Federal Transit Administration User Training Transit Economic Requirements Model Overview Updated April 2013 This document is confidential and is intended solely for the use and information of the client to whom it is addressed.
Transcript
Federal Transit Administration Federal Transit Administration
User Training
Transit Economic RequirementsModel Overview
Updated April 2013
This document is confidential and is intended solely for the use and
information of the client to whom it is addressed.
Federal Transit Administration
Federal Transit Administration
What is TERM?
FTA’s Capital Needs Analysis Tool
– Used to assess the current physical condition and future
investment needs of the nation’s transit assets / operators
Federal Transit Administration
Federal Transit Administration
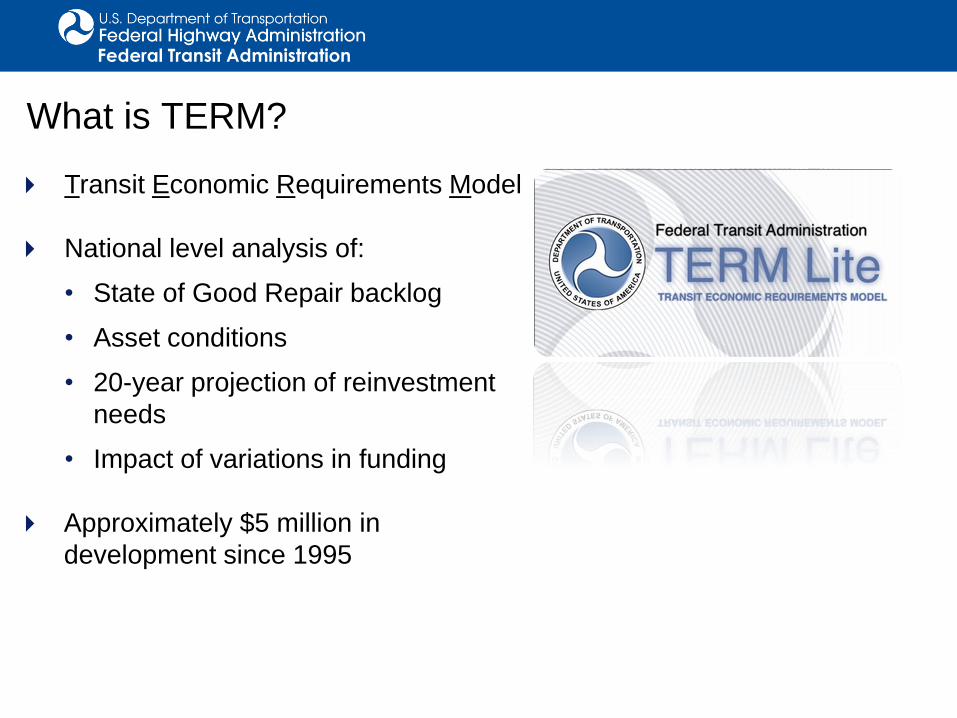
What is TERM?
Transit Economic Requirements Model
National level analysis of:
• State of Good Repair backlog
• Asset conditions
• 20-year projection of reinvestment
needs
• Impact of variations in funding
Approximately $5 million in
development since 1995
Federal Transit Administration
Federal Transit Administration
What is TERM?
Determines level of investment required to:
– Maintain condition/performance
– Improve condition/performance
Assesses impact of constrained investment on
future conditions / performance
Cost effectiveness of proposed investments
(benefit–cost analyses)
Results reported in the transit sections of the
“Status of the Nation’s Highways, Bridges, and
Transit: Conditions and Performance” (C&P)
Federal Transit Administration
The National Surface
Transportation
Commission examined the
condition and future needs of
the nation's surface
transportation system
The Rail Modernization
Study assessed the investment backlog and capital reinvestment needs of the nine
largest rail operators
The National State of Good
Repair assessed the investment backlog and capital
The answer depends on three primary factors. The following questions
are open ended but are eventually translated into relational tables that
allow TERM to simulate a 20-year scenario.
Federal Transit Administration
Federal Transit Administration
Do we know our inventory?
Knowing your inventory is the first step to being able to analyze the true cost
ownership.
• What types of assets do we have?
• How many assets do we have of each kind and how big are they?
• What is the age of each asset? And is the condition appropriate for its age?
• How often must an asset be rehabilitated and at what cost?
• What is the cost to replace one unit of each asset type?
• What assets can never be replaced?
• Do we have redundant or non-essential inventory?
Federal Transit Administration
Federal Transit Administration
How much can we spend?
The future condition of your portfolio depends on a complex combination of
capital replacement programs, operations, maintenance & sustainment practices,
worker training, investments in tools, and strategic planning. All of these require
funding. Future funding is rarely known but typical scenarios include the
following:
• Continue to spend some historical flat amount each year.
• Increased flat funding each year
• Increased short-term funding to reduce deferred maintenance followed by a
historical flat amount.
• Unlimited funding
• No funding
$
Federal Transit Administration
Federal Transit Administration
What are our priorities?
Every asset in your inventory contributes to meet your organization’s goals and
mission objectives. If they d on’t, you should probably decommission them. When
funds are constrained, budget planners must consider where to spend the
available money first. Criteria that is most often considered for a transit planner
include the following:
• Safety & Security
• Reliability
• Operations & Maintenance Impact
• Customer Experience
• Asset Condition
Federal Transit Administration
Federal Transit Administration
TERM Simulates how you Invest in your Assets
Once the current inventory, spending constraints, prioritization criteria, and a few
other economic assumptions are provided, TERM simulates up to 30 years of aging,
wear & tear, rehabilitation, maintenance, and replacement for a collection of assets.
20-Year
Simulation
Evaluate State
of Inventory in
Yearn
Simulate Annual
Spend
Prioritization
Evaluate Impact
of Spend Plan
Execute Annual
Spend Plan
Asset Inventory
Listing of Current
Asset Inventory
(Track, Structures,
Systems, Facilities,
Vehicles, Stations)
Establish
Investment Policies
Rehabilitate/replace
all assets at the end
of their Estimated
Design Lives
Model Run:
Needs Forecast
Asset
Conditions
Forecast
State of Good
Repair Needs
Forecast ($)
Federal Transit Administration
Federal Transit Administration
TERM is an MS Access-based tool designed for
use by a novice The analyst controls the simulation by using the following modules:
• Inventory Publisher: Transferring inventory data from MS Excel to TERM
• Prioritization Settings: Assign priority weights to each of five criteria and score each asset
type on those five criteria
• Expenditure Constraints: Specify the maximum annual funding available to the simulator
• Backlog Target Seek: Optimize funding to achieve a specific reduction in backlog
• Inventory Management: Add, delete, or modify the inventory details
• Expansion Analysis: Review the impact of adding new capacity on annual expenditure needs and long-term backlog growth/decline
• Life Cycle Cost: Edit assumptions regarding number and cost of interval rehabilitations, unit replacement cost, and useful life by asset type
• Inflation Module: Specify how costs should be escalated over time and how results are displayed
Federal Transit Administration
Federal Transit Administration
Inventory Publisher
TERM-Lite is developed in MS Access. Users that are comfortable using Access
may choose to become familiar with the tables and manage the data directly in the
model.
However, FTA has developed an MS Excel-based Inventory Publisher which helps
format data to conform to TERM’s business rules.
Federal Transit Administration
Federal Transit Administration
Prioritization Settings TERM-Lite simulates the long-
term impact of constrained
funding scenarios using a robust
prioritization algorithm. The
model considered five
dimensions of priority: Asset
Condition, Safety & Security,
Reliability, O&M Cost Impact, and
one User Defined criteria. The
User is in control of how each
asset type scores against other
asset types. The User also
determines how each criteria is
weighted against other criteria.
Federal Transit Administration
Federal Transit Administration
Expenditure Constraints
The User controls the amount
of funding that is available for
each of the years of analysis.
The User can specify
whether unspent funds are
carried over to future year or
returned to the funding
authority based on that
agency's unique
circumstances.
A built-in ‘Large Record Test’
will help the User evaluate of
the inventory is structured
optimally for TERM-Lite
analysis.
Federal Transit Administration
Federal Transit Administration
Backlog Target Seek In contract to using the Expenditure Constraints module, the User can also specify
a performance outcome by reducing existing backlog to a specific level within a
desired period of time. TERM-Lite calculates the annual funding required to achieve
this objective.
Federal Transit Administration
Federal Transit Administration
Inventory Management
The User can review, perform quality assurance,
edit, delete, or modify individual asset records.
Each record can include a unique cost basis,
quantity, useful life, and age.
Each asset can be
tagged as one be of four
levels of “overriding”
priority (Funded,
Deficient, Normal, or
Exclude).
In addition, twenty (20)
fields are available to
track metadata that is
important to the agency.
Federal Transit Administration
Expansion
Costs Rehab/
Replacement
Costs
Federal Transit Administration
Expansion Analysis
The User can choose to include planned or prospective capital improvements in
the analysis. This “what-if” scenario analysis allows a thorough review of the
impacts of such improvements on spending needs and, when funding is
constrained, on overall portfolio performance (as measured by average age, and
condition).
Federal Transit Administration
Federal Transit Administration
Life Cycle Cost and Inflation
Users can customize the rehab and replacement cost assumptions for each asset type. This customization can include up to five (5) intermediate rehabs stated as a percentage of the replacement cost.
Assets that are typically maintained for an indefinite period (tunnels or historic assets), an annual capital cost can be defined to allow for regular investments in rehab.
TERM-Lite analysis can be run using any desired assumed inflation rate.
Federal Transit Administration
Federal Transit Administration
TERM provides analysis charts and reports that
describe the outcome of each scenario
Reports help the analyst visualize the resulting condition and service performance of the asset
inventory based on the input settings. Comparing multiple scenarios side by side help build a
business case to support “right funding” of the portfolio
$0.0
$1.0
$2.0
$3.0
$4.0
$5.0
$6.0
$7.0
20
13
20
14
20
15
20
16
20
17
20
18
20
19
20
20
20
21
20
22
20
23
20
24
20
25
20
26
20
27
20
28
20
29
20
30
20
31
20
32
20
33
20
34
20
35
20
36
20
37
20
38
20
39
20
40
Bil
lio
ns o
f $
YO
E
Investment Expenditures by Category
Systems
Facilities
Stations
Guideway Elements
Vehicles
Average Annual Normal Replacement ($1.3B)
0%
5%
10%
15%
20%
25%
30%
35%
SG
RB
20
13
20
14
20
15
20
16
20
17
20
18
20
19
20
20
20
21
20
22
20
23
20
24
20
25
20
26
20
27
20
28
20
29
20
30
20
31
20
32
20
33
20
34
20
35
20
36
20
37
20
38
20
39
20
40
We
igh
ted
Av
era
ge
Asse
t A
ge
Percent of Assets Over Age
All Assets
Replaceable Assets
Non-Replaceable Assets
0%
5%
10%
15%
20%
25%
30%
Pe
rce
nt
of
To
tal
Re
pla
cem
en
t V
alu
e
Assets in Marginal or Poor Condition (Excludes Unreplaceable Assets)
Marginal
Poor
$0.0
$5.0
$10.0
$15.0
$20.0
$25.0
SG
RB
20
13
20
14
20
15
20
16
20
17
20
18
20
19
20
20
20
21
20
22
20
23
20
24
20
25
20
26
20
27
20
28
20
29
20
30
20
31
20
32
20
33
20
34
20
35
20
36
20
37
20
38
20
39
20
40
$B
illi
on
s
SGR Backlog by Category
Systems
Facilities
Stations
Guideway Elements
Vehicles
Federal Transit Administration
Federal Transit Administration
TERM provides analysis charts and reports that
describe the outcome of each scenario
$0.0
$1.0
$2.0
$3.0
$4.0
$5.0
$6.0
$7.0
20
13
20
14
20
15
20
16
20
17
20
18
20
19
20
20
20
21
20
22
20
23
20
24
20
25
20
26
20
27
20
28
20
29
20
30
20
31
20
32
20
33
20
34
20
35
20
36
20
37
20
38
20
39
20
40
Bil
lio
ns
of $
YO
E
Investment Expenditures by Category
Systems
Facilities
Stations
Guideway Elements
Vehicles
Average Annual Normal Replacement ($1.3B)
Federal Transit Administration
Federal Transit Administration
TERM provides analysis charts and reports that
describe the outcome of each scenario
$0.0
$5.0
$10.0
$15.0
$20.0
$25.0
SGR
B
20
13
20
14
20
15
20
16
20
17
20
18
20
19
20
20
20
21
20
22
20
23
20
24
20
25
20
26
20
27
20
28
20
29
20
30
20
31
20
32
20
33
20
34
20
35
20
36
20
37
20
38
20
39
20
40
$Bil
lio
ns
SGR Backlog by Category
Systems
Facilities
Stations
Guideway Elements
Vehicles
Federal Transit Administration
Federal Transit Administration
TERM provides analysis charts and reports that
describe the outcome of each scenario
0%
5%
10%
15%
20%
25%
30%
35%
SGR
B
20
13
20
14
20
15
20
16
20
17
20
18
20
19
20
20
20
21
20
22
20
23
20
24
20
25
20
26
20
27
20
28
20
29
20
30
20
31
20
32
20
33
20
34
20
35
20
36
20
37
20
38
20
39
20
40
We
igh
ted
Ave
rage
Ass
et A
ge
Percent of Assets Over Age
All Assets
Replaceable Assets
Non-Replaceable Assets
Federal Transit Administration
Federal Transit Administration
TERM provides analysis charts and reports that
describe the outcome of each scenario
0%
5%
10%
15%
20%
25%
30%
Pe
rce
nt
of
Tota
l R
ep
lace
me
nt
Val
ue
Assets in Marginal or Poor Condition (Excludes Unreplaceable Assets)