Economic Research:
The U.S. Economy Goes From SignsOf Shining To As Good As It Gets
U.S. Chief Economist:
Beth Ann Bovino, New York (1) 212-438-1652; [email protected]
U.S. Economist:
Satyam Panday, New York (212) 438-6009; [email protected]
Table Of Contents
No Easy Pieces On Capitol Hill
On The Jobs Front, Something's Gotta Give
Can American Companies Find A Few Good Men And Women?
Once Goin' South, The Housing Market Continues To Rebound
A Still-Wide Trade Deficit May Cause Heartburn For Uncle Sam
Alternate Scenarios
Upside: A Safe Place
Downside: Little Shop Of Horrors
WWW.STANDARDANDPOORS.COM/RATINGSDIRECT JUNE 29, 2017 1
1876902 | 300139182
Economic Research:
The U.S. Economy Goes From Signs Of Shining ToAs Good As It Gets(Editor's Note: S&P Global's U.S. economists completed their forecast before the Bureau of Economic Analysis published its
third estimate of first-quarter real GDP.)
As President Donald Trump approaches the end of his first six months in office, it seems that he's no closer to fulfilling
his campaign promises than the day he took the helm of the world's biggest economy. And markets have begun to
reflect this view, with sentiment readings, once bolstered by campaign promises, starting to soften.
Relying on the long-standing truth that campaign promises aren't (and often never become) government policy, we
largely discounted last autumn's rhetoric in our December forecast for U.S. economic growth. Now, we no longer
believe the federal government will be able to push through even a small infrastructure-spending package, and we
expect only moderate tax cuts to be passed early next year as midterm elections approach.
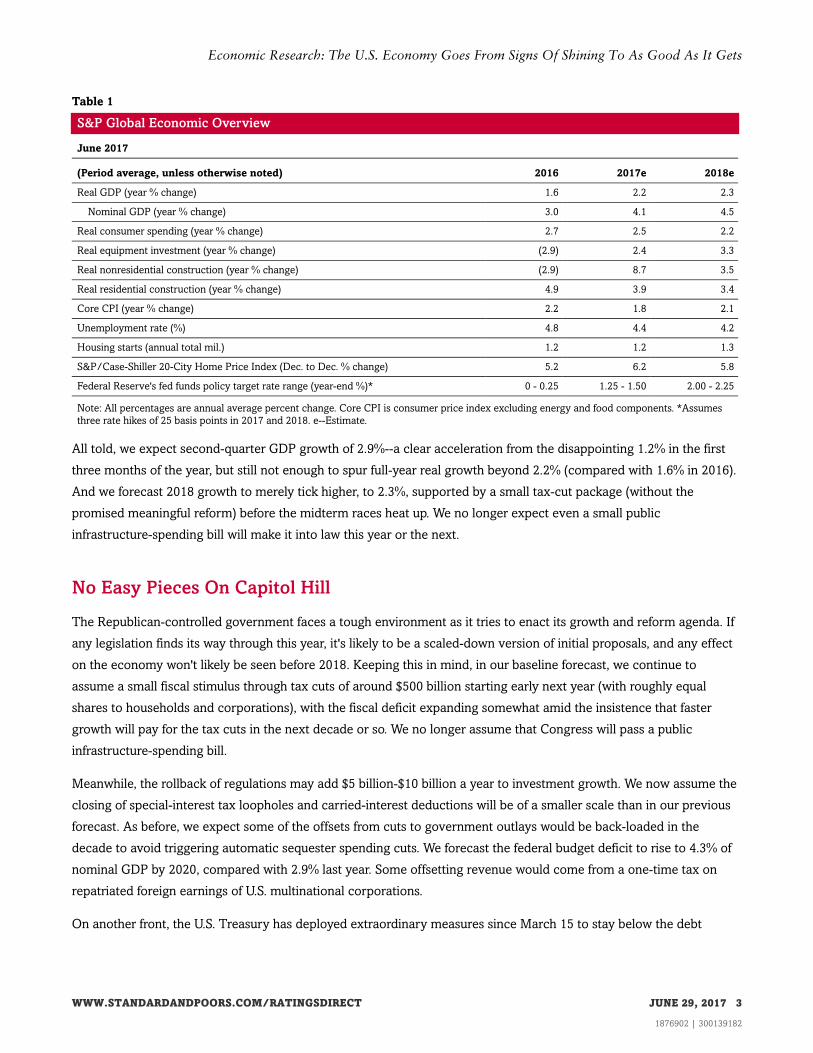
Overview
• The U.S. economic expansion will likely continue into the next year, albeit at a modest pace. We expect real
GDP growth of 2.2% this year and 2.3% in 2018.
• We expect the Federal Reserve to announce plans to gradually normalize its balance sheet in September. It
will likely raise rates one more time this year, with the benchmark rate climbing to 1.25%-1.50% by December,
and three more hikes in 2018.
• With roadblocks still in place on Capitol Hill, we don't consider many of President Trump's proposals, as
currently framed, in our baseline forecast. We expect a small tax package to pass later this year, along with
reduced regulation, to help boost growth the next few years. We no longer expect a small infrastructure
initiative will be passed.
• We now see a 15%-20% chance that the U.S. will slip back into recession over the next year as risks of a policy
mistake have eased (previously, we saw a 20%-25% risk of recession).
But even without much help from Uncle Sam, the U.S. economy continues to expand--albeit at a measured pace. S&P
Global never bought into the idea that the U.S. economy could break out of its trend of annual growth of 2%-2.5% and
reach the 3%-4% then-candidate Donald Trump vowed we'd soon see. At this point, we see the only way U.S. GDP
growth will feature a "3" or a "4" is if those figures follow a "2" and a decimal point. Unfortunately for the new
administration, much of the data bear this out.
Specifically, the latest labor-market data have fueled growing pessimism, even after strong employment gains earlier
this year. The Bureau of Labor Statistics' (BLS) May report showing 138,000 job gains carries a margin of error of
50,000 jobs, widening the range to either a respectable 188,000 … or a measly 88,000. Other indicators point to a
still-modest economic expansion, with bumps along the way.
WWW.STANDARDANDPOORS.COM/RATINGSDIRECT JUNE 29, 2017 2
1876902 | 300139182
Table 1
S&P Global Economic Overview
June 2017
(Period average, unless otherwise noted) 2016 2017e 2018e
Real GDP (year % change) 1.6 2.2 2.3
Nominal GDP (year % change) 3.0 4.1 4.5
Real consumer spending (year % change) 2.7 2.5 2.2
Real equipment investment (year % change) (2.9) 2.4 3.3
Real nonresidential construction (year % change) (2.9) 8.7 3.5
Real residential construction (year % change) 4.9 3.9 3.4
Core CPI (year % change) 2.2 1.8 2.1
Unemployment rate (%) 4.8 4.4 4.2
Housing starts (annual total mil.) 1.2 1.2 1.3
S&P/Case-Shiller 20-City Home Price Index (Dec. to Dec. % change) 5.2 6.2 5.8
Federal Reserve's fed funds policy target rate range (year-end %)* 0 - 0.25 1.25 - 1.50 2.00 - 2.25
Note: All percentages are annual average percent change. Core CPI is consumer price index excluding energy and food components. *Assumes
three rate hikes of 25 basis points in 2017 and 2018. e--Estimate.
All told, we expect second-quarter GDP growth of 2.9%--a clear acceleration from the disappointing 1.2% in the first
three months of the year, but still not enough to spur full-year real growth beyond 2.2% (compared with 1.6% in 2016).
And we forecast 2018 growth to merely tick higher, to 2.3%, supported by a small tax-cut package (without the
promised meaningful reform) before the midterm races heat up. We no longer expect even a small public
infrastructure-spending bill will make it into law this year or the next.
No Easy Pieces On Capitol Hill
The Republican-controlled government faces a tough environment as it tries to enact its growth and reform agenda. If
any legislation finds its way through this year, it's likely to be a scaled-down version of initial proposals, and any effect
on the economy won't likely be seen before 2018. Keeping this in mind, in our baseline forecast, we continue to
assume a small fiscal stimulus through tax cuts of around $500 billion starting early next year (with roughly equal
shares to households and corporations), with the fiscal deficit expanding somewhat amid the insistence that faster
growth will pay for the tax cuts in the next decade or so. We no longer assume that Congress will pass a public
infrastructure-spending bill.
Meanwhile, the rollback of regulations may add $5 billion-$10 billion a year to investment growth. We now assume the
closing of special-interest tax loopholes and carried-interest deductions will be of a smaller scale than in our previous
forecast. As before, we expect some of the offsets from cuts to government outlays would be back-loaded in the
decade to avoid triggering automatic sequester spending cuts. We forecast the federal budget deficit to rise to 4.3% of
nominal GDP by 2020, compared with 2.9% last year. Some offsetting revenue would come from a one-time tax on
repatriated foreign earnings of U.S. multinational corporations.
On another front, the U.S. Treasury has deployed extraordinary measures since March 15 to stay below the debt
WWW.STANDARDANDPOORS.COM/RATINGSDIRECT JUNE 29, 2017 3
1876902 | 300139182
Economic Research: The U.S. Economy Goes From Signs Of Shining To As Good As It Gets
ceiling, to add to tensions on Capitol Hill as Congress debates tax policy. We expect the administration will come to an
agreement with Congress to suspend or raise the debt ceiling by the third quarter of this year. It remains our view that
the ensuing debate about raising or suspending the ceiling weighs on the economy and is incorporated in our 'AA+'
rating.
While raising the benchmark federal funds rate 25 basis points (bps) to a range of 1%-1.25% in June, the Federal
Reserve also laid out a framework to normalize its now $4.5 trillion balance sheet. In a plan that will be phased in over
time, the Fed will stop reinvesting the principal of securities when they mature. In this light, we expect policymakers to
pause this cycle of interest-rate hikes to measure the effects of balance-sheet unwinding, which will likely add upward
pressure on long-term interest rates. We now expect the next quarter-point rate increase in December, with three
more in 2018. However, with recent data indicating softer prices, and the core rate still running below 2% year over
year, the Fed will be on guard as to whether this is "transitory" as Fed chair Janet Yellen said during her press
conference after the Federal Open Market Committee meeting in June. But while the large drop in prices for wireless
services may be fleeting, the slower pace of residential price gains is even more important for the Fed, given that rents
have a large weight in the index. We expect core inflation to slowly climb higher in 2018. But if prices remain soft, the
Fed may need to wait longer before it raises rates again.
Chart 1
WWW.STANDARDANDPOORS.COM/RATINGSDIRECT JUNE 29, 2017 4
1876902 | 300139182
Economic Research: The U.S. Economy Goes From Signs Of Shining To As Good As It Gets
All this assumes the economy performs in line with policymakers' expectations and that the balance-sheet
normalization proceeds according to plan. But this is uncharted territory, and it's unclear how much upward pressure
we'll see on interest rates and how quickly the effects are felt. If rates move higher faster than the Fed currently
expects, the Fed may wait until next year to again raise benchmark borrowing costs.
On The Jobs Front, Something's Gotta Give
Our 2017 projection for GDP growth is down from our March forecast of 2.3%, given that we no longer expect the
Republican-led Congress to be able to muster enough votes to support even a modest infrastructure-spending
initiative. We see long-term potential growth slowing to around 1.8%--far below the average of 3% from 1980 to the
early 2000s.
Previously upbeat "soft" data are showing signs of fatigue. While this has some thinking the game is over, we see some
time left on the clock before the expansion ends. We think the "hard" data are typically a better gauge of where this
$18 trillion economy is heading and that the risk of recession remains remote (see "U.S. Business Cycle Barometer,"
published May 5, 2017). Our inaugural U.S. Business Cycle Barometer signals an even smaller risk of a downturn in the
next 12 months than our qualitative assessment risk of recession. Even there, with signs that the risk of a policy
mistake eased globally, we have lowered our qualitative U.S. recession risk to 15%-20% from 20%-25% in our March
forecast.
While the BLS' most recent jobs report was disturbing, let's not forget that May is a notoriously difficult month in
which to get a true reading, given the influx of college students and graduates into the labor market, which can greatly
distort the data. We think that once these temporary factors fade, in June and July, we will likely return to a more
robust pace of job gains.
That said, labor-market growth is slowing as the U.S. nears full employment. The average monthly payroll gain from
March to May was just 121,000. And while headline unemployment, at 4.3%, is the lowest since 2001, and broader
measures of underemployment (such as people working part-time for economic reasons and discouraged workers) are
at 10-year lows, many Americans have left the workforce, either because of early retirement, disability, going back to
school, or simple pessimism at their job prospects--pushing the labor-participation rate to a 39-year low last month.
But, as job gains slowed, job openings reached a record high of 6.04 million in April. This shortage of qualified workers
lends credence to the view that wages will climb higher this year and next, after a modest gain of 2.5% (year over year)
in May. Moreover, the so-called quit rate--the proportion of workers who quit their jobs in any given month, and a
gauge of confidence in the labor market--at 2.1% in April, is near its postcrisis high of 2.2% first seen in January,
according to the BLS. There are also now just 1.14 unemployed workers per job opening, well off the peak of 6.6 in
July 2009.
We see year-over-year wages growing to around 2.75% by year-end, helping to boost consumer spending to a 2.5%
increase for 2017. Retail sales (in nominal terms) fell last month, though after gains of 0.4% and 0.1% in April and
March, respectively. People are also using those paychecks to help buy homes (for themselves or their kids). With both
new and existing home sales well above recession lows, the National Association of Home Builders index is still at a
WWW.STANDARDANDPOORS.COM/RATINGSDIRECT JUNE 29, 2017 5
1876902 | 300139182
Economic Research: The U.S. Economy Goes From Signs Of Shining To As Good As It Gets
firm 67 in May after reaching a 12-year high in March.
Can American Companies Find A Few Good Men And Women?
While companies take a conservative approach to hiring, waiting to see whether any campaign promises become
policy, a growing worry is that the U.S. faces a skills mismatch in which businesses simply can't find workers with the
skills needed to compete. Much of this is due to the never-ending march of automation, which will continue to create
wealth and add to GDP in coming years, while also changing the skills that workers need to succeed (see "Automation
Marches On: Do Jobs Need To Be Collateral Damage?," published June 7, 2017).
We applaud President Trump's remarks at the Roundtable Discussion on Vocational Training with U.S. and German
Business Leaders on March 17, 2017, that "we must embrace new and effective job-training approaches… that prepare
people for trade, manufacturing, technology, and other really well-paying jobs and careers." We also agree with a
report from President Obama's office last year that begins with the premise that investing in and developing artificial
intelligence is something that we need to do--while also espousing the idea that we need to train Americans for the
jobs of the future and help those who have been left behind in the transition toward greater automation.
Our research shows that if the U.S. were to add another year of education to the American workforce, GDP would
likely be $325 billion (or an aggregate 1.8%) higher in five years than in our baseline forecast. During that period, labor
productivity growth would rise 0.2 percentage points faster on average than in our baseline case--and add roughly
755,000 more jobs.
Once Goin' South, The Housing Market Continues To Rebound
Sustained strength in the labor market (along with any extra pocket money from income-tax cuts) would help underpin
consumer spending, which we think will remain an engine of growth in the U.S. With household finances improving on
the back of rising stock prices and home values, consumer sentiment readings are robust--further confirmation that
American households will support economic growth with their willingness to spend.
And while the U.S. housing market slowed this spring, after healthy weather-boosted gains in the first quarter, we
expect renewed strength this year and the next. Together with an upturn in homeownership among young adults,
inventories of homes for sale are low, and there's upbeat homebuilder sentiment. Higher home prices will help offset
increasing costs from lack of readied land and labor shortages.
With the Conference Board's consumer confidence reading a still-robust 117.0 in June, and the University of Michigan
Consumer Sentiment Index at 94.5 this month (near January's 13-year high of 98.5), we expect consumers to feel more
comfortable opening their wallets than they have been through much of the current recovery.
Stronger household balance sheets and fatter paychecks will, in turn, support the housing market. Housing starts, at 1.1
million annualized units in May, have been consistently above the watershed 1 million mark since the spring of 2015.
Single-family starts have risen to their strongest pace since 2007. With single-family building permits--a
forward-looking indicator for starts--also at a 10-year high, we expect housing starts (single- and multi-family
WWW.STANDARDANDPOORS.COM/RATINGSDIRECT JUNE 29, 2017 6
1876902 | 300139182
Economic Research: The U.S. Economy Goes From Signs Of Shining To As Good As It Gets
combined) to reach 1.2 million units this year.
Household formation has averaged 1.2 million the past two years (well above the 0.6 million average increase of the
preceding eight years), which bodes well for residential investment. If anything, supply constraints (the lack of
buildable land and workers) will be what keep homebuilding in check.
A Still-Wide Trade Deficit May Cause Heartburn For Uncle Sam
Meanwhile, on the trade front, American imports and exports have both picked up. Following a lackluster stretch, real
exports increased in the first quarter (albeit from a rather low base), amid firmer global demand and the fading effects
of a strong dollar (see chart). The increase was broad-based, as exports to all regions contributed--with emerging
markets excluding China making up the largest share of growth in the period. On the other side of the ledger, stronger
domestic demand--particularly for capital goods--has boosted imports in the past few months. The trade deficit
widened to $47.6 billion in April, from a revised $45.3 billion in March, as a result of a rise in imports and a decline in
exports.
Chart 2
These flows aren't helping the Trump Administration in its bid to shrink the trade deficit. In the first four months of this
WWW.STANDARDANDPOORS.COM/RATINGSDIRECT JUNE 29, 2017 7
1876902 | 300139182
Economic Research: The U.S. Economy Goes From Signs Of Shining To As Good As It Gets
year, the increase in imports--up 7.5% from the comparable period a year earlier, to $952 billion--easily outstripped the
6.1% gain in exports, to a cumulative $765.6 billion. We look for flows both to and from the U.S. to increase steadily in
the near term as global growth continues to strengthen. Following a meager expansion of 1.1% and 0.4% in real
imports and exports, respectively, last year, we expect imports to rise 3.7% this year and 2.5% in 2018, while exports
grow 2.8% and 3.1%.
The president has raised the specter of invoking national-security interests to erect barriers to imports. (Note that
World Trade Organization rules include a national-security exemption designed to be used only in times of war.) Either
way, the effects on trade flows would be predicated on how hard the administration's protectionist stance is.
Regarding steel, for example, the administration appears set to impose broad tariffs on all imports (hard protection) or
set up a system of quotas and tariff barriers that would essentially freeze imports from particular countries at current
levels and charge tariffs on levels above the quota (soft protection). The hard-tariff route could provoke a messy
scenario in which the U.S.'s trade partners feel compelled to either impose their own national-security restrictions on
steel imports, or to retaliate in other ways. But a limited restriction, which seems more likely at this point, may just be
more symbolic than a meaningful hit to aggregate flows.
Alternate Scenarios
Each quarter, S&P Global projects two scenarios in addition to its base case, one with faster growth than the baseline
and one with slower. Scenarios are based on ordinary risks to baseline growth, not extraordinary risks. Our base case
could be thrown off--in either direction--by policies being put forth by Congressional legislators and the new
administration. On the upside, pro-growth policies, including deregulation and certain aspects of tax reform, could help
accelerate the economy's recovery from the Great Recession. On the other hand, a hit to business confidence would
likely weigh on growth, in our view.
Table 2
S&P Global Economic Outlook
June 2017
--2017-- --2018--
Q1 Q2e Q3e Q4e Q1e 2012 2013 2014 2015 2016 2017e 2018e 2019e 2020e
(Key indicator, % change)
Real GDP 1.2 2.9 2.5 2.4 2.5 2.2 1.7 2.4 2.6 1.6 2.2 2.3 2.0 1.9
(in real terms)
Domestic
demand
1.0 2.8 2.3 2.3 2.4 2.1 1.3 2.4 3.2 1.7 2.3 2.2 2.0 2.0
Consumer
spending
0.6 3.0 2.4 2.8 2.3 1.5 1.5 2.9 3.2 2.7 2.5 2.2 1.9 2.0
Equipment
investment
7.2 3.3 1.6 3.2 4.2 10.8 4.6 5.4 3.5 (2.9) 2.4 3.3 3.3 3.7
Intellectual
property
investment
6.7 5.3 3.5 4.2 5.0 3.9 3.4 3.9 4.8 4.7 4.5 4.0 3.1 3.6
WWW.STANDARDANDPOORS.COM/RATINGSDIRECT JUNE 29, 2017 8
1876902 | 300139182
Economic Research: The U.S. Economy Goes From Signs Of Shining To As Good As It Gets
Table 2
S&P Global Economic Outlook (cont.)
June 2017
--2017-- --2018--
Q1 Q2e Q3e Q4e Q1e 2012 2013 2014 2015 2016 2017e 2018e 2019e 2020e
Nonresidential
construction
28.3 3.5 3.0 2.8 4.4 12.9 1.3 10.3 (4.4) (2.9) 8.7 3.5 3.3 3.7
Residential
construction
13.7 (3.8) 5.1 0.5 5.0 13.5 11.9 3.5 11.7 4.9 3.9 3.4 5.4 4.5
Federal
government
purchases
(2.1) (0.8) (1.1) (1.0) 0.1 (1.9) (5.8) (2.5) 0.0 0.6 (0.8) (0.2) (0.7) (0.4)
State and local
government
purchases
(0.6) (0.2) 1.1 1.2 1.8 (1.9) (0.8) 0.2 2.9 0.9 0.0 1.6 1.3 0.7
Exports of
goods and
services
5.9 1.8 2.9 2.9 3.7 3.4 3.5 4.3 0.1 0.4 2.8 3.2 3.1 3.1
Imports of
goods and
services
3.8 2.0 2.1 2.4 2.9 2.2 1.1 4.4 4.6 1.1 3.7 2.5 3.4 3.7
CPI 2.6 2.0 2.1 1.8 1.6 2.1 1.5 1.6 0.1 1.3 2.1 2.0 2.1 1.9
Core CPI 2.2 1.7 1.7 1.7 1.7 2.1 1.8 1.7 1.8 2.2 1.8 2.1 2.1 1.9
Nonfarm unit
labor costs
2.7 2.7 1.9 2.6 3.0 2.8 1.2 2.7 2.5 2.3 1.4 2.4 1.7 1.6
Productivity
trend ($ per
employee,
2009$)
(0.2) 1.3 0.8 1.0 1.3 0.4 0.6 0.7 0.9 (0.1) 0.9 1.1 1.5 1.6
(Levels)
Unemployment
rate (%)
4.7 4.4 4.4 4.3 4.3 8.1 7.4 6.2 5.3 4.8 4.4 4.2 4.4 4.5
Payroll
employment
(mil.)
145.7 146.1 146.6 147.1 147.5 134.2 136.4 138.9 141.8 144.3 146.4 148.1 149.5 150.7
Federal funds
rate (%)
0.7 0.9 1.1 1.2 1.4 0.1 0.1 0.1 0.1 0.4 1.0 1.6 2.6 2.9
10-year
Treasury note
yield (%)
2.4 2.3 2.4 2.5 2.6 1.8 2.4 2.5 2.1 1.8 2.4 2.7 3.0 3.3
'AAA'
corporate bond
yield (%)
3.2 3.0 3.3 3.5 3.7 2.5 3.1 3.2 3.0 2.7 3.3 3.9 4.4 4.8
Mortgage rate
(30-year
conventional,
%)
4.2 4.0 4.2 4.3 4.4 3.7 4.0 4.2 3.9 3.6 4.2 4.5 5.0 5.4
Three-month
Treasury bill
rate (%)
0.6 0.9 1.0 1.1 1.3 0.1 0.1 0.0 0.1 0.3 0.9 1.6 2.5 2.9
S&P 500 Index 2,324.0 2,391.0 2,399.3 2,402.4 2,404.2 1,379.6 1,642.5 1,930.7 2,061.2 2,092.4 2,379.1 2,411.6 2,447.4 2,520.1
S&P 500
Operating
Earnings (bil. $)
1,004.13 1,072.13 1,085.95 1,113.85 1,141.02 873.57 933.04 1,030.63 928.28 892.43 1,069.02 1,150.74 1,232.65 1,329.01
WWW.STANDARDANDPOORS.COM/RATINGSDIRECT JUNE 29, 2017 9
1876902 | 300139182
Economic Research: The U.S. Economy Goes From Signs Of Shining To As Good As It Gets
Table 2
S&P Global Economic Outlook (cont.)
June 2017
--2017-- --2018--
Q1 Q2e Q3e Q4e Q1e 2012 2013 2014 2015 2016 2017e 2018e 2019e 2020e
Current
account (bil. $)
(467.6) (495.9) (496.0) (507.1) (515.1) (446.5) (366.4) (392.1) (463.0) (481.2) (491.7) (534.1) (559.7) (590.2)
Exchange rate
(Index March
1973=100)
94.4 92.7 92.4 92.2 91.8 73.6 75.9 78.4 90.9 91.6 92.9 91.4 90.9 90.4
Crude oil
($/bbl, WTI)
51.80 50.20 49.60 49.90 50.80 94.20 97.94 93.26 48.74 43.22 50.38 52.30 54.98 57.40
Saving rate (%) 5.2 5.3 5.4 5.3 5.7 7.6 5.0 5.6 5.8 5.7 5.3 5.8 5.8 5.6
Housing starts
(mil.)
1.2 1.2 1.3 1.3 1.3 0.8 0.9 1.0 1.1 1.2 1.2 1.3 1.4 1.5
Unit sales of
light vehicles
(mil.)
17.3 16.9 17.2 17.3 17.2 14.5 15.6 16.5 17.4 17.5 17.2 17.2 17.2 17.2
Federal surplus
(fiscal year
unified, bil. $)
(210) (317) 21 (112) (231) (1,089) (680) (484) (439) (586) (617) (801) (902) (939)
Notes: Quarterly percent change represents annualized growth rate; annual percent change represents average annual growth rate from a year ago. Quarterly
levels represent average during the quarter; annual levels represent average levels during the year. Quarterly levels of housing starts and unit sales of light
vehicles are in annualized millions. Exchange rate represents the nominal trade-weighted exchange value of US$ versus major currencies. Forecasts were
completed before the third estimate of first-quarter 2017 U.S. GDP report was released by the BEA. e--Estimate.
Upside: A Safe Place
In this scenario, the president and Republican Congress would push through tax cuts and deregulation that boost
growth (though still not to the 3% assumed in the administration's budget proposal). The rollback of regulations and
lower tax rates for both corporations and households would spark capital spending, together with increased consumer
demand for goods and services next year. In this scenario, real GDP would expand 2.7% next year (compared with
2.3% in our baseline case), after 2.2% growth this year.
The economy would benefit not only from lower taxes and increased infrastructure spending, but also from reduced
policy uncertainty beginning in the fourth quarter. We assume a federal income-tax reduction in the neighborhood of
$1 trillion stretched over 10 years, with cuts that are roughly equal, proportionately, for companies and individuals. We
also assume Congress would pass a $200 billion (just above 1% of real GDP) public infrastructure-spending plan,
channeled through state and local governments.
Some offsetting revenue would come from a one-time tax on repatriated foreign earnings of U.S. multinational
corporations and the closing of special-interest tax loopholes and carried interest deductions. For the purposes of this
exercise, we assume the offsets from cuts to government outlays would be back-loaded in the decade to avoid
triggering automatic sequester spending cuts.
In this scenario, overall sentiment and domestic demand growth would peak next year. The unemployment rate would
fall to 4% by mid-2018, with an additional 300,000 jobs added by mid-2019 than in our base case. Inflationary
WWW.STANDARDANDPOORS.COM/RATINGSDIRECT JUNE 29, 2017 10
1876902 | 300139182
Economic Research: The U.S. Economy Goes From Signs Of Shining To As Good As It Gets
pressures would be partially offset by increased productivity growth and partly by the Fed's raising rates at a quicker
pace than planned. Continuing oversupply conditions in oil markets would keep energy prices at baseline levels.
The fed funds rate would reach 2.4% by year-end 2018 (2.2% in the baseline), and the yield on 10-year Treasury notes
would reach 3.2% (2.9% in the baseline).
Table 3
S&P Global Economic Outlook--Upside
June 2017
2012 2013 2014 2015 2016 2017e 2018e 2019e 2020e
(Key indicator, % change)
Real GDP 2.2 1.7 2.4 2.6 1.6 2.2 2.7 2.0 1.8
(in real terms)
Domestic demand 2.1 1.3 2.4 3.2 1.7 2.3 2.7 2.1 1.9
Consumer spending 1.5 1.5 2.9 3.2 2.7 2.5 2.6 2.1 2.0
Equipment investment 10.8 4.6 5.4 3.5 (2.9) 2.4 4.0 3.3 3.2
Intellectual property
investment
3.9 3.4 3.9 4.8 4.7 4.5 4.6 3.1 3.1
Nonresidential construction 12.9 1.3 10.3 (4.4) (2.9) 8.7 4.1 3.3 3.2
Residential construction 13.5 11.9 3.5 11.7 4.9 3.8 3.8 5.3 4.4
Federal government
purchases
(1.9) (5.8) (2.5) 0.0 0.6 (0.8) (0.2) (0.7) (0.4)
State and local government
purchases
(1.9) (0.8) 0.2 2.9 0.9 0.3 2.0 1.1 0.8
Exports of goods and services 3.4 3.5 4.3 0.1 0.4 2.8 3.3 3.0 2.9
Imports of goods and services 2.2 1.1 4.4 4.6 1.1 3.7 3.2 3.1 3.6
CPI 2.1 1.5 1.6 0.1 1.3 2.1 2.0 2.1 2.1
Core CPI 2.1 1.8 1.7 1.8 2.2 1.8 2.1 2.1 2.1
Nonfarm unit labor costs 2.8 1.2 2.7 2.5 2.3 1.4 2.3 1.9 1.8
Productivity trend ($ per
employee, 2009$)
0.4 0.6 0.7 0.9 (0.1) 0.9 1.3 1.5 1.5
(Levels)
Unemployment rate (%) 8.1 7.4 6.2 5.3 4.8 4.4 4.1 4.2 4.3
Payroll employment (mil.) 134.2 136.4 138.9 141.8 144.3 146.4 148.3 149.8 150.9
Federal funds rate (%) 0.1 0.1 0.1 0.1 0.4 1.0 1.8 2.9 3.2
10-year Treasury note yield
(%)
1.8 2.4 2.5 2.1 1.8 2.4 2.9 3.4 3.6
'AAA' corporate bond yield
(%)
2.5 3.1 3.2 3.0 2.7 3.3 4.1 4.7 5.2
Mortgage rate (30-year
conventional, %)
3.7 4.0 4.2 3.9 3.6 4.2 4.7 5.3 5.7
Three-month Treasury bill
rate (%)
0.1 0.1 0.0 0.1 0.3 0.9 1.8 2.9 3.2
S&P 500 Index 1,379.6 1,642.5 1,930.7 2,061.2 2,092.4 2,377.6 2,444.7 2,500.2 2,562.6
S&P 500 Operating Earnings
(bil. $)
873.6 933.0 1,030.6 928.3 892.4 1,068.3 1,169.7 1,264.7 1,357.1
Current account (bil. $) (446.5) (366.4) (392.1) (463.0) (481.2) (491.7) (544.7) (573.0) (612.7)
WWW.STANDARDANDPOORS.COM/RATINGSDIRECT JUNE 29, 2017 11
1876902 | 300139182
Economic Research: The U.S. Economy Goes From Signs Of Shining To As Good As It Gets
Table 3
S&P Global Economic Outlook--Upside (cont.)
June 2017
2012 2013 2014 2015 2016 2017e 2018e 2019e 2020e
Exchange rate (Index March
1973=100)
73.6 75.9 78.4 90.9 91.6 92.9 91.7 91.2 90.7
Crude Oil ($/bbl, WTI) 94.20 97.94 93.26 48.74 43.22 50.38 52.47 55.21 57.00
Saving rate (%) 7.6 5.0 5.6 5.8 5.7 5.3 6.0 5.9 5.7
Housing starts (mil.) 0.8 0.9 1.0 1.1 1.2 1.2 1.3 1.4 1.5
Unit sales of light vehicles
(mil.)
14.5 15.6 16.5 17.4 17.5 17.2 17.2 17.2 17.3
Federal surplus (fiscal year
unified, bil. $)
(1,089) (680) (484) (439) (586) (610) (873) (994) (1,043)
Note: Quarterly percent change represents annualized growth rate; annual percent change represents average annual growth rate from a year
ago. Quarterly levels represent average during the quarter; annual levels represent average levels during the year. Quarterly levels of housing
starts and unit sales of light vehicles are in annualized millions. Quarterly levels of CPI and core CPI represent year over year growth rate during
the quarter. Exchange rate represents the nominal trade-weighted exchange value of US$ versus major currencies. e--Estimate.
Downside: Little Shop Of Horrors
In our downside scenario, the recent rise in equity markets would turn out to be temporary, President Trump's
campaign promises would fail to materialize meaningfully, and political paralysis would create only more uncertainty
for business investment. This would accompany faltering productivity and a weak pace of household income and
spending growth.
Together, real GDP growth would slip to 1.8% this year and 1.6% in 2018, before rebounding to 2.1% in 2019.
In this scenario, persistent weak productivity growth and a U.S. stock market pullback of 13% spanning late-2017 to
early-2018 would shatter business and consumer confidence. The unemployment rate would tick up to 4.8% by the
end of next year, compared with 4.2% in our baseline. As such, it wouldn't be surprising that consumers would focus
on saving and continue to shed debt in the near term. Weaker growth in household income and wealth would translate
into just a 1.3% increase in consumer spending next year (compared with 2.2% in our baseline). Real gross domestic
demand would take a hit, rising only 1.3%.
Low demand would put a lid on inflation, with annual headline inflation slowing to 1.7% and 1.6% in 2018 and 2019,
respectively, after coming in at 2.1% this year. Meanwhile, productivity would fail to rise as U.S. businesses postpone
significant capital investments, keeping unit labor costs higher than in our baseline case--thus diminishing the
competitiveness of U.S. exports. In response to all this, the Fed would cut rates heading into next year by 25 bps and
wait until the end of 2018 before raising rates again, only after confirming the economy is back on a sustainable growth
path.
WWW.STANDARDANDPOORS.COM/RATINGSDIRECT JUNE 29, 2017 12
1876902 | 300139182
Economic Research: The U.S. Economy Goes From Signs Of Shining To As Good As It Gets
Table 4
S&P Global Economic Outlook--Downside
June 2017
2012 2013 2014 2015 2016 2017e 2018e 2019e 2020e
(Key indicator, % change)
Real GDP 2.2 1.7 2.4 2.6 1.6 1.8 1.6 2.2 2.3
(in real terms)
Domestic demand 2.1 1.3 2.4 3.2 1.7 1.9 1.4 2.2 2.4
Consumer spending 1.5 1.5 2.9 3.2 2.7 2.2 1.4 2.3 2.2
Equipment investment 10.8 4.6 5.4 3.5 (2.9) 1.3 1.8 2.7 3.6
Intellectual property
investment
3.9 3.4 3.9 4.8 4.7 3.5 2.6 2.5 3.4
Nonresidential construction 12.9 1.3 10.3 (4.4) (2.9) 7.7 2.1 2.7 3.5
Residential construction 13.5 11.9 3.5 11.7 4.9 0.4 2.3 4.2 7.8
Federal government
purchases
(1.9) (5.8) (2.5) 0.0 0.6 (0.8) (0.2) (0.7) (0.4)
State and local government
purchases
(1.9) (0.8) 0.2 2.9 0.9 0.1 1.3 1.3 1.2
Exports of goods and
services
3.4 3.5 4.3 0.1 0.4 2.6 3.2 4.2 3.5
Imports of goods and
services
2.2 1.1 4.4 4.6 1.1 2.9 1.5 4.0 3.9
CPI 2.1 1.5 1.6 0.1 1.3 2.0 1.7 1.7 1.4
Core CPI 2.1 1.8 1.7 1.8 2.2 1.8 1.8 1.5 1.4
Nonfarm unit labor costs 2.8 1.2 2.7 2.5 2.3 1.3 2.2 1.1 1.0
Productivity trend ($ per
employee, 2009$)
0.4 0.6 0.7 0.9 (0.1) 0.7 0.8 1.6 1.8
(Levels)
Unemployment rate (%) 8.1 7.4 6.2 5.3 4.8 4.6 4.6 4.7 4.6
Payroll employment (mil.) 134.2 136.4 138.9 141.8 144.3 146.4 148.1 149.5 150.6
Federal funds rate (%) 0.1 0.1 0.1 0.1 0.4 0.9 0.7 1.6 2.3
10-year Treasury note yield
(%)
1.8 2.4 2.5 2.1 1.8 2.2 1.8 1.9 2.6
'AAA' corporate bond yield
(%)
2.5 3.1 3.2 3.0 2.7 3.0 3.0 3.3 4.2
Mortgage rate (30-year
conventional, %)
3.7 4.0 4.2 3.9 3.6 4.0 3.6 3.9 4.8
Three-month Treasury bill
rate (%)
0.1 0.1 0.0 0.1 0.3 0.8 0.6 1.6 2.3
S&P 500 Index 1,379.6 1,642.5 1,930.7 2,061.2 2,092.4 2,367.6 2,164.0 2,314.1 2,411.8
S&P 500 Operating
Earnings (bil. $)
873.57 933.04 1,030.63 928.28 892.43 2,060.82 3,412.59 1,378.06 1,379.31
Current account (bil. $) (446.5) (366.4) (392.1) (463.0) (481.2) (469.3) (523.5) (490.8) (438.9)
Exchange rate (Index
March 1973=100)
73.6 75.9 78.4 90.9 91.6 93.0 90.6 89.9 89.8
Crude oil ($/bbl, WTI) 94.20 97.94 93.26 48.74 43.22 48.35 49.34 54.38 57.89
Saving rate (%) 7.6 5.0 5.6 5.8 5.7 5.4 5.6 5.6 5.4
WWW.STANDARDANDPOORS.COM/RATINGSDIRECT JUNE 29, 2017 13
1876902 | 300139182
Economic Research: The U.S. Economy Goes From Signs Of Shining To As Good As It Gets
Table 4
S&P Global Economic Outlook--Downside (cont.)
June 2017
2012 2013 2014 2015 2016 2017e 2018e 2019e 2020e
Housing starts (mil.) 0.8 0.9 1.0 1.1 1.2 1.2 1.3 1.3 1.4
Unit sales of light vehicles
(mil.)
14.5 15.6 16.5 17.4 17.5 16.8 16.5 16.6 16.6
Federal surplus (fiscal year
unified, bil. $)
(1,089) (680) (484) (439) (586) (614) (721) (800) (808)
Note: Quarterly percent change represents annualized growth rate; annual percent change represents average annual growth rate from a year
ago. Quarterly levels represent average during the quarter; Annual levels represent average levels during the year. Quarterly levels of housing
starts and unit sales of light vehicles are in annualized millions. Quarterly levels of CPI and core CPI represent year over year growth rate during
the quarter. Exchange rate represents the nominal trade-weighted exchange value of US$ versus major currencies. e--Estimate.
Writer: Joe Maguire
WWW.STANDARDANDPOORS.COM/RATINGSDIRECT JUNE 29, 2017 14
1876902 | 300139182
Economic Research: The U.S. Economy Goes From Signs Of Shining To As Good As It Gets
STANDARD & POOR'S, S&P and RATINGSDIRECT are registered trademarks of Standard & Poor's Financial Services LLC.
S&P may receive compensation for its ratings and certain analyses, normally from issuers or underwriters of securities or from obligors. S&P
reserves the right to disseminate its opinions and analyses. S&P's public ratings and analyses are made available on its Web sites,
www.standardandpoors.com (free of charge), and www.ratingsdirect.com and www.globalcreditportal.com (subscription) and www.spcapitaliq.com
(subscription) and may be distributed through other means, including via S&P publications and third-party redistributors. Additional information
about our ratings fees is available at www.standardandpoors.com/usratingsfees.
S&P keeps certain activities of its business units separate from each other in order to preserve the independence and objectivity of their respective
activities. As a result, certain business units of S&P may have information that is not available to other S&P business units. S&P has established
policies and procedures to maintain the confidentiality of certain nonpublic information received in connection with each analytical process.
To the extent that regulatory authorities allow a rating agency to acknowledge in one jurisdiction a rating issued in another jurisdiction for certain
regulatory purposes, S&P reserves the right to assign, withdraw, or suspend such acknowledgement at any time and in its sole discretion. S&P
Parties disclaim any duty whatsoever arising out of the assignment, withdrawal, or suspension of an acknowledgment as well as any liability for any
damage alleged to have been suffered on account thereof.
Credit-related and other analyses, including ratings, and statements in the Content are statements of opinion as of the date they are expressed and
not statements of fact. S&P's opinions, analyses, and rating acknowledgment decisions (described below) are not recommendations to purchase,
hold, or sell any securities or to make any investment decisions, and do not address the suitability of any security. S&P assumes no obligation to
update the Content following publication in any form or format. The Content should not be relied on and is not a substitute for the skill, judgment
and experience of the user, its management, employees, advisors and/or clients when making investment and other business decisions. S&P does
not act as a fiduciary or an investment advisor except where registered as such. While S&P has obtained information from sources it believes to be
reliable, S&P does not perform an audit and undertakes no duty of due diligence or independent verification of any information it receives.
No content (including ratings, credit-related analyses and data, valuations, model, software or other application or output therefrom) or any part
thereof (Content) may be modified, reverse engineered, reproduced or distributed in any form by any means, or stored in a database or retrieval
system, without the prior written permission of Standard & Poor's Financial Services LLC or its affiliates (collectively, S&P). The Content shall not be
used for any unlawful or unauthorized purposes. S&P and any third-party providers, as well as their directors, officers, shareholders, employees or
agents (collectively S&P Parties) do not guarantee the accuracy, completeness, timeliness or availability of the Content. S&P Parties are not
responsible for any errors or omissions (negligent or otherwise), regardless of the cause, for the results obtained from the use of the Content, or for
the security or maintenance of any data input by the user. The Content is provided on an "as is" basis. S&P PARTIES DISCLAIM ANY AND ALL
EXPRESS OR IMPLIED WARRANTIES, INCLUDING, BUT NOT LIMITED TO, ANY WARRANTIES OF MERCHANTABILITY OR FITNESS FOR
A PARTICULAR PURPOSE OR USE, FREEDOM FROM BUGS, SOFTWARE ERRORS OR DEFECTS, THAT THE CONTENT'S FUNCTIONING
WILL BE UNINTERRUPTED, OR THAT THE CONTENT WILL OPERATE WITH ANY SOFTWARE OR HARDWARE CONFIGURATION. In no
event shall S&P Parties be liable to any party for any direct, indirect, incidental, exemplary, compensatory, punitive, special or consequential
damages, costs, expenses, legal fees, or losses (including, without limitation, lost income or lost profits and opportunity costs or losses caused by
negligence) in connection with any use of the Content even if advised of the possibility of such damages.
Copyright © 2017 by Standard & Poor’s Financial Services LLC. All rights reserved.
WWW.STANDARDANDPOORS.COM/RATINGSDIRECT JUNE 29, 2017 15
1876902 | 300139182