ECONOMIC RESEARCH Working Paper 169 December 10, 2013 Claudia Broyer, Maximilian Günnewig, Dr. Michael Heise, Ann-Katrin Petersen, Dr. Rolf Schneider Euro Monitor 2013 On the way to balanced growth } MACROECONOMICS } FINANCIAL MARKETS } SECTORS } ECONOMIC POLICY
Transcript
E CON OMI C RE S E ARCH
Working Paper 169 December 10, 2013
Claudia Broyer, Maximilian Günnewig, Dr. Michael Heise, Ann-Katrin Petersen, Dr. Rolf Schneider
Euro Monitor 2013 On the way to balanced growth
} M A C R O E C O N O M I C S
} F I N A N C I A L M A R K E T S } S E C T O R S } E C O N O M I C P O L I C Y
2
Economic Research Working Paper / No. 169 / December 10, 2013
Economic Research Working Paper / No. 169 / December 10, 2013
xx.10.2010
1. INTRODUCTION: MAINTAINING REFORM MOMENTUM
Our encouraging message from this year’s Euro Monitor: If we bring the measures launched during the crisis to a successful conclusion, the eurozone will emerge stronger from the crisis than it was before. Mistrust was indeed widespread, reflected in excessively high yield spreads, talk about eurozone exits or even the breakup of the eurozone. In the meantime, however, substantial progress has been made on several fronts. The ECB left no doubt that it would do everything necessary to preserve the euro, helping to calm the markets. In parallel, major progress was made in the problem countries towards restoring competitiveness. And, despite conflicting interests, policymakers agreed on the core elements of a European framework – ESM, reinforced Stability and Growth Pact, a new procedure to deal with macroeconomic imbalances. Above all, they agreed on pivotal steps towards a banking union. Creation of the latter can be viewed as a just as significant stage in the European integration process as the introduction of the euro itself!
So far, so good. The key now, despite justified hopes that the worst of the crisis is over, is not to let up. Firstly, the nascent (tentative) economic recovery should not tempt national policymakers to ease up on the implementation of reforms. Secondly, the consolidation of public finances must continue. Thirdly, agreement must be found on the remaining contentious aspects of the second pillar of banking union (SRM) – as an essential counterpart to the first pillar (SSM) that is already being established. Fourthly, the ECB will need to steer a delicate course between the results of the bank review on the one hand and the gradual, cautious exit from ultra-loose monetary policy on the other in order to avoid excessive market ructions. If all this succeeds, if we manage to “live” the new accomplishments, the eurozone will have taken a major leap forwards in the shadow of the crisis. Incidentally, the current strength of the euro is not merely a reflection of problems in the USA, but can be seen as a sign of confidence in the eurozone. Similarly, a smooth exit by Spain and Ireland from their aid programs would provide a signal that the crisis is over.
Box: How can balanced growth be measured?
Balanced macroeconomic growth in the individual Member States is essential to safeguard prosperity and underpin the credibility of the single currency. A host of factors play a role when determining whether an economy enjoys balanced growth. As a macroeconomic monitoring system, the Euro Monitor aims to expose existing and emerging imbalances in order to flag up the aberrations that led to the sovereign debt crisis in the euro area in a timely fashion. Given the influence that the financial markets have over the stability of individual member states and, as a result, over the euro area as a whole, the criteria must by definition rely heavily on macroeconomic data which financial markets consider to be material. We have come up with 15 quantitative indicators, which are themselves divided into four categories. The four thematic categories in which the indicators are gathered are1: • Fiscal sustainability • Competitiveness and domestic demand • Jobs, productivity and resource efficiency
1 In view of the turbulent events of recent years and the resulting noise factors we have opted not to perform a regression analysis. The composition of our Euro Monitor may evolve over time owing to changing threats to macroeconomic stability or advances in data availability. For instance, we have added one indicator to our scoreboard this year which measures the average growth rate in financial sector liabilities over the last five years.
Economic Research Working Paper / No. 169 / December 10, 2013
xx.10.2010
• Private and foreign debt
Alongside fiscal indicators, the Euro Monitor also covers the full spectrum of the macroeconomic dimension. In many cases five-year averages are used to smooth out cyclical swings.
Fiscal sustainability
In the first category fiscal sustainability is assessed on the basis of four indicators: new borrowing and existing debt are the two indicators of state finances that the financial markets keep a closest eye on. A further indicator is the share of interest payments on government debt in overall spending. High debt levels do not necessarily translate into a considerable interest burden for a country's budget if investors are prepared to lend the government money at a low interest rate, as in the case of Japan, for example. When assessing state finances, it is important to bear in mind that demographic change will place additional burdens on the state's shoulders, burdens that will result in higher government debt in the longer run. This burden, known as implicit government debt, varies from country to country depending on the specific demographic trends and on the structure of the national pension systems. As a result, we have included the need to adjust state finances to reflect the ageing population as another indicator under the "fiscal sustainability" category.2
Competitiveness and domestic demand
When an economy becomes less competitive, it is more prone to imbalances, and moreover, loses growth potential in the longer term. We believe that the "competitiveness" category is just as important in ensuring balanced growth as the "fiscal sustainability" category. The current account balance is the main indicator of external equilibrium. The markets interpret hefty deficits as pointing towards a lack of competitiveness. However, the current account balance should not only be seen in terms of competitiveness. Although a member state with a current account surplus might benefit from its competitive export sector, its internal demand might leave something to be desired which in turn would enlarge the gap between deficit and surplus eurozone countries. Moreover, growth reliant solely on exports is possibly an indication of an imbalanced growth path. We therefore include medium-term domestic growth, measured as the average annual change in domestic demand over the last five years, in our set of indicators.
The main reason behind a loss of competitiveness tends to lie in unfavourable cost developments. Consequently, we have used wage costs per unit of production as one of the individual indicators for assessing price competitiveness. This assessment looks at the difference between actual unit wage costs and a stable development rate of 1.5% expressed in index points.3 But a lack of competitiveness is not only caused by cost disadvantages. The root can also lie in a lack of product innovation or a less attractive product range. We have therefore used the development of a country's global trade share as a further individual indicator, because this parameter particularly reflects changes in the quality and structure of the goods offered by a country on the global markets.
2 This is based on a sub-component of the European Commission's Sustainability Gap Indicator – the required adjustment due to the long-term changes in government expenditure. This component sheds light on the additional adjustment required to finance the increase in public expenditure due to ageing up to 2060. 3 Labor costs are the major domestic inflation determinant. The target path of a 1.5% increase in labor costs per year is approximately consistent with the ECB’s price stability norm (close to but below 2%) if rising commodity prices which result in further inflation pressures are taken into account.
5
Economic Research Working Paper / No. 169 / December 10, 2013
xx.10.2010
Jobs, productivity and resource efficiency
The third category looks at “imbalances” on the labor market and the efficiency of a country’s economic output: the financial markets generally consider countries boasting higher economic growth to be better equipped to tackle debt problems. This has prompted us to include the development in the employment rate and labor productivity per employee in our indicator. In this respect, we believe that a medium-term assessment showing the percentage change within a five-year period makes the most sense. We have chosen the unemployment rate as a further labor market indicator, because it is still the main parameter signaling imbalances on the labor market.
Nowadays, economic efficiency is no longer measured in terms of labor productivity alone. The efficient use of resources has become a quality attribute for an economy, especially given that scarcer resources can translate into higher cost burdens. Due to a lack of available data, Indicator 3d (level of energy intensity as measured by kilogram of oil equivalent per EUR 1000 output) has been excluded from our calculations this year.
Private and foreign debt
For an economy to have a balanced economic outlook, moderate government debt is not the only prerequisite. It is also extremely important that private and foreign debt are not excessive. Not least given that the risk that private debt transmutes into a state liability. The property bubble that emerged in a number of countries triggered a dramatic rise in the demand for loans and a marked increase in household debt. Consequently, our indicator also looks at the development of private household debt ratios. Similarly, it also includes the development in the debt ratio of non-financial corporations.
This year, in order to capture the risk to the real economy emanating from the financial sector, we have included the increase in total financial sector liabilities in our set of indicators, along the lines of the EU Commission’s approach.4 To gauge the risks we use the average growth rate over the last five years.
As far as foreign debt is concerned, we have used the "net international investment position", which is based on a concept developed by the IMF and serves as a sort of "external solvency ratio" that is expanded to include capital market positions.5
4 The liabilities of the financial sector measures the development of the sum of all liabilities (this includes cash and deposits, securities (ex shares), loans, shares, insurance rserves and other liabilities). 5 According to the IMF, the net international investment position refers to the stock of external assets minus the stock of external liabilities. In much the same way that a corporate or national balance sheet does, the net position displays what the economy owns in relation to what it owes. As the international investment position viewpoint is that of the compiling economy, the assets of the rest of the world represent liabilities of the corresponding economy and vice versa.
6
Economic Research Working Paper / No. 169 / December 10, 2013
xx.10.2010
The following chart summarises the indicators that we will be using in our Monitor:
(2A) Unit labour costs, total economy, deviation from the target path of 1.5% rise per year in index points
(2B) Current account balance, as % of GDP
(2C) Global merchandise trade shares, exports, deviation from base year 2000 in %
(2D) Domestic demand, average annual change over the last five years in %
(1A) Gross government debt, as % of GDP
(1B) General government deficit/ surplus,as % of GDP
(1C) General government interest payments,as % of total government expenditure
(1D) Required adjustment in the primary balance due to demographic ageing in percentage points
(3A) Harmonised unemployment rate, %(3B) Employment ratio, change over five years in
percentage points(3C) Labour productivity per person employed,
average annual change over the last five years in %
(4A) Debt-to-GDP ratio of households, change over five years in percentage points
(4B) Debt-to-GDP of non-financial corporations, change over five years in percentage points
(4C) Net international investment position,as % of GDP
(4D) Total financial sector liabilities, average annual change over the last five years in %
Fiscal sustainabilityC1
Competitiveness and domestic demandC2
Jobs, productivity and resource efficiency Private and foreign debtC3 C4
Evaluating balanced growth on the basis of 15 indicators out of 4 categories
Consequently, all 15 individual indicators are quantitative indicators. Countries are given a rating score ranging from 1 to 10 in each of the 15 indicators.6 Since the individual indicators are assigned an equal weighting in the overall Euro Monitor rating score, the overall score for each country corresponds to the average rating of all 15 indicators, meaning that it is also expressed as a value from 1 to 10. The country rating in each category is calculated as the average of the indicator ratings in that category. Throughout, we have used annual values for all years until 2010 and estimates for 2011. We have defined three rating classes: values 1-4 (coded in the charts in red) signal poor performance, 5-7 (coded in dark blue) indicate middling performance and 8-10 (coded in light blue) good performance. Just as an alert threshold, values 1-4 can be seen as indicative values which guide the assessment but are to be complemented by economic judgment and country-specific expertise.
2. HOW MUCH PROGRESS HAS BEEN MADE IN 2013?
The key findings in this year’s Allianz Euro Monitor are:
• Germany remains the top-rated country in the euro area in terms of balanced growth, with an overall rating of 7.7. As a result, we consider corrective procedures under the EU’s Macroeconomic Imbalance Procedure unlikely. The second and third spots are occupied by Estonia, with a rating of 7.2, and then Austria, with 7.1. Once again, no single country achieves a score of 8 or more, which would signal balanced performance across the board. So, despite the subsiding euro debt crisis, it is crucial that the required reform momentum is maintained in the member states. Only one country, Cyprus, has a rating of less than 4, which signals broad-based uneven
6 Scales for each indicator are listed in the appendix on p. 38-45.
7
Economic Research Working Paper / No. 169 / December 10, 2013
xx.10.2010
development based on our rating scale. Last year, there were four countries – Cyprus, Greece, Ireland and Portugal – with an average rating of less than 4.
• Nine out of seventeen eurozone countries were able to improve their rating in 2013
in a year-on-year comparison. One particularly encouraging development is the fact that these countries also include the program countries, albeit with the exception of Cyprus. This suggests that the consolidation and reform efforts are largely bearing fruit.
• Nevertheless, the economic weakness – manifested in a number of economic indicators – that continued to plague many EMU countries in 2013 meant that the success of the reform efforts was not as evident as it could have been. Negative economic conditions are still putting pressure on indicators such as the state deficit, unit wage costs, domestic demand and labor productivity.
• The economic slump cannot, however, serve as a general argument explaining why the ratings of five countries deteriorated further and why two countries stagnated at a relatively low level. Other than Cyprus, the developments in Slovenia and Italy, and even in the Netherlands, give cause for concern in this respect.
• As is hardly surprising, countries with a very poor indicator rating have the greatest potential for improvement. Portugal, for example, improved its rating from 3.8 in 2012 to 4.6 in 2013, with Greece upping its rating from 3.6 to 4.4.
• The two indicators that set off the loudest alarm bells remain unemployment and domestic demand. The debt crisis has left a visible scar on the labor market in a number of EMU countries, with marked differences in labor market conditions between the individual countries (only Germany, Austria, Luxembourg and Malta fare well in this respect). As far as the development of domestic demand is concerned, no single country managed to achieve a rating of 8 or more. Seven out of seventeen countries were assigned the worst possible rating, 1, for both of these indicators. These include the program countries, as well as Spain, Italy and Slovakia.
8
Economic Research Working Paper / No. 169 / December 10, 2013
xx.10.2010
0
1
2
3
4
5
6
7
8
9
10
2005 2007 2009 2011 2013
GermanyFranceItaly
Euro Monitor Rating over time: Periphery countries catching up
0
1
2
3
4
5
6
7
8
9
10
2005 2007 2009 2011 2013
IrelandGreeceSpainPortugal
• Thanks to the pension reforms implemented in a large number of member states,
the outlook for implicit government debt is looking brighter. The required adjustment to the structural primary balance to reflect demographic ageing, as published by the European Commission, has fallen considerably in the euro area as a whole.
• The indicator with the best results is now the current account. Twelve out of seventeen countries either have a surplus or balanced books. Only five countries – France, Finland, Estonia, Greece and Cyprus - still have a slight current account deficit corresponding to 1-2% of their GDP. In this respect, it is, however, important to remember that the current account indicator has to be viewed within the context of the domestic demand indicator. This means that a country with balanced foreign trade, or even a surplus in this area, due to weak domestic demand cannot be assigned a positive rating in this category.
• The improved current accounts are closely linked to the stabilization of private debt. The 2013 ratings for the debt ratios of private households and non-financial corporations, as well as the liabilities of financial corporations, have improved in many EMU countries compared with 2012, with virtually no countries slipping on this score. This deleveraging process is, however, likely to take a good few years and will go hand-in-hand with weak lending demand.
Eurozone country profiles
Germany
• Germany maintained its position at the top of the ranking with an unchanged overall score of 7.7 points. As a result, we consider corrective procedures under the EU’s Macroeconomic Imbalance Procedure unlikely.
• However, Germany scored 8 or more on only nine of the 16 indicators. • Germany’s best results were in the category “Private and Foreign Debt” (score 9.3).
Private sector debt levels are not impeding growth in Germany. • A soft spot of the German economy is the trend in labor productivity which, over the
last five years, has actually fallen marginally.
9
Economic Research Working Paper / No. 169 / December 10, 2013
deficit/surplus, % of GDP (rhs)Debt-to-GDP ratio, %
(lhs)
Germany: Euro Monitor strengths and weaknesses
Current account, % of GDP (lhs)
Domestic demand, average annual change over the last five years in % (rhs)
Harmonized unemploymentratio, % (lhs)
Labor productivity, average annual change, % (rhs)*
Non-financialcoporationsDebt-to-GDP ratio of private
households, %
*) Over the last five years. Sources: EcoWin, Eurostat, EU Commission, IMF, own estimates.
Estonia
• With an overall score of 7.2 points, Estonia, eurozone member since 2011, is again among the leaders in terms of balanced growth (second place, +0.3 points).
• Measured by our four indicators, the Baltic country displays by far the most sustainable public finances. Estonia gets best marks on the individual indicators for government debt, interest burden and future demographic burden on public finances. This healthy financial picture is also found in the private sector.
• Estonia performs rather less well in terms of the change in competitiveness, where it shares 11th place with Ireland. Rising labor costs are the main culprit.
• The category “Jobs and Productivity” remains a soft spot, in which Estonia – starting from a low level – recorded the sharpest improvements thanks to strong productivity gains, declining job losses and a falling unemployment rate. The employment ratio in Estonia is still above the eurozone average and is not that far off the 70% mark.
Austria
• With an overall score of 7.1 points Austria is again among the leaders in the eurozone in terms of balanced growth (third place). Austria is also one of the few “core countries” to see an improvement in its overall score compared with 2012 (+0.2 points).
• In the category “Fiscal Sustainability” Austria occupies fifth place. Thanks to the slight decline in interest payments as a percentage of overall expenditure, Austria’s fiscal robustness is likely to increase compared with last year and it is well on the way to being released from EU deficit proceedings. On the other hand, future outlays on pensions and health pose a threat to Austrian public finances, highlighting the need for further reforms to the relatively expensive state pension scheme.
• Austria remains among the leaders in terms of competitiveness (ranking 2nd again) – unit labour costs are rising only moderately and the current account is in surplus.
• Austria is among the eurozone countries with a relatively robust labour market picture (ranking 3rd). Despite a slight increase, the unemployment rate is again the lowest in the eurozone and the employment ratio over the last five years is likely to
10
Economic Research Working Paper / No. 169 / December 10, 2013
xx.10.2010
have edged up slightly. But the dip in labour productivity over the last five years is a weak spot.
• Austria’s best scores are in the category “Private and foreign debt” (Rank 3 with a score of 8.3 points).
Accession candidate Latvia
• With a Euro Monitor score of 6.8 points, Latvia would be among the leaders in our country ranking (fourth place).
• In the categories “Fiscal Sustainability” and “Private and Foreign Debt” Latvia performs outstandingly (Category score of 8 points or more).
• In the category “Competitiveness and Domestic Demand” high unit labor cost increases and weak domestic demand compared with 2008 were a negative factor. In conjunction with the rising export market share, however, the wage rises are a reflection of the catch-up process in the Baltic country.
0
4
8
12
16
20
2000 2004 2008 20120
2
4
6
8
10
0
20
40
60
80
100
120
2004 2006 2008 2010 2012
0
15
30
45
60
2000 2004 2008 2012-15
-10
-5
0
5
10
Labour market conditions improvingLabour market conditions improving
Continuing catching-up processContinuing catching-up process
Latvia: Euro Monitor strengths and weaknesses
*) Base year 2000, deviation from the target path of 1.5% rise per year in index points. **) Over the last five years. Sources: EcoWin, Eurostat, EU Commission, WTO, own estimates.
-20
0
20
40
60
80
100
120
2000 2004 2008 20120.00
0.02
0.04
0.06
0.08
0.10Unit labor costs, deviation
from target path* (lhs)
Global merchandisetrade share, % (rhs)
Non-financialcoporations
Debt-to-GDP ratio of private households, %
Government budgetdeficit/surplus, % of GDP (rhs)
Debt-to-GDP ratio, % (lhs)
Harmonized unemploymentratio, % (lhs)
Labor productivity, average annual change, % (rhs)*
• Latvia performs less well with regard to trends on the labor market. However, the
unemployment rate is falling and the employment ratio is heading back up towards the 70% mark, although it is still below its 2008 level.
Luxembourg
• Compared with other eurozone core countries, Luxembourg’s overall balanced growth score improved the most (+0.4 points).
• Luxembourg (AAA) ranks second on the “Fiscal Sustainability” indicator. Both debt ratio and deficit ratio are below the Maastricht thresholds. But long-term demographic risks loom. The required adjustment in the primary balance due to ageing is the highest in the eurozone.
• Luxembourg also gets good marks when it comes to deleveraging in the private sector, above all among the heavily indebted non-financial corporations. The required adjustment among private households is substantially lower. In terms of
11
Economic Research Working Paper / No. 169 / December 10, 2013
xx.10.2010
foreign debt the county is among the net creditors, not least thanks to persistent current account surpluses.
• The EU Commission has called for review of Luxembourg, alongside Germany, due to its current account surplus in excess of 6% of overall output (three-year period). The surplus stems less from merchandise trade, as can be seen in the loss of export market share, but rather from the services balance and the compensation and property income account.
• Unit labor costs have risen sharply since 2000, accompanied by low productivity gains. Although the unemployment rate is one of the lowest in the eurozone, it is often the young who struggle to find a job.
Slovakia
• With an overall score of 6.0 (-0.1 points) Slovakia defended its fifth place. On the one hand lower score with regard to the employment situation and domestic demand, on the other better marks for government and private sector finances..
• Slovakia is one of the few eurozone countries with a debt ratio (still) below the 60% Stability and Growth Pact ceiling. With the budget deficit set to decline, fiscal sustainability has improved compared with last year. Adherence to this year’s deadline in EU deficit proceedings seems within reach. On the other hand, the demographic sustainability gap jeopardizes government finances in the long term. All told, Slovakia moves up two rungs on the fiscal sustainability ladder to sixth place alongside France and the Netherlands.
• In the course of the catch-up process, Slovakia’s share in world trade has rocketed by almost 150% since 2000. The current account has been in surplus since 2011 and is likely to contribute to a reduction in external liabilities. Thanks to an increase in labor productivity, the rise in unit labor costs has slowed down.
• On the domestic front the employment situation remains the boil on the nose (falling employment rate and an unemployment rate above the eurozone average.
Malta
• Malta shares sixth place with the Netherlands in the Euro Monitor ranking. Compared with last year growth has become more balanced (+0.2 points).
• In the summer the EU opened new deficit proceedings against Malta (deadline 2014). Measured against (higher) state spending, the interest burden has eased. With a debt ratio of close to 70%, Malta comes in mid-field in terms of fiscal sustainability.
• On the change in competitiveness, Malta occupies last place together with Cyprus. This is attributable to the excessive unit labor costs (against the target path), which together with the loss in world trade share points to an undermining of competitiveness. Malta’s current account has been in surplus for two years, whereas domestic demand has performed poorly over a five-year horizon. The likely pickup in domestic demand compared with last year offers a ray of hope.
• On “Jobs and Productivity” Malta is among the leaders, together with Germany. Apart from solid growth, government measures to boost female participation have doubtless also contributed to the successes on the employment front. However, with an employment ratio of around 60% still has more room to improve than the “star pupils” with employment rates above 70%. Shrinking labor productivity is also worrying.
• Malta records its best results with regard to “Private and Foreign Debt”. In terms of foreign debt, Malta is among the net creditors in the eurozone. Debt momentum among private households and the heavily indebted non-financial corporations has
12
Economic Research Working Paper / No. 169 / December 10, 2013
xx.10.2010
slowed down. In relation to its economic strength, Malta’s banking sector is very large. The average increase in financial sector liablities over the last five years is likely to have halved compared with 2011.
Netherlands
• Dutch growth was less balanced than last year (-0.4 points). Main culprits were higher government debt, deterioration on the labor market and weaker domestic demand over the past five years, whereas debt momentum in the corporate sector slowed down. With an overall score of 5.8 points, the Netherlands slipped two slots to sixth place.
• The Netherlands not only lost its AAA rating, but also received a worse score for Indicator 1a (higher government debt). Although the deficit ratio has fallen on 2012, it is still likely to be above 3%. The Netherlands has been granted an extra year (until 2014) to reduce its excessive deficit.
• Set to come in at 9.6%, the Netherlands has the highest current account surplus in the eurozone. High private household debt and the rise in unemployment are weighing on domestic demand. The country was already subjected last year to an in-depth review by the EU Commission under the EU Macroeconomic Imbalance Procedure.
55
60
65
70
75
80
2000 2004 2008 20120
2
4
6
8
10
2000 2004 2008 20120510152025303540
0
2
4
6
8
10
12
2000 2002 2004 2006 2008 2010 2012-2
-1
0
1
2
3
0
20
40
60
80
100
2000 2004 2008 2012-8-6-4-20246810
Employment ratio remains above averageEmployment ratio remains above average
Budget deficit back above 3% benchmarkBudget deficit back above 3% benchmark
Dampening effects on domestic demandDampening effects on domestic demand
Sources: EcoWin, Eurostat, EU Commission, IMF, own estimates.
Netherlands: Euro Monitor strengths and weaknesses
Employment ratio in %
Employment ratio in %, EMU
Government budgetdeficit/surplus, % of GDP (rhs)
Debt-to-GDP ratio, % (lhs) Current account,
% of GDP (lhs)
Harmonized unemploymentratio, % (lhs)
Debt-to-GDP ratio of private households, % (rhs)
Domestic demand, average annual change over the last five years in % (rhs)
• Although employment is heading down, the employment ratio of 74% this year
remains well above the eurozone average of 63%.
Belgium
• In the overall ranking Belgium remains in eighth place. Belgium is one of the few core countries to improve its overall score compared with 2012 (5.7 points, +0.1 points).
• On “Fiscal Sustainability” Belgium ranks only 11th. The country is groaning under a government debt ratio of just over 100%. In addition, the demographic sustainability gap is one of the highest in the eurozone. After the EU had tightened up deficit proceedings against Belgium in the summer, there is now a good chance that it will be released from the deficit proceedings next year.
13
Economic Research Working Paper / No. 169 / December 10, 2013
xx.10.2010
• Belgian private households have already embarked on the deleveraging process, falling financial sector liabilities point to balance sheet adjustments in the banking sector and the net international investment position remains relatively stable in positive territory despite small current account deficits. In the category “Private and Foreign Debt” achieves its best ranking (fourth place). But in terms of overall output, non-financial corporations remain deeply in debt.
• With regard to the change in competitiveness, the score is somewhat less favorable this year. Belgium is steadily losing market share, due inter alia tot he steep rise in unit labor costs. The current account deficit, however, is likely to be small.
• The poor performance of labor productivity in Belgium is likely to be driving rising unit labor costs. On “Jobs and Productivity” Belgium gets its worst score.
France
• Coming in 8th in our ranking (together with Belgium), France does not fare as badly as its widespread reputation might suggest. The unchanged overall score of 5.7 (compared with 2012) is only a tenth of a point below sixth-placed Netherlands and Malta.
• France’s main weak points are the worrying drop in world market share and labor market regulation which is reflected generally in just over 10% unemployment rates and especially in high youth unemployment (around 25%). A further significant soft spot is the outsize public sector, reflected in factors not reviewed here such as the government revenue ratio.
• Among the country’s strengths, with indicator scores of 8 or 9, are: the government interest burden and the demographic adjustment requirement in the primary balance from Category 1, a small current account deficit and, from Category 4, the net international investment position and the modest increase in financial sector liabilities over the last five years. And, with the reduction in private household and corporate debt making headway, France records its best result in the final category “Private and Foreign Debt”.
• Both the French government debt ratio and the reduction in the deficit ratio leave much to be desired – the EU Commission has granted France an extra two years until 2015 to get the deficit down below the 3% mark. Nonetheless, François Hollande, not least with an eye on the financial markets, has left no doubt that he intends to remain on the budgetary consolidation path.
0
20
40
60
80
100
120
2000 2004 2008 20120
12
34
56
7Interest payments, % of govt. expenditure (rhs)*
-4-3-2-101234
2000 2002 2004 2006 2008 2010 20123.0
3.5
4.0
4.5
5.0
5.5
6.0
-4
0
4
8
12
16
2000 2004 2008 2012-2-1012345678
Continuing reduction in employmentContinuing reduction in employment
Declining world trade shareDeclining world trade share
France: Euro Monitor strengths and weaknesses
Employment ratio, changeover 5 years** (rhs)
0
4
8
12
16
20
24
2004 2006 2008 2010 2012
Global merchandisetrade share, % (rhs)
Current account, % of GDP (lhs)Debt-to-GDP ratio, %
(lhs)
*) General government interest payments as % of government expenditure. **) In percentage points. Sources: EcoWin, Eurostat, EU Commission, IMF, WTO, own estimates.
Debt-to-DGP ratio of households, change over 5
years in ppt
Non-financial corporations
Harmonized unemployment ratio in %, EMU (lhs)
Harmonized unemploymentratio, % (lhs)
14
Economic Research Working Paper / No. 169 / December 10, 2013
xx.10.2010
• During the crisis France has not been under such reform pressure as the programme countries or Italy and Spain. To this extent, there is a certain need to catch up and the risk of “political muddling through”.
Finland
• Both Finland’s 10th place in the ranking and its overall score of 5.5 were unchanged on last year.
• The country’s strength remains “Fiscal Sustainability”, sharing second place with Germany and Luxembourg. Although the budget deficit is likely to rise slightly this year, it will still be below the 3% Maastricht threshold. In addition, Finland is one of the few eurozone countries with a debt ratio below the 60% Stability and Growth Pact limit.
• The only category in which Finland gets a bad score (3.7) is “Jobs, Productivity and Resource Efficiency“. But including the level when looking at the employment ratio, the result is not that bad as Finland is not that far from the 70% mark.
• Among the individual indicators Finland gets the lowest score of 1 on world market share and financial sector liabilities. The annual average growth rate in the latter has been consistently more than 10% since 2005. By contrast, private households and corporations have been reining in their debt.
Spain
• With a score of 5.4, Spain ranks 11th and is thus in the lower mid-field. Compared with last year it was able to marginally improve both its score and its ranking. However, the recession, which was only overcome in the third quarter of this year, prevented a better performance.
• Given the pronounced weakness of the economy it is not surprising that Spain still scores a poor 1 on the indicators domestic demand and unemployment and employment ratio. By contrast, on labour productivity and unit labour costs the country performs well, with progress on the reform front certainly playing a role here, but also helped by “redundancy productivity”.
• Clear adjustment progress is evident in the current account balance, which is now in the black and rewards Spain with its best indicator score of 10. That this is not only attributable to declining imports but to a large extent also to exports can be seen in Indicator 2c: Among the countries under review, only Spain, together with Portugal, managed to boost their score compared with last year.
0
20
40
60
80
100
2000 2004 2008 2012-15
-10
-5
0
5
10
-20-10
0102030405060
2000 2002 2004 2006 2008 2010 2012-5
0
5
10
15
20
25
30
2000 2004 2008 2012-1
0
1
2
3
4
5
6
-10
-8
-6
-4
-2
0
2
2000 2002 2004 2006 2008 2010 20121.5
1.6
1.7
1.8
1.9
2.0
2.1
High unemployment ratio and productivity gainsHigh unemployment ratio and productivity gains
High yet decreasing government deficitHigh yet decreasing government deficit
Balance sheet adjustments in the private sectorBalance sheet adjustments in the private sector
Spanish export on the riseSpanish export on the rise
*) Over the last five years. **) Average annual change over the last five years in %.Sources: EcoWin, Eurostat, EU Commission, IMF, WTO, own estimates.
Spain: Euro Monitor strengths and weaknesses
Debt-to-GDP ratio of non-financialcorporations, change over 5 years in ppt
Total financial sectorliabilities**
Debt-to-GDP ratio of private households
Government budgetdeficit/surplus, % of GDP (rhs)
Debt-to-GDP ratio, % (lhs)
Global merchandisetrade share, % (rhs)
Current account, % of GDP (lhs)
Harmonized unemploymentratio, % (lhs)
Labor productivity, average annual change, % (rhs)*
15
Economic Research Working Paper / No. 169 / December 10, 2013
xx.10.2010
• While deleveraging in the private sector is making headway, government debt continues to rise steeply. Although the score for the deficit ratio has jumped by two points, it remains unsatisfactory. What is more, this improvement was also helped by the fact that, in contrast to 2013, public-sector aid to the banks in 2012 had a substantial negative impact. Spain has again been granted an extension by the EU – this time by two straight years to 2016 – to get below the 3% deficit ceiling. It is encouraging that the Spanish aid programme for its banks expires at the end of the year without needing to be extended.
Slovenia
• Slovenia’s overall score slipped from 5.5 points in 2012 to 5.1 points this year. Six individual indicators deteriorated, only three improved.
• As a result of the banking crisis and the severe recession, in particular the state of public finances and the situation on the labor market worsened further. Accordingly, indicator scores in Category 1 “Fiscal Sustainability” and Category 3 “Jobs and Productivity” fell noticeably.
• There were improvements, however, in the category “Private and Foreign Debt”, with the score rising from 6.3 points last year to 7.3 points this.
• In Slovenia stubbornly high unit labor costs and moribund domestic demand prevent a decent score in the category “Competitiveness and Domestic Demand”.
Italy
• Although Italy managed to improve its score in three out of the four categories compared with last year, among the eurozone “core countries” the third-largest economy once again shows the least balanced growth. In the eurozone ranking Italy drops one spot to 13th.
• Although important reforms have been passed in Italy aimed at promoting budgetary stability and boosting growth, full implementation of these reforms remains a challenge. Political stability and a functioning government are essential in order to tackle Italy’s economic policy challenges: sustained fiscal discipline, a competitive economy and a more flexible labour market.
95
105
115
125
135
145
2000 2004 2008 2012-1.1
-0.8
-0.5
-0.20.1
0.4
0.7
1.0
020406080
100120140160
2000 2004 2008 20120246810121416
02468
101214161820
2004 2006 2008 2010 2012
-30-25-20-15-10-505
1015
2005 2007 2009 2011 2013e-4
-3
-2
-1
0
1
2
Productivity: Can downward trend be halted?Productivity: Can downward trend be halted?
Public finance: Interest burden still relatively highPublic finance: Interest burden still relatively high
First current account surplus since 2001First current account surplus since 2001
*) General government interest payments as % of government expenditure. **) Per person employed, average annual change over past five years. Sources: EcoWin, Eurostat, EU Commission, IMF, own estimates.
Interest payments, % of govt. expenditure (rhs)*
Labor productivity, average annual
change, % (rhs)**
Italy: Euro Monitor strengths and weaknesses
Net international investment position, % of GDP (lhs)
Debt-to-GDP ratio, % (lhs) Current account,
% of GDP (rhs)
Unit labor costs, index 2000 = 100 (lhs)
Debt-to-DGP ratio of households, change over 5
years in ppt
Non-financial corporations
16
Economic Research Working Paper / No. 169 / December 10, 2013
xx.10.2010
• Thanks to healthy budget figures the EU Council lifted deficit proceedings against Italy in the summer of this year. However, it remains uncertain whether Italy will be able to meet the Maastricht criterion again this year. Italy is one of the most heavily indebted states in the eurozone and its interest payments as a percentage of total government spending are also high. On the other hand, the demographically induced “sustainability gap” in the Italian budget is one of the lowest in the eurozone and has fallen further thanks to the pension reform passed two years ago.
• For the first time in over a decade Italy looks poised to notch up a small current account surplus. Nonetheless, in the category “Competitiveness and Domestic Demand” Italy still comes in third from last – the rise in unit labour costs persists and domestic demand is falling.
• The sharp rise in unemployment in the course of the recession and the decline in the employment ratio feed into a worryingly poor score in the category “Jobs, Productivity and Resource Efficiency”. The slowdown in the downwards momentum of labour productivity provides a ray of hope. To boost labour market flexibility, key aspects of Italian labour law were amended in 2012.
• In the category “Private and Foreign Debt” Italy comes in mid-field (at No. 9). The debt momentum of private households, non-financial corporations and the financial sector is relatively low and foreign debt comparatively small.
Portugal
• Portugal’s growth has become more balanced this year, recording an overall score of 4.6 points. Only last year the average score of below 4 points had pointed to unbalanced growth across the board. As a result, Portugal, together with Greece, shows the highest adjustment momentum in the Euro Monitor. Portugal managed to improve its score in three of the four categories (the exception being the labor market) and in seven individual indicators.
• Portugal plans to exit the aid program in the middle of next year. Although the country is one of the most heavily indebted countries in the eurozone, fiscal sustainability improved in 2013 (thanks to the lower budget deficit and the fall in the interest burden as a proportion of state spending). This also ignores the reform of the Portuguese pension system (no data available), as a result of which the future demographic burden on Portugal’s budget is likely to have eased.
020406080
100120140160
2000 2004 2008 2012-12
-10
-8
-6
-4
-2
0
0
4
8
12
16
20
2000 2004 2008 2012-10-8-6-4-20246810
-10
0
10
20
30
40
50
60
2004 2006 2008 2010 2012
-16-12
-8-4048
1216
2000 2004 2008 2012-15
-10
-5
0
5
10
15
Labor market conditions still criticalLabor market conditions still critical
High yet decreasing budget deficitHigh yet decreasing budget deficit
Households reducing high debt-to-GDP ratioHouseholds reducing high debt-to-GDP ratio
First current account surplus for 40 yearsFirst current account surplus for 40 years
*) Base year 2000, deviation from the target path of 1.5% rise per year in index points. Sources: EcoWin, Eurostat, EU Commission, IMF, own estimates.
Portugal: Euro Monitor strengths and weaknesses
Employment ratio, changeover 5 years in ppt (rhs)
Harmonized unemploymentratio, % (lhs)
Debt-to-DGP ratio of households, change over 5
years in pptNon-financial corporations
Government budgetdeficit/surplus, % of GDP (rhs)
Debt-to-GDP ratio, % (lhs)
Unit labor costs, deviationfrom target path* (rhs)
Current account, % of GDP (lhs)
17
Economic Research Working Paper / No. 169 / December 10, 2013
xx.10.2010
• Portugal’s best performance is in the change in competitiveness. This year Portugal will record its first current account surplus for 40 years.
• The high foreign debt piled up by Portugal given decades of current account deficits therefore looks set to stabilize at least. Starting from high household and corporate debt ratios, Portugal will probably see the steepest drop in private sector debt this year. The liabilities of the Portuguese financial sector are likely to increase at a diminished pace on a five-year average.
• The situation on the Portuguese labor market remains bleak, with a score of 2.3 in this category. The employment ratio is well below its 2008 level. Some hope is offered by the decline in the unemployment rate since February (although some of this decline is probably attributable to the drop in the overall workforce) as well as increases in Portuguese labor productivity.
Greece
• In 2013 Greece improved its overall score to 4.4 from 3.6 in 2012 and 2.2 in 2011. This is still modest but does reflect improvements in many areas.
• Greece’s best performance is in terms of the change in competitiveness. In this category the score has shot up from 3.5 in 2011 to 7.0 this year. This is attributable to a sharp drop in unit labour costs, a more or less balanced current account and stabilisation of the world market share.
• Greece also performs fairly well on the corporate debt front, which is easing downwards at a relatively low level.
• But on seven indicators Greece still records the worst possible score of 1.
0255075
100125150175200
2000 2004 2008 2012024681012141618Interest payments, % of
*) General government interest payments as % of government expenditure. **) Base year 2000, deviation from the target path of 1.5% rise per year in index points. Sources: EcoWin, Eurostat, EU Commission, WTO, own estimates.
Greece: Euro Monitor strengths and weaknesses
0
5
10
15
20
25
30
2000 2004 2008 2012-16
-12
-8
-4
0
4
8
Unit labor costs, deviationfrom target path** (lhs)
Global merchandise tradeshare in % (rhs)
Employment ratio, changeover 5 years in ppt (rhs)
Harmonized unemploymentratio, % (lhs)
Debt-to-DGP ratio of households, change over 5 years in ppt
Non-financial corporations
• The fiscal picture remains very bleak, with a score of 2.3 in this category. However,
thanks to the interest-rate relief agreed in late 2012, the interest burden has eased despite rising debt levels. What is more, the successes on the consolidation front are not adequately reflected in the current deficit ratio. If the bank recapitalisation had not been included, the Greek budget deficit would be considerable lower. Nor, due to the lack of data, is account taken of the reform of the Greek pension system – as a
18
Economic Research Working Paper / No. 169 / December 10, 2013
xx.10.2010
result of this reform the future demographic burden on the Greek budget is likely to have eased.
Ireland
• Ireland’s three-year aid program expired in December. The Troika comprising EU, IMF and ECB had regularly given Ireland good marks on program implementation. Dublin intends to forgo the safety net of a credit line from the ESM rescue fund when it returns to the markets.
• Compared with last year Ireland improved its overall score by 0.4 points to 4.1. In three out of four categories (the exception being public finances) and in five individual indicators the Irish notched up better scores.
• Measured by our four indicators, Ireland comes in last with regard to “Fiscal Sustainabiliy”. On the one hand higher government debt in relation to economic output and a higher interest burden as a proportion of total spending, but a lower deficit ratio on the other.
0
4
8
12
16
20
2000 2004 2008 20120
1
2
3
4
5
020406080
100120140160
2000 2004 2008 2012-35-30-25-20-15-10-50510
-200
20406080
100120140
2004 2006 2008 2010 2012
-8-6-4-202468
2000 2004 2008 2012-40-30-20-10010203040
Labor market situation improvingLabor market situation improving Private sector: Debt dynamics slowing down Private sector: Debt dynamics slowing down
*) Base year 2000, deviation from the target path of 1.5% rise per year in index points. **) Within 5 years. ***) Average annual change over the last five years in %. Sources: EcoWin, Eurostat, EU Commission, IMF, own estimates.
Ireland: Euro Monitor strengths and weaknessesHigh yet decreasing budget deficitHigh yet decreasing budget deficit
Government budget deficit/surplus, % of GDP (rhs)
Debt-to-GDP ratio, % (lhs) Current account,
% of GDP (lhs)
Total financial sectorliabilities***
Debt-to-DGP ratio of households, change over 5 years in ppt
Non-financial corporations
Unit labour costs, deviationfrom target path* (rhs)
Harmonized unemploymentratio, % (lhs)
Labor productivity, average annual change, % (rhs)**
• Starting from a low level, the overall score in the category “Jobs and Productivity” has
improved. Ireland has recorded strong productivity gains over the last five years. At the same time the situation on the labor market has brightened up. The unemployment rate is falling and the employment rate has stabilized since 2011.
• Balance sheet repairs in the heavily indebted private sector in Ireland are making headway, above all among private households. Ireland’s foreign debt has been falling for two years, but remains high.
Cyprus
• In the spring Cyprus slipped under the euro rescue umbrella. The government debt and banking crisis are reflected in a very low and once again slightly worse overall score (down from 3.1 in 2012 to 2.7 in 2013). However, Cyprus did manage to achieve slight improvements in the categories “Competitiveness” (thanks to a drop in the current account deficit) and “Private and Foreign Debt” (due to balance sheet adjustments in the financial sector).
19
Economic Research Working Paper / No. 169 / December 10, 2013
xx.10.2010
• Cyprus registers the worst possible score of 1 on 9 of the 15 individual indicators. All three indicators in the category “Jobs and Productivity” were flashing 1. Particularly striking is the steep ongoing decline in the employment ratio in Cyprus of late.
Box: What are the conclusions reached by the European Commission's Alert Mechanism Report? – a comparison
The euro debt crisis has injected new urgency and vigor not only into budget policy monitoring, but also into economic policy coordination within the eurozone. One of the main aspects of the "Sixpack", which came into force in December 2011, was the Macroeconomic Imbalance Procedure (MIP). The new procedure is aimed at identifying and resolving excessive macroeconomic imbalances that could hinder the development of the EU economies and jeopardize the smooth functioning of the EMU.
The annual submission of the Commission's Alert Mechanism Report fires the starting gun for each new round of checks. The report uses a whole range of economic indicators (a "Scoreboard"), corresponding threshold values and a number of additional indicators enabling the economic interpretation of the Scoreboard to pinpoint those EU member states which could be harboring harmful imbalances, meaning that they are to be subjected to an "in-depth country review" in the following year (preventative arm). If this process identifies "excessive" imbalances, the Council can initiate an "Excessive Imbalance Procedure" (EIP - corrective arm). This sort of action has never been taken in the past. Ultimately, staggered financial sanctions can also be imposed on EMU countries. The following indicators are currently used:
1. Current account balance (3-year average as a % of GDP)
2. Net international investment position (as a % of GDP)
3. Export market shares (5-year % change)
4. Nominal unit labor cost (3-year % change)
5. Real effective exchange rate (3-year % change)
6. Private sector debt (as % of GDP)
7. Private sector credit flow (as % of GDP)
8. Deflated house prices (y-o-y % change)
9. General government sector debt (as % of GDP)
10. Unemployment rate (3-year average)
11. Total financial sector liabilities (y-o-y % change)
EU Commission scoreboard indicators to identify macroeconomicimbalances Identical indicators EU Commission/Euro Monitor in blue
This year, the European Commission concluded that an in-depth review was required for eleven EMU countries (and a further five EU countries): Spain, Slovenia, France, Italy, Belgium, Malta, the Netherlands and Finland, as well as Germany and Luxembourg, which will come under the microscope of an in-depth review for the very first time. (The imbalances and corrective measures in Greece, Portugal, Cyprus and Ireland are already being monitored as part of the economic adjustment programs in these countries.)
20
Economic Research Working Paper / No. 169 / December 10, 2013
xx.10.2010
Euro Monitor reviews of these "middle of the field" EMU countries show that none of them are experiencing broad-based, balanced growth. What differences can be identified?
• The Commission uses data from the previous year for its Alert Mechanism Report. So the report, published on November 13, is based on data from 2012, meaning that only some of the progress made in a number of member states to rectify their imbalances can be taken into account. Nine out of seventeen eurozone countries were able to improve their Euro Monitor rating in 2013 in a year-on-year comparison.
• Although the indicators used by the European Commission are largely consistent with those applied to the Euro Monitor, there are differences in respect of individual indicators in terms of whether levels, ratios or rates of change are used and which rates of change are deemed significant. This applies, in particular, to the assessment of private debt. The Euro Monitor looks at debt momentum as opposed to debt ratios, i.e. at the change in debt ratios, in the private sector, with a distinction being made between private households and non-financial companies. EMU countries with high private sector debt levels that are making progress on the deleveraging front include, by way of example, the Netherlands, France, Finland and Spain.
Euro Monitor Rating 2012-2013
Marked blue: EMU countries which will be subject to an in-depth analysis.
Rank 2013 Country Code
EMU Member State Rating 2013 Rating 2012
1 DE Germany 7.7 7.72 EE Estonia 7.2 6.93 AT Austria 7.1 6.94 LU Luxembourg 6.4 6.05 SK Slovakia 6.0 6.16 MT Malta 5.8 5.66 NL Netherlands 5.8 6.28 BE Belgium 5.7 5.68 FR France 5.7 5.7
10 FI Finland 5.5 5.511 ES Spain 5.4 5.112 SL Slovenia 5.1 5.513 IT Italy 4.6 4.814 PT Portugal 4.6 3.815 GR Greece 4.4 3.616 IE Ireland 4.1 3.717 CY Cyprus 2.7 3.1
• Differences also emerge when we look at the evaluation procedure. Whereas the
indicators used in the Euro Monitor are summarized to form a Scorecard and three evaluation categories are defined, the most important aspect in the Imbalance Procedure is whether or not, and how many, threshold values are undercut/overshot for individual indicators. This is particularly evident – when comparing the Euro Monitor results with this year's Commission procedure – in respect of Germany and Luxembourg. In both countries, a comparatively small number of indicators hint at worrying developments, with an overall assessment putting both Germany and Luxembourg in the upper-mid field. The fact that the Euro Monitor considers current account surpluses to be a good thing, provided that they are not explained by poor domestic demand, is doubtless one reason behind this.
21
Economic Research Working Paper / No. 169 / December 10, 2013
xx.10.2010
3. THE FOUR CATEGORIES OF BALANCED GROWTH IN DETAIL
Fiscal Sustainability
Although the signs are pointing to a (moderate) economic recovery, repairing public finances in the eurozone remains a protracted process. The category “Fiscal Sustainability” shows that the majority of EMU Member States need to keep their foot on the fiscal brake.
Despite individual setbacks – caused in part by political instability – there is no evidence that euro Member States are abandoning austerity. We expect the overall eurozone deficit to fall to 3.0% of GDP this year (down from 3.7% last year) and maintain our assessment that the eurozone debt ratio will peak this year at just below 96% before stabilizing next year and declining in 2015. The easing of the euro debt crisis has been accompanied by falling risk spreads on government bonds. We are therefore expecting a somewhat lower interest burden in relation to overall spending for the eurozone as a whole of 6% (2012: 6.2%). At the same time numerous European governments from Dublin to Athens have reacted to the demographic challenges facing public finances. The pension reforms introduced in a number of countries in recent years help reduce implicit government debt. The required adjustment in the primary balance as a result of demographic ageing in the eurozone, published every three years by the EU Commission, has fallen to 2.1 percentage points.
Measured by the four indicators in Category 1, Estonia displays the greatest degree of fiscal sustainability by far. Second spot is shared by the triple-A countries Finland, Germany and Luxembourg. In 2014 this trio is likely to meet with competition from Latvia, which, with a category rating of 8.8, would have come in just behind its Baltic neighbor Estonia this year. Other core countries such as Austria, France and the Netherlands receive middling ratings. In the program countries Portugal, Cyprus, Greece, fiscal sustainability remains a long way off. However, it should be noted that the, in some cases, sweeping pension reforms in Portugal, Greece and Ireland are not incorporated in the category score. These are likely to have lowered substantially the required adjustment in the primary balance due to demographic ageing (the EU Commission has not published any new data for these three countries).
Fiscal Sustainability Rating 2013
Rank 2013 EMU Member State Rating 2013 Rank 2012 Rating 2012 Rank 2008 Rating 2008
Economic Research Working Paper / No. 169 / December 10, 2013
xx.10.2010
In six euro countries the sustainability of public finances has increased, measured in terms of the four indicators. Encouragingly, the largest improvements were seen in Portugal and Greece, not least due to the decline in the interest burden. In addition, Austria, Slovakia, Malta and Belgium shored up their fiscal robustness. By contrast, five eurozone countries saw a deterioration in fiscal sustainability: Above all Cyprus, which slipped under the rescue fund in the spring, Slovenia and Ireland, to a lesser extent Finland and France. The reasons vary. While the Cypriot economy is groaning under mounting government debt, new borrowing and interest payments, in Ireland the rise in interest payments in terms of overall spending goes hand in hand with a lower deficit ratio. Ireland’s three-year aid program expires in mid-December. The Troika comprising EU, IMF and ECB has regularly issued the Irish government good marks in terms of program implementation. On its full return to the capital market, Dublin intends to do without the safety net of a credit line from the rescue fund ESM.
EMU
0
12
3
45
6
7
89
10
EE LU SK FI SL MT NL AT DE FR ES BE CY IE PT IT GR
EMU
0
20
40
60
80
100
120
140
160
180
EE LU SK FI SL MT NL AT DE FR ES BE CY IE PT IT GR
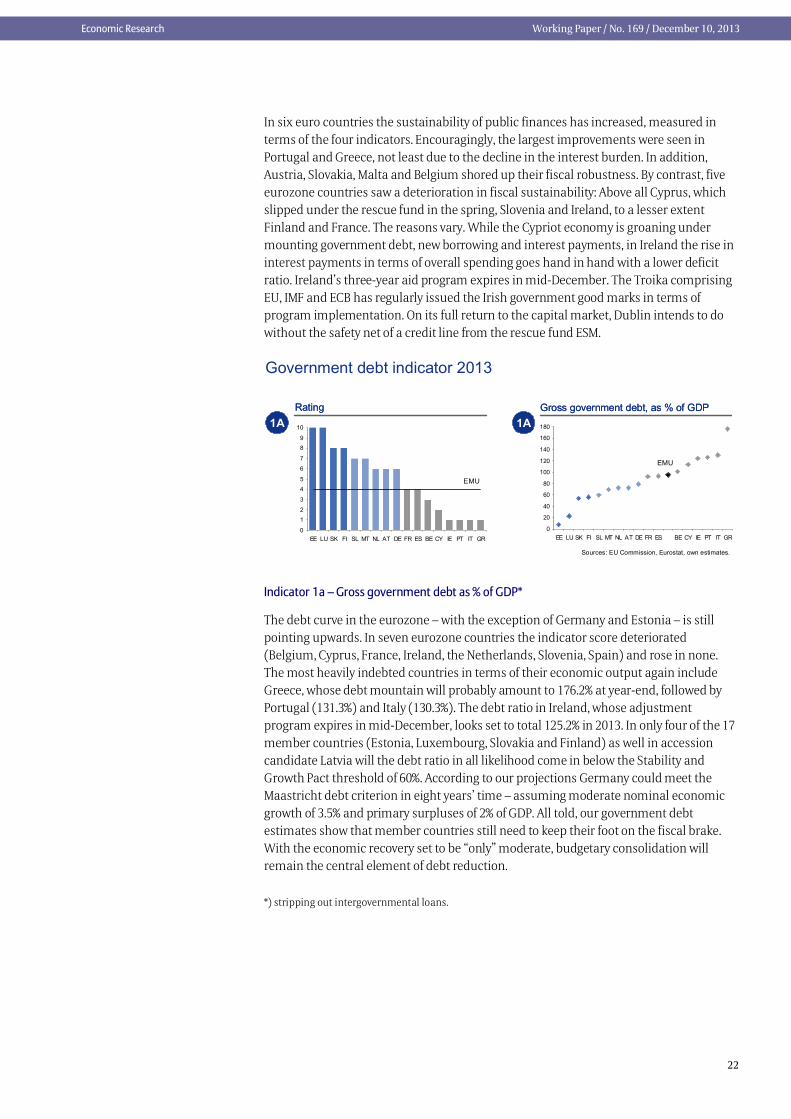
Government debt indicator 2013
RatingRating Gross government debt, as % of GDPGross government debt, as % of GDP1A 1A
Sources: EU Commission, Eurostat, own estimates.
Indicator 1a – Gross government debt as % of GDP*
The debt curve in the eurozone – with the exception of Germany and Estonia – is still pointing upwards. In seven eurozone countries the indicator score deteriorated (Belgium, Cyprus, France, Ireland, the Netherlands, Slovenia, Spain) and rose in none. The most heavily indebted countries in terms of their economic output again include Greece, whose debt mountain will probably amount to 176.2% at year-end, followed by Portugal (131.3%) and Italy (130.3%). The debt ratio in Ireland, whose adjustment program expires in mid-December, looks set to total 125.2% in 2013. In only four of the 17 member countries (Estonia, Luxembourg, Slovakia and Finland) as well in accession candidate Latvia will the debt ratio in all likelihood come in below the Stability and Growth Pact threshold of 60%. According to our projections Germany could meet the Maastricht debt criterion in eight years’ time – assuming moderate nominal economic growth of 3.5% and primary surpluses of 2% of GDP. All told, our government debt estimates show that member countries still need to keep their foot on the fiscal brake. With the economic recovery set to be “only” moderate, budgetary consolidation will remain the central element of debt reduction.
*) stripping out intergovernmental loans.
23
Economic Research Working Paper / No. 169 / December 10, 2013
xx.10.2010
Government deficit/surplus indicator 2013
RatingRating Government deficit/surplus, as % of GDPGovernment deficit/surplus, as % of GDP1B 1B
EMU
0
1
23
4
5
6
78
9
10
DE EE LU FI AT BE IT SK NL MT FR SL PT ES IE CY GR
EMU
-16
-14
-12
-10
-8
-6
-4
-2
0
2
DE EE LU FI AT BE IT SK NL MT FR SL PT ES IE CY GR
Sources: EU Commission, Eurostat, own estimates.
Indicator 1b – Government borrowing as % of GDP
Despite weak, in some cases shrinking, economic output, progress was made on reducing deficits in 2013. In only two eurozone countries, Cyprus and Finland, was the indicator score worse than last year (but the Finnish deficit is still below the Maastricht limit of 3% of GDP). By contrast, six countries improved their score – Slovakia and Spain by a straight two points. The number of deficit-sinners is shrinking. Almost half of the eurozone countries managed to meet the 3% Maastricht deficit criterion this year – Austria and Belgium are poised to be released from EU deficit proceedings next summer. The German budget could actually record a small surplus. Apart from Germany, Luxembourg and Estonia have the lowest budget deficits in the eurozone. At the same time, in this year’s EU deficit proceedings the nominal austerity targets of France, Spain, the Netherlands, Portugal and Slovenia have been extended. With the economy shaky, they benefited from the greater focus on the improvement of the structural deficit, adjusted for cyclical and one-off factors. These countries should use the time granted to continue their austerity drives – not only in order to reduce debt momentum but also not least to safeguard the credibility of the revamped Stability and Growth Pact.
In a number of countries, such as Greece, Slovenia and Spain for instance, the recapitalization of domestic banks by the government has had a detrimental impact on the deficit. Stripping out these rescue measures, the Greek deficit ratio would not have been the highest figure in the eurozone at 13.5%, but would have amounted to 4% at most. In Spain, where the adjustment program for the financial sector is likely to expire as planned at the end of the year, the rescue measures played less of a role than last year (around 0.3 after 4 percentage points in 2012). Next year the Asset Quality Review and the subsequent stress tests could put some European banks under pressure. In this context the EU Commission has already announced that it would treat any eventual aid for banks as a “one-off measure”, i.e. would not launch deficit proceedings if such aid resulted in a breaching of the 3% threshold.
RatingRating
Government interest payments indicator 2013General government interest payments,as % of total government expenditureGeneral government interest payments,as % of total government expenditure
1C 1C
EMU
0
1
2
3
4
5
6
7
8
9
10
EE LU FI NL FR AT SK SL DE BE MT GR ES CY PT IT IE
EMU
0
2
4
6
8
10
12
EE LU FI NL FR AT SK SL DE BE MT GR ES CY PT IT IE
Sources: EU Commission, Eurostat, own estimates.
24
Economic Research Working Paper / No. 169 / December 10, 2013
xx.10.2010
Indicator 1c – Interest payments as % total expenditure
Government interest payments in relation to overall spending have been moving broadly sideways this year. Seven countries have managed to uphold last year’s score. The easing of the eurozone debt crisis is likely to provide relief with regard to interest payments in a number of crisis-torn countries in the coming years, or at least curb the rise in the interest burden.
The top places are taken by countries with comparatively low debt levels such as Estonia, Finland and Luxembourg, where the share of interest payments is well below 2%. Overall, the euro core countries, including the Netherlands, Austria, France and Germany, continue to enjoy the confidence of the financial markets.
Among the countries with the highest interest burden in terms of overall spending are Ireland and Italy, with a share of just under 11%, along with Portugal and Cyprus with almost 9%. All four of these countries are groaning under government debt ratios of over 100% – as is Belgium, where the interest burden, however, is three percentage points below that in Portugal and Cyprus. As a result, Belgium occupies a middling spot. But Belgium is also “benefiting” from a comparatively high spending ratio. In a number of countries this denominator effect needs to be taken into account. In Greece the improved score compared with last year results not only from reduced interest payments thanks to the additional relief agreed in November 2012 but also from the higher spending ratio. In Spain’s case, paradoxically, the poorer score is also the result of a drop in the state spending ratio, i.e. a successful consolidation policy.
RatingRating
Required adjustment in primary balance indicator 2013*Required adjustments in the primarybalance due to demegraphic ageingRequired adjustments in the primarybalance due to demegraphic ageing
*) No data available for Greece, Ireland and Portugal. Source: EU Commission.
1D 1D
EMU
0
12
3
45
6
7
89
10
EE IT FR ES DE AT NL FI MT SK CY BE SL LU GR IE PT
EMU0
1
2
3
4
5
6
7
8
9
EE IT FR ES DE AT NL FI MT SK CY BE SL LU GR IE PT
Indicator 1d – Required adjustment in primary balance due to ageing in percentage points
Whether fiscal policy will continue to have the leeway to act or severely hamper the options of future generations also hinges on the additional costs due to demographic trends which can feed through into higher government debt (implicit government debt). This burden varies from country to country depending on demographic trends and pension system arrangements. Thanks to the pension reforms carried out in a number of countries – including Germany, France, Italy, Spain and recently the Netherlands – the outlook for implicit government debt in the eurozone has on the whole improved. This is evident from the EU Commission’s three-yearly Fiscal Sustainability Report, showing that the required adjustment in the structural primary deficit due to ageing has fallen from 3.5 percentage points in 2009 to 2.1 percentage points in 2012.
In order to finance additional spending due to ageing, the eurozone heavyweights Germany, France, Italy, Spain and the Netherlands, along with Cyprus, Malta, Slovenia and Luxembourg need to carry out smaller adjustments than estimated in 2009.
25
Economic Research Working Paper / No. 169 / December 10, 2013
xx.10.2010
Alongside Belgium and Slovakia, Slovenia and Luxembourg, however, are still among the eurozone countries with a yawning sustainability gap of more than five percentage points, which we classify as “high risk”. In Luxembourg – among the top 3 in the indicators 1a to 1c – the required adjustment in the primary balance is the highest in the eurozone. For this reason, the EU Commission has recommended that Luxembourg undertake further steps beyond the pension reforms passed in December 2012.7
In Germany the pension reforms8 enacted over the past decade have narrowed the calculated sustainability gap. However, it cannot be ruled out that the pension plans of the Grand Coalition will in future have the opposite effect. While Germany, as recently announced by Eurostat, has the lowest birth rate of all EU countries (8.4 births per 1000 inhabitants), the French budget will benefit over the long term from the positive demographic trend. Together with Ireland, France has one of the highest birth rates (15.7 and 12.6 births per 1000 inhabitants, respectively). In addition, President Francois Hollande’s predecessors had already introduced a number of measures to shore up the state pension system.9 Nonetheless, rising deficits of the pay-as-you-go basic pension funds illustrate that more action needs to be taken. A new pension reform is scheduled to be passed by the French National Assembly before the end of this year.10 In Italy, where the birth rate remains mired below the EU average as in Germany, ex-PM Mario Monti had passed a sweeping pension reform shortly after taking office in December 2011 (above all an increase in the retirement age). In Spain, too, steps to reform the pension system were introduced two years ago with further measures planned before the end of this year.11
Competitiveness and Domestic Demand
We determine a country’s competitiveness by looking at the development of unit labor costs, the deviation in world trade market shares and the current account balance. Since a current account surplus due to weak domestic demand can hardly be considered an expression of high competitiveness, we also take a look at domestic demand. Please note that the assessment in this category should not be interpreted as absolute competitiveness of a country, but much rather as changes over time.
7 See http://ec.europa.eu/europe2020/pdf/nd/csr2013_luxembourg_en.pdf. 8 i.a. incorporation of sustainability factor in pension adjustments, gradual increase in retirement age to 67. 9 Before the end of this decade – more quickly than in Germany – the retirement age for a full pension is to be raised from 65 to 67 years. 10 The pension reform envisages rising contributions and a gradual increase in contribution periods to 43 years. By contrast, the relatively low retirement age of 62 years is to remain unchanged. 11 To safeguard the long-term financial stability of the Spanish pension system the retirement age will in future be linked to life expectancy and other demographic factors.
The results of each indicator for this category “Competitiveness and Domestic Demand“ vary widely: While the current account balance indicator (2b) is the best indicator for the monetary union, the domestic demand assessment (2d) is among the worst of all indicator assessments. Increased price competitiveness has boosted exports in a number of EMU countries. At the same time, the ongoing deleveraging in the private and public sector as well as higher unemployment are weighing on domestic demand. These two developments have helped to improve the current account picture in the eurozone considerably.
This year as last, no country receives a rating of at least 8 points in this category – 8 points would imply an overall good performance. Germany tops the ranking, directly followed by Austria. Greece worked its way to up into third place, reflecting a substantial improvement in their competitiveness, albeit from a very low level. Germany is losing market share even though the unit labor cost picture remains favorable. Five countries manage to increase their rating, four countries lose some points. The scores of Greece, Portugal, Spain and Cyprus increased mainly due to improved current account balances. Italy’s score was unchanged. Slovakia, the Netherlands, Belgium and Malta all recorded lower domestic demand, with their scores slipping somewhat.
RatingRating
Unit labour costs indicator 2013
Unit labour costs, deviation from target path of 1.5% rise per yearUnit labour costs, deviation from target path of 1.5% rise per year
Sources: Eurostat projections, own estimates.
EMU
-20
-10
0
10
20
30
40
50
60
70
DE GR PT AT IE ES FR NL BE FI IT CY SK MT SL LU EE
EMU
0
1
2
3
4
56
7
8
9
10
DE GR PT AT IE ES FR NL BE FI IT CY SK MT SL LU EE
2A 2A
27
Economic Research Working Paper / No. 169 / December 10, 2013
xx.10.2010
Indicator 2A – Unit labor costs, base year 2000, deviation from the target path of 1.5%rise per
year in index
Looking at indicator 2A, we find that unit labor cost developments have been diverging starkly within the union. While some countries could lower their deviation margins, other countries have still not managed to correct excessive growth in unit labor costs.
In comparison with the year 2000, Germany and Greece have experienced the most favorable development of unit labor costs and both receive the maximum rating of 10 points, followed by Austria, Ireland and Portugal with 9 points and Spain with 8 points. Greece, Ireland, Portugal and Spain have improved their indicator ratings continuously since 2009, coming from very low levels: unit labor costs are now lower than they were in 2008, in the case of Greece even lower than the 2005 level. Italy and Cyprus report mediocre ratings of 5 points. Italian unit labor costs stand almost 12% (almost 15 index points) above the target path. Furthermore, Belgium and Finland have experienced an increase in unit labor costs of more than 1.5% per year and have thus gradually lost their good ratings from 2007 (9 or 10 points, respectively). Malta, Estonia, Luxembourg and Slovenia bring up the rear.
RatingRating
Current account balance indicator 2013
Current account balance, as % of GDP Current account balance, as % of GDP
Sources: Eurostat, IMF, own estimates.
EMU
0
1
23
4
5
6
78
9
10
NL DE LU SL SK IE AT MT ES PT IT BE FI FR GR CY EE
EMU
-4
-2
0
2
4
6
8
10
12
NL DE LU SL SK IE AT MT ES PT IT BE FI FR CY GR EE
2B 2B
Indicator 2b – Current account balance as % of GDP
The euro area looks set to report a current account surplus of 2.1% of GDP this year, with most EMU member states now having a balanced or even positive current account. This illustrates the success of the painful yet fruitful adjustment processes in the peripheral countries.
Twelve of the seventeen countries achieve the maximum rating of 10 points. Cyprus, Finland, France and Greece receive 9 points. Tailender Estonia is the only country to drop down one rating notch compared with 2012.
The steepest drop in the current account deficit is found in Cyprus: Due to plummeting domestic demand the current account deficit looks set to tumble 4.5 percentage points to 2% of GDP. The Greek current account deficit should decrease from 3.4% down to 2% of GDP. Encouraging news also emanates from Italy, Spain and Portugal where deficits were turned into small surpluses in 2013. In Italy’s case it is the first time since 2001, in the cases of Spain and Portugal the first time in this millennium. The Irish external balance has been positive since 2010.
With a value of 9.6% of GDP the Netherlands, as in the previous year, records the highest current account surplus in the monetary union. As part of the EU Commission Alarm
28
Economic Research Working Paper / No. 169 / December 10, 2013
xx.10.2010
Mechanism Report the German current account surplus was criticized in particular. In fact, the EMU surplus only slightly exceeds that of Germany (EUR 200bn compared with EUR 191bn). As last year, the German surplus accounts for 7% of GDP and the EU Commission has thus decided to conduct an in-depth review (see box below).
Box: on the debate surrounding the German current account surplus
Ever since 2011, the European Commission has been using the Stability and Growth Pact not only to keep an eye on fiscal policy in the EU countries, but also to analyze, drawing on a number of indicators (based on data from the prior year), whether or not there is a risk of excessive macroeconomic imbalances coming to the fore. The Commission recently caught the public eye by publishing an in-depth country analysis on Germany for the first time, prompted, among other things, by the country's overstepping of the indicator threshold for the current account surplus (three-year average of 6% of GDP).12
Marked current account deficits are often seen as pointing towards a lack of competitiveness, whereas surpluses hint at highly competitive economies. But the current account balance alone does not say much about anything. It is the driving forces behind the current account, which are often being swept under the carpet in the current debate, that are important: deficits, for example, do not always have to be an indicator of an undesirable development stemming from rampant wage growth or unsustainable public and private debt burdens. In emerging economies with low income levels, for example, there certainly is such a thing as a "healthy" current account deficit, because this means that these countries are receiving capital for investments that will be profitable in the long-term, bolstering the economic convergence process. In this sort of environment, above-average productivity growth also enables above-average wage increases. On the other hand, current account surpluses are not problematic per se, especially if, as in Germany's case, they can be explained by a strong competitive standing and specialization in sectors that are experiencing stronger global demand. The accumulation of assets abroad will help to cushion the blow of demographic burdens in the future. By investing their savings abroad, domestic savers can diversify the risk associated with their assets and benefit from higher returns in high-growth emerging economies with a different demographic profile.
It is striking that, at international level, Germany's status as an "outsider" on the basis of its current account surpluses has met with far more criticism than, say, the fact that budget deficits remain high in some EMU countries, even though - as we see it - the countries with the greatest need for adjustment within the single currency area are those countries that have a high current account deficit. A "race to the bottom" in terms of external competitiveness should be avoided at all costs.
The Commission has issued recommendations on how the German current account imbalances can be alleviated, urging the country to boost its domestic demand, in particular. Although the development of Germany's domestic demand is not as weak as is often assumed (over the past five years, it has been growing at an average rate of 0.6% a year while euro-zone domestic demand has been on the wane), it is, indeed, also true that moves to clear structural obstacles would help to provide more momentum for growth on the domestic economy. An "Investment agenda 2020", for example, would help to clear Germany's investment backlog and boost the country's long-term growth prospects. Other measures proposed by the Commission, such as moves to lower the
12 Other indicators that breached the indicative thresholds of the European Commission's Scoreboard in 2012 include the depreciation of the real effective exchange rate, the loss of export market share and the public debt level.
29
Economic Research Working Paper / No. 169 / December 10, 2013
xx.10.2010
country's high taxes and duties, especially for low wage earners, and to revive competition in the service sector could also be good news for domestic demand.
The results of the assessment will be published early next year. Given Germany's macroeconomic situation, the outcome is unlikely to involve any correction measures, with financial sanctions even less likely. If the imbalances were found to be "excessive", the European Council would launch an "Excessive Imbalance Procedure" and propose a package of correction measures. This sort of action has, however, never been taken in the past. No EMU country has ever been faced with the risk of a correction procedure to date – not even Slovenia and Spain, which were found to have "excessive imbalances" last year. Even if the procedure were initiated, staggered financial sanctions (ranging from interest-bearing deposits to annual administrative fines corresponding to 0.1% of GDP) would only be imposed on EMU countries if the Council were to conclude, in two consecutive recommendations, that (1) the package of correction measures proposed was insufficient and/or (2) the member state had not implemented the correction measures.
RatingRating
Global merchandise trade share indicator 2013Global merchandise trade shares, exports,deviation from base year 2000, %Global merchandise trade shares, exports,deviation from base year 2000, %
Sources: WTO, own estimates.
EMU
0
12
3
45
6
7
89
10
SK EE SL GR NL ES DE AT PT BE LU IT FR CY MT FI IE
EMU
-100
-50
0
50
100
150
200
SK EE SL GR NL ES DE AT PT BE LU IT FR CY MT FI IE
2C 2C
Indicator 2c – World trade share, merchandise exports, change on 2000 in %
In the course of 2013 world trade picked up somewhat more steam. We are penciling in an overall increase of 2.5 to 3% after 2.3% last year. But this still leaves growth below the medium-term average of 5 to 6%. Compared with last year, the eurozone’s share in world trade is likely to fall marginally. However, according to our indicator, which measures the percentage deviation in the world trade share compared with base year 2000, no eurozone country saw their score worsen on last year. Only Austria, Portugal, Spain and Slovakia managed to lift their market share. Slovakia has already reached the top of the rating scale. Over the last thirteen years Slovakia’s share in world trade has increased by more than 145%. As in the preceding years, Estonia and Slovenia also got the top mark of 10 points, increasing their share in world trade since 2000 by almost 45% and 27% respectively. These trends illustrate the growing integration of the eastern European Member States in the world economy.
The development in Greece’s world market share is striking. Apart from the threeleaders in this ranking, Greece is the only country likely to have expanded its share since 2000 – but of course from a low level. In mid-field we find the Netherlands, former export world champion Germany, Austria as well as Belgium and Luxembourg.
30
Economic Research Working Paper / No. 169 / December 10, 2013
xx.10.2010
Among the “losers” are France, Cyprus, Malta, Finland and Ireland, who have lost between almost 40% (France) and a good 48% (Ireland) of their world market share compared with base year 2000. Italy also performs badly, with its share down by almost 30%.
RatingRating
Domestic demand indicator 2013Domestic demand, average annual changeover the last five yearsDomestic demand, average annual changeover the last five years
Sources: Eurostat, own estimates.
EMU
0
1
2
3
4
5
6
7
8
9
10
LU DE AT BE FI FR MT EE NL SK IT ES PT IE SL CY GR
EMU
-8-7-6-5-4-3
-2-10123
LU DE AT BE FI FR MT EE NL SK IT ES PT IE SL CY GR
2D 2D
Indicator 2d – Domestic demand, base year 2000, average annual growth rate over five years
in %
Looking at domestic demand is an important supplement when it comes to assessing the current account as foreign trade surpluses can be the upshot of weak domestic demand. By contrast, surpluses that go hand in hand with strong domestic demand are a sign of international competitiveness.
Since 2011 Luxembourg has led the field on domestic demand growth, this year scoring 7 points. Germany and Austria follow with unchanged scores of 5 points. This might seem a little surprising given that Germany is often criticized for its weak domestic demand. However, at 0.6%, the average annual increase in German domestic demand is pretty modest. Finland along with Belgium, which slipped one rung, scored 4 points.
Not surprisingly, the trend in domestic demand in the eurozone as a whole presents an extremely weak picture. All told, domestic demand fell by 1.1% a year over the last five years. Twelve of the seventeen countries received a score of 2 points or less. The debt-ridden countries Cyprus, Greece, Ireland, Italy, Portugal and Spain all show the worst possible score of 1, joined by the Netherlands and the eastern European states Slovakia and Slovenia. In Greece domestic demand tumbled by an annual 7.3%, in Cyprus by 5.1%. As last year, Indicator 2d, along with Indicator 3a (unemployment rate) is the worst indicator in the eurozone (1 point). However, for next year the picture for domestic demand is at least somewhat brighter given the substantial adjustment progress made in correcting the economic imbalances that lie behind the contraction.
Jobs, Productivity and Resource Efficiency
In this year's issue of the Euro Monitor, the "Jobs, productivity and resource efficiency" category is based on only three components: the unemployment rate, the employment rate and productivity development. A lack of available data meant that we had to exclude the 3d indicator (gross domestic energy consumption in relation to gross domestic product, expressed in kg of crude oil equivalent per EUR 1,000) from our analysis. This unfortunately means that a key component of resource efficiency is missing, although the unemployment and employment rates also reflect whether an economy is using its
31
Economic Research Working Paper / No. 169 / December 10, 2013
xx.10.2010
resources in an efficient manner. After all, idle human capital is a contraindicator in this respect.
Out of the four categories we defined, "Jobs, Productivity and Resource Efficiency" clearly emerges as a sore point: whereas the average eurozone rating for the other three categories is sitting nicely in the mid field, the value for category 3 is only 2.7. What is more, not a single country manages to achieve a good rating in this category, with only five making it into the mid range: Germany, Estonia, Malta, Luxembourg and Austria. The situation in Greece and Cyprus is especially critical, with the worst possible marks being awarded for all three individual indicators in these countries.
Jobs, Productivity and Resource Efficiency Rating 2013
Rank 2013 EMU Member State Rating 2013 Rank 2012 Rating 2012 Rank 2008 Rating 2008
As the following individual sections reveal, both labor market indicators show countries leaning to either extreme, i.e. there are hardly any countries left in the middle of the rankings. The following also shows that no country is currently making a convincingly good job of achieving employment and productivity success at the same time. In order to achieve the latter, more attention would have to be devoted to aspects like the spread of technological advancements and the promotion of expertise/human capital. It is not least for this reason that the investment slump in the euro area has to be overcome. After all, the wave of public budget consolidation and private deleveraging has resulted in investments in infrastructure, research and development, etc. being neglected.
Naturally, the main area for action lies in combating the high levels of unemployment in Europe. Youth and long-term unemployment, in particular, have the potential to become socially explosive issues, with a real need for employment and training initiatives. It is also important not to underestimate the heavy burden that youth unemployment (already fueling talk of a "lost generation") could place on the future.
Indicator 3a – Unemployment rate in %
Alongside domestic demand, the unemployment rate is the indicator where the euro area as a whole fares the worst, with a rating of 1. This result comes as little surprise given that the region is just starting to emerge from a recession, and bearing in mind that labor market improvements tend to "lag behind" economic recovery. No fewer than seven countries are assigned the lowest possible rating (Greece, Ireland, Italy, Portugal, Slovakia, Spain and Cyprus), with Greece and Spain standing out as particularly bad
32
Economic Research Working Paper / No. 169 / December 10, 2013
xx.10.2010
examples, with unemployment rates in excess of 25%. France and Slovenia score almost equally poorly, with a rating of 2, owing to unemployment rates running into the double digits. The only countries that emerge in a positive light here are Germany, Luxembourg and Austria, with unemployment rates of between 5% and 6%. Whereas the unemployment rate has edged up in the latter two countries in 2013, Germany's labor market has managed to escape the crisis relatively unscathed.
Nevertheless, the gloomy overall picture should not distract us from the fact that the problem countries, in particular, have implemented far-reaching labor market reforms. Reforms like these generally, however, require some time to bear fruit in full, in some cases needing an economic upswing to allow them to show their full effect. The latest data from some of these countries point towards at least a stabilization on the labor market, with unemployment rates already starting to drop back again in some cases. While this improvement should continue, the lack of momentum behind the economic upswing means that it will be some time before acceptable labor market conditions prevail across Europe again.
RatingRating
Employment ratio indicator 2013Employment ratio,change over five years in percentage pointsEmployment ratio,change over five years in percentage points
Sources: EU Commission, Eurostat, own estimates.
EMU
0
1
2
3
4
5
6
7
8
9
10
MT DE LU AT BE FR EE FI SK IT NL SL PT IE ES CY GR
EMU
-14
-12
-10
-8
-6
-4
-2
0
2
4
6
MT DE LU AT BE FR EE FI SK IT NL SL PT IE ES CY GR
3B 3B
Indicator 3b – Employment rate, change over a five-year period in percentage points
When it comes to the development of the employment rate, the split between a small group of countries with positive ratings and the majority of EMU states with poor ratings is similar to, if not even more pronounced than, the previous indicator. The only country in the middle of the rankings in this respect is Austria. Malta in particular, but also Germany and Luxembourg, are on the positive side of the divide, with ratings in excess of 8. In addition to Malta's solid economic performance, government measures to boost labor force participation among women would also appear to have had a positive impact on employment. It is, however, worth bearing in mind that, with a current employment rate of around 60%, Malta has even more room for improvement than the "model pupils" (Netherlands, Germany and Austria), which each have rates in excess of 70% - because our indicator does not merely look at the current level, but also at the change over a five-year period. This also puts the poor 2 rating assigned to the Netherlands into perspective: although the trend is not heading in the right direction, the Netherlands leads the eurozone pack with an employment rate of 74% (the EMU average comes in at 63%). If we include an analysis of the current levels, the results achieved by Estonia and Finland no longer look quite as bleak either, with both countries only a whisker away from the 70% mark.
Among the six countries with the lowest indicator value of 1 (Greece, Ireland, Portugal, Slovenia, Spain, Cyprus), the picture in Greece and Spain is (as with the unemployment rate) particularly worrisome, with employment rates now having slipped back to below
33
Economic Research Working Paper / No. 169 / December 10, 2013
xx.10.2010
50% and 55% respectively. In Cyprus' case, the unabated sharp downward spiral of late is particularly striking, whereas in Ireland, the employment rate has stabilized since 2011. Although Italy does not fare quite as badly with a rating of 2, its employment rate is scarcely higher than in Spain, at 56%.
RatingRating
Labour productivity indicator 2013Labour productivity per person employed,avg. annual change over last five years, %Labour productivity per person employed,avg. annual change over last five years, %
Sources: Eurostat, own estimates.
3C3C
EMU
0
1
2
3
4
5
6
7
8
9
10
ES IE EE SK PT FR DE BE AT NL FI SL MT IT GR CY LU
EMU
-3
-2
-2
-1
-1
0
1
1
2
2
3
ES IE EE SK PT FR DE BE AT NL FI SL MT IT GR CY LU
Indicator 3c – Labor productivity per person in work, based on 2000, average annual growth
rate over a five-year period in %
If we look at the results for labor productivity in connection with the two previous indicators, one aspect really comes to the fore: no country has managed to convincingly overcome the trade-off between productivity and employment growth. Countries have managed to achieve either positive labor market development or strong productivity growth, but no country has managed to achieve both. The four countries at the top of the table for indicators 3a and 3b - Germany, Luxembourg, Malta and Austria - for example, only achieve ratings of 3 at the most when it comes to labor productivity. Conversely, the two best ranked countries in terms of productivity growth, namely Ireland and Spain, which both achieve a rating of 8, come bottom of the league as far as the labor market parameters are concerned. Two examples that highlight the trade-off are Spain, where the shrinking of the (relatively unproductive) construction sector, in particular, pushed "redundancy productivity" up, and the other way round, Malta, where job creation in the tourism and labor-intensive service industries has evidently left its mark on productivity development.
Estonia, Portugal and Slovakia end up in the middle of the labor productivity rankings. The group of problem countries with both clear labor market and evident productivity problems includes Greece, Italy, Slovenia and Cyprus. In these cases, our set of indicators provides emphatic evidence either that there is a need for reforms, that the reforms are not being implemented properly or that the reforms that have been initiated have not been able to demonstrate their full impact due to the recession.
Private and Foreign Debt
The results in our fourth category “Private and foreign debt” show that the balance sheet adjustments within the eurozone continue. 11 countries – including France Spain, Italy and Ireland – achieve their best rating, the remaining six countries their second best. 15 of the 17 EMU member countries gain points, Estonia and Italy maintain last year’s rating. The steepest climb, coming from rather low levels, was seen in Portugal (+1.8 points). Malta, Greece and Luxembourg also improved their rating substantially (+1.3 points).
34
Economic Research Working Paper / No. 169 / December 10, 2013
xx.10.2010
Private and Foreign Debt Rating 2013Rank 2013 EMU Member
The appreciable adjustment in current account balances is helping a number of EMU member countries to stabilize or improve their international investment position. Although this means that a recuction in foregn debt is under way, it is likely to be a lengthy process.
At the same time the private sector is, in almost all eurozone countries, either reducing debt levels or increasing debt levels at a lower pace, partly induced by the credit crunch in some EMU member states. However, this should not draw attention away from the fact that the debt levels of private households and non-financial corporations still exceed economic output in a number of countries. The deleveraging process will probably drag on for years, particularly when considering the negative effects of such a process on economic activity.
The downward trend in the volume of outstanding credit in the eurozone stems from both supply and demand factors: On one side weak economic growth erodes credit demand, on the other banks are keen to reduce their balance sheets. The latter is illustrated by our indicator 4d which measures the change in total financial sector liabilities over the last five years.
The ranking is almost unchanged compared with the previous year. Germany receives good ratings for each indicator and hence tops the table. Estonia is prevented from ranking higher by its very negative international investment position (due to very high direct foreign investment).
The program countries Greece, Portugal and Ireland are net debtors when looking at foreign indebtedness, but the ongoing private sector debt consolidation is starting to bear fruit. The Finnish financial sector has substantially increased its liabilities over the past five years, weighing on the overall category assessment. 2.5 points behind Ireland and at the bottom of the table stands Cyprus: the financial sector seems to have reduced its liabilities in the medium term but households and non-financial corporations have accumulated new debt and the net international investment position remains in the red.
Categories one and four demonstrate that low public debt levels generally go hand in hand with low private debt levels. In Italy, but also in Slovenia, public debt levels exceed private debt levels, making them the exception to the rule.
35
Economic Research Working Paper / No. 169 / December 10, 2013
xx.10.2010
Debt-to-GDP ratio of households indicator 2013Debt-to-GDP ratio of households, changeover five years in percentage pointsDebt-to-GDP ratio of households, changeover five years in percentage pointsRatingRating
Sources: Eurostat, own estimates.
EMU
0
1
2
3
4
5
6
7
8
9
10
EE IE DE PT ES AT SL IT MT BE LU SK FR FI NL GR CY
EMU
-20
-10
0
10
20
30
40
EE IE DE PT ES AT SL IT MT BE LU SK FR FI NL GR CY
4A 4A
Indicator 4a – Debt-to-GDP ratio of private households, change over five years in percentage
points
Compared with 2008 the private households in the eurozone are deleveraging or building up debt at a lesser pace. 11 out of the 17 EMU member states manage to improve their score. The debt-to-GDP ratio of private households has fallen in six member states – namely EMU heavyweights Germany and Spain, Austria, Estonia, Ireland and Portugal – over the last five years. In nine member states, including France and Italy, debt dynamics have slowed compared with the previous year. Cyprus brings up the rear: Compared with 2008 the debt-to-GDP ratio of private households has increased by more than 30 percentage points. The Dutch and Greek households report debt levels, measured as a percentage of GDP, 20 percentage points higher than five years ago. Cypriot and Dutch households, with debt levels above the 100% mark, are among the most heavily indebted households in the eurozone (alongside Ireland). Comparatively low debt levels, with a ratio below 50%, are found in Estonia, Italy, Slovakia and Slovenia.
Debt-to-GDP ratio non-fin corporations indicator 2013Debt-to-GDP ratio of non-financial corporations,change over five years in percentage pointsDebt-to-GDP ratio of non-financial corporations,change over five years in percentage pointsRatingRating
Sources: Eurostat, own estimates.
EMU
0
1
2
3
4
5
6
7
8
9
10
LU EE ES DE GR SK IT SL FI NL FR AT MT PT BE CY IE
EMU
-60
-40
-20
0
20
40
60
80
LU EE ES DE GR SK IT SL FI NL FR AT MT PT BE CY IE
4B 4B
Indicator 4b – Debt-to-GDP ratio of non-financial corporations, change over five years in
percentage points
Corporate debt ratios in the eurozone are substantial by historical standards. This can be seen, above all, in the long-term comparisons with non-financial business in the US. 13 In 10 of the 15 countries covered, and especially in Luxembourg, Belgium and Ireland, the corporate sector is still over-indebted with a ratio of more than 100% of GDP. German, Greek and Slovakian corporate debt is well below the 100% of GDP benchmark. As with government and private households, this high level of indebtness renders non-financial
13 See ECB, Monthly Bulletin, February 2012.
36
Economic Research Working Paper / No. 169 / December 10, 2013
xx.10.2010
corporations vulnerable to interest rate developments and negative credit risk assessments by market participants.
Encouragingly, indicator 4b shows that deleveraging of non-financial corporations is clearly under way. 14 countries are likely to improve their ratings. Luxembourgian corporate debt-to-GDP ratio is likely to have dropped down by 46 percentage points (although this is partly due to the analysis of changes over a five year period and rising debt levels up until 2009). German, Spanish, Estonian, Slovakian and Greek corporations also decreased their indebtness over the last five years. In Italy, Finland and Slovakia debt levels are around their 2008 value. The debt-to-GDP ratios have risen by more than 20 percentage points in Belgium, Cyprus and Ireland. In Ireland this development is mainly due to big, international corporations with broad access to financial markets, rather than small and medium Irish enterprises. 14
Indicator 4c – Net international investment position, as % of GDP
To measure foreign debt we use the net international investment position, which is defined as the stock of external assets minus the stock of external liabilities. Unlike the current account position, the international investment position is thus a size of stock. Regarding foreign debt, there has been practically no change in the ratings compared with 2013. Austria and Slovakia are likely to achieve a better rating. The tenability of the external position of the most vulnerable countries has not yet been fully restored. Greece, Ireland and Portugal report net foreign liabilities of more than 100% of GDP (in the case of Ireland mainly due to high foreign direct investment), in Cyprus and Spain the ratio is just below that benchmark. The current account surplus in Ireland, Portugal and Spain should lead to a stabilization of the net international investment position.
Financial sector liabilities indicator 2013
RatingRatingTotal financial sector liabilities, averageannual change over the last five years, %Total financial sector liabilities, averageannual change over the last five years, %
Sources: Eurostat, own estimates.
EMU
0
1
2
3
4
5
6
7
8
9
10
BE EE AT SL SK IE DE GR FR ES PT CY IT MT NL LU FI
EMU
-4
-2
0
2
4
6
8
10
12
BE EE AT SL SK IE DE GR FR ES PT CY IT MT NL LU FI
4D 4D
Indicator 4d – Total financial sector liabilities, average annual change over the last five years
in %
The Euro Monitor 2013 contains, for the first time, the indicator 4d, aimed at providing insights into the health of the financial sector. This indicator assesses the average annual growth in total financial sector liabilities over the last five years. A low indicator value corresponds to a strong increase in liabilities. Our indicator 4d shows that the financial institutes in several member states have managed to trim their balance sheets.
Eight EMU member states (Austria, Cyprus, Greece, Ireland, Malta, Portugal, Slovakia and Slovenia) are likely to improve their score. Italy drops one point, Luxembourg loses five 14 See Central Bank of Ireland, Quarterly Bulletin, January 2013.
37
Economic Research Working Paper / No. 169 / December 10, 2013
xx.10.2010
points. The crisis-ridden countries of Cyprus, Greece, Portugal and former program countries Ireland and Spain – who got into a scrape due to their ailing financial sector – all report good ratings for this indicator. In 2009 the financial sector liabilities were increasing on average by more than 9%, a precarious figure. Finland has ranked in last place since 2008. Compared to nominal GDP, total financial sector liabilities are particularly high in Luxembourg, Ireland, the Netherlands and Cyprus.15
APPENDIX
Scaling For each indicator the countries are rated on a scale from 1 to 10: • Ratings from 1 to 4 are considered poor performance • Ratings from 5 to 7 are considered middling performance • Ratings from 8 to 10 are considered good performance
The scales define which value is translated into what rating score. For example on Indicator (1a) a gross government debt ratio which is greater than or equal to 60% but smaller than 70% is rated with 7. So the Netherlands, which reported a gross government debt ratio of 64.8% in 2010, is rated with 7 for that year, while in 2008 it achieved a rating of 8 in line with a debt ratio of 58.5%.
On the following pages the scales for each indicator are listed as well as the Euro Monitor country ratings for 2013 to 2008.
15 In Luxembourg total financial sector liabilities are more than 148 times GDP. However, due to its small size and traditionally strong financial sector, the Grand Duchy can be considered an exceptional case. Ireland, the Netherlands and Cyprus report the second, third and fourth highest financial sector liabilities compared to GDP (21.9-fold, 13.3-fold and 9.6-fold, respectively). The EMU average is 6.2-fold of GDP.
38
Economic Research Working Paper / No. 169 / December 10, 2013
xx.10.2010
39
Economic Research Working Paper / No. 169 / December 10, 2013
xx.10.2010
40
Economic Research Working Paper / No. 169 / December 10, 2013
xx.10.2010
41
Economic Research Working Paper / No. 169 / December 10, 2013
xx.10.2010
42
Economic Research Working Paper / No. 169 / December 10, 2013
xx.10.2010
43
Economic Research Working Paper / No. 169 / December 10, 2013
xx.10.2010
44
Economic Research Working Paper / No. 169 / December 10, 2013
xx.10.2010
45
Economic Research Working Paper / No. 169 / December 10, 2013
xx.10.2010
46
Economic Research Working Paper / No. 169 / December 10, 2013
xx.10.2010
These assessments are, as always, subject to the disclaimer provided below.
ABOUT ALLIANZ Together with its customers and sales partners, Allianz is one of the strongest financial communities. Around 78 million private and corporate customers rely on Allianz's knowledge, global reach, capital strength and solidity to help them make the most of financial opportunities and to avoid and safeguard themselves against risks. In 2012, around 144,000 employees in over 70 countries achieved total revenue of 106.4 billion euros and an operating profit of 9.3 billion euros (restated on January 1, 2013 due to a change in accounting standard and presentation). Benefits for our customers reached 89.2 billion euros. This business success with insurance, asset management and assistance services is based increasingly on customer demand for crisis-proof financial solutions for an aging society and the challenges of climate change. Transparency and integrity are key components of sustainable corporate governance at Allianz SE.
CAUTIONARY NOTE REGARDING FORWARD-LOOKING STATEMENTS The statements contained herein may include prospects, statements of future expectations and other forward-looking statements that are based on management's current views and assumptions and involve known and unknown risks and uncertainties. Actual results, performance or events may differ materially from those expressed or implied in such forward-looking statements. Such deviations may arise due to, without limitation, (i) changes of the general economic conditions and competitive situation, particularly in the Allianz Group's core business and core markets, (ii) performance of financial markets (particularly market volatility, liquidity and credit events) (iii) frequency and severity of insured loss events, including from natural catastrophes, and the development of loss expenses, (iv) mortality and morbidity levels and trends, (v) persistency levels, (vi) particularly in the banking business, the extent of credit defaults, (vii) interest rate levels, (viii) currency exchange rates including the Euro/U.S. Dollar exchange rate, (ix) changes in laws and regulations, including tax regulations, (x) the impact of acquisitions, including related integration issues, and reorganization measures, and (xi) general competitive factors, in each case on a local, regional, national and/or global basis. Many of these factors may be more likely to occur, or more pronounced, as a result of terrorist activities and their consequences.
NO DUTY TO UPDATE The company assumes no obligation to update any information or forward-looking statement contained herein, save for any information required to be disclosed by law.