+ All Categories
Home > Documents > ECONOMIC ROLE OF GOAT PRODUCTION TO SMALLHOLDER ...

ECONOMIC ROLE OF GOAT PRODUCTION TO SMALLHOLDER ...

Date post: 11-Feb-2022
Category:
Upload: others
View: 1 times
Download: 0 times
Share this document with a friend
50
ECONOMIC ROLE OF GOAT PRODUCTION TO SMALLHOLDER LIVELIHOODS IN ZAMBIA'S GWEMBE DISTRICT A Research Report presented to the Department of Agricultural Economic and Extension Education of the University of Zambia. BY MUYATWA LIKANDO III Partial Fulfdlment of the Requirement for the Degree of Bachelor of Ag^ultural Science. © Muyatwa Likando, 2«07
Transcript

ECONOMIC ROLE OF GOAT PRODUCTION TO SMALLHOLDER LIVELIHOODS IN ZAMBIA'S GWEMBE DISTRICT

A Research Report presented to the Department of Agricultural Economic and Extension Education of the University of Zambia.

BY

MUYATWA LIKANDO

III Partial Fulfdlment of the Requirement for the Degree of Bachelor of Ag^ultural Science.

© Muyatwa Likando, 2«07

ACKNOWLEDGEMENTS

I am indebted to Zambia College of Agriculture Management for funding of this research.

My sincere gratitude goes to my supervisor Dr T. H . Kalinda for his untiring guidance

throughout this study. I would also like to thank all members of staff in the Department

of Agricultural Economics and Extension Education of the University of Zambia for their

guidance.

I would like to dedicate this report to my dear wife Mercy Mutumba for her support

throughout my years of being at University of Zambia.

TABLE OF CONTENT

ACKNOWLEDGEMENTS : i TABLE OF CONTENT ii LIST OF TABLES iv LIST OF FIGURES v LIST OF ABBREVIATIONS vi ABSTRACT vii

CHAPTER 1.0 INTRODUCTION 1 1.1 Background 1 1.2 Statement of the Problem 2 1.3 Objectives 3

1.3.1 General Objective 3 1.3.2 Specific Objectives 3

1.4 Hypothesis 3 1.5 Justification of the Problem 3 1.6 The Scope of the Study 4 1.7 Limitations of the Study 5 1.8 Structure of the Report 5

CHAPTER 2.0 LITERATURE REVIEW 7 2.1 Introduction 7 2.2 Goat Production 8 2.3 Marketing 11 2.4 Ownership and Distribution of Small Ruminants 14 2.5 Profitability Analysis 14

CHAPTER 3.0 METHODOLOGY OF THE STUDY 18 3.1 Introduction 18 3.2 Study Site 18 3.3 Sampling Procedure 18 3.4 Methods of Data Collection 19 3.5 Data Analysis 19

CHAPTER 4.0 STUDY FINDINGS AND DISCUSSIONS 20 4.1 Introduction 20 4.2 Demographic Characteristics 20 4.3 Sources of Income 22 4.4 Goat Production 22 4.5 Income Contribution of Goat Enterprise 23 4.6 Other Livestock Enterprises : 27 4.7 Participation of Other Service Providers 27 4.8 Marketing 28 4.9 Constraints faced in Goat Production 29

CHAPTER 5.0 CONCLUSION AND RECOMMENDATIONS 31 5.1 Introduction 31

i i

5.2 Conclusion

5.3 Recommendations

REFERENCES.

APPENDICES.. Appendix 1: Questionnaire

LIST OF TABLES

Table 1: Some Performance Traits of Indigenous Goats 9

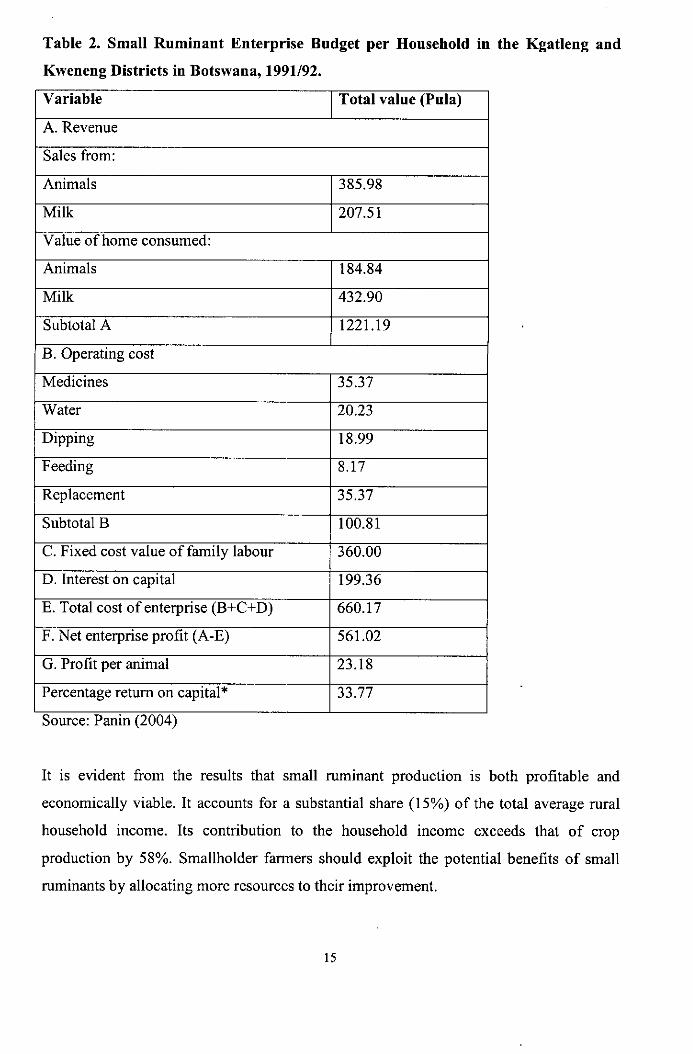
Table 2: Small Ruminant Enterprise Budget per Household 15

Table 3: Demographic Characteristics 21

Table 4: Average Number of Goats per Household 22

Table 5: Number of Goats Kept 23

Table 6: Number of Households who Sold Goats 23

Table 7: Prices per Animal According to each Class Identified 24

Table 8: Contribution of Bil ly Goats towards the Net Margins , 25

Table 9: Contribution of She-Goats towards the Total Net Margins 26

IV

LIST OF FIGURES

Figure 1: Sales and Slaughter of Male Goats in Malawi 13

Figure 2: Time of Sale of Goats 29

V

LIST OF ABBREVIATIONS

C B W M Community Based Wildlife Management

D A P H Department of Animal Production and Health

GTZ German Technical A id to Zambia

M A C O Ministry of Agriculture and Co-operatives

SADC Southern African Development Community

SPSS Statistical Package for Social Sciences

U N Z A University of Zambia

vi

ABSTRACT

Economic Role of Goat Production to Smallholder Livelihoods in Zambia's Gwembe District.

The study was aimed at estabUshing the economic role of goat production to smallholder livelihoods. It was undertaken in Gwembe District in Zambia's Southern Province. A survey was conducted covering 100 households and purposive sampling was employed to select households who were involved in goat production.

The study showed that on average a weaner would contribute about KIO, 193.00, a She-goat K12, 816.00 and a billy K20, 015.00 towards the total net margin of a smallholder livelihood. On the other hand the smallholder livelihoods in the study area kept the following livestock; cattle, local chicken, pigs, pigeons, ducks and fowls and these contributed to their economic well being.

According to the respondents there was a high participation of other service providers in the study area. These service providers were; the Government, World Vision and German Technical aid to Zambia. The type of assistance given by these organizations differed e.g. assistance given by the Ministry of Agriculture and Co-operative staff was purely extension services while that given by World Vision and German Technical aid to Zambia was inform of inputs such as breeding stock and drugs. As for the marketing system, individuals and private organizations were the only institutions involved in buying of goats from the small-scale farmers, there was no government interventions. It was also noted that farmers mostly sale their goats in the dry season due to hunger at that time of the year.

It was recommended that Producers and Middlemen form Associations and contribute to a revolving fund, to improve the marketing facilities, other than waiting for fiinds from the govenunent. The government should create legal institutions to foster the development of goat industry in the country e.g. through the Ministry of Agriculture and Co-operatives.

Muyatwa Likando University of Zambia, 2006

Supervisor: Dr. T. H. Kalinda

vii

CHAPTER 1.0 INTRODUCTION

1.1 Background

The livestock sub-sector contributes significantly to the agricultural industry in Zambia.

It provides outputs such as; meat, milk eggs, hides, skins, manure and draught power.

The livestock sector also generates employment opportunities and income among the

rural people. Since the early 1990's the government has liberalized the agricultural

markets and emphasized the need for the private sector to take a lead in the agricultural

sector development. However, it is recognized that it will take time for market to be fully

liberalized and to function efficiently.

At the begirming of the new millennium, rural livelihoods in many parts of Southern

province are under considerable stress. The economy and the political environment is

experiencing a period of significant transformation and poverty remains endemic. In

many parts of the province a substantial proportion of the rural population lives below the

poverty line and life expectancy is often, at best, static. This has been due to the wiping

out of most cattle (by corridor disease), which used to serve as a common source of farm

livelihood by the small scale farmers. In view of the above, small raminants are

encouraged, with emphasis on Goat production due to there hardness.

Goats have contributed to the quality of life for humankind for milleimia. For them to

provide lasting benefits to farmers in developing countries, in small scale approach,

specific approaches must take into account the type of enterprise combination, ecosystem

and production system. They must also factor in social, environment, and other

considerations.

Goats are exhibiting a very high productivity potential which i f well promoted can easily

help to improve the rural economy within a very short time. According to Central

Statistical Office Report for agricultural season (2004) the goat population increased by

71% between 1998 and 2003 to a staggering figure of 1,206,642 from 861,775.With

regards to this report the distribution of goat population in Zambia is 32% Southern

Province, 24% Eastern Province, 17% Northern Province and other Provinces shared

1

27% (that included Lusaka, Copperbeh, Central, Luapula, North-Western and Western

Provinces).

It was from this background that smallholder livelihoods realized the contribution of goat

production to improving their economic status. However, despite the recognized

contributions of goats to smallholder livelihoods, such roles and contributions had not

fully been studied and quantified. Therefore, this study intended to explore the extend to

which goat production contributes to improved standard of living for the rural

community, focusing on livelihoods analysis at the household level and the significance

of the supporting infrastructure e.g. communication and markets.

L2 Statement of the Problem

In recent years, it has been observed that Goat production is becoming increasingly

important among smallholder livelihoods, due to their high productivity potential.

However, despite the recognized contributions of goats to smallholder livelihoods, such

roles and contributions have not fully been studied and quantified. There have been few

studies on goat production and most of them concentrated on production and marketing

part. Chitambo (1995), in his research with the aim of establishing the marketing chain

for goats from the Zambezi valley concluded that, the marketing costs were high because

of the dispersed nature of the producers. He did not look at how much do goat enterprises

contribute to the economic wellbeing of the smallholder livelihoods.

Therefore, despite the increase in numbers of goats, little is known about their economic

contribution to the standard of living of smallholder livelihoods in the rural areas. There,

seem to be lack of knowledge on how much goats contribute to economic wellbeing of

smallholder livelihoods. The purpose of this research was therefore, to assess the

contribution of goat production to economic status of smallholder livelihoods in Gwembe

district.

2

1.3 Objectives

1.3.1 General Objective

The main objective of the study was:

To investigate the extent to which goats contribute to the economic wellbeing of

smallholder livelihoods.

1.3.2 Specific Objectives

The specific objectives of this study were;

1. To determine the average income levels contributed by goat enterprise to individual

smallholder livelihoods.

2. To determine other livestock enterprises that contributes to the economic wellbeing of

smallholder livelihoods other than goat production.

3. To establish the level of participation of other service providers in goat production

1.4 Hypothesis

1. The level of net income per animal influences the choice of enterprise.

2. The higher the number of other species of livestock enterprises, the lower the number

of goats being kept by smallholder livelihoods

3. The higher the level of participation by other service providers in goat production, the

higher the involvement by the smallholder livelihoods.

1.5 Justification of the Problem

Within the past few years, it has been observed that a number of cattle heads have been

lost in Southern Province as well as other parts of the country due to cattle diseases. This

has seen a reduction in income for the rural communities resulting in an increase in

poverty levels. This research was necessitated by a number of reasons.

One of these reasons is the increased assumption that under livestock sector cattle cannot

be replaced by small ruminants where they are endangered by diseases and this has

3

resulted in reduced cash inflows among rural dwellers. Goats do exhibit high productivity

potential which i f well promoted can easily help to improve the rural economy within a

short time. Therefore, there is need to encourage the smallholder livelihoods to rear goats.

The knowledge of the economic system in which goats interact with other farm

enterprises may not be known to shape the future of the enterprise combinations. Also the

following question may be answered by this research; to what extend do the smallholder

livelihoods depend on goat production to improve their standard of living?

Usually it may prove difficult for the Government to offer community services e.g. dip-

tanks for the animals (i.e. goats), i f their contribution to economic wellbeing of the

smallholder livelihoods is not known, therefore, the combination of the reasons above

necessitated the carrying out of this research.

After investigations, the results of this research will be useful to many stakeholders both

within the district and outside the district. The research findings and recommendation

may also be of great use to Non-governmental organizations which are involved in

helping or funding a number of communities involved in goat production e.g. World

Vision and Heifer International

It will also be useful to the Government when considering the services and projects which

it should undertake to improve the livelihood of the communities in the district in relation

to goat production. With this in mind, the relevance and seriousness of the problem can

not be overemphasized in that it affect a wide range of stakeholders and solutions to the

problem wil l help to improve the standard of hving among the rural dwellers and reduce

dependence on cattle.

1.6 The Scope ofthe Study

This study was limited to Gwembe district in Southern Province. It did not encompass all

stakeholders in the district but its main group of interest was the smallholder livelihood

that keeps goats as one of their enterprises. The study also did not involve all the three

4

camps found in the district but just concentrated in Gwembe Central Agricultural Camp

involving 11 villages.

In terms of the depth of the study it just looked at the economic contribution of goats to

smallholder livelihoods that is the distribution, profitability of the enterprise, marketing

and some of the problems faced by the small scale farmers.

1.7 Limitations ofthe Study

During the survey the Researcher encountered the following limitations as he was

carrying out this study;

The Researcher found some problems in moving from one village to the other to

interview the sampled farmers because of the nature of topography in Gwembe. The

topography in the district is characterized by steep hills and very rocky, making it

difficult for any form of transport to maneuver around.

As indicated in the scope of the study, this research did not encompass the commercial

farmers and the whole district, therefore, generalization is biased towards the small-scale

farmers within Gwembe Central Agricultural Camp. The time frame of one month is not

enough for a comprehensive research like this one, in terms of data collection looking at

the sample size of 100, which the school sees as ideal.

1.8 Structure ofthe Report

This report is divided into 5 chapters. Chapter 1 begins by looking at the background of

goats' production, importance goats in the economy, distribution of goat production in

the country. It continues to discuss the statement of the problem that is what necessitated

this research to be carried out, it also looks at objectives that is the general and specific

objectives, rationale which explains how important the area of study is, scope ofthe study

which looks at the extent to which the study covers and ends with the limitations

encoimtered in carrying out this research. Chapter 2 consists of the literature review; this

chapter discusses other research findings concerning the same topic of study. Chapter 3

5

focuses on the methodology that was used in the study. This chapter starts with the

introduction, then it looks at the study site that is, it discusses the area where the study

was undertaken this is followed data collection methods to be employed during the study

this chapter ends with data analysis. Chapter 4 looks at the inside of the findings. In this

chapter the results of the findings are discussed and analyzed at length it starts with the

introduction then demographic characteristics where the research looks at the

composition of the sample in term of age, sex, marital status, and sources of income, it

also looks at goat production, income contrition of goats as well as marketing. Chapter 5

presents the conclusions and recommendations. The conclusion is discussed with

reference to the objectives of the research while the recommendations are discussed to

reveal strategies to be undertaken by the stakeholders to improve the goat performance in

the study area.

6

CHAPTER 2.0 LITERATURE REVIEW

2.1 Introduction

Reference has been made to previous research findings done by different Governments,

Non Governmental Organizations and individuals to assess the contribution of goat

production to the economic well being of smallholder livelihoods in different parts of the

World. This chapter reviews goat production, marketing, ownership and distribution of

small ruminants and profitability of goats.

According to the National Dairy Database (1992), the goat is one of the smallest

domesticated ruminants that have served mankind earlier and longer than cattle and

sheep. It is managed for the production of milk, meat and wool, particularly in arid, semi-

tropical or mountainous countries. In temperate zones, goats are kept often rather as

supplementary animals by small holders, while commercially cows or buffaloes are kept

for milk, cheese and meat, and sheep for wool and meat production. Nonetheless, there

are more than 460 million goats worldwide presently producing more than 4.5 miUion

tons of milk and 1.2 million tons of meat besides mohair, cashmere, leather and dung;

and more people consume milk and milk products fi-om goats worldwide than from any

other animal. Cheese production, e.g., from goat milk even in France, Greece, Norway

and Italy is of economic importance. Goatherds, on the other hand low producing though,

are an expression of capital assets and wealth in Africa and Asia where they are found in

large numbers.

According to Linda (2004), Goats can survive on bushes, trees, desert scrub and aromatic

herbs when sheep and cattle would starve to death. Goat herders often have neglected a

rational numerical balance between goat numbers and sparse vegetatioii. Over-grazing

has destroyed many tree and woodland areas, which was blamed then on goats rather than

man, and this has caused widespread ecological and political concerns, erosion,

desertification and even ban on fi-eely grazing goats in some area. On the other hand,

goats are valued by cattle and sheep men in the fight against brush encroachment on

millions of acres of open rangeland. Reference has been made to previous research

7

findings done by different Governments and Non Governmental Organizations to assess

the contribution of livestock/goat production to the economic well being of the

smallholder livelihoods (http//attar.neat.org/attar-pub/PDF/meatgoat.pdf).

2.2 Goat Production

According to Tchad (1989), the shift in ownership pattern of sheep to goat is the gradual

change in emphasis firom sheep to goats as the macro-management system moves fi"om

nomadic to sedentary and from pastoral to agricultural among the nomads of Kenya. This

is reflected not so much in the size of flocks as in the numbers of owners who either have

preferences for goats over sheep or who, for other reasons, are forced to keep goats.

Goats are, of course, generally more prolific than sheep and are probably less trouble to

manage for the agriculturalists and agro-pastoralists who are recent entrants into animal

husbandry. This shows the increasing economic importance of goat production among the

nomads of Kenya

In Zambia Goats which are important in the marginal areas are widely distributed

throughout the country, but over 60% are in river valley areas and setni-arid regions

(Eroarome, 2006). These areas are characterized by poor crop production, and cattle do

not thrive because of trypanosomiasis and feed scarcity (Department of Animal

Production and Health, 1993). Goats' adaptability, prolificacy and modest nutrient

requirements make them well adapted to poor marginal lands (Ahmadu et.al, 2000). Most

smallholders keep local breeds. There is also the Boer goat. Aside from the seasonal

demand, i.e. religious rites and parties, goat meat is gaining general acceptance as a

regular item in many homes and restaurants. While goats represent a critical resource for

the provision of income and nutrition to the smallholders, they have not been fully

appreciated by policy makers, non-governmental organizations and other development

agents. Only limited research has been conducted on indigenous goats; their genetic

potential has not been well documented and appreciated (Mwenya, 2001).

Zambian goats are believed to originate from the present day Zimbabwe (the Matebele

and Shona kingdoms). The numbers in the national flock are not well known. There are

many indigenous types (Mwenya, 2001), which are further described by the locality

within which they are found. In the Southern half of the coimtry three different types

have been identified (Chisanga and Mwenya, 1998):

(i) The South East African Dwarf Goat, or Gwembe Valley goat

(ii) In most of the southern half of the country and the northern parts of the

Zambezi escarpment and Luangwa valley, a larger breed is found generally

referred to as the Valley goat.

(iii) On the plateau areas there is an intermediate type referred to as the plateau

goat which appears to be widely distributed in the country. Colours vary from

black, brovm and roan with or without white markings. The goats are short

with fine and glossy coats.

Tablel presents data on the performance of some indigenous goats. There is a strong

feeling now that goat rearing should be promoted as part of the poverty alleviation.

However, development efforts need to be backed by frill characterization and evaluation

of indigenous goats (Mwenya, 2001).

Tablel: Some Performance Traits of Indigenous Goats

Parameters Gwembe Goats Valley Goats Plateau Goats

Mature body weight, kg

-Male 30-36 48-50 34-36

-Female 18-25 32-46 25-30

Age at first kidding (months) 15-18 20-22 18-20

Fertility rate, percentage 88.8 86.4 87.5

Kidding rate, percentage 110 98.8 105

Prolificacy 1.4 1.1 1.2

Kid birth weight, kg 1.5 1.8 1.6

Weaning rate 55 50 52

Pre-weaning mortality,

percentage

48 50 42

Dressing percentage at 12

months

42.8 42.3 40.2

Source: Chisanga and Mwenya (2001)

9

According to the study undertaken in Malawi it revealed that the Malawi goats in the

villages were more prolific, but have a high mortality rate in rearing stages of males

(42%) and that 27% of the suckling stock risk dying before 12 months of age

(Banda et.al. 1998). The off take rate was 21% with a risk of 19%. It increased from

young to old stock, and was highest in rearing and breeding stock. These observations are

very high and pose a problem in sustaining flock numbers and making the enterprise

competitive in the crop-livestock farming systems. It was suggested that in order to

sustain goat numbers and make goat production profitable and sustainable, mortality,

especially of rearing stock and offtake of females be reduced. In addition, improvements

in management should be made to avoid the factors, which cause mortality and reduced

survival ofthe goats.

For the marketing system to be sustainable and benefit all the producers, middlemen and

consumers, the producer has to make goats available that are in good condition and age as

well as weight. This calls for improved productivity at the farm level by increasing the

reproduction/breeding and nutrition, management and disease control. This will

automatically reduce meat prices. Middlemen and sellers themselves must endeavor to

maintain high handling and hygienic standards, i f consumers were to be satisfied. The

sellers and/or middlemen could form groups and contribute to a revolving fund from

sales to improve the marketing facilities, other than waiting for funds from the

government (Banda, et. al, 1998)

According to World Bank (1995), the small land holdings make it difficult for the

households to produce enough food for the family members to last the whole year.

Consequently, there are regularly recurring periods every year when the staple food

(maize) runs out from September. This period coincides with the time of greatest

workloads in crop fields. During such times, selling of goats to earn cash to purchase

food is one of the major strategies farmers take to make their households survive. Due to

these sales, the contribution to the socio-economic and cultural objectives of the rural

community is quite large.

10

In Luangwa, according to Wildlife Conservation report (2004), specific areas where there

is minimal risk of geographic overlap between goats and wildlife. Community Based

Wildlife Management (CBWM) is seeking to improve goats to promote alternative meat

soiu"ces to wildlife as well as alternative income sources to poaching. The areas are;

Plateau region of the Luangwa Valley watershed east of Lukusuza National Park and

selected areas along the lower stretch of Luangwa river near the confluence with Zambezi

river. This illustrates how important goat production to the livelihood of small-scale

farmers is.

2.3 Marketing

The economic concept of "elasticity" relates to supply as well as demand; it measures the

sensitivity between changes in production and prices received by producers. We can say

that the supply of meat goats seems rather elastic, meaning that sustained improvements

in prices offered would likely result in substantial increases, over time, in the production

(supply) of goats. However, many producers and prospective producers of goats face

resource limitations-financial, technical knowledge, time or suitable land area. Such

limitations may delay response time for increasing goat numbers even when favorable

prices are encountered for an appreciable time (http://vyww.sheepgoatmarketing.infro/).

According to the National Dairy Database (1992), supply response in United States Of

America is sometimes triggered by changes in federal farm policy programs. The serial

demise ofthe Wool and Mohair Act, aimounced in mid-October, 1993 encouraged, in the

short-run, a sell-off of Angora goats; price dropped precipitously. While some Angora

owners shifted to meat goat production, others stayed with mohair production (prices

have since recovered-for stock and for mohair). Angora goats have long suffered price

discrimination as meat animals, but, with better conditioning and certain developments in

market acceptability, this could change sharply.

The major demand for goat meat in New York City and in the region comes primarily

from myriad ethnic groups; the predominantly white middle-class of English origin

consumes little goat meat while Muslims are the leading purchasers, taking over 60% of

11

the total (up from 50% or less in 1991). The demand for goat meat in New York City

seems relatively inelastic; however, recent economic downturns have encouraged some

shifting back and forth from goat to lamb to sheep meat to cheaper, imported goat meat.

Further increases in demand for goat meat wil l come with increases in ethnic population

numbers and improvements in their disposable income, assuming the younger

generations remain reasonably loyal to traditions (Tomlinson, 1999).

Recently emerging demand for goat meat is apparent in the health food sector and in the

yuppie community for a novel gourmet item; restaurants are beginning to reflect these

new interests. The vast majority of goat meat is consumed throughout the year; however,

demand (and prices) rises appreciably, but temporarily, at Easter and Ramadan; other

holidays have only negligible influence on seasonal demand.

According to Tomlinson (1999), supply of goats to New York City originates primarily

in Texas, Tennessee, Missouri, Ohio, and upper Midwest; New York and Pennsylvania

are not presently producing an appreciable flow of goats for slaughter. Although New

York City does not import goat meat directly from Australia or New Zealand, it does sell

carcasses entering through the Port of Philadelphia; such meat is appreciably cheaper

than that from packers in New Jersey, Coimecticut, and New York.

It does not seem possible at this time for New York goat producers to profitably compete

with Texas and other domestic and imported goats of average, or less, quality; however,

production of higher quality, heavier goats for specialty markets seems to warrant

particular attention in addition to "Easter kids" of desirable weight and quality. New York

goat producers may be positioned favorably to produce both light weight kids and heavier

weight animals of high quality for the Easter(s) and Ramadan holidays and for the

restaurant trade in eastern Canada (http://www.sheepgoatmarketing.infro/)

12

Figure 1: Sales and Slaughter of Male Goats in Malawi

% sales and slaughters of rearing males in Central Malawi

35.0 T

30.0 ••

25.0 -•

I 20.0 • • S u 15.0 ••

• %SlauRM

n%SalesRM @%GiftsOutRM

10.0 •• n 5.0 - n

3. 0.0 Mar- Apr- May- Jun- Jul-97 Aug- Sep- Oct- Nov- Dec- Jan- Feb-97 97 97 97 97 97 97 97 97 98 98

Source: Banda (1999)

According to Kusina et. al, (2000), in Zimbabwe, of the goats sold at all farms, 47% of

the goats were sold directly at the market or to other farmers by the producers themselves

while 53% were sold by the middlemen who purchased the goats from the farmers. The

prices of goats sold by the producers and those purchased and sold by the middlemen

were recorded. According to Central Statistics Office Report (2003), Goats are exhibiting

a very high productivity potential which i f well promoted can easily help to improve the

rural economy within a very short time. Apparently, close to 93% of the goats which

were monitored using ten traders at the Lusaka's small livestock market then, had came

from Southern Province, the goats in Eastern and Central provinces came to the urban

market in small numbers.

Although 93% of the goats monitored came from Southern Province their Contribution to

the economic status ofthe smallholder livelihoods in the province is not known.

Central Statistics Office (2003): Livestock marketing system (including goats) are

generally operated by the private sector and individuals agents in rather lengthy

marketing chains. The value of an animal increases in scale as it progress down the

marketing chain. The smallholder livelihood often receives a low percent of the final

selling price of their animal.

13

Small ruminants producers in the Southern Province receive as low as 38% ofthe final

selling price on the urban market. But this does not show the contribution of goat

production to the economic well being of the smallholder livelihoods.

2.4 Ownership and Distribution of Small Ruminants

According to Panin (2004), the study, which was conducted in Botswana, reviewed that

the ownership of the small ruminants among the small livelihoods, goats were more

widely owned than sheep. About 90% of the sample households possessed at least a unit

of goat as compared with only 27% of the same sample households who owned sheep.

Also, the percentage of households owning any one of the two species of animal was the

same (90%) as goat owning households. Mixed flock of sheep and goats enterprise was

found to be practiced by only 27% of the households in the area. The average number of

goats owned across all households was 19. This varied greatly between the households as

was reflected in the standard deviation (SD = 18.1).

2.5 Profitability Analysis

On average, the small ruminant production enterprise earned a household a total net profit

of P 561.00. On a per animal basis, an appropriate measure for the profitability, the return

per animal was P 23.00 (Panin and Mahapibe, 1994). This suggested that a small

ruminant production enterprise was profitable. However, profit per se may not be the best

measure of how efficiently the factors of production have been utilized. He concluded

that the best measure of efficiency is that which recognizes the returns per unit of input

and capital was identified as one of the constraints to increased agricultural production in

the area (Panin and Mahabile, 1994), the return per Pula of capital tied up in the small

ruminant enterprise was calculated. They did that to help in assessing whether it was

worth investing in such enterprise as capital has an opportunity cost. Capital here was

referred to as the value of the total average number of sheep and goats owned by a

household. Their analysis showed that the return to capital was considerably high, about

34%, exceeding the interest rate by almost 65%.

14

Table 2. Small Ruminant Enterprise Budget per Household in the Kgatleng and

Kweneng Districts in Botswana, 1991/92.

Variable Total value (Pula)

A . Revenue

Sales from:

Animals 385.98

Milk 207.51

Value of home consumed:

Animals 184.84

Milk 432.90

Subtotal A 1221.19

B. Operating cost

Medicines 35.37

Water 20.23

Dipping 18.99

Feeding 8.17

Replacement 35.37

Subtotal B 100.81

C. Fixed cost value of family labour 360.00

D. Interest on capital 199.36

E. Total cost of enterprise (B+C+D) 660.17

F. Net enterprise profit (A-E) 561.02

G. Profit per animal 23.18

Percentage return on capital* 33.77

Source: Panin (2004)

It is evident from the results that small ruminant production is both profitable and

economically viable. It accounts for a substantial share (15%) of the total average rural

household income. Its contribution to the household income exceeds that of crop

production by 58%. Smallholder farmers should exploit the potential benefits of small

ruminants by allocating more resources to their improvement.

15

A study of the flock dynamics marketing, and socio-economic roles of small ruminants in

crop - livestock farming system in Malawi was conducted in 2002 by Bunda College of

Agriculture, the study revealed that the Malawi goats are more prolific, but have a high

mortality rate in rearing stages risking dying before 12 months of age. These observations

are very high and pose a problem in sustaining flock numbers and making the enterprise

competitive in the crop-livestock farming systems. It was suggested that in order to

sustain goat numbers and make goat production profitable and sustainable, mortality,

should be reduced. In addition, improvements in management should be made to avoid

the factors, which cause mortality and reduced survival of the goats. The same study

revealed that, for the marketing system to be sustainable and benefit all the producers,

middlemen and consumers, the producer has to make goats available that are in good

condition and age as well as weight. This calls for improved productivity at the farm level

by increasing the reproductionA)reeding and nutrition, management and disease control.

This will automatically reduce meat prices. Middlemen and sellers themselves must

endeavor to maintain high handling and hygienic standards, i f consumers are to be

satisfied.

Chitambo (1995), in his research with the aim of establishing the marketing chain for

goats from the Zambezi valley concluded that, the marketing costs were high because of

the dispersed nature of the producers. He did not look at how much do goat enterprises

contribute to the economic well being of the smallholder livelihoods.

Ndambo (1999), in his research on the contribution of goats to smallholder livelihoods

observed that goat production is an important enterprise for the rural community because

it helps in solving social economic problems.

According to Mac Crown (2001), in his study he found that livestock production is

essential where cash inflow is required regularly as opposed to cropping and that

livestock can readily be sold to solve an emergent needs at household level, especially

where crop failure was recorded.

16

Botswana's livestock population is estimated at 2.6 million cattle, 2.093 million goats

and 30,100 sheep. Out of the 2.093 million goats 314000 are under commercial sector

and 1,779,000 are under smallholder livelihoods. The main products are skin, milk and

meat. In that country goats contribute about 33.6% to the livelihood of the smallholder

livelihoods. This shows how much goats can contribute to the smallholder livelihoods

(http://www.fao.org/sd/dim pe4/ pe4 040902al en.htm).

17

CHAPTER 3.0 METHODOLOGY OF THE STUDY

3.1 Introduction

This chapter presents the methodology used in the study. The methodology reveals the

study site and its location, why it was chosen, it also looks at the sampling procedures

which embraces research design used as well as the description of the sample. This

chapter also includes methods of data collection; it also gives reasons why the identified

methods were used. Finally, the chapter is concluded by looking at data analysis.

3.2 Study Site

The study was conducted in Gwembe District, Southern Province. It's about 216 km from

Lusaka. According to agricultural demarcation the District falls in region 1 meaning it

receives on average less than 1000mm of annual rainfall and the main activity in the

District is small scale agriculture, crops grown include maize, cotton and sorghum while

animals being kept are goats, cattle, local chickens guinea fowl, pigs and pigeons.

Gwembe District was chosen because of its goat populations. The District is one of the

few districts in Zambia with high goat populations due to its climatic conditions that tend

to favor goat production. In the research, the population of interest constituted of

smallholder livelihoods Gwembe Central Agricultural Camp and 11 villages were

involved. The study area extended to about 24 km from Gwembe town.

3.3 Sampling Procedure

The research design, which was employed, was a non- experimental design. This was for

the simple reason that the research was done in the natural and uncontrolled setting. The

Research-sampling design that was used to select the sample was non-probability

purposive sampling. Purposive sampling was used because the researcher subjectively

wanted a sample which was representative of the population i.e. persons who keep goats.

The sample size was 100 farmers who keep goats in their agricultural activities, while the

sampling unit was individual households. This sample size was adequate and reliable,

valid generalizations were made. It also permitted detailed and intensive study of the

18

sample. Purposive sampling was considered a viable alternative because it was cheaper in

terms of reducing time, finances, it has higher degree of representative and the method

was easy and convenient to use.

3.4 Methods of Data Collection

Data for this study was collected using both primary and secondary sources. Primary data

was collected from sampled smallholder livelihoods from the study site using a

questionnaire, and through interviews with key informants for qualitative data. The

questiormaire constituted of closed ended questions, because of the desire for quantitative

data, which was easily analyzed statistically using Statistical Package for Social Sciences

(SPSS) package. The questionnaire was used because it tended to be impersonal,

relatively cheaper, it saved on time. The respondents had also enough time to answer the

questions properly. When collecting data the Researcher worked with the Agricultural

Camp officer and a Veterinary Assistance Officer.

3.5 Data Analysis

By virtue of the data being quantitative, the statistical analysis was done using computer

software package referred to as SPSS.

19

CHAPTER 4.0 STUDY FINDINGS AND DISCUSSIONS

4.1 Introduction

This chapter looks at the findings of the study which includes the demographic

characteristic of the study sample, income generating activities, other livestock

enterprises other than goats, goat production. Profitability of goat production. Service

providers involved in goat production and Marketing of goats. The demographic

characteristics ofthe sampled households discuss the sex composition of the sample, age

groups, sources of income, marital status as well as the educational level of the

respondent. Goat production looks at the performance of goats in terms of acceptability in

the study area by the local community. The section for Profitability of goat production

analyses the contribution of a goat as a unit towards the Smallholder livelihoods. Under

other Service Providers, the study discusses their role in goat production. Finally the

study looks at the marketing of goats by these Smallholder livelihoods in the study area.

4.2 Demographic Characteristics

The table 3 below shows the demographic characteristics for the respondents in the

sampled population. In this study II villages were captured and they were as follows;

Coolwe, Hangwanama, Hankomona, Handyabanta, Hauma, Jululumba, Kaona,

Luumuno, Moonde, Musisa, and Nabuyuni. The highest number of respondents was

recorded from Kooma, which was 15% of the total respondents, and the lowest number

was recorded fi-om Moonde and Jululumba with 6% each.

20

Table 3: Demographic Characteristics Village Number of Households Percent Coolwe 7 7.0 Hagwanama 7 7.0 Hankomona 9 5.0 Handyabanta 10 10.0 Hauma 14 14.0 Jululumba 6 6.0 Kooma 15 15.0 Luumuno 7 7.0 Moonde 6 6.0 Musisa 8 8.0 Nabuyuni 11 11.0 Total 100 100.0 Sex of respondent Male 70 70.0 Female 30 30.0 Total 100 100.0 Marital status Single 7 7.0 Married 78 78.0 Divorced 3 3.0 Widowed 12 12.0 Total 100 100.0 Age group 16-25 years 4 4.0 26 -35 years 22 22.0 36-45 years 31 31.0 46 -55 years 27 27.0 56 and above 16 16.0 Total 100 100.0 Level of education attained Primary 54 54.0 Secondary 32 32.0 Tertiary 4 4.0 None 10 10.0 Total 100 100.0 Source: Own survey data

From the total number of 100 respondents 70% of the respondents were male-headed

households while 30% were female-headed households. When it comes to marital status,

the majority of the interviewed farmers were married that is 78%, while 12% were

widowed, 7% were single and 3% were divorcees.

21

With regards to age of the respondents most of the people who were involved in goat

production within the study area were in the range of 36 - 45 years old with a percentage

of 31%, and 4% for 16 - 25 years old, 22% for 26 - 35years, 27% for 46 - 55years and

finally 55years and above were 16%.

With reference to level of education attained, the study revealed that 54% of the

interviewed farmers had primary level education, 32% had reached secondary level only

4% went up to tertiary where the acquired different skills.

4.3 Sources of Income

According to the surveyed households the people of the area are engaged in a number of

activities to be able to raise some income to meet their day-to-day demands. These

activities include; growing of crops 99.8% ofthe respondents, charcoal selling 2% of the

sampled population, trading i.e. selling of groceries and salaula 4% of the sampled

population and involvement in other livestock rearing other than goats 96%.

4.4 Goat Production

According to the survey as indicated in table 4 below the minimum number of goats

owned by a household was 2 goats while the maximum number owned was 46 goats. The

mean average gave 12.66 as indicated below. This varied greatly between the households

as is reflected in the standard deviation of 7.420

Table 4: Average Number of Goats per Household N Minimum Maximum Mean Std. Deviation

The average number ol goats per individual.

100 2 46 12.66 7.420

Source: Own survey data.

Note: N = Total number of households sampled.

With regards to the number goats, which individuals had according to the survey, it was

discovered that those who were in the range of less than 5 goats were 46%, between

22

6 - 1 0 goats were 40%, between 11 - ISgoats were 11%, and 16 goats and above were

3%. This is shown in the table below.

Table 5: Number of Goats kept Number of Households Percent

Less than 5 46 46.0 6-10 goats 40 40.0 11-15 goats 11 11.0 16-20 goats 3 3.0 Total 100 100.0 Source: Own survey data

4.5 Income Contribution of Goat Enterprise

Among the sampled population of goat keepers only 76% were able to sale goats during

2006 season. While the remaining 24% did not sale during the said season. Through the

investigations carried out during the survey, it was discovered that those who did not sale

were starters i.e. they had just started keeping goats therefore they could not sale (see

table6 below).

Table 6: Number of Households who sold Goats Number of Household Percent

Sold 76 76.0 Not sold 24 24.0 Total 100 100.0 Source: Own Survey data.

With regards to this survey, to determine the profitability of the goat enterprise, the

margins per animal was used to see how much a goat contributes towards the income of a

farmer. The selling prices were divided into three categories as indicated in table 7 below.

These categories included Weaners, Billies and She-goats. The average prices for each

category were as follows:

• Weaners KIO, 193.00 per weaner.

• She-goats K21, 516.00 per animal.

• Billies K28, 715.00 per animal.

23

The standard deviations from the means of the identified groups varied greatly and this

was attributed to the result of free market system, where the price is dictated by the

bargaining ability of the farmer or the buyer.

Table 7: Prices per Animal according to each Class Identified N Minimum Maximum Mean Std. Deviation

Price of weaners 100 6000 14500 10193.00 1992.119 Price of she goats 100 15000 45000 21516.00 5042.841 Price of bilUes 100 18000 36000 28715.00 5394.655 Source: Own survey data.

N = Number of household.

As for costs only four inputs were identified that is dip, dewormer, drugs and the

opportunity cost for family labour, since only family labour was used by all the

respondents at the time of the survey. The opportunity cost of family labour was taken to

be K4, 700.00 as given by the respondents. The actual costs for the other inputs were as

follows;

• Dip cost per animal was K l , 000.00

• Dewormer cost per animal K l , 500.00

• Drugs per animal K l , 500.00

24

Table 8: Contribution of Billy towards the Total Net Margin

ITEM UNIT PRICE TOTAL

Revenue K N K N

Sale of Bil ly 28,715.00

Total Revenue 28,715.00

Variable Costs

Dip 1,000.00

Dewormer 1,500.00

Drug 1, 500.00

Total Variable Costs 4, 000.00

Gross Margin 24,715.00

Fixed Costs

Labour 4, 700.00

Total Fixed Costs 4, 700.00

Net Margin 20, 015.00

Source; Own survey data.

25

Table 9:Contributioii of She-Goats Towards the Total Net Margin

ITEM UNIT PRICE TOTAL

Revenue K N K N

Sale of She - goat 21,516.00

Total Revenue 21, 516.00

Variable Costs

Dip 1, 000.00

Dewormer 1, 500.00

Drugs 1,500.00

Total Variable Costs 4, 000.00

Gross Margin 17, 516.00

Fixed Costs

Labour 4, 700.00

Total Fixed Costs 4, 700.00

Net Margin 12, 816.00

Source; Own survey data.

The weaners were assumed that at the time of selling it was before these identified costs

are incurred on them. Therefore, the price identified was KIO, 193.00.

After the analysis, it was realized that the following were the average net margin

contributions of each category towards the total net margin for Smallholder Livelihood;

• Weaner KIO, 193.00

• She-goats K12,816.00

• Bil ly K20,015.00

However, during the survey it was revealed that, the income generated fi-om the goat

enterprise was not enough to meet their requirements, looking at the average number of

goats being kept per individual of 12.66 goats. Therefore, other options were Crops 93%,

livestock 11%, charcoal 2% and trading 5%.

26

4.6 Other Livestock Enterprises

According to the assessment on whether the sampled Smallholder Livelihoods also keep

other Livestock it was found that 99% keep other types of livestock other than goats and

only 1% out of 100 farmers sampled acknowledged keeping goats only.

The surveyed households revealed that the common livestock being kept were as follows

(given in percentages); chickens 97%, cattle 59%, pigs 48%, pigeons 17%, ducks 10%,

fowls 9% and turkeys 6%.

When the number of goats being kept was related to keeping of other livestock it was

found that 96% did not agree that the size of their goat herd dependent on other livestock

being kept. While 3% agreed that the size of their goat herd was dependent on other

livestock being kept and reason being the scarcity of resources to be shared.

4.7 Participation of Other Service Providers.

From the study it was indicated that there was flill participation of other service providers

in the study area. These organizations were Extension Services offered by the Ministry of

Agriculture and Co-operatives (MACO), World Vision and German Technical aid to

Zambia (GTZ). The types of assistance given by these organizations differ. The

assistance being given by the M A C O staff was purely advisory on technical lines in terms

of goat production. While the assistance which was given by World Vision and GTZ was

inform of inputs mainly the breeding stock and drugs to mostly women clubs. The inputs

given as grants to be recovered in-kind i.e. surrendering of one or two offspring to other

members of the group.

When the smallholder livelihoods were asked whether their involvement was due to these

organizations operating in the area 91% disagreed and only 9% agreed that their

involvement was due to presence of these organizations. But 98% of the respondents

agreed seeing more smallholder livelihoods going into goat production because of these

same organizations operating in the area and only 2% disagreed seeing more farmers

going into goat production due to these organizations.

27

4.8 Marketing.

The private sector and individual agents in a free market condition generally operate

livestock marketing systems that include marketing of goats. This means that the

government has no hand in the marketing system of goats.

This survey identified two major players who buy goats from the small-scale farmers in

the study area. They categorized them into Middlemen and the Local Community.

According to the respondents 62% sale their goats to the Middlemen only, saying their

offer is always more attractive than what the Local Community can offer, 7% sale to the

Local Community only, saying they are always there for them, while 31% said the sale to

both Middlemen and local community, depending on who is there at time of sale.

Middlemen in this context refer to the buyers who buy goats for resale either in Gwembe

town or elsewhere for a profit.

According to the survey selling points are two that is at the farmhouse and at the local

market. With regards to the survey 94% acknowledged their selling point to be at the

farm house, 3% said they take their animals to the local community market and the other

3% said they use either the local community market or at their farm house.

When trying to assess the time period when most sales are done the following was

revealed, 17% indicated selling their goats mostly during rainy season sating diseases as

being the cause, 57% sale during the dry season due to hunger around that time of the

year, while 26% sale their goats whenever need arisen (through-out the year). Figure 2.0

indicates how the goat sales are distributed throughout the year.

28

Figure 2.0

Time of sale of goats 60

rain season dry season throughout the year

Time of sale of goats

Source: Own survey data.

4.9 Constraints faced in Goat Production

The performance of goat production in the study area showed a bright future due to the

cUmatic conditions that are conducive for this type of species of animal. But although this

looks to be the scenario, farmers also revealed that goat production within the study area

had some problems and they identified three major problems, which were breed,

marketing, and management.

Under marketing, 94% of the respondents indicated problem of prices. The resuhs

showed that in most of the cases farmers were price takers. Buyers would like at all cost

to lower down the prices as much as possible to the disadvantage of the farmer.

As for transportation it was just 1% of respondents which indicated transport as a

problem alone and 5% indicated that they had both problems i.e. transportation and

prices.

As for management, 73% indicated that they were lacking knowledge in goat production

management and this resulted in high mortality rate during rearing stage. Meanwhile,

29

with regards to financial problems, out of 100 respondents only 1% indicated having a

problem with financial requirements for his goat enterprise.

From the Key Informants who in this study refers to the Local Agricultural Extension

Officer and the Veterinary Assistant for the area, revealed that the farmers get low prices

because of the type of breed they have which is very small. Therefore, it fails to attract a

good price.

30

CHAPTER 5.0

CONCLUSION AND RECOMMENDATIONS

5.1 Introduction

The success of goat production/ enterprises for economic well-being of smallholder

livelihoods must uhimately be measured by their income contribution towards the total

net income of the small-scale farmers involved. This study discussed the income

contribution of goat enterprise, other livestock enterprises, service providers, marketing

and finally the constraints faced in goat production in the study area. These areas

discussed relate to the three specific objectives of this research.

5.2 Conclusion

The study revealed that 99% of smallholder livelihoods in Gwembe kept goats for both

income generation and home consumption and only 1% kept goats for income generation

alone. On average the farmers in Gwembe are able to raise income from goat sales.

According to the resuh a farmer is able to earn K20, 015.00 as net margin from the sale

of one billy, K12, 816.00 from the sale of a she-goat and KIO, 193.00 from the sale of

one weaner. Money raised from the sale of goats was used for food, education, health,

purchase of farm inputs and other activities. From these figures, it is justifiable for goat

enterprises to be integrated into the existing agricultural activities in the district by the

smallholder livelihoods.

From the same results obtained, it was seen that these smallholder livelihoods should be

encouraged to keep goats since the size of the goat herd was independent of the size of

other livestock being kept i.e. 96% disagreed and only 3% agreed that size of goat herd

was dependent on other livestock being kept due to scarcity of resources to be shared.

The livestock which people in the study area keeps that contributes to their economic

well being included: cattle, local chickens, pigs, pigeons, ducks and fowl.

In the study area it was found that there was fiill participation of other service providers,

which may result in an increase in goat keepers. The identified service providers in the

31

area included; Government, World Vision and German Technical aid to Zambia. As for

the marketing system individuals and private organizations are the only institutions

involved in buying of goats from the small-scale farmers there was no government

interventions. Majority of the farmers in the study area preferred selling their animals

during dry season when they are food insecure.

5.3 Recommendations

The recommendations focuses on the strategies that the government and other concerned

stakeholders should undertake in order to improve goat production in the country.

Therefore, for the marketing system to be sustainable and benefit all the producer,

middlemen and consumers, the producer has to make goats available that are in good

condition and age as well as weight. This calls for improved productivity at the farm level

by the introduction of better breeds that puts on good weight, and increasing the

reproduction and nutrition.

The producer and middlemen could form Association and contribute to a revolving fund,

to improve the marketing facilities, other than waiting for funds from the goveniment.

The goverrmient should create legal institutions to foster the development of goat

industry in the country through the introduction of better breeds e.g. through the Ministry

of Agriculture and Co-operatives a wing can be created to look at the development of

goat industry.

32

REFERENCES.

Ahmadu, B., Lovelace, C.E.A. and Samui, K.L. (2000). Goat keeping Under Village Production System in Semi-arid River VaHey m Zambia, 7^ International Conference on Goats, France, May 2000.

Banda J W., Mtukuso A.P. and Jere J.A (1998): Small Ruminants in Smallholder Crop/Livestock Systems in Malawi Identification and Priorittsation of Constraints, Bunda College of Agriculture.

Central Statistical Office (2003): Agricultural and Pastoral Production Country Report.

Chitambo H. (1995): The Marketing Chain for Goats from Farms in the Zambezi Valley in Zambia.

Chisanga and Mwenya (1998): The Diversity and Conservation Status of Livestock and Poultry Genetic Resources in Zambia, Workshop on Animal Genetic Resources in the SADC region held in Gaborone, April, 1998, Botswana.

DAPH (1993). Department of Animal Production and Health. Ministry of Agriculture, Food and Fisheries, Annual Report, Zambia.

Eroarome M. Aregheore (2006): Country Pasture / Forage Resource Profiles Zambia H, University ofthe Southern Pacific.

Kusina, Dzudar, Chikura and Sibanda (2000): Goat Marketing System in Crop/Livestock Farming System Report, Harare.

Linda Coffey (2004): Goat, Sustainable Production Overview, ATTRA Publication #IP2000.

Mwenya, W.N.M. (2001): The Diversity and Conservation Status of Livestock and Poultry Genetic Resources in Zambia, Workshop on Animal Genetic Resources in the SADC region held in Gaborone, February 2001, Botswana.

National Dairy Database <1992): A Countiy Living Resource and Community.

Ndambo Ndambo (1999): Contribution of Goats to Smallholder Farmers in Kanakantapa.

Panin A. (2004): Botswana College of Agriculture, Botswana.

Panin A. and Mahabile M. (1994): Response of Land Productivity to Wealth of Smallholder Farmers in Botewana: A case study Report.

33

Tchad-Dumas (1989): Livestock Owing in Agro-Pastoral and Pastoral Societies in Kenya and Tchad.

Tomlinson Sylvia (1999): The Meat Goats of Caston Creek, Redbud PubUshing Company, Victoria. http://attra.neat.org/attra-pub/PDF/meatgoat.pdf

Worid Bank. (1995): Malawi Food Security Report, Report No. 18151 - M A I .

Wildlife Conservation Report (2004): Community Based Wildlife Management, Lusaka http://www.fao.org/SD/dim pe44/ pe4 040902alen.htm.

34

APPENDICES

35

Appendix 1: Questionnaire

{Where the box is provided tick where it is appropriate to you)

SECTION A; PERSONAL DETAILS

1.

2.

3.

4.

Date of interview;

First Name: Surname:

Village: Agric Camp;

Sex:

(a)

.Block.

Male (b) Female

5. In which age group do you fall?

(a) 16-25

(b) 2 6 - 3 5

(c) 3 6 - 4 5

(d) 4 6 - 5 5

(e) 55 and above

Marital Status:

(a) Smgle

(b) Married

(c) Divorced

(d) Widowed

(e) Separated

Level of education attained:

(a) Primary

(b) Secondary

(c) Tertiary

(d) None

Sources of income

(a) Livestock sales

(b) Crop sales

(c) Charcoal selling

(d) Trading

36

SECTION B. GOAT ENTERPRISE

1. What is the composition of your goat herd?

Class Number of Animals

Billies

She - Goats

Female weaners

Male weaners

Kids

Total

2. Why do you keep goats?

(a) Income generation

(b) Home Consumption

(c) Prestige

3. Do you sell your goats?

(a) Yes (b) No

4. If yes, indicate, how many you sold in the identified years.

Class 2004 2005 2006 No. Sold live No. Sold cold dressed

weight.

Total

Billies

She-Goat

Female

weaners

Male

Weaners

Kids

Total

37

5. For animals you sale cold dressed weight, how many kgs do you get per animal (according to

Class):

Class Kilogrammes / Animal Price per Kg .

Billies

She-Goat

Female Weaners

Male Weaners

Kids

Total

6. For animals sold live, how much do you sale, according to class?

Class Price

Billies

She-Goat

Female Goats

Male Goats

Kids

Total

7. What are the major inputs involved.

No. INPUT Q U A N T I T Y COST/UNIT

1 Dip

2 Drugs

3 Labour

4 Supplementation

8. What are the major problems faced with regards to goat rearing?

(a) Inputs acquisition

(b) Marketing

(c) Financial

(d) Management

38

SECTION C. OTHER LIVESTOCK ENTERPRISES

1. Are you keeping other livestock, other than goats?

(a) Yes I I (b)No

2. If the answer in question 1 is (a) what are these animals?

Tick Livestock No. of Animals No. sold

Cattle

Pigs

Chickens

Ducks

Pigeons

Guinea fowl

Turkeys

Sheep

3. Are the livestock enterprises mentioned in question 2 above enough to meet your household

requirements in addition to income from goats?

(a) Yes I I (b)No

4. If your answer to question 3 above is (b) what are your options?

(a) Crops

(b) Charcoal selling

(c) Trading

5. If the number of goats being kept is low, could it be because of other livestock enterprise being

kept?

(a) Yes (b) No

6. If the answer in question 5 is (b) why then?

39

SECTION D. OTHER SERVICE PROVIDERS

1. Is there any Service Provider Organisation working in your area in relation to goat production e.j

government workers, NGOs, e.tx.?

(a) Yes I I (b) No

2. If the answer in question 1 is (a) who are they?

(a) Local Agricultural Extension officer

(b) Non Governmental Organisations

(c) Out grower Schemes

(d) Consultants

3. What type of assistance do they provide?

Name of Organisation Type of Assistance

Local Agric Extension Officer (a) Advisory ( ) (b) Financial ( )

(b) Inputs ( ) (d) Marketing ( )

Non Government Organisation (a) Advisory ( ) (b) Financial ( )

(c) hiputs ( ) (d) Marketmg ( )

Out grower Scheme (a) Advisory ( ) (b) Financial ( )

(c) Inputs ( ) (b} Marketing ( )

Consultants (a) Advisory ( ) (b) Financial ( )

(c) hiput ( ) (d) Marketing ( )

4. On what type of Assistance are you expected to pay back?

Name of Organisation Type of Assistance

Local Agric. Extension Officers (a) Advisory ( ) (b) Fmancial ( )

(c) hiputs ( ) (d) Marketing ( )

Non Government Organisation (a) Advisory ( ) (b) Financial ( )

(c) Input ( ) (d) Marketing ( )

Out grower Scheme (a) Advisory ( ) (b) Financial ( )

(c) Inputs ( ) (d) Marketing ( )

Consultants (a) Advisory ( ) (b) Fmancial ( )

(c) Inputs ( ) (d) Marketing ( )

5. For organisations giving fmancial Assistance i f any is it?

(a) Grant | | (b) Loan

40

6. How is the recover done, is it?

(a) Financially (b) In kind

7. Is it because of these organisations that you are involved in goat production?

(a) Yes I I (b)No

8. Do you see other farmers going into goat production because of these Organisations?

(a) Yes I 1 (b)No

9. How has the mentioned service providers helped you?

(a) Improved your food security

(b) Improved your cash farm flow.

(c) Improved your understanding of goat rearing

(d) Just stabilised your goat herd.

SECTION E: GOAT MARKETING

1. Who are the main buyers of your goats?

(a) Middlemen

(b) Retailers I

(c) Local Community

2. How do you sale to these buyers?

(a) At the Farm House I

(b) On market place |

(c) Either way

3. If your answer to question 2 above is (b), how do you take your animals to the market?

(a) By Road

(b) By Train

(c) On Foot

4. How much do you spend on transport per animal?

5. What are the major marketing problems you face?

(a) Pricing

41

(b) Marketing Costs

(c) Transportation

(d) Competition from other Farmers.

When do you sale your animals?

(a) Rain season

(b) Dry season

(c) Throughout the Year.


Recommended