Economic Sectors and Employment Patterns INTRODUCTION & CONTEXT Minnesota’s economy is changing; understanding how these changes have unfolded in the past and where they may take the state in the future allows for better alignment of the transportation system with the demands of industry & commerce. It is important to note that many of the other trends shaping the way Minnesota continues to change have a significant impact on how the state’s economy evolves. For example, an aging population requires a growing educational, health, and social services sector to provide care and opportunities for enrichment while professional service industries continue to grow in order to support an economy ever-more rooted in technological development. The sections below highlight some of the key factors that are likely to drive economic change in the state. KEY TRENDS Minnesota’s Shifting Economy Minnesota’s economy is slowly shifting from agriculture and manufacturing, two highly visible industries, toward service industries such as education and health services and professional and business services. Key information that highlights this shift is noted below. Additionally, Figure 1 (on page 3) shows, at the county level, the proportion of the workforce employed within these and other top industries. Table 1: Top sectors for employment (MN DEED Quarterly Census of Employment and Wages) Sector 2014 Employment 2014 Employment (%) Education and health services 674,000 24.59% Transportation, trade, and utilities 531,000 19.40% Professional and business services 395,000 13.00% SERVICES Table 1 shows the workforce size of Minnesota’s top three sectors of employment in 2014. Education and health services made up 24.59 percent of employment in Minnesota and professional and business services made up 13.00 percent. These two service-based industries together accounted for nearly 40 percent of Minnesota’s workforce. MANUFACTURING Relative to the national average, the highest concentration of employment within Minnesota is in the manufacturing sector. Despite this, manufacturing experienced the most dramatic decline in the concentration of employment between 2001 and 2014, as indicated by the sector’s location quotient. The location quotient, a ratio of an area’s employment within a sector compared to a reference area, is the measure typically used to evaluate employment concentration within a sector, and relative to national manufacturing employment. The location quotient for manufacturing declined by 0.13 statewide and by 0.14 in the Twin Cities. 1 1 U.S Bureau of Labor Statistics Location Quotient Calculator 1
Transcript
Economic Sectors and Employment Patterns INTRODUCTION & CONTEXT Minnesota’s economy is changing; understanding how these changes have unfolded in the past and where they may take the state in the future allows for better alignment of the transportation system with the demands of industry & commerce. It is important to note that many of the other trends shaping the way Minnesota continues to change have a significant impact on how the state’s economy evolves. For example, an aging population requires a growing educational, health, and social services sector to provide care and opportunities for enrichment while professional service industries continue to grow in order to support an economy ever-more rooted in technological development. The sections below highlight some of the key factors that are likely to drive economic change in the state.
KEY TRENDS Minnesota’s Shifting Economy
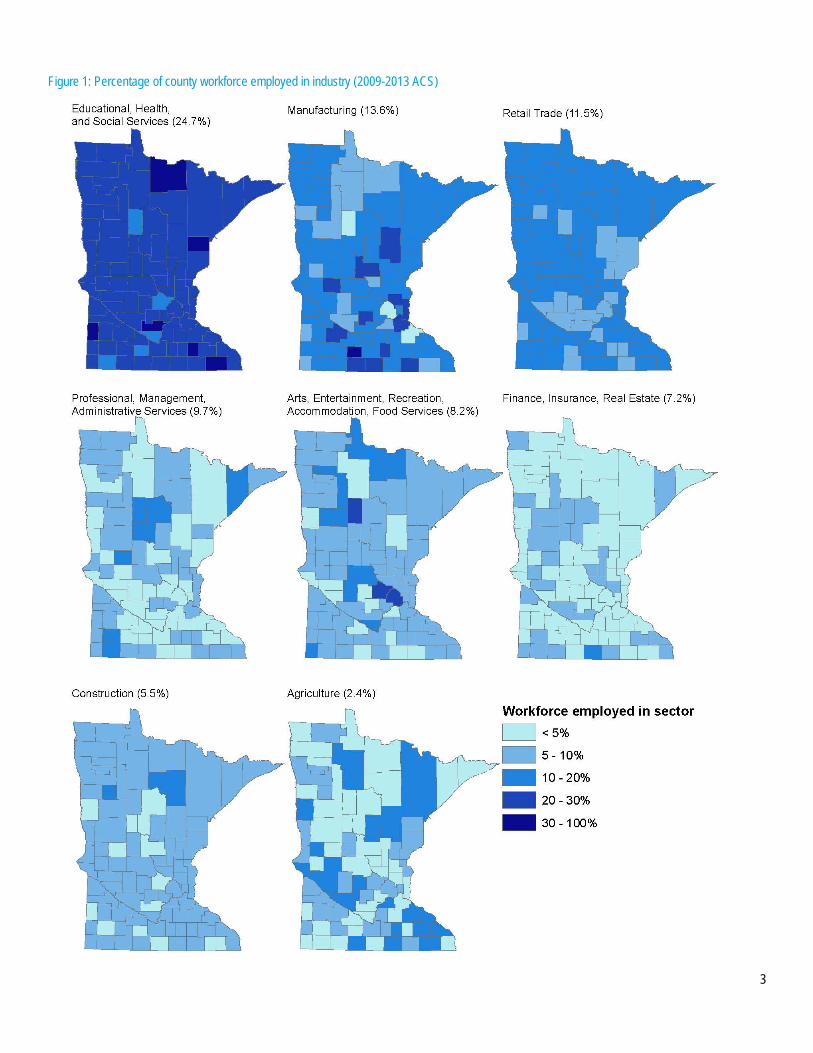
Minnesota’s economy is slowly shifting from agriculture and manufacturing, two highly visible industries, toward service industries such as education and health services and professional and business services. Key information that highlights this shift is noted below. Additionally, Figure 1 (on page 3) shows, at the county level, the proportion of the workforce employed within these and other top industries.
Table 1: Top sectors for employment (MN DEED Quarterly Census of Employment and Wages)
Sector 2014 Employment 2014 Employment (%)
Education and health services 674,000 24.59%
Transportation, trade, and utilities 531,000 19.40%
Professional and business services 395,000 13.00%
SERVICES
Table 1 shows the workforce size of Minnesota’s top three sectors of employment in 2014. Education and health services made up 24.59 percent of employment in Minnesota and professional and business services made up 13.00 percent. These two service-based industries together accounted for nearly 40 percent of Minnesota’s workforce.
MANUFACTURING
Relative to the national average, the highest concentration of employment within Minnesota is in the manufacturing sector. Despite this, manufacturing experienced the most dramatic decline in the concentration of employment between 2001 and 2014, as indicated by the sector’s location quotient. The location quotient, a ratio of an area’s employment within a sector compared to a reference area, is the measure typically used to evaluate employment concentration within a sector, and relative to national manufacturing employment. The location quotient for manufacturing declined by 0.13 statewide and by 0.14 in the Twin Cities.1
1 U.S Bureau of Labor Statistics Location Quotient Calculator 1
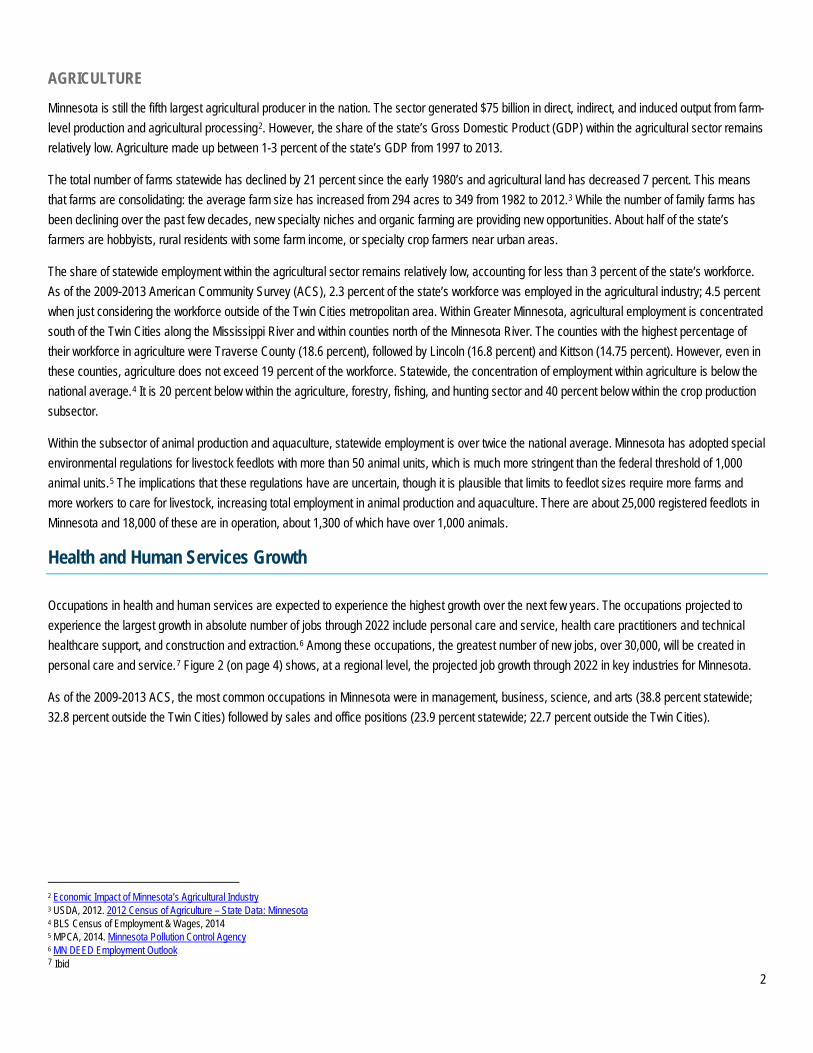
Minnesota is still the fifth largest agricultural producer in the nation. The sector generated $75 billion in direct, indirect, and induced output from farm-level production and agricultural processing2. However, the share of the state’s Gross Domestic Product (GDP) within the agricultural sector remains relatively low. Agriculture made up between 1-3 percent of the state’s GDP from 1997 to 2013.
The total number of farms statewide has declined by 21 percent since the early 1980’s and agricultural land has decreased 7 percent. This means that farms are consolidating: the average farm size has increased from 294 acres to 349 from 1982 to 2012.3 While the number of family farms has been declining over the past few decades, new specialty niches and organic farming are providing new opportunities. About half of the state’s farmers are hobbyists, rural residents with some farm income, or specialty crop farmers near urban areas.
The share of statewide employment within the agricultural sector remains relatively low, accounting for less than 3 percent of the state’s workforce. As of the 2009-2013 American Community Survey (ACS), 2.3 percent of the state’s workforce was employed in the agricultural industry; 4.5 percent when just considering the workforce outside of the Twin Cities metropolitan area. Within Greater Minnesota, agricultural employment is concentrated south of the Twin Cities along the Mississippi River and within counties north of the Minnesota River. The counties with the highest percentage of their workforce in agriculture were Traverse County (18.6 percent), followed by Lincoln (16.8 percent) and Kittson (14.75 percent). However, even in these counties, agriculture does not exceed 19 percent of the workforce. Statewide, the concentration of employment within agriculture is below the national average.4 It is 20 percent below within the agriculture, forestry, fishing, and hunting sector and 40 percent below within the crop production subsector.
Within the subsector of animal production and aquaculture, statewide employment is over twice the national average. Minnesota has adopted special environmental regulations for livestock feedlots with more than 50 animal units, which is much more stringent than the federal threshold of 1,000 animal units.5 The implications that these regulations have are uncertain, though it is plausible that limits to feedlot sizes require more farms and more workers to care for livestock, increasing total employment in animal production and aquaculture. There are about 25,000 registered feedlots in Minnesota and 18,000 of these are in operation, about 1,300 of which have over 1,000 animals.
Health and Human Services Growth
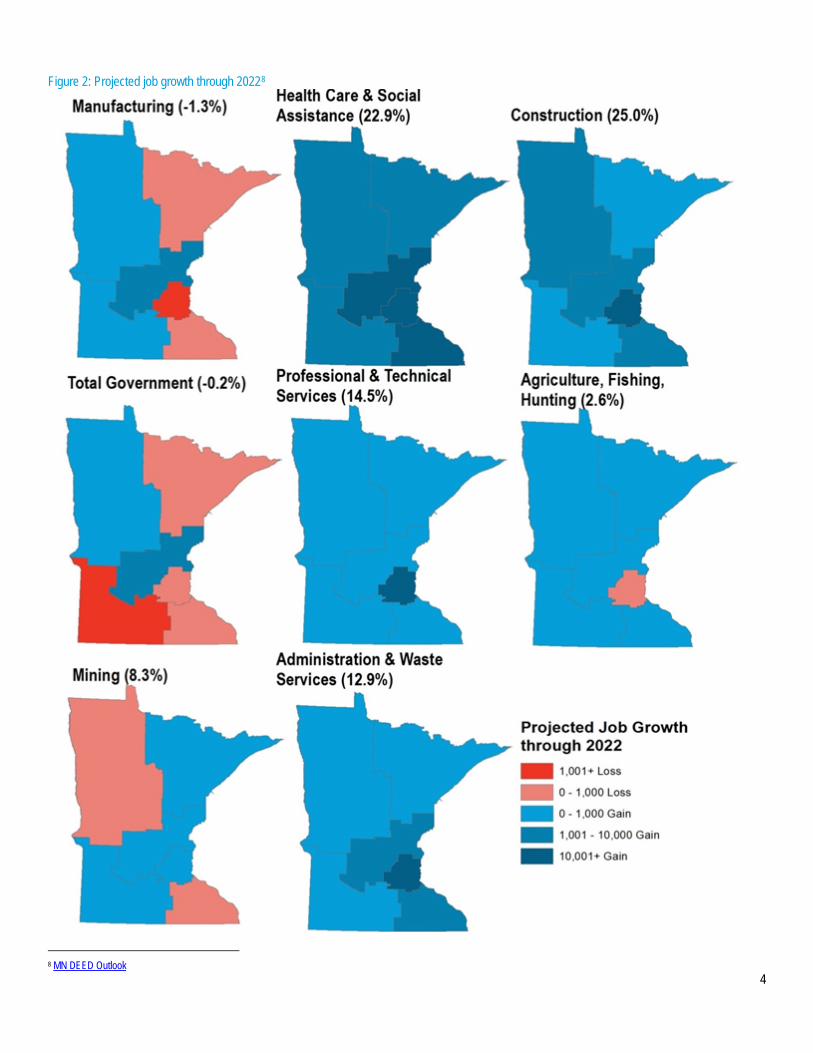
Occupations in health and human services are expected to experience the highest growth over the next few years. The occupations projected to experience the largest growth in absolute number of jobs through 2022 include personal care and service, health care practitioners and technical healthcare support, and construction and extraction.6 Among these occupations, the greatest number of new jobs, over 30,000, will be created in personal care and service.7 Figure 2 (on page 4) shows, at a regional level, the projected job growth through 2022 in key industries for Minnesota.
As of the 2009-2013 ACS, the most common occupations in Minnesota were in management, business, science, and arts (38.8 percent statewide; 32.8 percent outside the Twin Cities) followed by sales and office positions (23.9 percent statewide; 22.7 percent outside the Twin Cities).
2 Economic Impact of Minnesota’s Agricultural Industry 3 USDA, 2012. 2012 Census of Agriculture – State Data: Minnesota 4 BLS Census of Employment & Wages, 2014 5 MPCA, 2014. Minnesota Pollution Control Agency 6 MN DEED Employment Outlook 7 Ibid
Finance, insurance, and real estate is the economic sector responsible for the largest proportion of the state’s Gross Domestic Product (GDP) and, as shown in Figure 3, it experienced dramatic growth over the past 15 years compared to other key economic sectors.
Many sectors saw a dip in GDP during the 2008 recession. However, these sectors have since experienced growth and all have surpassed 2008 GDP levels.
Figure 3: Minnesota Gross Domestic Product (GDP) (2014 billion dollars) by top economic sectors, 1997-20149
Tourism
Tourism is an important part of Minnesota’s economy in all parts of the state. All told, there are approximately 250,000 full- and part-time jobs in Minnesota related to the travel and tourism sectors.10 The geographical distribution of these jobs is focused primarily in the Twin Cities metropolitan area, Saint Cloud area, Mankato area, Brainerd Lakes area, Rochester area, and Saint Louis County.11 Travel- and leisure-related spending in Minnesota is spread out fairly evenly during the four seasons: 24 percent in winter (Dec-Mar), 14 percent in spring (Apr-May), 37 percent in summer (Jun-Aug), and 25 percent in fall (Sept-Nov).12 All told, Minnesota ranks 22nd out of all states in the U.S. in traveler spending, and 10th in travel-generated tax receipts. Figure 4 shows the breakdown of travel and leisure related spending by category.
9 MN DEED Quarterly Census of Employment & Wages 10 Explore MN, 2015 11 Ibid 12 Ibid
Figure 4: Gross sales generated (in millions of Dollars) by tourism-related industries in Minnesota13
Decline in Unemployment and Underemployment
Unemployment and underemployment has declined. In 2014, unemployment and underemployment in Minnesota was significantly lower than the national average. Unemployment was 4.0 percent in 2014 (U.S. average was 6.2 percent) and underemployment, which includes the unemployed, part-time for economic reasons, and those marginally attached to the labor force, was 8.7 percent. (U.S. average was 12 percent).14 Minnesota’s unemployment rate has returned to and improved upon levels seen prior to the 2008 recession (4.7 percent in December 2007), illustrated in Figure 5.15 As of November 2015, Minnesota’s unemployment rate was a seasonally-adjusted 3.5 percent.16
Figure 5: Unemployment and Underutilized Work Force17
13 Explore MN, 2013 14 Alternative Measures of Labor Underutilization 15 Select Committee on Living Wage Jobs: Making Work Pay in Minnesota 16 MN DEED, 2015 17 Current Employment Statistics
While workforce participation and commuting demands on the transportation system are growing, work and travel schedules are spreading beyond the traditional morning and evening peak hours as more people work part-time. This is a nationwide phenomenon referred to as peak spreading, and is largely driven by increased part-time employment.18 The implications of peak spreading are uncertain – they may lessen congestion during the traditional “peak-of-the-peak” but in doing so may lengthen the amount of time that highways are congested. The American Community Survey shows that full-time employment declined by 3.0 percent (to 61.2 percent) from 2009 averages to 2013 averages in Minnesota, part-time employment increased by 0.5 percent (to 22.5 percent), while the percentage of the population that did not work increased by 2.4 percent (to 16.2 percent).
Congestion and access to jobs
There are many ways to think about slow-downs on the transportation system. Delays and congestion can be measured in amount of time or fuel wasted, cost to travelers, or reductions in access to destinations within a given amount of time. MnDOT keeps detailed data on congestion in the Twin Cities metropolitan area, and has begun collecting and analyzing travel time reliability data for Greater Minnesota. Despite the inconvenience that congestion creates, it is also an inevitable sign that local economies are flourishing. Further, a study of MN 100 northbound from Interstate 494 to Interstate 694 found that nearly half of all traveler delays occur in the presence of conditions that are non-recurring (crashes, stalls, special events, weather, etc.) and occur only 28 percent of the time.19 It is likely that this trend is replicated across the Twin Cities’ highway system.
TWIN CITIES METRO
MnDOT has been tracking congestion data in the Twin Cities for many years. Figure 6 shows the percentage of freeway miles operating below 45 MPH during both the AM and PM peak periods combined.
Figure 6: Percent of freeway miles in Twin Cities operating below 45 MPH during peak periods
Generally speaking, congestion levels in the Twin Cities have remained relatively constant around 20 percent since the mid-2000s. The map in Figure 7 shows where congestion most frequently occurs.
18 Commuting in America III (2013) 19 MnDOT/SRF SHARP 2 Implementation Study, 2013
Figure 7: Hours of congestion during AM & PM peak periods combined, 201420
Emerging technologies and data analysis techniques allow for fine-grained research into how many jobs are accessible from one location within the Twin Cities. The University of Minnesota’s 2010 report on auto accessibility in the Twin Cities produced the following map showing the number of jobs within a 20 minute commute of locations throughout the region. A similar initiative from the Accessibility Observatory displays the number of jobs accessible within a 30 minute transit commute.
MnDOT is in the process of developing and implanting a Travel Time Reliability Measurement and Analysis system that will assist in estimating how predictable travel times are throughout Minnesota. Further work on this topic and additional analysis as to how to use this system will continue in the years to come.
Changing freight, constant value
The types of freight moving in Minnesota are changing. However, the shipper value remains fairly constant. Key information related to freight movement is highlighted below.
• In terms of ton-miles, cereal grains comprise the bulk of agricultural freight movement originating from and circulating within Minnesota at just over 60,000 ton-miles in 2015, and are projected to grow to over 80,000 ton-miles by 2040.23 Metallic ores make up most of mining freight movement at over 40,000 ton-miles in 2015, but are projected to decline to 30,000 ton-miles by 2040. These goods, along with other agricultural products, will continue to dominate freight movement in Greater Minnesota through 2040. Among products entering Minnesota from other states, coal (not elsewhere classified, excludes other petroleum products) comprises the greatest number of ton-miles.
• Among goods originating from within the Twin Cities metropolitan area, manufactured products such as milled grains and basic chemicals (10,000 now and 33,000 by 2040) are expected to overtake raw agricultural products such as cereal grains and live animals/fish, which currently comprise the most ton-miles of freight (32,000 now and just under 30,000 in 2040).24
• Based on studies in southwestern and west-central Minnesota, the transportation features manufacturers and other shippers value most are smooth pavement, wide shoulders, other infrastructure features that facilitate freight movement for oversize trucks, snow and ice operations that ensure around-the-clock reliability, as well as timely and accurate communication, such as 511mn.org information, a frequently-used source for road conditions and closures.25
• Economic clusters across the state benefit from investment in railroads. A freight rail economic development study completed in 2012 revealed that rail is the preferred shipping mode for bulk cargo and that rail is an important factor of industry logistics and economic competitiveness, particularly with regards to short rail line connections to larger Class I railroads. Freight rail volumes are expected to continue increasing because of the truck driver shortage, increasing fuel prices, and increased truck freight regulations. Investment in freight rail and diverting freight volumes from roadways to railroads also reduces stress on pavement, congestion, and other highway costs. NAFTA partners Mexico and Canada are well-connected to Minnesota by rail, and are two of the state’s top-three international trading partners. Railroads are an important channel of private investment and will continue to catalyze economic growth. The private sector invests millions of dollars in capital on the railway system each year. 26
• Minnesota industries such as construction, manufacturing, retail and wholesale industries, were identified as freight-intensive due to their size, growth opportunities, strategic importance, and high level of dependence on efficient movement of transportation to keep supply chains flowing, manage costs, and maintain productivity in very competitive markets.27 These industries make greater use of transportation networks in their production processes. By 2022, the number of jobs in these sectors is projected to grow more slowly (4.9 percent) than the state average across all sectors (6.7 percent).
• Air cargo carriers in Minnesota move goods with the highest value per ton. Goods shipped by air in Minnesota are estimated to value approximately $90,000 per ton in comparison to just under $800 per ton for cargo carried by truck.28
23 Freight Analysis Framework, 2015 24 Freight Analysis Framework Data Tabulation Tool uses 2007 Commodity Survey data to forecast freight movement through 2040. 25 MnDOT Districts 8 and 4, MnDOT Offices of Customer Relations, Freight and Commercial Vehicle Operations, UMN, 2014, 2015. Manufacturers’ Perspective on Minnesota’s Transportation System: Studies in Southwest and West-Central Minnesota 26 MnDOT, MnDEED, 2013. Freight Rail Economic Development 27 MnDOT, 2009. Freight Rail Supply and Demand Draft Technical Memo. 28 Minnesota Statewide Freight System Plan, Draft Report, 2015
Growth in regional mineral extraction, including the related transportation and processing, has strengthened the state’s economy. However, this growth can also raise public health and safety concerns, and its long-term viability is questionable given recent mine idling and closings in Northern Minnesota. Examples are highlighted below.
• Oil production and related activities in North Dakota produce some small direct impacts on economic activity in Minnesota. Except for specialty sand used in hydraulic fracturing, companies in Minnesota’s border cities are not suppliers of goods or services used in production of crude oil. However, there are some in-state businesses that use crude oil or refined products as inputs and the state can benefit from oil production in North Dakota and Canada because of the lower costs of delivered crude relative to other locations in the Midwest. All in all, rail shipments of crude from Canada and North Dakota have increased enormously since 2010, and are likely to continue to remain at current levels.
• Silica sand mining, processing, and transportation increased in southern Minnesota in recent years. Due to air pollution concerns resulting from mining, state legislation passed in 2013 subjects this activity to new regulations and environmental review thresholds.29
• Mining and processing of taconite, a low-grade iron ore, increased in recent years and is credited with saving Minnesota’s iron ore mining industry. Trucks holding up to 240 tons of mined taconite transport it from mines in northern Minnesota either directly to a processing plant if nearby, or to train cars or on ore boats to ports and steel mills around the Great Lakes.30
29 Silica Sand Mining Minnesota Pollution Control Agency 30 Digging into Minnesota Minerals: Taconite (2015)