34
Economic state of the union, EuroMemo 2013 Engelbert Stockhammer Kingston University

Economic state of the union, EuroMemo 2013
Engelbert Stockhammer
Kingston University

structure
• Economic developments
– Background: export-led growth and debt-led growth
– Growth, trade imbalances, ages and unemployment
– House prices, household debt, banks
• Economic policy
– More fiscal straightjacket
– Cyprus
• Outlook: Europe’s divided working class

Background: neoliberal growth models
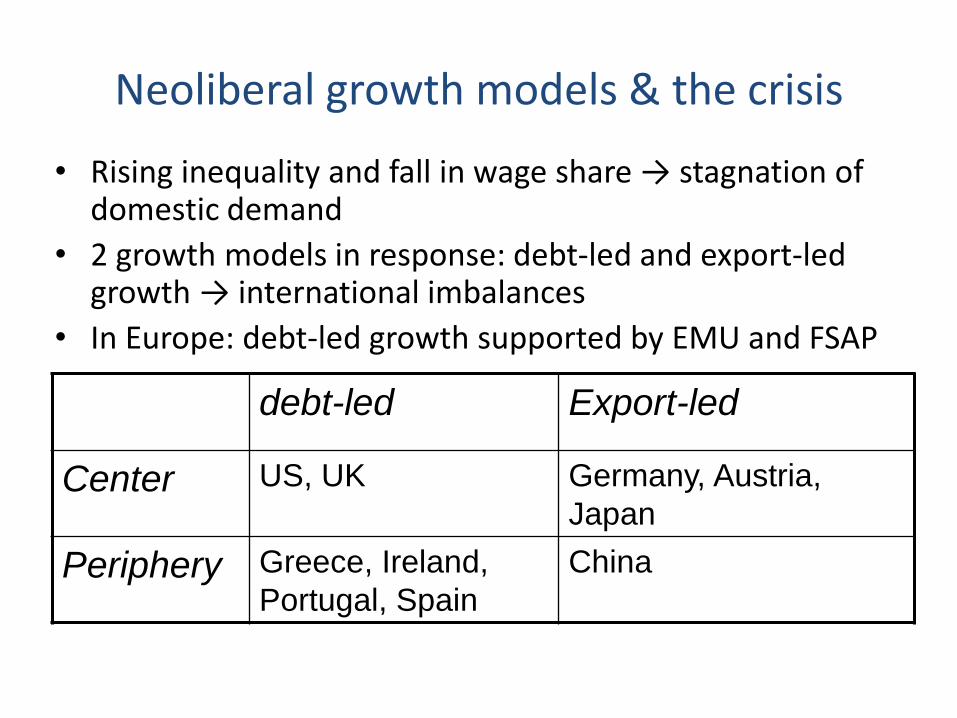
Neoliberal growth models & the crisis
• Rising inequality and fall in wage share → stagnation of domestic demand
• 2 growth models in response: debt-led and export-led growth → international imbalances
• In Europe: debt-led growth supported by EMU and FSAP
debt-led Export-led
Center US, UK Germany, Austria,
Japan
Periphery Greece, Ireland,
Portugal, Spain
China

Neoliberalism
Financial deregulation
Polarization of income distribution
internal
External Temporary relaxtion of
BoP constraint
2 growth models
Stagnant domestic . demand
debt-driven consumption
Export orientation
CA surplus
Capital outflows
CA deficit
Capital inflows
Asset + housing price bubble
The build up of the crisis

Increase in household debt (% of GDP)
Increase in HH debt (in % GDP) 2000/08
Germany -11.3 USA 26
Netherlands 32.8
United
Kingdom 28.1
Austria 7.9
Ireland 62.7
Greece 35.5
France 15.8 Spain 33.8
Portugal 27.4
Source: Eurostat, except USA: FoF

International imbalances at the outset of the crisis
current account (%GDP) 2007
Germany 7,9 United Kingdom -2,7
Austria 3,6 United States -5,2
Netherlands 8,7
Greece -14,5
Japan 4,8 Ireland -5,3
China 5,2 Spain -10
Portugal -9,4
Italy -2,4

building up of imbalances (in Europe: German wage suppression + financial bubbles in the South)
Crisis 2008-
Debt-led economies Recession + stagnation due to debt overhang
Export-led economies Short sharp recession with strong recovery
USA Some counter-cyclical fiscal policy QE (for private sector as well as for public sector) → interest rates on govt bonds low
Europe Fiscal straightjacket Hesitant QE: ECB does not play lender of last resort (LOLR) for govts
∑ stagnation/weak recovery
North Weak recovery
South Debt deflation Sovereign debt crisis

Recent economic developments

GDP and NX
real gdp NX Country 2009-13 2013 Country 2008-13 2013
European Union (28 countries) -1.3% -0.1%
European Union (28 countries) 2.6 1.6
Euro area (12 countries) -2.1% -0.4%
Euro area (12 countries) 3.1 2.5
Germany 2.9% 0.4% Germany 0.2 6.3 Ireland -2.9% 1.1% Ireland 8.8 3.1 Greece -23.3% -4.2% Greece 15.2 -2.8 Spain -6.4% -1.5% Spain 11.2 1.6 France 0.0% -0.1% France 0.3 -1.6 Italy -7.1% -1.3% Italy 3.8 1.0
Czech Republic -2.0% -0.4% Czech Republic 0.5 -2.4 Hungary -5.4% 0.2% Hungary 9.4 2.5 Poland 13.6% 1.1% Poland 3.1 -2.5 Romania -3.5% 1.6% Romania 7.5 -3.9
United Kingdom -0.5% 0.6% United Kingdom -1.7 -2.7

The costs of rebalancing Stockhammer & Sotiropoulos (2012)
• GIIPS had average NX of -8.4% (GDP) in 2007. given standard macro relations, what is the output decline required to balance NX?
• Estimate panel of EU12 countries
• NX-equation: NX = f(Y, ULC)
• Phillips curve: ULC = f(U, PM)
• Okun’s Law: ∆U = f(∆ Y)
• Finding: need -23% (recession sample) to -47% (full sample) GDP

Public debt
budget deficit public debt Country 2009-13 2013 Country 2009-13 2008 2013
Euro area (12 countries) 0.34 -2.86 Euro area (12 countries) 25 71 96 Germany 1.15 -0.16 Germany 14 67 81 Ireland 0.22 -7.14 Ireland 79 45 123 Greece 6.09 -3.83 Greece 62 113 175 Spain -2.04 -6.53 Spain 51 40 91 France 0.19 -3.96 France 26 68 94 Italy 0.01 -2.69 Italy 25 106 131
Czech Republic 0.30 -2.86 Czech Republic 20 29 48 Hungary -0.15 -3.14 Hungary 7 73 80 Poland 0.07 -3.94 Poland 10 47 57 Romania 3.11 -2.57 Romania 25 13 39 United Kingdom 0.36 -6.85 United Kingdom 43 52 95

Sovereign yields remain high for South, but seem to be declining

Unemployment and wage
unemployment rate real wages Country 2008-13 2013 Country 2009-13 2013
European Union (27 countries) 0.6 11.1
European Union (27 countries) -0.6% 0.3%
Euro area (12) 4.6 12.2 Germany -2.1 5.4 Germany 2.9% 0.8% Ireland 7.8 14.2 Ireland -3.5% -1.0% Greece 19.3 27 Greece -22.1% -6.2% Spain 15.7 27 Spain -6.9% -0.3% France 2.8 10.6 France 2.0% -0.3% Italy 5.1 11.8 Italy -2.4% -0.4%
Czech Republic 3.1 7.5 Czech Republic 4.7% -0.4% Hungary 3.6 11.4 Hungary -8.7% -3.1% Poland 3.8 10.9 Poland 2.0% 1.2% Romania 1.1 6.9 Romania -6.8% 1.7%
United Kingdom 2.4 8 United Kingdom -3.2% 0.6%

Housing, credit, banks


Property prices: Spain (-30%), Germany, Ireland (-50%)
0,0
20,0
40,0
60,0
80,0
100,0
120,0
140,0
01.
01.
200
5
01.
01.
200
6
01.
01.
200
7
01.
01.
200
8
01.
01.
200
9
01.
01.
201
0
01.
01.
201
1
01.
01.
201
2
01.
01.
201
3
Ireland: property prices (-50% since 2007)
0,0
20,0
40,0
60,0
80,0
100,0
120,0
01.
03.
200
0
01.
06.
200
2
01.
09.
200
4
01.
12.
200
6
01.
03.
200
9
01.
06.
201
1
Germany
Spain


Fragile banks
• RAC typically 4-12%
• what does this mean for equity/ total assets?
• Banks are extremely leveraged
– That boost profits in boom
– And losses in crises
Deutsche Bank, consolidated group, 2013Q1, bn €
Assets 2033
RAC 325
Total Shareholder
Equity 56
capital ratio (RAC) 17%
capital ratio (total
assets) 3%

QE

ECB Monthly Bulletin June 2010, p. 38

Europe’s Lehmann moment
• “on 6-7 May tensions in the sovereign debt markets of some euro area countries spread to other segments of the financial markets. Volatility in the financial markets increased sharply and liquidity conditions deteriorated significantly not only in sovereign bond markets, but also and to a critical degree in the money markets. Transactions within the interbank market declined rapidly and uncertainty among banks about counterparties’ creditworthiness increased.” (ECB Monthly Bulletin June 2010, 41)
• “heightened concerns about the probability of default of some European financial institutions. Indeed, the probability of a simultaneous default of two or more euro area large and complex banking groups, (...) rose sharply on 7 May, reaching values higher than in the aftermath of the collapse of Lehman Brothers.” ECB Monthly Bulletin June 2010, 38-39
• Sovereign debt crisis = (private) banking crisis

Gov’t debt, money and banks • CBs (LOLR) are contested between private (financial) interests and
gov’ts • ECB is reluctantly playing LOLR for private sector • ... and even more reluctantly for public sector
– EMU has removed LOLR from nation states – Turned what would have been an exchange rate crisis into a sovereign
debt crisis (similar to ‘debt in foreign currency’)
• Crisis has illustrated how closely linked the state and the (national) financial sectors are
• A sovereign debt crisis is also a crisis of private banking sector – Role of gov’t bonds in banks’ balance sheet
• A banking crisis → public debt
• European neoliberalism wants to strangulate the nation states, but hasn’t built a European one.

Wrapping up & policy

Is the worst over, or is the next crisis around the corner?
• On the surface it looks like stabilisation, but with divergence across Europe – No disaster (yet)
• Mild recession in North • Positive growth in Ireland, no collapse in Spain, growth in Baltics
– Some countries left to rot (Greece, Cyprus) – Financial market pressures have eased – Rebalancing is taking place (trade imbalances, house prices; but not
household debt)
• In the ‘South’ a social roll back: falling wages and high unemployment, attack on welfare state
• Possible sources of instability – Fragile banks – Fragile sovereign debt in Spain, Italy – High levels of household debt

Economic policy
• 6pack, 2pack, TSCG, Eu Semester: more austerity (for South) & constitutional
• ESM • Banking union: not quite
– Supervision – Rescue fund
• Cyprus – ordo-liberalism (when it’s about someone else’s money) – Bail in and ‘tax’ on deposits >10k – Cyprus had a huge (8.5 x GDP) financial sector

Thinking about rebalancing strategies in the Euro area
How to deal with cost differentials
Adjustment in trade deficit countries:
deflationary
Adjustment in trade surplus countries:
Inflationary
How to deal with debt
Bankruptcy
Restructuring / Bail in
Bail out
Bail out + QE

Europe’s divided workers
• North: export-led growth (stable industry); before crisis: erosion of welfare state + rising inequality; recovery after recession
• South: debt-led growth: bubble + deindustrialisation; before crisis: consolidation of welfare state; crisis -> depression + attack on welfare state
• East: dependent catching up (subordination to German production networks) with some debt-led elements (rising household debt from low levels), moderate de-industrialisation with upgrading (productivity and wage growth); crisis: varied experience

Policy implications
• So what does this mean for progressive political strategies in Europe?
• Recognition: national working classes face different economic circumstances
• Either unity has to be create politically or develop national progressive strategies
• Demands to could create political unity (‘Proletarians of Europe, unite!’) – European system of minimum wages – Inflationary adjustment in reaction to debt and to cost
imbalances. (High wage growth in surplus countries – Wealth taxes

appendix

Manufacturing as % of value added
15
16
17
18
19
20
21
22
23
24
South (4)
North (3)
East (8)

Social expenditures as % GDP
0,0
5,0
10,0
15,0
20,0
25,0
30,0
35,0
1999 2000 2001 2002 2003 2004 2005 2006 2007 2008 2009
East
North
South

Wage dispersion in Germany and Spain
0
0,1
0,2
0,3
0,4
0,5
0,6
0,7
197
0
197
2
197
4
197
6
197
8
198
0
198
2
198
4
198
6
198
8
199
0
199
2
199
4
199
6
199
8
200
0
200
2
200
4
200
6
200
8
201
0
Germany
Spain


