147
ECONOMIC SURVEY 2007 - 2008 DEPARTMENT OF NATIONAL PLANNING MALE’, REPUBLIC OF MALDIVES
| Date post: | 01-Aug-2018 |
| Category: |
Documents |
| Upload: | nguyencong |
| View: | 213 times |
| Download: | 0 times |

ECONOMIC SURVEY 2007 - 2008
DEPARTMENT OF NATIONAL PLANNINGMALE’, REPUBLIC OF MALDIVES

Economic Survey, 2007-2008
3
Department of National Planning, Male’
FOREWORD
Strengthening of the Small and Medium Enterprises (SMEs), as a means to facilitate economic
diversification is one of the goals of the Strategic Action Plan (SAP) 2009-2013. In this regard, the
findings of this survey come at a timely moment and provide a valuable contribution to the understanding
of the performance of enterprises and establishments, operating in the economy.
Small establishments accounted for one fourth of the establishments, although they employed only 7% of
the private business workforce. Over half the firms were of medium size, and employed a third of the
workers. Large firms accounted for nearly 20% of the establishments but they employed over half the
workers.
Manufacturing industry dominates the economy with 38 percent of total establishments and employed 18
percent of the total private business workforce. It is the second largest employer with an average of 2
workers per establishment. This shows the strength of the small manufacturing establishments, in the
process of economic diversification.
Wholesale and retail trade industry had the second largest number of establishments but they employed
the highest number of workers. It highlights the dependence of small firms on imports as a means of
employment, in the already high import reliant economy.
Foreign workers amounted to one fourth of the workforce in the private sector, and one third of the
private sector workforce in Male'. Such high concentration of businesses and foreign workers in the
capital diverts the use of scarce land resources for business purposes. As such it becomes more
challenging to provide housing for the high proportion of residents, living in rented accommodation in the
already congested island.
During the survey process it also emphasised the urgent need for developing and maintaining an updated
list frame of all establishments in operation in the different islands of the country, with basic information
such as their major economic activities and employment by locals and foreigners. Such a list is essential
for proper representation of establishments engaged in different economic activities in business surveys,
reduce survey costs and minimise respondent burden.
With an overall response rate of 64% in the survey, it highlighted the need for increased awareness on the
importance of statistics, especially to convince large establishments to provide information for national
statistics. It is critical that reliable information on establishments be made available, to enable informed
policy decisions and for the sustainable development of the SMEs and the private sector.
I sincerely thank all the respondents to our survey for the valuable information you provided, and hope for
even better cooperation in future surveys, to increase the accuracy of national statistics. I urge all
stakeholders to make better use of statistics as we work hand in hand to create an enabling environment to
realise the national development goals as envisaged in the SAP.
Mr. Ali Hashim
Minister of Finance and Treasury

Economic Survey, 2007-2008
4
Department of National Planning, Male’
ACKNOWLEDGEMENTS
Publication of this document is only made possible through the timely and valuable contribution of
different public and private organizations and the respondents to our survey from selected
establishments and households. Hence, we gratefully acknowledge and thank them for the valuable
information provided and the cooperation extended by all the respondents to our survey. We would
like to thank the Ministry of Economic Development, Department of Inland Revenue and other
agencies who provided the list of establishments for use as survey frames. Our heartfelt appreciation
goes to the Steering Committee of the Economic Survey for their valuable inputs at the preparatory
stages of the survey. Furthermore, the technical support rendered by UNESCAP consultant Ms.
Margarita Guerrero, on the sampling aspect also deserves a special mention.
The high-school graduates involved as enumerators and staff of the Statistics Division of the
Department of National Planning (DNP) as supervisors deserves special recognition for their hard
work. The unrelenting effort of the staff of Statistics Division under considerable staff constraint is
highly commendable. In this regard, the significant contribution made by Mr. Idham Fahumy in
designing the sampling and managing the survey in collaboration with Ms. Mariyam Niyaf, Ms.
Aishath Aniya, Ms. Hidhaya Moosa and Ms. Mariyam Saba with support from all the staff of survey
and economic statistics section is duly recognized. Beside the development of the data entry program
and producing the final tables by Mr. Mushthaq Saeed, his contributions together with Ms. Fathimath
Nihan and Mr. Ahmed Rasheed is also acknowledged in the maintenance of the data-entry program
and data management.
Throughout the entire survey process Ms. Aishath Hassan, Ms. Zumlath Mohamed, Ms Aishath
Suzy, Ms. Fathimath Hashiya and Ms Shifaza Rasheed provided invaluable assistance. Support
provided by Ms. Ashiyath Shazna in questionnaire development and Mr. Yasir Hassan in enumerator
training is also worth mentioning. The support provided by Ms. Mariyam Niyaf, Ms. Aishath Laila,
Ms. Aishath Hassan and Ms. Fathimath Hana Mansoor in data cleaning is also duly recognized.
The analysis and report writing was carried out by Ms. Mariyam Niyaf and Ms. Aishath Laila. Our
gratitude also goes to the Administration and Finance Section of DNP, especially Mr. Mohamed
Rasheed, Mr. Abdul Rasheed and Ms. Naseema Moosa for their support and facilitation in the
smooth implementation of the survey operation.
Overall guidance and support throughout the survey process was provided by the senior management
of statistics division Mr. Fuwad Thowfeek and Ms. Aishath Shahuda under the leadership of Ms.
Rasheeda Ali and Mr. Hamdun Hameed.

Economic Survey, 2007-2008
5
Department of National Planning, Male’
CONTENTS
ACKNOWLEDGEMENT …………………………………………………………………………………………………………………………….4
REFERENCES .................................................................................................................................................. 7
LIST OF FIGURES ............................................................................................................................................ 7
LIST OF TABLES .............................................................................................................................................. 8
LIST OF ABBREVIATIONS AND ACRONYMS ................................................................................................... 9
Executive Summary……………………………………………………………………………………………………………………………….11
Chapter 1: Overview ……………………………………………………………………………………………………………………………..13
1.1 Objectives of the survey ................................................................................................................... 14
1.2 Scope and Coverage .......................................................................................................................... 14
1.3 Data collection .................................................................................................................................. 15
Chapter 2: Statistical Analysis ..................................................................................................................... 18
2.1 Coverage of Analysis ......................................................................................................................... 18
2.2 Economic Performance ..................................................................................................................... 19
2.3 Main Activities in the Economy ........................................................................................................ 23
2.4 Key Performance Ratio ..................................................................................................................... 25
2.5 Performance by Firm Size ................................................................................................................. 27
2.6 Main Business Costs .......................................................................................................................... 30
Chapter 3: Sampling Methodology ............................................................................................................. 31
3.1 Sample Frame .................................................................................................................................... 31
3.2 Stratification ...................................................................................................................................... 34
3.3 Sample Size and its Allocation .......................................................................................................... 35
3.4 Sample Allocations ............................................................................................................................ 41
Chapter 4: Weighting Procedures ............................................................................................................... 44
4.1 List frame Segment ........................................................................................................................... 44
Economic Survey, 2007-2008
6
Department of National Planning, Male’
4.2 Area frame segment ......................................................................................................................... 45
Annex 1: Concepts and Definitions ........................................................................................................... 1
Annex 2: Economic Survey Budget ........................................................................................................... 4
Annex 3: Questionnaire Design............................................................................................................... 13
Annex 4: Training .................................................................................................................................... 45
Annex 5: Field Operation ........................................................................................................................ 48
Annex 6: Coding and Data Entry ............................................................................................................. 58
Annex 7: internationalstandard industrial classification for all economic activities (ISIC) ..................... 61
Annex 8: Statistical Tables ...................................................................................................................... 78
Economic Survey, 2007-2008
7
Department of National Planning, Male’
REFERNCES
DNP 2003, Maldives Supply and Use Tables (SUT) 2003, Department of National Planning, Male‟,
Maldives
LIST OF FIGURES
Chart 1: Percentage share of Remuneration by Maldivians and Foreigners ........................ 21
Chart 2: Number of Establishment and Employment ............................................................ 24
Chart 3: Operating Receipts and Value Added, (monthly) .................................................... 24
Chart 4: Profitability Ratios, (monthly) ................................................................................... 25
Chart 5: Earnings-Expenditure Ratio, (monthly).................................................................... 26
Chart 6: Average Annual Remuneration per Employee ......................................................... 26
Chart 7: Value Added per worker, (monthly).......................................................................... 27
Chart 8: Establishments and Employment by Size ................................................................. 28

Economic Survey, 2007-2008
8
Department of National Planning, Male’
LIST OF TABLES
Table 1: Employment and establishment share by industry .................................................. 18
Table 2: Some Key Economic Indicators, by locality, (Monthly) ........................................... 19
Table 3: Employment per establishment and Average Annual Remuneration .................... 20
Table 4: Economic performance by industry, (Monthly)........................................................ 21
Table 5: Economic performance of establishments by sector/industry, (Monthly) .............. 23
Table 6: Percentage share of operating receipts and Value Added ....................................... 25
Table 7: Establishments & Employment by Firm size ............................................................ 27
Table 8: Operating Receipts, operating expenditure, profit, operating surplus & value
added by Firm size ...................................................................................................................... 27
Table 9: Manufacturing Sector Establishments, Employment by Firm size ........................ 29
Table 10: Main Business Costs by Activity .............................................................................. 30
Table 11: Summary of the information gathered from other ministries ............................... 32
Table 12: Number of Households, Enumeration Blocks and Self Employed by Development
Regions ………………………………………………………………………………………….33
Table 13: Population and Sample of Enumeration Areas ....................................................... 35
Table 14: Survey Sample Size and Response Rate .................................................................. 39
Table 15: Non-response Rate by Atoll ...................................................................................... 40
Table 16: List segment for Islands with the domains by status .............................................. 41
Table 17: List segment for Male’ with the domains by status ................................................ 42

Economic Survey, 2007-2008
9
Department of National Planning, Male’
LIST OF ABBREVIATIONS AND ACRONYMS
ES Economic Survey
HIES Household Income and Expenditure Survey
LES Large Establishment Survey
SES Small Establishment Survey
SUT Supply and Use Tables
VA Value Added
GDP Gross Domestic Product
Rf Rufiyaa
PPI Producer Price Index
IIP Production Index
PSU Primary Sampling Unit
USU Secondary Sampling Unit
DNP Department of National Planning
SD Statistics Division
ADB Asian Development Bank
NGO Non-Governmental Organizations
MoED Ministry of Economic Development
DIR Department of Inland Revenue
MOE Ministry of Education
MOTC Ministry of Tourism, Arts and Culture
MOH Ministry of Health
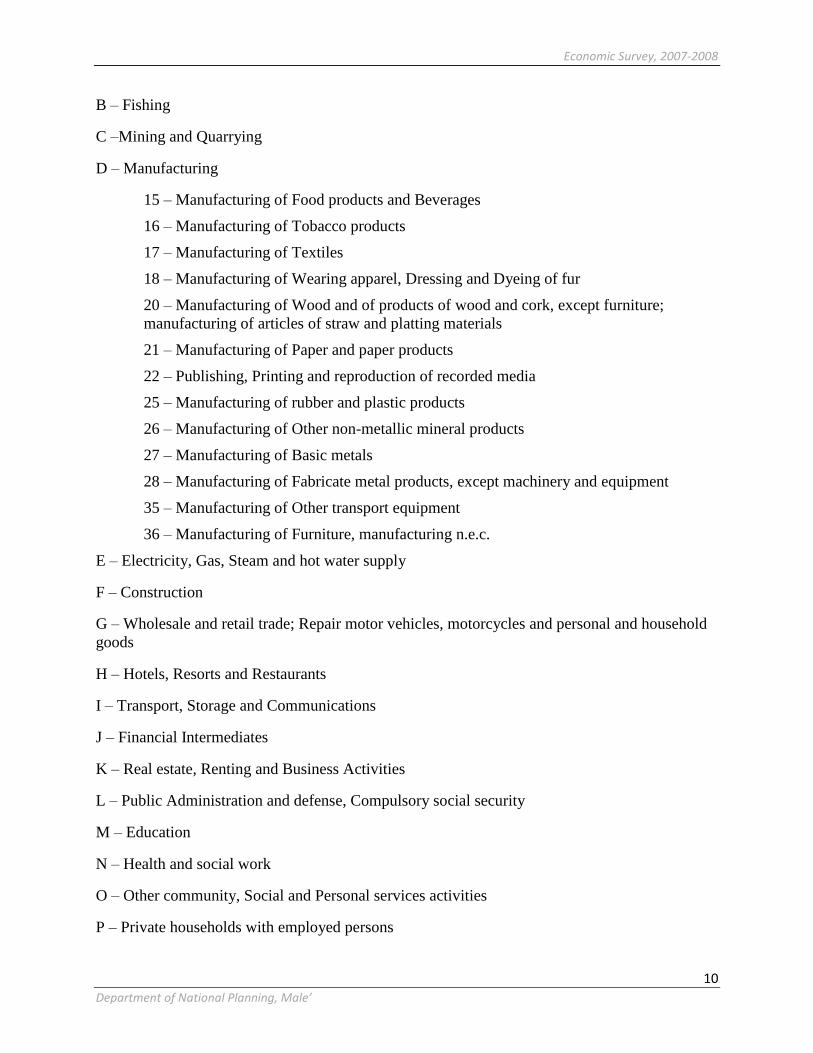
ISIC International Standard Industrial Classification
A – Agriculture
Economic Survey, 2007-2008
10
Department of National Planning, Male’
B – Fishing
C –Mining and Quarrying
D – Manufacturing
15 – Manufacturing of Food products and Beverages
16 – Manufacturing of Tobacco products
17 – Manufacturing of Textiles
18 – Manufacturing of Wearing apparel, Dressing and Dyeing of fur
20 – Manufacturing of Wood and of products of wood and cork, except furniture;
manufacturing of articles of straw and platting materials
21 – Manufacturing of Paper and paper products
22 – Publishing, Printing and reproduction of recorded media
25 – Manufacturing of rubber and plastic products
26 – Manufacturing of Other non-metallic mineral products
27 – Manufacturing of Basic metals
28 – Manufacturing of Fabricate metal products, except machinery and equipment
35 – Manufacturing of Other transport equipment
36 – Manufacturing of Furniture, manufacturing n.e.c.
E – Electricity, Gas, Steam and hot water supply
F – Construction
G – Wholesale and retail trade; Repair motor vehicles, motorcycles and personal and household
goods
H – Hotels, Resorts and Restaurants
I – Transport, Storage and Communications
J – Financial Intermediates
K – Real estate, Renting and Business Activities
L – Public Administration and defense, Compulsory social security
M – Education
N – Health and social work
O – Other community, Social and Personal services activities
P – Private households with employed persons
Economic Survey, 2007-2008
11
Department of National Planning, Male’
EXECUTIVE SUMMARY
The Economic Survey (ES) 2007/2008 is the first nation wide economic survey conducted in the
Maldives integrating all economic entities of production units in the country, exclusively funded
by the government. The survey covers corporate sector establishments, small establishments and
all the economic activities undertaken by households with some market output, which includes
goods and services produced to be exchanged in the market to generate income for households .
The main objective of Economic survey is to collect information on the performance of different
industries and their contribution to the Gross Domestic Product (GDP) of Maldives. It will also
be used in obtaining weights for the compilation of production and price indices and for
monitoring the achievements of the government‟s strategic action plan.
Data collection of the Economic Survey was done in Male' and 47 islands. From each 20 atoll 2
islands, including atoll capital and one other island were selected. In addition 7 islands
specializing in specific economic activities were included in the survey.
The reference period of this survey was the calendar year 2007. In the case of household
activities and for small establishments who do not maintain proper accounting records, the
reference period was the past month which was later raised to the number of months in operation
during the year. The data collection of the survey lasted for a period of 11 months from
November 2007 till September 2008. A total of 117 enumerators and supervisors were involved
in the data collection operation.
Information collected from the survey include: characteristics of the establishment; employment
and remuneration; principal economic activity; main products produced and services provided by
the establishment; incomes and expenditures; purchases of fixed assets and general questions on
the establishment.
Data collection of ES was taken using a list frame and an area frame. In case of list frame, a pre-
identified list of establishments were given, while in case of area frame only a block or area was
pre-identified. In case of the area based sample, before proceeding with the questionnaire,

Economic Survey, 2007-2008
12
Department of National Planning, Male’
enumerators had to carry out a listing of all structures in the sample blocks and identify the
economic activity units.
Sample frame of the Economic Survey was based on 2 segments namely, list frame segment and
area frame segment. The main purpose of having these two approaches was to ensure that
economic activities undertaken by major corporations and establishments on a large scale was
captured properly. The Sample was drawn based on these 5 development regions, i.e. North,
Central North, Centre, Central South and South.
A total of 8,146 establishments comprising of 2,976 establishments in the Area frame segment
and 5,170 establishments in List frame segment were included in the initial sample. The
responses rate of the survey was 64 percent.
The results showed that small establishments accounted for one fourth of the establishments,
although they employed only 7% of the private business workforce. Over half the firms were of
medium size, and employed a third of the workers. Large firms accounted for nearly 20% of the
establishments but they employed over half the workers.
Manufacturing industry dominates the economy with 38 percent of total establishments and
employed 18 percent of the total private business workforce. It is the second largest employer
with an average of 2 workers per establishment. Wholesale and retail trade industry had the
second largest number of establishments but they employed the highest number of workers.
Foreign workers amounted to one fourth of the workforce in the private sector, and one third of
the private sector workforce in Male'.
The results obtained from this survey would be very useful for guiding private sector
development and for investors. We hope that individual businesses will use the survey to gauge
the performance of their establishment vis a vi that of the industry and national averages.
Economic survey is planned to be conducted in five year intervals.

Economic Survey, 2007-2008
13
Department of National Planning, Male’
Chapter 1: Overview
The Economic Survey (ES) 2007 is the first nation wide economic survey conducted in the
Maldives integrating all economic entities of production units in the country. The survey
integrates all the activities carried out in establishments including the incorporated and
unincorporated establishments in addition to as the household activities with some market
production.
The Statistics Division of the Department of National Planning (DNP) is working towards
creating a statistical system capable of producing timely, relevant and reliable statistics on
economic activities in the country. In this regard several statistical activities have been carried
out under three projects implemented with technical assistance from the Asian Development
Bank (ADB) to improve the national accounts statistics of the country. Two major economic
surveys namely Large Establishment Survey (LES) and Small Establishment Survey (SES) were
initiated under these projects. Both these surveys were designed in a way that complement each
other and provide output and input data of production units.
Large Establishment Survey (LES) focuses on the corporate sector establishments and was first
launched in 2000 (on a pilot basis) and conducted on an annual basis afterwards.
Small Establishment Survey (SES) on the other hand focuses on unincorporated establishments
and home based economic activities undertaken within the household for income generation.
These activities were captured in SES using an area frame. The first SES was conducted in 1999
(on a pilot basis) while the second SES was conducted in 2002/03 together with the Household
Income and Expenditure Survey (HIES). The 2002/03 SES was restricted to unincorporated
establishments operating in a fixed location, which was identifiable, while the home based
income generating economic activities carried within the households were captured as part of the
HIES.
LES was used the list of companies registered as a frame even though this frame was not up to
dated. There were issues of registered companies not being in operation, difficulty in finding the
company in the registered location, contact information of the company/establishment not being
accurate and many more. Hence, the available frame used for the survey was incomplete and
insufficient as a proper frame.
O
V
E
R
V
I
E
W
Economic Survey, 2007-2008
14
Department of National Planning, Male’
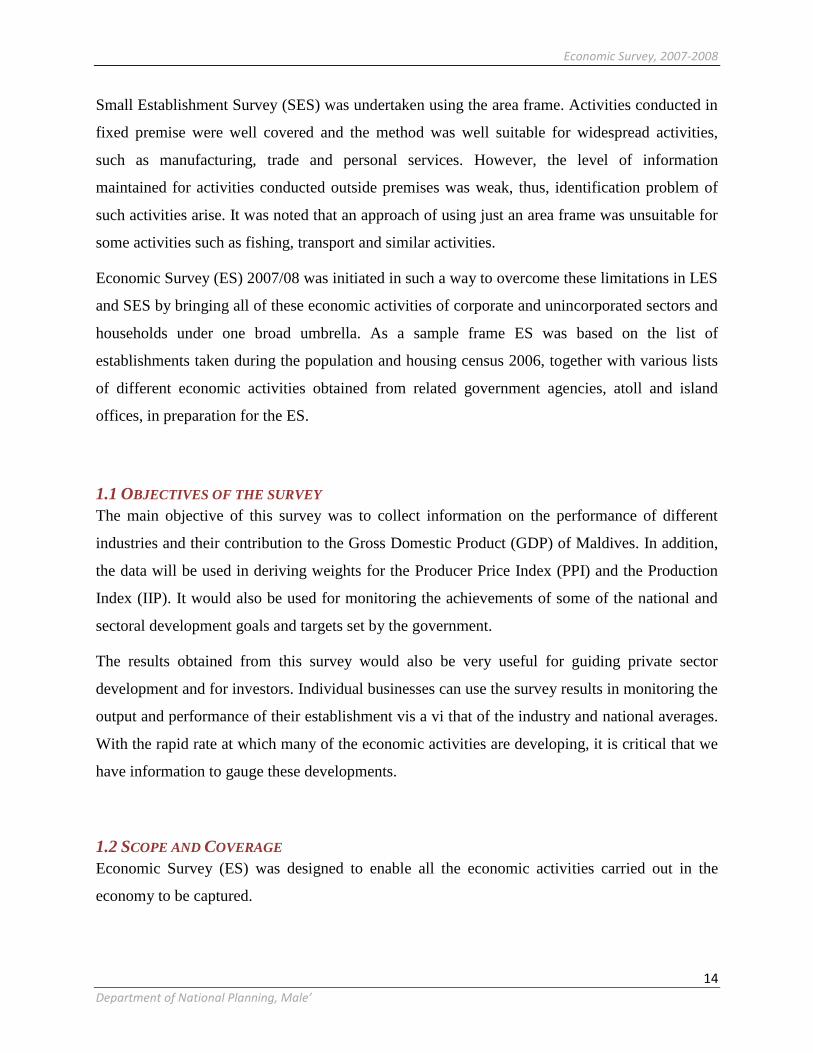
Small Establishment Survey (SES) was undertaken using the area frame. Activities conducted in
fixed premise were well covered and the method was well suitable for widespread activities,
such as manufacturing, trade and personal services. However, the level of information
maintained for activities conducted outside premises was weak, thus, identification problem of
such activities arise. It was noted that an approach of using just an area frame was unsuitable for
some activities such as fishing, transport and similar activities.
Economic Survey (ES) 2007/08 was initiated in such a way to overcome these limitations in LES
and SES by bringing all of these economic activities of corporate and unincorporated sectors and
households under one broad umbrella. As a sample frame ES was based on the list of
establishments taken during the population and housing census 2006, together with various lists
of different economic activities obtained from related government agencies, atoll and island
offices, in preparation for the ES.
1.1 OBJECTIVES OF THE SURVEY
The main objective of this survey was to collect information on the performance of different
industries and their contribution to the Gross Domestic Product (GDP) of Maldives. In addition,
the data will be used in deriving weights for the Producer Price Index (PPI) and the Production
Index (IIP). It would also be used for monitoring the achievements of some of the national and
sectoral development goals and targets set by the government.
The results obtained from this survey would also be very useful for guiding private sector
development and for investors. Individual businesses can use the survey results in monitoring the
output and performance of their establishment vis a vi that of the industry and national averages.
With the rapid rate at which many of the economic activities are developing, it is critical that we
have information to gauge these developments.
1.2 SCOPE AND COVERAGE
Economic Survey (ES) was designed to enable all the economic activities carried out in the
economy to be captured.
Economic Survey, 2007-2008
15
Department of National Planning, Male’
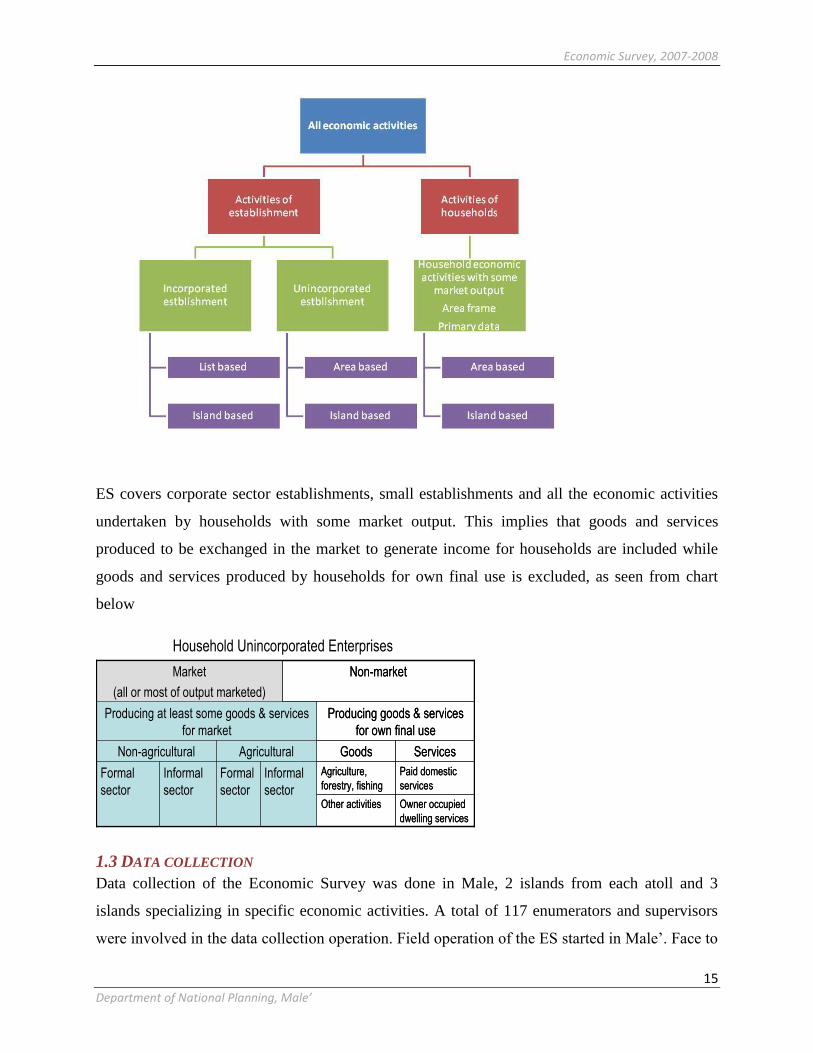
ES covers corporate sector establishments, small establishments and all the economic activities
undertaken by households with some market output. This implies that goods and services
produced to be exchanged in the market to generate income for households are included while
goods and services produced by households for own final use is excluded, as seen from chart
below
Non-marketMarket
(all or most of output marketed)
Informal
sector
Formal
sector
Informal
sectorOwner occupied
dwelling services
Other activities
Paid domestic
services
ServicesAgricultural
Agriculture,
forestry, fishingFormal
sector
Producing goods & services
for own final use
GoodsNon-agricultural
Producing at least some goods & services
for market
Household Unincorporated Enterprises
Starting point for data collection
1.3 DATA COLLECTION
Data collection of the Economic Survey was done in Male, 2 islands from each atoll and 3
islands specializing in specific economic activities. A total of 117 enumerators and supervisors
were involved in the data collection operation. Field operation of the ES started in Male‟. Face to

Economic Survey, 2007-2008
16
Department of National Planning, Male’
face interview method and post were adopted with a pre-designed questionnaire. The data
collection period of the survey was from November 2007 to September 2008. Field operation
was carried out regularly except for Fridays from around 9:00 till 17:00.
A common questionnaire was designed to collect the information for all economic activities. A
total of 40 questions were included in 10 different sections in the questionnaire. As it is a general
questionnaire, each establishments need not to fill all of the 40 questions. They only needed to
fill the sections which were relevant to their particular industry or economic activity.
Information collected from the survey include: characteristics of the establishment; employment
and remuneration; principal economic activity; main products produced and services provided by
the establishment; incomes and expenditures; purchases of fixed assets and general questions on
the establishment. The reference period of this survey is the calendar year 2007. However in the
case of household activities and for small establishments who do not maintain proper accounting
records, the reference period is the last month of operation which will finally be raised to the
number of months in operation during 2007.
Data collection of ES was taken using a list frame and an area frame. In case of list frame, a pre-
identified list of establishments were given, while in case of area frame only a block or area was
pre-identified. In case of the area based sample, before proceeding with the questionnaire,
enumerators had to carry out a listing of all structures in the sample blocks and identify the
economic activity units. Furthermore, these listings were compared with the lists of
establishments in the list frame to avoid duplications. If the same establishment was repeated in
both the frames, the data was captured in the list based segment. Moreover, to avoid any
omission or duplication in area frame, enumerators were provided with a Census Enumeration
Block (EB) maps and strictly asked to enumerate only those economic activities/entities within
the sample area.
In the case of area frame, for activities such as manufacturing, construction, trade and services it
was absolutely necessary that questionnaire were filled exclusively for establishments located
within the sample area irrespective of the place of the owner or proprietor. For agriculture and
forestry, individual teachers and informal health activities were filled from the household
Economic Survey, 2007-2008
17
Department of National Planning, Male’
members while for the list based segment, questionnaires were filled from their respective
establishments. More details on data collection are available on annex 6.

Economic Survey, 2007-2008
18
Department of National Planning, Male’
CHAPTER 2: STATISTICAL ANALYSIS
2.1 COVERAGE OF ANALYSIS
The Maldivian economy however small is diverse in nature and encompasses a wide range of
economic activities conducted by the population. However, large populations of establishments
are concentrated in a few sectors like Fisheries, Manufacturing, Construction, Resorts, and
Transport. The analysis presented in the following sections is based on data collected for the
Economic Survey 2007 from 6183 establishments; which was finally raised to the whole
economy (41,550 establishments), conducted by the Department of National Planning.
The detail analysis focuses primarily on the economic performance of the establishments
focusing largely on the main sectors in terms of employment in the economy excluding the
Wholesale and Retail sector. The sectors selected for the analysis accounts for more than 75% of
the total employment and 70% of establishments in the economy. The sectors are Agriculture
(A), Fishing (B), Manufacturing (D), Construction (F), Resorts, Hotels and Restaurants (H),
Transport, Storage & Communications (I), Business activities (K) and Other community, Social
and Personal services (O). In addition to these sectors the analysis also includes Financial
Intermediaries (J) as this sector is the most profitable sector in the economy.
Before going to detail analysis, a snapshot of the economy as a whole is presented in Part II.
Table 1: Employment and establishment share by industry
Industry Establishment % share of establishments Employment % share of employment
A 4,506 11 9,940 5
B 2,355 6 13,648 7
C 117 0 271 0
D 15,881 38 35,018 18
E 128 0 1,638 1
F 1,638 4 18,500 10
G 9,334 22 37,151 19
H 707 2 31,108 16
I 1,988 5 20,805 11
J 24 0 1,122 1
K 2,511 6 5,964 3
L1 7 0 357 0
M 1,131 3 4,387 2
N 163 0 1,877 1
1 General Public services in this survey consists of ISIC 7523, Fire fighting and fire-prevention activities.
S
T
A
T
I
S
T
I
C
A
L
A
N
A
L
Y
S
I
S

Economic Survey, 2007-2008
19
Department of National Planning, Male’
O 1,057 3 9,686 5
P 4 0 42 0
Total 41,550 100 191,515 100
Wholesale and retails sector (G) employed 37,151 workers which accounted for 19 percent of
private sector jobs and 22% of establishments in the economy. The analysis of Wholesale and
retails sector will be done separately and published in a different report.
2.2 ECONOMIC PERFORMANCE
Table 2: Some Key Economic Indicators, by locality, (Monthly)
National Male' Atolls
Number of establishments 41,550 8,035 33,515
Employment Numbers
Maldivian 145,457 47,748 97,709
Foreign 46,058 22,832 23,226
Total Remuneration (Million Rufiyaa) 792.93 354.79 438.13
Operating Income Receipts (Million
Rufiyaa)*
5,240.06 2,714.33 2,525.73
Operating Expenditures (Million
Rufiyaa)*
3,833.34 2,010.68 1,822.66
Profits (Million Rufiyaa)* 1,406.72 703.64 703.08
Value Added (Million Rufiyaa)* 2,497.60 1,054.06 1,443.54
* Excludes Wholesale and Retail Trade
In 2007 there were 41,550 establishments in the economy employing 191,515 of which 76% was
locals and 24% foreigners. On average there were 5 workers per establishment. The 8,035
private business establishments in Male‟ employed 70,580 (47,748 Maldivians & 22,832
Foreigners) workers paying nearly Rf. 4.3 billion as compensations in 2007. In Atoll, there were
33,515 private business establishments employing 120,935 (97,709 Maldivians & 23,226
Foreigners) workers and paid nearly Rf. 5.3 billion as compensation in 2007.
Manufacturing (D) was the most dominant industry in the economy in terms of number of
establishment engaged in the activity, accounting for about 38 percent of total establishments as
seen from Table 1. They employed 18 percent of the total private business workforce, making
them the second largest employer with an average employment size of 2 workers per
establishment a slightly lower value than the overall average of 5 workers.

Economic Survey, 2007-2008
20
Department of National Planning, Male’
Table 3: Employment per establishment and Average Annual Remuneration
Industry Establishment Employment Employment per
establishment
Annual Remuneration
Average Annual Remuneration per employee
A 4,506 9,940 2 14,163,488 1,424.97
B 2,355 13,648 6 981,633,957 71,923.80
C 117 271 2 5,726,040 21,142.56
D 15,881 35,018 2 541,896,679 15,474.73
E 128 1,638 13 99,015,064 60,451.71
F 1,638 18,500 11 1,234,888,249 66,750.54
G 9,334 37,151 4 1,148,757,689 123,076.55
H 707 31,108 44 2,186,774,602 70,295.15
I 1,988 20,805 10 1,741,128,998 83,686.44
J 24 1,122 47 110,591,106 98,578.35
K 2,511 5,964 2 185,497,960 31,101.17
L 7 357 51 19,443,648 54,464.00
M 1,131 4,387 4 84,142,156 19,178.14
N 163 1,877 11 119,978,334 63,917.20
O 1,057 9,686 9 1,039,252,324 107,292.94
P 4 42 11 2,233,200 53,171.43
Total 41,550 191,515 5 9,515,123,433 49,683.39
On a per establishment basis, the largest employer was General public services1 (L), hiring an
average of 51 workers, followed by Financial Intermediaries (J) (average of 47 workers) and
Resort, hotels and restaurants (H), hiring an average of 44 workers. On the other hand,
Manufacturing (D), Business Activities (K), Agriculture (A), and Mining and quarrying (C) had
the lowest average employment of 2 workers.
Average Annual Remuneration per Employee in Male‟ was Rf. 98,578 for employees working
in Financial Intermediaries (J) sector in 2007, making them the highest remuneration paying
sector in the capital city (Male‟). However, in Atoll, as well as whole economy wise, Other
community, Social and Personal services (O) sector paid the highest average annual
remuneration per employee, Rf. 120,625 and 107, 293 in atolls and whole economy respectively.
This was followed by Construction (F) (Rf. 80,292) and Hotel, Resort and Restaurant (H) (Rf.
78,024) in atolls. Agriculture (A) sector paid (Rf. 1,356) the lowest average annual remuneration
per employee in atolls.

Economic Survey, 2007-2008
21
Department of National Planning, Male’
Chart 1: Percentage share of Remuneration by Maldivians and Foreigners
Overall, locals were paid higher than foreigners except for the Agriculture (A), Resorts, Hotels
and Restaurants (H), Health and Social work (N) and Other community, Social and Personal
services (O) sectors.
Table 4: Economic performance by industry, (Monthly)
Industry
Operating receipts Operating
expenditure
Profit Operating
surplus
Value added
A 10,629,636 3,874,221 6,755,414 6,755,414 7,991,771
B 225,177,363 142,485,234 82,692,129 82,692,129 165,559,599
C 1,067,442 722,732 344,710 344,710 821,880
D 328,831,148 253,287,374 75,543,775 78,475,905 127,258,931
E 122,272,204 124,573,801 -2,301,597 5,007,353 21,591,481
F 859,216,444 306,127,900 553,088,544 556,199,582 660,095,630
H 1,490,152,322 1,335,515,004 154,637,318 272,135,320 643,507,242
I 1,427,577,811 1,172,698,318 254,879,492 292,561,192 480,138,235
J 216,607,249 92,172,640 124,434,609 138,154,119 93,580,213
K 166,267,903 88,785,350 77,482,553 81,830,353 95,468,273
L 7,233,331 6,008,331 1,225,000 1,274,581 2,894,885
M 15,264,956 12,097,178 3,167,779 3,452,046 10,629,054
N 64,781,426 26,797,689 37,983,737 39,289,645 49,982,762
O 304,104,596 267,430,992 36,673,604 42,190,952 137,778,589
P 878,420 767,095 111,325 111,325 297,425
Total* 5,240,062,250 3,833,343,859 1,406,718,391 1,600,474,626 2,497,595,969
* Excludes Wholesale and Retail Trade
Economic Survey, 2007-2008
22
Department of National Planning, Male’
Total income receipts of the economy stood at Rf. 5.2 billion per month in 2007 and this value
was divided between Male‟ and the Atolls at 52% and 48% respectively. Establishments in the
Resorts, Hotels and Restaurant (H) industry received the highest incomes receipts among the
different sectors accounting for about 28% while Transport, Storage & Communications (I),
sector followed very close with 27%. The lowest incomes/revenues were received for
establishments engaged in ISIC sector Private Households with employed persons (P). However,
this phenomenon differs in the localities.
In Male‟ about half of the revenues accrued to those establishments in the Transport, Storage &
Communications (I) sector, which was followed by Construction (F) sector and then Resorts,
Hotel and Restaurant (H) sector with 12% and 9% respectively. However, in the Atolls the main
sector according to income generation was Resorts, Hotel and Restaurant (H) sector accruing
about half the total income received to those establishments in the atolls, followed by those
engaged in Construction (F) industry.
Total operating expenditures incurred for the whole economy was Rf. 3.8 billion per month,
depicting similar distribution of expenditure shared between Male‟ and Atolls, as was the case
for income. Establishments engaged in Resorts, Hotels and Restaurants (H) incurred the highest
expenditures accounting for about Rf. 1.34 billion per month, with second highest being
establishments engaged in Transport, Storage & Communications (I) sector with Rf. 1.17 billion
per month. Lowest expenditures were incurred by those establishments engaged in Mining and
Quarrying (C) sector with Rf. 772,732 per month.
Operating expenditures vastly differed in the localities. In Male‟ Transport, Storage &
Communications (I) sector spent about 1 billion per month as expenditures in 2007 while the
second largest was the Construction (F) with 203 million per month. Agriculture (A) sector
incurred the lowest expenditures in Male‟. However, in the atolls Rf. 1 billion per month was
incurred as expenditures by the Resorts, Hotels and Restaurants (H) sector with Other
Community, Social and Personal service (O) activities following with Rf. 205 million per month.
Education (M) sector incurred the lowest expenditures in the Atolls with Rf. 0.4 million per
month.
Total profits generated amounted to Rf. 1.4 billion per month, where profits were again largely
divided equally between Male‟ and the Atolls. Sector with the highest profit is the Construction
(F) sector generating a little less than 40% of the total profits. Electricity, water and gas
production (E) sector incurs a loss of about Rf. 2 million per month. However, this loss is for
Male‟ only, while for Atolls the sector incurs a profit of about 8.5 million per month.
Establishments engaged in Transport, Storage & Communications (I) sector generates the highest
profit in Male‟, of about 0.2 billion per month while the lowest accrues to Agriculture (A) Sector
which is hardly existent in Male‟. However, in the Atolls establishments engaged in the
Construction (F) sector generate little more than 60% of profits accrued to establishments in the
Economic Survey, 2007-2008
23
Department of National Planning, Male’
atolls. Establishments operating in the atolls engaged in business activities are largely operating
at a loss.
Total operating surplus generated amounted to 19.2 billion in 2007. Operating surplus per
establishment generated amounted to Rf. 596,142 in 2007.
Net value added rose from Rf 10.5 billion in 2003 (Supply and Use table 2003, excluding
Wholesale and retail trade) to Rf. 29 billion (excluding Wholesale and retail trade) in 2007
representing an increase of 176 percent. On a per establishment basis, value added per
establishment is Rf. 930,300 in 2007.
2.3 MAIN ACTIVITIES IN THE ECONOMY
From here in the report would focus on some major sectors of the economy, as highlighted in the
beginning of this report.
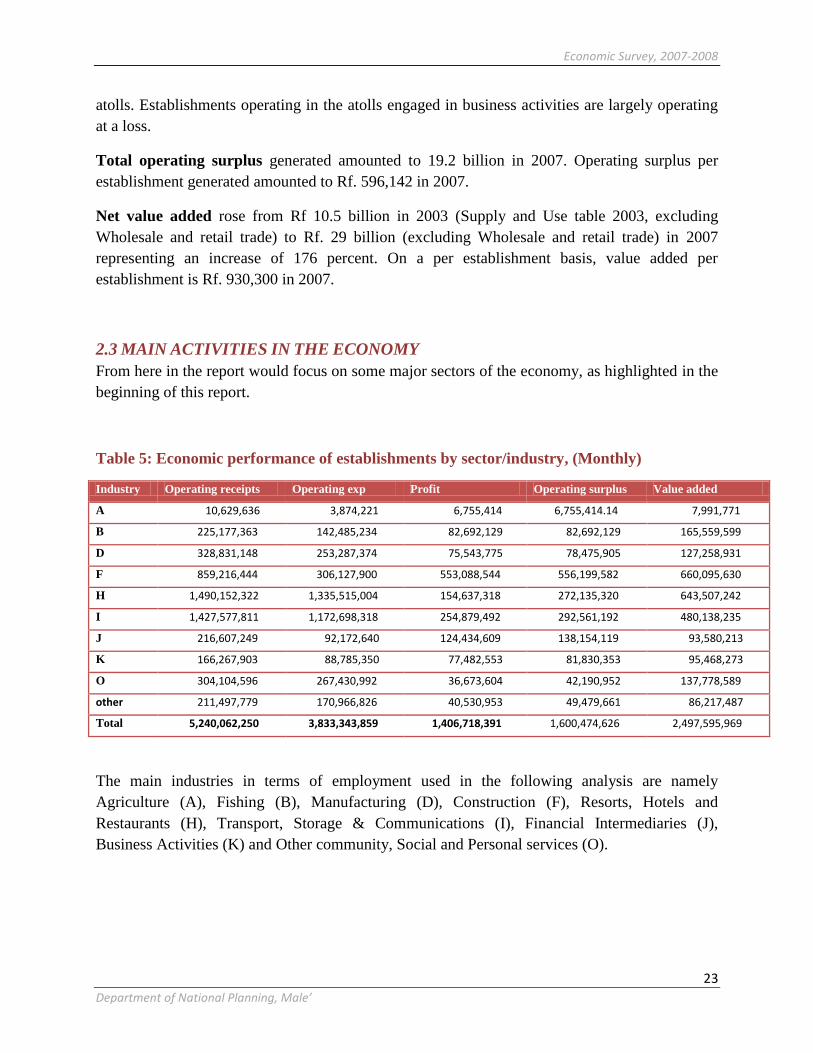
Table 5: Economic performance of establishments by sector/industry, (Monthly)
Industry Operating receipts Operating exp Profit Operating surplus Value added
A 10,629,636 3,874,221 6,755,414 6,755,414.14 7,991,771
B 225,177,363 142,485,234 82,692,129 82,692,129 165,559,599
D 328,831,148 253,287,374 75,543,775 78,475,905 127,258,931
F 859,216,444 306,127,900 553,088,544 556,199,582 660,095,630
H 1,490,152,322 1,335,515,004 154,637,318 272,135,320 643,507,242
I 1,427,577,811 1,172,698,318 254,879,492 292,561,192 480,138,235
J 216,607,249 92,172,640 124,434,609 138,154,119 93,580,213
K 166,267,903 88,785,350 77,482,553 81,830,353 95,468,273
O 304,104,596 267,430,992 36,673,604 42,190,952 137,778,589
other 211,497,779 170,966,826 40,530,953 49,479,661 86,217,487
Total 5,240,062,250 3,833,343,859 1,406,718,391 1,600,474,626 2,497,595,969
The main industries in terms of employment used in the following analysis are namely
Agriculture (A), Fishing (B), Manufacturing (D), Construction (F), Resorts, Hotels and
Restaurants (H), Transport, Storage & Communications (I), Financial Intermediaries (J),
Business Activities (K) and Other community, Social and Personal services (O).

Economic Survey, 2007-2008
24
Department of National Planning, Male’
Chart 2: Number of Establishment and Employment
On a per establishment basis, the largest employer was Financial Intermediaries (J) employing an
average of 47 workers, followed by Resorts, Hotels and Restaurants (H) employing an average of
44 workers. On the other hand, manufacturing (D) sector had the lowest average employment
size of 2 workers.
Chart 3: Operating Receipts and Value Added, (monthly)

Economic Survey, 2007-2008
25
Department of National Planning, Male’
Table 6: Percentage share of operating receipts and Value Added
Resorts, Hotels and Restaurants (H) accounted for
the largest share of 28% of the total operating
receipts collected and the industry‟s value added of
643 million accounted for 26% of the economy.
Transport, Storage & Communications (I) followed
second with 27% of total operating receipt collected
with the industry‟s value added 480 million; lower
than Construction (F) sector value added 660 million
while Construction (F) sector followed third in
operating receipts due to Transport, Storage &
Communications (I) sector‟s higher operating
expenditure compared to that of Construction (F).
2.4 KEY PERFORMANCE RATIOS
Chart 4: Profitability Ratios, (monthly)
Profitability ratio shows the proportion of operating receipts that was converted to profits. The
highest profitability ratios were attained by Construction (F), Agriculture (A) and Financial
intermediaries (J) with 65% and 64% and 64% respectively. Other community, Social and
Industry % share of Operating Receipts
% share of Value Added
A 0.20 0.32
B 4.30 6.63
D 6.28 5.10
F 16.40 26.43
H 28.44 25.77
I 27.24 19.22
J 4.13 3.75
K 3.17 3.82
O 5.80 5.52
Economic Survey, 2007-2008
26
Department of National Planning, Male’
Personal services (O) recorded the lowest profitability ratio of 14%. The remaining industries
attained a profitability ratio between 18% and 49%.
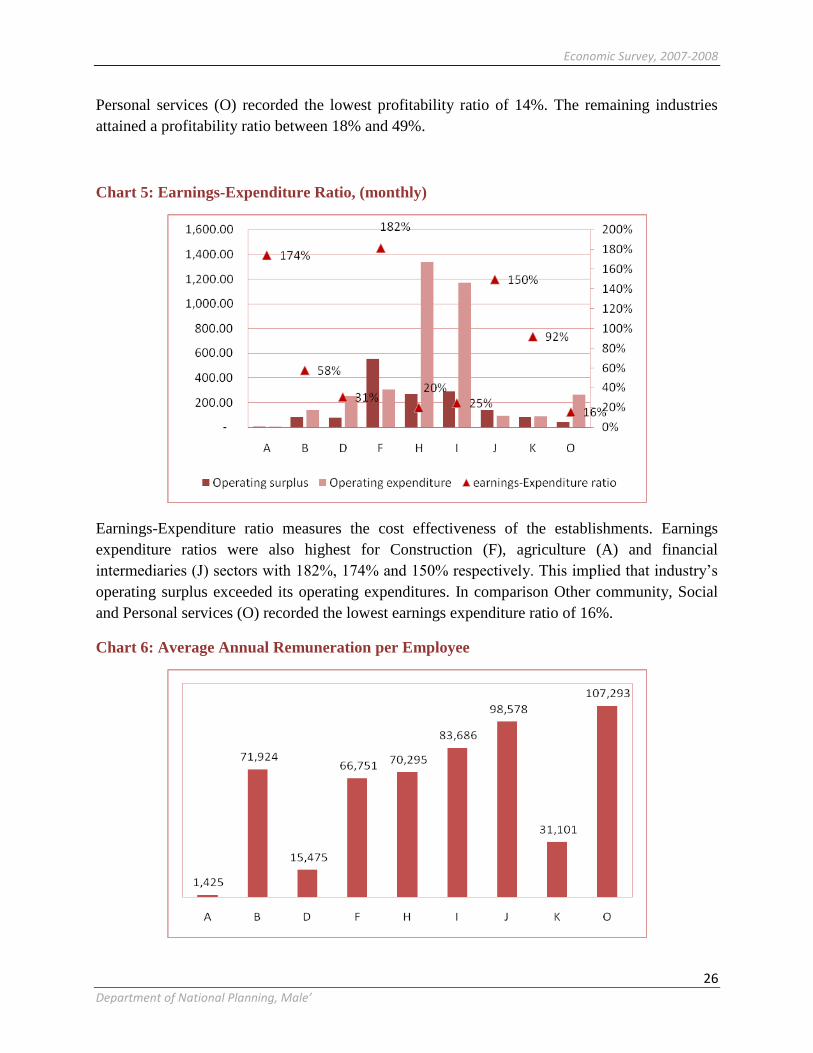
Chart 5: Earnings-Expenditure Ratio, (monthly)
Earnings-Expenditure ratio measures the cost effectiveness of the establishments. Earnings
expenditure ratios were also highest for Construction (F), agriculture (A) and financial
intermediaries (J) sectors with 182%, 174% and 150% respectively. This implied that industry‟s
operating surplus exceeded its operating expenditures. In comparison Other community, Social
and Personal services (O) recorded the lowest earnings expenditure ratio of 16%.
Chart 6: Average Annual Remuneration per Employee

Economic Survey, 2007-2008
27
Department of National Planning, Male’
Average annual remuneration per employee was highest in other community, social and personal
(O) services amounting to Rf. 107,293. Employees in Agriculture (A) sector received the lowest
average remuneration of Rf. 1,425. The scenario changes when locality is added.
Chart 7: Value Added per worker, (monthly)
Value added per worker was highest in the financial intermediaries (J) sector amounting to Rf.
83,415 while the next closest sector was at Rf. 35,681 which was Construction (F) sector.
Agriculture (A) sector recorded the lowest value added amounting to Rf. 804.
2.5 PERFORMANCE BY FIRM SIZE
Table 7: Establishments & Employment by Firm size
Firm Size Estabs Emp
Less than 10 7,912 10,709
10 - 99 18,050 47,081
100 and above 6,239 96,574
NS 15 -
Total 32,217 154,364
Table 8: Operating Receipts, operating expenditure, profit, operating surplus & value
added by Firm size
In (Rf. '000) , Monthly
Firm Size Operating receipts
Operating exp
Profit Op. surplus Value added
Less than 10 102,797 44,617 58,180 58,293 69,107
10 - 99 954,237 618,580 335,657 350,765 407,903
100 and above 4,182,993 3,170,123 1,012,870 1,191,405 2,020,560
Not Specified 35 23 12 12 27
Total 5,240,062 3,833,344 1,406,718 1,600,475 2,497,596
Economic Survey, 2007-2008
28
Department of National Planning, Male’
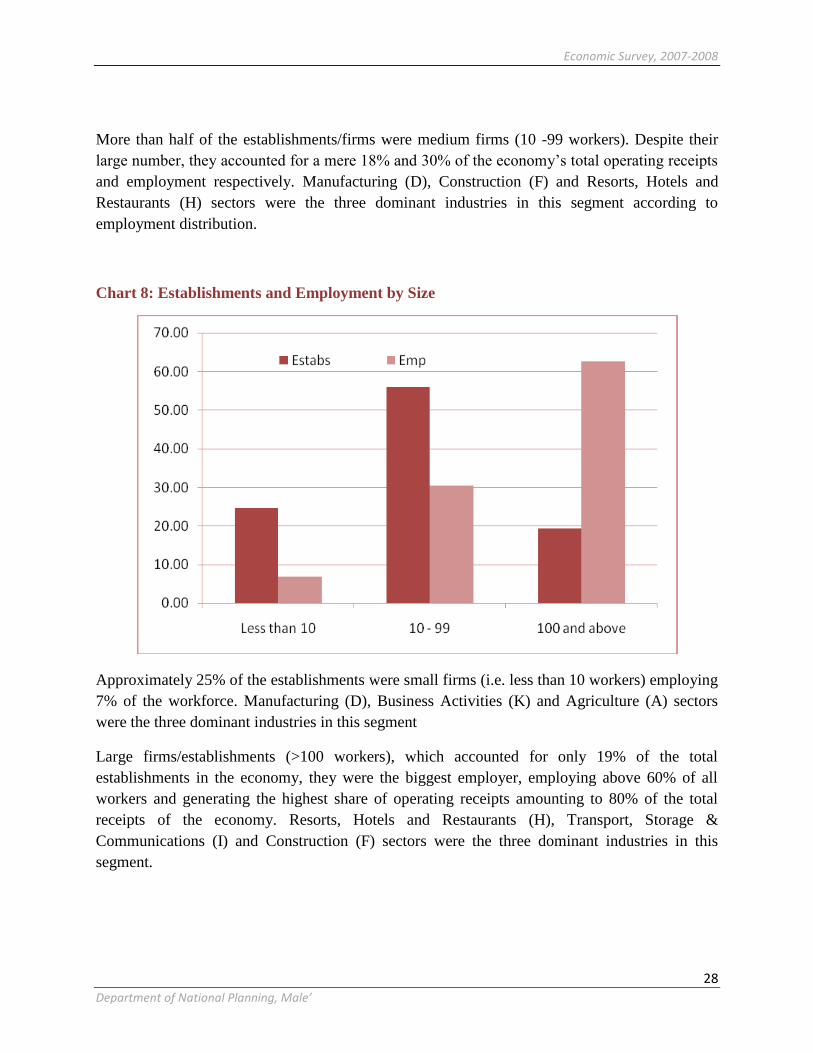
More than half of the establishments/firms were medium firms (10 -99 workers). Despite their
large number, they accounted for a mere 18% and 30% of the economy‟s total operating receipts
and employment respectively. Manufacturing (D), Construction (F) and Resorts, Hotels and
Restaurants (H) sectors were the three dominant industries in this segment according to
employment distribution.
Chart 8: Establishments and Employment by Size
Approximately 25% of the establishments were small firms (i.e. less than 10 workers) employing
7% of the workforce. Manufacturing (D), Business Activities (K) and Agriculture (A) sectors
were the three dominant industries in this segment
Large firms/establishments (>100 workers), which accounted for only 19% of the total
establishments in the economy, they were the biggest employer, employing above 60% of all
workers and generating the highest share of operating receipts amounting to 80% of the total
receipts of the economy. Resorts, Hotels and Restaurants (H), Transport, Storage &
Communications (I) and Construction (F) sectors were the three dominant industries in this
segment.

Economic Survey, 2007-2008
29
Department of National Planning, Male’
Table 9: Manufacturing Sector Establishments, Employment by Firm size
Firm size
Less than 10 10 - 99 100 and above
Industry Establishments Employment Establishments Employment Establishments Employment
D 3,255 4,220 10,886 20,241 1,731 10,557
15 611 946 1,763 3,717 86 1,625
16 - - - - 52 156
17 44 57 105 309 - -
18 1,075 1,326 2,149 3,216 133 462
20 1,043 1,079 5,047 7,143 1,075 3,198
21 - - 3 39 14 128
22 28 56 152 640 5 412
25 - - 14 84 - -
26 67 148 266 668 68 1,074
27 - - 3 34 - -
28 104 151 389 1,449 39 157
35 49 112 156 1,018 101 2,521
36 234 343 841 1,925 159 824
Irrespective of the size of the firm, the main type of manufacturing in the economy was
Manufacture of wood and of products of wood and cork, except furniture; manufacture of
articles of straw and plaiting materials (20). This activity accounted for about 45% of all those
establishments in the manufacturing industry. The second and the third highest is manufacture of
wearing apparel; dressing and dyeing of fur (18) with 21% and manufacture of food products and
beverages (15) with 15% of the industry.
Among the smaller firms, manufacture of wearing apparel (18) was followed by Manufacture of
wood and of products of wood and cork, except furniture; manufacture of articles of straw and
plaiting materials (20) and manufacture of food products and beverages (15) with 33%, 32% and
19% respectively.
In the medium sized firms, manufacture of wood and of products of wood and cork, except
furniture; manufacture of articles of straw and plaiting materials (20) was followed by wearing
apparel (18) and manufacture of food products and beverages (15) with 46%, 20% and 16%
respectively.
The larger firms showed a very different distribution for the second and third largest activities.
Manufacture of wood and of products of wood and cork, except furniture; manufacture of
Economic Survey, 2007-2008
30
Department of National Planning, Male’
articles of straw and plaiting materials (20) was followed by manufacture of furniture (36) and
manufacture of wearing apparel (18) with 62%, 9% and 8% respectively.
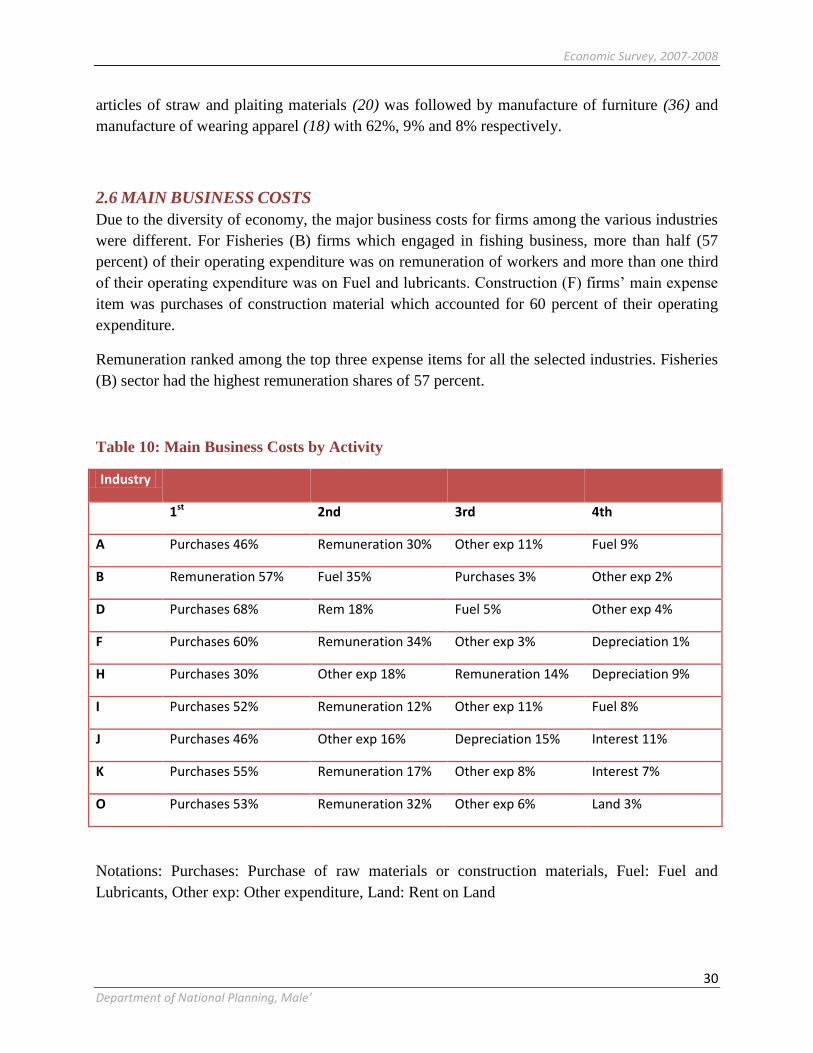
2.6 MAIN BUSINESS COSTS
Due to the diversity of economy, the major business costs for firms among the various industries
were different. For Fisheries (B) firms which engaged in fishing business, more than half (57
percent) of their operating expenditure was on remuneration of workers and more than one third
of their operating expenditure was on Fuel and lubricants. Construction (F) firms‟ main expense
item was purchases of construction material which accounted for 60 percent of their operating
expenditure.
Remuneration ranked among the top three expense items for all the selected industries. Fisheries
(B) sector had the highest remuneration shares of 57 percent.
Table 10: Main Business Costs by Activity
Industry
1st 2nd 3rd 4th
A Purchases 46% Remuneration 30% Other exp 11% Fuel 9%
B Remuneration 57% Fuel 35% Purchases 3% Other exp 2%
D Purchases 68% Rem 18% Fuel 5% Other exp 4%
F Purchases 60% Remuneration 34% Other exp 3% Depreciation 1%
H Purchases 30% Other exp 18% Remuneration 14% Depreciation 9%
I Purchases 52% Remuneration 12% Other exp 11% Fuel 8%
J Purchases 46% Other exp 16% Depreciation 15% Interest 11%
K Purchases 55% Remuneration 17% Other exp 8% Interest 7%
O Purchases 53% Remuneration 32% Other exp 6% Land 3%
Notations: Purchases: Purchase of raw materials or construction materials, Fuel: Fuel and
Lubricants, Other exp: Other expenditure, Land: Rent on Land
Economic Survey, 2007-2008
31
Department of National Planning, Male’
CHAPTER 3: SAMPLING METHODOLOGY
3.1 SAMPLE FRAME
Sample frame of the Economic Survey was based on 2 segments namely, list frame segment and
area frame segment. The main purpose of having these two approaches was to ensure that
economic activities undertaken by major corporations and establishments on a large scale was
captured properly. The country was divided into 5 development regions identified at the time
namely North, Central North, Centre, Central South and South. Sample was drawn based on
these 5 development regions.
3.1.1 LIST FRAME
For the list frame segment the data or “list” was compiled from the establishments listed in the
Noonu form (Establishment form) used in Census 2006. Objective of “Noonu form” was to
collect basic data on activity, economic organization and employment on all establishments
operating with a physical location in Maldives. However, all government offices, schools and
other government units were excluded, except for government companies and public enterprise.
About 9,000 establishments were listed in Noonu form. For the survey purpose, this
establishment list was updated and improved using various administrative lists that were
available from different ministries and agencies.
From Ministry of Economic Development (MoED), the authority responsible for registering the
business operators,
Companies, individual establishments, co-operative societies, partnership and foreign
investments lists of establishments were gathered.
In order to identify which establishments from the MoED list were in operation at the time of the
survey ,a list from Department of Inland Revenue (DIR), the authority responsible to collect the
annual/monthly fee from business operators, was obtained. These two lists were compared to
come up with a list of companies and businesses registered in the MoED which was in operation.
Ministry of Tourism, Arts and Culture (MOTC) gathers the information about the activities
carried out in Tourism sector. Hence, a list of
S
A
M
P
L
I
N
G
M
E
T
H
O
D
O
L
O
G
Y
Economic Survey, 2007-2008
32
Department of National Planning, Male’
Resorts, guest houses, safari vessels, travel agencies, tour guides and dive centre‟s were
obtained from MOTC.
Ministry of Health (MOH) collects the information about the activities carried out in Health
sector. Hence, a list of Hospitals, Clinics and Health Centre‟s were obtained from MOH.
Ministry of Education (MOE) gathered the information about the activities carried in Education
sector. Hence, a list of education providers was obtained from MOE. And from Ministry of
Housing a list of all NGO‟s were obtained.
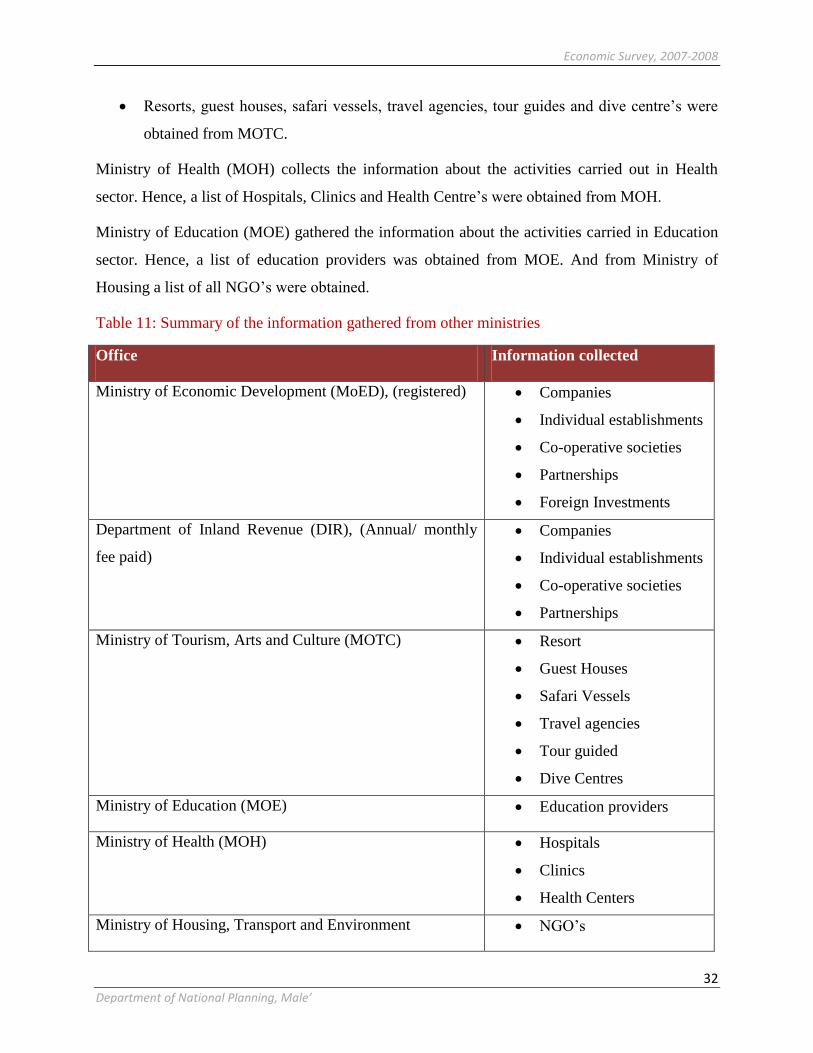
Table 11: Summary of the information gathered from other ministries
Office Information collected
Ministry of Economic Development (MoED), (registered) Companies
Individual establishments
Co-operative societies
Partnerships
Foreign Investments
Department of Inland Revenue (DIR), (Annual/ monthly
fee paid)
Companies
Individual establishments
Co-operative societies
Partnerships
Ministry of Tourism, Arts and Culture (MOTC) Resort
Guest Houses
Safari Vessels
Travel agencies
Tour guided
Dive Centres
Ministry of Education (MOE) Education providers
Ministry of Health (MOH) Hospitals
Clinics
Health Centers
Ministry of Housing, Transport and Environment NGO‟s
Economic Survey, 2007-2008
33
Department of National Planning, Male’
Noonu form data were updated using the lists brought from different ministries and hence the
updated lists were used as a frame for the list based sample.
3.1.2 AREA FRAME
Economic Survey based on the area frame for which necessary data were compiled from the
results of the Population and Housing Census 2006. The country was divided into 5 development
regions namely North, Central North, Centre, Central South and South and 20 administrative
atolls. Administrative atolls consist of 194 inhabited islands with clearly marked census
enumeration blocks. The capital Male‟ has separate administrative status. Economic Survey uses
area frame thus administrative and geographic structure of the country was taken as a basis to
make the sample representative. Major characteristics of the frame are given below:
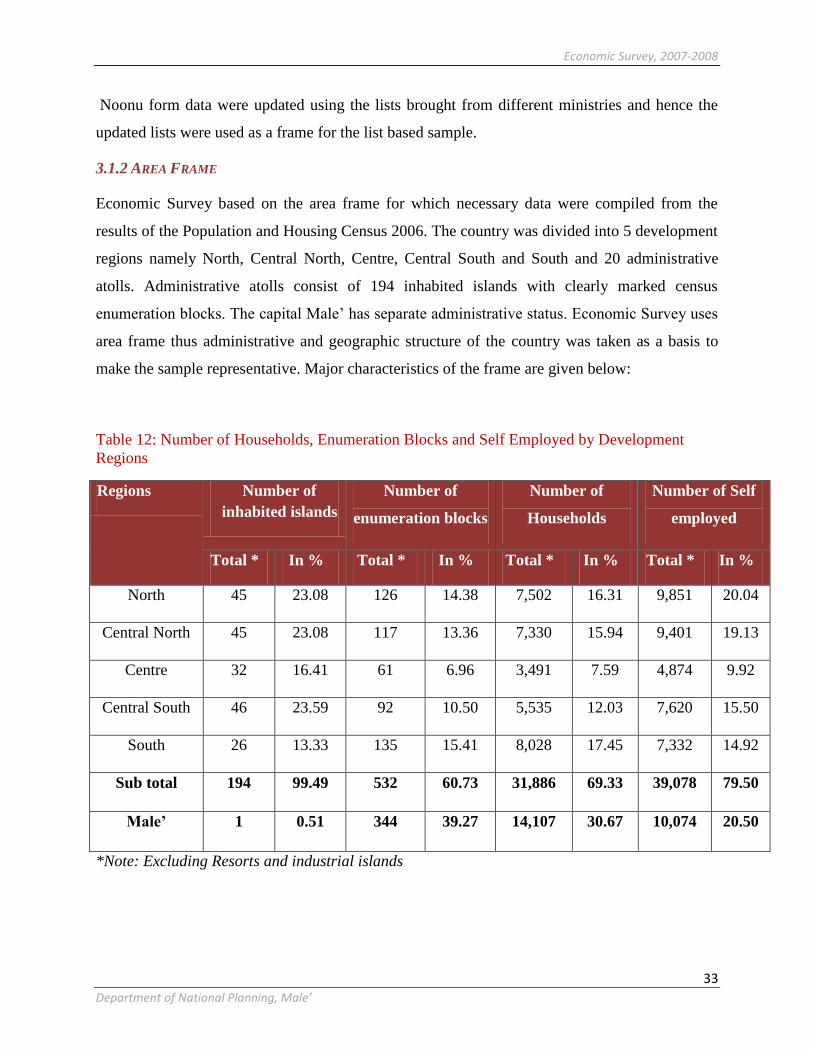
Table 12: Number of Households, Enumeration Blocks and Self Employed by Development
Regions
Regions Number of
inhabited islands
Number of
enumeration blocks
Number of
Households
Number of Self
employed
Total * In % Total * In % Total * In % Total * In %
North 45 23.08 126 14.38 7,502 16.31 9,851 20.04
Central North 45 23.08 117 13.36 7,330 15.94 9,401 19.13
Centre 32 16.41 61 6.96 3,491 7.59 4,874 9.92
Central South 46 23.59 92 10.50 5,535 12.03 7,620 15.50
South 26 13.33 135 15.41 8,028 17.45 7,332 14.92
Sub total 194 99.49 532 60.73 31,886 69.33 39,078 79.50
Male’ 1 0.51 344 39.27 14,107 30.67 10,074 20.50
*Note: Excluding Resorts and industrial islands
Economic Survey, 2007-2008
34
Department of National Planning, Male’
a. Island frame
A list of economic activities and entities which are difficult to identify and locate as they are not
in a fixed location such as fishing vessels, transport vessels, , sand mining agricultural and
construction activities was obtained from the island offices. These lists were used as a frame to
collect the information for these activities.
b. Special islands
In order to capture all kinds of economic activities, a special focus was given to some main
sectors such as Agriculture and Boat building, which are to a large extent located in specific
islands in the country. For these sectors, data was collected from some major agricultural islands
and islands specialized in boat buildings and fishing.
3.2 STRATIFICATION
The purpose of stratification is to divide the population into homogeneous groups in order to
reduce the variability of the estimators. Stratification allows proper allocation of sample in
different groups and makes it more representative.
For both list frame and area frame, the country was divided into two domains: Male‟ and Atolls.
Further stratification was done in Atolls by regions. In Male‟ sample was drawn within each
ward and in Atolls within each region.
3.2.1 AREA FRAME
Stratification in Atoll was done by development region and by Atoll capital and other islands,
which was aimed to group the Atoll capital and other islands separately. It was believed that in
most of the cases Atoll Capital carry out more economic activities while other islands have
limited economic activities.
Allocation of sample in domains was based in proportion to the number of self employed persons
identified in the population and housing census 2006. The sample design used was two-stage
sampling with enumeration blocks as primary sampling units (psu) (probability proportional to
size, without replacement) and all eligible household unit and establishments (excluding the

Economic Survey, 2007-2008
35
Department of National Planning, Male’
establishments already in the list segment sample) in the sample area as secondary or ultimate
sampling unit (usu).
The country was divided in to three stratums. Male‟, Atoll capital and the rest of the country and
each stratum are subdivided in five development regions (excluding Male‟ stratum). This means
that the population and sample of enumeration areas was divided in 11 stratums:
Table 13: Population and Sample of Enumeration Areas
Stratum 1 Male’ Region
Stratum 2 Atoll Capital islands Region 1: North
Stratum 3 Atoll Capital islands Region 2: North Central
Stratum 4 Atoll Capital islands Region 3: Central
Stratum 5 Atoll Capital islands Region 4: South Central
Stratum 6 Atoll Capital islands Region 5: South
Stratum 7 Non-atoll islands (rest of the country) Region 1: North
Stratum 8 Non-atoll islands (rest of the country) Region 2: North Central
Stratum 9 Non-atoll islands (rest of the country) Region 3: Central
Stratum 10 Non-atoll islands (rest of the country) Region 4: South Central
Stratum 11 Non-atoll islands (rest of the country) Region 5: South
3.3 SAMPLE SIZE AND ITS ALLOCATION
The survey covered all the sectors of the economy reflecting characteristics and economic
activities of the units which are defined in terms of the International Standard Industrial
Classification of All Economic Activities (ISIC Rev. 3).
The sampling approached was divided into two segments and a total of 8,146 establishments in
the country were included in the initial sample.

Economic Survey, 2007-2008
36
Department of National Planning, Male’
1. List frame segment 2,976 establishments
2. Area frame segment 5,170 establishments
List frame Segment - Atolls
The basis of the list frame segment was the information on establishments collected from the
“Noonu form” during the Population and Housing Census 2006. However, this list was
“updated” using lists of establishments received from different government agencies and the
island offices, immediately prior to the survey.
The table 1 in Annex 6 shows the selected islands and the respective number of establishments
recorded in census 2006. The establishments are grouped by ISIC major category level. After
tabulating the establishments by ISIC category, these were divided in to two categories, “take
all” segment and “non-take all” segment. These segments are made depending on the number of
establishments in each ISIC group. If the establishment number is greater than 30 in the ISIC
group then it was decided to go for sampling without replacement (srswor). All islands except
HDh. Kulhudhufushi, Lh. Naifaru, GDh. Thinadhoo, Gn. Fuvahmulah and S. Hithadhoo, were
classified under the “take all” category. Hence, the list prepared from “Noonu form” was fully
utilized in the enumeration process. In the “non-take all" category islands, only ISIC 5211
(Retail trade in non-specialized stores with food, beverages or tobacco predominating) needed
sampling and all other ISIC groups was enumerated fully.
List frame Segment – Male’
The Economic survey was planned to cover all production units were including formal
establishments (through Noonu listing and from administrative lists) and Household
unincorporated establishments.
The table 2 in annex 6 shows the list segment for Male‟ showing the domains by status, and the
“take all” segment and those which required sampling.
Details of how the units for enumeration were selected for the domains for which sampling was
adopted, are given below.
For instance, consider the ISIC code 9302, Hair dressing and other beauty treatment, shown in
the example below. A list of establishments for this domain was compiled.

Economic Survey, 2007-2008
37
Department of National Planning, Male’
Domain
ISIC
9302
Employees
1= 0-5 2= 6-9 3= 10-19 Total
Count 51 4 1 56
mean 1.84 7.25 42.00 2.95
SD 1.07 1.26 40.16 30.44
Error= 5% distance from the mean
Level of Significance: 95% confidence
N Mean SD n0 n
Group 1 51 1.84 1.07 513 44
Group 2 4 7.25 1.26 46 4
Group 3 1 42.00 40.16 1405 1
Total 56 49
For a better representation of the domain according to the employment size of establishments it
was sub divided into 3 groups, less than 5 employees, 5 to 9 and 10 or more employees. There
are total N=56 establishments, with 5% error margin (distance from the mean) and 95%
confidence interval, the sample size arrived is 49 establishments. Therefore, a sample of 49
establishments was selected for the survey with a maximum error of 5% and confidence limits of
95%.
The same procedure was adopted in Male‟ as well as in the Atolls, for the domains where
sampling was required. (Shown in annex 6)
Area frame Segment – Atolls
For the area base segment, two stage sampling process was adopted. In the first stage islands
were chosen and from these islands blocks were selected. In the design stage it was assumed that
major economic activities existed in the Atoll capitals, therefore, all the Atolls capital islands
were included in the sample purposefully. In addition to this, one island from each Atoll was
selected in the sample, based on the self employed population from census 2006. Therefore, the
island with the highest number of self employed population was selected as the second island. It
was assumed that large numbers of formal and large establishments will be covered in the Atoll

Economic Survey, 2007-2008
38
Department of National Planning, Male’
capital and the other island selected will largely capture informal and household activities. Hence
the coverage of different types of activities is representative up to region level.
In the second stage enumeration areas were selected using PPS of self employed population. In
some islands more than one enumeration area (EAs) was selected depending on the number of
EAs. As in the area sampling procedures, the selected EA(s) were listed and enumerated fully.
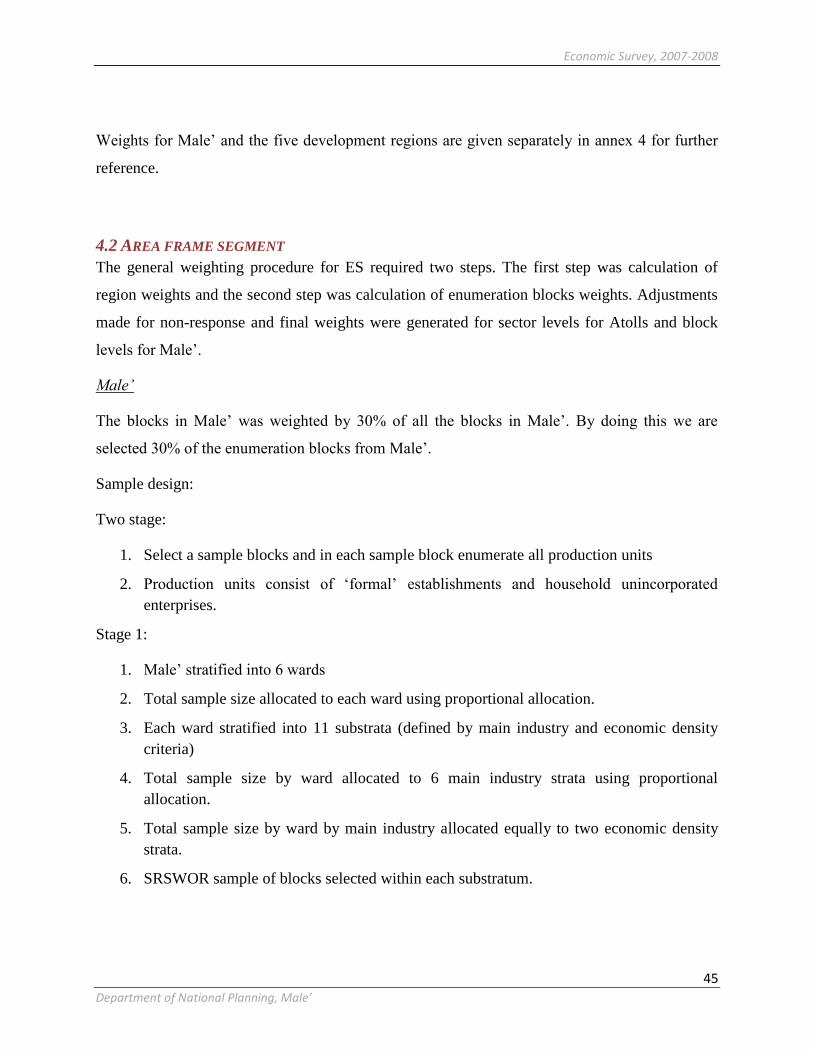
Area frame Segment – Male’
The area segment in Male‟ was in two stages. In stage 1, Male‟ was stratified into 6 wards. Each
ward was then sub-stratified into 11 substrata. The basis for sub-stratification was by main
industry and economic density criteria. Using proportional allocation to main industry criteria,
sample size to each ward was allocated. In the second stage blocks from each sub-strata were
selected using the identified economic criteria using the method of simple random sample
without replacement.
Sample Size and response rates
Out of the 8,146 establishments included in the sample responses were received from only 5,235
establishments, which come to an overall response rate of 64 percent.
In the List based segment the sample consists of 2,976 establishments (without replacement), i.e.
1,823 establishments in Male‟ and 1,153 establishments in Atolls. However due to different
reasons only 705 establishments participated in the survey in Male‟ and 828 establishments in
Atolls.
In the case of area based segment, the sample consists of 5,170 establishments i.e. 2,629
establishments in Male‟ and 2,541 establishment in Atolls were selected for the sample. Out of
which 1,649 establishment in Male‟ participate in the survey and 2,053 establishments in Atolls
responded to the survey.
Table 14: Survey Sample Size and Response Rate

Economic Survey, 2007-2008
39
Department of National Planning, Male’
Economic Survey Sample Size and Response Rate
Total Response UnavailableRefused/r
eject
Not
identifiedTotal Response Unavailable
Refused/r
eject
Not
identified
Male' 2629 1649 871 109 0 1823 707 401 56 659
% 100 63 33 4 0 100 39 22 3 36
Non-response (max) 37 61
61
39
Atolls 2541 2053 449 39 0 2219 1774 142 54 249
% 100 81 18 2 0 100 80 6 2 11
Non-response (max) 19 20
90
10
Area based List based
response (excl. not identified)
Non-response (excl. not identified)
response (excl. not identified)
Non-response (excl. not identified)
The reason for adopting this methodology of stratification was to be able to produce data at the
level of Male‟ and Atolls separately and also separately for Regions.

Economic Survey, 2007-2008
40
Department of National Planning, Male’
Table 15: Non-response Rate by Atoll
Economic Survey, 2007-2008
41
Department of National Planning, Male’
3.4 SAMPLE ALLOCATIONS
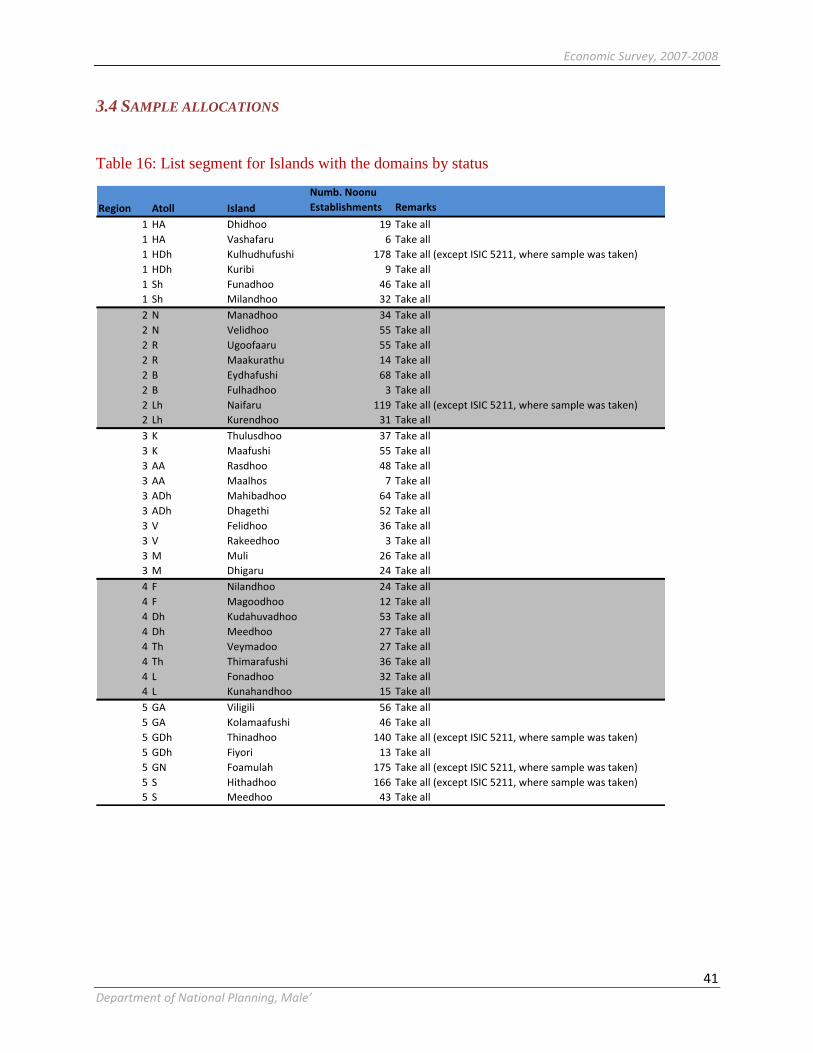
Table 16: List segment for Islands with the domains by status Annex 1
Region Atoll Island
Numb. Noonu
Establishments Remarks
1 HA Dhidhoo 19 Take all
1 HA Vashafaru 6 Take all
1 HDh Kulhudhufushi 178 Take all (except ISIC 5211, where sample was taken)
1 HDh Kuribi 9 Take all
1 Sh Funadhoo 46 Take all
1 Sh Milandhoo 32 Take all
2 N Manadhoo 34 Take all
2 N Velidhoo 55 Take all
2 R Ugoofaaru 55 Take all
2 R Maakurathu 14 Take all
2 B Eydhafushi 68 Take all
2 B Fulhadhoo 3 Take all
2 Lh Naifaru 119 Take all (except ISIC 5211, where sample was taken)
2 Lh Kurendhoo 31 Take all
3 K Thulusdhoo 37 Take all
3 K Maafushi 55 Take all
3 AA Rasdhoo 48 Take all
3 AA Maalhos 7 Take all
3 ADh Mahibadhoo 64 Take all
3 ADh Dhagethi 52 Take all
3 V Felidhoo 36 Take all
3 V Rakeedhoo 3 Take all
3 M Muli 26 Take all
3 M Dhigaru 24 Take all
4 F Nilandhoo 24 Take all
4 F Magoodhoo 12 Take all
4 Dh Kudahuvadhoo 53 Take all
4 Dh Meedhoo 27 Take all
4 Th Veymadoo 27 Take all
4 Th Thimarafushi 36 Take all
4 L Fonadhoo 32 Take all
4 L Kunahandhoo 15 Take all
5 GA Viligili 56 Take all
5 GA Kolamaafushi 46 Take all
5 GDh Thinadhoo 140 Take all (except ISIC 5211, where sample was taken)
5 GDh Fiyori 13 Take all
5 GN Foamulah 175 Take all (except ISIC 5211, where sample was taken)
5 S Hithadhoo 166 Take all (except ISIC 5211, where sample was taken)
5 S Meedhoo 43 Take all

Economic Survey, 2007-2008
42
Department of National Planning, Male’
Table 17: List segment for Male‟ with the domains by status Annex 2
Sector
Domain /
ISIC Description Remarks
Agriculture 01 / 02 Agriculture take all
Fishing 05 Fishing take all
Mining & quarrying 1410 Other mining and quarrting take all
1512 Processing and preserving of fish & fish products take all
154 Other food products take all
155 Beverages take all18 Wearing apparel take all
202 Products of wood take all
221 Publishing take all
222 Printing take all
24 Chemicals and chemical products take all
269 Non-metallic mineral products, nec take all
281 Structural metal products (2892?) take all292 Special purpose machinery take all
351 Building an repairing of ships and boats take all
361 Furniture take all
40 Electricity take all41 Water take all
Construction 45 Construction sampling
50 Motor vehicles take all
51 Wholesale trade take all
5143 Construction materials take all
521 Non- specialized retail trade in stores sampling522 Retail sale of food, beverages & tobacco in specialized storessampling
5231 Retsil sale of pharmaceuticle and medical goods sampling
5232 Retail sale of textiles, clothing, footwear sampling
5233 Retail sale of household appliances take all
5234 Retail sale of hardware, paints and glass sampling
5239 Other retail sale in specialized stores sampling
525 Retail trade not in stores take all526 Repair of personal & household goods take all
Hotels & Restaurants 551 Hotels take all
552 Restaurants take all
602 Other land transport take all
611 Sea and coastal take all612 Inland water take all
62 Air transport take all
6301 Cargo handling take all
6302 Storage and warehousing take all
6304 Travel agencies sampling6309 Other transport agencies take all
Communications 641 Post & courier activities take all
642 Telecommunications (includes internet providers, cyber cafes)take all
Transport & storage
Wholesale & retail trade; repair of
motor vehicles
Electricity, gas & water
Manufacturing

Economic Survey, 2007-2008
43
Department of National Planning, Male’
Sector
Domain /
ISIC Description Remarks
65 Except insurance & pension funding take all66 Insurance take all
67 Auxiliary activities take all
Real estate 70 Real estate activities take all
711 Transport sampling
712 Other machinery & equipment take all713 Personal & household goods take all
Computer and related activities 72 Computer related activities take all
7411 Legal take all
7491 Labour recruitment sampling7494 Photographic activities take all
801 Primary education take all
802 Secondary education take all
809 Adult and other education (including: computer training)take all
851 Human health activities (8511, 8512) take all853 Social work activities take all
90 Sewage take all
91 Activities of membership organizations take all
921/922 Motion picture, radio, TV/news agency take all
924 Sporting and other recreational activities take all
9302 Hairdressing and other beauty treatment sampling9301, 9309 Others take all
Health and social work
Other community, social and personal
services
Other service activities
Renting of machinery & equipment
without operator & of personal and
household goods
Other business activities
Financial intermediation
Education

Economic Survey, 2007-2008
44
Department of National Planning, Male’
CHAPTER 4: WEIGHTING PROCEDURES
4.1 LIST FRAME SEGMENT
The design was a single stage sampling using Simple Random Sample (SRS) method. For
estimation of the total, weights were calculated separately for Male‟ and Atolls by sector level
based on the following formula:
Where Wbi = Base/design weight for i-th sample area,
N= Total number of establishment, and
n= Sample establishment in a stratum
The final weight has to be adjusted for non-response. Establishments which do not respond have
influence to value of weight, so final weight was adjusted for non-response. Non- response
adjustment corresponds to inverse response rate.
All establishment that does not respond, irrespective of the reason for non-response, are treated
as non- response and are used for weight correction. Response rate for establishment was
calculated as ratio between number of establishment which responded and number of selected
establishment in the stratum. Inverse response rate is used for non-response adjustment. Non-
response adjustment is defined as:
The final weight after the non-response adjustment for establishment is:
Where Wbi = Base/design weight for i-th sample area,
Wr= Adjustment for non-response
W
E
I
G
H
T
I
N
G
P
R
O
C
E
D
U
R
E
S
Economic Survey, 2007-2008
45
Department of National Planning, Male’
Weights for Male‟ and the five development regions are given separately in annex 4 for further
reference.
4.2 AREA FRAME SEGMENT
The general weighting procedure for ES required two steps. The first step was calculation of
region weights and the second step was calculation of enumeration blocks weights. Adjustments
made for non-response and final weights were generated for sector levels for Atolls and block
levels for Male‟.
Male’
The blocks in Male‟ was weighted by 30% of all the blocks in Male‟. By doing this we are
selected 30% of the enumeration blocks from Male‟.
Sample design:
Two stage:
1. Select a sample blocks and in each sample block enumerate all production units
2. Production units consist of „formal‟ establishments and household unincorporated
enterprises.
Stage 1:
1. Male‟ stratified into 6 wards
2. Total sample size allocated to each ward using proportional allocation.
3. Each ward stratified into 11 substrata (defined by main industry and economic density
criteria)
4. Total sample size by ward allocated to 6 main industry strata using proportional
allocation.
5. Total sample size by ward by main industry allocated equally to two economic density
strata.
6. SRSWOR sample of blocks selected within each substratum.
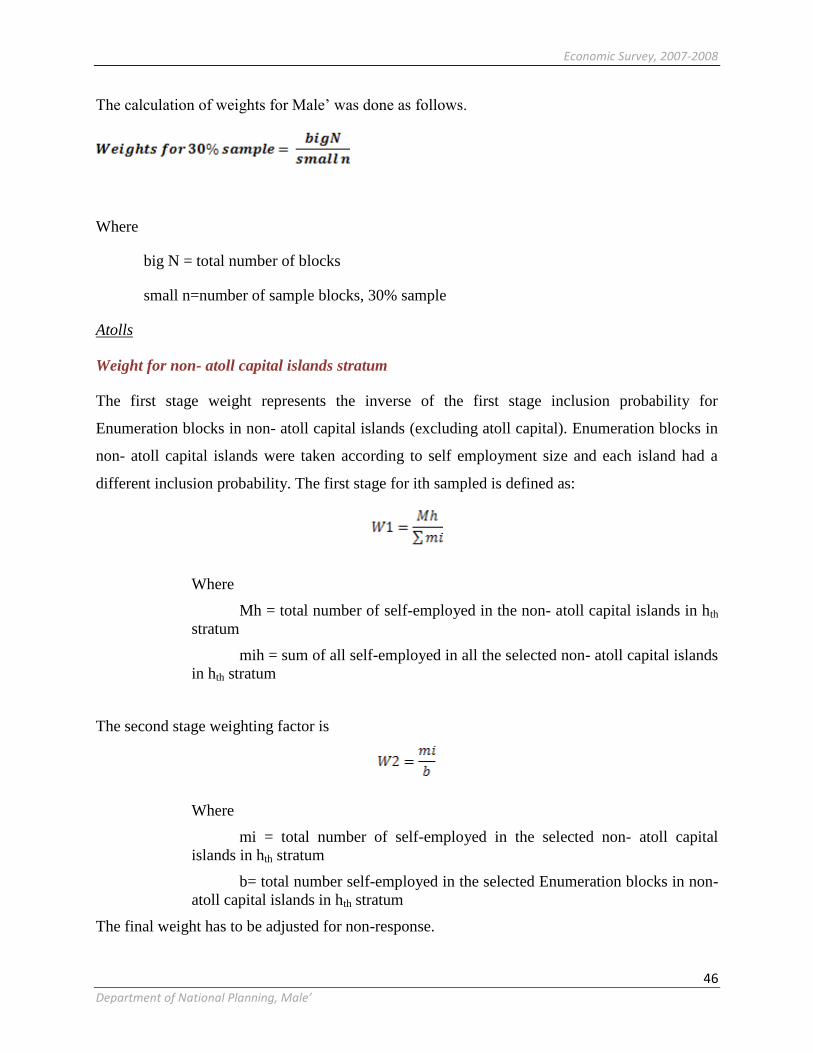
Economic Survey, 2007-2008
46
Department of National Planning, Male’
The calculation of weights for Male‟ was done as follows.
Where
big N = total number of blocks
small n=number of sample blocks, 30% sample
Atolls
Weight for non- atoll capital islands stratum
The first stage weight represents the inverse of the first stage inclusion probability for
Enumeration blocks in non- atoll capital islands (excluding atoll capital). Enumeration blocks in
non- atoll capital islands were taken according to self employment size and each island had a
different inclusion probability. The first stage for ith sampled is defined as:
Where
Mh = total number of self-employed in the non- atoll capital islands in hth
stratum
mih = sum of all self-employed in all the selected non- atoll capital islands
in hth stratum
The second stage weighting factor is
Where
mi = total number of self-employed in the selected non- atoll capital
islands in hth stratum
b= total number self-employed in the selected Enumeration blocks in non-
atoll capital islands in hth stratum
The final weight has to be adjusted for non-response.

Economic Survey, 2007-2008
47
Department of National Planning, Male’
Non-response adjustment is defined as:
The final weight after the non-response adjustment for establishment is:
Where WF = Final weight for i-th sample area,
Wr= Adjustment for non-response
Weight for atoll capital island stratum
The same weighting procedure mention above was used to raise the data for atoll capital islands,
since atoll capital was treated as a different stratum. All the atoll capitals were taken in the
sample, hence first stage W1 = 1. The second stage weight was calculated in the same procedure
as the non- atoll capital islands. After adjusting for non-response for establishments final weight
for this stratum was prepared.
Note:
Initially it was designed to raise the survey results into five development regions. But due to
changes in the government, the raising factors were adjusted to 7 provinces.
Special islands and island frame segments
Those information/data collected from “special islands” and “island based segment” was not
weighted to get economy level data because these were focused specifically on certain activities
and if we raise the data the level the economy will be bloated.

Economic Survey, 2007-2008
48
Department of National Planning, Male’
ANNEX
Economic Survey, 2007-2008
1
Department of National Planning, Male’
ANNEX 1: CONCEPTS AND DEFINITIONS
Some items of the questionnaire are identical for all sectors while filling in the questionnaires.
These items are defined and explained below.
Establishment
An establishment is an enterprise or part of an enterprise that is situated in a single location and
in which only a single (non-ancillary) productive activity is carried out or in which the principal
productive activity accounts for most of the value added.
Production
Production is the activity in which an establishment uses inputs to produce its outputs.
Production is the process whereby, land, labour, capital and raw materials are transformed into
goods and services.
Gross Value Added
Gross Value added is the value of output less the value of intermediate consumption. It is a
measure of the contribution to GDP made by an individual producer, industry or sector. This is
the additional value generated by the factors of production; or the additional value created by a
process of production.
Output
Output is the goods and services that are produced with the establishment that become available
for those outside the establishment and any good and services produced for own final use.
Intermediate Consumption
Intermediate consumption consists of the value of the goods and services consumed as inputs by
a process of production (excluding fixed assets whose consumption is recorded as consumption
of fixed capital). These goods and services may either be transformed or used up by the
production process.
Durable goods which may be classified as capital goods since they are used as the tools of
production over a number of years (saws, spades, knives, axes, hammers and screwdrivers etc.)
may be included in intermediate consumption if their prices are below a certain low value.
C
O
N
C
E
P
T
S
A
N
D
D
E
F
I
N
I
T
I
O
N
S

Economic Survey, 2007-2008
2
Department of National Planning, Male’
Intermediate consumption excludes other production costs such as labour cost, financial costs
and production taxes.
Accounting Period
The questionnaire refers to calendar years. In case the accounting year of the establishment
differs from the calendar year, select the accounting year with the largest coverage in the
mentioned period. For instance, if your establishment's accounting year is from the 1st of April
to the 31st March of the following year, report it in the starting year of the accounting period. For
accounting years running from July 1st to June 30th, it is recommended to report for the year
ENDING in the calendar year referenced.
Also the establishment could choose to provide data for the last month as for small and
household establishments that do not maintain proper books of accounts it will be difficult to
provide for the last year.
Income
Income is the maximum amount that an establishment, can consume without reducing its real net
worth provided the net worth at the beginning of the period is not changed by capital transfers,
other changes in the volume of assets or real holding gains or losses.
Expenditures
Expenditures are the values of the amounts that buyers pay, or agree to pay, to sellers in
exchange for goods or services that sellers provide to them or to other institutional units
designated by the buyers.
Industry
An industry consists of a group of establishments engaged in the same or similar kind of
production activity. The industries are classified according to the productive activities as per the
ISIC classification (Rev.3)

Economic Survey, 2007-2008
3
Department of National Planning, Male’
Net Worth
Net worth is the value of all the non-financial and financial assets owned by an institutional unit
or sector less the value of all its outstanding liabilities. It is a measure of the wealth of a unit or
sector at one point in time.
Capital Transfers
Capital transfers are transactions in which the ownership of an asset (other than cash and
inventories) is transferred from one institutional unit to another, in which cash is transferred to
enable the recipient to acquire another asset or in which the funds realized by the disposal of
another asset are transferred.
Other changes in the volume of assets
The other changes in the volume of assets are the changes in assets, liabilities, and net worth
between opening and closing balance sheets that are due neither to transactions between
institutional units, as recorded in capital and financial accounts, nor to holding gains and losses.
Real Holding gains or losses
Positive or negative holding gains may accrue during the accounting period to the owners of
financial and non-financial assets and liabilities as a result of a change in their prices (holding
gains are sometimes referred to as “capital gains”)
Fixed Assets
Fixed assets are tangible or intangible assets produced as outputs from processes of production
that are used repeatedly or continuously in other processes of production for more than one year.
(eg. Machinery, equipment etc)
Ancillary Activity
An ancillary activity is a supporting activity undertaken within an enterprise in order to create
the conditions within which the principal or secondary activities can be carried out. Ancillary
activities generally produce services that are commonly found as inputs into almost any kind of
economic activity and the value of an individual ancillary activity‟s output is likely to be small
compared with the other activities of the enterprise (e.g. cleaning and maintenance of buildings).

Economic Survey, 2007-2008
4
Department of National Planning, Male’
ANNEX 2: ECONOMIC SURVEY BUDGET
Economic Survey 2007 was solely funded by the government of the Maldives.
2.1 Planned Budget
Initially during the government budgeting process, the survey budget was planned to carry out a
Small Establishment Survey (SES). However, due to the need to assess the fast growing
economy, it was decided that an Economic Survey was of more importance during that time. It
was planned to use a combined approach of small and large establishments alike with personal
interviews in order to accomplish improved responses. However, due to this change in scope,
some financial shortfalls occurred which led to some problems in the budget.
The sample size of the Small Establishment Survey was just 12 islands while 40 islands were
included in the sample of Economic Survey due to which the cost of atoll field operation soared.
The estimated budget for Small Establishment Survey (SES) was Rf 181,380, which was 7 times
less than the actual expenditure.
2.2 Actual Budget
A new budget was formulated prior to starting the ES field operation which amounted to a total
of Rf 1,278,208.
Major expenses of the survey broken down by the purpose are given in figure below. Almost
60% of the expenditure was on allowances of enumerators, supervisors and data entry personnel
and their food and accommodation during field operation.
E
C
O
N
O
M
I
C
S
U
R
V
E
Y
B
U
D
G
E
T
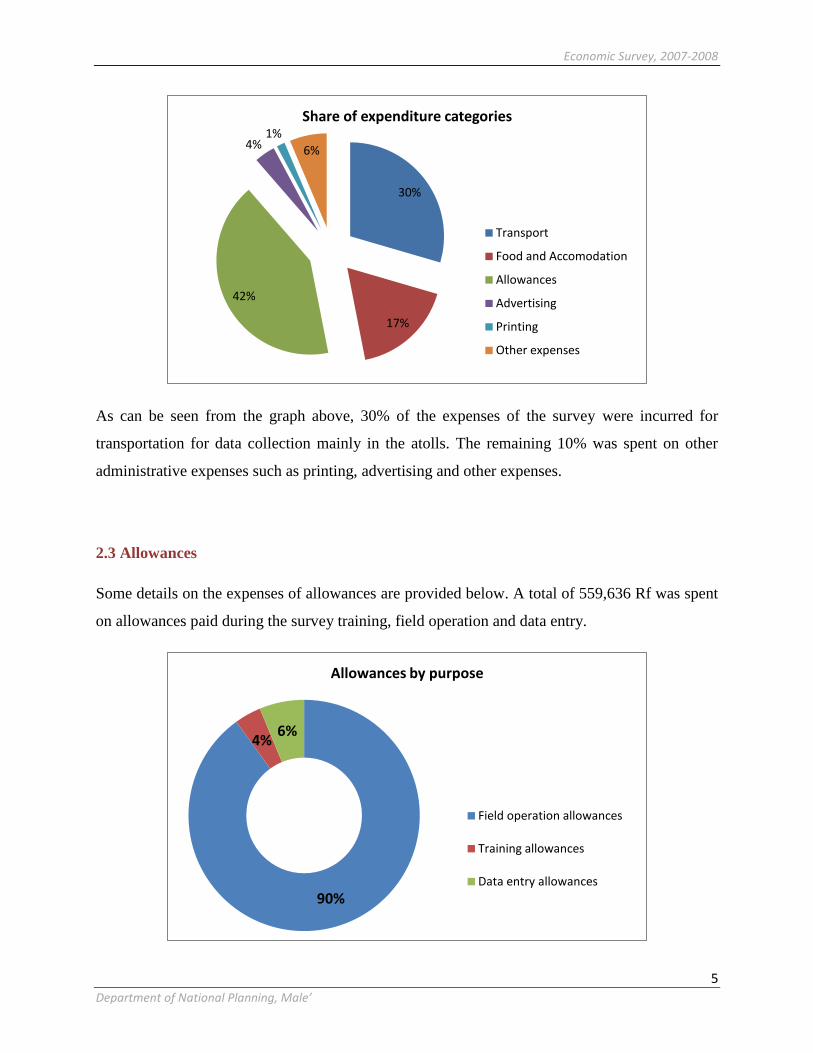
Economic Survey, 2007-2008
5
Department of National Planning, Male’
As can be seen from the graph above, 30% of the expenses of the survey were incurred for
transportation for data collection mainly in the atolls. The remaining 10% was spent on other
administrative expenses such as printing, advertising and other expenses.
2.3 Allowances
Some details on the expenses of allowances are provided below. A total of 559,636 Rf was spent
on allowances paid during the survey training, field operation and data entry.
30%
17%
42%
4%1%
6%
Share of expenditure categories
Transport
Food and Accomodation
Allowances
Advertising
Printing
Other expenses
90%
4%6%
Allowances by purpose
Field operation allowances
Training allowances
Data entry allowances

Economic Survey, 2007-2008
6
Department of National Planning, Male’
2.3.1 Training Allowances
Training expenses include allowances paid to the enumerators only. No expenses were incurred
to hire a training venue as the trainings were conducted in the premise of the office. The training
of the survey was carried out in 3 rounds and enumerators were paid Rf80 per day of training,
while training lasted 4 days. Furthermore, trainers were also paid Rf150 per day of training. The
expenses incurred amounted to 20,840 as shown in the table below.
Training rounds Number
Trained
Allowance totals (in
Rufiyaa)
Round 1 17 5,280
Round 2 25 7,320
Round 3 26 8,240
Total 68 20,840
2.3.2 Field Operation allowances
Field operation of the Economic Survey started in Male‟. During the field operation, payments to
enumerators were made fortnightly. A minimum of 8 hours have to be put into field work by
enumerators to get Rf150 per day. These allowances amounted to Rf 503,810.
Description Number of enumerators
and supervisors
Allowance
totals (in
Rufiyaa)
First remuneration 18 38,380
Second remuneration 55 76,576
Third remuneration 44 388,854
Total 117 503,810
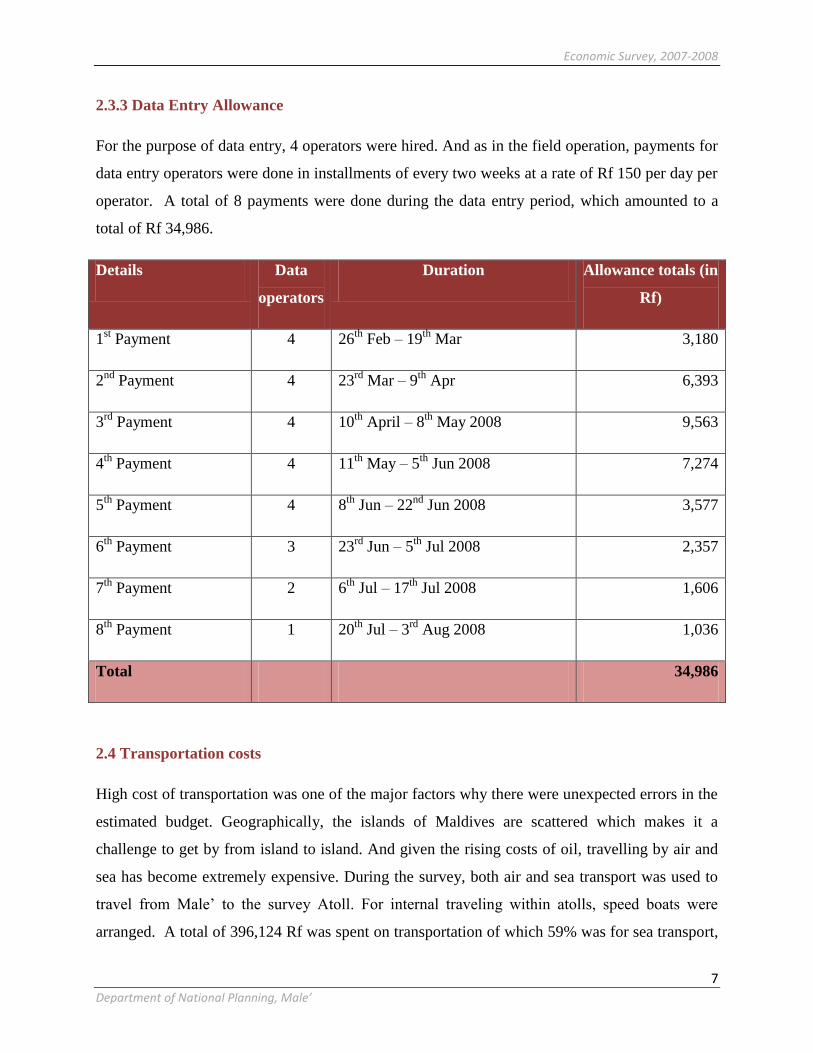
Economic Survey, 2007-2008
7
Department of National Planning, Male’
2.3.3 Data Entry Allowance
For the purpose of data entry, 4 operators were hired. And as in the field operation, payments for
data entry operators were done in installments of every two weeks at a rate of Rf 150 per day per
operator. A total of 8 payments were done during the data entry period, which amounted to a
total of Rf 34,986.
Details Data
operators
Duration Allowance totals (in
Rf)
1st Payment 4 26
th Feb – 19
th Mar 3,180
2nd
Payment 4 23rd
Mar – 9th
Apr 6,393
3rd
Payment 4 10th
April – 8th
May 2008 9,563
4th
Payment 4 11th
May – 5th
Jun 2008 7,274
5th
Payment 4 8th
Jun – 22nd
Jun 2008 3,577
6th
Payment 3 23rd
Jun – 5th
Jul 2008 2,357
7th
Payment 2 6th
Jul – 17th
Jul 2008 1,606
8th
Payment 1 20th
Jul – 3rd
Aug 2008 1,036
Total 34,986
2.4 Transportation costs
High cost of transportation was one of the major factors why there were unexpected errors in the
estimated budget. Geographically, the islands of Maldives are scattered which makes it a
challenge to get by from island to island. And given the rising costs of oil, travelling by air and
sea has become extremely expensive. During the survey, both air and sea transport was used to
travel from Male‟ to the survey Atoll. For internal traveling within atolls, speed boats were
arranged. A total of 396,124 Rf was spent on transportation of which 59% was for sea transport,

Economic Survey, 2007-2008
8
Department of National Planning, Male’
25% for air transport, 13% for inter-island sea transport and 3% for land transport, as seen from
table below.
In the Economic Survey planning stage, there had been discussions to minimize the cost for
transportation. As a reasonable solution, it was decided to travel to 2 or 3 atolls at the same time
using the same day travel plan which economizes on the travel budget. To see the traveling plans
refer annex 4.
For some of the islands, transportation cost was significantly high; while in some islands inland
transport cost was high; mostly islands like S. Hithadhoo, Gn. Fuvamulah, HDh.
Kulhudhuffushi, Ha. Dhiddhoo, L. Fonadhoo, K. Hulhumale‟ and K.Male‟.
Transport costs of Economic Survey 2007
Atoll Air
Transport
Sea
Transport
Internal Sea
Transport
Land
Transport Total
Ha 10,800
4,500 1,440 5,940
HDh 5,500 1,440 17,740
Sh
60,500
2,000 62,500
N 2,000 2,000
R 2,000 2,000
B 38,000
2,500 40,500
Lh 1,564 1,564
K 22,900 22,900
AA 12,500
3,500 16,000
ADh 5,500 5,500
V
80,500
700 81,200
M 1,200 1,200
F 800 800
Dh 1,200 1,200
Th. 1,500 1,500
L 30,150 3,000 33,150
Ga 29,880 17,600
2,000 19,600
GDh 2,000 31,880
S 30,150 2,500 2,400 35,050
Gn 11,500 2,400 13,900
Total 70,830 232,000 51,464 11,680 396,124
% share 18% 59% 13% 3% 100%
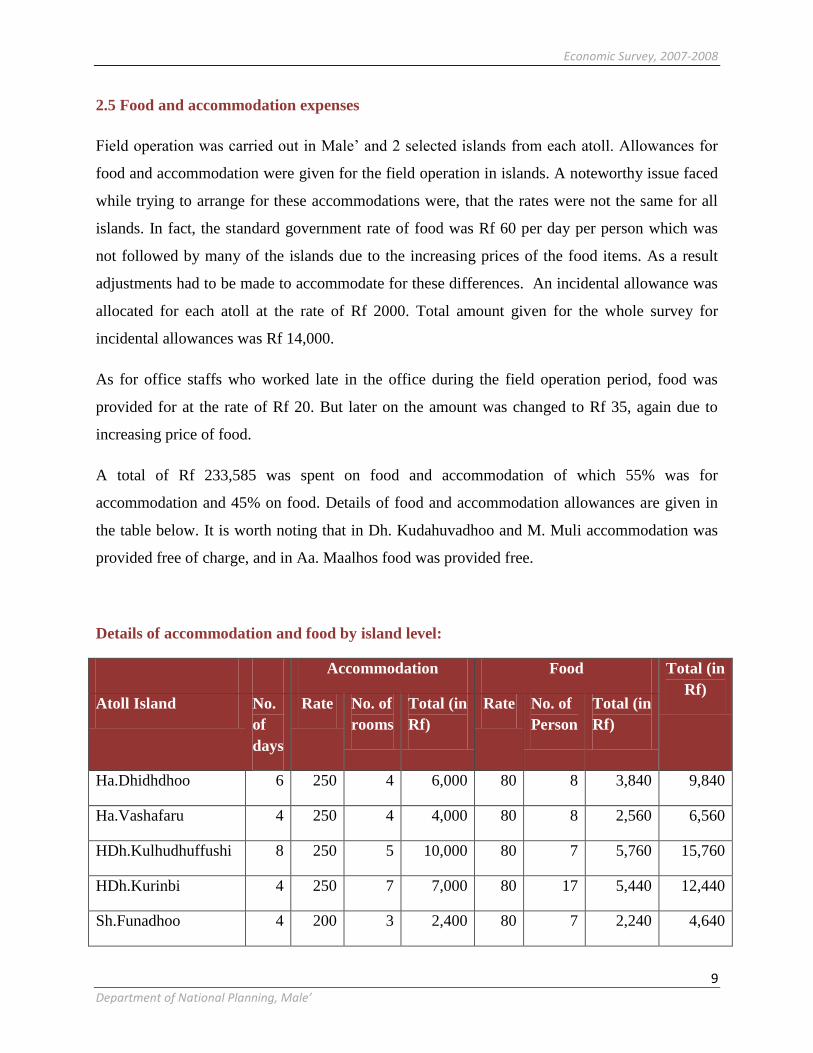
Economic Survey, 2007-2008
9
Department of National Planning, Male’
2.5 Food and accommodation expenses
Field operation was carried out in Male‟ and 2 selected islands from each atoll. Allowances for
food and accommodation were given for the field operation in islands. A noteworthy issue faced
while trying to arrange for these accommodations were, that the rates were not the same for all
islands. In fact, the standard government rate of food was Rf 60 per day per person which was
not followed by many of the islands due to the increasing prices of the food items. As a result
adjustments had to be made to accommodate for these differences. An incidental allowance was
allocated for each atoll at the rate of Rf 2000. Total amount given for the whole survey for
incidental allowances was Rf 14,000.
As for office staffs who worked late in the office during the field operation period, food was
provided for at the rate of Rf 20. But later on the amount was changed to Rf 35, again due to
increasing price of food.
A total of Rf 233,585 was spent on food and accommodation of which 55% was for
accommodation and 45% on food. Details of food and accommodation allowances are given in
the table below. It is worth noting that in Dh. Kudahuvadhoo and M. Muli accommodation was
provided free of charge, and in Aa. Maalhos food was provided free.
Details of accommodation and food by island level:
Accommodation Food Total (in
Rf) Atoll Island No.
of
days
Rate No. of
rooms
Total (in
Rf)
Rate No. of
Person
Total (in
Rf)
Ha.Dhidhdhoo 6 250 4 6,000 80 8 3,840 9,840
Ha.Vashafaru 4 250 4 4,000 80 8 2,560 6,560
HDh.Kulhudhuffushi 8 250 5 10,000 80 7 5,760 15,760
HDh.Kurinbi 4 250 7 7,000 80 17 5,440 12,440
Sh.Funadhoo 4 200 3 2,400 80 7 2,240 4,640

Economic Survey, 2007-2008
10
Department of National Planning, Male’
Sh.Milandhoo 3 200 3 1,800 80 7 1,680 3,480
N.Manadhoo 4 200 6 4,800 80 11 3,520 8,320
N.Velidhoo 3 200 6 3,600 80 11 2,640 6,240
R.Ungoofaaru 4 200 3 2,400 80 9 2,880 5,280
R.Maakurathu 3 200 3 1,800 80 9 2,160 3,960
B.Eydhafushi 4 200 3 2,400 90 7 2,520 4,920
B.Fulhadhoo 2 200 3 1,200 90 7 1,260 2,460
Lh.Naifaru 4 250 5 5,000 60 10 2,400 7,400
Lh.Kurendhoo 2 250 5 2,500 60 10 1,200 3,700
K.Thulusdhoo 3
200 4 2,400
85 9 2,295 4,695
K.Maafushi 3
200 4 2,400
85 8 2,040 4,440
K.Kaashidhoo 3
200 3 2,400
85 6 1,530 3,930
Aa.Rasdhoo 4 250 3 3,000 80 5 1,600 4,600
Aa.Maalhos 2 250 3 1,500 1,500
Adh.Mahibadhoo 4 200 3 2,400 90 7 2,520 4,920
Adh.Dhangethi 2 200 3 1,200 90 7 1,260 2,460
V.Felidhoo 3 250 4 3,000 60 8 1,440 4,440
V.Rakeedhoo 3 150 4 1,800 60 8 1,440 3,240
M.Muli 3 85 9 2,295 2,295
M.Dhiggaru 3 150 5 2,250 80 9 2,160 4,410
F.Nilandhoo 3 200 3 1,800 80 8 1,920 3,720
F.Magoodhoo 3 175 3 1,575 80 8 1,920 3,495
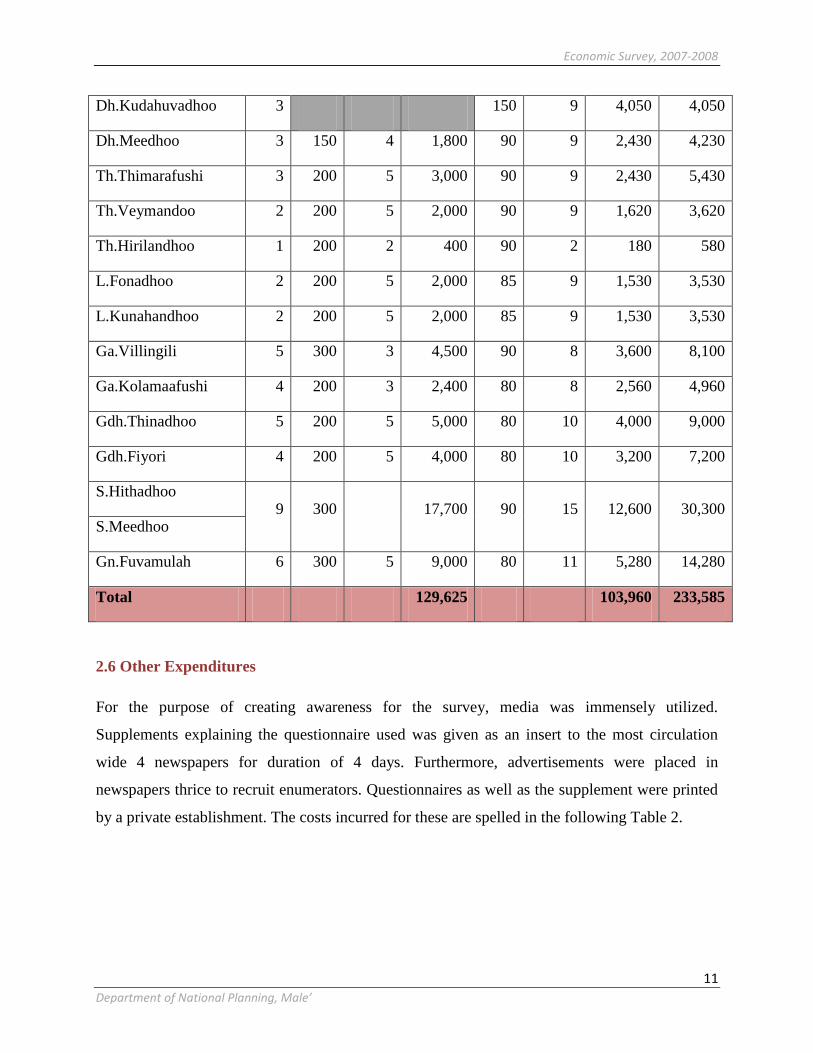
Economic Survey, 2007-2008
11
Department of National Planning, Male’
Dh.Kudahuvadhoo 3 150 9 4,050 4,050
Dh.Meedhoo 3 150 4 1,800 90 9 2,430 4,230
Th.Thimarafushi 3 200 5 3,000 90 9 2,430 5,430
Th.Veymandoo 2 200 5 2,000 90 9 1,620 3,620
Th.Hirilandhoo 1 200 2 400 90 2 180 580
L.Fonadhoo 2 200 5 2,000 85 9 1,530 3,530
L.Kunahandhoo 2 200 5 2,000 85 9 1,530 3,530
Ga.Villingili 5 300 3 4,500 90 8 3,600 8,100
Ga.Kolamaafushi 4 200 3 2,400 80 8 2,560 4,960
Gdh.Thinadhoo 5 200 5 5,000 80 10 4,000 9,000
Gdh.Fiyori 4 200 5 4,000 80 10 3,200 7,200
S.Hithadhoo 9 300 17,700 90 15 12,600 30,300
S.Meedhoo
Gn.Fuvamulah 6 300 5 9,000 80 11 5,280 14,280
Total 129,625 103,960 233,585
2.6 Other Expenditures
For the purpose of creating awareness for the survey, media was immensely utilized.
Supplements explaining the questionnaire used was given as an insert to the most circulation
wide 4 newspapers for duration of 4 days. Furthermore, advertisements were placed in
newspapers thrice to recruit enumerators. Questionnaires as well as the supplement were printed
by a private establishment. The costs incurred for these are spelled in the following Table 2.
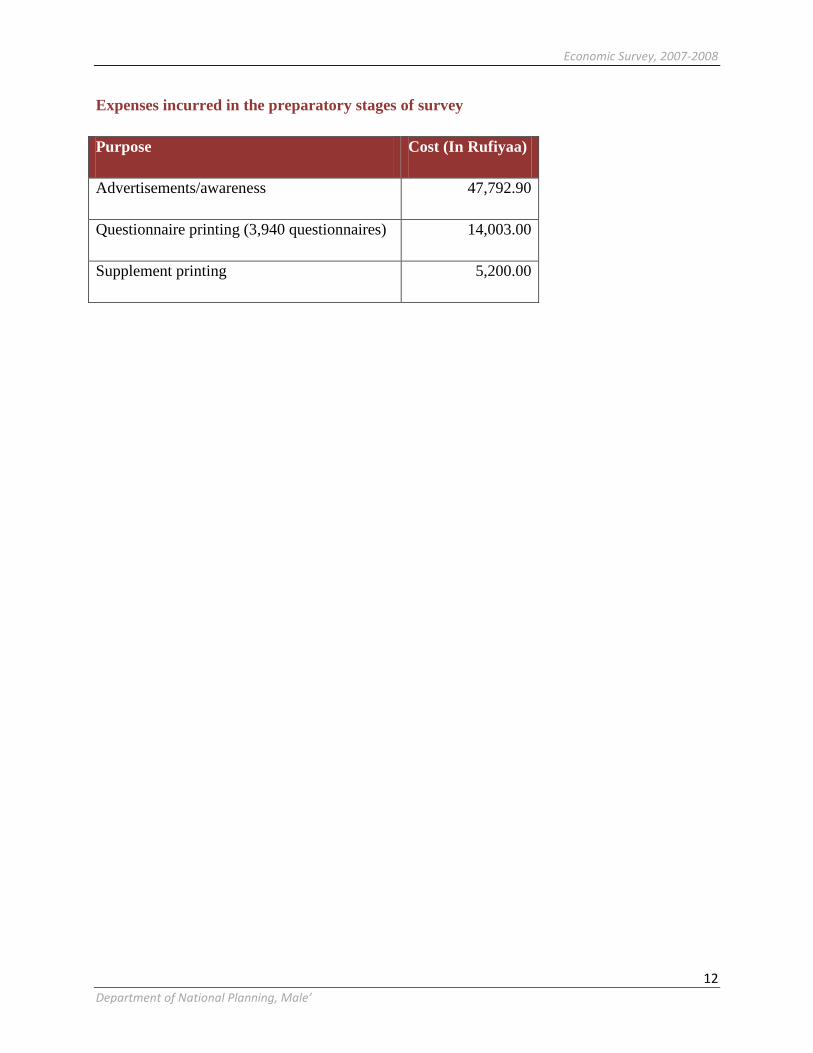
Economic Survey, 2007-2008
12
Department of National Planning, Male’
Expenses incurred in the preparatory stages of survey
Purpose Cost (In Rufiyaa)
Advertisements/awareness 47,792.90
Questionnaire printing (3,940 questionnaires) 14,003.00
Supplement printing 5,200.00
Economic Survey, 2007-2008
13
Department of National Planning, Male’
ANNEX 3: QUESTIONNAIRE DESIGN
The data collection period of the survey was November 2007 to September 2008.
Information collected from this survey include: characteristics of the establishment; employment
and remuneration; principal economic activity; main products produced and services provided by
the establishment; incomes and expenditures; purchases of fixed assets and general questions on
the establishment. The reference period of this survey is the calendar year 2007. That is January
2007 to December 2007. If the accounting year of the establishment differs from the calendar
year, then the part of the accounting year that coincided with more months from the calendar
year was taken as the reference year. For instance, if a company‟s accounting year is from March
2007 to February 2008 then the reference period should be 2007. However in the case of
household activities and for small establishments who do not maintain proper accounting
records, the reference period is the last month of operation which will finally be raised to the
number of months in operation during 2007.
This annex highlights the process of designing the Economic Survey questionnaire and the
major issues that arose during this process. Initially, it was proposed to use Small Establishment
Survey (SES) and Large Establishment survey (LES) questionnaire for data collection. SES and
LES had distinguished activity based income and expenditure sections for different sectors, for
instance questionnaire for tourism industry include; activity based information relating to bed
nights, number of rooms etc, income section include income from transportation, rooms etc,
expenditure section includes expenditure on bed tax, transfers etc. However, since we do not
have an appropriate list frame which identifies the sector or the activity the establishment
engages in, it was difficult to estimate a number of forms to be printed from each sector.
Therefore it was decided to design a new questionnaire with the combination of SES and LES
questionnaires so that one questionnaire could be used in the collection of data for all sectors.
A total of 40 questions were included in 10 different sections. Since the questionnaire is a
general questionnaire, each establishments need not to fill all of the 40 questions in the
questionnaire. They only need to fill the sections which are relevant to their industry or the
activity.
Q
U
E
S
T
I
O
N
N
A
I
R
E
D
E
S
I
G
N

Economic Survey, 2007-2008
14
Department of National Planning, Male’
Before finalizing the questionnaire, a meeting was held with the Economic Survey Steering
Committee which consists of members from stakeholder agencies, public and private agencies.
Issues were raised by the members regarding their area of concern, and the questionnaire as well
as the process of data collection was modified to allow for these concerns.
A. Sections in the questionnaire
Section 1 – Identification
Section 2 – Principal Activity
Section 3 – Activity Based Information
Section 4 – Organizational Status
Section 5 – Employment
Section 6 – Income
Section 7 – Expenditure
Section 8 – Capital Goods
Section 9 – Profits
Section 10 – General
All sections except section 3 were to be filled by all establishments. Section 3 was only for some
of the selected sectors/activities for which more information was felt needed.
Section 1: Identification:
The identification part includes the name, owner, and the block etc of the establishment. For each
establishment a unique Establishment ID was given for confidentiality purpose as suggested by
Economic Survey Steering Committee.
Economic Survey, 2007-2008
15
Department of National Planning, Male’
Section 2: Principal Activity
1. Specify the principal activity of this establishment
The principal activity refers to the activity which contributes the most for the establishments‟
linear income, for instance if the highest income is generated from provision of accommodation
services to the tourists, the principal activity will be operation of hotel even thought it earn
income from their bar sales. And for a manufacturing establishment when describing the
principal activity, merely “manufacturing of food” is not enough. Also need to specify the type
of food being manufactured. These items are to be written in detail so that it could be coded
according to the International Standard Industrial Classifications of all economic activities (ISIC)
4 digit level.
2. Commodities produced/Services provided by the establishment
In case a number of goods and services are being provided by the establishment, then write the
name of the major products/services on the basis of its value. If the establishment is a hotel
which operates restaurants, shops etc what is also operated by the management, then list those
here. It is also coded according to international coding system of “Central Product
Classification” (CPC).
Also establishments need to specify the principal activity carried out by ticking the most
appropriate one only from a list given from 1 to 17.
Section 3: Activity Based Information
This section contains 10 blocks of different sectors. All these blocks contain specific details of
the company about the principal activity which could be used as an indicator to represent the
whole economy, for instance the number of bed nights sold by a resort, the number of projects
carried out by the establishment during the reference period etc.
Out of the ten separate blocks for different sectors, establishments need fill the block which is
applicable to them, for instance a company which operates construction as their principal
activity; it should fill 3.6 of the section 3 only.
Economic Survey, 2007-2008
16
Department of National Planning, Male’
The section 2 of the questionnaire also indicates whether activity based information the
establishment needs to fill based on the main activity it is engaged in.
The sectors that included in this section are:
3.1 Manufacturing: - Ship/Boat Building:
The establishments need to fill this section based on the number of the ongoing projects; for each
vessel separately.
This section focuses on the costs that are directly benefiting the manufacture of ship/boat
building such as the materials and labour cost of the production are to be written mention in this
section. In addition, the total value of the project according to the type of vessel is also to be
included. The purpose of this section is to estimate the proportion of material cost based on
characteristics of the vessels.
3.2 Resorts, Hotels, Safari vessels and Guesthouses:
All resorts, hotels, safari vessels and guest houses need to fill this section of the activity based
information.
This section contains mainly the indicators that could be used for the estimation of the
contributions by the tourism sector to the GDP when representing to the whole economy, such as
the number of beds, number of bed nights sold, number of rooms, number of room nights sold
(occupied) and average room rate per night (Rufiyaa).
3.3 Health:
This sector mainly covers the number of out patients that have registered during the past month
and the number of doctors consulted the patients.
3.4 Fisheries:
This section contains a cross table of the type, characteristics, ownership and the methods of
financing for each vessel. The type of vessel is breakdown into mechanized and non mechanized
vessels where characteristics include the length, horsepower and the tonnage of the vessels. In
addition the number of days spent for fishing during the last working month.

Economic Survey, 2007-2008
17
Department of National Planning, Male’
This section also included:
How the fishing vessels are financed?
How the fish catch is distributed?
3.5 Education:
This section contains the number of students enrolled during the reference period and the average
fee per student in each sub categories of students. The sub categories are pre-school, primary,
secondary and higher secondary. One of the issues rose during the enumerators training was the
average fee per secondary student, whose fee varies from subject to subject. Hence, we trained
the enumerators to take an average fee for the total subjects and act accordingly in other similar
cases of this sector.
3.6 Construction:
Construction is the activity by which a building/structure is erected, renovated electrification or
prepared for construction. As the projects vary widely it was decided to collect information by
type of construction activity carried out.
This sector focuses on costs that are directly benefiting to the construction of residential, non-
residential buildings, major projects, such as the number of projects and the cost and materials if
it is a turnkey project and the cost of labour. In addition the values of the projects are also taken.
And this information can be expressed according to project classification.
The projects are to be classified under the following categories;
1. Residential Buildings
2. Non-Residential Buildings
3. Site preparation
4. Electrical/Mechanical contractors
5. Structural work/Interior/exterior finishing
6. Resort Construction
7. Major projects (Harbor, Roads, Seawall, Demolition of buildings, etc.)
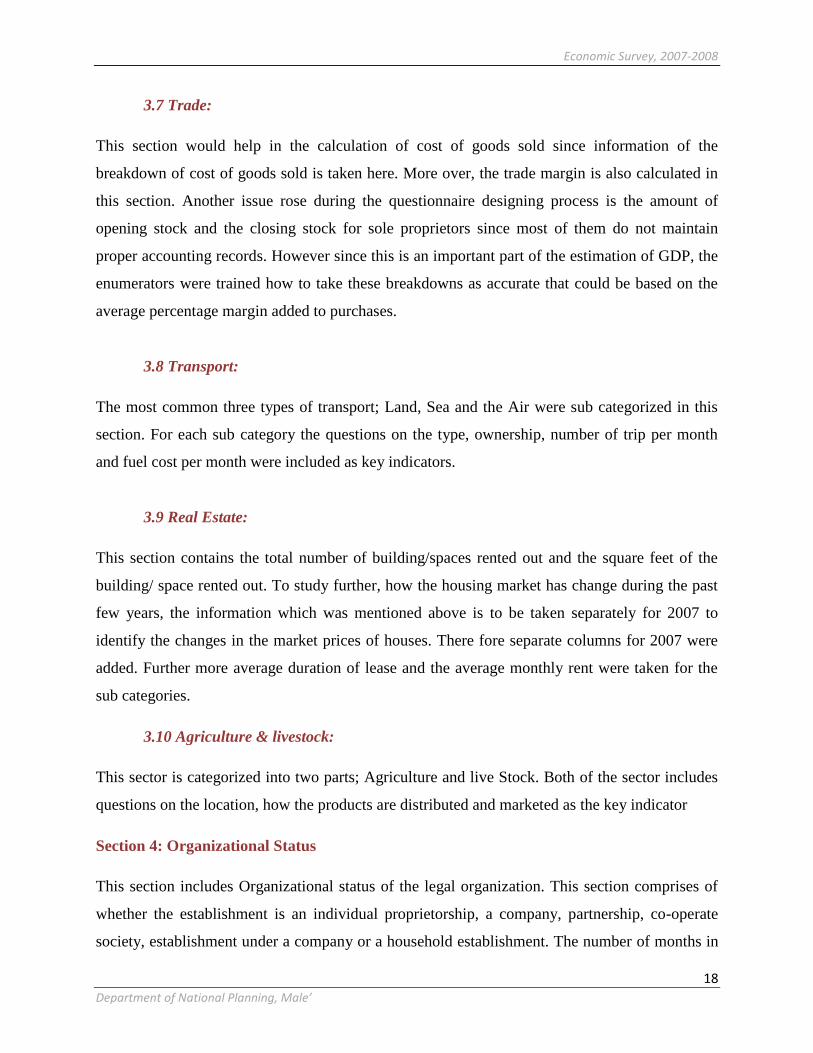
Economic Survey, 2007-2008
18
Department of National Planning, Male’
3.7 Trade:
This section would help in the calculation of cost of goods sold since information of the
breakdown of cost of goods sold is taken here. More over, the trade margin is also calculated in
this section. Another issue rose during the questionnaire designing process is the amount of
opening stock and the closing stock for sole proprietors since most of them do not maintain
proper accounting records. However since this is an important part of the estimation of GDP, the
enumerators were trained how to take these breakdowns as accurate that could be based on the
average percentage margin added to purchases.
3.8 Transport:
The most common three types of transport; Land, Sea and the Air were sub categorized in this
section. For each sub category the questions on the type, ownership, number of trip per month
and fuel cost per month were included as key indicators.
3.9 Real Estate:
This section contains the total number of building/spaces rented out and the square feet of the
building/ space rented out. To study further, how the housing market has change during the past
few years, the information which was mentioned above is to be taken separately for 2007 to
identify the changes in the market prices of houses. There fore separate columns for 2007 were
added. Further more average duration of lease and the average monthly rent were taken for the
sub categories.
3.10 Agriculture & livestock:
This sector is categorized into two parts; Agriculture and live Stock. Both of the sector includes
questions on the location, how the products are distributed and marketed as the key indicator
Section 4: Organizational Status
This section includes Organizational status of the legal organization. This section comprises of
whether the establishment is an individual proprietorship, a company, partnership, co-operate
society, establishment under a company or a household establishment. The number of months in

Economic Survey, 2007-2008
19
Department of National Planning, Male’
operation during the reference period is also included in order to use it for raising the figures to
the whole year. Another important question which was discussed to introduce to this
questionnaire was the year of commence of the establishment to generate the data for the base
year of the survey.
Section 5: Employment
This section contains a cross table of the number of Maldivian and foreign employees by sex.
The details of remuneration paid including wages and salaries, health benefits and other benefits
such as food and accommodation etc are included. In order to estimate the productivity of the
household, the numbers of unpaid family workers are also taken here.
This data will be vital for a detail analysis of the compensation paid to local and expatriate
employees. In addition the wage differentials of different sectors, can be analysed using this data.
Section 6: Income
The income is the output of the establishment by its economic activity. It will be used to
calculate the Gross Domestic product (GDP), as GDP comprises of the difference of the output
and the input. Therefore the incomes that are directly from the main activity and the other
incomes such as rent receivables are taken separately in order to distinguish output from
transfers, property income etc.
Section 7: Expenditure
This section includes all expenses incurred by the main activity of the establishment. Moreover,
the expenses incurred are by the other activity i.e. for a construction company which builds
residential buildings, their expenses for main activity would be those expenses which directly
related to the construction of residential building, like material cost and labour cost. Other
expenses like rent paid for the land, interest paid to the bank will be included as other expenses.
Some of the expenses like Dividends, Depreciation, Electricity and Water are already included in
the questionnaire.

Economic Survey, 2007-2008
20
Department of National Planning, Male’
Section 8: Capital Goods
The main purpose of this section is to calculate the Gross Fixed Capital Formation of the
corporate sector. The value of capital goods bought during the period is one of the major
indicator to identify the size of the establishments is small or large. It also indicates the liquidity
position of the establishment and therefore the capital goods which were bought during the
reference period is taken separately.
Section 9: Profit
This section comprises of three parts i.e. the profit/loss of the establishment during the previous
accounting period or the average profit that it earns on average. This has to be included, to check
whether the incomes and expenditures that are given on the sections 6 and 7 respectively, are
matter-of-fact. To study the sector further, the changes in the level profit during the period on
monthly basis is also included to identify the seasonal fluctuations of the sector.
Section 10: General
This section focuses on major problems that are currently faced by the establishments. Partially
closed questions on the major problems that could be face by an establishment are listed, if any
issue is not mentioned they are to be written. Since different establishments have different issues,
they have to tick and rank according to the priority where number gives the main threat to run the
business. This would finally lead a list of issues in the Maldives for different sectors which could
be focused on to in the implementation National Development Plan.
To estimate how much the tsunami had effected in the level of contribution to the GDP by each
sector, the establishment is asked how much it was effect by the tsunami on their properties and
the turn over. To estimate how much the establishment related to tourism sector, what percentage
of income is derived from the tourism sector out of the total income was asked in the
questionnaire.
To monitor the National Development Plan, the changes in the level of employment of the
establishment during the next three years were also included.

Economic Survey, 2007-2008
21
Department of National Planning, Male’

Economic Survey, 2007-2008
22
Department of National Planning, Male’

Economic Survey, 2007-2008
23
Department of National Planning, Male’
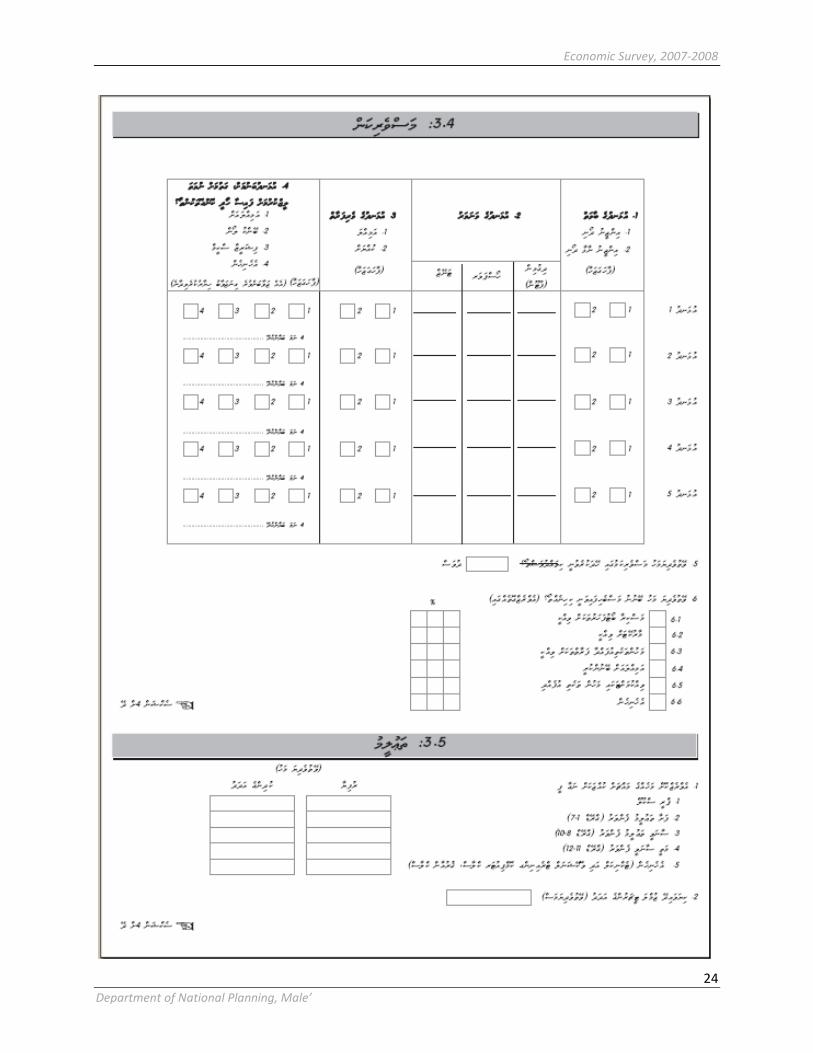
Economic Survey, 2007-2008
24
Department of National Planning, Male’

Economic Survey, 2007-2008
25
Department of National Planning, Male’
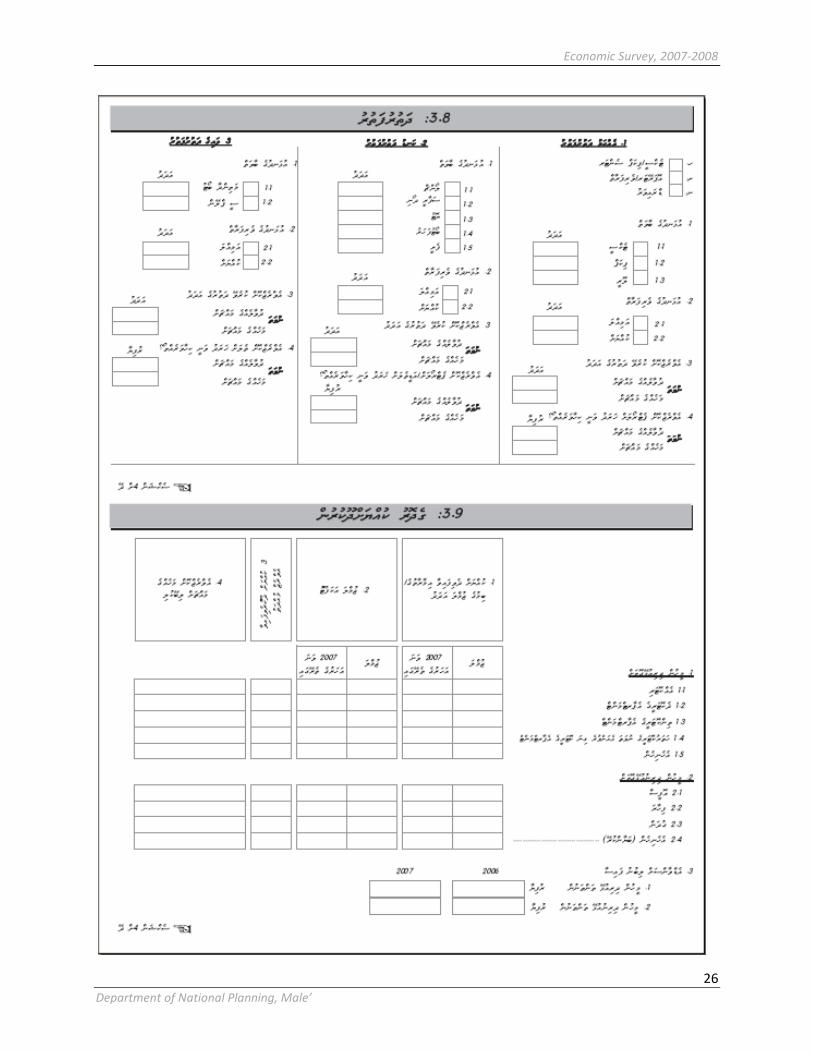
Economic Survey, 2007-2008
26
Department of National Planning, Male’

Economic Survey, 2007-2008
27
Department of National Planning, Male’
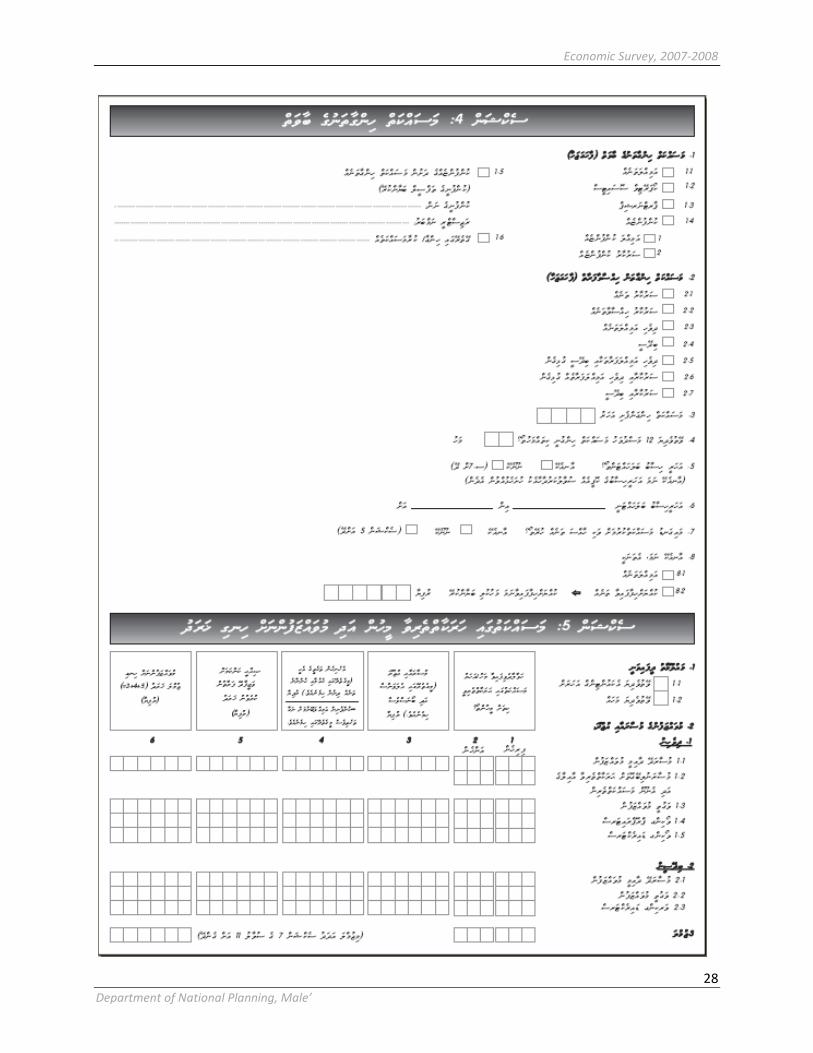
Economic Survey, 2007-2008
28
Department of National Planning, Male’

Economic Survey, 2007-2008
29
Department of National Planning, Male’

Economic Survey, 2007-2008
30
Department of National Planning, Male’
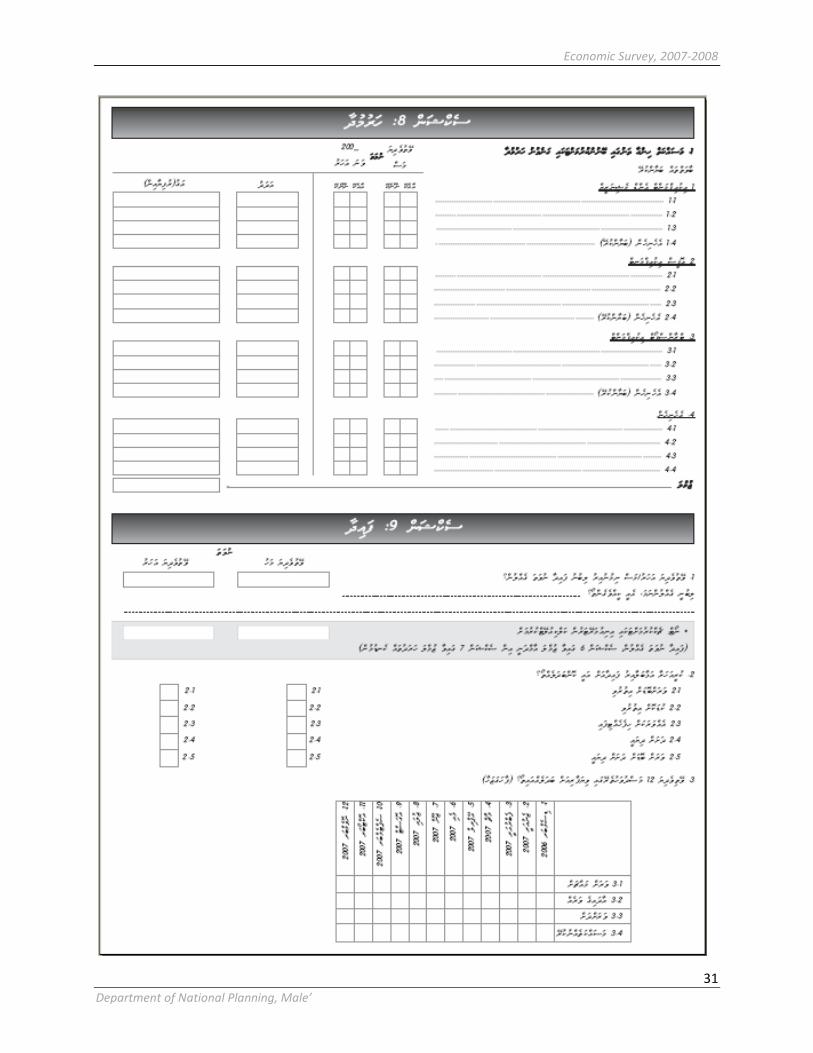
Economic Survey, 2007-2008
31
Department of National Planning, Male’
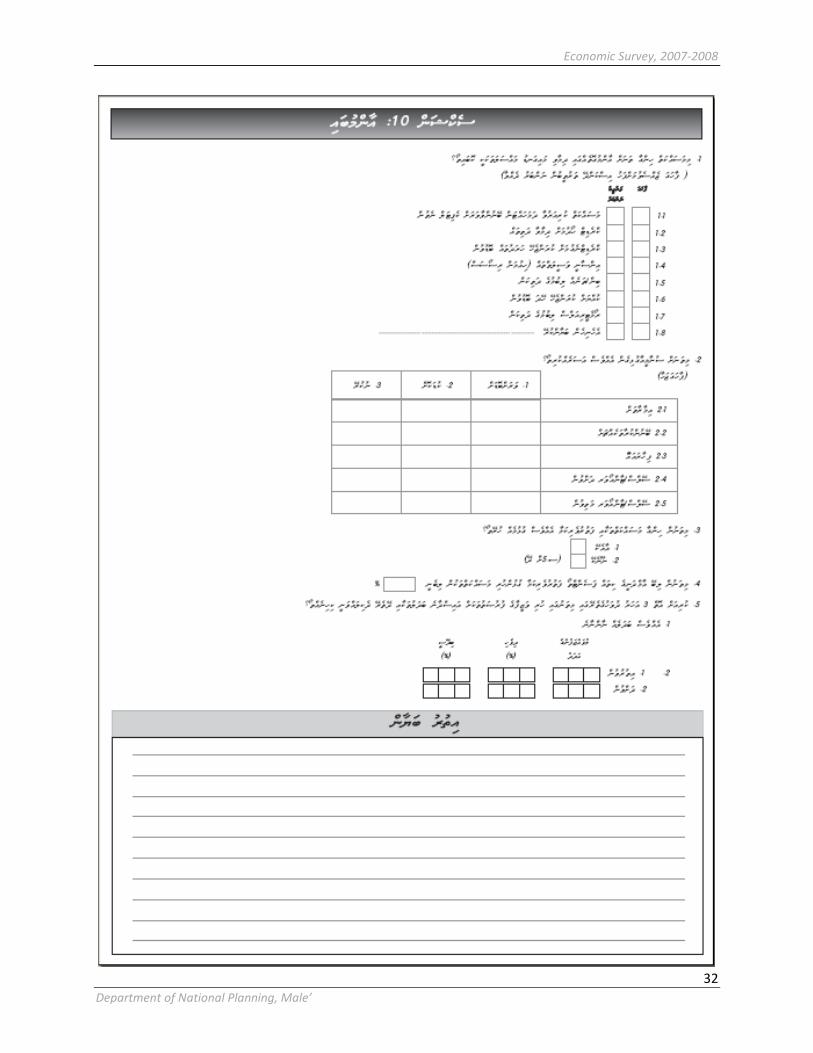
Economic Survey, 2007-2008
32
Department of National Planning, Male’

Economic Survey, 2007-2008
33
Department of National Planning, Male’

Economic Survey, 2007-2008
34
Department of National Planning, Male’

Economic Survey, 2007-2008
35
Department of National Planning, Male’
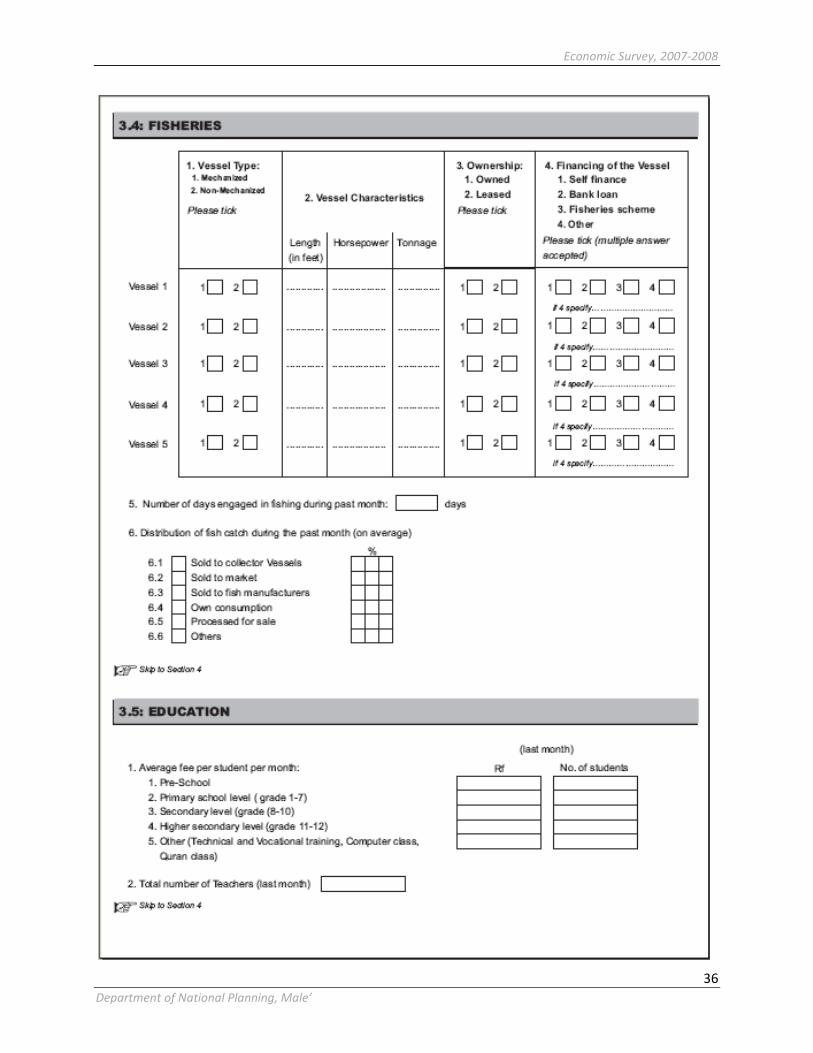
Economic Survey, 2007-2008
36
Department of National Planning, Male’

Economic Survey, 2007-2008
37
Department of National Planning, Male’

Economic Survey, 2007-2008
38
Department of National Planning, Male’

Economic Survey, 2007-2008
39
Department of National Planning, Male’
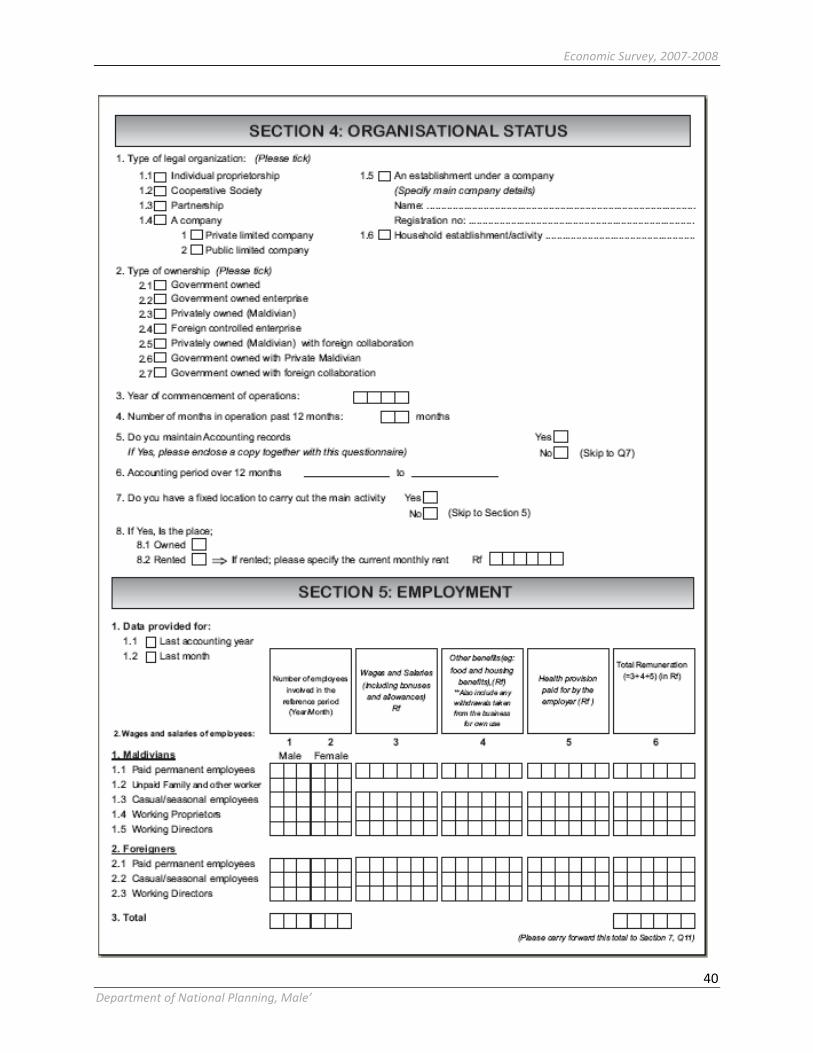
Economic Survey, 2007-2008
40
Department of National Planning, Male’

Economic Survey, 2007-2008
41
Department of National Planning, Male’

Economic Survey, 2007-2008
42
Department of National Planning, Male’

Economic Survey, 2007-2008
43
Department of National Planning, Male’

Economic Survey, 2007-2008
44
Department of National Planning, Male’
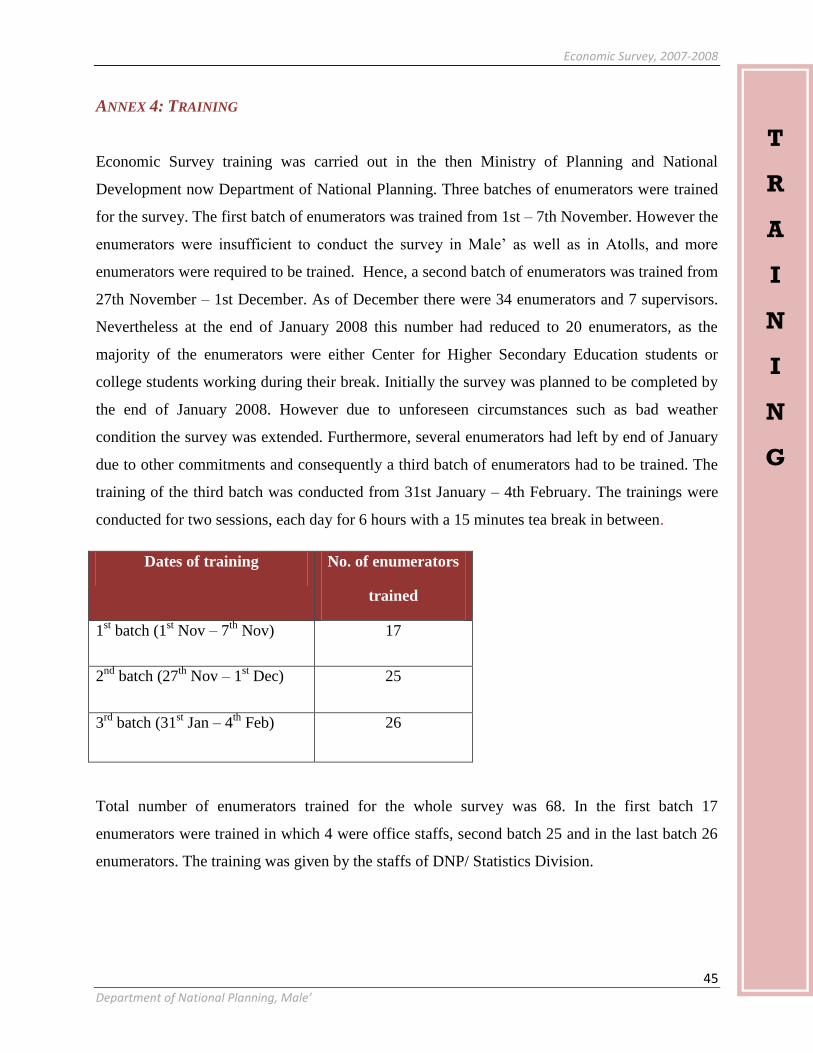
Economic Survey, 2007-2008
45
Department of National Planning, Male’
ANNEX 4: TRAINING
Economic Survey training was carried out in the then Ministry of Planning and National
Development now Department of National Planning. Three batches of enumerators were trained
for the survey. The first batch of enumerators was trained from 1st – 7th November. However the
enumerators were insufficient to conduct the survey in Male‟ as well as in Atolls, and more
enumerators were required to be trained. Hence, a second batch of enumerators was trained from
27th November – 1st December. As of December there were 34 enumerators and 7 supervisors.
Nevertheless at the end of January 2008 this number had reduced to 20 enumerators, as the
majority of the enumerators were either Center for Higher Secondary Education students or
college students working during their break. Initially the survey was planned to be completed by
the end of January 2008. However due to unforeseen circumstances such as bad weather
condition the survey was extended. Furthermore, several enumerators had left by end of January
due to other commitments and consequently a third batch of enumerators had to be trained. The
training of the third batch was conducted from 31st January – 4th February. The trainings were
conducted for two sessions, each day for 6 hours with a 15 minutes tea break in between.
Dates of training No. of enumerators
trained
1st batch (1
st Nov – 7
th Nov) 17
2nd
batch (27th
Nov – 1st Dec) 25
3rd
batch (31st Jan – 4
th Feb) 26
Total number of enumerators trained for the whole survey was 68. In the first batch 17
enumerators were trained in which 4 were office staffs, second batch 25 and in the last batch 26
enumerators. The training was given by the staffs of DNP/ Statistics Division.
T
R
A
I
N
I
N
G
Economic Survey, 2007-2008
46
Department of National Planning, Male’
4.1 Training
A training material package was prepared which included questionnaire, presentation slide and
exercises. Presentations were prepared using power-point with elaborated examples explaining
the contents of the questions, discussions, question and answer sessions and practical role play.
As the applicants (most) were secondary school leavers, a lot of effort was taken to bring them
up to certain level in understanding the economic activities. The contents of the training include:
1. Introduction
Introduction says that the economic survey was the first of its kinds integrating the economic
entities/production unit of the country. It also highlighted the past surveys such as Household
Income and Expenditure Survey (HIES), Small Establishment Survey (SES) and Large
Establishment Survey (LES) and the purpose of integrating the three major surveys. It also
focused on the objectives and how the data will be used in the end.
2. Interviewing techniques
The enumerators were given a special trainings session regarding the interviewing techniques
and procedures. This included the roles and duties of the enumerators on the filed as well as in
the office, how the questions should be asked, how to deal with refusals, and how to be an
effective interviewer. In addition to this, enumerators were trained to give a brief door step
introduction on the survey. At the beginning of each training round special attention was given
on the confidentiality of the information collected.
3. Explanation of the questionnaire
Initially a brief introduction of questionnaire was given to the enumerators. Special attention
was given to the activity based areas as this area was unique for different types of activities. The
training was carried out in a very interactive atmosphere which helped the enumerators to clarify
their doubts as well as the trainers to study the question in depth. Strict orders on how to fill the
questionnaire, following skips, following instructions, detailing out income and expenditures as
much as possible, being neutral in politics was given. During the training session enumerators
came up with lots of questions, some of them being calculating the trade margin, calculating cost
Economic Survey, 2007-2008
47
Department of National Planning, Male’
of good sold, how to treat with different cases in construction sector, the reference periods
especially on fixed asset section. More questions were asked on construction, trade, real estate
sectors and fixed assets section. Also questions on business accounting principles and economic
accounting principles were asked and trainers clarified these by means of examples.
4. Training on coding
The questionnaire was designed to obtain the main activity of the establishment, i.e. the activity
which contributes the largest share of income to that establishment. In order to standardize these
activities international classification was used to code these activities. International Standard
Classification of all Economic Activities (ISIC) revision 3 was used to code the industry of the
establishment and the product or service provided by the establishment was coded using Central
Product Classification (CPC).
The ISIC codes were planned to code for 4 digit level. In order to give these codes for 4 digit
level the enumerators were advised to take the description of the activity as detail as possible.
And to get more idea about how these industries are classified in ISIC, enumerators were given a
copy of the classification and explained how the activities are coded. In addition to ISIC, CPC
and Atoll Islands codes were explained during the session. The same Atoll/Island codes which
were used in Census were used in Economic Survey. During the session relevant examples were
explained and exercises were given to the enumerators in order to familiarize with the codes.
4.2 Enumerators Agreement
At the end of the each training batch the enumerators were asked to sign the confidentiality
agreement. The purpose of this was to have a clear understanding between the enumerators and
the department about the survey rules and regulations. The agreement includes rules and
regulations about data collection, discipline at work, confidentiality of the survey, payment
statements, and penalties for violation of these rules. A signed copy of agreement was given to
each enumerator for their own reference.

Economic Survey, 2007-2008
48
Department of National Planning, Male’
ANNEX 5: FIELD OPERATION
Economic Survey field operation started on 7th November 2007 with 16 enumerators and 3
supervisors. Enumerators reported to the ministry at 8:30 in order to complete the registration
and sign the agreement. This agreement was a written deed between the enumerators and the
ministry. It included the general rules when collecting information, conduct of the enumerators,
confidentiality of the information taken, pay for the enumerators, and the penalty if the rules are
violated. Field operation officially started at 13:00 after lunch break on 7th November.
Field operation was carried out regularly except for Fridays. The starting time was 8:30 for the
weekdays and 9:00 for Saturdays. The finishing time was 17:00.
Economic Survey data collection was done in Male, and 2 islands from each atoll and 3 special
islands.
6.1 Atoll Enumeration
Data collection in the atolls started on 8th December 2007 and was completed in six rounds of
data collection. Two islands from each atoll were enumerated. The enumeration was done for list
based and area based, however it was decided to get a list of establishments from island offices
so as not to miss out any economic activity undertaken in that island.
HA. team and HDh team traveled together by air to HDh. Hanimadhoo. From HDh. Hanimadhoo
2 teams changed there route to their final destinations. The teams going to Sh, N and R atoll
traveled together as well. They journeyed from Male‟ via speed launch to the northern most Sh.
Atoll as a final destination, dropping the respective teams to the atolls en-route. Likewise, the
same methodology was followed after the field operation, on the return trip.
The B and Lh Atoll teams traveled together from Male‟, reaching Lh Atoll after dropping the B
Atoll team and returned the same way. AA and ADh Atoll teams traveled in separate speed
boats. V, M, F and Dh Atoll teams traveled on the same day from Male‟ but in 2 speed boats. V
and M. Atoll teams together and F and Dh Atoll teams went together. Th and L. Atoll teams
traveled first to L Atoll by air, after completing L Atoll 2 islands, the same team traveled to Th
Atoll. This team‟s return was from L. Atoll to Male‟.
F
I
E
L
D
O
P
E
R
A
T
I
O
N

Economic Survey, 2007-2008
49
Department of National Planning, Male’
Ga and GDh Atoll teams traveled together by air to GDh Kadhedhoo, from there onwards 2
teams separated to their assigned destinations and travelled by speed boats. These 2 teams return
was from GDh Kadhedhoo to Male‟. S and Gn Atoll teams traveled together by air to S Gan.
This team worked in S Atoll first and then separated into two teams while one team went to Gn
Atoll. These 2 teams returned to Male‟ via air from the S Gan Airport.
Round Date Islands enumerated No.of
enumerators
No.of
supervisors
No.of
coordinators
1 8th
– 15th
Dec 2007
L. Fonadhoo,
Kunahandhoo
Th.Veymandoo,
Thimarafushi,
Hirilandhoo*
6 2 1
2 10th
– 15th
Dec 2007 AA.Rasdhoo,
Maalhos 4 1 0
10th
– 15th
Dec 2007 Adh.Mahibadhoo,
Dhangethi 4 1 0
10th
– 15th
Dec 2007 B.Eydhafushi,
Fulhadhoo 6 1 0
10th
– 15th
Dec 2007 Lh.Naifaru,
Kurendhoo 10 1 1
3 20th
Dec – 2nd
Jan 2008
S.Hithadhoo,
Meedhoo
Gn.Fuvamulah
10 4 1
26th
Dec – 7th
Jan 2008 HDh.Kulhudhuffushi,
Kurinbi 6 2 1
26th
Dec – 1st Jan 2008
HA.Dhidhoo,
Vashafaru 6 1 1
4th
– 11th
Jan 2008 GA.Kolamaafushi,
Villingili 4 2 1

Economic Survey, 2007-2008
50
Department of National Planning, Male’
4th
– 11th
Jan 2008 GDh, Thinadhoo,
Fiyori 4 2 1
4 14th
– 20th
Jan 2008 Sh.Funadhoo,
Milandhoo 4 3 1
14th
– 20th
Jan 2008 N.Manadhoo,
Velidhoo 9 1 1
14th
– 20th
Jan 2008 R.Ungoofaaru,
Maakurathu 6 2 1
5 24th
– 29th
Jan 2008 V.Felidhoo,
Rakeedhoo 5 2 1
24th
– 29th
Jan 2008 M.Muli, Dhiggaru 7 1 1
24th
– 29th
Jan 2008 F.Nilandhoo,
Magoodhoo 4 2 1
24th
– 29th
Jan 2008 Dh.Kudahuvadhoo,
Meedhoo 7 2 1
6 21st – 24
th Feb 2008
K.Thulusdhoo,
Maafushi,
Kaashidhoo*
6 2
5th Dec Gulhi* 10 2 1
* Special Islands
Special Islands
Special islands were those islands where an economic activity was undertaken on a very large
scale. In this survey three special islands were taken. They were K.Gulhi, K.Kaashidhoo and
Th.Hirilandhoo. K.Gulhi and Th.Hirilandhoo were selected for their boat building activity and
K.Kaashidhoo, HA.Maafahi, HDh.Vakara-muraadhoo, HDh.Theefaridhoo, Sh.Madidhoo for
agriculture. However, data for HDh.Theefaridhoo was unable to capture.
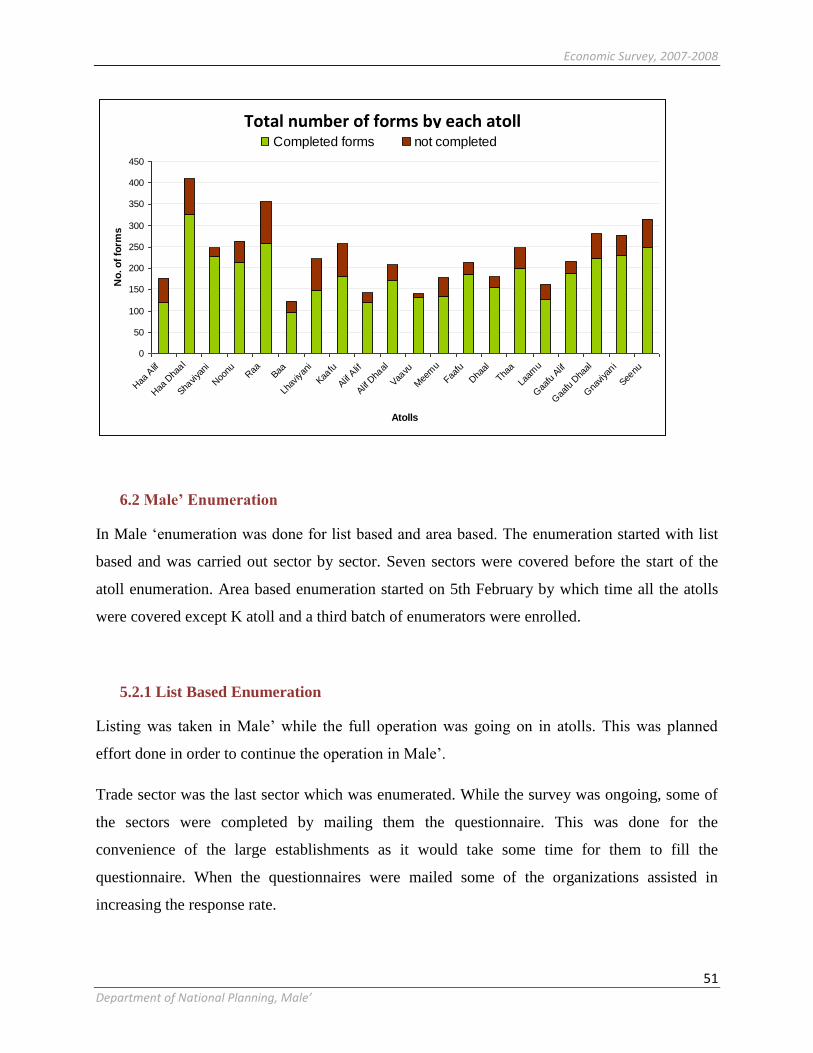
Economic Survey, 2007-2008
51
Department of National Planning, Male’
6.2 Male’ Enumeration
In Male „enumeration was done for list based and area based. The enumeration started with list
based and was carried out sector by sector. Seven sectors were covered before the start of the
atoll enumeration. Area based enumeration started on 5th February by which time all the atolls
were covered except K atoll and a third batch of enumerators were enrolled.
5.2.1 List Based Enumeration
Listing was taken in Male‟ while the full operation was going on in atolls. This was planned
effort done in order to continue the operation in Male‟.
Trade sector was the last sector which was enumerated. While the survey was ongoing, some of
the sectors were completed by mailing them the questionnaire. This was done for the
convenience of the large establishments as it would take some time for them to fill the
questionnaire. When the questionnaires were mailed some of the organizations assisted in
increasing the response rate.
Total number of forms each atoll
0
50
100
150
200
250
300
350
400
450
Haa
Alif
Haa
Dha
al
Shaviya
ni
Noo
nu Raa
Baa
Lhav
iyan
i
Kaafu
Alif A
lif
Alif D
haal
Vaavu
Mee
mu
Faafu
Dha
al
Thaa
Laam
u
Gaa
fu A
lif
Gaa
fu D
haal
Gna
viya
ni
Seenu
Atolls
No
. o
f fo
rms
Completed forms not completed
Total number of forms by each atoll
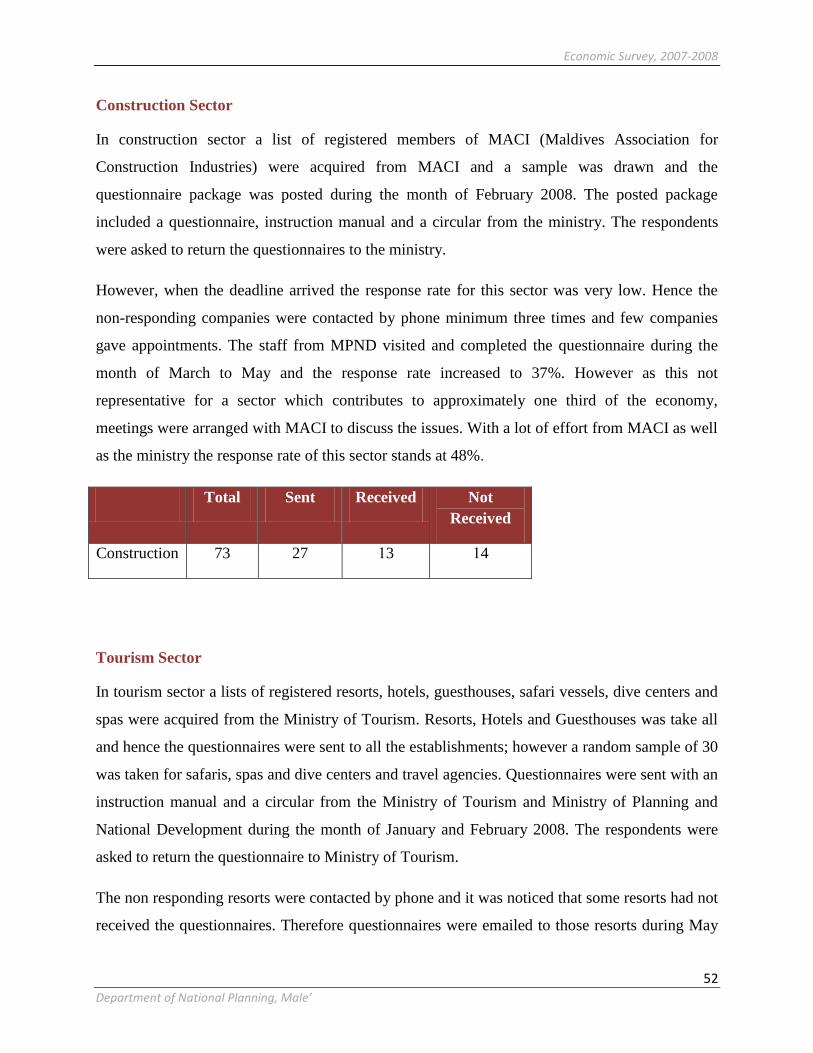
Economic Survey, 2007-2008
52
Department of National Planning, Male’
Construction Sector
In construction sector a list of registered members of MACI (Maldives Association for
Construction Industries) were acquired from MACI and a sample was drawn and the
questionnaire package was posted during the month of February 2008. The posted package
included a questionnaire, instruction manual and a circular from the ministry. The respondents
were asked to return the questionnaires to the ministry.
However, when the deadline arrived the response rate for this sector was very low. Hence the
non-responding companies were contacted by phone minimum three times and few companies
gave appointments. The staff from MPND visited and completed the questionnaire during the
month of March to May and the response rate increased to 37%. However as this not
representative for a sector which contributes to approximately one third of the economy,
meetings were arranged with MACI to discuss the issues. With a lot of effort from MACI as well
as the ministry the response rate of this sector stands at 48%.
Total Sent Received Not
Received
Construction 73 27 13 14
Tourism Sector
In tourism sector a lists of registered resorts, hotels, guesthouses, safari vessels, dive centers and
spas were acquired from the Ministry of Tourism. Resorts, Hotels and Guesthouses was take all
and hence the questionnaires were sent to all the establishments; however a random sample of 30
was taken for safaris, spas and dive centers and travel agencies. Questionnaires were sent with an
instruction manual and a circular from the Ministry of Tourism and Ministry of Planning and
National Development during the month of January and February 2008. The respondents were
asked to return the questionnaire to Ministry of Tourism.
The non responding resorts were contacted by phone and it was noticed that some resorts had not
received the questionnaires. Therefore questionnaires were emailed to those resorts during May
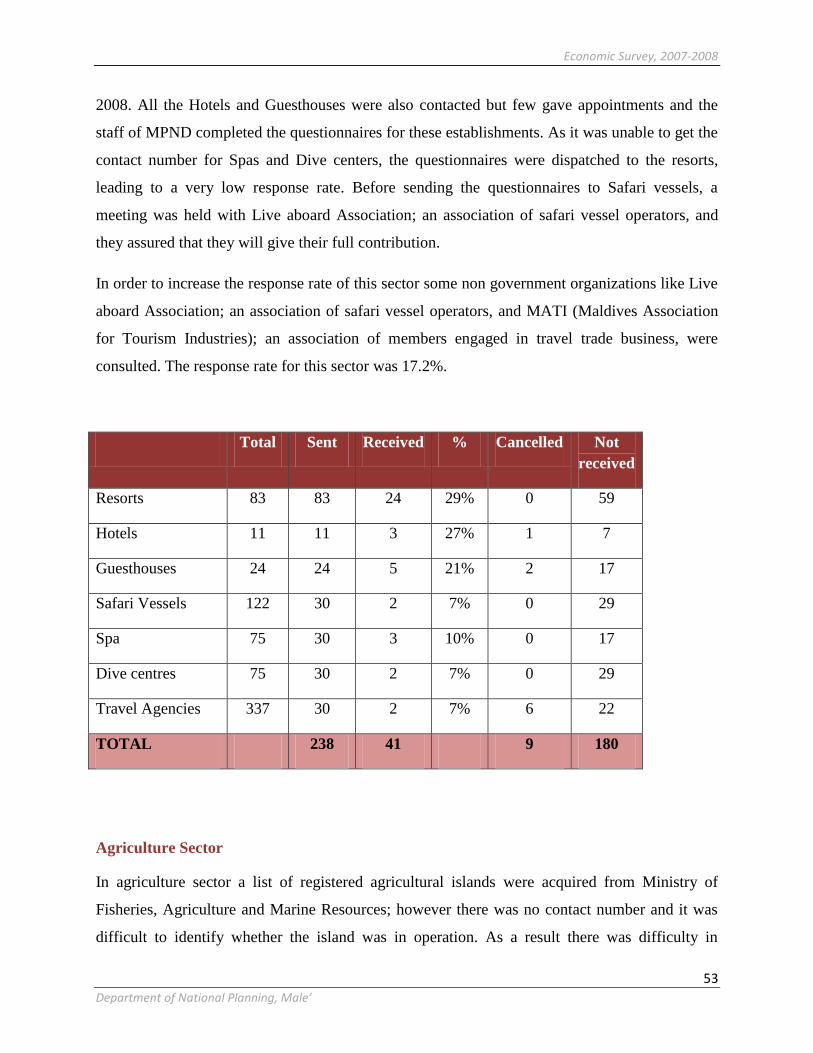
Economic Survey, 2007-2008
53
Department of National Planning, Male’
2008. All the Hotels and Guesthouses were also contacted but few gave appointments and the
staff of MPND completed the questionnaires for these establishments. As it was unable to get the
contact number for Spas and Dive centers, the questionnaires were dispatched to the resorts,
leading to a very low response rate. Before sending the questionnaires to Safari vessels, a
meeting was held with Live aboard Association; an association of safari vessel operators, and
they assured that they will give their full contribution.
In order to increase the response rate of this sector some non government organizations like Live
aboard Association; an association of safari vessel operators, and MATI (Maldives Association
for Tourism Industries); an association of members engaged in travel trade business, were
consulted. The response rate for this sector was 17.2%.
Total Sent Received % Cancelled Not
received
Resorts 83 83 24 29% 0 59
Hotels 11 11 3 27% 1 7
Guesthouses 24 24 5 21% 2 17
Safari Vessels 122 30 2 7% 0 29
Spa 75 30 3 10% 0 17
Dive centres 75 30 2 7% 0 29
Travel Agencies 337 30 2 7% 6 22
TOTAL 238 41 9 180
Agriculture Sector
In agriculture sector a list of registered agricultural islands were acquired from Ministry of
Fisheries, Agriculture and Marine Resources; however there was no contact number and it was
difficult to identify whether the island was in operation. As a result there was difficulty in
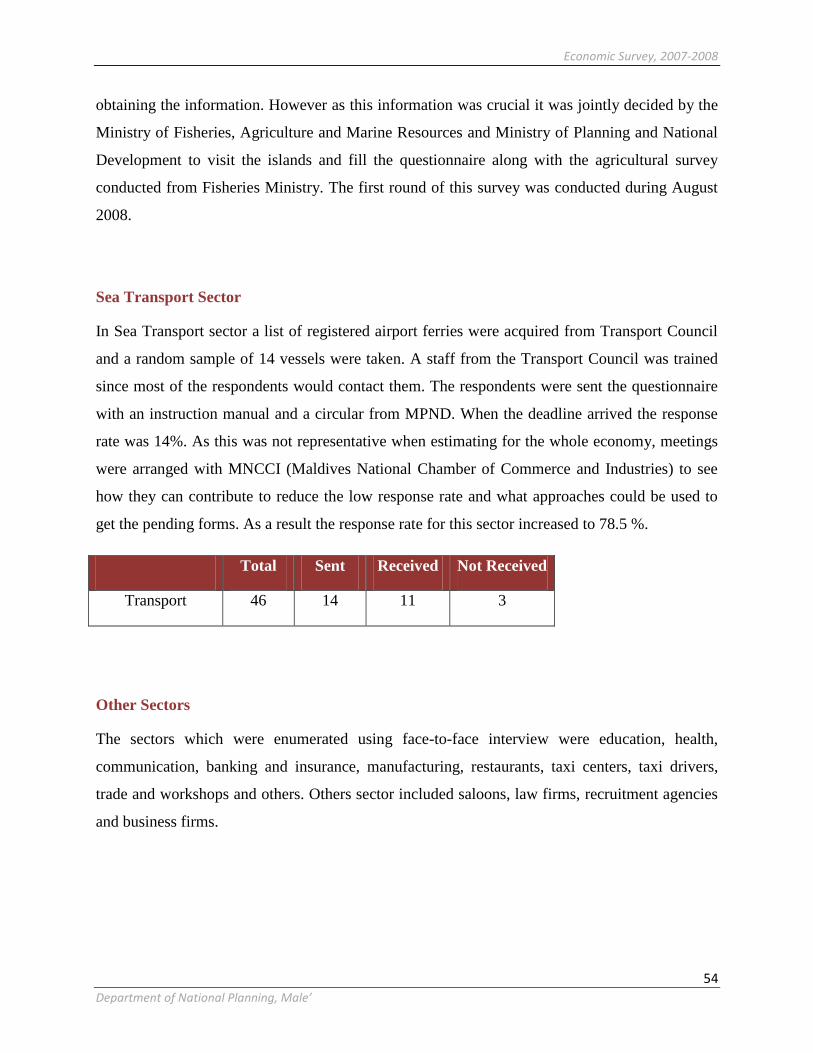
Economic Survey, 2007-2008
54
Department of National Planning, Male’
obtaining the information. However as this information was crucial it was jointly decided by the
Ministry of Fisheries, Agriculture and Marine Resources and Ministry of Planning and National
Development to visit the islands and fill the questionnaire along with the agricultural survey
conducted from Fisheries Ministry. The first round of this survey was conducted during August
2008.
Sea Transport Sector
In Sea Transport sector a list of registered airport ferries were acquired from Transport Council
and a random sample of 14 vessels were taken. A staff from the Transport Council was trained
since most of the respondents would contact them. The respondents were sent the questionnaire
with an instruction manual and a circular from MPND. When the deadline arrived the response
rate was 14%. As this was not representative when estimating for the whole economy, meetings
were arranged with MNCCI (Maldives National Chamber of Commerce and Industries) to see
how they can contribute to reduce the low response rate and what approaches could be used to
get the pending forms. As a result the response rate for this sector increased to 78.5 %.
Total Sent Received Not Received
Transport 46 14 11 3
Other Sectors
The sectors which were enumerated using face-to-face interview were education, health,
communication, banking and insurance, manufacturing, restaurants, taxi centers, taxi drivers,
trade and workshops and others. Others sector included saloons, law firms, recruitment agencies
and business firms.

Economic Survey, 2007-2008
55
Department of National Planning, Male’
Total sample Cancelled Received Not
Received
Education 83 83 34 43 6
Health 30 30 4 23 3
Banks &
Insurance
12 12 1 10 1
Communication 42 42 24 7 11
Manufacturing 305 305 79 159 67
Restaurants 99 99 13 66 20
Taxi Drivers 86 86 8 37 41
Taxi Centers 9 9 1 6 2
Trade 1455 1455 449 227 779
Others 199 199 47 91 61
5.2.2 Area Based Enumeration
Area based enumeration was done in such a way that the households and establishments engaged
in any economic activity were identified from the listing and revisited by the enumerators to fill
the questionnaire. All the economic activities may not be functioning from an establishment,
hence the listing provided these household activities as well as those carried out without a
specific premise. When the listing was completed, all the places for which the questionnaire
needs to be filled was identified and then crosschecked from the list based sample in order to
avoid duplication.
By March, slip was introduced to be given to those respondents whom the enumerators were
unable to meet even after more than three visits. These respondents were asked to call a toll free

Economic Survey, 2007-2008
56
Department of National Planning, Male’
number (8003348317) at a convenient time so that they may be enumerated. Appointments were
made and follow up visits were carried out.
5.3 Interview Methods
Economic Survey data was collected using two different methods. Postal method was used for
Construction, Tourism and Transport sectors. This was done for the convenience of the
respondents as most of the selected establishments in these sectors were large scale
establishments and it would take time for them to fill the questionnaire. All the other sectors
were enumerated using face-to-face interview method. This helped to boost the response rate
compared to postal method.
5.4 Monitoring
Enumerators report to the department and sign the attendance sheet before the start of the field
work. Lunch break was given from 12:00 to 13:30 and the field work finishes at 17:00. During
the lunch break all the enumerators return their files and completed questionnaires to the
respective supervisors. Enumerators were not allowed to take anything related to the survey
home with them except their name tags. This is done in order to maintain the confidentiality of
the survey.
5.5 Supervisors Role
The working time of the supervisors were also recorded and maintained for administrative
purposes such as allocating allowances. There were four enumerators (two teams) per supervisor
during Male‟ enumeration; however during atoll enumeration this number varied. The
supervisors stayed until their teams return from field work and handover the updates for the day.
At the end of each working day the enumerators complete a daily update sheet which shows the
number of places visited and the number of questionnaires completed. The supervisors then
update the original sheet and status is prepared at the end of each day which was used to monitor
the daily progress of the survey.

Economic Survey, 2007-2008
57
Department of National Planning, Male’
A slip was introduced to tackle the problem of head of activity being absent or when the
establishment was not accessible due to it being locked. When the slip was given some of the
respondents gave appointments and these were attended by the supervisors. This was done in
order to decrease the burden on the enumerators and hence speedup the field operation. When the
deadline of the slip was ended the response rate did not reach the expected level even at the end
of the time allotted for the „slip given establishments‟. Hence further attempt was made to call
back on these establishments but this did not increase the response any further.
5.6 Issues faced during field operation
Organization of trips within the short period of time with the same enumerators resulted
in incomplete listing forms and half complete questionnaires.
Due to the lack of supervisors and the large workload the work of the supervisors could
not be done effectively and hence some difficulties while monitoring the enumerators
came up.
Mis-communication and irresponsibility at the supervisory level lead to repeated visits
being made to some of the establishments and complaints from the respondents.
Survey was initiated not at the scale that it finally came about; hence a lot of managerial
failures occurred.
Political environment in the country lead to people getting false idea on the objective of
the survey and hence increasing the refusal cases and intolerable respondents.
Lack of space and staff constraint made it difficult to handle large number of enumerators
and smoothly carrying out the field operation.
Lack of support from some organization, government as well as private sector resulted in
use of lists which were not updated, and in some cases no lists on certain activities
resulted in difficulties of locating the establishments as well as in being unable to get a
frame for all activities.
Support from some Island offices, Atoll offices and the people of the islands made it easy
to carryout the survey in those islands successfully.
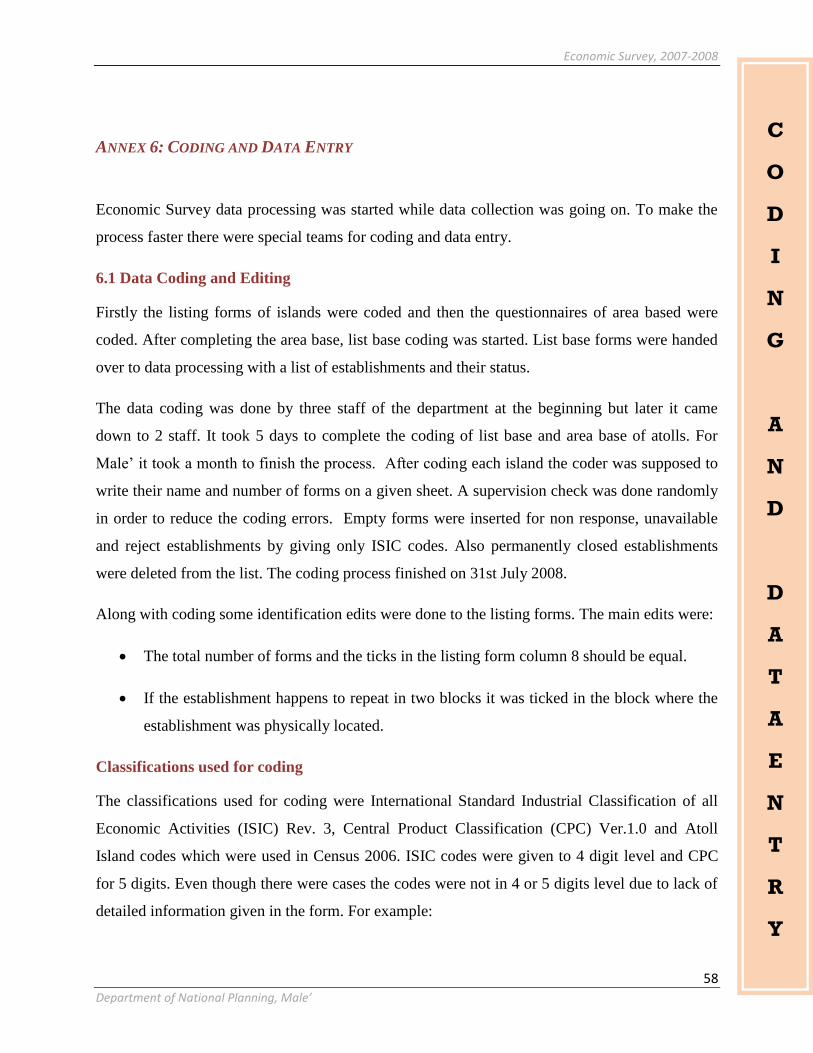
Economic Survey, 2007-2008
58
Department of National Planning, Male’
ANNEX 6: CODING AND DATA ENTRY
Economic Survey data processing was started while data collection was going on. To make the
process faster there were special teams for coding and data entry.
6.1 Data Coding and Editing
Firstly the listing forms of islands were coded and then the questionnaires of area based were
coded. After completing the area base, list base coding was started. List base forms were handed
over to data processing with a list of establishments and their status.
The data coding was done by three staff of the department at the beginning but later it came
down to 2 staff. It took 5 days to complete the coding of list base and area base of atolls. For
Male‟ it took a month to finish the process. After coding each island the coder was supposed to
write their name and number of forms on a given sheet. A supervision check was done randomly
in order to reduce the coding errors. Empty forms were inserted for non response, unavailable
and reject establishments by giving only ISIC codes. Also permanently closed establishments
were deleted from the list. The coding process finished on 31st July 2008.
Along with coding some identification edits were done to the listing forms. The main edits were:
The total number of forms and the ticks in the listing form column 8 should be equal.
If the establishment happens to repeat in two blocks it was ticked in the block where the
establishment was physically located.
Classifications used for coding
The classifications used for coding were International Standard Industrial Classification of all
Economic Activities (ISIC) Rev. 3, Central Product Classification (CPC) Ver.1.0 and Atoll
Island codes which were used in Census 2006. ISIC codes were given to 4 digit level and CPC
for 5 digits. Even though there were cases the codes were not in 4 or 5 digits level due to lack of
detailed information given in the form. For example:
C
O
D
I
N
G
A
N
D
D
A
T
A
E
N
T
R
Y

Economic Survey, 2007-2008
59
Department of National Planning, Male’
If retail trade was written in the form, the ISIC code given was 521.
If only trade was written in the form, the ISIC code given was 5 only.
And 9999 was given to those which were not stated.
If there is more than one activity the code was given to the main activity which receives
the highest income.
6.2 Data Entry
Along with data coding the data processing was also started. The data entry program was
designed by using Access 2003. It took around 2 months to finish the data entry program. Before
starting the data entry a trial was carried out to check the program. Data entry started on 21st
February 2008. One day training was given to each key operator to get familiar with the forms
and understand the concepts of the economic survey.
Data Entry was done by 4 operators from 21st February to 22nd May, 3 operators from 25th May
to 6th July and 2 operators were till the end of the process. Data entry was done 8 hours per day
including a 45 minute break.
A unique serial number was given to each form before entering the data. Also a person number
and an activity number was given to each form according to the information on listing form in
order to identify if the person is engaged in more than one activity. The first batch entered was
the listing forms of Male‟. And after some point it was held back because the survey was going
on and listing forms were changing. The second batch which was entered was listing forms and
the area base forms of the atolls. After that the list base of atolls were entered.
6.3 Some difficulties faced in coding and data entry
Some difficulties faced in designing the data entry program arose due to the fact that some of the
fields in the questionnaire were not very clear. For example, activity serial number and
questionnaire serial numbers were not very clearly distinguished. Therefore, activity serial
number was left out and a number from the listing form was given to the questionnaire serial
number.

Economic Survey, 2007-2008
60
Department of National Planning, Male’
There were some difficulties faced during the data entry process due to the way the listing form
was designed. For example it does not match the lines on both pages.
Economic Survey, 2007-2008
61
Department of National Planning, Male’
ANNEX 7
INT
ER
NA
TIO
NL
ST
AN
DA
RD
IN
DU
ST
RIA
L C
LA
SS
FIC
AT
ION
FO
R A
LL
EC
ON
OM
IC A
CT
IVIT
IES
(IS
IC)
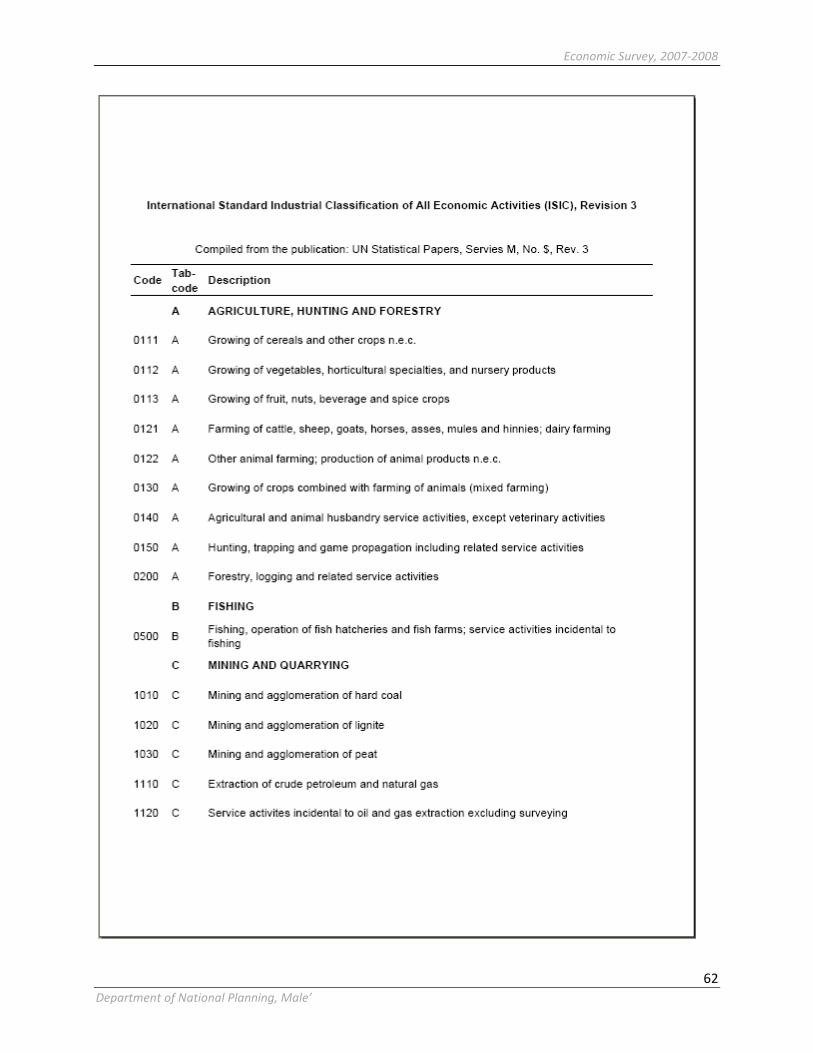
Economic Survey, 2007-2008
62
Department of National Planning, Male’

Economic Survey, 2007-2008
63
Department of National Planning, Male’

Economic Survey, 2007-2008
64
Department of National Planning, Male’
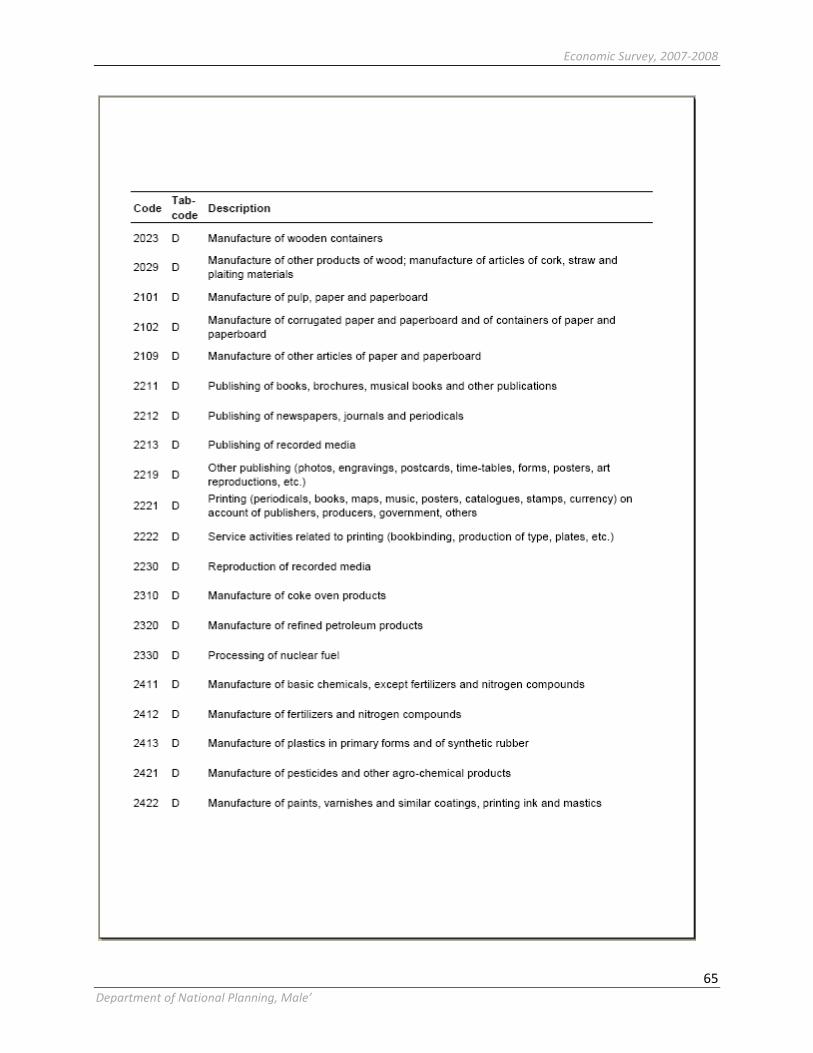
Economic Survey, 2007-2008
65
Department of National Planning, Male’
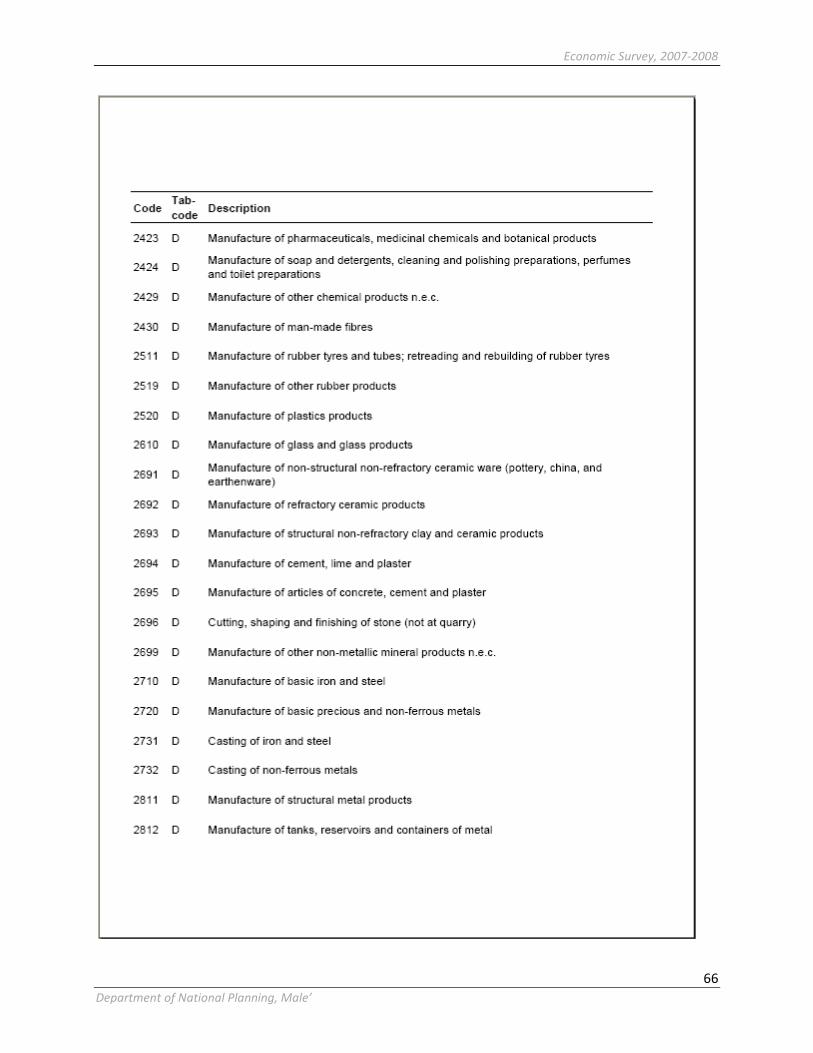
Economic Survey, 2007-2008
66
Department of National Planning, Male’

Economic Survey, 2007-2008
67
Department of National Planning, Male’
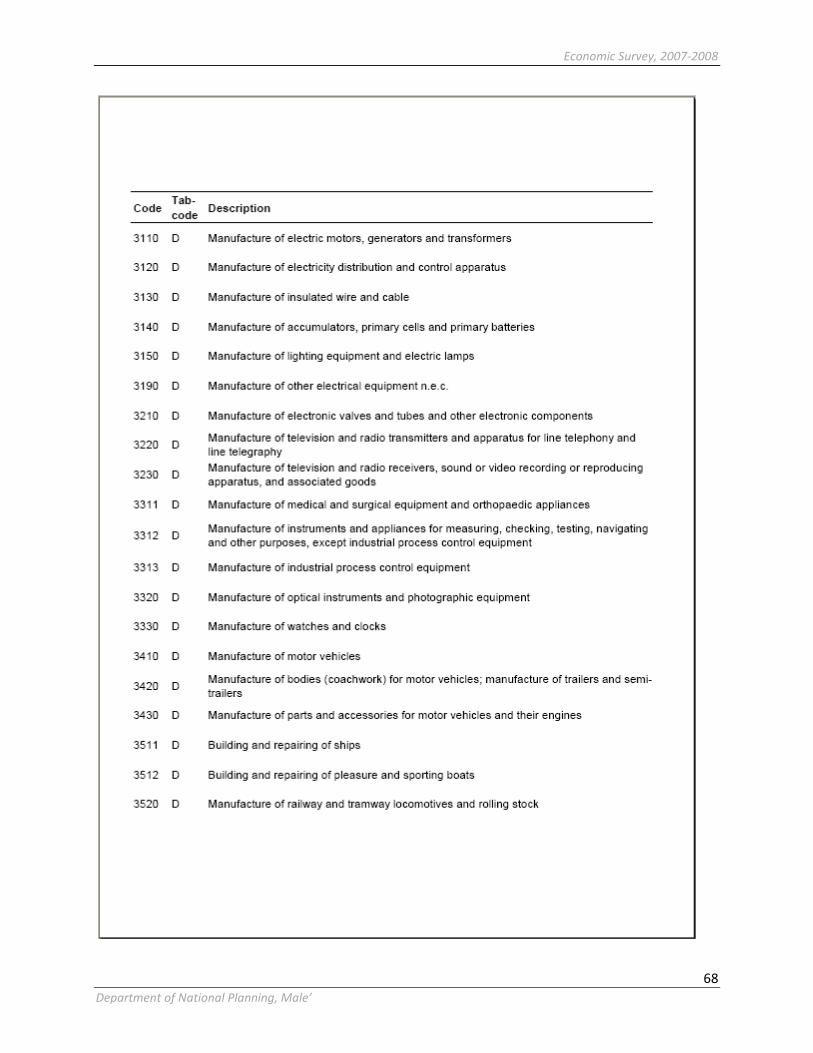
Economic Survey, 2007-2008
68
Department of National Planning, Male’

Economic Survey, 2007-2008
69
Department of National Planning, Male’

Economic Survey, 2007-2008
70
Department of National Planning, Male’
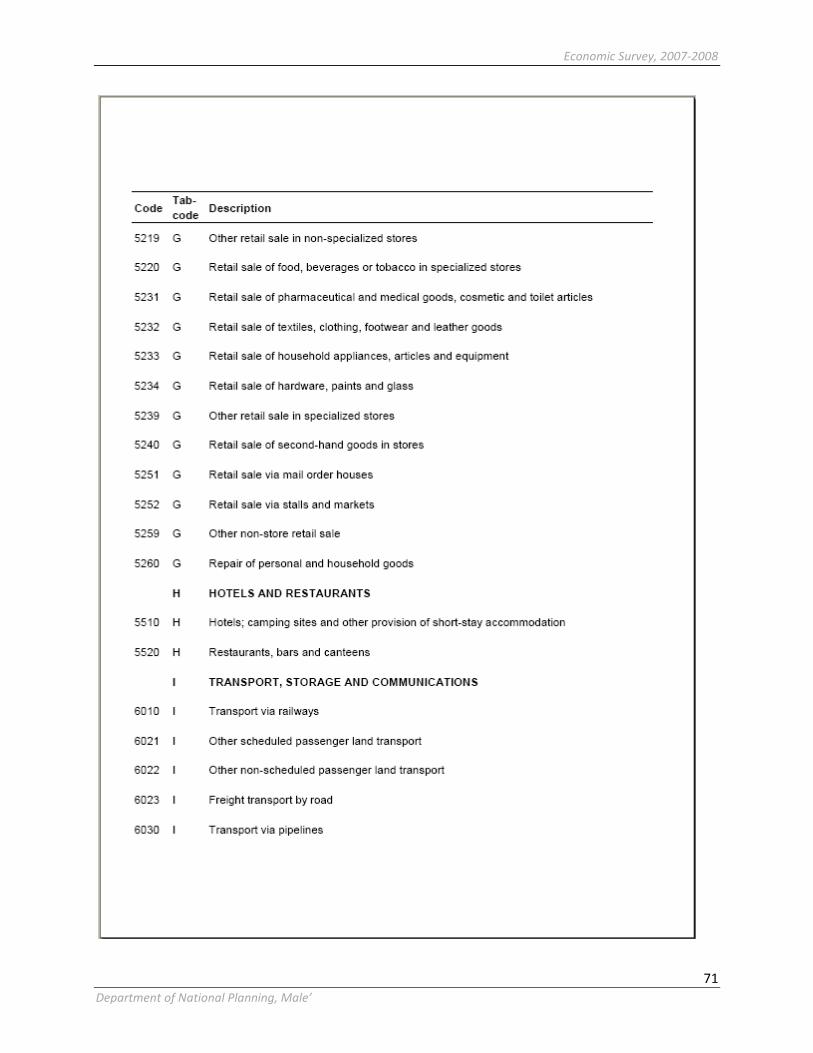
Economic Survey, 2007-2008
71
Department of National Planning, Male’
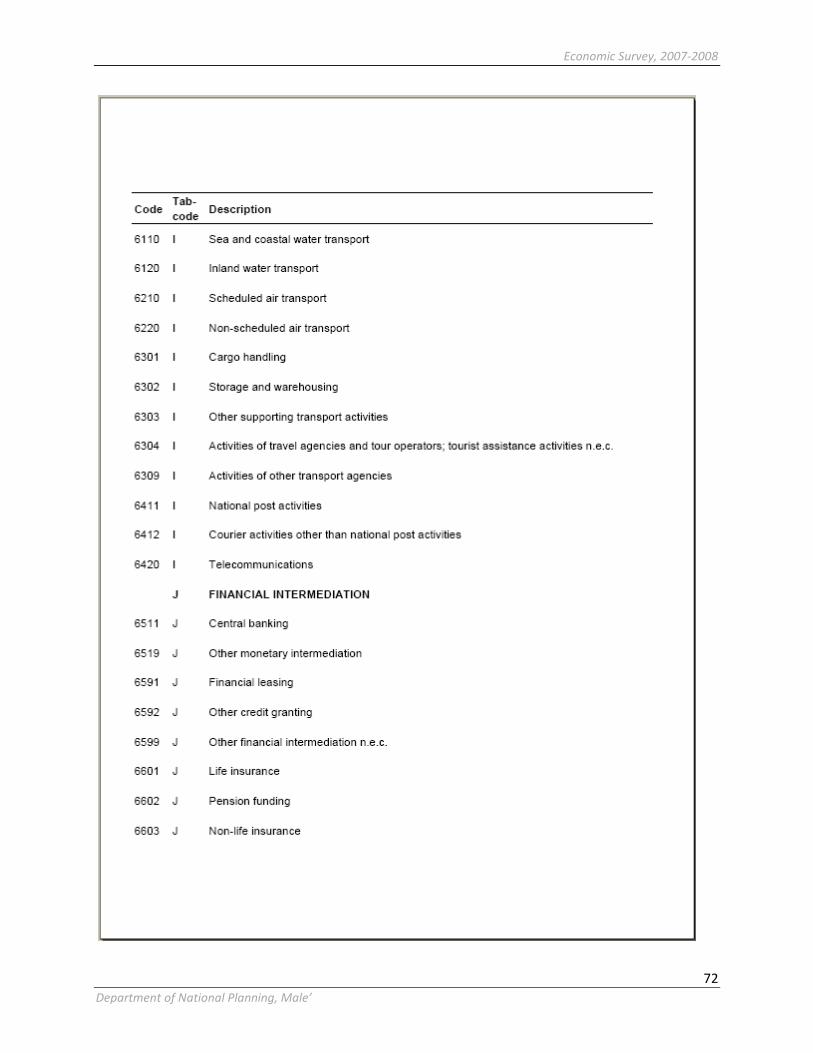
Economic Survey, 2007-2008
72
Department of National Planning, Male’

Economic Survey, 2007-2008
73
Department of National Planning, Male’
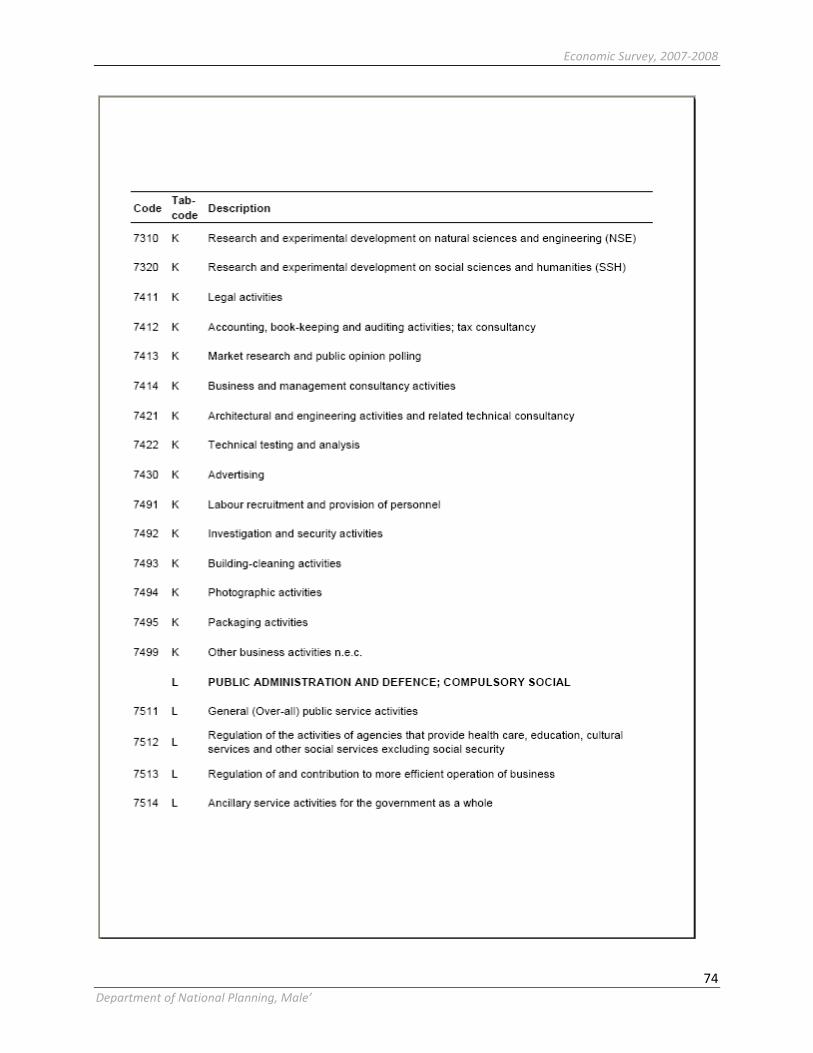
Economic Survey, 2007-2008
74
Department of National Planning, Male’
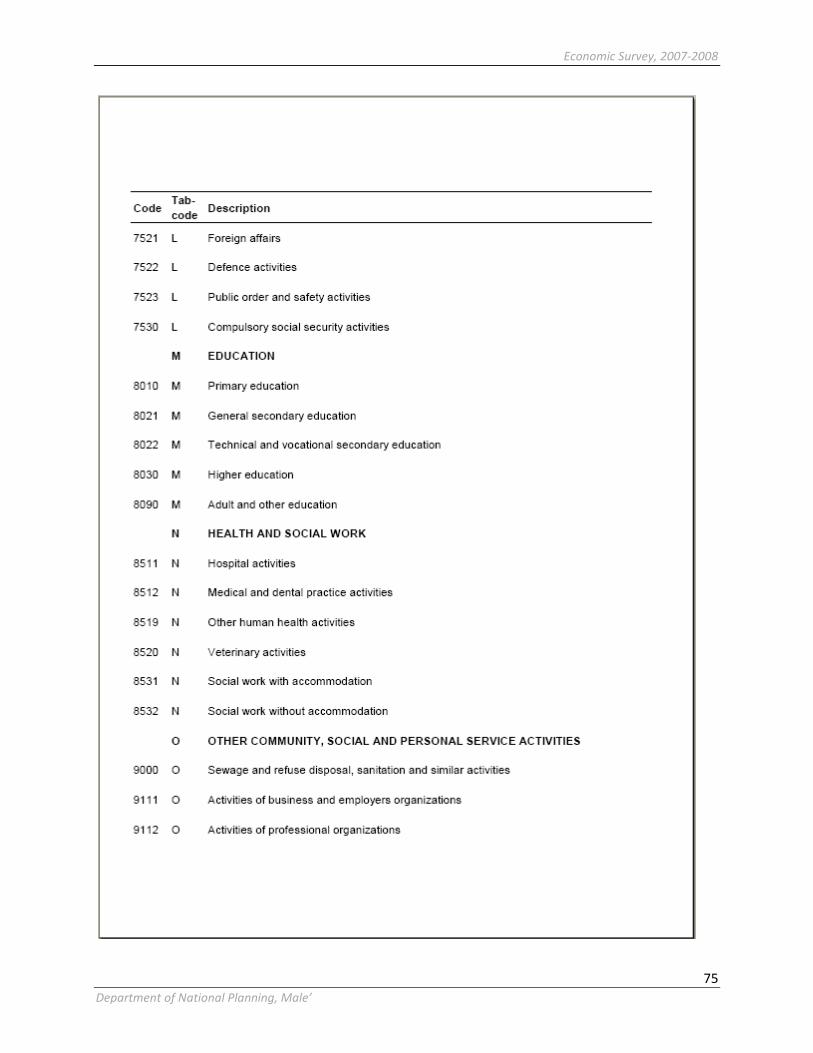
Economic Survey, 2007-2008
75
Department of National Planning, Male’

Economic Survey, 2007-2008
76
Department of National Planning, Male’

Economic Survey, 2007-2008
77
Department of National Planning, Male’

Economic Survey, 2007-2008
78
Department of National Planning, Male’
ANNEX 8
S
T
A
T
I
S
T
I
C
A
L
T
A
B
L
E
S

Economic Survey, 2007-2008
79
Department of National Planning, Male’

Economic Survey, 2007-2008
80
Department of National Planning, Male’
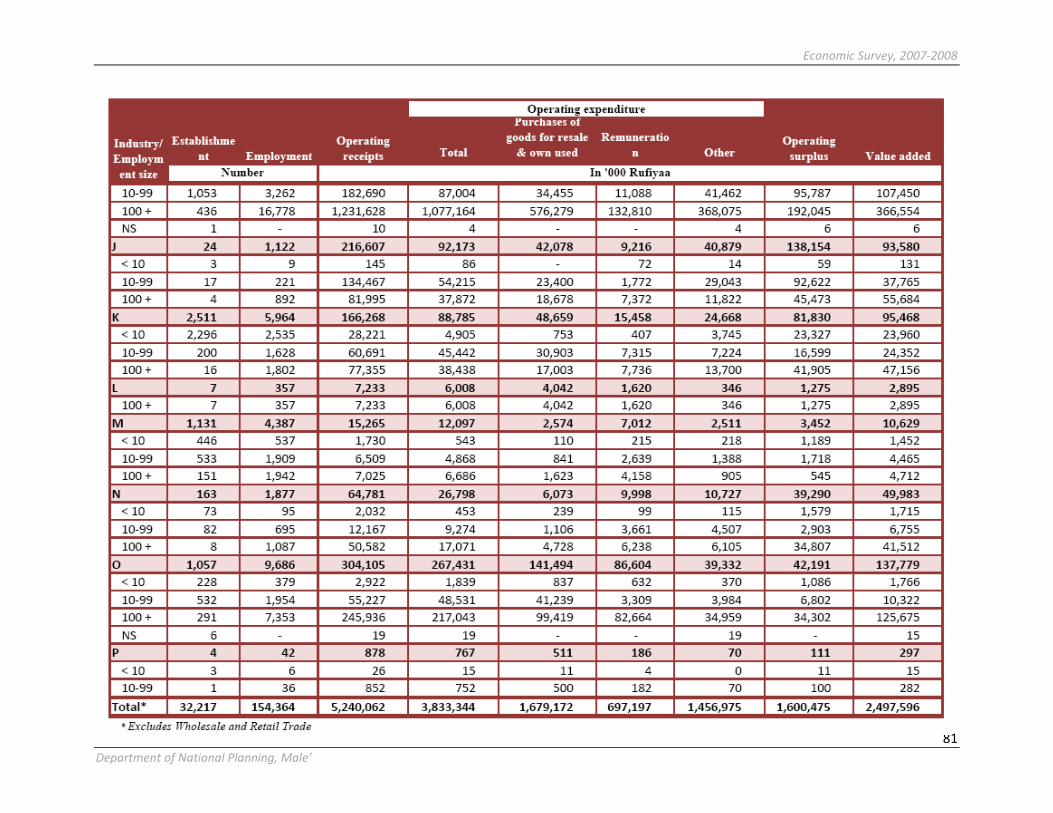
Economic Survey, 2007-2008
81
Department of National Planning, Male’
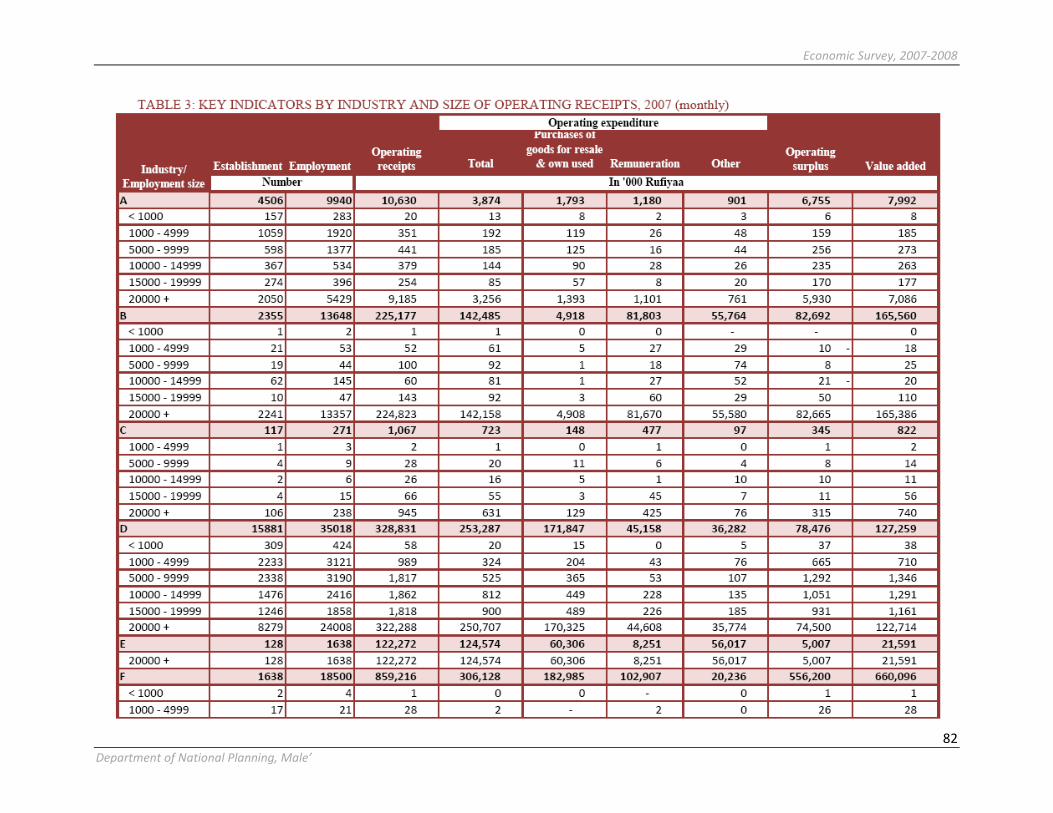
Economic Survey, 2007-2008
82
Department of National Planning, Male’
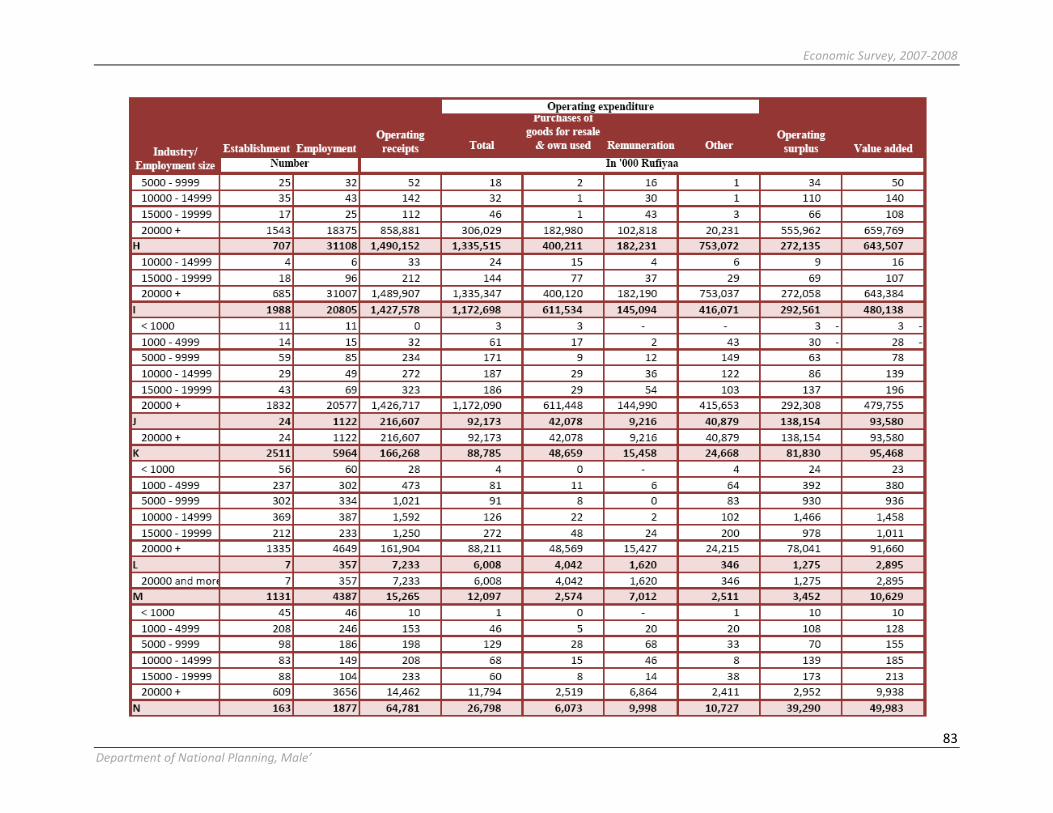
Economic Survey, 2007-2008
83
Department of National Planning, Male’
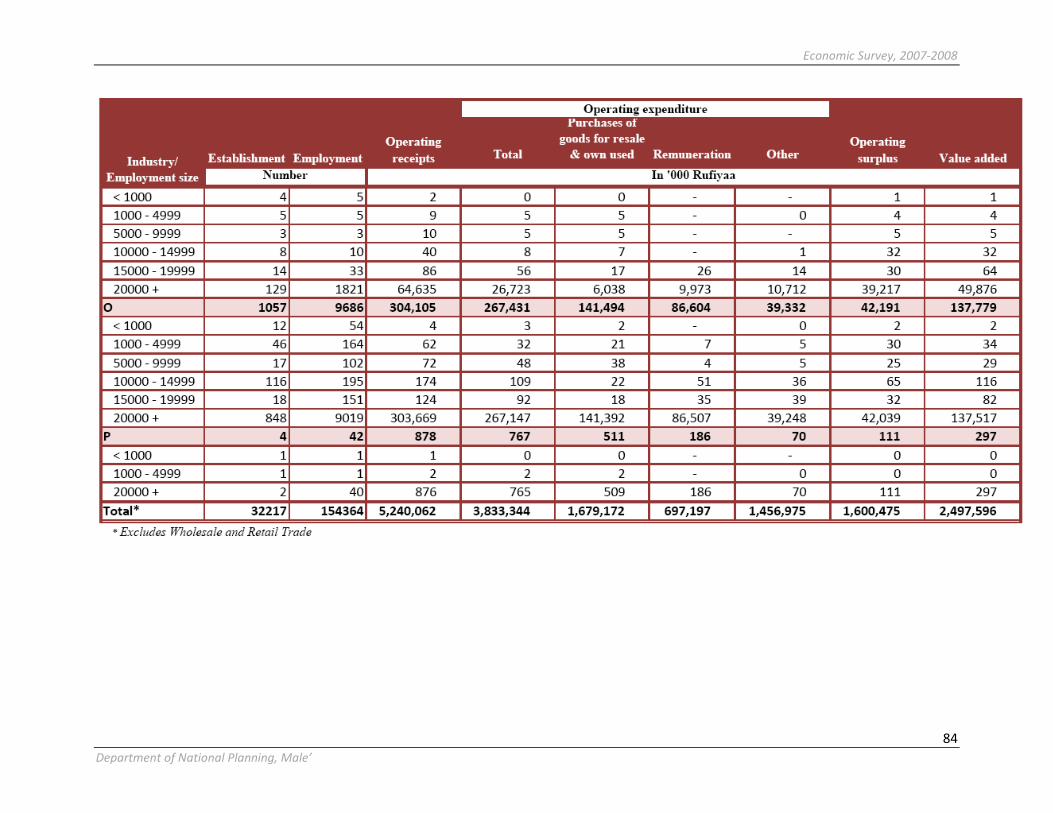
Economic Survey, 2007-2008
84
Department of National Planning, Male’

Economic Survey, 2007-2008
85
Department of National Planning, Male’
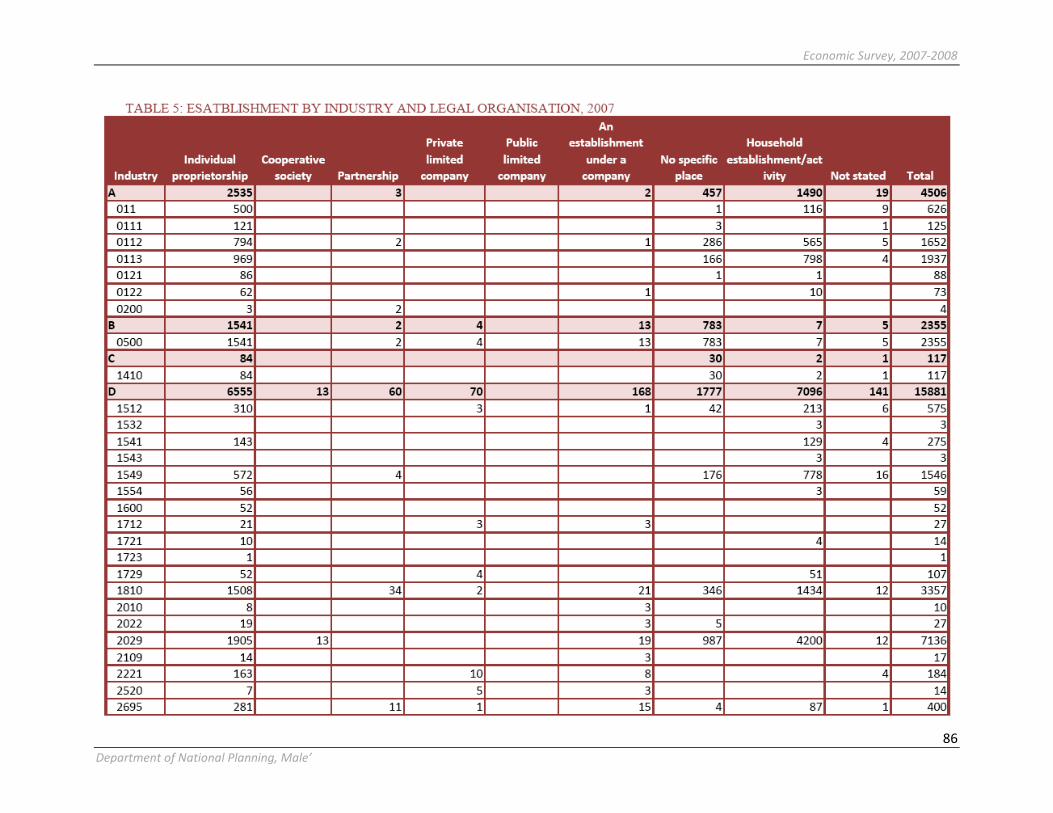
Economic Survey, 2007-2008
86
Department of National Planning, Male’

Economic Survey, 2007-2008
87
Department of National Planning, Male’
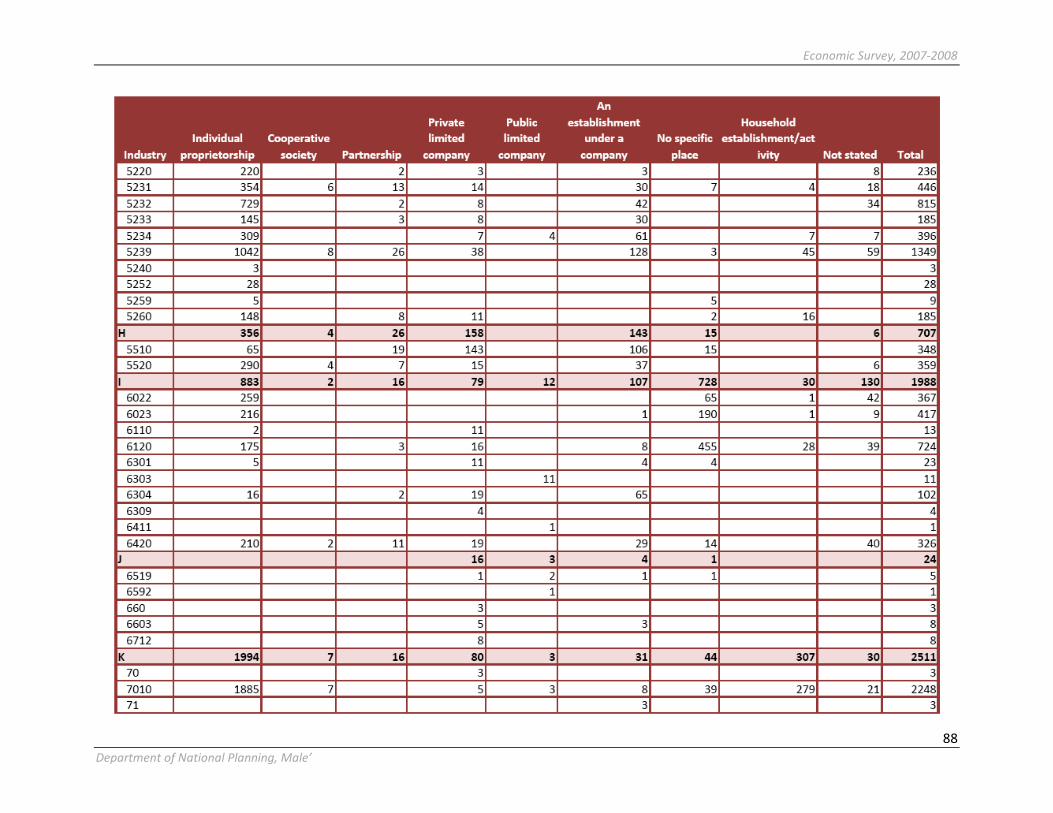
Economic Survey, 2007-2008
88
Department of National Planning, Male’
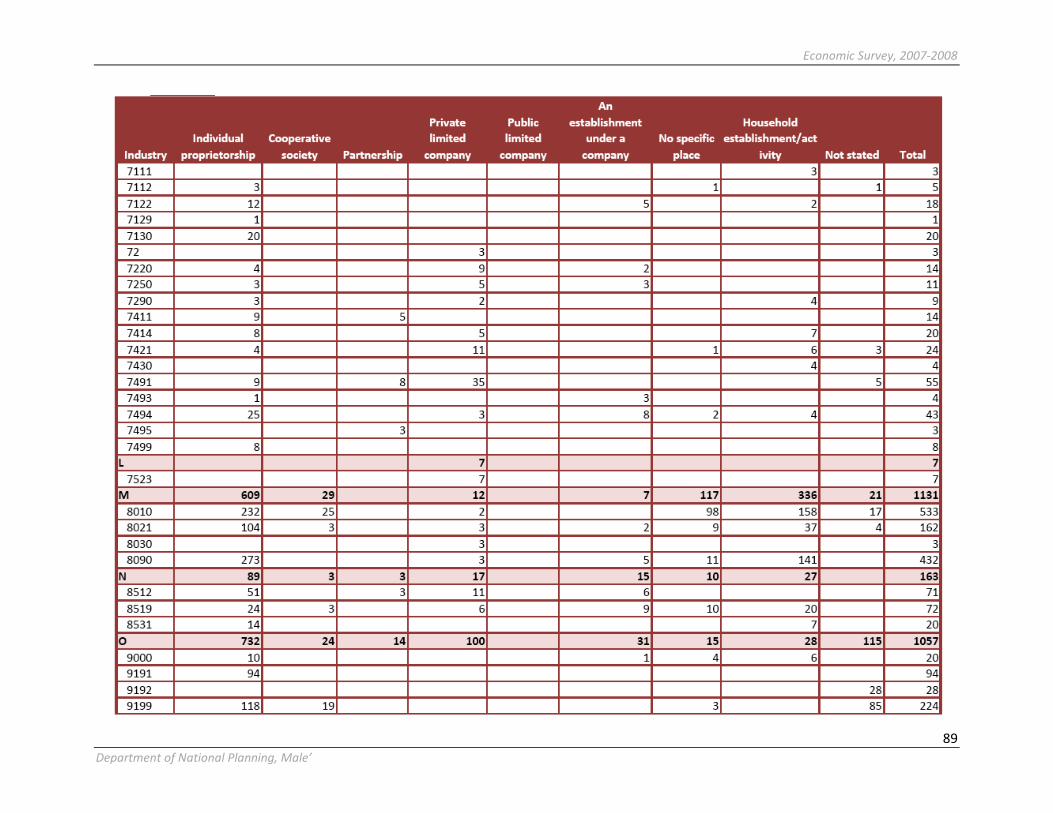
Economic Survey, 2007-2008
89
Department of National Planning, Male’
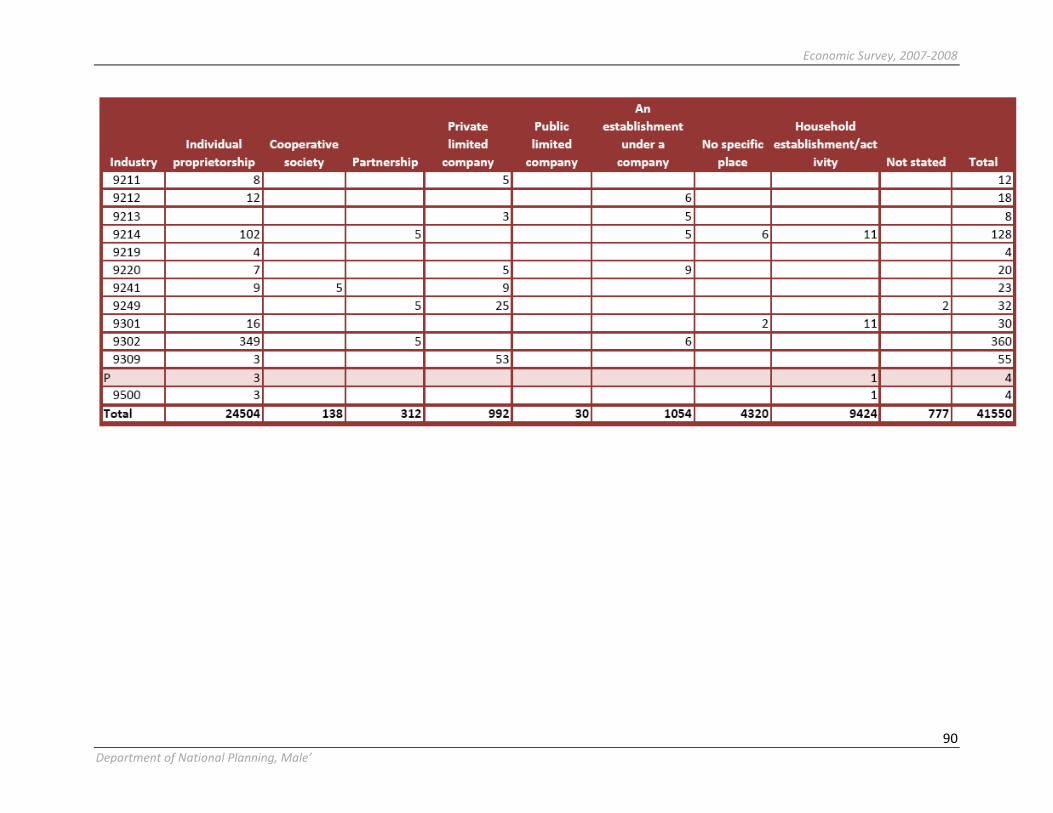
Economic Survey, 2007-2008
90
Department of National Planning, Male’

Economic Survey, 2007-2008
91
Department of National Planning, Male’

Economic Survey, 2007-2008
92
Department of National Planning, Male’
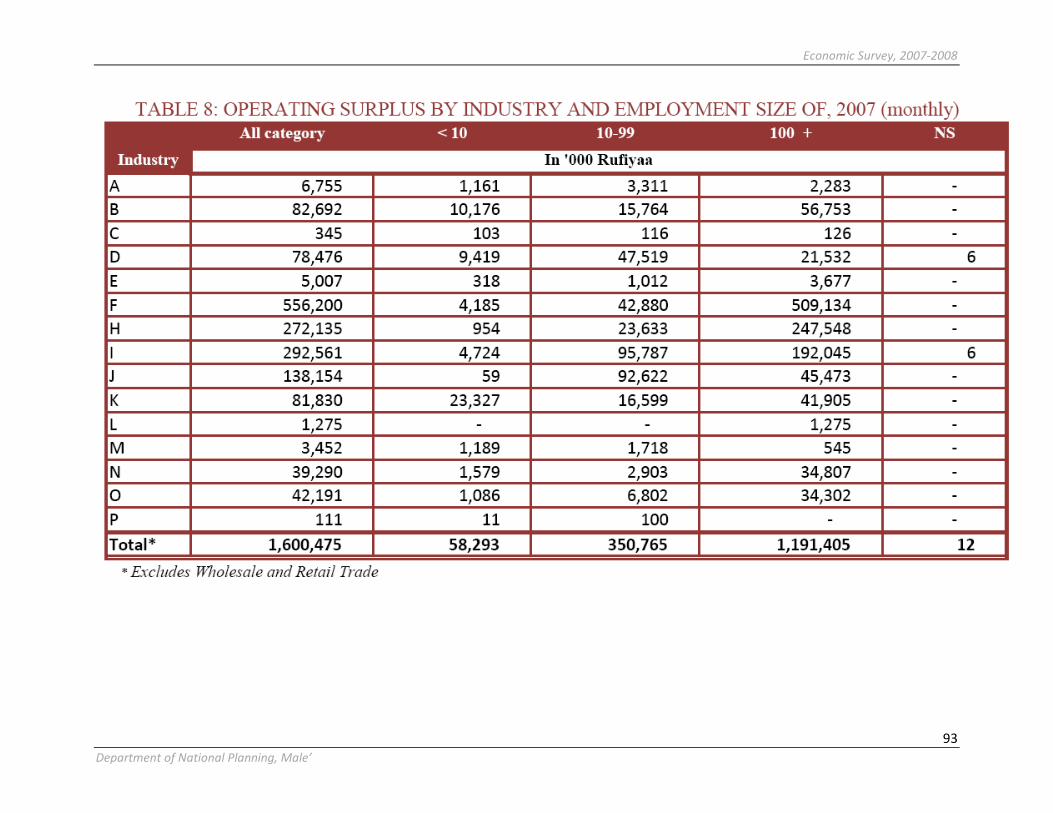
Economic Survey, 2007-2008
93
Department of National Planning, Male’

Economic Survey, 2007-2008
94
Department of National Planning, Male’

Economic Survey, 2007-2008
95
Department of National Planning, Male’

Economic Survey, 2007-2008
96
Department of National Planning, Male’

Economic Survey, 2007-2008
97
Department of National Planning, Male’
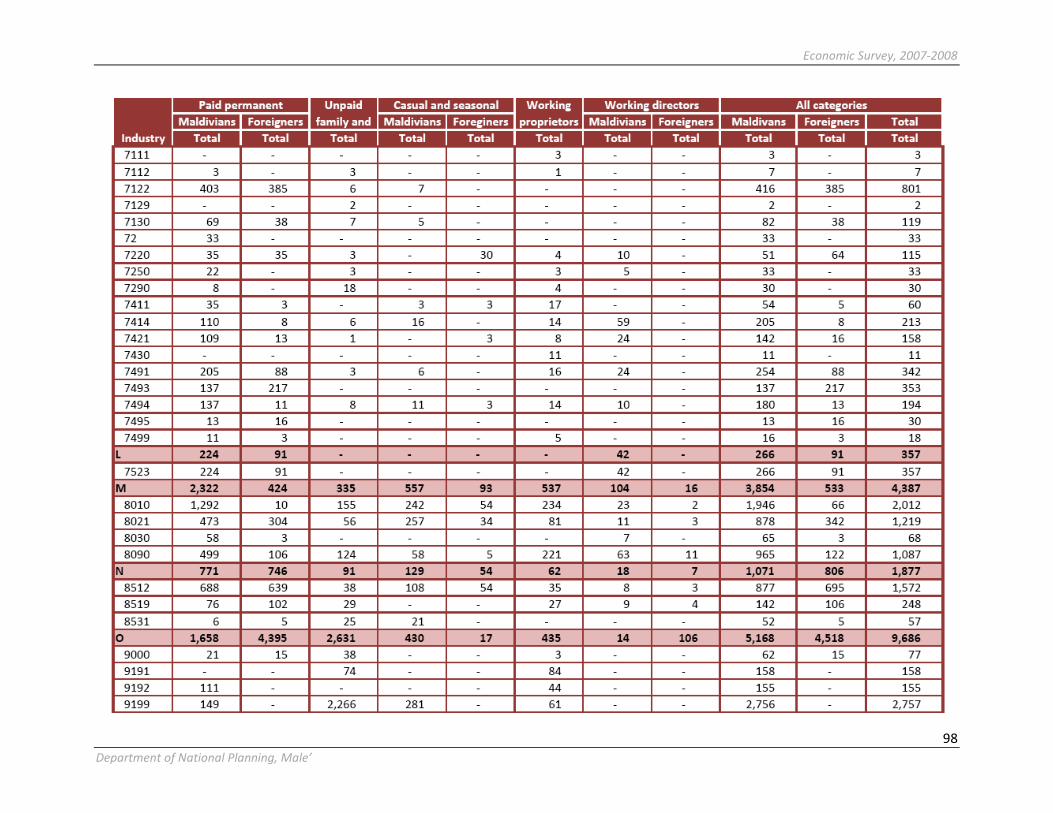
Economic Survey, 2007-2008
98
Department of National Planning, Male’
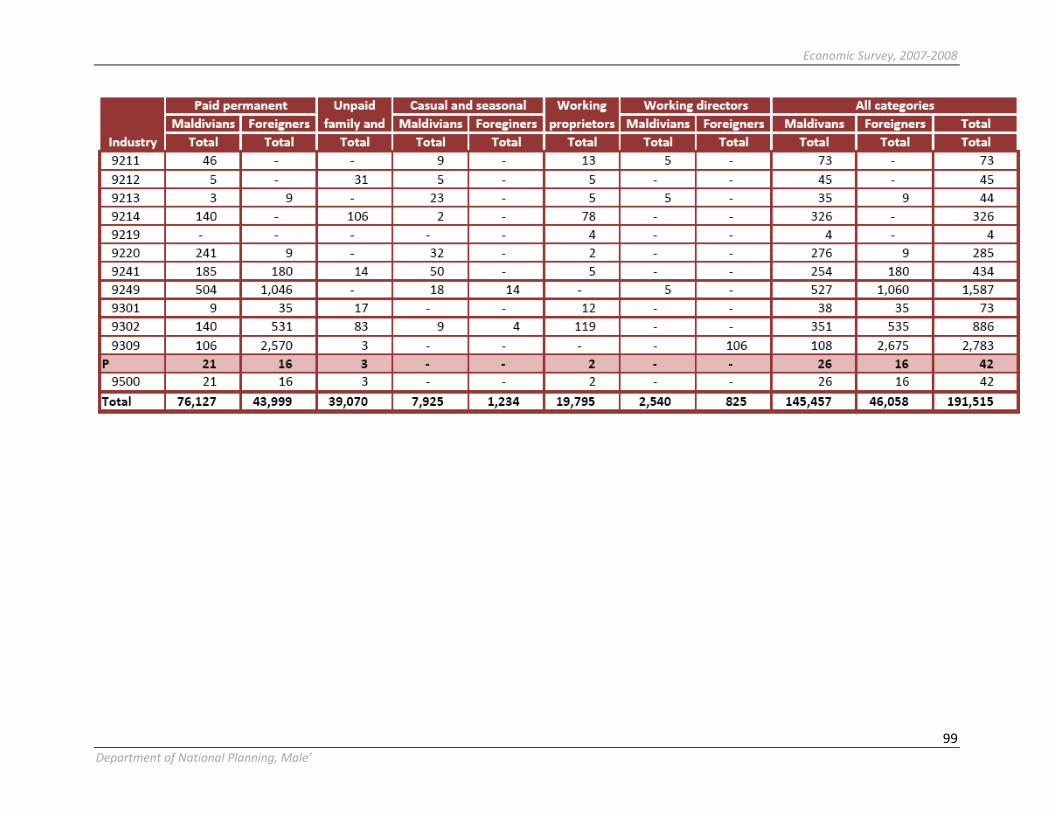
Economic Survey, 2007-2008
99
Department of National Planning, Male’

Economic Survey, 2007-2008
100
Department of National Planning, Male’


