181
ECONOMIC SURVEY MIZORAM 2013-14 Planning & Programme Implementation Department (Research & Development Branch) Government of Mizoram.

ECONOMIC SURVEY
MIZORAM
2013-14
Planning & Programme Implementation Department (Research & Development Branch)
Government of Mizoram.
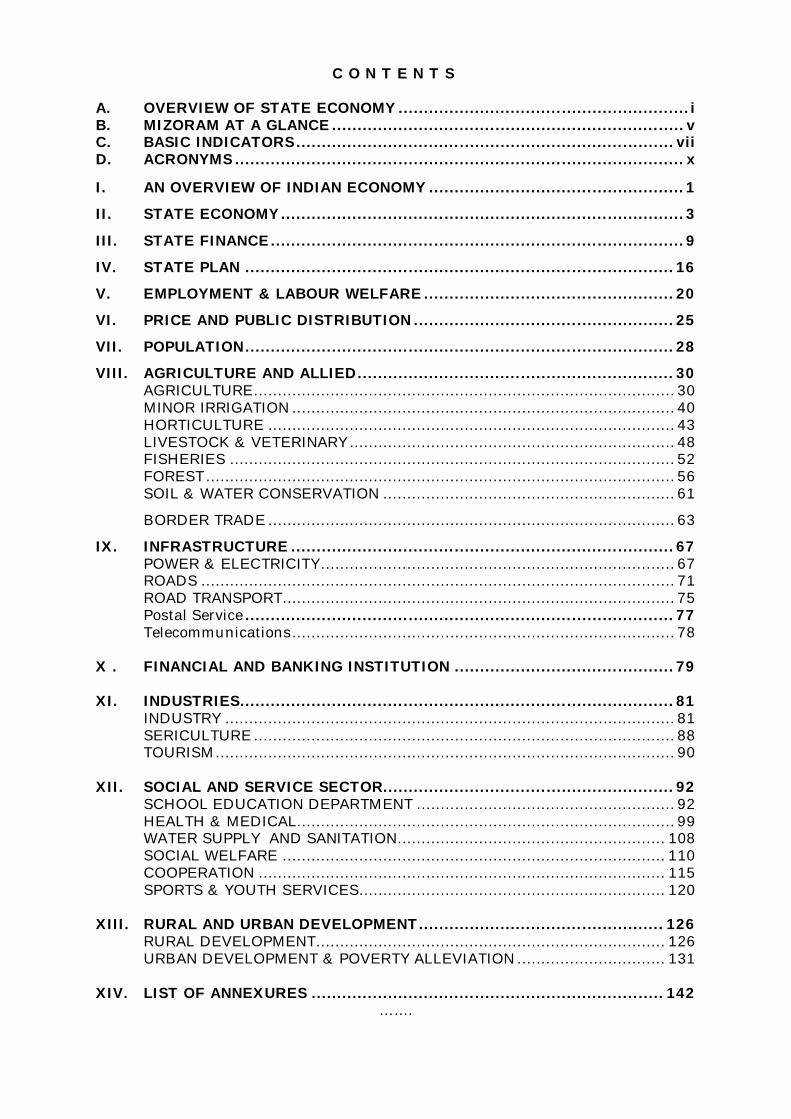
C O N T E N T S
A. OVERVIEW OF STATE ECONOMY ......................................................... i B. MIZORAM AT A GLANCE ..................................................................... v C. BASIC INDICATORS .......................................................................... vii D. ACRONYMS ........................................................................................ x I. AN OVERVIEW OF INDIAN ECONOMY .................................................. 1
II. STATE ECONOMY ............................................................................... 3
III. STATE FINANCE ................................................................................. 9
IV. STATE PLAN .................................................................................... 16
V. EMPLOYMENT & LABOUR WELFARE ................................................. 20
VI. PRICE AND PUBLIC DISTRIBUTION ................................................... 25
VII. POPULATION .................................................................................... 28
VIII. AGRICULTURE AND ALLIED .............................................................. 30 AGRICULTURE ........................................................................................ 30 MINOR IRRIGATION ................................................................................ 40 HORTICULTURE ..................................................................................... 43 LIVESTOCK & VETERINARY .................................................................... 48 FISHERIES ............................................................................................. 52 FOREST .................................................................................................. 56 SOIL & WATER CONSERVATION ............................................................. 61
BORDER TRADE ..................................................................................... 63
IX. INFRASTRUCTURE ........................................................................... 67 POWER & ELECTRICITY .......................................................................... 67 ROADS ................................................................................................... 71 ROAD TRANSPORT.................................................................................. 75 Postal Service .................................................................................... 77 Telecommunications ................................................................................ 78 X . FINANCIAL AND BANKING INSTITUTION ........................................... 79 XI. INDUSTRIES..................................................................................... 81 INDUSTRY .............................................................................................. 81 SERICULTURE ........................................................................................ 88 TOURISM ................................................................................................ 90 XII. SOCIAL AND SERVICE SECTOR......................................................... 92 SCHOOL EDUCATION DEPARTMENT ...................................................... 92 HEALTH & MEDICAL ............................................................................... 99 WATER SUPPLY AND SANITATION........................................................ 108 SOCIAL WELFARE ................................................................................ 110 COOPERATION ..................................................................................... 115 SPORTS & YOUTH SERVICES................................................................ 120 XIII. RURAL AND URBAN DEVELOPMENT ................................................ 126 RURAL DEVELOPMENT......................................................................... 126 URBAN DEVELOPMENT & POVERTY ALLEVIATION ............................... 131 XIV. LIST OF ANNEXURES ..................................................................... 142
…….

i
Economic Survey Mizoram 2013-14
A. OVERVIEW OF STATE ECONOMY
1. As per provisional figure of 2011 census, the total population stood at 10,97,206 registering a growth rate of 23.40 per cent over 2001 census. The sex ratio is 976 females per 1000 males. About 94.48% of the state population belongs to Scheduled Tribe and Scheduled Caste population comprises about 0.11 % of the State’s population.
2. The State economy (GSDP) is projected to grow at about 8.58%
during 2013-14 while the national economy (GDP) is projected to grow at 4.9 % during 2013-14.
3. The Per capita income of Mizoram for the year 2011 -2012 is estimated at Rs. 55,886/- as against the previous year’s estimate of Rs. 50,956/-. Per capita income at the national level is Rs. 67,839/- for the year 2012-2013. Per capita income for the year 2012-13 is estimated at Rs 60,836 while the National Per capita income during the same period is estimated at Rs 74,920/-
4. Tertiary/Service sector consti-tuting a share of about 60% of the total
GSDP indicates that this sector drives the economy of Mizoram. Both the industry sector contribute about 17% and the agriculture & allied sector contribute about 19% to the GSDP respectively.
5. About 60% of the population depends upon agriculture and allied sector. Share of Agriculture and Allied sector to the economy during the 11th Plan period could be averaged at 14 %. About 32 % of the cultivated area is under Jhum cultivation. Only 31.60 % of the demand for rice could be met within the State. During 2012-13, a total of 1,70,931.80 tonnes of rice was lifted by the State Government from outside.
6. Annual Inflation measured from Consumer Price Index shows 7.92 %
increase in September 2013. (The Consumer Price Index has been constructed for Mizoram State with 1999 as base year. Thus, Annual Report rate has been calculated from Consumer Price Index instead of wholesale Price Index).
7. The existing area under various horticulture crops accounts for 1.21
lakhs ha. which is only about 10.46% of the estimated potential area of 11.56 lakhs ha. Floriculture and horticulture has gained momentum and shown improvement in production.
8. The fish production during 2012-13 was 5600 MT. While the potential
culture fisheries resources in the State is estimated to be 24,000 Ha.,

ii
Economic Survey Mizoram 2013-14
only 18.75% of the available resource (4500Ha) has been developed for fish farming which could offer only 38% of the table size fish requirement leaving a gap of 62%.
9. Based on “India State of Forest Report- 2011’ published by Forest
Survey of India, Dehradun about 90.68% of the State’s total geographical area is covered under forests. The state has 12,897 Sq.km open forests. At present, notified forests(reserved/protected forests) constitute about 38% of the geographical area and even most of these are open, degraded and subject to pressure of shifting cultivation, encroachments, fire,illicit felling etc.
10. Mizoram has abundant natural bamboo resources which covers 31%
(6446 sqkm) of its geographical area and as many as 35 species of bamboo have been identified in the State.
11. There is an estimated growing stock of 25.26 million metric tonnes of
bamboo in in the State. 12. Mizoram is still on its way to achieving the National Norm of Water3
towns in Mizoram 12 towns have been brought under fully covered status (below 70 lpcd) and 3 towns are non-covered. At present 741 habitations comes under fully covered status and 36 habitations comes under partially covered status. It is encouraging that all the 777 habitations have now been brought under FC & PC.
13. There are 370 Health Sub Centre, 57 PHC and 12 CHC. About 25.2
% of children (0-3yrs) are malnourished. The Infant Mortality rate (IMR) based on CRS 2009 stood at 33.67 per 1000 while it is 33 per 1000 based on CRS 2008. Doctor population ratio is estimated at 1: 2455 and Nurse population ratio is estimated at 1 : 1477
14. Up to 2012-13, there were 3914 number of schools at different level of education in the State and out of which 41.77 % are owned and managed by Central/State Governments, 27.75% are Private Un-Aided, 21.18% are Private-Aided and the rest 9.30% comprising Primary and Middle Schools are run by Local Body, i.e, three Autonomous District Councils. The teacher-pupil ratio in the state is estimated at 1:19 for Primary School, 1:9 for Middle School, 1:9 students for High School and 1:15 for Higher Secondary schools. As per reconstructed Cohort method the drop out rate during 2012-13 has been calculated as 8.8% for Primary School, 1.7% for Middle School and 2.2% for High School. As per Apparent Cohort Method drop out rate is calculated as - Primary School (I-IV) -31.26%; Middle School (I-VIII)-38.26%; High School (I-X) -45.68%.

iii
Economic Survey Mizoram 2013-14
15. Industrial Development in Mizoram could be considered to have started lately in 1990’s after attaining statehood. “Micro and Small Industries are the only industries in the State. “Entrepreneurs in Mizoram are of first generation and the State could be still described as “No Industry Zone” due to absence of large or medium industries. Upto 2012-13 there are 8,341 nos small scale industries registered.
16. In spite of abundant hydro-electric power potential available in the State
(4500.0MW), only 0.66% of its potential has so far been harnessed, through Small & Mini Hydel Projects. The State’s power demand is presently worked out to be 107.0MW while the state’s own generation is only 58.609MW Hydel Diesel emergency only. During 2012-13 only 15% of total energy is met within State and the remaining 85.00% was imparted mainly from Central sector projects. Number of electrified villages as on February 2012 is 657 and electrification works being taken up for the remaining un-electrified 50 villages under RGGVY scheme in full swing. The per capita power consumption during 2009-11 is 263 KWH. The T & D loss is estimated at 30.22 % during 2012-13.
17. The total length of all types of roads in Mizoram by end of March, 2013
is 7807.11 kms and road density is 37.03 km/100 sq km. (approx), whereas the total length of roads in the beginning of 11th Plan (i.e 2007) was 6059.83 km which was 28.36 Km/100 Sq Km. The density of road in Mizoram is still very low in comparing to the National level of 96.57 Km/100 Sq Km. There are 7 National Highways in Mizoram with a total length of 986 kms including 100Km NH 502A under construction.
18. The total number of motor vehicles on road in the State upto the end of
2012-2013 (March, 2013) for both private and government vehicles was 1,21,330. The number of vehicles on road has been increased by 15,225 (12.55%) over a period of one year as against 1,06,105 at the end of the previous year. Of the total number of vehicles in operation during 2011-2012, 58.06% are two-wheelers while 36.01% are light motor vehicles. Truck and Lorries constituted 3.81% of all vehicles on road.
19. As on March 2012, there are 7,01,959 mobile phone connections in
the state against 5,52,254 connections in March 2011 which is an increase of 21.32 %. Airtel has the majority of subscribers with 2,40,000 connections followed by AIRCEL with 2,08,572 connections. There are 514 mobile towers in Mizoram.
20. The CD ratio as on 31.12.2011 is 41.67% against 42.41% in 2011-12.
The CD ratio is low as compared to the national average of 75%. 21. The receipts from the State’s own resources is estimated to be
increased by Rs 67.66 crore in 2010-11 in absolute term as compared to the receipts in 2009-10. It is further estimated that state own tax
iv
Economic Survey Mizoram 2013-14
revenue to grow during the fiscal 2011-12 in comparison with the growth rate of the previous year. The revenue surplus is also expected to increase from 16.63 crore in 2010-11 to 322.04 crore in 2011-12 with a corresponding decrease in Gross Fiscal Deficit from 732.85 to 172.86 in absolute and from 11.64 to 2.40 as a percentage of GFD to GSDP. However, the outstanding debt of the State is high as Rs 3163.95 crore in 2009-10 which is 49.62% against GSDP.
22. The original approved outlay for the 12th Five Year Plan (2012-2017) was Rs.12,160.00 crores while total of the successive approved 11th Plan outlays is Rs 6300.00 crore. The approved outlay for 2013-14 is Rs 2500.00 crores which is an increase of 8.70 % over the previous year outlay of Rs 2300.00 crore.
23. New Land Use Policy (NLUP), the Flagship Programme of the State Government continued to be the highest priority during 2013-2014. The programme aims at gradually changing the practice of jhumming with a new pattern of land use through empowerment of people, preservation of environment, adoption of effective water harvesting measures and commercial utilization of abun-dant locally available resources. Rs 370.00 crores is specifically earmarked for NLUP which is implemented by eight Depart-ments.
…….
v
Economic Survey Mizoram 2013-14
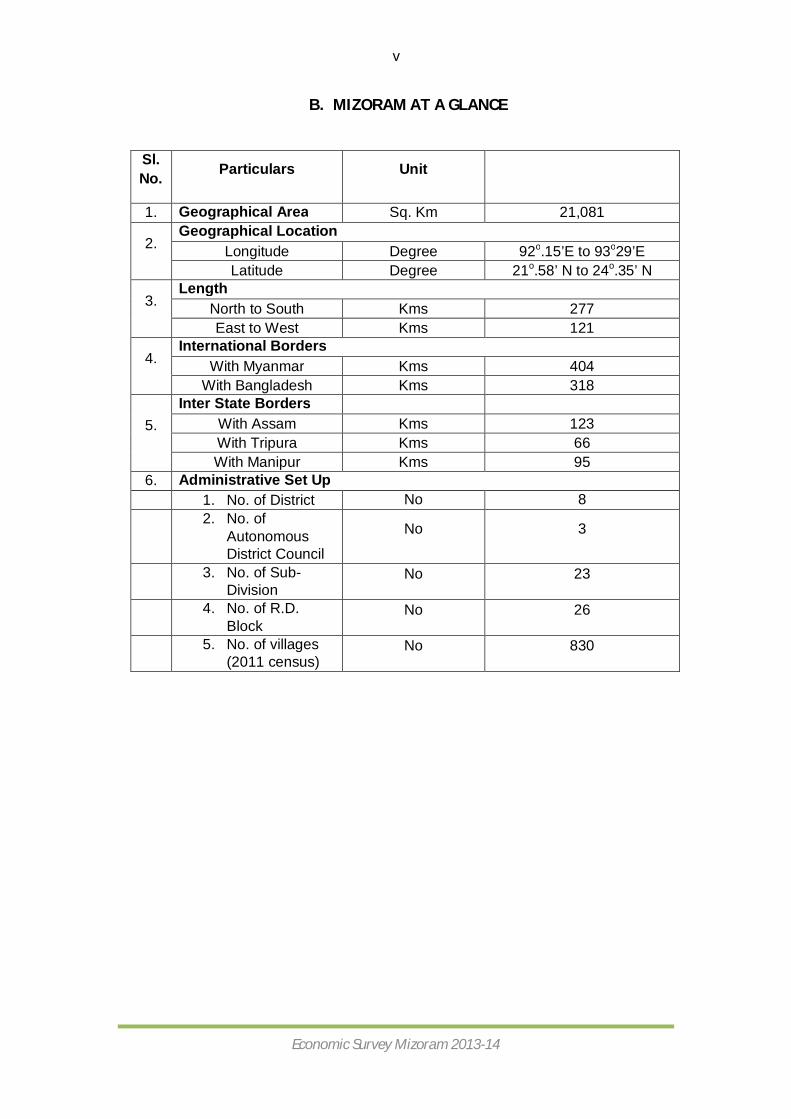
B. MIZORAM AT A GLANCE
Sl. No. Particulars Unit
1. Geographical Area Sq. Km 21,081
2. Geographical Location
Longitude Degree 92o.15’E to 93o29’E Latitude Degree 21o.58’ N to 24o.35’ N
3. Length
North to South Kms 277 East to West Kms 121
4. International Borders
With Myanmar Kms 404 With Bangladesh Kms 318
5. Inter State Borders
With Assam Kms 123 With Tripura Kms 66 With Manipur Kms 95
6. Administrative Set Up 1. No. of District No 8
2. No. of
Autonomous District Council
No 3
3. No. of Sub-Division
No 23
4. No. of R.D. Block
No 26
5. No. of villages (2011 census)
No 830

vi
Economic Survey Mizoram 2013-14
Sl. No. Particulars Unit
1. Total Population (2011 Provisional) Persons Persons Male Male Female Female
2. Decadal Population Growth (2001 – 2011) Absolute Absolute Percentage Percentage
3. Population Density 3. Population Density 4. No. of females per 1000 4. No. of females per 5. 0 – 6 Population (2011) Persons Persons Males Males Females Females
6. Literacy (2011) 6. Literacy (2011) Persons Persons
.......

vii
Economic Survey Mizoram 2013-14
C. BASIC INDICATORS Sl. No. Particulars Unit 2011-12 2012-13
1 State Income a) GSDP at current price Rs. in lakhs 719782 805309 b) Per Capita Income at current price Rs. 55886 60836 c) GSDP at constant (2004-05) price Rs. in lakhs 515792 536990
d) Per Capita Income at Constant Price Rs. 40387 40930
2 Average Monthly Per Capita Expenditure
2007-2008 2009-2010
(Consumer Expenditure) NSS 64th Round NSS 66th Round a) Rural Rs. 1017.62 1155.92 b) Urban Rs. 1730.97 1778.43 3 Agriculture 2011-2012 2012-2013 a) Gross Cropped Area 000 ha 133.956 133.591 b) Net Area Sown 000 ha 131.23 130.821 c) Gross Irrigated Area 000 ha 13.15 14.33 d) Area under Principal Crops 2011-2012 2012-2013 i) Paddy ha 38976 40075 ii) Maize ha 6905 6175 iii) Pulses ha 3836 3099 iv) Oilseeds ha 5474 2063 e) Production of Principal Crops 2011-2012 2012-2013 i) Paddy M. Tonnes 75566 77471 ii) Maize M. Tonnes 8397 8064 iii) Pulses M. Tonnes 5331 3288 iv) Oilseeds M. Tonnes 2382 2224 f) Agricultural Census 2005-06 2010-11 i) No. of operational holdings Nos. 97223 91880 ii) Total operated area ha 116645 104789.34 iv) Average size of holdings ha 1.2 1.14 4 Livestock Census 2007 2012 (Projected) a) Total Livestock 000 364 394 b) Total cattle 000 34 36 c) Total pigs 000 267 337 d) Total poultry 000 1234 1610 5 Forest (FSI Report) 2011-2012 2012-2013 a) Area under dense forest Sq. Km 6283 6149 b) Area under open forest Sq. Km 12900 12900 6 Electricity 2011-2012 2012-2013 a) Installed Capacity MW 52.77 52.47 b) Gross Generation MW 18.35 39.87 c) Power Purchased * MU 389.51 377.66 d) Total Consumption MW 237.56 286.604
* Power purchased decreased as local generation from Serlui ‘B’ project started recently

viii
Economic Survey Mizoram 2013-14
7 Industries 2011-2012 2012-2013 a) Registered SSI Units during Nos. 8219 8341
b) No. of farmers registered in Sericulture Nos. 7826 7826(2012)
c) No. of enterprises (as per 1998 economic census) Nos. 24943 24943
d) No. of enterprises (as per 2005 economic census) Nos. 47378 47378
e) Average annual growth rate of enterprise (1998 to 2005) 9.60% 9.60%
8 Cooperation 2010-2011 2011-2012 a) No. of Coop. Societies Nos. 1490 1440 b) Membership Nos. 49107 50520 c) Working Capital Rs. in lakhs 16,357 54,749 9 Banking 2011-2012 2012-2013 a) No. of Banks/Branches No. 129 146 b) Total Deposits Rs. in
crores 4063.75 4692.66
c) Total Advances Rs. in crores
1740.93 1990.31 d) Credit Deposit Ratio % 42.84 42.41
10 Education 2011-2012 2012-2013 a) No. of Primary Schools Nos. 1855 1831 b) Enrolment in Primary Schools Nos. 164272 161581 c) No. of Middle Schools Nos. 1383 1381 d) Enrolment in Middle Schools Nos. 87726 89755 e) No. of High Schools Nos. 543 584 f) Enrolment in High Schools Nos. 48741 38870 g) No. of Higher Secondary Schools Nos. 113 118
h) Enrolment in Higher Secondary Schools Nos. 20250 21472
i) No. of Colleges Nos. 22 21 j) Enrolment in Colleges Nos. 10660 11754 k) No. of Universities Nos. 2 2 l) Enrolment in Universities Nos. 3305 3467
11 Health 2011-2012 2012-2013 a) No. of Hospitals Nos. 12 11 b) Community Health Centres Nos. 12 12 c) Primary Health Centres Nos. 57 57 d) Sub-centres Nos. 370 370 2011 2012 e) Birth Rate Per '000 23.3 23.73 f) Death Rate Per '000 5.03 5.93 g) Infant Mortality Rate Per '000 33.67 35.83
12 Transport 2011-2012 2012-2013 a) Total Road Length Kms 8465.14 8853.54 b) National Highway Kms 871.12 986 c) State Highway Kms 1663.51 1350.04 d) District Road Kms 2320.55 2932.88 e) Village Road Kms 1045.13 1890.857 f) Town Road Kms 959.31 647.333 g) Total Motor Vehicles Nos. 106105 121330

ix
Economic Survey Mizoram 2013-14
13 Communication 2011-2012 2012-2013 a) No. of Post Offices Nos. 395 385 Rural Nos. 348 344 Urban Nos. 47 41 b) No. of Mobile Connections Nos.
14 Water Supply 2011-2012 2012-2013 a) No. of villages fully covered Nos. 715 745 b) No. of villages not covered Nos. 62 32
15 Public Finance 732977 (Feb 2012)
NA a) Revenue Deficit (-) / Surplus (+) Rs. Crore b) Gross Fiscal Deficit (GFD) Rs. Crore c) Internal Debt Rs. Crore d) % of GFD to GSDP % e) Accumulated Debt Rs. Crore f) Acc. Debt aas % of GSDP %
16 Plan Outlay a) 12th Five Year Plan Outlay Rs 12160.00 crore
b) Annual Plan 2011-2012 approved outlay Rs 1700.00 crore
c) Annual Plan 2011-2012 revised outlay Rs 1724.28 crore
d) Annual Plan 2012-2013 approved outlay Rs 2300.00 crore
e) Annual Plan 2012-2013 revised outlay Rs 2361.62 crore
f) Annual Plan 2013-2014 approved outlay Rs 2500.00 crore
g) Annual Plan 2013-2014 revised outlay Rs 2539.78 crore
……

x
Economic Survey Mizoram 2013-14
D. ACRONYMS AAY = Antyodaya Anna Yojana ACA = Additional Central Assistance ADA = Aizawl Development Authority ADB = Asian Development Bank AIBP = Accelerated Irrigation Benefit Programme AMC = Aizawl Municipal Council APDRP = Accelerated Power Development and Reform Programme APEDA = Agricultural and Processed Food Products and Export Development Authority ASHA = Accredited Social Health Activists ASPA = Advanced Special Plan Assistance AT& C = Average, Technical & Commercial Loss ATI = Administrative Training Institute ATMA = Agriculture Technology Management Agency AYUSH= Ayurveda, Yoga ,Naturopathy, Unani, Siddha and Homoepathy BADP = Border Area Development Programme BAFFACOS = Bamboo Flowering and Famine Combat Scheme BOB= Bank of Baroda BPL = Below Poverty Line BPO=Branch Post Office BRGF = Backward Region Grand Fund BRO = Border Roads Organisation BSUP = Basic Service to the Urban Poor CAT= Computer Aided Teaching CCA= Culturable Command Area CDCU = Chhimtuipui District Cooperative Union CPU = Central Processing Unit CRSP= Central Rural Sanitation Programme CSO = Central Statistics Organisation CSS= Centrally Sponsored Scheme CWSN=Children with Special Needs CTE = College of Teacher Education DDA = Delhi Development Authority DONER = Development of North East Region DOTs= Directly Observed Treatment strategy DVOR = Doppler Very High Frequency Omni Directional Range EAP = Externally Aided Project EPI = Expanded Programme of Immunization EBB = Educationally Backward Block EPIP = Export Promotion Industrial Park ERCM = Education Reforms Commission, Mizoram. EWS= Economically Weaker Section FC = Fully Covered FFDA = Fish Farmer Development Agency FSI = Forest Survey of India GBS= Gross Budgetary Support

xi
Economic Survey Mizoram 2013-14
GER=Gross Enrolment Ratio GCA= Gross Command Area GER = Gross Enrolment Ratio GSDP = Gross State Domestic Product HFO= Heavy Furnace Oil HiWEL= Hole-in-the-Wall Education Limited HiWEL= Hle-in-the-Wall Education Limited HMNEH= Horiculture Mission for North East & Himalayan Region HPO= Head Post Office HPTW= Hand Pumped Tube Well ICT = Information and Communication Technology ICMR= Indian Council of Medical Research IDSP= Integrated Disease Surveillance Project ICDS= Integrated Child Development Services ICPS= Integrated Child Protection Scheme IEC= Information, Education and Communication IGNOAP= Indira Gandhi National Old Age Pension IHL = Individual Household Latrines IHSDP = Integrated Housing and Slum Development Programme IIPA = Indian Institute of Public Administration ILS= Instrumental Landing System IPC= Irrigation Potential Created IREP = Integrated Rural Electric Programme IUD = Intra - Uterine Devices IWDP = Integrated Wasteland Development Programme IWMP= Integrated Watershed Management Programme JFM = Joint Forest Management JNNURM = Jawaharlal Nehru National Urban Renewal Mission KGBV = Kashturba Gandhi Balika Vidhyalaya LDCU = Lunglei District Cooperative Union LIG = Low Income Group lpcd = litres per capita per day MAHCO = Mizoram Apex Handloom & Handicraft Co-operative Society Ltd. MAHFED = Mizoram State Agriculture/Horticulture & Marketing Cooperative Federation MASCOS= Mizoram Apex Sericulture Cooperative Society Ltd. MDM = Mid-Day Meal MCS= Model Cluster Schools MDM = Mid-Day Meal MFF= Multi-tranche Financing Failities MHTC = Mizoram Hindi Training College MIZOFED = Mizoram State Co-Operative Marketing & Consumers Federation Ltd. MCAB = Mizoram Cooperative Apex Bank Ltd. MKWH =Million Kilo Watt Hour MNRE = Ministry of New and Renewable Energy MPL = Mizoram Polytechnic, Lunglei MGNREGS = Mahatma Gandhi National Rural Employment Guarantee Scheme

xii
Economic Survey Mizoram 2013-14
MSCU = Mizoram State Co-operative Union MSHCS=Mizoram State Health Care Scheme MDG= Mukhya Dak Ghar MU = Million Unit MUCO Bank= Mizoram Urban Cooperative Development Bank Ltd. MULCO = Mizoram Multi-commodity Producers Co-operative Union Ltd. MW = Mega Watt MZU = Mizoram University NABARD = National Bank for Agriculture and Rural Development NC = Non-Covered NCC= National Cadet Corps NCSE = Non Conventional Source of Energy NEC = North Eastern Council NEDFi = North Eastern Financial Development Corporation NEEPCO = North Eastern Electric Power Corporation NeGAP = National E-Governance Action Plan NERUDP = North East Region Urban Development Project NERCCDIP= North Eastern Region Capital Cities Development Investment Programme NHPC = National Hydro Power Corporation NIELIT = National Institute for Electronics and Information Technology NLCPR = Non Lapsable Central Pool of Resources NLEP = National Leprosy Eradication Programme NPAG = Nutrition Programme for Adolescent Girls NPCBB= National Project on Cattle And Buffalo Breeding NPEGEL = National Programme for Education of Girls at Elementary Level NRDWP = National Rural Drinking Water Programme NREGS = National Rural Employment Guaranteed Scheme NRHM = National Rural Health Mission NSDP = Net State Domestic Product NSS = National Services Schemes NSSO = National Sample Survey Organisation NVBDCP= National Vector Borne Diseases Control Programme PAC = Potential Area Connectivity PACS = Primary Agricultural Credit Societies PC = Partially Covered PIGFED = Mizoram Pig Producer Co-operative Federation Ltd. PMGSY = Pradhan Mantri Gram Sadak Yojana PPP = Public Private Partnership PRS = Public Reservation System PYKKA= Panchayat Yuva Krida Aur Khel Abhiyan RBD = Registration of Birth and Death RCH= Reproductive and Child Health RE = Revised Estimates REC = Rural Electrification Corporation RGGVY = Rajiv Gandhi Grameen Vidyutikaran Yojana RGSY= Rashtriya Gram Swaraj Yojana
xiii
Economic Survey Mizoram 2013-14
RMIS = Rationalisation of Minor Irrigation Stastistics RMSA= Rashtriya Madhyamik Shiksha Abhiyan RNTCP= Revised National TB Control Programme RKVY= Rashtriya Krishi Vikas Yojana RSBY = Rashtriya Swasthya Bima Yojana RSVY = Rashtriya Sam Vikas Yojana RWHS=Rural Water Harvesting Schemes SAL = Structural Adjustment Loan SARDP-NE = Special Accelerated Road Development Programme for North East SCA = Special Central Assistance SGRY = Sampoorna Gramin Rozgar Yojana SGSY = Swarnajayanti Gram Swarozgar Yojana SJSRY= Swarna Jayanti Shahri Rozgar Yojana SIPMIU = State Investment Programme Management and Implementation Unit SIRD = State Institute of Rural Development SIDBI= Small Industrial Development Bank of India SLMC & IAC = State Level Monitoring Cell & Internal Audit Cell SMS = State Matching Share SPA = Special Plan Assistance SPO = Sub-Post Office SSA = Sarva Shiksha Abhiyan STEP-UP= Skill Training for Promotion amoung Urban Poor TPR = Teacher-Pupil Ratio TSC = Total Sanitation Campaign TSECL = Tripura State Electricity Corporation Ltd. TSP = Tribal Sub Plan UCDN= Urban Community Development Network UIDSSMT = Urban Infrastructure Development Scheme for Small and Medium Town UIG = Urban Infrastructure and Governance ULBs = Urban Local Bodies UPS = Upper Primary School/Uninterruptible Power Supply USEP= Urban Self-Employment Programme UWEP= Urban Wage Employment Programme UWSP = Urban Women Self-help Programme VAT = Value Added Tax VHSC = Village Health & Sanitation Committee WAPCOS = Water and Power Consultancy Services Ltd. WDPSCA = Watershed Development Programme in Shifting Cultivation Areas WOMENFD = Mizoram Women Cooperative Federation WPA = Women Polytechnic Aizawl WSS = Water Supply Scheme YHAI = Youth Hostel Association of India ZEDA = Zoram Energy Development Agency ZOFISHFED = Mizoram Cooperative Fish Farming Marketing & Processing Federation
….
Economic Survey Mizoram 2013-14 ~ 1 ~ An Overview of Indian Economy
Economic Survey Mizoram 2013-14
I. AN OVERVIEW OF INDIAN ECONOMY Managing growth and price stability are the major challenges of
macroeconomic policy-making. For the Indian economy, the outlook for growth and price stability during 2013-2014 looks more promising. There are signs from some high frequency indicators that the weakness in economic activity has bottomed out and a gradual upswing is imminent. Gross Domestic Product
GDP at factor cost at current prices in the year 2013-14 is likely to attain a level of Rs.105.4 lakh crore, showing a growth rate of 12.3 per cent over the First Revised Estimate of GDP for the year 2012-13 of Rs. 93.9 lakh crore.
Gross Domestic Product (GDP) at factor cost at constant (2004-05) prices in the year 2013-14 is likely to attain a level of Rs.57.5 lakh crore, as against the First Revised Estimate of GDP for the year 2012-13 of Rs. 54.8 lakh crore, released on 31st January 2014. The growth in GDP during 2013-14 is estimated at 4.9 per cent as compared to the growth rate of 4.5 per cent in 2012-13.
The sectors which registered growth rate of over 5 percent are 'financing, insurance, real estate and business services', community, social and personal services' and electricity, gas and water supply’. The growth in ‘agriculture, forestry and fishing’, manufacturing, mining and quarrying, trade, hotels, transport and communication sector is estimated to be 4.6%, (-)0.2%, (-)1.9%, 1.7% and 3.5% respectively. Per Capita Income The per capita income at current prices during 2013-14 is estimated to be Rs. 74,920 as compared to Rs. 67,839 during 2012-13, showing a rise of 11.9 per cent. The per capita income in real terms (at 2004-05 prices) during 2013-14 is likely to attain a level of Rs.39,961 as compared to the First Revised Estimate for the year 2012-13 of Rs. 38,856. The growth rate in per capita income is estimated at 2.8per cent during 2013-14, as against the previous year's estimate of 2.1 per cent. Agriculture
The ‘agriculture, forestry and fishing’ sector is likely to show a growth of 4.6 per cent in its GDP during 2013-134 as against the previous year’s growth rate of 1.4 per cent. According to the information furnished by the Department of Agriculture and Cooperation (DAC), which has been used in compiling the estimate of GDP from agriculture in 2013-14, production of foodgrains is expected to grow by 2.3 per cent as compared to growth of 0.8 per cent in the previous agriculture year. The production of cotton and sugarcane is also expected to grow by 6.7 per cent and 1.1 per cent as compared to decline of 2.8 percent and 5.5 percent respectively in 2012-13. Among the horticultural crops, production of fruits and vegetables is expected to increase by 3.9 per cent and 4.1 percent during the year 2013-14 as compared to the previous agricultural year.
Economic Survey Mizoram 2013-14 ~ 2 ~ An Overview of Indian Economy
Economic Survey Mizoram 2013-14
Industry The estimated growth in the ‘manufacturing’ ‘mining and quarrying’,
‘electricity, gas and water supply’, and ‘construction’ is estimated to be (-) 0.2 per cent, (-) 1.9 per cent, 6.0 percent and 1.7 per cent, respectively, during 2013-14 as compared to growth of 1.1 percent, (-) 2.2 per cent, 2.3 per cent and 1.1 per cent, respectively, in 2012-13. According to the latest estimates available on the Index of Industrial Production (IIP), the index of mining, manufacturing and electricity registered growth rates of (-)2.2 per cent, (-)0.6 per cent and 5.4 per cent, respectively during April-November, 2013-14, as compared to the growth rates of (-)1.6 per cent, 0.8 per cent and 4.5 per cent, respectively during April-November, 2012-13. The key indicators of construction sector, namely, cement production and steel consumption have registered growth rates of 3.7 per cent and 0.5 per cent, respectively, during April-December, 2013-14. Services
The estimated growth in GDP for the trade, hotels, transport and communication sectors during 2013-14 is placed at 3.5 per cent as against growth of 5.1 percent in the previous year. This is mainly on account of decline of 18.4 per cent in the sales of commercial vehicles during April-December 2013 as compared to decline of 2 percent during April to December 2012-13. Cargo handled at major sea ports increased by 1.9 per cent during April-December, 2013-14 while passengers and cargo handled by civil aviation increased by 8.2 per cent and 0.9 per cent respectively during April-November, 2013-14. The sector, 'financing, insurance, real estate and business services', is expected to show a growth rate of 11.2 per cent during 2013-14 as compared to growth rate of 10.9 per cent in 2012-13, on account of 15.9 per cent growth in aggregate deposits and 14.5 per cent growth in bank credit as on December 2013 (against the respective growth rates of 11.0 per cent and 15.1 per cent in the corresponding period of previous year). The growth rate of 'community, social and personal services' during 2013-14 is estimated to be 7.4 per cent.
…….

Economic Survey Mizoram 2013-14 ~ 3 ~ State Economy
Economic Survey Mizoram 2013-14
II. STATE ECONOMY State Domestic Product Estimates of State Domestic Product is one of the most important single economic indicator to measure the overall economic development of a State. It is the estimates of the value of all goods and services produced within the State during a reference period of one year, commonly referred to as Gross State Domestic Product (GSDP) or simply State Domestic Product (SDP). Economic Growth The GSDP of Mizoram is continuously increasing over the years. Gross State Domestic Product (GSDP) at factor cost at constant (2004-2005) prices is expected to attain an amount of Rs. 562658/- lakhs in 2013-2014 against the advance estimates of Rs. 536990/- lakhs for the year 2012-2013 showing a growth of about 4.78% over the previous year. The GSDP at constant (2004-2005) prices clocked 8.5% average annual growth rate during the financial years 2004-2005 to 2013-2014. GSDP at Factor Cost by Economic Activity : Mizoram (At constant 2004-2005 prices) : Rs in Lakhs
Sl. No
INDUSTRY 2010-2011
2011-2012 (Provisional Estimates)
2012-2013 (Quick
Estimates)
2013-2014 (Projected Estimates)
1 2 3 4 5 6
1 Agriculture, Forestry & Fishing 104474 99770 95131 90878
2 Mining & Quarrying 1287 1687 2211 2899
3 Manufacturing 5381 6933 8934 11516
4 Electricity, Gas & Water Supply 15632 16293 16982 17700
5 Construction 59567 59985 60406 60830
6 Trade, Hotels, Transport & Communication
56556 57021 57525 58072
7
Financing, Insurance, Real Estate & Business Service
77222 86592 97957 111909
8 Community, Social & Personal Services
177813 187511 197841 208858
GSDP at Factor Cost 497932 515792 536990 562658

Economic Survey Mizoram 2013-14 ~ 4 ~ State Economy
Economic Survey Mizoram 2013-14
GSDP at factor cost at current prices is projected to touch Rs. 912836/- lakhs in 2013-2014, a change of 13.35% over the previous year’s (2012-2013) figure of Rs. 805309/- lakhs. GSDP at Factor Cost by Economic Activity : Mizoram (At Current Prices) : Rs in Lakhs
Sl. No
INDUSTRY 2010-2011
2011-2012 (Provisional Estimates)
2012-2013 (Quick
Estimates)
2013-2014 (Projected Estimates)
1 2 3 4 5 6
1 Agriculture, Forestry & Fishing 128206 137005 137305 143567
2 Mining & Quarrying 1796 2323 3005 3886
3 Manufacturing 6946 7690 8763 10339
4 Electricity, Gas & Water Supply 21038 22675 24439 26341
5 Construction 80651 89441 99189 109999
6 Trade, Hotels, Transport & Communication 71224 78418 86351 95101
7 Financing, Insurance, Real Estate & Business Service
108803 137965 175165 222697
8 Community, Social & Personal Services 220124 244265 271090 300904
GSDP at Factor Cost 638788 719782 805309 912836
0100000200000300000400000500000600000
2008-2009 2009-2010 2010-2011 2011-2012 2012-2013 2013-2014
378137424896
497932515792 536990 562658
GSDP AT CONSTANT PRICE

Economic Survey Mizoram 2013-14 ~ 5 ~ State Economy
Economic Survey Mizoram 2013-14
The Per capita income of Mizoram for the year 2012-2013 is estimated at Rs. 60836/- as against the previous year’s estimate of Rs. 55886/-. Per capita income at the national level is Rs. 74920/- for the year 2013-2014 (Advance Estimates).
Per Capita Income
Year Per Capita Income (in Rs.)
2008-2009 38582 2009-2010 42715 2010-2011 50953 2011-2012(P) 55886 2012-2013(Q) 60836 2013-2014(Pr) 67149
P= Provisional Estimate, Q= Quick Estimate , Pr= Project Estimate
38582 4271550953 55886
6083667149
01000020000300004000050000600007000080000
2008-2009 2009-2010 2010-2011 2011-2012 2012-2013 2013-2014
Per capita income
0
200000
400000
600000
800000
1000000
2008-2009 2009-2010 2010-2011 2011-2012 2012-2013 2013-2014
457711525985
638788719782
805309912836
GSDP AT CURRENT PRICE
Economic Survey Mizoram 2013-14 ~ 6 ~ State Economy
Economic Survey Mizoram 2013-14
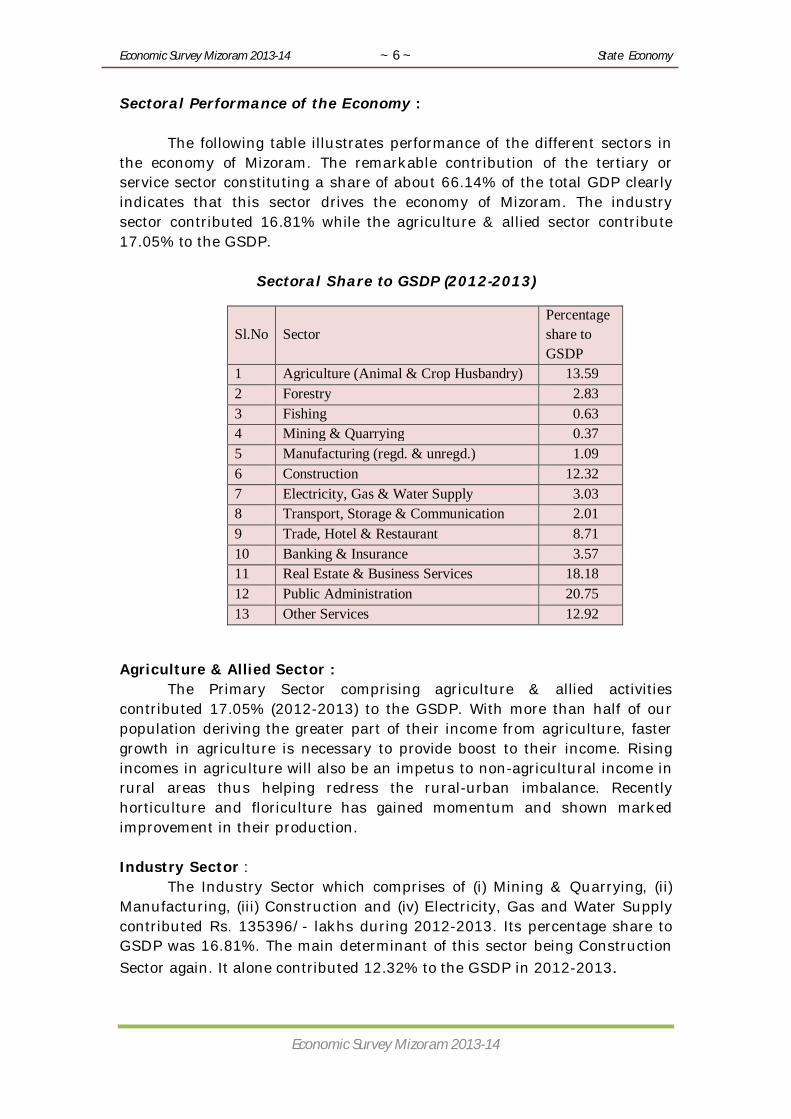
Sectoral Performance of the Economy : The following table illustrates performance of the different sectors in the economy of Mizoram. The remarkable contribution of the tertiary or service sector constituting a share of about 66.14% of the total GDP clearly indicates that this sector drives the economy of Mizoram. The industry sector contributed 16.81% while the agriculture & allied sector contribute 17.05% to the GSDP.
Sectoral Share to GSDP (2012-2013)
Sl.No Sector Percentage share to GSDP
1 Agriculture (Animal & Crop Husbandry) 13.59 2 Forestry 2.83 3 Fishing 0.63 4 Mining & Quarrying 0.37 5 Manufacturing (regd. & unregd.) 1.09 6 Construction 12.32 7 Electricity, Gas & Water Supply 3.03 8 Transport, Storage & Communication 2.01 9 Trade, Hotel & Restaurant 8.71 10 Banking & Insurance 3.57 11 Real Estate & Business Services 18.18 12 Public Administration 20.75 13 Other Services 12.92
Agriculture & Allied Sector : The Primary Sector comprising agriculture & allied activities contributed 17.05% (2012-2013) to the GSDP. With more than half of our population deriving the greater part of their income from agriculture, faster growth in agriculture is necessary to provide boost to their income. Rising incomes in agriculture will also be an impetus to non-agricultural income in rural areas thus helping redress the rural-urban imbalance. Recently horticulture and floriculture has gained momentum and shown marked improvement in their production. Industry Sector : The Industry Sector which comprises of (i) Mining & Quarrying, (ii) Manufacturing, (iii) Construction and (iv) Electricity, Gas and Water Supply contributed Rs. 135396/- lakhs during 2012-2013. Its percentage share to GSDP was 16.81%. The main determinant of this sector being Construction Sector again. It alone contributed 12.32% to the GSDP in 2012-2013.

Economic Survey Mizoram 2013-14 ~ 7 ~ State Economy
Economic Survey Mizoram 2013-14
Service Sector (Tertiary Sector) : The Service Sector comprising (i) Transport, Storage & Communication, (ii) Trade, Hotels & Restaurants, (iii) Banking & Insurance, (iv) Real Estate, Business Services etc, (v) Public Administration and (vi) Other Services continues to have the highest contribution to the GSDP, its share being 66.14% in 2012-2013.
GSDP by Industry of Origin Base Year 2004-2005
Year
Agriculture & Allied Sector Industry Sector Service Sector
Current Price
Constant (2004-2005) Price
Current Price
Constant (2004-2005) Price
Current Price
Constant (2004-2005) Price
2005 -2006 64787 64053 59783 57197 172545 165692 2006 -2007 68565 64227 64208 57826 196225 178534 2007- 2008 80109 73258 76345 65327 225097 195036 2008-2009 94065 82198 95201 76289 268445 219650 2009-2010 107836 89737 102729 78817 315420 256342 2010-2011 128206 104474 110431 81867 400151 311591 2011-2012(P) 137005 99770 122129 84898 460648 331124 2012-2013(Q) 137305 95131 135396 88534 532607 353326 2013-2014(Pr) 143567 90878 150566 92944 618703 378836
17.05 %
16.81%
66.14%
Sectoral Share in GSDP
Agri. & Allied Industry Service

Economic Survey Mizoram 2013-14 ~ 8 ~ State Economy
Economic Survey Mizoram 2013-14
Sectoral Share of Industry In Percentage
Base Year 2004-2005
Year
Agriculture & Allied Sector Industry Sector Service Sector
Current Price
Constant (2004-2005) Price
Current Price
Constant (2004-2005) Price
Current Price
Constant (2004-2005) Price
2004 -2005 23.50 23.50 16.60 16.60 59.90 59.90 2005 -2006 21.81 22.32 20.12 19.94 58.07 57.74 2006 -2007 20.84 21.37 19.52 19.24 59.64 59.39 2007 -2008 21.00 21.96 20.01 19.58 58.99 58.46 2008-2009 20.55 21.74 20.80 20.17 58.65 58.09 2009-2010 20.50 21.12 19.53 18.55 59.97 60.33 2010-2011 20.07 20.98 17.29 16.44 62.64 62.58 2011-2012(P) 19.03 19.34 16.97 16.46 64.00 64.20 2012-2013(Q) 17.05 17.72 16.81 16.49 66.14 65.80 2013-2014(Pr) 15.73 16.15 16.49 16.52 67.78 67.33
……..

Economic Survey Mizoram 2013-14 ~ 9 ~ State Plan
Economic Survey Mizoram 2013-14
III. STATE FINANCE I. FISCAL POSITION AT A GLANCE 1. The State’s fiscal position depends largely on the terms of devolution of resources from the Central Government. 2. The fiscal imbalance of the Central Government that resurfaced in 2009-10 to cope with the exogenous factor spilled over to 2010-11 and aggravated in the subsequent years with the state's fiscal deterioration. Though the Thirteen Finance Commission advised the states to be back on track of fiscal consolidation within two to three years of their award period, in practice it did not happen by and large due to under assessment of the effect of the implementation of the recommendations of the Sixth Pay Commission on non-plan revenue expenditure. Declining GDP growth, large fiscal and external imbalances, stubbornly high inflation and interest rates, and an uncertain global economic environment adversely affected central transfers of Share in Taxes as a percentage to GSDP and Finance Commission grant during 2011-12 and 2012-13. 3. Fiscal consolidation and correction path as prescribed by the successive Finance Commissions has been laid down and incorporated in the FRBM Act, 2006 and Rules 2007 as amended from time to time. 4. Bulging Non Plan Revenue Expenditure is the main issue and challenge of the State Government. Main reasons for increase in NPRE are implementation of Sixth Pay Commission Recommendation of salary and pensions coupled with high cost of Power purchase, interest payment, mass subsidization of foodgrains and ever increasing cost of administration. After the Seventh Plan period, the posts created under Plan could no longer be converted to Non-plan in the succeeding year of the plan period and had to be carried over to the next Plan period which adversely affected the Plan size as well as size of the Plan Capital Expenditure of the State Government. 5. Considering lack of credible investments and palpable economic growth in the State and also the small base of own taxes and revenues and without sufficient support from the Central government in the form of Non Plan Revenue Deficit (NPRD) grant and shares in taxes, the State could not but resort to more borrowings. However, there were no cases of off budget borrowings after termination of practice of on-lending to States from 2005-2006. Although the State can contain its debts within the limit prescribed by FRBM Act so far, the ever-increasing debt may in the near future result in bunching of repayments having serious consequences. 6. Major Fiscal Aggregates of the Government of Mizoram for the last few years is shown in Table-1 below.

Economic Survey Mizoram 2013-14 ~ 10 ~ State Plan
Economic Survey Mizoram 2013-14
Table – I Major Fiscal Aggregates
(Figures in crore of rupees)
Sl. No Item 2009-10
(Actuals) 2010-11 (Actuals)
2011-12 (Actuals)
2012-13 (Pre -Actuals)
2013-14 (RE)
1 2 3 4 5 6 7 1 Total Revenue Receipts 2963.50 2855.37 3824.90 4536.74 5545.34 (a) State’s Own Tax Revenues 107.58 130.44 179.07 223.15 234.82
(b) State’s Own Non Tax Revenues 126.50 146.72 168.03 212.80 251.78
(c) Share in Central Taxes 394.53 451.66 827.38 785.96 874.46 (d) Grant-in-aid from GOI 2334.89 2126.55 2650.42 3314.83 4184.28 (i) Non-Plan Grants 725.33 724.97 797.24 1057.16 1180.76 (ii) Plan Grants 1,609.56 1401.58 1853.18 2257.67 3003.52 2 Non-Plan Expenditure 1,932.49 2187.92 2472.15 3161.18 3741.38 3 Plan Expenditure 1733.28 1985.44 2110.63 2271.58 4035.83 4 Total Expenditure 3665.77 4173.36 4582.78 5432.76 7777.21 5 Revenue Expenditure 2702.70 3256.23 3697.32 4508.91 6145.03 6 Capital Expenditure 963.07 917.13 885.46 923.85 1632.18 7 Loans and Advance Expenditure (24.94) (29.87) (33.52) (30.25) (55.95) 8 Transfer to Contingency Fund - - - - - 9 Revenue Surplus 260.80 -400.86 127.58 27.83 -599.69 10 Gross Fiscal Deficit (GFD) -311.62 -1019.48 -478.41 -580.49 -1596 11 Percentage of GFD to GSDP* 5.55 16.83 6.84 7.21 17.96 12 GSDP 5619.14 6057.70 6991.40 8053.00 8886.00
GSDP figures for 2009-10, 2010-11 and 2011-12 are taken from C&AG Report. GSDP Figures for 2012-13 and 2013-14 are taken from figure used by Ministry of Finance. II. FISCAL POSITION FOR 2012-13: A REVIEW. 7. Due to non-availability of the actual figure (Finance Accounts 2012-13), the pre-actuals figures have been taken for analyzing the fiscal position of Mizoram during the financial year 2012-’13. On retrospection, it can be seen that the fiscal deficit as a percentage of GSDP was 7.21 per cent which is higher than the permissible limit of 5.2 per cent norm set by the Thirteen Finance Commission for the year 2012-’13. This overshoot may be attributable to inevitable expansionary borrowing resorted to by the Government. On scrutiny of the components of Revenue Receipt, all other components except Share in Central Taxes are showing positive trend during 2012-13 such that the total Revenue Receipt stood at Rs. 4536.74 crore which is an improvement of Rs. 711.84 over the previous year. 8. In spite of improvement in the revenue fronts, the expenditure side also increased enormously during the same period from Rs. 4582.78 crore in 2011-12 to Rs. 5432.76 in 2012-13. This increase in expenditure to the tune of Rs. 849.98 crore cannot be catered to by Rs. 711.84 crore increase in Revenue receipts. The State Government is unable to contain the surging revenue expenditure under Plan
Economic Survey Mizoram 2013-14 ~ 11 ~ State Plan
Economic Survey Mizoram 2013-14
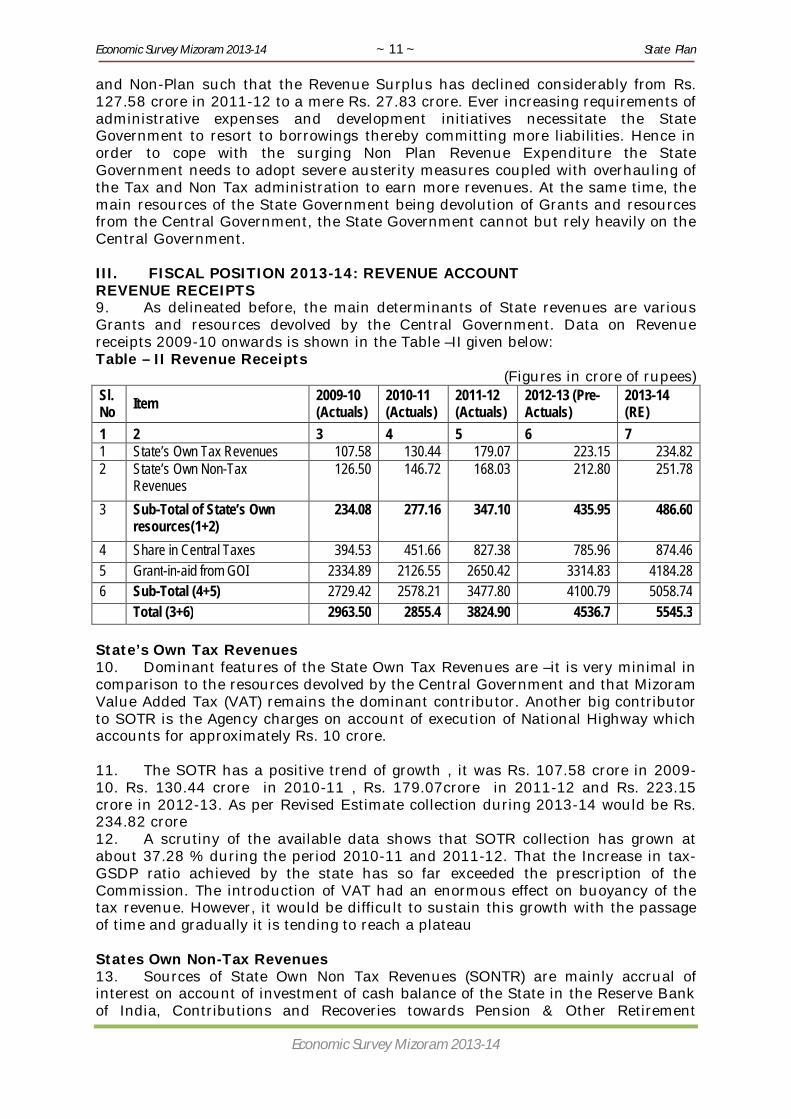
and Non-Plan such that the Revenue Surplus has declined considerably from Rs. 127.58 crore in 2011-12 to a mere Rs. 27.83 crore. Ever increasing requirements of administrative expenses and development initiatives necessitate the State Government to resort to borrowings thereby committing more liabilities. Hence in order to cope with the surging Non Plan Revenue Expenditure the State Government needs to adopt severe austerity measures coupled with overhauling of the Tax and Non Tax administration to earn more revenues. At the same time, the main resources of the State Government being devolution of Grants and resources from the Central Government, the State Government cannot but rely heavily on the Central Government. III. FISCAL POSITION 2013-14: REVENUE ACCOUNT REVENUE RECEIPTS 9. As delineated before, the main determinants of State revenues are various Grants and resources devolved by the Central Government. Data on Revenue receipts 2009-10 onwards is shown in the Table –II given below: Table – II Revenue Receipts
(Figures in crore of rupees) Sl. No Item 2009-10
(Actuals) 2010-11 (Actuals)
2011-12 (Actuals)
2012-13 (Pre-Actuals)
2013-14 (RE)
1 2 3 4 5 6 7 1 State’s Own Tax Revenues 107.58 130.44 179.07 223.15 234.82 2 State’s Own Non-Tax
Revenues 126.50 146.72 168.03 212.80 251.78
3 Sub-Total of State’s Own resources(1+2)
234.08 277.16 347.10 435.95 486.60
4 Share in Central Taxes 394.53 451.66 827.38 785.96 874.46 5 Grant-in-aid from GOI 2334.89 2126.55 2650.42 3314.83 4184.28 6 Sub-Total (4+5) 2729.42 2578.21 3477.80 4100.79 5058.74 Total (3+6) 2963.50 2855.4 3824.90 4536.7 5545.3 State’s Own Tax Revenues 10. Dominant features of the State Own Tax Revenues are –it is very minimal in comparison to the resources devolved by the Central Government and that Mizoram Value Added Tax (VAT) remains the dominant contributor. Another big contributor to SOTR is the Agency charges on account of execution of National Highway which accounts for approximately Rs. 10 crore. 11. The SOTR has a positive trend of growth , it was Rs. 107.58 crore in 2009-10. Rs. 130.44 crore in 2010-11 , Rs. 179.07crore in 2011-12 and Rs. 223.15 crore in 2012-13. As per Revised Estimate collection during 2013-14 would be Rs. 234.82 crore 12. A scrutiny of the available data shows that SOTR collection has grown at about 37.28 % during the period 2010-11 and 2011-12. That the Increase in tax-GSDP ratio achieved by the state has so far exceeded the prescription of the Commission. The introduction of VAT had an enormous effect on buoyancy of the tax revenue. However, it would be difficult to sustain this growth with the passage of time and gradually it is tending to reach a plateau States Own Non-Tax Revenues 13. Sources of State Own Non Tax Revenues (SONTR) are mainly accrual of interest on account of investment of cash balance of the State in the Reserve Bank of India, Contributions and Recoveries towards Pension & Other Retirement
Economic Survey Mizoram 2013-14 ~ 12 ~ State Plan
Economic Survey Mizoram 2013-14
Benefits, Collection of User Charges on Water Supply, Electricity Bill, tariff on Government’s Guest House, fees collected by various Departments, etc. 14. There has been a certain degree of uncertainty in the collection of State’s Own Non-Tax Revenues (SONTR) unlike that of the Tax Revenue. Existing user charges need revision so as to realize more revenue; however, such upward revision may not be possible to be enforced without inciting complaints from various stakeholders. Table II shows the trends of SONTR collection during 2009-10 to 2013-14. State’s Share in Central Taxes As per the recommendation of the Thirteenth Finance Commission, the share of States in the net proceeds of Union taxes was fixed at 32 per cent. Out of this, the share of Mizoram in inter-se distribution of the State’s share amongst the States is 0.269 per cent. Depending upon buoyancy of the Central taxes, actual receipt of the State in Central Taxes may be more or less than the projection of the Commission. Again, economic boom and recession may also play a vital role in determination of the actual volume of devolution.
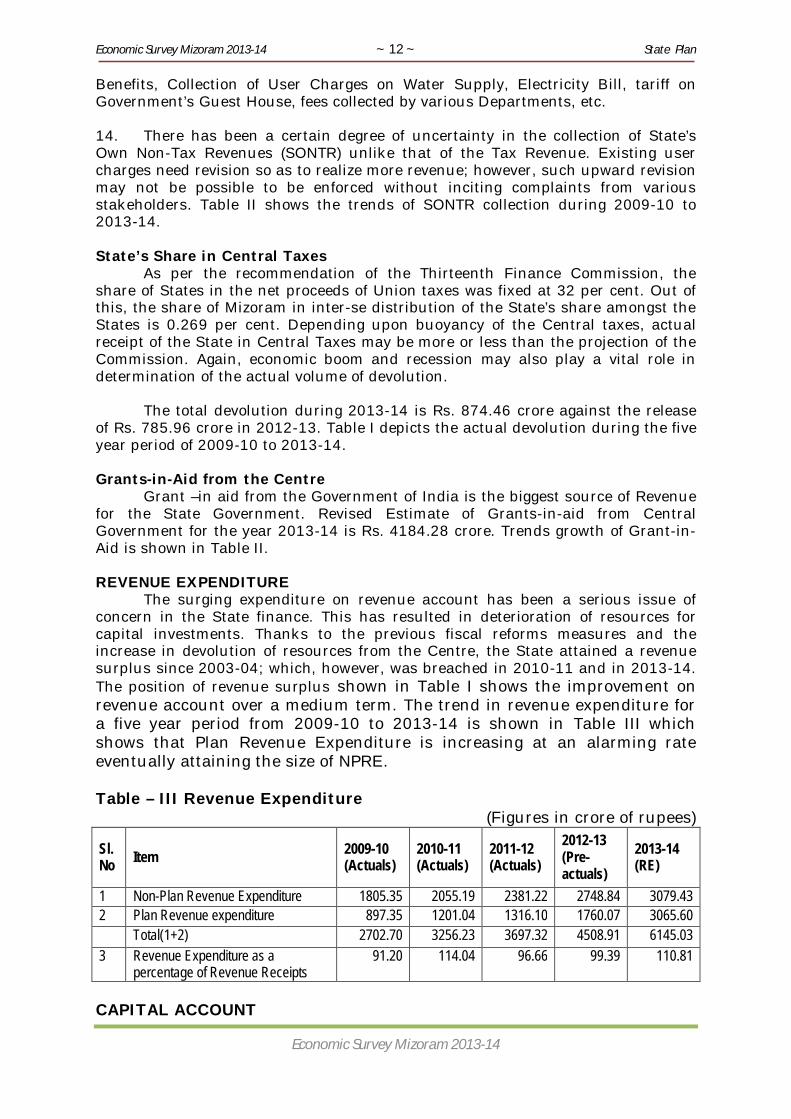
The total devolution during 2013-14 is Rs. 874.46 crore against the release of Rs. 785.96 crore in 2012-13. Table I depicts the actual devolution during the five year period of 2009-10 to 2013-14. Grants-in-Aid from the Centre Grant –in aid from the Government of India is the biggest source of Revenue for the State Government. Revised Estimate of Grants-in-aid from Central Government for the year 2013-14 is Rs. 4184.28 crore. Trends growth of Grant-in-Aid is shown in Table II. REVENUE EXPENDITURE The surging expenditure on revenue account has been a serious issue of concern in the State finance. This has resulted in deterioration of resources for capital investments. Thanks to the previous fiscal reforms measures and the increase in devolution of resources from the Centre, the State attained a revenue surplus since 2003-04; which, however, was breached in 2010-11 and in 2013-14. The position of revenue surplus shown in Table I shows the improvement on revenue account over a medium term. The trend in revenue expenditure for a five year period from 2009-10 to 2013-14 is shown in Table III which shows that Plan Revenue Expenditure is increasing at an alarming rate eventually attaining the size of NPRE. Table – III Revenue Expenditure
(Figures in crore of rupees)
Sl. No Item 2009-10
(Actuals) 2010-11 (Actuals)
2011-12 (Actuals)
2012-13 (Pre-actuals)
2013-14 (RE)
1 Non-Plan Revenue Expenditure 1805.35 2055.19 2381.22 2748.84 3079.43 2 Plan Revenue expenditure 897.35 1201.04 1316.10 1760.07 3065.60 Total(1+2) 2702.70 3256.23 3697.32 4508.91 6145.03 3 Revenue Expenditure as a
percentage of Revenue Receipts 91.20 114.04 96.66 99.39 110.81
CAPITAL ACCOUNT
Economic Survey Mizoram 2013-14 ~ 13 ~ State Plan
Economic Survey Mizoram 2013-14
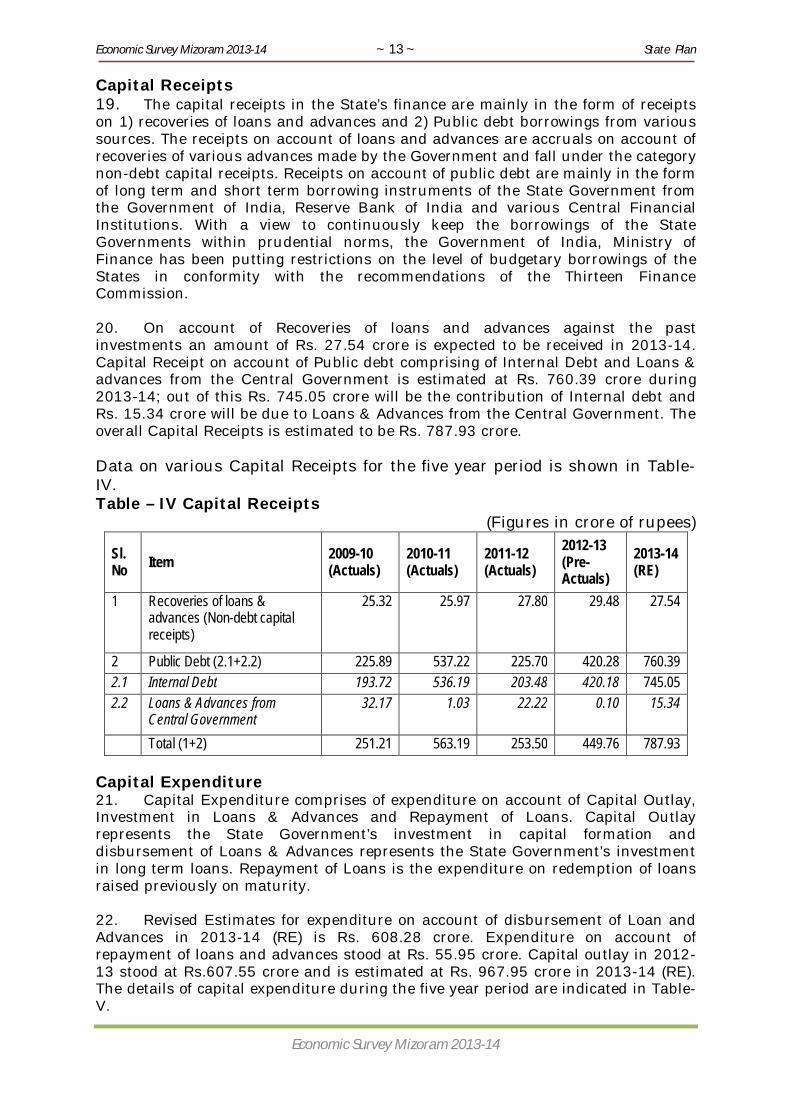
Capital Receipts 19. The capital receipts in the State’s finance are mainly in the form of receipts on 1) recoveries of loans and advances and 2) Public debt borrowings from various sources. The receipts on account of loans and advances are accruals on account of recoveries of various advances made by the Government and fall under the category non-debt capital receipts. Receipts on account of public debt are mainly in the form of long term and short term borrowing instruments of the State Government from the Government of India, Reserve Bank of India and various Central Financial Institutions. With a view to continuously keep the borrowings of the State Governments within prudential norms, the Government of India, Ministry of Finance has been putting restrictions on the level of budgetary borrowings of the States in conformity with the recommendations of the Thirteen Finance Commission. 20. On account of Recoveries of loans and advances against the past investments an amount of Rs. 27.54 crore is expected to be received in 2013-14. Capital Receipt on account of Public debt comprising of Internal Debt and Loans & advances from the Central Government is estimated at Rs. 760.39 crore during 2013-14; out of this Rs. 745.05 crore will be the contribution of Internal debt and Rs. 15.34 crore will be due to Loans & Advances from the Central Government. The overall Capital Receipts is estimated to be Rs. 787.93 crore. Data on various Capital Receipts for the five year period is shown in Table-IV. Table – IV Capital Receipts
(Figures in crore of rupees)
Sl. No Item 2009-10
(Actuals) 2010-11 (Actuals)
2011-12 (Actuals)
2012-13 (Pre-Actuals)
2013-14 (RE)
1 Recoveries of loans & advances (Non-debt capital receipts)
25.32 25.97 27.80 29.48 27.54
2 Public Debt (2.1+2.2) 225.89 537.22 225.70 420.28 760.39 2.1 Internal Debt 193.72 536.19 203.48 420.18 745.05 2.2 Loans & Advances from
Central Government 32.17 1.03 22.22 0.10 15.34
Total (1+2) 251.21 563.19 253.50 449.76 787.93
Capital Expenditure 21. Capital Expenditure comprises of expenditure on account of Capital Outlay, Investment in Loans & Advances and Repayment of Loans. Capital Outlay represents the State Government’s investment in capital formation and disbursement of Loans & Advances represents the State Government’s investment in long term loans. Repayment of Loans is the expenditure on redemption of loans raised previously on maturity. 22. Revised Estimates for expenditure on account of disbursement of Loan and Advances in 2013-14 (RE) is Rs. 608.28 crore. Expenditure on account of repayment of loans and advances stood at Rs. 55.95 crore. Capital outlay in 2012-13 stood at Rs.607.55 crore and is estimated at Rs. 967.95 crore in 2013-14 (RE). The details of capital expenditure during the five year period are indicated in Table-V.

Economic Survey Mizoram 2013-14 ~ 14 ~ State Plan
Economic Survey Mizoram 2013-14
Table – V Capital Expenditure
(Figures in crore of rupees)
Sl. No Item 2009-10
(Actuals) 2010-11 (Actuals)
2011-12 (Actuals)
2012-13 (Pre-actuals)
2013-14 (RE)
1 Capital Outlay 572.80 614.71 600.27 607.55 967.95
2 Other Capital Expenditure (2.1+2.2) 390.27 302.42 285.19 316.30 664.23
(a) Disbursement of Loans & Advances 365.33 272.55 251.67 286.05 608.28
(b) Repayment of Loans & Advances 24.94 29.87 33.52 30.25 55.95
Total (1+2) 963.07 917.13 885.46 923.85 1632.18
III. PUBLIC DEBT 23. Public Debt in short consists of all kinds of borrowings of the government to finance its expenditure. For financing deficit, the government borrows funds from various sources such as Government Bonds by raising market loans, loans from Central Financial Institutions (CFIs) as negotiated loans, loans from the Central Government as loan components in the Block Grants and Centrally Sponsored Schemes (CSS), loans released to the State Government out of the share in the National Small Savings Fund (NSSF), etc. Besides, the State Government also acts as a banker in respect of certain funds in the Public Accounts like Provident Funds, GIS, etc. which are to be repaid with interests to the employees. 24. The FRBM Act, 2006 and Rules, 2007 prescribe that the State government shall ensure that the total outstanding debt in a year shall not exceed twice of the estimated receipts in the Consolidated Fund of the State at the close of the financial year. The third Amendment of FRBM Act, 2011 thereby mandated that the State government should reduce total outstanding debt as a percentage of GSDP so as to reach the annual target of 87.3 % in 2010-11, 85.7 % in 2011-12, 82.9 % in 2012-13, 79.2 % in 2013-14 and 74.8 % in 2014-15. Performance of the State may be seen from Table VI below. Table – VI Outstanding Liabilities (Figures in crore of rupees)
Year Accumulated Debt (Finance Accounts)
Gross State Domestic Product (GSDP)
Percentage of Debt to GSDP
2009-10 3627.69 5497.93 65.98 2010-11 4491.82 6057.70 74.15 2011-12 4548.45 6991.40 65.06 2012-13 (Pre-actuals)
5114.20 8053.00 63.51
2013-14 (RE) 5455.95 8886.00 61.40
Economic Survey Mizoram 2013-14 ~ 15 ~ State Plan
Economic Survey Mizoram 2013-14
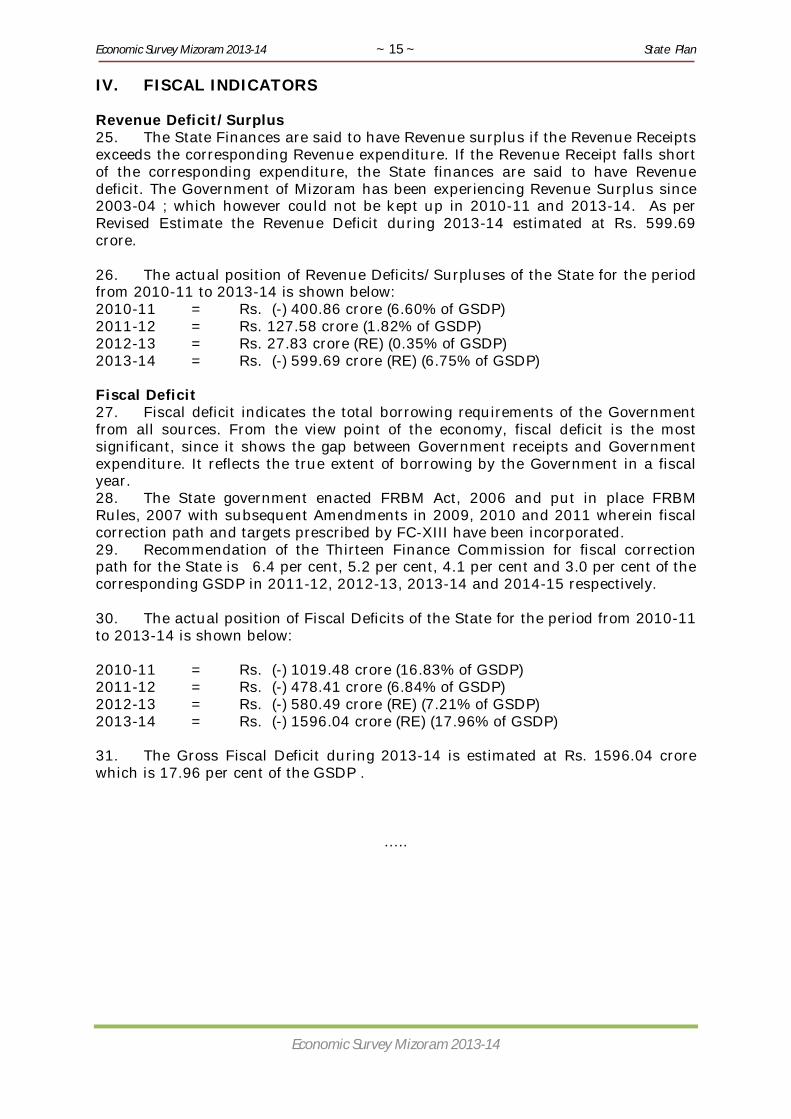
IV. FISCAL INDICATORS Revenue Deficit/Surplus 25. The State Finances are said to have Revenue surplus if the Revenue Receipts exceeds the corresponding Revenue expenditure. If the Revenue Receipt falls short of the corresponding expenditure, the State finances are said to have Revenue deficit. The Government of Mizoram has been experiencing Revenue Surplus since 2003-04 ; which however could not be kept up in 2010-11 and 2013-14. As per Revised Estimate the Revenue Deficit during 2013-14 estimated at Rs. 599.69 crore. 26. The actual position of Revenue Deficits/Surpluses of the State for the period from 2010-11 to 2013-14 is shown below: 2010-11 = Rs. (-) 400.86 crore (6.60% of GSDP) 2011-12 = Rs. 127.58 crore (1.82% of GSDP) 2012-13 = Rs. 27.83 crore (RE) (0.35% of GSDP) 2013-14 = Rs. (-) 599.69 crore (RE) (6.75% of GSDP) Fiscal Deficit 27. Fiscal deficit indicates the total borrowing requirements of the Government from all sources. From the view point of the economy, fiscal deficit is the most significant, since it shows the gap between Government receipts and Government expenditure. It reflects the true extent of borrowing by the Government in a fiscal year. 28. The State government enacted FRBM Act, 2006 and put in place FRBM Rules, 2007 with subsequent Amendments in 2009, 2010 and 2011 wherein fiscal correction path and targets prescribed by FC-XIII have been incorporated. 29. Recommendation of the Thirteen Finance Commission for fiscal correction path for the State is 6.4 per cent, 5.2 per cent, 4.1 per cent and 3.0 per cent of the corresponding GSDP in 2011-12, 2012-13, 2013-14 and 2014-15 respectively. 30. The actual position of Fiscal Deficits of the State for the period from 2010-11 to 2013-14 is shown below: 2010-11 = Rs. (-) 1019.48 crore (16.83% of GSDP) 2011-12 = Rs. (-) 478.41 crore (6.84% of GSDP) 2012-13 = Rs. (-) 580.49 crore (RE) (7.21% of GSDP) 2013-14 = Rs. (-) 1596.04 crore (RE) (17.96% of GSDP) 31. The Gross Fiscal Deficit during 2013-14 is estimated at Rs. 1596.04 crore which is 17.96 per cent of the GSDP .
.....

Economic Survey Mizoram 2013-14 ~ 16 ~ State Plan
Economic Survey Mizoram 2013-14
IV. STATE PLAN
Prior to 1972, Mizoram was one of the distssricts of Assam. During that
period, very small amount was spent for the development of Mizoram and the outlays for the first three Five Year Plans were as given below : (Rs in lakh ) –
1st Five Year Plan (1952-56) - Rs. 63.02 2nd Five Year Plan (1956-61) - Rs.210.83 3rd Five Year Plan (1961-66) - Rs.411.42
During the first three years of the Fourth Five Year Plan (1962-72), the following were the Plan expenditure in Mizoram :
1969 – 1970 - Rs. 101.61 lakh 1970 – 1971 - Rs. 176.42 lakh 1971 – 1972 - Rs. 205.18 lakh
Since Mizoram attained the status of U.T. in January, 1972, Planning
Commission approved an outlay of Rs. 275.00 lakh for the Annual Plan 1972-73. This outlay was enhanced to Rs. 437.00 lakh in the later part of the year. Out of this provision, only Rs.355.23 lakh was actually spent.
During 1973-74, Rs. 600.00 lakh was allocated for Mizoram out of which only Rs. 573.73 lakh was actually spent.
During the Fifth Five Year Plan (1974-79) Rs. 46.59 crore was allotted for Mizoram against the total Plan size of Rs. 39,300.24 crore for the country as a whole.
In the Sixth Five Year Plan, Rs. 128.47 crore was the outlay for Mizoram whereas the total Plan size was Rs. 71,000.00 crore, but the said 6th Plan was not completed as there was a change of government at the centre.
Before the commencement of the new 6th Five Year Plan (1980-85), there
were two Rolling Annual Plans for 1978-79 and 1979-80. During these two years, the outlays for Mizoram annual Plans were Rs. 16.64 crore and Rs. 17.72 crore and the actual expenditure were Rs. 14.62 and Rs. 16.11 crore respectively.
During the 6th Five year Plan (1980-85), Rs. 130.00 crore was originally allotted for Mizoram. The actual expenditure during the Plan period amounted to Rs. 150.09 crore.
The original outlay for the 7th Five Year Plan (1985-90) in respect of Mizoram was Rs. 260.00 crore. However, the actual release of Plan fund during the period by way of Annual Plan was Rs. 364.50 crore, out of which the actual expenditure was Rs. 363.56 crore.
Prior to the launching of Eight Five Year Plan in 1992-93 there were two Annual Plans for 1990-91 and 1991-92, for which the actual expenditure were Rs.
Economic Survey Mizoram 2013-14 ~ 17 ~ State Plan
Economic Survey Mizoram 2013-14
125.35 crore and Rs. 152.28 crore respectively against the outlays of Rs. 125.00 crore and Rs. 152.00 crore.
The original approved outlay for the 8th Five Year Plan was Rs. 763.00 crore.
However, the total approved outlays for the five annual plans during the period was Rs.1064.60 crore against which the total expenditure was Rs. 1064.45 crore.
The original approved outlay for the 9th Five Year Plan (1997-2002) was Rs.1618.51 crore. However, the total approved outlays for the five successive Annual Plans during the period was Rs. 1794.26 crore and the total actual expenditure was Rs. 1719.96 crore.
While the original agreed outlay for the 10th Five Year Plan (2002-2007) was
Rs. 2300.01 crore, total of successive Annual Plan approved outlays was Rs. 2969.52 crore and total of the successive Revised Annual Plan outlays was Rs. 3154.99 crore. The total actual expenditure during the 10th Five Year Plan was Rs. 2941.48 crore which was 127.88% of the original agreed total outlay of Rs. 2300.01 crore for the 10th Five Year Plan.
The original approved outlay for the 11th Five Year Plan (2007-2012) was
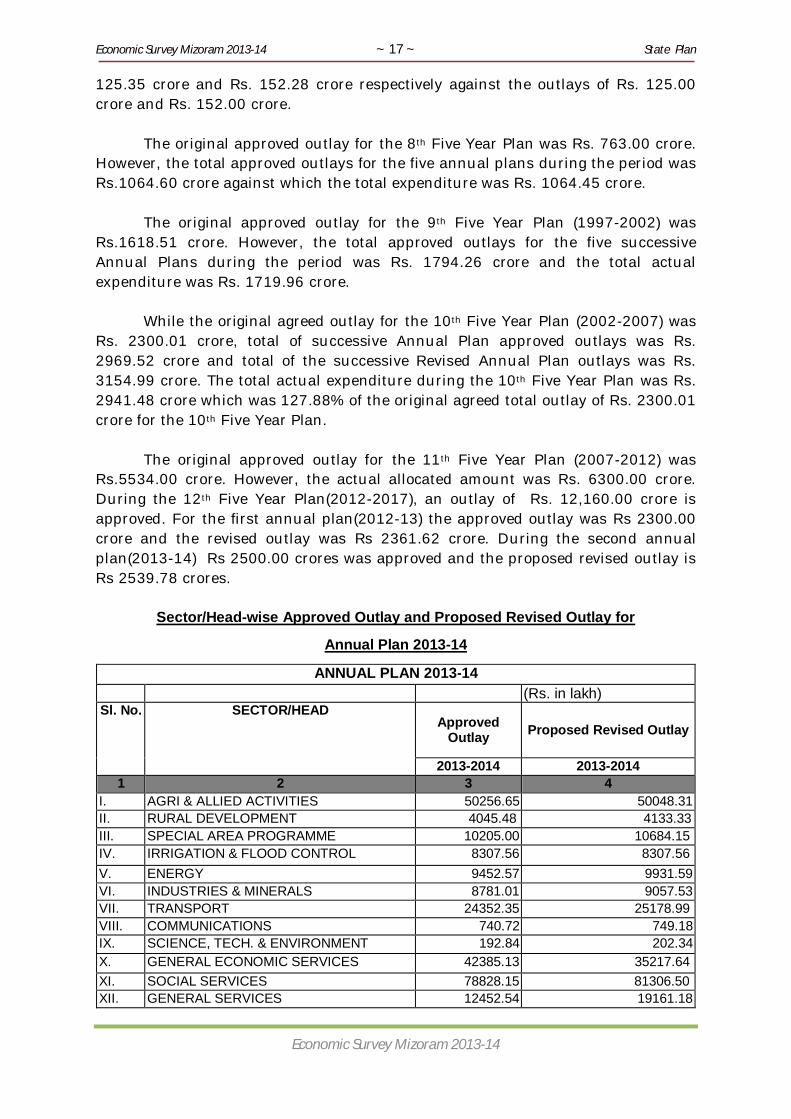
Rs.5534.00 crore. However, the actual allocated amount was Rs. 6300.00 crore. During the 12th Five Year Plan(2012-2017), an outlay of Rs. 12,160.00 crore is approved. For the first annual plan(2012-13) the approved outlay was Rs 2300.00 crore and the revised outlay was Rs 2361.62 crore. During the second annual plan(2013-14) Rs 2500.00 crores was approved and the proposed revised outlay is Rs 2539.78 crores.
Sector/Head-wise Approved Outlay and Proposed Revised Outlay for
Annual Plan 2013-14
ANNUAL PLAN 2013-14 (Rs. in lakh)
Sl. No. SECTOR/HEAD Approved
Outlay Proposed Revised Outlay
2013-2014 2013-2014 1 2 3 4
I. AGRI & ALLIED ACTIVITIES 50256.65 50048.31 II. RURAL DEVELOPMENT 4045.48 4133.33 III. SPECIAL AREA PROGRAMME 10205.00 10684.15 IV. IRRIGATION & FLOOD CONTROL 8307.56 8307.56 V. ENERGY 9452.57 9931.59 VI. INDUSTRIES & MINERALS 8781.01 9057.53 VII. TRANSPORT 24352.35 25178.99 VIII. COMMUNICATIONS 740.72 749.18 IX. SCIENCE, TECH. & ENVIRONMENT 192.84 202.34 X. GENERAL ECONOMIC SERVICES 42385.13 35217.64 XI. SOCIAL SERVICES 78828.15 81306.50 XII. GENERAL SERVICES 12452.54 19161.18

Economic Survey Mizoram 2013-14 ~ 18 ~ State Plan
Economic Survey Mizoram 2013-14
GRAND TOTAL 2,50,000.00 2,53,978.30
North Eastern Council (NEC)
The North Eastern Council, set up by an act of Parliament in 1971 as an Advisory body for all round development of the North eastern Region is now function as regional planning body. It comprises 8 (eight) States viz – (1) Arunachal Pradesh (2) Assam (3) Manipur (4) Meghalaya (5) Mizoram (6) Nagaland (7) Sikkim and (8) Tripura. The North Eastern region cover an area of 262189 Sq.Km constituting 7.98% of the country’s geographical area and account for only 3.79% of the total population of Indian Union (2001 Census).
The Council plays an important role for Socio-economic Development of the North Eastern States for various sectors. The major investments had been in transport an communication followed by the water and power sector. Investments include construction of roads, upgradation/ improvement of airports, survey and investigation of hydroelectric power projects
At present, there are 55 no's of on-going projects with total cost Rs. 778.85 crores. NEC had released Rs. 33.70 crores for these projects during 2013-14 and Rs. 461.40 crores since inception of these projects. Mizoram Govt' submitted 75 no's of new projects as 'State Priority' for funding during 2013-14. NEC had retained 8 projects and accorded approval of 2 projects costing Rs. 12.73 crores.
Status of fund release to Mizoram by NEC duirng 2008-13 (Rs. in lakhs).
Sl. No. Name Of Scheme 2008-09 2009-10 2010-11 2011-12 2012-13
1 2 3 4 5 6 7
I. Agriculture & Allied Sector 88.20 141.50 - 316.33 682.85
II. Irrigation, Flood Control & Wsm - 35.00 417.00 280.68 713.82
III. Industries & Tourism Sector 53.60 59.70 66.35 110.53 357.31
IV. Power Development 783.00 450.00 717.69 355.00 1,081.12
V. Transport & Communication 3,300.00 1,997.82 2,930.20 4,542.88 6,069.88
VI. Science & Technology Sector 180.00 75.00 165.19 223.20 325.77
VII. Medical & Health Services 116.57 30.00 130.00 355.00 406.53
VIII. Human Resources Development 49.85 154.11 313.70 580.50 665.94
IX. Information & Public Relations - - 4.25 2.50 145.00
Grand Total 4,571.22 2,943.13 4,744.38 6,766.62 10,448.22
Economic Survey Mizoram 2013-14 ~ 19 ~ State Plan
Economic Survey Mizoram 2013-14
Non-Lapsable Central Pool Resources
The Non-Lapsable Central Pool of Resources (NLCPR) was created during 1998-99 out of unspent balance of mandatory 10% of GBS of the concerned Central Ministries. Initially it was administered by the Planning Commission and transferred to the Department of Development of North Eastern Region during 2001-02. The Department was upgraded to a Ministry in 2004.
The Non Lapsable Central Pool of Resources(NLCPR) has been implemented in Mizoram since 1998-1999. Since the implementation of this project in Mizoram a total of 132 projects has been sanctioned out of which, 71 projects were completed and 61 are on-going projects. A total of Rs 51,482.91 lakhs have been released for completed projects. Total approved cost for the 61 on-going projects amounts to Rs 57430.34 lakhs out of which Rs 32661.46 lakhs have been released.
In addition to the above there are 60 nos of projects with a total estimated cost of Rs 49,032.00 lakhs which are under active consideration.
Year-wise fund released since the inception of NLCPR are as follows: — (Rs. in lakh) 1998 – 1999 - 900.00 1999 – 2000 - 5,615.00 2000 – 2001 - 2,671.00 2001 – 2002 - 6,986.00 2002 – 2003 - 8,343.00 2003 – 2004 - 9,953.60 2004 – 2005 - 4,236.96 2005 – 2006 - 4,104.19 2006 – 2007 - 5,646.43 2007 – 2008 - 2,982.37 2008 – 2009 - 1,494.52 2009 – 2010 - 1,991.42 2010 – 2011 - 7,372.61 2011 – 2012 - 3,656.16 2012 – 2013 - 8,168.12 2013 – 2014 - 5,166.28 (till Jan. 31, 2014) Total - 79,287.66
…….
Economic Survey Mizoram 2013-14 ~ 20 ~ Employment & Labour Welfare
Economic Survey Mizoram 2013-14
V. EMPLOYMENT & LABOUR WELFARE
Population Census 2011 reveals that out of the total population of 1097206 in the state, 44.35% i,e. 486705 were workers and the rest 610501 were non-workers. The proportion of workers has decreased from 52.57% in 2001 census to 44.35% in 2011 census. It also reveals that proportion of workers was higher in the rural areas at 52% than in the urban areas which has about 48% of all workers. Also, female working population constitute about 40% of total workers and the share of male working population was about 60%. As per Census 2011, 65 per cent of the total workers are engaged in agricultural activities.
Percentage (%) to Total Main Workers
DISTRICT Cultivators Agricultural
Labourer
Workers in Household Industries
Other Workers
2001 Census
2011 Census
2001 Census
2011 Census
2001 Census
2011 Census
2001 Census
2011 Census
Mamit 77.51 79.22 3.29 7.05 0.80 0.72 18.39 13.01
Kolasib 61.52 60.58 3.83 19.93 1.13 1.96 33.52 17.53
Aizawl 31.41 25.93 2.51 7.55 1.47 2.21 64.61 64.31
Champhai 70.19 72.18 6.37 10.96 1.12 1.84 22.31 15.02
Serchhip 72.77 73.07 2.32 4.30 2.64 3.10 22.27 19.53
Lunglei 65.23 73.27 1.52 17.19 0.59 1.31 32.65 8.23
Lawngtlai 71.52 76.64 3.09 8.27 0.99 1.60 24.40 13.49
Saiha 67.66 60.62 1.28 6.51 0.80 2.13 30.26 30.74
Labour Administration
A country or state can prosper only if proper care, security, safety and protection is given to its workforce. Various Labour Acts such as Minimum Wages Act, 1945, Trade Union Act, 1926, Inter-State Migrant Workmen Act, 1979, Contract Labour Act, 1970, Building & Other Construction Workers’ Act, 1996 etc. have been implemented by the state with the above object in view. The Mizoram Shops & Establishments Act, 2010 and the Mizoram Child Labour(Prohibition & Regulation) Rules, 2010 have been approved by the meeting of the Council of Ministers in February, 2010.
Regular Male 33,568 Female 10,989
TOTAL 44,557 Muster Roll 8,113 Workcharge 625 Others 2,170 TOTAL EMPLOYEE 55,465

Economic Survey Mizoram 2013-14 ~ 21 ~ Employment & Labour Welfare
Economic Survey Mizoram 2013-14
Public Sector Employment As per Census of Government Employees, 2012, the number of employees working under the state government were 55,465 out of which 44.557 were regular employees and 8013 were Muster Roll and 625 were work-charged.
GROUP WISE NUMBER OF STATE GOVERNMENT EMPLOYEES as on 31.3.2012
Sl. No. Group Male Female Total
1. A 2931 1160 4091 2. B ‘G’ 1135 574 1709 3. B ‘NG’ 7721 4627 12348 4. C 15244 3039 18283 5. D 6537 1589 8126 6. SUB.TOTAL 33568 10989 44557
OTHERS 7. Contract 899 766 1665 8. Work Charge 454 171 625 9. Muster Roll 6112 2001 8113 10. Officiating 6 5 11 11. Co-Terminus 361 133 494 12. SUB-TOTAL 7832 3076 10908 13. Grand Total 41400 14065 55465
As per the last i.e. 6th Economic Census held in 2013, a total of 1,09,559 persons were employed in all the 51,723 enterprises in the state.
Out of the total workers in the state, 35,145 (32.08%) were employed in rural areas and 74,414(67.92%) were employed in urban areas. In all, there are 58,407 hired workers. Out of the total hired workers engaged in both agricultural and non-agricultural enterprise, 35,258 worked in the urban areas and the remaining 19,251 worked in rural areas.
Implementation of Minimum Wages Act, 1948: State Advisory Board representing workers, employees and independent persons was constituted under the Minimum Wages Act, 1948 and Mizoram Rules, 1992. Minimum daily rates of wages on the State’s sphere of employment was fixed in April, 2013 on the basis of the advice of the Advisory Board as follows:- Unskilled - Rs. 220/- Semi – Skilled - Rs. 250/- Skilled – II - Rs. 310/- Skilled – I - Rs. 380/-
Implementation of Contract Labour Act, 1970 and Inter-State Migrant Workmen Act, 1970 and the Mizoram Rules, 2005.
As on 31.32013 No. of Licenses Issued under No. of Labours covered by Licenses Contract Labour 51 2756 Inter-State Migrant Workmen 71 6006
Economic Survey Mizoram 2013-14 ~ 22 ~ Employment & Labour Welfare
Economic Survey Mizoram 2013-14
Vocational Training (ITI) The state Government is running ITI at Aizawl, Lunglei and Saiha under National Vocational Training Programme with the following objectives:-
(a) To ensure steady flow of skilled workers in different trades to meet the man-power need of the state and of the nation
(b) To reduce unemployment among educated youth by providing employable training.
Status of the three Gov’t. ITI’s (2013)
Name of Institution No. of Trainees enrolled
I.T.I., Aizawl I.T.I., Lunglei I.T.I., Saiha
336 36 37
Employment Service: While reducing un-employment continued to be the major thrust of developmental planning, growing un-employment problem still remains an alarming feature of the state. Job-seekers have been increasing over the years and there is a persistent problem of un-employment especially among the educated youths. The number of job-seekers in the live register up to September, 2012 stood at 50225 and the number of vacancies notified figured at 2006 during 2010-2011 while the number of applicants registered for self-employment assistance during 2010-2011 was 154. Number of educated job-seekers registered in the live register of Aizawl, Champhai, Lunglei and Saiha as on 31.1.2013 are as follows:
DISTRICT EMPLOYMENT REGISTRATION AIZAWL 29619 LUNGLEI 5282 SAIHA 6592 CHAMPHAI 4055 TOTAL 45548
Number of Employment(All Enterprise)
Particulars EC 1980 EC 1990 EC 1998 EC 2005 EC 2013 Rural 18484 20980 22981 33314 35145 Urban 27351 51374 54476 73392 74414 Combined 45835 72354 77457 106706 109559
Sector-wise Employment Particulars EC 1980 EC 1990 EC 1998 EC 2005 EC 2013 Agricultural N.A. N.A. 2991 13481 N.A. Non-agricultural N.A. N.A. 74466 93225 N.A.
All enterprises 45835 72354 77457 106706 N.A.
Economic Survey Mizoram 2013-14 ~ 23 ~ Employment & Labour Welfare
Economic Survey Mizoram 2013-14
JOB-SEEKER ON THE LIVE REGISTER OF EMPLOYMENT EXCHANGE IN MIZORAM AS ON SEPT 2012
SL. NO.
CATEGORY REGN FOR MONTH LIVE REGISTER TOTAL Male Female Male Female
1 Unskilled 1 1 85 77 162 2 CL - VI to IX 50 13 5184 1692 6876 3 Matriculate / HSLC 372 216 5605 1823 7428 4 PUC / HSSLC 332 304 6346 5722 12068 5 B.A. (General) 12 10 963 845 1808 6 B.A. (Hon) 106 109 2961 2904 5865 7 B.Com 1 66 28 94 8 B.Ed 12 9 21 9 B.Sc.(General) 3 1 101 72 173 10 B.SC.(Hon) 10 20 210 454 664 11 B.Pharm 7 28 35 12 B.V.Sc 2 1 31 26 57 13 B.D.S 6 8 14 14 B.Lib.Sc. 1 1 15 BBA 4 4 43 29 72 16 BCA 13 6 275 152 427 17 B.D.(Theology) 1 1 18 B.E. 8 3 167 50 217 19 LIB (BL) 2 7 10 17 20 M.A. 19 20 762 930 1692 21 M.Com 2 1 66 67 133 22 M.Ed. 0 23 M.Sc. 7 9 191 158 349 24 M.Tech 0 25 MBA 4 12 10 22 26 M.Lib.Sc. 1 13 20 33 27 M.S.W. 1 1 27 66 93 28 M.Phil 13 29 42 29 MTA (Tourism & Admn.) 1 2 5 7 30 M.E. 1 1 31 M.V.Sc. 4 3 7 32 MBBS 24 31 55 33 PGJMC 34 Ph.D 0 35 Graduate (BHTM) 1 54 118 172 36 Bachelor of Physiotherapy 23 5 28 37 BPS (Fisheries) 1 4 4 38 BHMS 7 7 14 39 Hindi M.Ed 2 2 40 MLM 0 41 MCA 1 39 8 47 42 B.Arch. 1 1 43 LLM 33 17 50

Economic Survey Mizoram 2013-14 ~ 24 ~ Employment & Labour Welfare
Economic Survey Mizoram 2013-14
SL. NO. CATEGORY REGN FOR MONTH LIVE
R2EGISTER TOTAL Male Female Male Female
44 MCM 1 1 45 BSW 1 2 1 3 46 MF.Sc. (Fisheries) 2 2 47 Doctor of Medicine (MD) 1 3 1 4 48 Master of Surgery (MS) 1 4 4 49 B.Th 5 3 8 50 Typist 0 51 Driver 2 114 114 52 Conductor 0 53 Hindi a) Matric 1 1 103 254 357 54 Hindi b) PU 2 45 137 182 55 Hindi c) BA 2 10 77 318 395 56 Hindi d) MA 5 5 57 Technical Trade (EXIT) 45 42 2112 2940 5052 58 Physically Handicapped 1 2 98 35 133 59 Non - Mizo 7 6 377 159 536
Grand Total 1006 792 26290 19258 45548
……

Economic Survey Mizoram 2013-14 ~ 25 ~ Price & Public Distribution
Economic Survey Mizoram 2013-14
VI. PRICE AND PUBLIC DISTRIBUTION Retail Price
Retail price is the price which the ultimate consumer pays when buying from a retailer. Movement of retail prices of various commodities purchased by the people shows a more or less upward trend thereby causing a higher cost of living. The average retail price of some selected commodities of the past few years are as below.
Retail Price of selected commodities
(Price in Rupees)
SI.No Comodity Unit 2007-08 2008-09 2009-10 2010-11 2011 -12 2012-13 Dec.
1 2 3 5 6 7 8 9 1 Rice Kg 20.3 20.88 24.67 24 32 33
2 Atta Kg 17.25 17.38 18.12 24 23 25
3 Masur Dal Kg 56 73.75 76.28 69 67 73
4 Matar Chana Kg 30.63 31.88 31.09 33 39 49
5 Mustard Oil Lit 78.12 85 78.87 82 94 115
6 Pork Kg 122 145 150.42 162.1 188 200
7 Beef Kg 123.75 146.25 159.58 180 201 215
8 Fish (Romas) Kg 114.28 131.25 142.94 149 219 244
9 Milk (Fresh) Lit 27.62 30.63 32.73 37 45 60
10 Ginger Kg 12.12 21.88 21.25 30 29 35
11 Potato Kg 12.5 14.5 22.42 18 18 23
12 Sugar Kg 23.62 27.25 34.43 43 43 49
13 LPG Cylinder 305.63 325 320.44 361 425 435
Retail Price Index Price index calculated from a basket of 24 commodities with base year 1984-85 figures at 669 on ending December 2010 as against 545 over the year 2009-2010 which shows a percentage increase of 22.75. Since 2011 under the initiative of Central Statistical Organisation Consumer Price Index is calculated from a basket of 270 items and 2010 as base year =100
Retail Price Index (Base Year : 1984 – 1985)
SI. No.
Year Index % variation 1 2 3 4 1 2002 341 0.88 2 2003 362 6.16 3 2004 383 5.8 4 2005 376 -1.83 5 2006 411 9.31 6 2007 433 5.35

Economic Survey Mizoram 2013-14 ~ 26 ~ Price & Public Distribution
Economic Survey Mizoram 2013-14
7 2008 480 10.85 8 2009 545 13.54 9 2010 669 22.75 10 2011 922 14 11 2012 1024 11.11 12 2013 888 -13.28 Consumer Price Index(CPI) Base Year=2010
Wholesale Price The Wholesale price is generally taken as the rate at which a relatively large transaction of purchase is affected. The price index of wholesale price measures the rate of inflation. The following table represent the price behaviour and trend of wholesale price in respect of some selected items between the period of 1999-2000 to the current year of ending December 2010 also showing item wise index with 1999-2000 as the base year.
Average Wholesale Price and price index of Selected Food Commodities in Mizoram
(Base Year : 1999-2000)
SI. No
Name of Commodities Unit 1999-
2000 2008-
09 2009-
10 2010-
11 2010-
11 2011-12
2011-12
1 2 3 4 6 7 8 9 10 11 1 Rice Qtls. 1355 1800 2125 2125 3050 33513 3313 2 Atta Qtls. 965 1380 1340 1340 1490 1784 2282 3 Masur Dal
(Small) Qtls. 2800 6837 7090 7090 6517 5740 7025
4 Sugar Qtls. 1860 2456 3053 3053 3671 3606 4325 5 Salt 70 Kg. 240 350 395 395 543 493 556 6 Ginger Qtls. 500 1687 1771 1771 2376 1500 2438 7 Pork Qtls. 8000 14000 14333 14333 16200 18800 20000 8 Beef Qtls. 9000 13800 14833 14833 18000 20500 21500 9 Chicken (Broiler) Qtls. 8000 14500 14500 14500 16800 20450 18950
10 Fish Qtls. 7000 10000 11000 11000 15800 21900 24400 11 Potato Qtls. 700 1126 1979 1979 1326 1232 1362 12 Onion Qtls. 1000 2175 2393 2393 3526 2151 2962 13 Banana Qtls. 600 1100 1078 1078 804 1375 1586
Average index for all commodities 241 268
Inflation
Inflation is an indicator of macro economic stability. Inflation affects adversely individual household budget and hurts the poor with their incomes not indexed to prices. It also upsets the developmental works in the economy and puts pressure on interest rates and adversely affect savings and investment. The rate of inflation is measured by the statistical device “index Number of prices” considered as a barometer of economic activity.
In Mizoram, changes in price is measured from Consumer Price Index in which the price of 270 items are taken into account. The CPI in September 2012
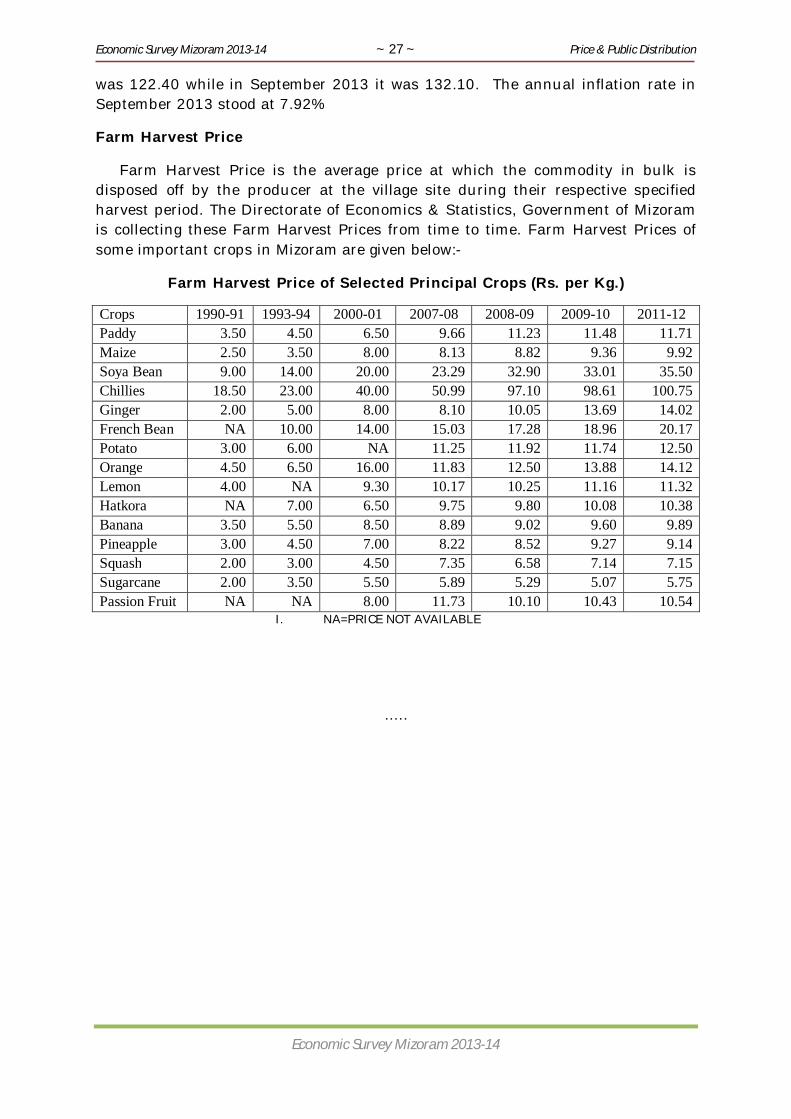
Economic Survey Mizoram 2013-14 ~ 27 ~ Price & Public Distribution
Economic Survey Mizoram 2013-14
was 122.40 while in September 2013 it was 132.10. The annual inflation rate in September 2013 stood at 7.92%
Farm Harvest Price
Farm Harvest Price is the average price at which the commodity in bulk is disposed off by the producer at the village site during their respective specified harvest period. The Directorate of Economics & Statistics, Government of Mizoram is collecting these Farm Harvest Prices from time to time. Farm Harvest Prices of some important crops in Mizoram are given below:-
Farm Harvest Price of Selected Principal Crops (Rs. per Kg.)
Crops 1990-91 1993-94 2000-01 2007-08 2008-09 2009-10 2011-12 Paddy 3.50 4.50 6.50 9.66 11.23 11.48 11.71 Maize 2.50 3.50 8.00 8.13 8.82 9.36 9.92 Soya Bean 9.00 14.00 20.00 23.29 32.90 33.01 35.50 Chillies 18.50 23.00 40.00 50.99 97.10 98.61 100.75 Ginger 2.00 5.00 8.00 8.10 10.05 13.69 14.02 French Bean NA 10.00 14.00 15.03 17.28 18.96 20.17 Potato 3.00 6.00 NA 11.25 11.92 11.74 12.50 Orange 4.50 6.50 16.00 11.83 12.50 13.88 14.12 Lemon 4.00 NA 9.30 10.17 10.25 11.16 11.32 Hatkora NA 7.00 6.50 9.75 9.80 10.08 10.38 Banana 3.50 5.50 8.50 8.89 9.02 9.60 9.89 Pineapple 3.00 4.50 7.00 8.22 8.52 9.27 9.14 Squash 2.00 3.00 4.50 7.35 6.58 7.14 7.15 Sugarcane 2.00 3.50 5.50 5.89 5.29 5.07 5.75 Passion Fruit NA NA 8.00 11.73 10.10 10.43 10.54
I. NA=PRICE NOT AVAILABLE
…..

Economic Survey Mizoram 2013-14 ~ 28 ~ Population
Economic Survey Mizoram 2013-14
VII. POPULATION
As per Population Census 2011, the population of Mizoram stood at 10,97,206 which accounts for only 0.09% of India’s total population of 1,21,01,93,422. The decadal growth rate during 2001-2011 was 23.48% which is the third highest among the 7 (seven) north eastern states while the country’s decadal growth rate was 17.6%.
As per Population census 2011, the density of population of Mizoram is 52 persons per sq.km. while it is 382 persons per sq.km. in India. At the district level, Aizawl district has the highest density in population at 112 persons per sq.km., Mamit district with 29 persons per sq.km. is the least populated among the districts. The results of Population Census 2011 shows an improvement in the sex ratio of the state ie. The sex ratio recorded is 976 as compared to 935 in 2001 census. The national figure for the same is 940 as per 2011 census provisional figure. Among the 8 (eight) districts, Aizawl recorded the highest sex ratio at 1009 while Mamit district recorded the lowest at 927 though showing a marked improvement compared to 2001 census figure of 896 females per 1000 males. As per the provisional census 2011 results, the literacy rate of the state is 91.33% which is the 3rd highest in the country. Among the 8 (eight) districts, Serchhip district recorded the highest literacy rate of 97.91% while Lawngtlai district recorded the lowest at 65.88%. The male and female literacy rates for the state are 93.35% and 89.24% respectively showing a slight increase in the male-female literacy gap ie. 4.08% in 2011 while it was 3.97% in 2001.
0
200000
400000
600000
800000
1000000
1200000
1901 1911 1921 1931 1941 1951 1961 1971 1981 1991 2001 2011
8243
4
9120
4
9840
6
1244
04
1527
36
1962
02
2660
63
3323
90 4937
57 6897
56 8885
73
1097
206GROWTH OF POPULATION IN MIZORAM

Economic Survey Mizoram 2013-14 ~ 29 ~ Population
Economic Survey Mizoram 2013-14
DISTRICT – WISE POPULATION
Sl. No.
District 2001
Census 2011Census
2012 (Projected
Population)
2013 (Projected
Population)
2014 (Projected
Population)
1 2 3 4 5 6 7
1 Mamit 62785 86364 89162 92051 95033
2 Kolasib 65960 83955 86005 88105 90256
3 Aizawl 325676 400309 408655 417174 425871
4 Champhai 108392 125745 127626 129536 131474
5 Serchhip 53861 64937 66163 67412 68684
6 Lunglei 137223 161428 164072 166759 169490
7 Lawngtlai 73620 117894 123578 129536 135781
8 Saiha 61053 56574 56144 55718 55295
TOTAL 888573 1097206 1121405 1146290 1171885
……
0.0010.0020.0030.0040.0050.0060.0070.0080.0090.00
100.00
1951 1961 1971 1981 1991 2001 2011
46.87 49.52
60.4964.46
89.01 90.72 93.35
16.94
36.02
46.7154.91
78.6086.75 89.27
YEAR
MALE & FEMALE LITERARY RATE FROM 1951-2011
Male
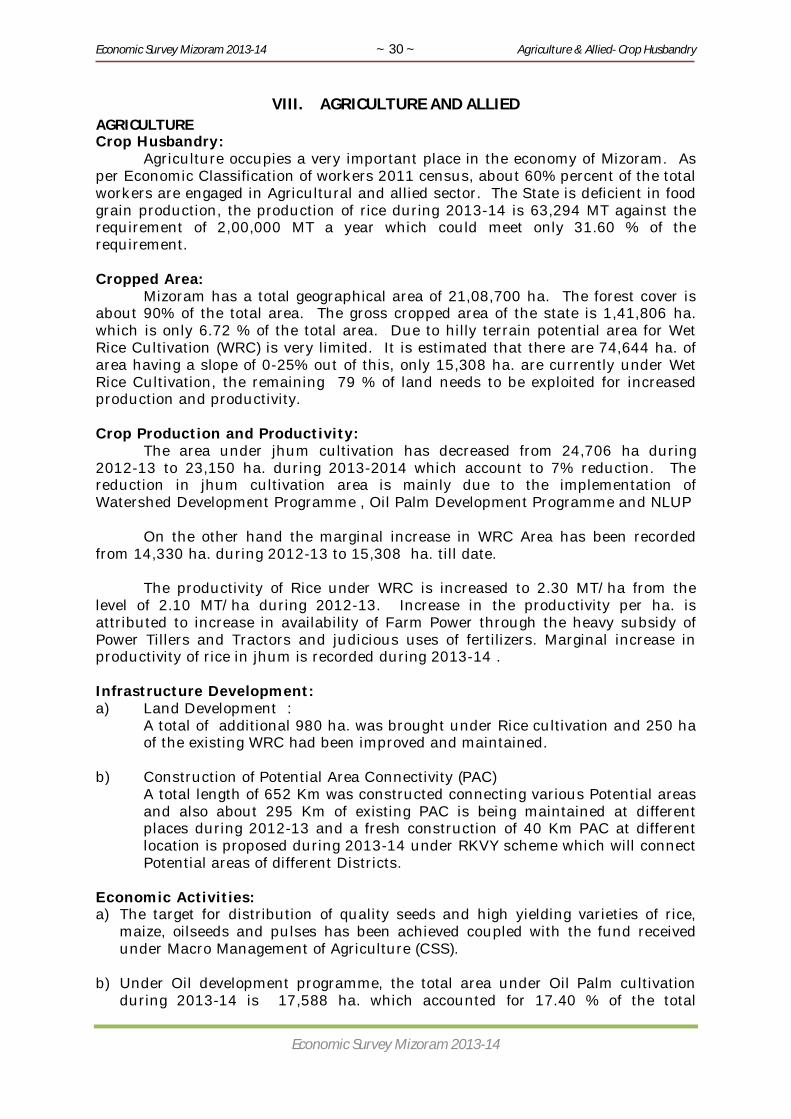
Economic Survey Mizoram 2013-14 ~ 30 ~ Agriculture & Allied- Crop Husbandry
Economic Survey Mizoram 2013-14
VIII. AGRICULTURE AND ALLIED AGRICULTURE Crop Husbandry: Agriculture occupies a very important place in the economy of Mizoram. As per Economic Classification of workers 2011 census, about 60% percent of the total workers are engaged in Agricultural and allied sector. The State is deficient in food grain production, the production of rice during 2013-14 is 63,294 MT against the requirement of 2,00,000 MT a year which could meet only 31.60 % of the requirement. Cropped Area: Mizoram has a total geographical area of 21,08,700 ha. The forest cover is about 90% of the total area. The gross cropped area of the state is 1,41,806 ha. which is only 6.72 % of the total area. Due to hilly terrain potential area for Wet Rice Cultivation (WRC) is very limited. It is estimated that there are 74,644 ha. of area having a slope of 0-25% out of this, only 15,308 ha. are currently under Wet Rice Cultivation, the remaining 79 % of land needs to be exploited for increased production and productivity. Crop Production and Productivity: The area under jhum cultivation has decreased from 24,706 ha during 2012-13 to 23,150 ha. during 2013-2014 which account to 7% reduction. The reduction in jhum cultivation area is mainly due to the implementation of Watershed Development Programme , Oil Palm Development Programme and NLUP On the other hand the marginal increase in WRC Area has been recorded from 14,330 ha. during 2012-13 to 15,308 ha. till date. The productivity of Rice under WRC is increased to 2.30 MT/ha from the level of 2.10 MT/ha during 2012-13. Increase in the productivity per ha. is attributed to increase in availability of Farm Power through the heavy subsidy of Power Tillers and Tractors and judicious uses of fertilizers. Marginal increase in productivity of rice in jhum is recorded during 2013-14 . Infrastructure Development: a) Land Development :
A total of additional 980 ha. was brought under Rice cultivation and 250 ha of the existing WRC had been improved and maintained.
b) Construction of Potential Area Connectivity (PAC) A total length of 652 Km was constructed connecting various Potential areas and also about 295 Km of existing PAC is being maintained at different places during 2012-13 and a fresh construction of 40 Km PAC at different location is proposed during 2013-14 under RKVY scheme which will connect Potential areas of different Districts.
Economic Activities: a) The target for distribution of quality seeds and high yielding varieties of rice,
maize, oilseeds and pulses has been achieved coupled with the fund received under Macro Management of Agriculture (CSS).
b) Under Oil development programme, the total area under Oil Palm cultivation
during 2013-14 is 17,588 ha. which accounted for 17.40 % of the total
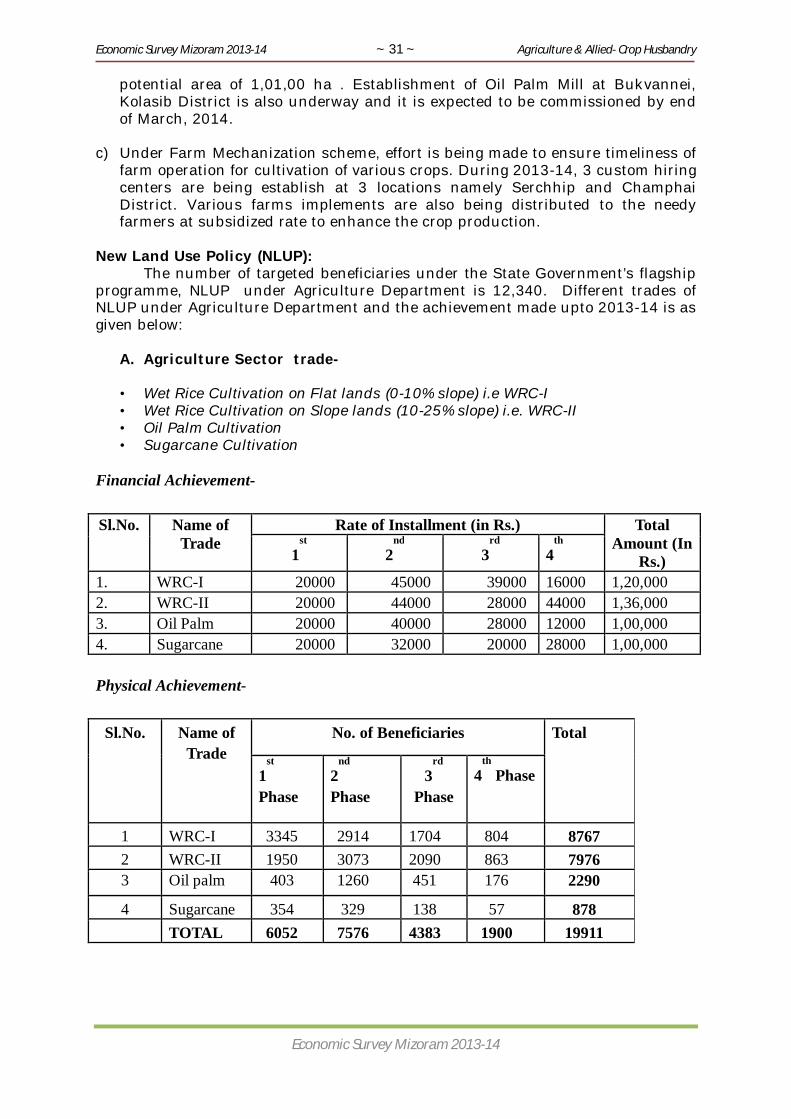
Economic Survey Mizoram 2013-14 ~ 31 ~ Agriculture & Allied- Crop Husbandry
Economic Survey Mizoram 2013-14
potential area of 1,01,00 ha . Establishment of Oil Palm Mill at Bukvannei, Kolasib District is also underway and it is expected to be commissioned by end of March, 2014.
c) Under Farm Mechanization scheme, effort is being made to ensure timeliness of
farm operation for cultivation of various crops. During 2013-14, 3 custom hiring centers are being establish at 3 locations namely Serchhip and Champhai District. Various farms implements are also being distributed to the needy farmers at subsidized rate to enhance the crop production.
New Land Use Policy (NLUP): The number of targeted beneficiaries under the State Government’s flagship programme, NLUP under Agriculture Department is 12,340. Different trades of NLUP under Agriculture Department and the achievement made upto 2013-14 is as given below:
A. Agriculture Sector trade-
• Wet Rice Cultivation on Flat lands (0-10% slope) i.e WRC-I • Wet Rice Cultivation on Slope lands (10-25% slope) i.e. WRC-II • Oil Palm Cultivation • Sugarcane Cultivation
Financial Achievement- Sl.No. Name of
Trade Rate of Installment (in Rs.) Total
Amount (In Rs.) 1
st 2
nd 3
rd 4
th
1. WRC-I 20000 45000 39000 16000 1,20,000 2. WRC-II 20000 44000 28000 44000 1,36,000 3. Oil Palm 20000 40000 28000 12000 1,00,000 4. Sugarcane 20000 32000 20000 28000 1,00,000 Physical Achievement-
Sl.No. Name of Trade
No. of Beneficiaries Total
1st
Phase 2
nd
Phase 3
rd
Phase 4
th Phase
1 WRC-I 3345 2914 1704 804 8767 2 WRC-II 1950 3073 2090 863 7976 3 Oil palm 403 1260 451 176 2290
4 Sugarcane 354 329 138 57 878 TOTAL 6052 7576 4383 1900 19911

Economic Survey Mizoram 2013-14 ~ 32 ~ Agriculture & Allied- Crop Husbandry
Economic Survey Mizoram 2013-14
OILPALM DEVELOPMENT PROGRAMME IN MIZORAM The rapid increase in land degradation due to jhumming,
deforestation, loss of biodiversity and productivity, increasing flood are leading to an ecological crisis affecting livelihood options for Jhumia families. This suggests inter-alia policy to encourage and support plantation of Oil Palm to overcome these constraints. Oil Palm stands as an ideal crop capable of achieving conservation of soil and moisture, repair of degraded land, provide ecological balance, food and security of rural and urban poor. The Government of Mizoram aims to implement and action Programme with an objective of placing Oil Palm as a key component in the plan to generate employment and mitigate environmental degradation and to strengthen the process of Oil Palm Development.
In the recent past, the cultivation of Oil Palm had been tried in
Assam, Tripura and Mizoram with considerable success. In Mizoram 5,000 nos. and 7’000 nos. of seedlings of Oil Palm were planted at Rotlang area of Lunglei district and Thingdawl area of Kolasib district during 1999-2000, respectively, with promising results. Thereafter, the Government of Mizoram has decided to undertake Oil Palm cultivation. The Total potential area identified in 7 (seven) Districts of Mizoram comes to1, 01, 000 hectares at low elevation with gentle slope (25-33 %) having favorable Agro-climatic condition.
1. Adaptability of Oil Palm Cultivation in Mizoram.
The Technical Experts from NRC-OP, who studied the suitability of agro-climatic condition and water availability required for Oil Palm Cultivation in Mizoram, has recommended that “Climate and soil condition in the southern Mizoram having low elevation and gentle slopes are quite suitable for Oil Palm cultivation”. The growth of the existing plants which are planted during 1999-2000 exhibited vigorous growth showing good FFB production at different locations. Government of Mizoram has therefore decided to undertake large scale cultivation of Oil Palm from 2004-2005 during Xth Plan Period.
2. Objectives of the Oil Palm Development Programme : i) To create income generation opportunities for small and marginal farmers. ii) To reverse the degradation process and achieve eco-balance to sustain land
and water use. iii) To motivate farmers to switch over from jhum cultivation to permanent
settlement.
3. Present scenario of Oil Palm Development:
i) For Oil Palm Development Programme, Ministry of Agriculture & Co-operation, Government of India, issued Administrative approval of Oil Palm Cultivation under ISOPOM (Integrated Scheme of Oilseeds, Pulses, Oil Palm and Maize) for the year 2004-2005 and the programme is implemented in Mizoram since 2004-2005 till 2011-12.

Economic Survey Mizoram 2013-14 ~ 33 ~ Agriculture & Allied- Crop Husbandry
Economic Survey Mizoram 2013-14
ii) The Oil Palm Development Programme is continued under RKVY (Oil Palm Area Expansion) from 2011-12 to 2012-13. Mission on Oilseeds and Oil Palm likely to be launched from 12th Plan.
iii) The Mizoram Oil Palm (Regulation of Production and Processing) Act, 2004 was
passed in Mizoram Legislative Assembly on 2nd December, 2004. The act contains 26 sections.
iv) A high level Working Group constituted by Government of India under the
Chairmanship of Dr.K.L.Chadha have identified 61,100 hectares potential area and under the Chairmanship of Dr. P.Rethinam have identified additional 40,000 hectares potential area totaling 1,01,000 Ha for Oil Palm cultivation in Mizoram.
v) The Government of Mizoram has signed M.O.U with reliable national
companies for Oil Palm Development. The implementing partner companies with areas allotted to them are:-
1. Godrej Oil Palm Limited -Kolasib & Mamit District. 2. Ruchi Soya Industries Ltd. -Lunglei & Lawngtlai District. 3. 3F Oil Palm Agrotech Pvt Ltd -Serchhip & Aizawl & Saiha District vi) Numbers of Farmers involved under Oil Palm as on 12.02.2014 is 10,800 nos. vii) Numbers of village covered under Oil Palm as on 12.02.2014 is 225 nos. viii) Production of Fresh fruit Bunches (FFBs) as on 12.02.2014 is 3,407.55 MT. ix) District wise area covered under Oil Palm up to February, 2014 is as given in the following Table. (Area In Ha.)
Year Name of Districts
Kolasib Mamit Lunglei Lawg- tlai
Ser- chhip Aizawl Sai
ha Total
2005 – 2006 82 - 28 - - - - 110 2006 – 2007 24 - - - - - - 24 2007 – 2008 543 267 15 - - - - 825 2008 – 2009 964 476 218 - 42 - - 1700 2009 – 2010 997 697 806 - 342 - - 2842 2010 – 2011 489 474 500 105 310 - - 1878 2011 – 2012 478 350 562 300 250 26 - 1966 2012-2013 1,039 928 750 617 327 50 - 3,711 2013-2014 711 852 1,300 381 957 331 - 4,532 TOTAL 5327 3731 4492 1652 1979 407 17,588
vi) The District Wise Oil Palm Potential Area in Mizoram:
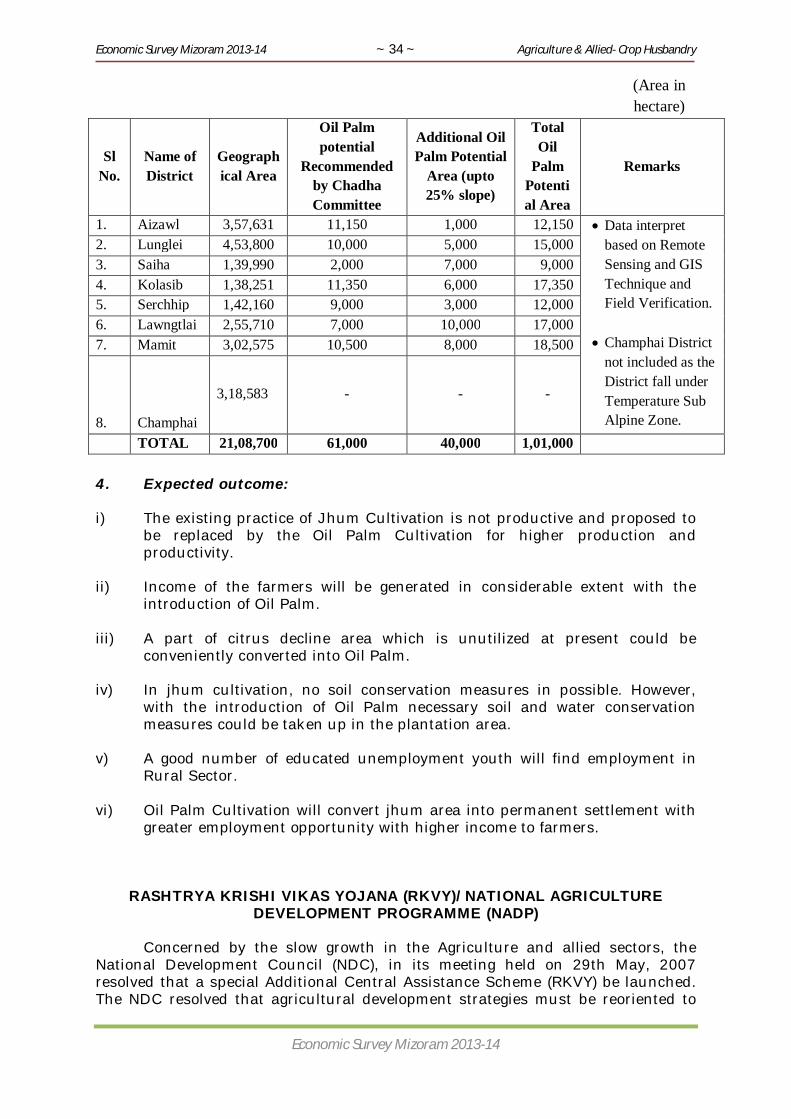
Economic Survey Mizoram 2013-14 ~ 34 ~ Agriculture & Allied- Crop Husbandry
Economic Survey Mizoram 2013-14
(Area in hectare)
Sl No.
Name of District
Geographical Area
Oil Palm potential
Recommended by Chadha Committee
Additional Oil Palm Potential
Area (upto 25% slope)
Total Oil
Palm Potential Area
Remarks
1. Aizawl 3,57,631 11,150 1,000 12,150 Data interpret based on Remote Sensing and GIS Technique and Field Verification.
Champhai District
not included as the District fall under Temperature Sub Alpine Zone.
2. Lunglei 4,53,800 10,000 5,000 15,000 3. Saiha 1,39,990 2,000 7,000 9,000 4. Kolasib 1,38,251 11,350 6,000 17,350 5. Serchhip 1,42,160 9,000 3,000 12,000 6. Lawngtlai 2,55,710 7,000 10,000 17,000 7. Mamit 3,02,575 10,500 8,000 18,500 8.
Champhai
3,18,583 - - -
TOTAL 21,08,700 61,000 40,000 1,01,000 4. Expected outcome:
i) The existing practice of Jhum Cultivation is not productive and proposed to
be replaced by the Oil Palm Cultivation for higher production and productivity.
ii) Income of the farmers will be generated in considerable extent with the
introduction of Oil Palm.
iii) A part of citrus decline area which is unutilized at present could be conveniently converted into Oil Palm.
iv) In jhum cultivation, no soil conservation measures in possible. However,
with the introduction of Oil Palm necessary soil and water conservation measures could be taken up in the plantation area.
v) A good number of educated unemployment youth will find employment in
Rural Sector.
vi) Oil Palm Cultivation will convert jhum area into permanent settlement with greater employment opportunity with higher income to farmers.
RASHTRYA KRISHI VIKAS YOJANA (RKVY)/NATIONAL AGRICULTURE DEVELOPMENT PROGRAMME (NADP)
Concerned by the slow growth in the Agriculture and allied sectors, the
National Development Council (NDC), in its meeting held on 29th May, 2007 resolved that a special Additional Central Assistance Scheme (RKVY) be launched. The NDC resolved that agricultural development strategies must be reoriented to

Economic Survey Mizoram 2013-14 ~ 35 ~ Agriculture & Allied- Crop Husbandry
Economic Survey Mizoram 2013-14
meet the needs of farmers and called upon the Central and State governments to evolve a strategy to rejuvenate agriculture. The NDC reaffirmed its commitment to achieve 4 per cent annual growth in the agricultural sector during the 11th plan. The Resolution with respect to the Additional Central Assistance scheme reads as below:
Introduce a new Additional Central Assistance scheme to incentivise States to
draw up plans for their agriculture sector more comprehensively, taking agro-climatic conditions, natural resource issues and technology into account, and integrating livestock, poultry and fisheries more fully. This will involve a new scheme for Additional Central Assistance to State Plans, administered by the Union Ministry of Agriculture over and above its existing Centrally Sponsored schemes, to supplement the State-specific strategies including special schemes for beneficiaries of land reforms. The newly created National Rainfed Area Authority will on request assist States in planning for rainfed areas.
During 2010-2011, Mizoram could become eligible to avail the RKVY fund ,
the first SLSC meeting was convened on 11.3.2011 and during 2012-13 an amount of sanctioned Rs 3,240.00 lakhs under stream-I and an amount of Rs 1,362.00 lakhs as sub scheme was released by the Govt of India. The physical and financial achievements under RKVY 2012-2013 is given below:
Physical & Financial Achievement of RKVY during 2012-2013 Stream-I &
Sub Scheme.
(Rs in lakhs) SL. No
Programme/Scheme/projects Implementing Department
Target Achievement Phy Fin Phy Fin
A Normal (stream – I) Rice Area Expansion
1 WRC in Plain @Rs.0.80 lakh
Agriculture 875 700.00 875 700.00
2 WRC in Plain @Rs.0.80 lakh in SHDC
Agriculture 125 100.00 125 100.00
3
iii)Terrace in Hill Slope @ Rs.1.38 lakh Agriculture
705 974.00 705 974.00
4 i) Enhancement of Crop Production & Productivity by Improved Package of Practices @ Rs.7500/-
Agriculture 3020 226.50 3020 226.50
5 ii) Assistance for improved cultivation on hill slope @ Rs 2000/- per ha Agriculture
4300 86.00 4300 86.00
6 Farmers’ Field School@ Rs.14,000/- Agriculture
250 35.00 250 35.00
7 Agriculture Mechanization 8 Power Tiller @ Rs.45,000/- Agriculture 100 45.00 100 45.00
9 Small Power Tiller @ Rs.25,000/- Agriculture
200 50.00 200 50.00
10 Power Operated Implements @ Rs.15,000/- Agriculture
300 45.00 300 45.00
11 Diesel/electrical driven water pump set upto 7.5 BHP/ 5KW Agriculture
365 36.50 365 36.50

Economic Survey Mizoram 2013-14 ~ 36 ~ Agriculture & Allied- Crop Husbandry
Economic Survey Mizoram 2013-14
12 Development of Irrigation facilities: Rain Water Harvesting Tank/Ponds (15X15X1.5mtr) with a capacity of 3.3 lakhs ltr.
Agriculture 120 120.00 120 120.00
13 Pipes for carrying water from source to the field Agriculture
500 75.00 500 75.00
14 Development of Rainfed Farming System in Watershed areas: Assistance for land development
Agriculture 5634 Ha 676.00 5634 Ha 676.00
15 Administrative cost (1 % of the total project cost) Agriculture
71.00
71.00
Total of Stream - I 3240 3240 Sub Scheme
1 RADP Agriculture 3 Nos 100.00 3 Nos 100.00 2 OPAE Agriculture 5350 Ha 2523.00 3711 Ha 1262.00
Sub Total Agriculture 2623.00 1362.00
Project approved by SLSC during 2013-2014 under RKVY Stream-I
SL. No Programmes
2013-14
Unit Physical Financial
A Normal (stream – I)
1 Rice Area Expansion
(i) WRC in Plain @Rs.0.80 lakh Ha 400 320.00
(ii) WRC in Plain @Rs.0.80 lakh in SHDC Ha 80 64.00
(iii)Terrace in Hill Slope @ Rs.1.38 lakh Ha 250 345.00
2. Expansion of Area under Improved package of cultivation.
(i) Enhancement of Crop Production & Productivity by Improved Package of Practices @ Rs.7500/- Ha 3500 262.50
(ii) Enhancement of Crop Production & Productivity by SRI @ Rs. 7500/- Ha 1000 75.00
(iii) Assistance for improved cultivation on hill slope @ Rs 2000/- per ha Ha 5000 100.00
3.
Promotion of Integrated Pest Management.
(i) Assistance for Plant Protection chemicals and bioagents @ Rs. 500/- per Ha Nos. 2000 10.00
(ii) Plant protection equipment’s like manually operated Knap Sack sprayer @
Rs. 800/- per No. Nos. 800 6.40
4. Strengthening of Infrastructure to promote Extension Services
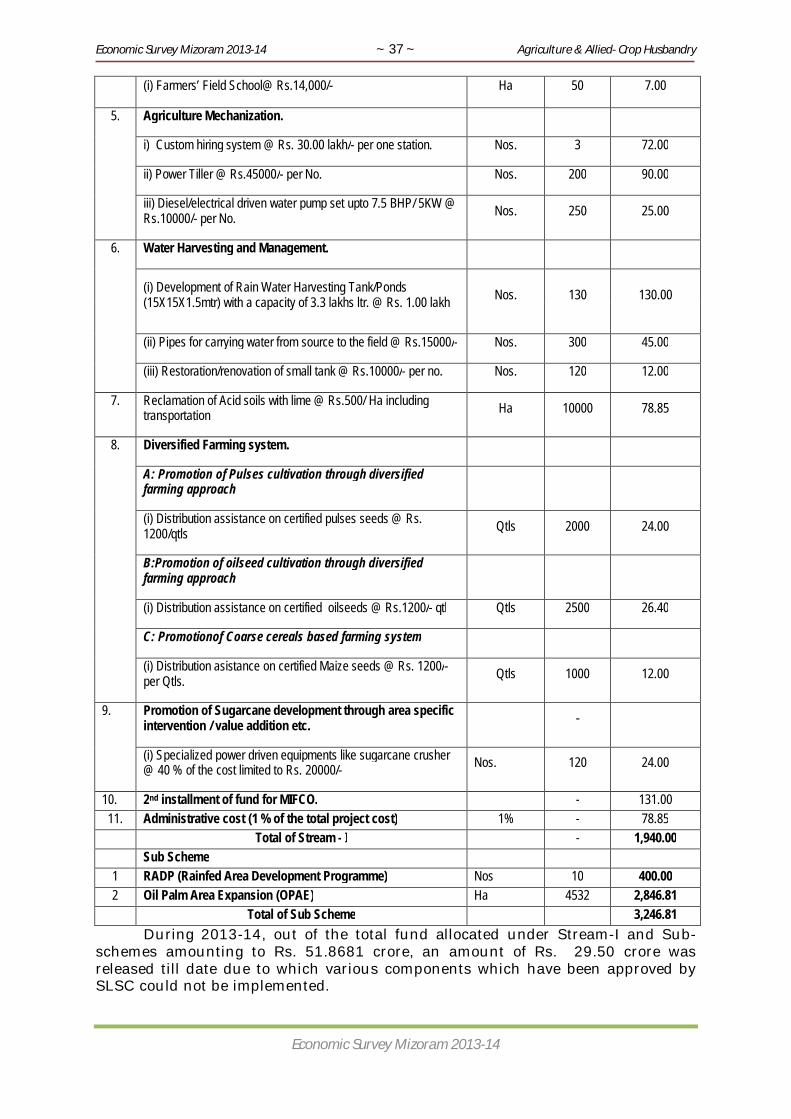
Economic Survey Mizoram 2013-14 ~ 37 ~ Agriculture & Allied- Crop Husbandry
Economic Survey Mizoram 2013-14
(i) Farmers’ Field School@ Rs.14,000/- Ha 50 7.00
5.
Agriculture Mechanization.
i) Custom hiring system @ Rs. 30.00 lakh/- per one station. Nos. 3 72.00
ii) Power Tiller @ Rs.45000/- per No. Nos. 200 90.00
iii) Diesel/electrical driven water pump set upto 7.5 BHP/ 5KW @ Rs.10000/- per No. Nos. 250 25.00
6. Water Harvesting and Management.
(i) Development of Rain Water Harvesting Tank/Ponds (15X15X1.5mtr) with a capacity of 3.3 lakhs ltr. @ Rs. 1.00 lakh Nos. 130 130.00
(ii) Pipes for carrying water from source to the field @ Rs.15000/- Nos. 300 45.00
(iii) Restoration/renovation of small tank @ Rs.10000/- per no. Nos. 120 12.00
7. Reclamation of Acid soils with lime @ Rs.500/ Ha including transportation Ha 10000 78.85
8. Diversified Farming system.
A: Promotion of Pulses cultivation through diversified farming approach
(i) Distribution assistance on certified pulses seeds @ Rs. 1200/qtls Qtls 2000 24.00
B:Promotion of oilseed cultivation through diversified farming approach
(i) Distribution assistance on certified oilseeds @ Rs.1200/- qtl Qtls 2500 26.40
C: Promotionof Coarse cereals based farming system
(i) Distribution asistance on certified Maize seeds @ Rs. 1200/- per Qtls. Qtls 1000 12.00
9. Promotion of Sugarcane development through area specific intervention / value addition etc. -
(i) Specialized power driven equipments like sugarcane crusher @ 40 % of the cost limited to Rs. 20000/- Nos. 120 24.00
10. 2nd installment of fund for MIFCO. - 131.00 11. Administrative cost (1 % of the total project cost) 1% - 78.85 Total of Stream - I - 1,940.00 Sub Scheme
1 RADP (Rainfed Area Development Programme) Nos 10 400.00 2 Oil Palm Area Expansion (OPAE) Ha 4532 2,846.81 Total of Sub Scheme 3,246.81
During 2013-14, out of the total fund allocated under Stream-I and Sub-schemes amounting to Rs. 51.8681 crore, an amount of Rs. 29.50 crore was released till date due to which various components which have been approved by SLSC could not be implemented.

Economic Survey Mizoram 2013-14 ~ 38 ~ Agriculture & Allied- Crop Husbandry
Economic Survey Mizoram 2013-14
NATIONAL FOOD SECURITY MISSION-RICE (NFSM-RICE) IN MIZORAM STATE
The National Development Council (NDC) in its 53rd meeting held on 29th May, 2007 adopted a resolution to launch a Food Security Mission comprising rice, wheat and pulses to increase the production of rice by 10 million tonnes and pulses by 2 million tonnes by the end of Eleventh Plan (2011-12) and continue in the 12th Plan Period.
Accordingly, NFSM-Rice was launched in Mizoram during the year 2012-13
and 2013-14 with an approved outlay of Rs.604.25 lakh and Rs.750.00 lakh respectively for the following items-
Physical & Financial Achievement of NFSM-Rice during 2012-2013 Fin. (Rs.in lakhs)
Sl. No.
Intervention
Approved Rate of
Assistance
Unit
Approved Targets
Achievement
% Achievement
Phy. Fin. Phy. Fin. Phy. Fin.
1 2 3 4 5 6 7 8 9 10 1 Cluster demonstrations by State
Department of Agriculture with the Technical backstopping of
ICAR/SAUs/IRRI(one cluster of 100 ha)
(a) Direct seeded rice/Line Transplanting/SRI(Target 1.5% of area of District.
Rs.7500/- per Ha
Ha
1500
112.5
1500
112.5
100
100
(b) Cluster Demonstration on Hybrid rice(one cluster of 100 ha) Target 0.5% of Area of District.
Rs.7500/- per Ha
Ha 500
37.5
500
37.50
100
100
(c) Cluster Demonstration on Swarna Sub-1/sahbhagi Dhan of 100 ha each.
Rs.7500/- per Ha
Ha
(d) Frontline demonstrations by ICAR/SAUS on Hybrid/varieties (cluster of minimum 10 ha each)
Rs.7500/- per Ha
Ha
2 Seed Distribution: (a) Hybrid Rice seed
Rs.2000/- per Qtl
Qtl 500 10.0 500 10.00 100 100
(b) HYVs Seeds Rs.500/- per Qtl
Qtl 8000 40.0 8000 40.00 100 100
3 Plant and soil protection management:
(a) Micronutrients
Rs.500/- per Ha
Ha 4500 22.5 4500 22.50 100 100
(b) Liming in Acidic soils Rs.500/- per Ha
Ha 10000 50.0 10000
50.00 100 100
(c) Plant protection Chemicals & Bio agents.
Rs.500/- per Ha
Ha 20000 100.0 20000
100.00 100 100
Sub Total 3(a) to 3(c)
34500
172.5
34500 172.50
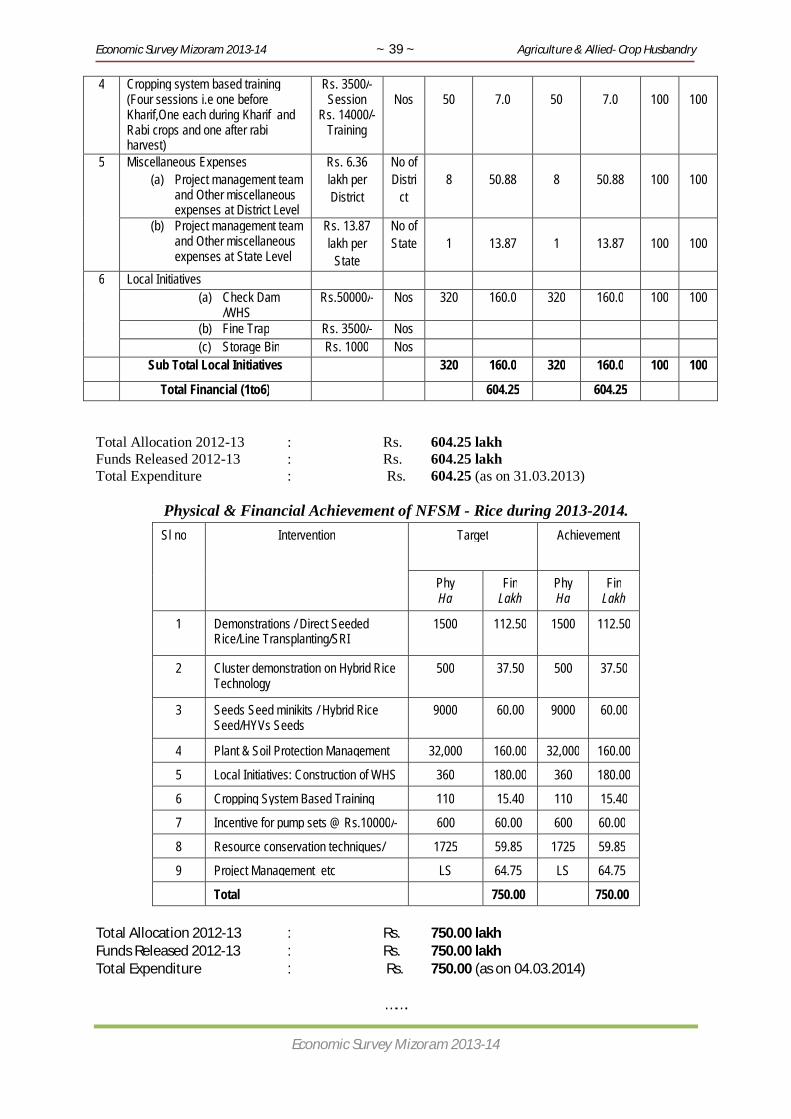
Economic Survey Mizoram 2013-14 ~ 39 ~ Agriculture & Allied- Crop Husbandry
Economic Survey Mizoram 2013-14
4 Cropping system based training (Four sessions i.e one before Kharif,One each during Kharif and Rabi crops and one after rabi harvest)
Rs. 3500/- Session
Rs. 14000/- Training
Nos
50
7.0
50
7.0
100
100
5 Miscellaneous Expenses (a) Project management team
and Other miscellaneous expenses at District Level
Rs. 6.36 lakh per District
No of Distri
ct
8
50.88
8
50.88
100
100
(b) Project management team and Other miscellaneous expenses at State Level
Rs. 13.87 lakh per
State
No of State
1
13.87
1 13.87
100 100
6 Local Initiatives (a) Check Dam
/WHS Rs.50000/- Nos 320 160.0 320 160.0 100 100
(b) Fine Trap Rs. 3500/- Nos (c) Storage Bin Rs. 1000 Nos
Sub Total Local Initiatives 320 160.0 320 160.0 100 100
Total Financial (1to6) 604.25 604.25
Total Allocation 2012-13 : Rs. 604.25 lakh Funds Released 2012-13 : Rs. 604.25 lakh Total Expenditure : Rs. 604.25 (as on 31.03.2013)
Physical & Financial Achievement of NFSM - Rice during 2013-2014. Sl no Intervention Target Achievement
Phy Ha
Fin Lakh
Phy Ha
Fin Lakh
1 Demonstrations / Direct Seeded Rice/Line Transplanting/SRI
1500 112.50 1500 112.50
2 Cluster demonstration on Hybrid Rice Technology
500 37.50 500 37.50
3 Seeds Seed minikits / Hybrid Rice Seed/HYVs Seeds
9000 60.00 9000 60.00
4 Plant & Soil Protection Management 32,000 160.00 32,000 160.00
5 Local Initiatives: Construction of WHS 360 180.00 360 180.00
6 Cropping System Based Training 110 15.40 110 15.40
7 Incentive for pump sets @ Rs.10000/- 600 60.00 600 60.00
8 Resource conservation techniques/ 1725 59.85 1725 59.85
9 Project Management etc LS 64.75 LS 64.75
Total 750.00 750.00 Total Allocation 2012-13 : Rs. 750.00 lakh Funds Released 2012-13 : Rs. 750.00 lakh Total Expenditure : Rs. 750.00 (as on 04.03.2014)
…….
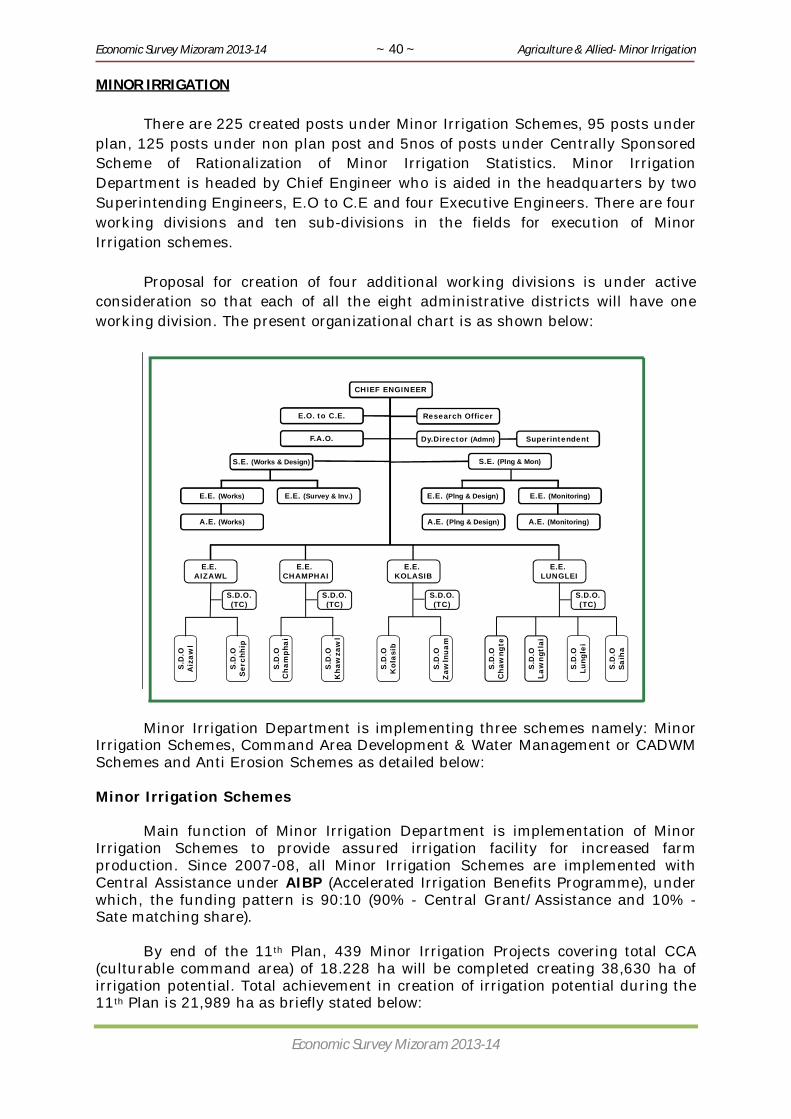
Economic Survey Mizoram 2013-14 ~ 40 ~ Agriculture & Allied- Minor Irrigation
Economic Survey Mizoram 2013-14
MINOR IRRIGATION
There are 225 created posts under Minor Irrigation Schemes, 95 posts under plan, 125 posts under non plan post and 5nos of posts under Centrally Sponsored Scheme of Rationalization of Minor Irrigation Statistics. Minor Irrigation Department is headed by Chief Engineer who is aided in the headquarters by two Superintending Engineers, E.O to C.E and four Executive Engineers. There are four working divisions and ten sub-divisions in the fields for execution of Minor Irrigation schemes. Proposal for creation of four additional working divisions is under active consideration so that each of all the eight administrative districts will have one working division. The present organizational chart is as shown below:
E.O. to C.E. Research Officer
F.A.O. Dy.Director (Admn) Superintendent
S.E. (Works & Design) S.E. (Plng & Mon)
E.E. (Monitoring)E.E. (Plng & Design)
A.E. (Monitoring)
E.E. KOLASIB
S.D.O.(TC)
CHIEF ENGINEER
S.D
.OA
izaw
l
S.D
.OS
erch
hip
S.D
.OC
ham
phai
S.D
.OK
haw
zaw
l
S.D
.OK
olas
ib
S.D
.OZ
awln
uam
S.D
.OC
haw
ngte
S.D
.OLa
wng
tlai
S.D
.OLu
ngle
i
S.D
.OSa
iha
E.E. LUNGLEI
E.E. CHAMPHAI
E.E. AIZAWL
S.D.O.(TC)
S.D.O.(TC)
S.D.O.(TC)
E.E. (Survey & Inv.)E.E. (Works)
A.E. (Works) A.E. (Plng & Design)
Minor Irrigation Department is implementing three schemes namely: Minor Irrigation Schemes, Command Area Development & Water Management or CADWM Schemes and Anti Erosion Schemes as detailed below: Minor Irrigation Schemes
Main function of Minor Irrigation Department is implementation of Minor Irrigation Schemes to provide assured irrigation facility for increased farm production. Since 2007-08, all Minor Irrigation Schemes are implemented with Central Assistance under AIBP (Accelerated Irrigation Benefits Programme), under which, the funding pattern is 90:10 (90% - Central Grant/Assistance and 10% - Sate matching share).
By end of the 11th Plan, 439 Minor Irrigation Projects covering total CCA
(culturable command area) of 18.228 ha will be completed creating 38,630 ha of irrigation potential. Total achievement in creation of irrigation potential during the 11th Plan is 21,989 ha as briefly stated below:
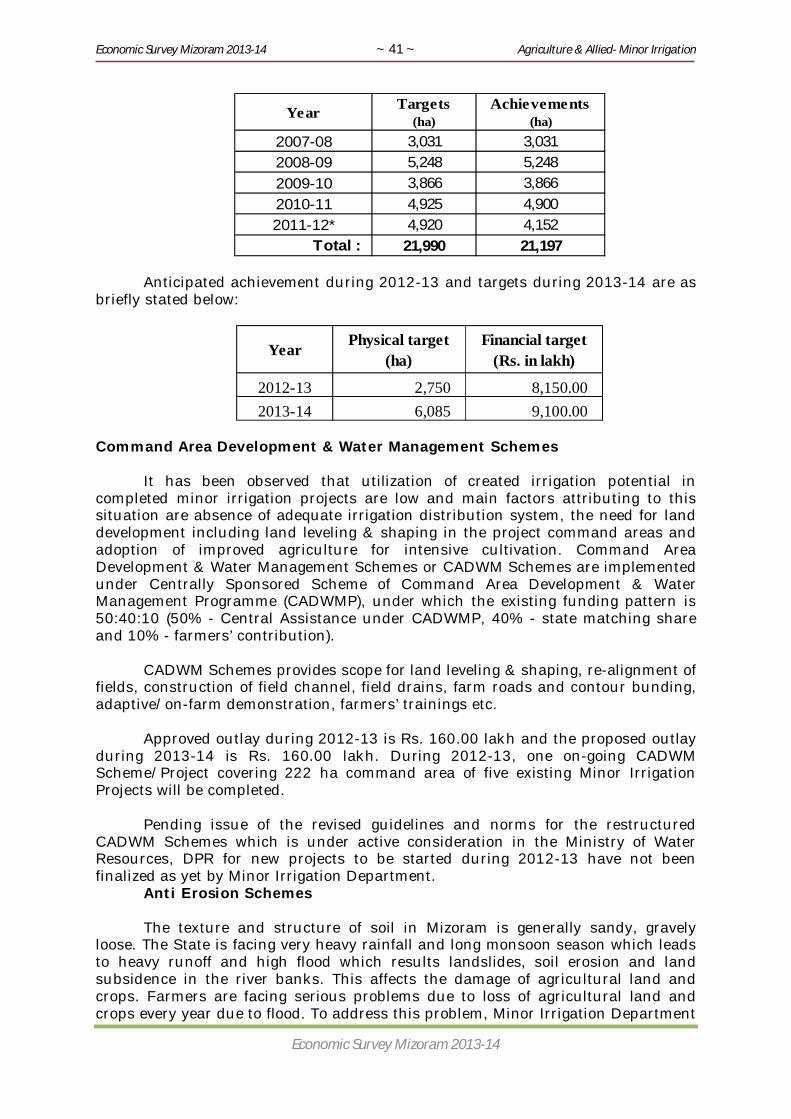
Economic Survey Mizoram 2013-14 ~ 41 ~ Agriculture & Allied- Minor Irrigation
Economic Survey Mizoram 2013-14
Year Targets(ha)
Achievements(ha)
2007-08 3,031 3,0312008-09 5,248 5,248
2009-10 3,866 3,866
2010-11 4,925 4,9002011-12* 4,920 4,152
Total : 21,990 21,197
Anticipated achievement during 2012-13 and targets during 2013-14 are as briefly stated below:
Year Physical target (ha)
Financial target(Rs. in lakh)
2012-13 2,750 8,150.002013-14 6,085 9,100.00
Command Area Development & Water Management Schemes
It has been observed that utilization of created irrigation potential in completed minor irrigation projects are low and main factors attributing to this situation are absence of adequate irrigation distribution system, the need for land development including land leveling & shaping in the project command areas and adoption of improved agriculture for intensive cultivation. Command Area Development & Water Management Schemes or CADWM Schemes are implemented under Centrally Sponsored Scheme of Command Area Development & Water Management Programme (CADWMP), under which the existing funding pattern is 50:40:10 (50% - Central Assistance under CADWMP, 40% - state matching share and 10% - farmers’ contribution).
CADWM Schemes provides scope for land leveling & shaping, re-alignment of
fields, construction of field channel, field drains, farm roads and contour bunding, adaptive/on-farm demonstration, farmers’ trainings etc.
Approved outlay during 2012-13 is Rs. 160.00 lakh and the proposed outlay
during 2013-14 is Rs. 160.00 lakh. During 2012-13, one on-going CADWM Scheme/Project covering 222 ha command area of five existing Minor Irrigation Projects will be completed.
Pending issue of the revised guidelines and norms for the restructured
CADWM Schemes which is under active consideration in the Ministry of Water Resources, DPR for new projects to be started during 2012-13 have not been finalized as yet by Minor Irrigation Department.
Anti Erosion Schemes The texture and structure of soil in Mizoram is generally sandy, gravely
loose. The State is facing very heavy rainfall and long monsoon season which leads to heavy runoff and high flood which results landslides, soil erosion and land subsidence in the river banks. This affects the damage of agricultural land and crops. Farmers are facing serious problems due to loss of agricultural land and crops every year due to flood. To address this problem, Minor Irrigation Department
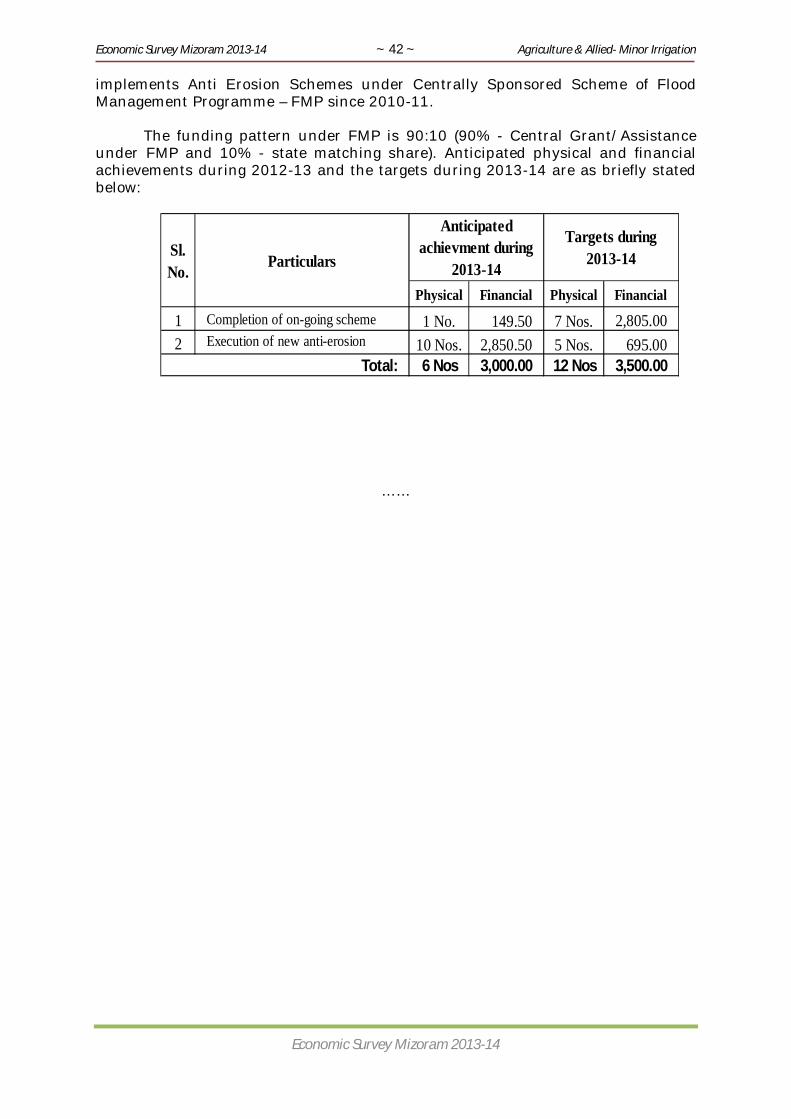
Economic Survey Mizoram 2013-14 ~ 42 ~ Agriculture & Allied- Minor Irrigation
Economic Survey Mizoram 2013-14
implements Anti Erosion Schemes under Centrally Sponsored Scheme of Flood Management Programme – FMP since 2010-11.
The funding pattern under FMP is 90:10 (90% - Central Grant/Assistance
under FMP and 10% - state matching share). Anticipated physical and financial achievements during 2012-13 and the targets during 2013-14 are as briefly stated below:
Physical Financial Physical Financial
1 Completion of on-going scheme 1 No. 149.50 7 Nos. 2,805.002 Execution of new anti-erosion
scheme10 Nos. 2,850.50 5 Nos. 695.006 Nos 3,000.00 12 Nos 3,500.00Total:
Targets during 2013-14Sl.
No. Particulars
Anticipated achievment during
2013-14
……

Economic Survey Mizoram 2013-14 ~ 43 ~ Agriculture & Allied- Horticulture
Economic Survey Mizoram 2013-14
HORTICULTURE More than 70% of the population of Mizoram depends on land based activities for their livelihood and horticulture plays as a vital role and occupies a very important place in the economy of Mizoram and contributes substantially to the State Gross Domestic Products. Out of the total horticulture potential area of 11.56 lakhs ha. only 1.21 lakhs is covered under horticulture plantation which shows that 10.35 lakhs ha i.e (89.54%) of horticulture potential area is still lying untapped indicating vast scope for settlement of jhumia families into permanent settlement as well as development of horticulture in the state. Because of its hilly terrain horticulture is the only sustainable land base activities for development of the state and its farmers. The main objectives of the schemes are – a) Uplift the economy of the farming community through cultivation of
sustainable horticultural crops.
b) Increase area, production and productivity of horticultural crops in the state with latest technologies and adopt cluster area approach and cultivation at commercial scale for market surplus production.
c) Settlement of jhumia families to permanent cultivation with intensive farming practices.
d) To ensure availability of quality inputs like improved planting materials, fertilizers and manures, plant protection materials by improving and strengthening delivery system.
e) Promotion of protected cultivation along with supporting infrastructure for quality production of high value crops all round the year.
f) Promotion of INM through vermin-composting, popularization of bio-fertilizers in addition to judicious and balanced nutrients to crops.
g) Promotion of micro-irrigation for efficient management and delivery of required quantities of water as per crop needs.
h) Promotion of mechanization conducive to hill farming by providing equipment and implements to reduce labour.
i) Create water harvesting structure potential for irrigation and to augment ground water.
j) Human resource development through capacity building of departmental staff and skill development of farmers through transfer of technology.
k) To promote and strengthen the Public Private Partnership for ensuring delivery of need base inputs and technologies.
Table -I: Area and production of major horticultural crops 2012-2013.
Crops 2012 - 2013 Area (Ha) Production (Ton)
Banana 10540 127530
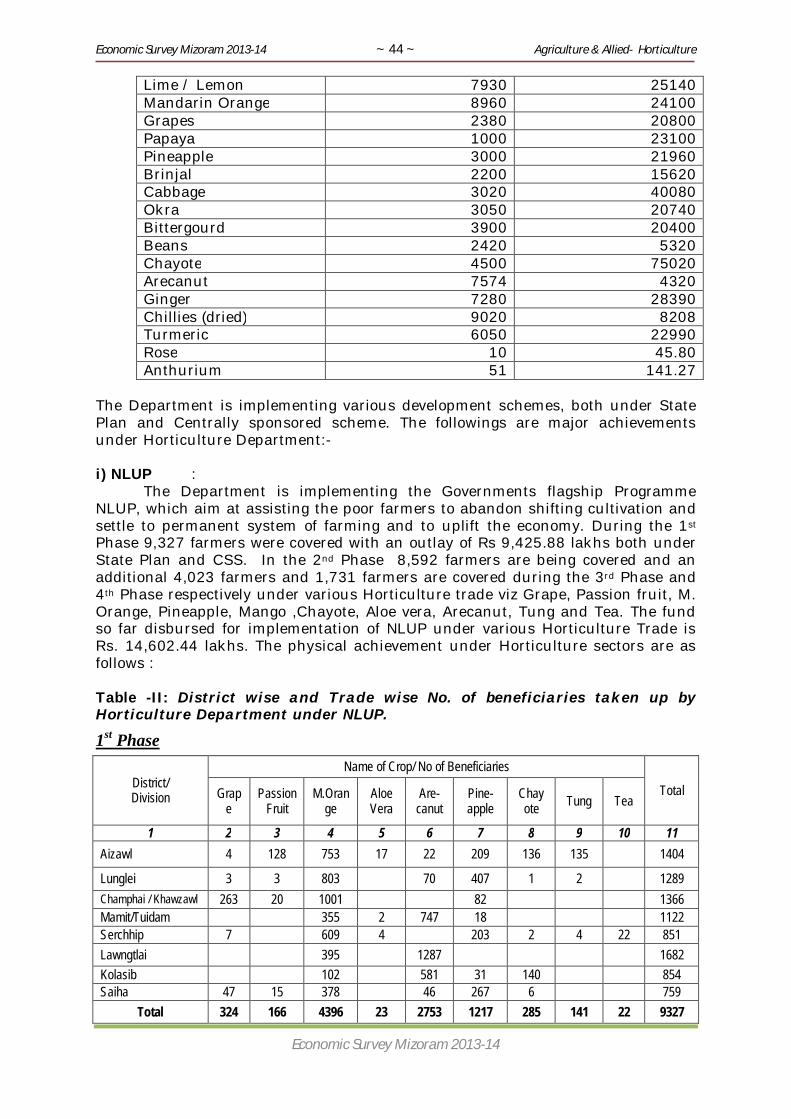
Economic Survey Mizoram 2013-14 ~ 44 ~ Agriculture & Allied- Horticulture
Economic Survey Mizoram 2013-14
Lime / Lemon 7930 25140 Mandarin Orange 8960 24100 Grapes 2380 20800 Papaya 1000 23100 Pineapple 3000 21960 Brinjal 2200 15620 Cabbage 3020 40080 Okra 3050 20740 Bittergourd 3900 20400 Beans 2420 5320 Chayote 4500 75020 Arecanut 7574 4320 Ginger 7280 28390 Chillies (dried) 9020 8208 Turmeric 6050 22990 Rose 10 45.80 Anthurium 51 141.27
The Department is implementing various development schemes, both under State Plan and Centrally sponsored scheme. The followings are major achievements under Horticulture Department:- i) NLUP : The Department is implementing the Governments flagship Programme NLUP, which aim at assisting the poor farmers to abandon shifting cultivation and settle to permanent system of farming and to uplift the economy. During the 1st Phase 9,327 farmers were covered with an outlay of Rs 9,425.88 lakhs both under State Plan and CSS. In the 2nd Phase 8,592 farmers are being covered and an additional 4,023 farmers and 1,731 farmers are covered during the 3rd Phase and 4th Phase respectively under various Horticulture trade viz Grape, Passion fruit, M. Orange, Pineapple, Mango ,Chayote, Aloe vera, Arecanut, Tung and Tea. The fund so far disbursed for implementation of NLUP under various Horticulture Trade is Rs. 14,602.44 lakhs. The physical achievement under Horticulture sectors are as follows : Table -II: District wise and Trade wise No. of beneficiaries taken up by Horticulture Department under NLUP.
1st Phase
District/ Division
Name of Crop/ No of Beneficiaries
Total Grape
Passion Fruit
M.Orange
Aloe Vera
Are- canut
Pine- apple
Chay ote Tung Tea
1 2 3 4 5 6 7 8 9 10 11 Aizawl 4 128 753 17 22 209 136 135 1404
Lunglei 3 3 803 70 407 1 2 1289 Champhai / Khawzawl 263 20 1001 82 1366 Mamit/Tuidam 355 2 747 18 1122 Serchhip 7 609 4 203 2 4 22 851 Lawngtlai 395 1287 1682 Kolasib 102 581 31 140 854 Saiha 47 15 378 46 267 6 759
Total 324 166 4396 23 2753 1217 285 141 22 9327

Economic Survey Mizoram 2013-14 ~ 45 ~ Agriculture & Allied- Horticulture
Economic Survey Mizoram 2013-14
2nd Phase
3rd Phase
4th Phase
District/Division
Name of Crop Total Aloe
Vera Areca
nut Chayo
te Grap
e M.Orange Passion fruit
Pineapple Tea Tung Man
go
1 2 3 4 5 6 7 8 9 10 11 12 Aizawl 1 13 12 125 17 29 24 221 Lunglei 36 2 264 68 49 419 Khawzawl 18 172 23 28 1 242 Mamit 240 71 11 322 Serchhip 2 224 42 20 288 Lawngtlai 32 7 5 44 Kolasib 120 3 16 1 140 Saiha 46 7 2 55
Total:- 3 441 15 20 925 40 191 70 24 2 1731
District/ Division
Name of Crop/ No of Beneficiaries
Total Aloe Vera
Are-canut
Chay-ote Grape M.
Orange Passion
fruit Pineap
ple Tea Tung
1 2 3 4 5 6 7 8 9 10 11 Aizawl 91 82 3 861 44 121 173 1375
Lunglei 354 1 3 933 397 134 1 1823 Khawzawl 207 736 68 159 15 1185 Mamit 911 1 367 65 1344 Serchhip 6 1 10 665 21 196 56 32 987 Lawngtlai
520 199 719
Kolasib 621 44 97 27 789 Saiha 18 2 8 284 58 370
Total:- 6 2515 131 231 4142 133 1023 205 206 8592
District/Division
Name of Crop / No. of beneficiaries
Total Aloe Vera
Are-canut
Chay- ote Grape M.Ora
nge Passion
fruit Pine- apple Tea Tung Mango
1 2 3 4 5 6 7 8 9 10 11 12 Aizawl 35 18 1 332 43 102 1 103 635 Lunglei 166 482 263 25 936 Khawzawl 1 38 419 33 55 4 550 Mamit 553 174 23 750 Serchhip 7 1 389 3 89 51 6 546 Lawngtlai 58 24 8 90 Kolasib 260 9 46 2 317 Saiha 2 3 121 41 32 199
Total:- 7 1072 31 42 1987 79 583 81 109 32 4023

Economic Survey Mizoram 2013-14 ~ 46 ~ Agriculture & Allied- Horticulture
Economic Survey Mizoram 2013-14
ii) RKVY : Under RKVY during 2013 – 2014 attention is made for self-sufficiency and
sustenance of the farmers so as to meet the emerging challenges of the state. Provision is made for cultivation of fruit crops 432 Ha., Vegetable Crops 349 Ha., Aromatic and Medicinal Plants 30 Ha., Green House 100 Nos., storage Godown 6 Nos., Portable pack house with cold room 6 Nos. and individual rain water storage tank 60 Nos.
iii) Fruits : The introduction of quality planting materials especially in case of M.Orange and rejuvenation of old M.orange orchard is very successful and production level has gone up as high as 24100 MT during 2012 - 2013 with bumper harvest during the last season upto the level that Govt. of Mizoram had to intervene for its marketing to tackle the growers problem. With area expansion scheme, production of banana, pineapple, grapes, lemon etc. has gone up generating more income to the farmers.
iv) Vegetables : In case of vegetable, there has been immense production in case of Chayote (
chow-chow) during 2012 – 2013. The estimated value of chayote sold within and outside the state comes to the tune of Rs. 463.75 lakhs only. A single farmer earned about Rs. 20,000 – 30,000 on an average during rabi season due to the impart of latest technology alongwith introduction of off-season varieties which results in round-the-year production of vegetables like cabbage, pumpkins, cowpea etc,. Similarly sustainable income have been generated by farmers through cultivation of vegetables like capsicum, tomato, corriander etc under under protected cultivation like shade house/green house.
v) Flowers : Under Floriculture, 246,26,000 Nos of Anthurium stems have been produced
and sold outside the state the value which is to the tune of Rs. 1231,30,000/- and 108,80,000 Nos of Rose cut stems which is to the value of Rs. 326,40,000/- only during the 11th Plan period.
vi) Spices : Introduction of Ginger and Turmeric cultivation in bench terraces is very successful. It does not only generate income to the farmers but also reduce and controls soil loss. Area expansion scheme on ginger, turmeric and chillies have been taken up for commercial scale and domestic consumption, surplus production are achieved which are either exported or sold outside the state.
vii) Nurseries and Scion Bank : Availability of quality planting material is a mandatory for successful cultivation and results to production and productivity. Establishment of public sector nurseries and private sector nurseries resulted in production of more than 3 lakh quality planting material for distribution to the selected growers. Citrus Scion Bank for production of true to type, disease free healthy scion buds under Hi – tech Green house was established in the year 2010 – 2011. Under this unit 846 numbers of healthy, carefully selected plants are planted and maintained for the purpose of producing not less than 1 lakhs number of desirable scion buds per year. This citrus Scion Bank was established using the technology adopted by Israel having environment control facilities, on line drip irrigation fertigation system. This citrus scion bank has also encouraged many academician, scientists, officials from various universities, and states to visit this centre and to adopt and replicate this technique in their states and Universities. A large number of healthy, disease free scion buds has been distributed to several private registered nurseries and other Horticulture Centre for production of healthy citrus planting materials.

Economic Survey Mizoram 2013-14 ~ 47 ~ Agriculture & Allied- Horticulture
Economic Survey Mizoram 2013-14
Horticulture Department, Govt. of Mizoram received “Excellence Award” from the Govt. of India for best performance in best infrastructure establishment for production of disease free planting materials. viii) On farm water management : For irrigation of crops during the dry spell, 400 Nos of water harvesting structure for individual farmers were constructed during 2013 – 14 depending on the potential of crops under HMNEH to boost the production and as life saving irrigation during the dry spell . Besides, Green House structure are provided to farmers covering 20,000 sqm area to boost up the production of off-season vegetables like Tomato, Capsicum etc.
ix) Centre of excellence : Thiak village is situated about 35 km from the Aizawl city within Aizawl District. This centre of Excellence is established to cater to the needs of the farmers of Aizawl District. In this Centre of Excellence various infrastructure are created like Greenhouse, Rain water harvesting structure and water storage tasks for irrigation, structure for hydrophonic cultivation, training hall etc. Besides producing quality planting materials, the centre also cover 90 families of the village in various horticulture trades imparting training, dissemination of technical knowhow as well as for higher economic returns. Trials on soil less cultivation ( hydrophonic) is being carried out with guidance of experts from Israel, if successful the method and techniques will be disseminated to the farmers for adoption. This type of centre of Excellence is planned to be established in all the 8 districts of the state and progress is going on at Serchhip District for establishing such centre with a target to cover 60 families as well as in Thingdawl, Kolasib District. x) NMMI : Under National Mission on Micro Irrigation, drip / sprinkler irrigation system were installed at farmers gardens and orchards for continuous and judicious supply of irrigation to increase the production and productivity. In areas, where drip / sprinkler irrigation installation is not feasible, LLDPE and HDPE pipe of 16mm , 25 mm and 32 mm were made available to the farmers at 75% subsidy. xi) NMMP : Under National Mission on Medicinal Plants , Aloevera 40.50 ha was covered during 2013 – 14. Besides, Aloevera cultivation has been very successful and farmers are earning good income by making aloevera soap which has high market demand.
…..
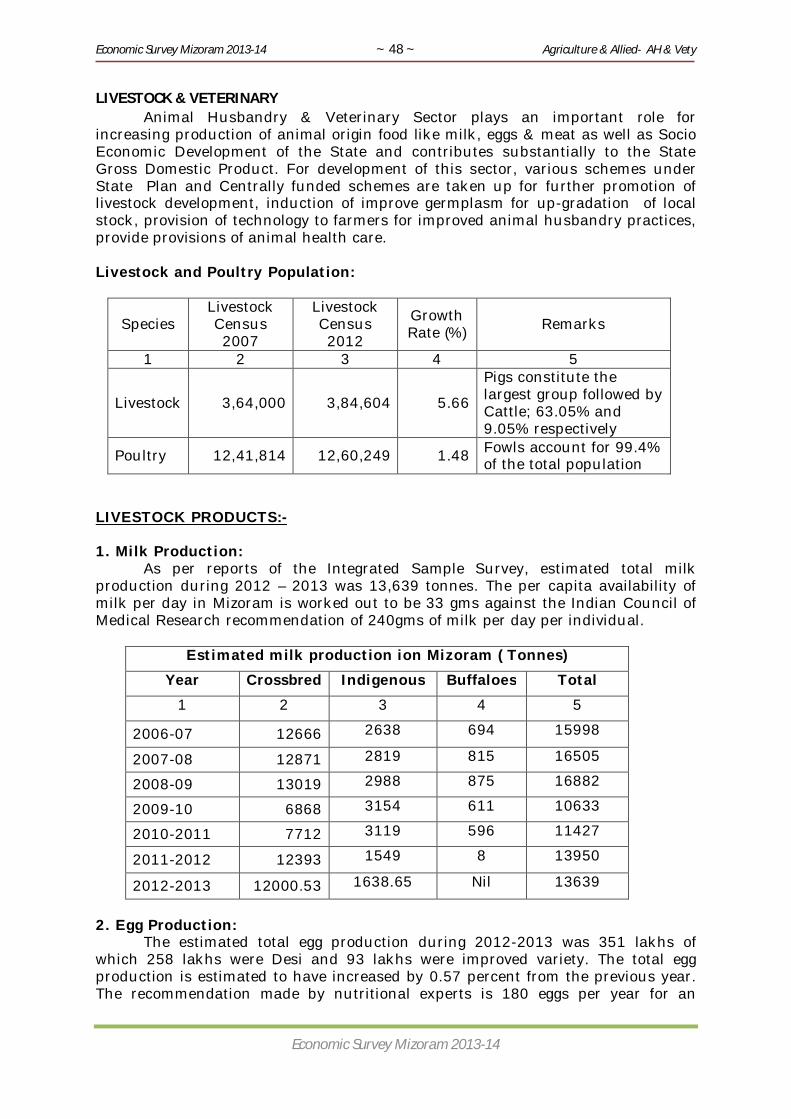
Economic Survey Mizoram 2013-14 ~ 48 ~ Agriculture & Allied- AH & Vety
Economic Survey Mizoram 2013-14
LIVESTOCK & VETERINARY Animal Husbandry & Veterinary Sector plays an important role for
increasing production of animal origin food like milk, eggs & meat as well as Socio Economic Development of the State and contributes substantially to the State Gross Domestic Product. For development of this sector, various schemes under State Plan and Centrally funded schemes are taken up for further promotion of livestock development, induction of improve germplasm for up-gradation of local stock, provision of technology to farmers for improved animal husbandry practices, provide provisions of animal health care. Livestock and Poultry Population:
Species Livestock Census 2007
Livestock Census 2012
Growth Rate (%) Remarks
1 2 3 4 5
Livestock 3,64,000 3,84,604 5.66
Pigs constitute the largest group followed by Cattle; 63.05% and 9.05% respectively
Poultry 12,41,814 12,60,249 1.48 Fowls account for 99.4% of the total population
LIVESTOCK PRODUCTS:- 1. Milk Production: As per reports of the Integrated Sample Survey, estimated total milk production during 2012 – 2013 was 13,639 tonnes. The per capita availability of milk per day in Mizoram is worked out to be 33 gms against the Indian Council of Medical Research recommendation of 240gms of milk per day per individual.
Estimated milk production ion Mizoram ( Tonnes) Year Crossbred Indigenous Buffaloes Total
1 2 3 4 5
2006-07 12666 2638 694 15998
2007-08 12871 2819 815 16505
2008-09 13019 2988 875 16882
2009-10 6868 3154 611 10633
2010-2011 7712 3119 596 11427
2011-2012 12393 1549 8 13950
2012-2013 12000.53 1638.65 Nil 13639
2. Egg Production: The estimated total egg production during 2012-2013 was 351 lakhs of which 258 lakhs were Desi and 93 lakhs were improved variety. The total egg production is estimated to have increased by 0.57 percent from the previous year. The recommendation made by nutritional experts is 180 eggs per year for an
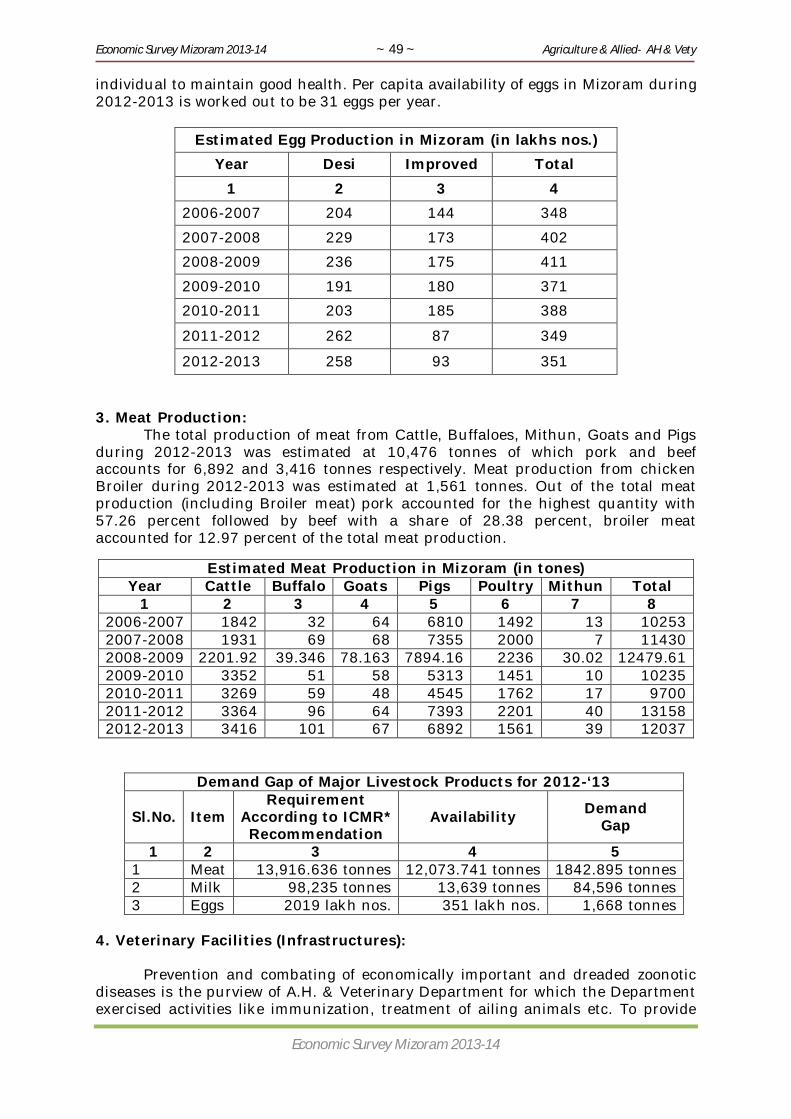
Economic Survey Mizoram 2013-14 ~ 49 ~ Agriculture & Allied- AH & Vety
Economic Survey Mizoram 2013-14
individual to maintain good health. Per capita availability of eggs in Mizoram during 2012-2013 is worked out to be 31 eggs per year.
Estimated Egg Production in Mizoram (in lakhs nos.) Year Desi Improved Total
1 2 3 4 2006-2007 204 144 348
2007-2008 229 173 402
2008-2009 236 175 411
2009-2010 191 180 371
2010-2011 203 185 388
2011-2012 262 87 349
2012-2013 258 93 351 3. Meat Production: The total production of meat from Cattle, Buffaloes, Mithun, Goats and Pigs during 2012-2013 was estimated at 10,476 tonnes of which pork and beef accounts for 6,892 and 3,416 tonnes respectively. Meat production from chicken Broiler during 2012-2013 was estimated at 1,561 tonnes. Out of the total meat production (including Broiler meat) pork accounted for the highest quantity with 57.26 percent followed by beef with a share of 28.38 percent, broiler meat accounted for 12.97 percent of the total meat production.
Demand Gap of Major Livestock Products for 2012-‘13
Sl.No. Item Requirement
According to ICMR* Recommendation
Availability Demand Gap
1 2 3 4 5 1 Meat 13,916.636 tonnes 12,073.741 tonnes 1842.895 tonnes 2 Milk 98,235 tonnes 13,639 tonnes 84,596 tonnes 3 Eggs 2019 lakh nos. 351 lakh nos. 1,668 tonnes
4. Veterinary Facilities (Infrastructures): Prevention and combating of economically important and dreaded zoonotic diseases is the purview of A.H. & Veterinary Department for which the Department exercised activities like immunization, treatment of ailing animals etc. To provide
Estimated Meat Production in Mizoram (in tones) Year Cattle Buffalo Goats Pigs Poultry Mithun Total
1 2 3 4 5 6 7 8 2006-2007 1842 32 64 6810 1492 13 10253 2007-2008 1931 69 68 7355 2000 7 11430 2008-2009 2201.92 39.346 78.163 7894.16 2236 30.02 12479.61 2009-2010 3352 51 58 5313 1451 10 10235 2010-2011 3269 59 48 4545 1762 17 9700 2011-2012 3364 96 64 7393 2201 40 13158 2012-2013 3416 101 67 6892 1561 39 12037
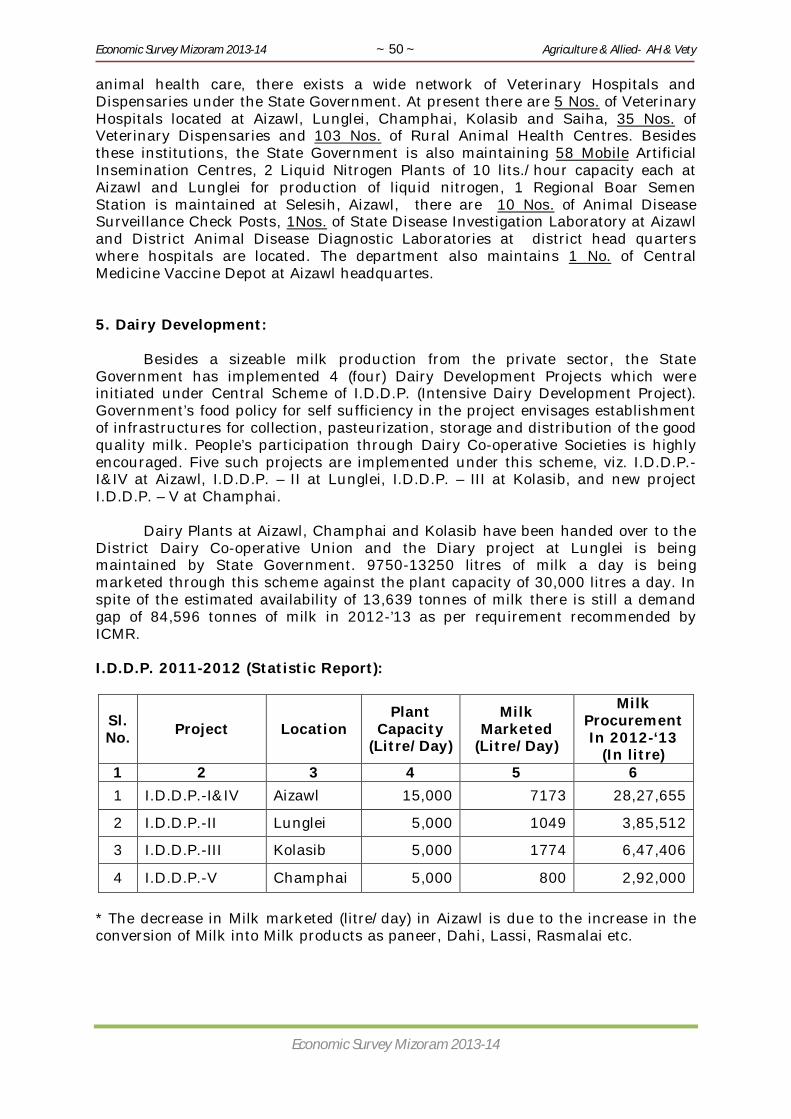
Economic Survey Mizoram 2013-14 ~ 50 ~ Agriculture & Allied- AH & Vety
Economic Survey Mizoram 2013-14
animal health care, there exists a wide network of Veterinary Hospitals and Dispensaries under the State Government. At present there are 5 Nos. of Veterinary Hospitals located at Aizawl, Lunglei, Champhai, Kolasib and Saiha, 35 Nos. of Veterinary Dispensaries and 103 Nos. of Rural Animal Health Centres. Besides these institutions, the State Government is also maintaining 58 Mobile Artificial Insemination Centres, 2 Liquid Nitrogen Plants of 10 lits./hour capacity each at Aizawl and Lunglei for production of liquid nitrogen, 1 Regional Boar Semen Station is maintained at Selesih, Aizawl, there are 10 Nos. of Animal Disease Surveillance Check Posts, 1Nos. of State Disease Investigation Laboratory at Aizawl and District Animal Disease Diagnostic Laboratories at district head quarters where hospitals are located. The department also maintains 1 No. of Central Medicine Vaccine Depot at Aizawl headquartes. 5. Dairy Development: Besides a sizeable milk production from the private sector, the State Government has implemented 4 (four) Dairy Development Projects which were initiated under Central Scheme of I.D.D.P. (Intensive Dairy Development Project). Government’s food policy for self sufficiency in the project envisages establishment of infrastructures for collection, pasteurization, storage and distribution of the good quality milk. People’s participation through Dairy Co-operative Societies is highly encouraged. Five such projects are implemented under this scheme, viz. I.D.D.P.-I&IV at Aizawl, I.D.D.P. – II at Lunglei, I.D.D.P. – III at Kolasib, and new project I.D.D.P. – V at Champhai. Dairy Plants at Aizawl, Champhai and Kolasib have been handed over to the District Dairy Co-operative Union and the Diary project at Lunglei is being maintained by State Government. 9750-13250 litres of milk a day is being marketed through this scheme against the plant capacity of 30,000 litres a day. In spite of the estimated availability of 13,639 tonnes of milk there is still a demand gap of 84,596 tonnes of milk in 2012-’13 as per requirement recommended by ICMR. I.D.D.P. 2011-2012 (Statistic Report):
Sl. No. Project Location
Plant Capacity
(Litre/Day)
Milk Marketed
(Litre/Day)
Milk Procurement In 2012-‘13
(In litre) 1 2 3 4 5 6 1 I.D.D.P.-I&IV Aizawl 15,000 7173 28,27,655
2 I.D.D.P.-II Lunglei 5,000 1049 3,85,512
3 I.D.D.P.-III Kolasib 5,000 1774 6,47,406
4 I.D.D.P.-V Champhai 5,000 800 2,92,000 * The decrease in Milk marketed (litre/day) in Aizawl is due to the increase in the conversion of Milk into Milk products as paneer, Dahi, Lassi, Rasmalai etc.

Economic Survey Mizoram 2013-14 ~ 51 ~ Agriculture & Allied- AH & Vety
Economic Survey Mizoram 2013-14
5. New Land Use Policy (NLUP): Animal Husbandry & Veterinary Department is one of the implementing Departments of New Land Use Policy. The main objective of NLUP in respect of A.H.& Veterinary Department is to create sustainable livelihood through introduction of improved technology and improved breeds of livestock and poultry. The physical and financial target and achievement may be summarized as below : Sl.No.
Year of Operation
Physical
Financial (Rs.in lakhs)
Target
Achievement
Target
Achievement
1.
2010-2011
5200
9929
10,157.00
2,832.40
2.
2011-2012
-
-
-
7325.40
3.
2012-2013
4500
12970
18455.50
6299.99
4.
2013-2014
5000
12886
5000.00
12981.00
There are 5 (five) different trades under A.H.& Vety. sector such as :
Sl.No.
Trades
Nos. of beneficiaries
2010-2011
2012-2013
2013-14
1 Dairy Farming 946 477 380
2 Piggery Farming 5346 7123 7006
3 Mithun Farming 1856 1073 1141
4 Brioler Farming 1348 4297
4268
5 Layer Farming 430 91
……

Economic Survey Mizoram 2013-14 ~ 52 ~ Agriculture & Allied- Fisheries
Economic Survey Mizoram 2013-14
FISHERIES Mizoram has considerable stretches of plain area with all favourable and
conducive conditions for development of fisheries. The state has about 24,000 hectare of potential land which could be developed for fish farming. Due to various constraints in the past so far only 4500 hectare of ponds and tanks could be developed for fish till end of 2012-2013. The state has further 6000 hectare of water area in the form of rivers and streams spread over 1100km of riverine stretches. In the recent past the Power and Electricity Department has created two hydroelectricity impoundments offering almost 4000 hectare and the government has entrusted the state Fisheries Department to incorporate capture based culture fisheries though MOU executed between Power and Electricity Department and Fisheries Department.
The present ministry of Mizoram has taken up a flagship programme namely NLUP to assist 1,20,000 jhumia families to settle permanently in various trade to do away with shifting cultivation of which 3000 families covering 1500 hectare has been entrusted to the fishery sector. The main policy of the government for fishery sector in the state is targeted towards gradual bridging of the gap between requirement of table size fish and its supply from the state own resources and finally to reach self-sufficiency to offer 11kg per capita by the end of 12th Five Year Plan period, besides offering self employment to 16,000 families. The per capita consumption at the end of 2011-12 is estimated to be 4.93 kg from the states own culture and capture resources. At present there is a shortfall of 6.07kg per capita, this shortfall has to be fulfilled by the end of 12th Five Year Plan. The requirement of table size fish is estimated to be about 14300 M.T by the end of 12th Five Year Plan period at a per capita scale of 11kg. To achieve this target 3000 hectare of new ponds and tanks has to be developed in the state for which there is immense scope as only about 18.75 % of the total potential fishery resource of 24000 hectare has so far been developed till 2012-2013. Fish production The actual production at the end of 2012-2013 is estimated to be 5600 M.T from both culture and capture sector in contrast to anticipated value of 6200 MT since compilation of harvest report in the reservoirs will be completed only by March 2014. Quantity of Inland fish production and fish seed distribution
Sl. No Year Fish production
(inland) (in M.T) Fish seed distribution (in lakh
nos) 1. 2. 3.
2011-2012 2012-2013 2013-2014
5400 5600 (Actual) 6200 (Anticipated)
320 (fingerling) 240 (fingerlings) 300(anticipated)

Economic Survey Mizoram 2013-14 ~ 53 ~ Agriculture & Allied- Fisheries
Economic Survey Mizoram 2013-14
Fish seed availability scenario The total fish seed requirement of the state is estimated to be 400 lakhs fingerling on the basis of available water bodies under culture in pond culture sector at the end of 2012-2013. Out of this entire requirement it has been possible to produce and distribute 240 lakhs of fingerlings both from private and government resources of the state and 160 lakhs is estimated to have come from the neighbouring states of Assam and Tripura. Therefore the shortfall is estimated to be around 160 lakhs nos. of fish seed resulting in under stocking of cultivable water bodies in the interior places. Meanwhile, few new hatcheries and upgradation of existing hatcheries have been envisaged under NLUP, RKVY, National Fisheries Development Board programme which are likely to improve the fish seed scenario of the state in the near future. An account of fish farms and hatcheries are shown below:-
Year No.of fish farms (FF) fish
farming families (FFF) Nos of hatcheries Remarks Govt. Privates
1 2 3 4 5
2011-2012
2012-2013
2012-2013
4 (FF)
4 (FF)
4(FF)
10700(FFF)
11000(FFF)
13000(FFF) anticipated
7 of which 2 new anticipated under NFDB and 2 non-functional to be made functional under NFDB 7 of which 1 new anticipated under NFDB and 1 non-functional to be made functional under NFDB Govt- 4 Nos. Private – 7 Nos.
7 fish seed farm including 3 hatcheries handed over to ZOFISFED for a period of 10 years, Department is left with 4 fish seed farm with 4 hatcheries from 2008-2009 onwards
The highlights of achievements in respect of Fisheries Department during
the year 2013-2014 is as stated below:- I. STATE PLAN SECTOR:
Production of 35 lakhs of fingerling from government fish seed farm and
distributed among the farmers.
Distributed 300 lakhs nos. of Indian Major Carp and Exotic carp fingerling to the farmers.
Targeted to augment production level of the state at 6200 M.T by the end of 2013-2014.
Targeted to augment per capita consumption level of 5.28kg by the end of 2013-2014 from states own production against available per capita of 4.41 kg at the end of 2011-2012.
Economic Survey Mizoram 2013-14 ~ 54 ~ Agriculture & Allied- Fisheries
Economic Survey Mizoram 2013-14
Auctioned fish crop of Serlui ‘B’ to achieve additional production level of 300-400 M.T by the end of 2013-2014. UNDER GOVERNMENT OF MIZORAM FLAGSHIP PROGRAMME NLUP, THE FOLLOWING ARE ACHIEVED DURING 2013-201
Under NLUP Programme, the Department implements, two components viz: Development component Infrastructure Development component
Under Development component, the Department implements Semi-Intensive
Aquaculture covering 3654 no. of beneficiaries under 1st, 2nd, 3rd, and 4th phase NLUP programme.
Under 1st phase NLUP programme, disbursement of fund @ Rs.1.00 lakh each (in cash and in kind) to 1447 beneficiaries has been completed.
For 2nd phase NLUP Programme 1131 No. of beneficiaries have been selected for construction of new pond for implementation of Semi-Intensive Aquaculture.
Disbursement of 1st installment @ Rs.50,000/- and 2nd Installment @ Rs.20,000/- each and 3rd installment @Rs. 30000/- to the beneficiaries has been completed for 2nd phase NLUP programme.
Under 3rd to 4th phase NLUP programme Rs.10,000/- each has been released to the beneficiaries covering 1076 families.
Under infrastructure Development components, the Department of Fisheries constructed 1 no. open well at Tamdil fish seed farm. The Department has also received funds for repairing of Nursery ponds at Tamdil and Ngengpui fish seed farm using WetComb materials.
II. CENTRALLY SPONSORED SCHEMES(CSS), FFDA, NSWF, DEVELOP-MENT OF RESERVOIR / RIVERINE FISHERIES AND NFDB
A. CSS-FFDA, NSWF AND NFDB: The Government of India has already released Rs.494.25 lakhs for various activities under CSS programmes like Fish Farmer Development Agency(FFDA), National Scheme for Welfare of Fishermen(NSWF) and National Fisheries Development Board(NFDB). However, due to imposement of Model code of conduct till middle of December 2013, implementation of the programme could not be undertaken upto the period as specified in the Model code of conduct. Therefore, the implementation of the programme has been started in the last part of December 2013 to complete the following targets within March 2014.
Creation of 198 Ha. of new fish ponds in the State to achieve additional production of atleast 400 M.T. of table-size fish.
Renovation of 540 Ha. of existing fish ponds to achieve additional production of 270 M.T of table-size fish.

Economic Survey Mizoram 2013-14 ~ 55 ~ Agriculture & Allied- Fisheries
Economic Survey Mizoram 2013-14
Supply of 1st inputs in kind worth Rs.12,500/- ha to 990 Ha. of new fish ponds,
renovated ponds and existing ponds, totally covering about 1950 beneficiary families.
Constructed 228 fishermen huts (Thlam), 22 water point/ Tube-well (Tuikhur) and 2 Community Hall under NSWF. Also construction of other 477 fishermen huts (thlam), 46 waterpoint/tubewell (Tuikhur) and 2 Community Hall has been started in various districts with a target to complete by 31st March 2014.
So far, the Department has received a total of Rs.13.40 lakhs from annual
auction of Serlui ‘B’ Reservoir for the last two years.
B. RKVY: Supplied 400MT of fish feed, 200 lakh fingerlings to beneficiaries under RKVY
programme 4 units of Fish Feed Mill under Construction Construction of 40 ha of new ponds 4 nos. of warehousing facility/godown under construction Installation of 2 batteries of cages at Serlui ‘B’ Reservoir Construction of 1 unit of Mini Ice-Plant Constructed 1 unit of hatchery Training Centre-1 unit under construction at Serchhip Upgradation of Laboratory under progress Training and demonstration of 1000 nos. of fish farmers on modern technology
of fish farming.
…..

Economic Survey Mizoram 2013-14 ~ 56 ~ Agriculture & Allied- Fisheries
Economic Survey Mizoram 2013-14
FOREST The forest cover in the country
is monitored at the interval of every two years by Forest Survey of India Dehradun based on interpretation of Satellite Imageries. Though the state is rich in forests, it has very limited dense forests. As per National Forest Policy 1988, in the hills and in mountainous regions like Mizoram, the aim should be to maintain two-third of the area under forest or tree cover in order to prevent soil erosion and land degradation and to ensure the stability of the fragile eco-system. As against this goal; at present notified forests (reserved/ protected forests) constitute about 38% of the geographical area and even most of these are open, degraded and subject to pressure of shifting cultivation, encroachments, fire, illicit felling etc.
Area under various reserved forest in Mizoram SL.NO. TYPE OF FOREST AREA (IN SQ.KM)
A. State owned 1 Riverine reserved forest 1832.50 2 Innerline reserved forest 570.00 3 Roadside reserved forest 97.20 4 Other reserved forests 1963.63 5 Wildlife protected areas 1728.75 6 B. District Councils Forests 2562.00 Total reserved forests 8754.08
Source: Mizoram Forest Statistical Handbook 2011: Issued by Deptt. of Environment & Forest . G.O.M. FOREST DEVELOPMENT AGENCY:
The State of Mizoram moved from State regulation to people’s participation for managing its rich forest wealth by adopting the “Joint Forest Management” (JFM) through a notification issued in 1998. The introduction of JFM established a new mutually-beneficial relationship between the forests, the people and the State. The basic objective of adopting the mechanism of JFM in the state was to encourage active involvement of the local people in enrichment, protection and sustainable management of the forests.
Based on ‘India State of Forest Report-2011’ published by Forest Survey of India, Dehradun about 90.68% of the State’s total geographical area is covered under forests. However the forests have suffered serious depletion and degradation due to traditional practice of shifting cultivation, uncontrolled fire, unregulated fellings etc. As per the “India State of Forest Report-2011” published by Forest Survey of India, the state has 12,897 Sq.km open forests.

Economic Survey Mizoram 2013-14 ~ 57 ~ Agriculture & Allied- Forest
Economic Survey Mizoram 2013-14
For ensuring active and constructive participation of the local people in forest management, 1(one) State Forest Development Agency (SFDA), 21 Forest Development Agencies (FDAs) and 598 Village Forest Development Committees (VFDCs)/ Eco-Development Committees (EDCs) have been constituted. Works under Centrally sponsored schemes – “National Afforestation Programme” (NAP)- are mainly taken up by VFDCs/ EDCs through FDAs. Suitable tree species have been planted over an area of 52,440 ha. under NAP during the period 2003-04 to 2011-12. PRESERVATION OF WILDLIFE :
The Environment & Forest Department, Govt. of Mizoram has taken praise worthy initiatives for preservation of wildlife by constituting one Tiger Reserve, two National Parks, and seven Wildlife Sanctuaries. The network of protected areas provide healthy habitats for many wild animals, birds and reptiles. The area set aside for long-term wildlife conservation is 1728.75 Sq.km which is more than 8% of the State’s geographical area. The details of protected areas are as under:-
Sl.No Name of Protected
Area Status Area (in
Sq.km) Year of Notification Remarks
Preliminary Final
1 Dampa Tiger Reserve(DTR)
WLS 988 1989 1994 DTR included core 500 Sq.km and buffer area
488 Sq.km 2 Murlen NP 100 1991 2003 3 Phawngpui NP 50 1991 1997 4 Ngengpui WLS 110 1991 1997 5 Khawnglung WLS 35 1991 2000 6 Lengteng WLS 60 1998 2002 7 Tawi WLS 35.75 1998 2001 8 Thorang WLS 50 2001 2002 198 Sq.km
additional area to add vide
latest notification
9 Pualreng WLS 50 2001 Over due for final notification
10 Tokalo WLS 250 2006 2007 TOTAL 1728.75
* WLS= Wildlife Sanctuary, NP= National Park
ECO-DEVELOPMENT SCHEME: The Ministry of Environment & Forests, Govt. of India has issued funds for
the improvements of the livelihood of villagers living at the periphery and around various Protected Areas (PAs) to minimize the level of dependency of villagers on forest and forest produces. Under this developmental components, the people living in and around the PAs have been given assistance in the form of free medical camps distribution of LPG, Poultry, Piggery, Cultivation of cash crops, WRC, Terracing, Pisiculture, insulation of water tank, solar lamp, bee keeping etc. FOREST UTILIZATION :
The forests in Mizoram are being managed with a vision to “achieve well-stocked high-quality forests with rich bio-diversity for maintaining ecological balance and ensuring environmental stability while meeting the forest based needs

Economic Survey Mizoram 2013-14 ~ 58 ~ Agriculture & Allied- Forest
Economic Survey Mizoram 2013-14
of the local people. Growing stock of timber is limited in the forests, therefore there is very little scope for commercial felling of trees in Mizoram. Revenue earned is very limited. The details of revenue earned for last three years are as under:- Outturn of Forest Procedure & Revenue Collected (upto January,2013)
Sl No
Items Unit 2010-11 2011-2012 2012-2013 Remarks Quantity extracte
d
Revenue (Rs. in lakh)
Quantity extracte
d
Revenue (Rs. in lakh)
Quantity extracted
Revenue (Rs. in lakh)
1 2 3 4 5 6 7 8 9 10 1. Sawn Timber
1.DTO 2.Seized & Compounded 3.Auction Sale
Cum -do- -do-
1125 2565
1148.45
61.07 13.97 8.15
1460.76 3845.19 1331.23
65.81 42.15 9.44
278.48 1548.35 38231
178.72 30.13 27.29
Rates depend on class of the timber.
2. Firewood 1.Permit System 2.Illegal/ Seized
Cum -do-
3628 933
2.06 1.94
7468
683.42
2.57 1.75
693
583.6
0.40 1.54
3. Bamboo 1.Permit 2.Illegal
Lakh -do-
35
0.32
70.07 1.47
4.72 0.7
7.32 1.72
0.59 2.25
0.70
28.42
Permit system for domestic use. Price
depends on size of
bamboo. 4. Broomstick
1.Permit
Qtls.
1780
12.09
3742
16.22
535
2.50 Permit
system. Mahal was stopped in
2010. PREPARATION OF WORKING PLANS:
Working Plans are important documents for ensuring scientific management of the forests. Presently, there is one approved working plan for Kawrthah forest division. Working plans for Aizawl, Kolasib, Mamit, Thenzawl, Lunglei, N.Vanlaiphai, Tlabung forest divisions and forest areas under Chakma Autonomous District Council (CADC) have been prepared and submitted to the Regional Office, Ministry of Environment & Forests, Govt. of India, Shillong for approval. These working plans are under scrutiny at the Regional Office. BAMBOO DEVELOPMENT IN MIZORAM :
Mizoram has abundant natural bamboo resources which covers around 31% (about 6446 Sq.km) of its geographical area and as many as 35 species of bamboo have been identified in the state of which Melocanna baccifera (mautak) contributes about 77% of the total bamboo coverage. NATIONAL BAMBOO MISSION :
National Bamboo Mission is a Centrally Sponsored Scheme which envisages increase in the areas under Bamboo Plantation of selected species with intensive management so that the yield improves from the present 3 tonnes per hectare (approx. average) to about 18 to 20 tonnes. One of the major components of the NBM is to increase the coverage area under bamboo plantation with economically important bamboo species. In order to ensure supply of quality bamboo planting materials, it is necessary to get them certified by a competent authority. So far Bamboo Nursery Certification has been completed in seven States including Mizoram.
The Mission activities are taken up in both Forest and Non-Forest Areas. The schemes in Forest areas are dealt directly by Environment & Forest Department through Forest Development Agency (the existing FDA’s under National

Economic Survey Mizoram 2013-14 ~ 59 ~ Agriculture & Allied- Forest
Economic Survey Mizoram 2013-14
Afforestation Programme), whereas Non-Forest Areas are dealt with by the Bamboo Development Agency, with Horticulture Department as its nodal department. IMPLEMENTATION OF NEW LAND USE POLICY (NLUP):
The practice of shifting cultivation had contributed to large scale deforestation -disturbing ecological balance resulting in destruction of wild animals and their habitats, elimination of source of water and so on. It also converted vast area comprising valuable timber trees into degraded or barren land. The State Government has come up with a very promising programme called ‘New Land Use Policy’ to do away with the wasteful practice of jhumming and faulty land use. Though the primarily objective of the programme is socio - economic upliftment of the rural poor, it is going to have remarkable impact on preservation of the forests and its resources in the State as the project envisages ensuring – 60% of geographical area of the state to be tree/rain forests, 10% of land for Community Forest Reserves, 10% for community fuelwood reserved forests, 15% for land based development for implementation of NLUP and another 5% for habitation, industrial area, communications etc.
Under New Land Use Policy (NLUP), the Environment & Forest Department has been selected to implement Bamboo Development Programme. So the followings are the status of implementation of NLUP under Environment & Forest Department.
IMPLEMENTATION OF NLUP UNDER ENVIRONMENT & FORESTS DEPARTMENT
1. Allotment of fund under NLUP during 2011-2012 & 2012-2013
= 1) Rs. 1173.91 lakhs (ACA and CSS fund) for 1st Phase 2) Rs. 1424.94 lakhs (1266.06 ACA and 158.88 CSS) for 1st Phase
maintenance and 2nd Phase development works. 2. Families or beneficiaries in number
= 1) 1st Phase – 1409 beneficiaries 2) 2nd Phase – 1200 beneficiaries 3) 3rd & 4th Phases beneficiary being selected by Deputy Commissioner concerned.
3. Area affected by NLUP = 1) 2 (two) hectares per beneficiary 2) 1st Phase – 2818 ha. for 1409 beneficiaries 3) 2nd Phase – 2400 ha. for 1200 beneficiaries
4. Number of beneficiaries in Districts and Division- wise (a) 1st Phase
Sl.No. Name of District Name of Division No.of beneficiaries Total
beneficiaries
1. Mamit Mamit 61 72 Kawrthah 11 2. Kolasib Kolasib 37 37
3. Aizawl Aizawl 77 129 Darlawn 52 4. Champhai Champhai 283 283 5. Serchhip Thenzawl 47 47

Economic Survey Mizoram 2013-14 ~ 60 ~ Agriculture & Allied- Forest
Economic Survey Mizoram 2013-14
6. Lunglei Lunglei 231 747 Tlabung 516 7. Lawngtlai Lawngtlai 94 94
TOTAL : 1409
(b) 2nd Phase
Sl.No. Name of District Name of Division No.of beneficiaries Total
beneficiaries
1. Aizawl Aizawl 133 216 Darlawn 83
2. Lunglei Lunglei 172 425 Tlabung 253 3. Lawngtlai Lawngtlai 86 86 4. Saiha Lawngtlai 2 2
5. Mamit Mamit 81 87 Kawrthah 6
6. Serchhip Thenzawl 100 100 7. Kolasib Kolasib 73 73 8. Champhai Champhai 211 211
TOTAL : 1200 The last and 4th installment of 1st Phase and the 1st installment of 2nd Phase have been released to Deputy Commissioners and Divisional Forest Officers joint account on 17th January, 2013 for implementation of NLUP as per work programme and the fund is being released to the beneficiaries in all Districts.
…….

Economic Survey Mizoram 2013-14 ~ 61 ~ Agriculture & Allied- Soil & Water Conservation
Economic Survey Mizoram 2013-14
SOIL & WATER CONSERVATION The primary function of Soil & Water Conservation is enhancement of soil
fertility, its productivity, regeneration of natural water resources and its conservation for sustainable biomass production. The approach is ‘watershed basis’ and the means to achieve is through Agronomy, Engineering and Forestry combined in an integrated manner. Following are the important approaches being used for conservation of Soil and Water in Mizoram : (1) Terracing : This breaks length of the slope, reduces erosive force of run-off water, retain top soil materials, debris and run-off water on the terrace thereby enhancing soil fertility and soil moisture regime for sustainable production. This scheme is implemented in a project wise under CSS like RVP and RKVY. (2) Water harvesting structures : These are done either as storage tanks/farm ponds across the small rivers, on natural depression in farm lands or at the convenient place in the farm for life saving irrigation to crops in the lean season and for moisture conservation around the structures through seepage/percolation. Again, these schemes are taken up under RVP/FPR(CSS) and RKVY due to extreme fund constrains under divisible outlay during 2013-2014. (3) Soil Conservation Engineering : It involves works like check dams, silt retention dam, drop structures, stream bank erosion control works along or across the small streams to retain silt, debris and flowing water for some time to provide more time for infiltration and percolation to improve ground water recharging. These structures also divert strong currents from damaging river banks adjoining to WRC areas. (4) River Valley Project/Flood Prone River (CSS) : 12 nos. of projects is being implemented during 2013-14. Under these projects, Water Harvesting, Terracing, Check-dam had been taken up. During 2013-14, the following works had been done :-
Achievement under RVP/FPR works are :- Sl. No. Name of Works Physical
1 Bench Terrace 508 Ha. 2 Half moon/Line Terrace 70 Ha. 3 Community Water Tank 3 Nos. 4 Individual Water Tank 191 Nos. 5 Check Dam 688.74 Rm
(5) NLUP : Under this Scheme, Rubber Plantation in the low lying area (less than 450m above msl) in Kolasib, Mamit, Aizawl, Lunglei Districts and Chakma Autonomous District Council on Cluster approach as far as possible will be done. Arabica Coffee Plantation will be done in middle portion of the State (1000-1500 ft above msl) and Broom grass plantation in marginal lands along National Highways and State High ways of the State. The achievement of various Trades are as follow :

Economic Survey Mizoram 2013-14 ~ 62 ~ Agriculture & Allied- Soil & Water Conservation
Economic Survey Mizoram 2013-14
Sl. No. Name of Trade No. of Family
2010-2011 No. of Family 2011-2012 Total
1. Broom 3862 2689 6552 2. Rubber 658 482 1140 3. Coffee 872 394 1266 Total 5393 3565 8958
Rubber Plantation Under NABARD Scheme :
Under this scheme, 1000 Ha. Of Rubber Plantation were created at different District as follows :
Sl. No.
Name of District Location Area in Ha.
1 Mamit Borai, Kawrthah, Mamit, W.Phaileng 300
2 Kolasib Bilkhawthlir, Hortoki, Khamrang 280 3 Serchhip Mamt, Tuikum 80
4 Lunglei Rangte, Zawlpui, Bunghmun, Bolia, Tuisen 240
5 Lawngtlai Sihtlang, Chawntlang, Lawngtlai, Kawlchaw 100
Total : 1000
(6) RKVY : RKVY is implemented in watershed basis and in an integrated approach. The main approach is control of stream banks to prevent erosion of paddy land or increase of rice production and construction of check dam across the stream to retain silts, debris and to improve ground water recharging. The anticipated Achievement during 2013-14 is as follows : 1. Bench Terrace = 266 Ha. 2. Stream Bank Erosion Control = 483 Nos. 3. Check Dam = 915 Nos. 4. Water Harvesting Tank = 339 Nos. 5. Contour Trenches = 44 Ha.
…..
Economic Survey Mizoram 2013-14 ~ 63 ~ Agriculture & Allied- Border Trade
Economic Survey Mizoram 2013-14
BORDER TRADE Indo-Bangladesh 1. Survey for the development of infrastructure and site selection for the ICP on
the Tlabung - Thekamukh sector was carried out by RITES Ltd. In the year 2005 and their survey report was submitted to the Director (BM-II), Ministry of Home Affairs, Government of India on 3.10.2005.
2. In pursuance to the findings and recommendations of the said report.
Government of Mizoram identified and acquired land measuring 224.99 bighas at Kawrpuichhuah, on the International Border, and earmarked 9 hectares (65 bighas/22.5 acres) for the development of the ICP and its attendant infrastructure. In fact, the said parcel of 9 hectares has already been transferred on lease in favour of the Secretary, MHA, GOI and the Land Settlement Certificate (LSC) to this effect was submitted to the Ministry in February 2010.
3. Government of Mizoram has been striving hard to hasten the progress in
this matter and insisting on upgrading the ICP-Kawrpuichhuah from Phase-II to Phase-I of the ICP Project. In fact, a number of letters have been written by the State Government in this regard requesting an expeditious action, wherein references have also been made to the verbal assurances given by the former Union Home Minister, Mr. Chidambaram.
4. In terms of the infrastructure towards the ICP at Kawrpuichhuah, the
following initiatives have been taken up so far by the State Government. 5. A multi-storied Trade Facilitation Centre at Tlabung (Demagiri) has been
constructed at a cost of Rs. 118.00 lakhs harnessing funds from the Critical Infrastructure Balance (CIB) Scheme under the Ministry of Commerce and Industry, GOI, which was jointly inaugurated by the visiting Hon'ble State Minister of Bangladesh for CHT Affairs Shri Dipankar Talukdar and Hon'ble Minister of Trade & Commerce, Government of Mizoram in December, 2011.
,6. A truckable 18kms road from Tlabung (Demagiri) to Kawrpuichhuah through
the rugged hills is being constructed by the State Government. In fact, the road at present is motor-able and involves a journey time of around 35-40 minutes. However, the black-topping and metalling works on the road have been completed in only 2-3 kms stretch and the remaining works are under progress.
7. Internal roads at Kawrpuichhuah are being developed by the Rural
Development Department, Government of Mizoram tapping the resources from PMGSY Scheme of Government of India.
8: Chief Secretary, Mizoram submitted a note on setting up of ICP at
Kawrpuichhuah on 10.2.2012 to the Secretary (Coordination) Cabinet Secretariat, Government of India. Accordingly, the meeting of the Committee of Secretaries under the Chairmanship of Cabinet Secretary held on 19.3.2012 recommended that the estimate for the bridge for providing connectivity to the proposed ICP may be prepared by the State Government and may be taken up with Planning Commission for provision of funds.
9. Public Works Department, Mizoram has been requested to prepare the DPR
for construction of the RCC double lane over river Theka.

Economic Survey Mizoram 2013-14 ~ 64 ~ Agriculture & Allied- Border Trade
Economic Survey Mizoram 2013-14
10. The State Government is awaiting approval of Ministry of Home Affairs, Government of India for finalization of the site for construction of the propose bridge over the Theka River to connect Thekamukh (Bangladesh) from Kawrpuichhuah (India). The State Government has prepared DPR amounting to Rs. 27.00 crores for establishing Integrated Check Post at Kawrpuichhuah and the same has already been submitted to Ministry of Home Affairs, Government of India for approval and expenditure sanction and it is expected that a positive reaction will be received soon from the Ministry of Home Affairs, Government of India.
PRESENT SCENARIO AND FUTURE PROSPECTS for ICP : 11. As already elucidated above. Tlabung (Demagari) - Thegamukh route was the
traditional trade route in this area where trading activity, both commercial and on traditional/customary lines, has been in existance since the late 19th Century. This route was the main supply link to the southern Mizoram, connecting it to the bustling port of Chittagong and the other parts of the British administered Chittagong Hill Tracts areas and thence to the rest of the country.
12. Of course, the volume and range of formal trade underwent a steep decline in
the post-independence era, especially after 1965, but informal trading activity, exchange of goods and commodities through customary/traditional means and movement of people has continued unabated till date. If fact, the juices offered to us on site by the hospitable and eagerly expectant locals were all produced and bottled in Bangladesh. We were also informed that most cosmetics, toiletries, processed food items, chips, snacks etc used by the people in this whole region are imported from Bangladesh, albeit through the 'informal' channel.
13. There is no gainsaying the fact that opening this trade corridor would be of
substantial signification to the local economies on both sides of the border, besides generating other positive externalities. Presently, the range and diversity of goods and items being exchanged/traded in this sector is quite impressive and is bound to increase in extent and quality once the trade is formalized. A brief snapshot of the items and commodities being traded here ia as follows: 1. Outflow from India:
* Bamboo * Ginger * Chillies * Teak * Citrus fruits * Sugar * Cement * Passion fruit, bananas
2. Inflow from Bangladesh:
* Cosmetics * Toiletries * Crockery * Garments * Schoes * Juices * Meat & poultry
Economic Survey Mizoram 2013-14 ~ 65 ~ Agriculture & Allied- Border Trade
Economic Survey Mizoram 2013-14
* Fish (Fresh, Dried, Fermented) * Electronic goods * Condensed milk * Cooking Oil
14. It can safely be concluded that there is a considerable potential for boosting exports from Mizoram in agriculture, horticulture and floriculture sector besides forest based produce like Bamboo, teak etc. There is also a sizeable demand of quarry stones and stone chips from Mizoram in Bangladesh which can be tapped for earning dividends for this resource-starved region. B. INDO-MYANMAR:
Construction of Infrastructures required for establishment for LCS Zokhawthar have been completed and the LCS is awaiting formal inauguration jointly by the Hon'ble Minister, Commerce & Industry, Government of India and Ministry of Commerce, Union of Myanmar at there convenience.
Even though the required export/import infrastructure have been put-in
place, the connecting link on Myanmar side of the Border is a major hindrance for increasing trade volume. Therefore, a project for improvement of Rih-Kalemyo road via Tiddim-Falam was proposed. Subsequently, the Border Roads Organisation took the task of surveying and preparation of DPR. As per the DPR submitted by the BRO to the MEA, the total cost for construction of these roads as per National Highway Single Lane (NHSL) specification is Rs. 711.47 crores. This was approved by MEA and the construction of work is entrusted to IRCON Government of India and the Republic of Myanmar were requested to take immediate action for setting-up these connectivity inside Myanmar. C. ZORINPUI LCS :
As a part of materialising the Look East Policy, the Kaladan Multi-Modal Transit Transport Project was taken up. This Project will cover two-lane road from Silchar to Sittwe port in Myanmar. Lawngtlai to Indo-Myanmar Border road is under SARDP-NE and construction is going on in full swing now. RDS Projects Ltd., New Delhi is taking up construction of two-lane road at two portions 38 Km and 28 Km and the Atlanta ARSS (JV), New Delhi is taking up construction-of the remaining 38 Km, the total length of which is 104 Km.
This Kaladan road from Lawngtlai and Paletwa road from Myanmar will meet at the Indo-Myanmar Border called ZORINPUI near Zochachhuah. The site was visited by a team of Officials and heads of Lawngtlai District Council headed by Trade & Commerce Minister during the first part of February, 2011.
Land Lease for the site of Zorinpui Land Custom Station is being obtained from E.M i/c Revenue of Lai Autonomous District Council which is expected in the near future. DPR for all necessary infrastructure will soon be prepared.
Like other Trade Centres of Zokhawthar and Kawrpuichhuah the proposed Land Custom Station of Zorinpui is touching the inhabitants of Chin State of Union of Myanmar and traditional mutual benefit trade transactions have been carried out for generations by the peoples of both Countries. As bilateral trade is carried out vigorously within the framework provided by the Government of India and the Government of Myanmar, development of border trade with the neighbouring countries would have special significance to the economic growth of the states of North-East India due to its geographical isolation from the mainland and its

Economic Survey Mizoram 2013-14 ~ 66 ~ Agriculture & Allied- Border Trade
Economic Survey Mizoram 2013-14
relative proximity to the vibrant market economy of the neighbouring South East Asean Countries.
Major items of exportable to Myanmar are Bamboo, spices like chilles, ginger, squash, passion fruit, sesame, banana, cotton yarn and all types of citrus fruits and major items from Myanmar are animals like Cattle, Pigs etc. processed meat tins like fish, cow, chicken, beef and pork, electronic goods, readymade garments, textile articles and either textile fabrics etc. Access to South-East Asean Countires will be provided by Kaladan Multi-Modal Transit Transport on both inland and water through Aizawl to Sittwe port in Myanmar via Lawngtlai, Zorinpui, Kaletwa and Paletwa. Zorinpui will be INDIAN GATEWAY to South East Asia.
As development of Zorinpui LCS is connected with the road from this Indo-Myanmar Border up to Sittwe Port, the same need be highlighted. Zorinpui LCS to Kaletwa-Paletwa is 129 Km by road and Paletwa to Sittwe Port in Myanmar is only 158 Km by Inland Water Transport (IWT) through Kaladan river. Thus, Zorinpui ICP to Sittwe port is 287 Km. IWT & PORT COMPONENT : For Inland Water Transport, the river Kaladan between Paletwa to Sittwe Port has to be improved. At the same time the port of Sittwe has to be developed. For this the Government of both India and Myanmar have left no stone unturned for completion of the work within a short time. The Government of Myanmar has provided land for setting up contractor's camp and land for construction of Sittwe port during September, 2010. Permission for import of construction equipments and materials as well as for opening of Bank Account has been received by contractor during October, 2010. As a result, construction work at Sittwe started in December, 2010. Site Office has been opened at Sittwe in the space provided by Government of Myanmar and preparation of detailed design and working drawings by the contractor is in progress. For these two components of Port and IWT, Project cost is Rs. 342.41 crore. The date of completion is December, 2013.
There is an inland portion, construction of highway link between Paletwa IWT Terminal and Indo-Myanmar border via Kaletwa i.e. Zorinpui. It is 129 Km. Ministry of External Affairs has to finalise arrangements for this.
……

Economic Survey Mizoram 2013-14 ~ 67 ~ Infrastructure- Power & Electricity
Economic Survey Mizoram 2013-14
IX. INFRASTRUCTURE POWER & ELECTRICITY In spite of abundant hydro-electric power potential available in the State (4500.0MW approx), only 0.66% of its potential has so far been harnessed, through Small & Mini Hydel Projects. The State’s power demand is presently worked out to be 201 MW as per 18th Power Survey of India. The bulk of the State’s power requirement is met from Central Sector Generating Stations in which the share of Mizoram is 103.09 MW. But, as these generating stations are mostly hydel stations which depend on rainfall, power availability from these stations are, therefore, seasonal. So, in dry seasons, inherent generation shortfall compelled the Department to resort to load shedding at various places. The status of power in the state at a glance is – (1) Demand – 201 MW (2) Allocated share – 103.09 MW (Real time available power is normally 60 MW due to reduction of generation from Central Generating Station, Transmission Failure etc.) (3) Local generation installed capacity – 29.35MW Hydel The allocated power is wheeled to the State through NE grid at 132kV level through the following lines - (1) 132kV SC Jiribum (Manipur) to Aizawl (PowerGrid) line. (2) 132kV S/C Badarpur (Assam) to Aizawl (PowerGrid) line. (3) 132kV S/C Kumarghat (Tripura) to Aizawl (PowerGrid) line. These lines converge into 132kV PGCIL Sub-Station at Luangmual (Aizawl) from which power is transmitted to various States’ own 132kV Sub-Stations in Mizoram for further distributions at various voltage levels. The existing power networks in the State consists of – 1. Diesel Power Station - 1 No. (0.5 MW) 2. Hydel Generating Station - 11 Nos. (29.35MW) 3. 132kV lines - 728.96 Kms 4. 66kV lines - 117 Kms 5. 33kV lines - 1170.026 Kms 6. 11kV lines - 5044.747 Kms 7. LT lines - 2746.59 Kms 8. 132kV Grid Sub-Station - 7 Nos. (128.10MVA) 9. 33kV Grid Sub-Station
a) 33/11kV at 132kV Sub-Stations -7 Nos. (50.50MVA) b) 33/11kV Sub-Stations - 41 Nos. (157.90MVA)
10. Distribution Transformers - 1634 Nos. (188.323MVA) 11. Street Lights - 10647 Nos. . GENERATION In Mizoram power is generated by two types viz. Hydel & Diesel. Due to its high generation cost, use of Diesel is avoided as far as possible. The Potential availability of hydro power of Mizoram is estimated at 4500 MW (approx), out of which only 0.66% is presently harnessed. Table I below indicates the details of Installed capacity and generation of power in the state during 2007-08 to 2011-12.

Economic Survey Mizoram 2013-14 ~ 68 ~ Infrastructure- Power & Electricity
Economic Survey Mizoram 2013-14
Table – IP
Hydel HFO Based
Diesel Hydel HFO Based
Diesel
2008-09 17.35 22.92 0.5 40.77 8.28 2.63 0.016 10.9262009-10 17.05 22.92 0.5 40.47 13.5 4.01 0.02 17.532010-11 29.05 22.92 0.5 52.47 31.93 1.72 0.01 33.662011-12 29.35 22.92 0.5 52.77 22.78 0.00 0.01 22.792012-13 29.35 22.92 0.5 52.77 58.59 0.00 0.02 58.61
TotalYearInstalled Capacity in MW
TotalGross Generation in MU
POWER PURCHASE
During 2011-12 only 5.0 % of the total energy available for the state is met within the state and the remaining 95.0 % was imported mainly from Central Sector Projects. Status of power purchased for the last five years is shown below :-
Table – II
Source of Power purchase 2008-
09 2009-
10 2010-
11 2011-
12 2012-
13 TSECL, Tripura (MU) 36.08 41.08 45.98 66.57 74.67 Central Sector (NEEPCO, NHPC) (MU) 321.64 268.5 302.27 322.94 302.99 Others (MU) 20.49 37.57 55.32 51.59 29.43 Total Power Purchased (MU) 378.21 347.15 403.57 441.10 407.09 Total cost of purchased (Rs in Cr) 86.28 78.81 108.93 150.81 183.74
( Note : Figures are in MU unless specified)
CONSUMPTION OF ELECTRICITY
Power & Electricity is the basic infrastructure for economic development of a country. The degree of economic growth is highly correlated with the generation and consumption of electricity. The category-wise consumption pattern during 2012-13 reveals that the consumption of electricity was highest in case of domestic which accounted for 69% and the lowest consumption of electricity was the Agriculture sector which consume only 0.56 MKWH which is less than 1% of the total consumption. Total number of electric consumers as on 31st March 2013 is 1,86,022.
Table – III (Figures in MU)
Sl No Type of Consumers 2008-09 2009-10 2010-11 2011-12 2012-131 Dommestic 111.34 129.16 174.40 171.15 197.592 Commercial 9.94 11.86 14.65 18.89 21.13 Public Lighting 5.84 5.15 7.04 6.04 5.364 Public Water Works 25.26 30.62 27.29 36.28 37.235 Industrial 1.62 1.75 1.88 2.09 3.286 Bulk Supply 11.38 11.66 12.18 17.31 21.487 Agriculture 0.00 0 0.121 0.095 0.560
Total 165.38 190.20 237.56 251.86 286.60

Economic Survey Mizoram 2013-14 ~ 69 ~ Infrastructure- Power & Electricity
Economic Survey Mizoram 2013-14
Sale of energy within
the state
Sale of energy
outside the state
Total Sale of energy Misc. Grand Total
2008-09 43.34 42.11 85.45 1.64 87.092009-10 48.47 17.55 66.02 1.60 67.622010-11 55.82 15.19 71.01 1.55 72.562011-12 89.08 18.29 107.37 2.33 109.702012-13 96.43 15.45 111.88 2.45 114.33
Year
Revenue Received (Rs in Crores)
Revenue
The main sources of revenue is Sale of energy to the consumers, there are other miscellaneous sources like Meter rent, theft of energy, connection & re-connection charges, re-rating and fuse call, etc. Sale of Energy may be divided into two, viz. Sale of Energy within the State and Sale of Energy outside the State. After implementation of ABT (Availability Based Tariff), Mizoram has a chance to sell its unused Power share through U.I (Unscheduled Interchanged) or Bilateral Sale as the case may be.
Table - IV
COMPLETED/ ON-GOING SCHEMES
Rajiv Gandhi Grameen Vidyutikaran Yojana (RGGVY) : The Department has implemented RGGVY scheme which covers
Construction of 4 nos. 33/1 IkV Sub-Stations at Phullen, Sakawrdai, Sangau and Chawngte, with Electrification of 182 un-electrified villages and intensive electrification work in 525 electrified villages and provision of free service connection to 26210 nos. of BPL households at the cost of Rs 316.95 crore as per latest sanctions. Out of these, 4 nos. of 33kV Sub-Stations, electrification of 94 un-electrified villages, intensification of 346 electrified villages and provision of 15,122 BPL connections are completed. Approval of additional REDB projects for all 8 districts of Mizoram under XII plan of RGGVY is accorded by REC at a project cost of Rs 7702.83 lakh on 13.9.2013. The followings are the scope of works under REDB:- a) Augmentation of 33kV Sub-Station at Thingsulthliah, Mamit, Zamuang,
W.Phaileng, Kolasib, Bairabi, Vairengte, Champhai, E.Lungdar, Tlabung, Hnahthial and Tuipang.
b) Construction of new 33/1 IkV Sub-Station at Rabung(1.6MVA), Chekkawn(1.6MVA), Tawipui 'N'(1.6MVA), Mualthuam(1.6MVA), Saibawh(2.5MVA), Bualpui 'NG'W(2.5MVA) and Phura(1.6MVA).
c) Construction of 295Kms 33kV lines.
d) Construction of 33kV bay at Rabung, Chekkawn Tawipui 'N', Mualthuam, Saibawh, Bualpui 'NG' W and Phura.
e) Construction of SOKms 1 IkV lines.
f) Construction of 1 IkV switchyard at W.Phaileng.
Projects under NEC : There are 9 Nos on-going projects under NEC funding at an estimated cost of Rs 5107.22 lakh out of which R&M of 132kV Sub-Station, Bukpui
Economic Survey Mizoram 2013-14 ~ 70 ~ Infrastructure- Power & Electricity
Economic Survey Mizoram 2013-14
and Construction of 2.5MVA 33/1 IkV Sub-Station at Zokhawsang AR Complex are physically completed.
In addition to above Construction of new 33/1 IkV Sub-Station at Saiphai and Buarpui is already sanctioned by NEC at an estimated cost of Rs 1370.58 lakh. The work is to be started in 2014-15 and expected to be completed within 3 years form starting the works. Projects under DoNER : There are 2 Nos on-going projects under DoNER funding which are Construction of 132kV S/C Line on D/C tower from Kolasib to Aizawl (Melriat) with LILO of one Ckt at Aizawl (Zuangtui)132kV S/S and Construction of HOKm new 132kV S/C line Aizawl (Melriat) to Lunglei at an estimated cost of Rs 2151.10 lakh and Rs 4176.07 lakh respectively. Hydel Generation : The Department has taken up construction of 3x4MW Serlui *B' SHP wherein all the machines are technically commissioned in 2010 and has generated 39.85MU during 2012-13 The Department also takes up Construction of 2x2.5MW SHP at river Tlawva near Khuangthing village in Champhai District at the projected cost Rs. 57.49 crore and is expected to be completed in the year 2015. Construction of 3.5MW Kawlbem SHP is also started during 2013-14 at an estimated cost of Rs 4960.00 lakh and is expected to be completed during 12th
Plan. The 18th Meeting of Empowered Committee on 18.9.2013 for Viability Gap Funding (VGF) support has recommended for 210 MW Tuivai HEP to be executed on Public Private Partnership (PPP) mode with Viability Gap Funding (VGF) Rs 340 crores which was approved by Finance Minister on November 2013. The project will be executed by Power & Electricity Department, Government of Mizoram on Public Private Partnership (PPP) mode under state sector. The project is the first infrastructure Public Private Partnership (PPP) project in the North East and the first power generation project to be executed on Public Private Partnership (PPP) mode with Viability Gap Funding (VGF) support in India. The project will be completed within 12th Plan.
It may be pertinent to mention here that Power & Electricity Department signed MOU with NEEPCO on 26.3.2010 for execution three hydel projects of 1526 MW comprising of Lungreng HEP (815 MW), Chhimtuipui HEP (635 MW) and Mat HEP (76 MW) under Central Sector. The Department also signed MOU with NTPC, a reputed Public Sector on 22.12.2008 for construction of Kolodyne Phase -II Hydro Electric Project (460 MW) near Lawngtlai Town. In addition to this, MOU was signed with SPLM Energy Kolkata, private developer on 5.11.2011 for Tuirini (38MW) and Tuivawl (42MW) HEPs on Build, Operate and Transfer (EOT) basis. The total capacity addition from above projects will be 2066 MW. RB-STRUCTURBD ACCELERATED POWER DEVELOPMENT AND REFORM PROGRAMME (R-APDRP Part 'A'): The Department has taken up the scheme at a sanctioned cost of Rs. 35.12 crore wherein Rs. 10.54 crore is already released by PFC. The basic scope of the scheme is preparation of base line data for establishment of consumer indexing, GIS mapping etc. for reduction of AT 8s C loss to the level of 15%. R-APDRP Part 'A' is scheduled to be completed by 2015. In the meantime, R-APDRP Part TB' work is being taken up which consists of strengthening and improvement of Distribution Networks amounting to Rs 334.19 crores. The scheme implementation is to be completed in September 2016.
…..
Economic Survey Mizoram 2013-14 ~ 71 ~ Infrastructure- Transport & Communications
Economic Survey Mizoram 2013-14
TRANSPORT & COMMUNICATIONS ROADS
The total length of all types of roads in Mizoram has increased considerably, during the 11th Five Year Plan i.e., from 6059.83 kms at the beginning (i.e 2007) to 7437.13 kms till date, which is 23% increase during the past five years.
The details of road length in Mizoram as on 2012 is shown below :
1) National Highway (NH) : 986.00 Kms 2) State Highways (SH) : 505.05 Kms 3) Major District Road (MDR) : 709.90 Kms 4) Other District Road (ODR) : 1013.77 Kms 5) Village Road (VR) : 1061.70 Kms 6) Roads within Towns & Villages : 591.645 Kms 7) City Roads (CR) : 355.487 Kms 8) Other Roads : 1020. 576 Km
(A)Total of Roads under PWD : 6244.128 Kms
1) State Highways (SH) : 194.59 Kms 2) Major District Road (MDR) : 225.750 Kms 3) Other District Road (ODR) : 383.13 Kms 4) Village Road (VR) : 41.00 Kms
5) Other Roads : 191.720 Kms (B)Roads maintained by BRO 1036.19 Kms
(C)Roads maintained by other Department 257.00 Kms Grand Total(A)+(B) +(C) : 7537.318 Kms
The funding agency for construction and maintenance of roads within Mizoram, other than that allocated annually under State Plan includes those from NLCPR (DoNER), NEC, PMGSY, NABARD, ADB Loan, World Bank Loan and Ministry of State Road Transportation & Highway.
National Highway :
The total length of National Highways in Mizoram is 986 kms. There are 6 (six) National Highways in Mizoram as shown below. NH-54 was taken over by the Mizoram PWD from BRO on 1st April, 2010.
NH-154 = 58.00 kms(Bairabi – Bilkhawthlir) NH-150 = 140.00 kms (Seling to Manipur Border) NH-44A = 130.00 kms(Aizawl – Mamit - Tripura) NH-54A = 9.00 kms(Hrangchalkawn-Lunglei) NH-54B = 27.00 kms (Zero Point to Saiha) NH-54 = 522. 00 kms (Lailapur to Tuipang) NH-502 A = 100.00 kms
(Multi Modal Road, i.e. NH-54 at Lawngtlai to Myanmar border) Total = 886. 00 kms

Economic Survey Mizoram 2013-14 ~ 72 ~ Infrastructure- Transport & Communications
Economic Survey Mizoram 2013-14
There are mainly three funding type for National Highways in Mizoram, viz.,
a) NH (O) b) PR (Periodical Repair) c) SARDP (Special Accelerated Road Development Programme)
Also, during 2012-13, the Ministry has sanctioned Rs.6.56crores for
Ordinary Repair and Rs. l.00 crore for Flood Damage Repair.
Under NH(0), the Annual Plan 2012-2013 approved Rs.372.00crores out of which Rs.l72.39crores have already been sanctioned. The works taken up under this fund include Strengthening, Improvement of Riding Quality, Periodical Renewal, Widening, Road Safety, Construction of Bridges, etc.,
SARDP is divided into Phase A and Phase B. At present, all the ongoing works are taken up under Phase-A and numbers of DPR are being prepared to be taken up under Phase B, some of which have already been sent to MORT&H for approval.
With the introduction of e-tendering system by the Central Government, the Public Works Department have also implemented this scheme from 7th May, 2012 for National Highway works costing Rs.S.OOlakhs and above. Central Public Procurement Portal (CPPP) is utilized for e-tender and this have become a major achievement. At present, there are 10(ten) works amounting to Rs.82.81crores called under e-tender out of which 5 [five) Work Order is already issued.
Feasibility Study and Preparation of DPR in-house for 2-lanning of NH54A
Lunglei-Theiriat Section and Champhai-Tiau Road have already been submitted and the same for NH-54B Zero Point-Saiha Section and Lunglei-Demagiri Road is being prepared for submission under SARDP-NE Phase-B. Roads Under PMGSY (Bharat Nirman) : PMGSY (Bharat Nirman) Programme was started in 2000-01. The main objective of the programme is to provide connectivity to all habitations with population of 250 & above for desert and hilly area and 500 & above for plain area by way of making all weather road to promote their socio economic development. The scheme is a 100% Centrally sponsored scheme. Sanctions are being accorded in Phase-wise in yearly basis.
The achievement under PMGSY scheme may be summarized as shown below :
Year Length (in Km) Habitations (No) Expenditure (Rs. in Cr.)
Target Achievement Target Achievement Target Achievement
2005 - 06 154.10 174.40 22 14 60.68 44.52 2006 - 07 49.00 146.81 2 1 44.00 37.85 2007 - 08 334.00 207.44 19 19 100.00 61.05 2008-09 280 192.03 40 6 100.00 54.56 2009-10 250 202.71 40 14 - 66.85 2010-11 - 251.04 30 31 - 82.24 2011-12 - 82.85 - - - 62.38 2012-13 297.65 56.56 36 3 167.00 36.06

Economic Survey Mizoram 2013-14 ~ 73 ~ Infrastructure- Transport & Communications
Economic Survey Mizoram 2013-14
Kaladan Multi Modal Transit Transport Project (Phase 'A' of SARDP-NE)
This project was initiated by Ministry of External Affairs, Govt. of India to build transport communication to link Kolkata port with North eastern region via Mizoram and through Myanmar. The route consists of sea route (720 km) from Kolkata-Sittwe(Akyab) in Myanmar, river route along Kolodyne river from Sittwe-Kaletwa (222km) in Myanmar upto which 500 tons capacity of vessel can ply. And inland road from Kaletwa-Indo Myanmar border (62 km) and then from the Myanmar border to NH-54 at Lawngtlai (100 km) in Mizoram.
Kaladan Multi Modal Transit Project Transport Project within Mizoram from 100 km of Double Lane Highway to connect Kolkata port via Myanmar and sea route has been sanctioned for an amount of Rs. 575.69 crores. And was recently declared as nationa Highway NH-502A. The work was physically started on February 2011 and Formation Cutting of 60km amounting to Rs.221.86 crores have already been completed. Roads Under NEC (North Eastern Council):
Under NEC there are 9 Nos of on-going road works with an expenditure of Rs.2476.56 lakhs. 3 Nos of road projects have been completed with an expenditure of Rs.1226.32 lakhs and 2 nos of Bridge with an expenditure of Rs. 525.30 lakhs. Out of the 9 ongoing works 2 Nos namely Upgradation of Serkhan Bhagabazar Road (115.20 Kmp) and Upgradation of Thanlon-Singhat Road (Ngopa-Tuivai) (43.40 Kmp) which are llth Plan projects are expected to be completed by 2014 and the remaining 7 nos of roads are expected to be completed soon. NLCPR (Non-Lapsable Central Pool of Resources):
Under NLCPR Scheme taken up by Mizoram PWD, there are 12 nos of on-going projects (i.e 8 nos of road projects and 4 nos of bridges). The roads under NLCPR are mainly classified as Other District Roads. The cumulative expenditure for the on-going projects is Rs. 24.93 crores against the sanctioned amount of Rs. 82.24 crores. There are also 18 nos of Deposit works being taken up by the Mizoram PWD. Roads Under Asian Development Bank:
The Asian Development Bank (ADB) is assisting the Government of India in Upgradation and improvement of the roads in the seven North Eastern States of India through a programme of works called the North Eastern States Roads Investment program (NESRIP).
NESRIP is a 100% centrally sponsored scheme of which ADB will finance up
to 70% while the Central Government will finance the remaining 30% of the costs of capital investment. State Governments will only bear the expenses towards land acquisition resettlement and rehabilitation, environmental and mitigation measures, shifting of utilities, etc.
Construction of Improvement of Serchhip-Buarpui Road (L=55 Kms)
amounting to Rs. 167.90 crores has been selected and approved by the Ministry of

Economic Survey Mizoram 2013-14 ~ 74 ~ Infrastructure- Transport & Communications
Economic Survey Mizoram 2013-14
DoNER. Administrative Approval and Expenditure Sanction have already been accorded and the work is expected to start soon. In the meantime, Land Acquisition, Relief & Rehabilitation for this road is under process. Roads under NABARD:
Under NABARD Scheme, there is a total of 5 Nos. of on-going work with a total sanctioned amount of Rs. 7413.20 lakhs. A new scheme i.e., Strengthening & Improvement of Chhumkhum-Chawngte Road amounting to Rs.55.45 crores is being processed for approval to be taken up during 2012-2013 .
…….
Economic Survey Mizoram 2013-14 ~ 75 ~ Infrastructure- Transport & Communications
Economic Survey Mizoram 2013-14
ROAD TRANSPORT
Road Transport for commercial and non-commercial is the most important mode of carrying goods and passengers within the state, inter -state, and along international borders of Bangladesh and Myanmar. Therefore, roads are the most important means of communication, transportation of goods and passengers, and thus serve as the lifeline of the State’s economy. Operation of MST Buses in Transport Department
The objective of MST Bus operation is to facilitate the need of the people by way of providing them safe, comfortable and cheaper means of transportation throughout the length and breath of the State. Transport Department is operating buses even to the remote areas of the State in the interest of public service where private operators are reluctant to operate due to the uneconomical nature of operating transport services to these remote areas. Postal Department is also availing MST Bus services to despatch mails to various destinations within the State.
As on December,2011, Transport Department is operating Buses on 15 regular routes with a fleet strength of 35. During 2010-2011, the MST Buses performed 5,027 trips travelling 10.29 lakh Kms, carrying 85,744 passengers. The revenue earned during 2010-11 was Rs. 231.22 lakhs against the target of Rs. 191.00 lakhs. Motor Vehicles :-
The total number of motor vehicles on road in the State upto the end of 2010-2011 for both Private and Government vehicles was 91,922. The number of vehicles on road has increased by 11,734 (14.63%) during 2010-2011 as against 80,188 at the end of the previous year i.e 2009-2010. Out of the total number of vehicles in operation during 2010-2011, 55.03% were two-wheelers while 38.10% were light motor vehicles (Auto Rickshaw, Motor Cab, Maxi cab, Motor Car, Jeep, Gypsy), Trucks and Lorries constituted 4.17% of all vehicles on road. The total nos. of vehicles registered as on 31st January 2011 was 102,660. Table showing the trend in increase of vehicles is shown.
No.of vehicles (all types) Increase percentage 2007 - 2008 61,534 8.75% 2008 - 2009 69,130 12.34% 2009 - 2010 80,188 16.00% 2010 – 2011 91,922 14.63% 2011 – 2012 106,105 11.68%
2012 - 2013(upto January,2013)
117,631 10.86%
Commercial Transport At present, a large number of private transport operators are in operations. The Maxi Cab services are available almost on every routes, superseding the services of buses for movement of passengers within and outside the States. Till January, 2013, there are 2,202 nos. of Maxi cab and 4,285 Trucks and Lorries on roads. The number of Motor Cab (Taxi) and Commercial Auto Rickshaw registered and in service are 6,754 and 3,419 respectively. Collection of Revenue Revenue collected from Road Tax, Registration fees & fines, license fees, Passengers and Goods Taxes by the State Government amounts to Rs.1,852.11lakh at the end of 2011-2012 as against Rs. 929.23 lakh during 2010-2011.
Economic Survey Mizoram 2013-14 ~ 76 ~ Infrastructure- Transport & Communications
Economic Survey Mizoram 2013-14
Government of Mizoram have recently amended State Vehicle Taxation Act and enforced it with effect from September 1st, 2011. With the amendment of State Vehicle Taxation Act, 15 years life-time tax is introduced for non-transport vehicles falling under personal category in which engine capacity is based for calculation of tax. It is levied at the time of vehicle registration. On the other hand annual tax is charged on all transport vehicles where laden weight of the vehicle is based for calculation of tax for Goods vehicles and passenger carrying capacity for Passengers vehicles, the tax is collected in a recurring manner on a particular vehicle with a frequency of payment of quarterly, half yearly and yearly. Rail Connectivity Railway line extends to Mizoram at Bairabi, near Assam border measuring only 1.5. km from Katakal Junction. Pasengers and goods arrive at this station once a day. Railways also plays a vital role in carrying essential commodities to the State. Since all major towns are far off from Bairabi, the role of railways in the economy of Mizoram till today is almost negligible. The new railway line project from Bairabi to Sairang having a length of 51.38 kms was sanctioned in the railway budget 2008-2009 at a total cost of Rs.510.34 crore. A ‘Task Force on National Railway Project’ has also been constituted to function as a mechanism of continuous interaction between the Railway and the State Government. Inland Water Project under Ministry of Shipping Transport Department has completed the project on Inland Waterway at Tlawng river with the approved estimated cost of Rs. 527.93 lakh financed by the Ministry of Shipping vide No. I.W.- 14013/7/2006-IWT dt. 23.12.2009. The physical progress achieved so far with the amount received from Govt. of India is 100%. New project proposals on Inland Water Transport at Tuichawng river and Khawthlangtuipui river are proposed for implementation during 2013-14 and the Detail Project Reports were also been submitted to the Ministry of Shipping during January, 2013.
……

Economic Survey Mizoram 2013-14 ~ 77 ~ Postal & Telecommunication
Economic Survey Mizoram 2013-14
POSTAL & TELECOMMUNICATIONS Postal Service
The status and achievements of Postal Services in Mizoram during 2013-14 is given below :
1. Number of Post Offices in Mizoram division
2012-13 2013-14
Head Post Office 1 1
Sub Post Offices 38 38
Branch Post Offices 350 346
Total 389 385
2. Revenue Collection : (ie.) Upto Feb. 2013 Upto 15
Feb.2014
Postal Life Insurance Rs. 16,559,000.00 Rs. 2.10 crore
Rural Postal Life Insurance Rs. 6,136,000.00 Rs. 0.90 crore
Total Rs. 22,695,000.00 Rs. 3.00 crore
3. Sale of Postage Stamps - upto Jan. 2013 upto Jan. 2014
Rs. 9,194,023.86 Rs. 6,368,657.86
4. Savings Bank target & Achievement Upto January, 2013 upto February 2014
Target Achievement Target Achievement
Rs. 4.50 crore Rs.2.83 crore Rs. 4.50 crore Rs. 3.36 crore
......
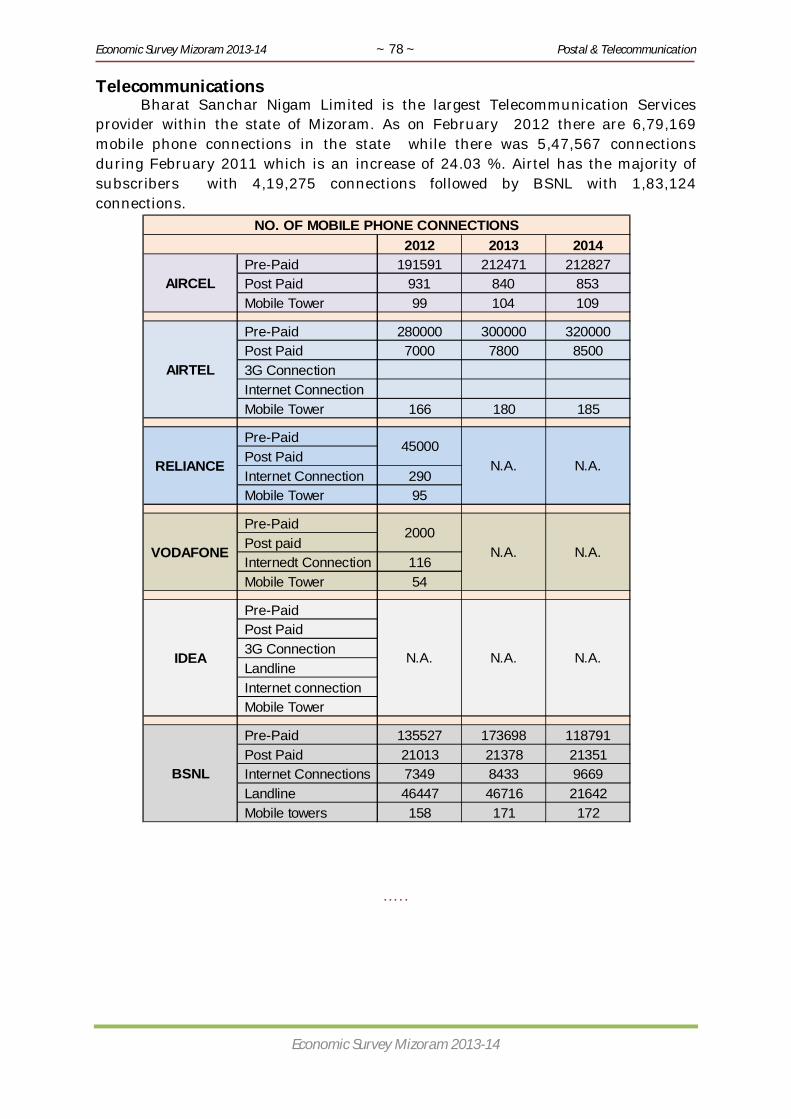
Economic Survey Mizoram 2013-14 ~ 78 ~ Postal & Telecommunication
Economic Survey Mizoram 2013-14
Telecommunications Bharat Sanchar Nigam Limited is the largest Telecommunication Services
provider within the state of Mizoram. As on February 2012 there are 6,79,169 mobile phone connections in the state while there was 5,47,567 connections during February 2011 which is an increase of 24.03 %. Airtel has the majority of subscribers with 4,19,275 connections followed by BSNL with 1,83,124 connections.
…..
2012 2013 2014 Pre-Paid 191591 212471 212827 Post Paid 931 840 853 Mobile Tower 99 104 109
Pre-Paid 280000 300000 320000 Post Paid 7000 7800 8500 3G Connection Internet Connection Mobile Tower 166 180 185
Pre-Paid Post Paid Internet Connection 290 Mobile Tower 95
Pre-Paid Post paid Internedt Connection 116 Mobile Tower 54
Pre-Paid Post Paid 3G Connection Landline Internet connection Mobile Tower
Pre-Paid 135527 173698 118791 Post Paid 21013 21378 21351 Internet Connections 7349 8433 9669 Landline 46447 46716 21642 Mobile towers 158 171 172
N.A.
45000
2000
N.A.
NO. OF MOBILE PHONE CONNECTIONS
N.A. N.A.
N.A. N.A.
N.A.
BSNL
IDEA
AIRCEL
AIRTEL
RELIANCE
VODAFONE

Economic Survey Mizoram 2013-14 ~ 79 ~ Industries
Economic Survey Mizoram 2013-14
X . FINANCIAL AND BANKING INSTITUTION The total bank branches functioning as on 31.12.2013 stood at 140 against
129 bank branches as on 31.12.2012which is an increase of 8.52%.
BANK BRANCH NETWORK IN MIZORAM (As on 31.12.2012)
The population (as per 2011 census) served per branch comes to 7837 while the national average is about 15,000. However the location of branches in the State has been skewed in cities and urban centres. There are still many villages devoid of banking services even with a radius of 80-100 kms. The main reason is setting up of scattered village with small number of households which makes branch banking unviable.
Credit Deposit Ratio
The Credit Deposit (CD) ratio generally gives an idea about the extent to which deposit resources have been locally deployed to propel the economy. Though, in itself, it has its own limitations, nevertheless it gives a clue regarding the credit absorption capacity of the local economy provided other things remain favorable.
The deposits, advances and CD ratio of Commercial Banks, Mizoram Rural Bank, Mizoram Cooperative Apex Bank and MUCO Bank in the State are given below :
(Rs In crore) Agency 2012-13 (as on 31.12.2012) 2013-14 (as on 31.12.2013)
Deposits Advances CD Ratio
Deposits Advances CD Ratio
Commercial Banks
2500.97 943.76 37.74 2906.77 1095.68 37.69
Mizoram Rural Bank
1136.36 496.90 43.73 1290.71 571.61 44.29
MCAB Ltd. 391.96 283.78 72.40 460.42 304.80 66.20 MUCO Bank Ltd. 34.45 16.46 47.80 34.76 18.22 52.41 Total 4063.74 1740.90 42.84 4692.66 1990.31 42.41
Deposits & Advances
Deposits –
The total deposits registered an absolute increase of Rs. 628.92 crore from Rs. 4063.74 crore as at the end of December 2012 to Rs. 4692.66 crore as at the end of December 2013, showing a growth of 15.48% during a calendar year.
Advances –
The total advances increased from Rs. 1740.90 crore as on December 2012 to Rs. 1990.31 crore as on December 2013, registering a growth of 14.33%.

Economic Survey Mizoram 2013-14 ~ 80 ~ Industries
Economic Survey Mizoram 2013-14
Priority Sector Lending
The total accumulated loans and advances disbursed to priority sector i.e. Agriculture, Industry and Service sector by all banks in the State as on 31.12.2013 is Rs. 1,58,254.46 lakhs against Rs. 1,74,751.08 lakhs as on 31.12.2012.
The important point which may be noted is that advance to Agriculture
& Allied Sector has a share of 14.51 % of the total advance while the RBI norm is 18%, whereas it is 24% in 2011. Recovery
The recovery position of the banks operating in the state (as on 31.12.2012) may be observed from the table below :
(Rs in lakh)
…..
2013-2014 (as on 31.12.2013) Demand Recovery Recovery
% Commercial Banks 21900.80 9646.42 44 Mizoram Rural Banks 9067.31 7355.91 81
MCAB Ltd. 5352.55 3675.31 69 MUCO Bank Ltd. 55.55 45.69 82 TOTAL 36376.21 20723.33 57

Economic Survey Mizoram 2013-14 ~ 81 ~ Industries
Economic Survey Mizoram 2013-14
XI. INDUSTRIES INDUSTRY INDUSTRIAL REGISTRATION: Some progress in Industrial development was experienced in Mizoram in spite of its topographical and geographical disadvantages coupled with under developed infrastructure and transportation bottle-neck. Power supply, transport and communication, water supply and lack of raw material and skill, inter alia played significant role toward hindering slow industrial development. However, the micro and small enterprises are slowly gaining momentum especially those service industries. The contribution of industry sector, both manufacturing and service industry in the GSDP has been increased at the rate of 1.58% during 2009-10.
In terms of registration there is 8088 no. of units registered as on 31.3.2011. The flow of investment during 2009-10 is Rs. 1978.29 lakh. Following table shows the achievement during the last 10 years:-
Year Cumulative No. of register unit
No. of registered
Investment during the Year
Employment
2004-05 6080 319 717.50 1116 2005-06 6395 315 661.50 1228 2006-07 6739 344 791.20 1376 2007-08 6944 594 593.00 594 2008-09 7431 487 866.30 4113 2009-10 7888 457 1978.29 3977 2010-11 8088 200 2164.50 1328 2011-12 8219 131 1072.985 906 2012-13 8341 122 1432.202 930 2013 Dec 8474 133 1349.582 800 BAMBOO PROCESSING:
The vast bamboo resources are becoming an income earner for the state. In order to tap the full potential of bamboo and bamboo processing with the possibility of generating Large Scale employment in the field, the Government of Mizoram is taking several steps. The recent bamboo flowering and regeneration of Mautak species has affected the process of bamboo processing to some extent as this species contributes the largest fraction of the total reserves in the state. The initiative taken may be summarized as below:-
1. Establishment of 9 (NINE) Bamboo Chipping Cluster 2. Production of Bamboo Construction Materials 3. Revival of Mizoram Venus Bamboo 4. Establishment of 3 (three) round agarbati stick making unit at
Lunglei, Haulawng and Sairang. 5. Project square agarbati stick for jail inmates. 6. Establishment of 2 (units) Bamboo sliver and mat making unit at
Darlak and Bairabi. 7. Establishment of Bamboo pebble unit at E. Phaileng. 8. Establishment of Bamboo charcoal and Bamboo vinegar unit. 9. Training on handicraft items in association of UNIDO.

Economic Survey Mizoram 2013-14 ~ 82 ~ Industries
Economic Survey Mizoram 2013-14
INFRASTRUCTURE :
There are several items contributing industrial infrastructure such as land, power, water, transport and communication etc. The combined development of all those items contributed industrial infrastructure development. Though development of industrial infrastructure in the hilly terrain of Mizoram is not an easy task, the State Government with its limited resources and geographical disadvantages had earmarked and developed industrial areas with basic infrastructure. This industrial areas, though not fully provided with required infrastructure, will solve the problem of industrial units to a great extend. Enactments of The Mizoram Industrial Areas (Management, Regulation and Control) Act-2008 envisage allotment of industrial units at different declared industrial area.
10.
The following table shows different industrial areas and their respective status :
Sl. No
Industrial Area Total Area (in Bighas)
Present Status
1. Industrial Estate, Zuangtui 314.70 Out of 231 demarcated, 197 plots are allotted to 165 Industrial units
2. Industrial Growth Centre, Luangmual
940.78 Allotment process is yet started and 29 units are now given provisional allotments and expected to accommodate many more enterprises.
3. Industrial Estate, Bairabi 26.20 Yet to be developed
4. Industrial Estate, Kolasib 32.33 Yet to be developed
5. IIDC, Pukpui 76.68 Demarcation of plot completed, and allotment is given to 2 units.
6 Industrial Estate, Hmunhmeltha
104.40 Yet to be developed
7 Export Promotion Industrial Park at Lengte
1390.22 32 plots had been developed and allotted to entrepreneurs, 3 units are now in operation. Up-gradation of the Park is being done and expected to accommodate some more small enterprises.
8 Bamboo Technology Park at Sairang
148.2 The park is ready for plot allotment. Entrepreneurs are allotted plots for bamboo related activities.
The availability of Industrial plot inside industrial areas are shown in the following table indicating that only few industries can be allotted industrial plot that too with insufficient infrastructure. This shows that development of industrial area needs to be taken up in a faster rate during 12th Five Year Plan.

Economic Survey Mizoram 2013-14 ~ 83 ~ Industries
Economic Survey Mizoram 2013-14
Sl No Industrial Estate No. of
plot No. of plot
allotted 1 Industrial Estate, Zuangtui 232 197 2 Bamboo Technology Park (BTP), Sairang 10 3 3. Export Promotional Industrial ark (EPIP), Lengte 32 26 4 Industrial Growth Centre (IGC), Luangmual 99 29 5 Integrated Infrastructure Development Centre(IIDC) at Pukpui
Lunglei District 70 2
TOTAL 443 257 INDUSTRIAL INCENTIVE:
In order to encourage the entrepreneurs for promotion and development of Industries in the State, the Government of Mizoram has formulated a number of incentives which has been given to the Industrial Units in the form of subsidy of power consumption, interest paid on load cost of transportation of plants and machineries and on cost of preparation of Project Reports and cost of power generating sets purchased and used for Industrial purpose etc. These incentives are found beneficial for further development and growth of the Industries and gave immense impetus to the existing as well as proposed Industrial Enterprises to invest in industrial activities in the state. This has resulted in rural industrialization and expansion of existing units in the urban areas as well. Subsidy was given to 43 nos. of industrial units during 2010-2011. The total amount given is Rs. 25 lakh.
For the current financial year a sum of Rs. 39,99,774/- for 33 nos. of Industrial Unit is earmarked and it is under process for sanction.
The Government of Mizoram has also provided a highly beneficial scheme for giving grant-in-aid to the rural and urban artisans in the form of small hand tools like Carpentry, Blacksmithy, Tinsmithy, Cobbler Tools and Sewing & Knitting Machines at a reasonable subsidized rate. With the increasing price of machinery and hand tools the subsidies rate was enhanced to a limit of Rs. 2500/- per machine and tool set with which the entrepreneurs can deliver the machine/tools on payment of small amount towards the cost of the machine/tool set. This scheme greatly helped the growth of rural industries apart from generation of employment in the state. Grant-in-Aid was given to 900 nos. of artisans during 2007-08 amounting to Rs. 22, 50,000.00. However, grant could not be given during 2008-2009 and 2009-2010 as there was no provision of plan fund under scheme. During 2010-2011, 800 nos of artisans are given GIA worth Rs. 20.00 lakhs.
For the current financial year a sum of Rs. 16.50 lakhs for 550 beneficiaries is earmarked and it is under process for sanction. And the subsidy rate is enhanced to Rs. 3000/- per machine/tool set.
HANDLOOM & HANDICRAFT WING
Handloom and Handicraft wing was established in 1988 headed by Joint Director of Industries. The wing introduces new technology and designs to replace and upgrade traditional loin loom weaving into Fly shuttle loom which is more productive and time saving. Today, the more productive Zoloom – the mechanism of which is more or less similar to Burma loom has been introduced in the state to up-grade the skill level of local weavers and quality products. The success of the initiative taken by the wing may be seen all over the state where all loin looms were replaced by the newly introduced Zoloom. The few loin looms

Economic Survey Mizoram 2013-14 ~ 84 ~ Industries
Economic Survey Mizoram 2013-14
existed in the state are only used for making centre carpet, banner, and special items only. Analogously, Fly Shuttle looms are mostly used in Thenzawl Area only where traditional clothes like Mizo Puanchei, Ngotekherh, Puanropui, Ipte chei, Kawrchei, etc. are popularly produced in the area as Fly Shuttle looms are more useful for this purpose.
The wing also taken up various training programmes for skill upgradation of local artisans as below:
Name of discipline
Capacity per year
Duration Total Nos of trained during the year
2012-13
Remarks
Knitting & Tailoring
110 Nos 6 months 220 Nos Stipend of Rs 500 per trainee per month and Rs 2500 being post incentive are given
Weaving 80 Nos 12 months 80 Nos
Cane & Bamboo
30 Nos 6 months 60 Nos
The wing prepared DPR with a total project cost of Rs 24.05 lakhs under North East Region Textiles Promotion Scheme (NERTPS) to be implemented during 12th Plan and submitted to the Ministry of Textiles, Govt. of India. The PAMC in the Ministry already approved the DPR as below :
1. Cluster Development Project - Rs.1700.00 lakhs 2. Technology Upgradation - Rs.201.05 lakhs 3. Marketing - Rs.348.00 lakhs
Total - - Rs.2249.05 lakhs
The Revival Reform Restructuring Package for the Handloom Sector announced by the Ministry of Textiles, Government of India to waive loan over dues under Handloom sector is being implemented where the share of the central and the state Governments are 90 : 10 respectively. During 2013-14 as many as one Apex Society, 69 PWCS and 51 Nos of individual were covered. In line with the revised guidelines under this package as many as 61 PWCS were already vetted and approved by SIMRC during the current financial year. The claims were already submitted to the Regional office of NABARD, Aizawl.
The 3rd All India Handloom census conducted by NCEAR during 2009-2010 omitted the actual active weavers in the state. Hence it is proposed to issue Weavers’ Photo ID Card to enable the weaver to avail benefit of Weavers’ Credit Card scheme. The card will be issued on production of Photo ID Card shortly. Target for issuance of Weavers’ Photo ID is 1000 weavers for the whole state.
To preserve the cultural indigenous crafts of the state, the department is running Handicraft production centre at Luangmual. The centre produced various items of mizo crafts like – Khumbeu, Thulte, Thlangra, Hnam, Various types of Em, etc.
During 2013-14 the wing distributed GIA from state Plan fund to 200 Nos of passed out trainees under Knitting & Tailoring at the rate of Rs 3000/- per trainees.
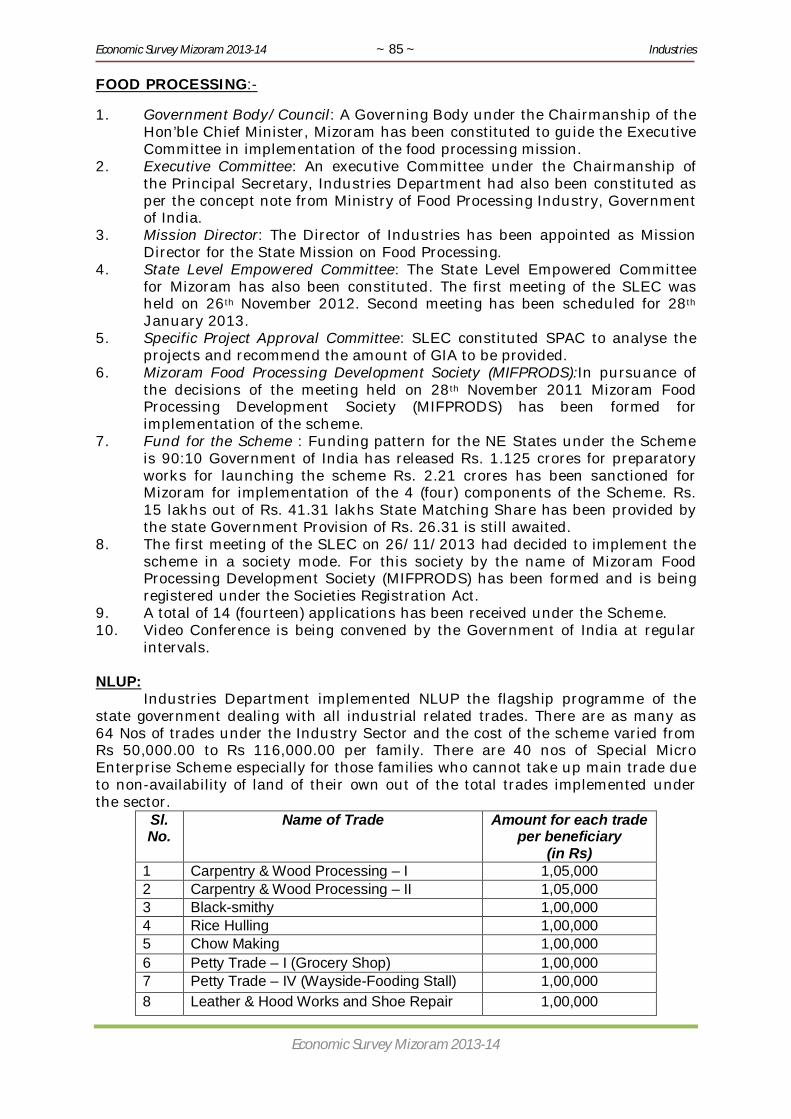
Economic Survey Mizoram 2013-14 ~ 85 ~ Industries
Economic Survey Mizoram 2013-14
FOOD PROCESSING:-
1. Government Body/Council: A Governing Body under the Chairmanship of the Hon’ble Chief Minister, Mizoram has been constituted to guide the Executive Committee in implementation of the food processing mission.
2. Executive Committee: An executive Committee under the Chairmanship of the Principal Secretary, Industries Department had also been constituted as per the concept note from Ministry of Food Processing Industry, Government of India.
3. Mission Director: The Director of Industries has been appointed as Mission Director for the State Mission on Food Processing.
4. State Level Empowered Committee: The State Level Empowered Committee for Mizoram has also been constituted. The first meeting of the SLEC was held on 26th November 2012. Second meeting has been scheduled for 28th January 2013.
5. Specific Project Approval Committee: SLEC constituted SPAC to analyse the projects and recommend the amount of GIA to be provided.
6. Mizoram Food Processing Development Society (MIFPRODS):In pursuance of the decisions of the meeting held on 28th November 2011 Mizoram Food Processing Development Society (MIFPRODS) has been formed for implementation of the scheme.
7. Fund for the Scheme : Funding pattern for the NE States under the Scheme is 90:10 Government of India has released Rs. 1.125 crores for preparatory works for launching the scheme Rs. 2.21 crores has been sanctioned for Mizoram for implementation of the 4 (four) components of the Scheme. Rs. 15 lakhs out of Rs. 41.31 lakhs State Matching Share has been provided by the state Government Provision of Rs. 26.31 is still awaited.
8. The first meeting of the SLEC on 26/11/2013 had decided to implement the scheme in a society mode. For this society by the name of Mizoram Food Processing Development Society (MIFPRODS) has been formed and is being registered under the Societies Registration Act.
9. A total of 14 (fourteen) applications has been received under the Scheme. 10. Video Conference is being convened by the Government of India at regular
intervals. NLUP: Industries Department implemented NLUP the flagship programme of the state government dealing with all industrial related trades. There are as many as 64 Nos of trades under the Industry Sector and the cost of the scheme varied from Rs 50,000.00 to Rs 116,000.00 per family. There are 40 nos of Special Micro Enterprise Scheme especially for those families who cannot take up main trade due to non-availability of land of their own out of the total trades implemented under the sector.
Sl. No.
Name of Trade Amount for each trade per beneficiary
(in Rs) 1 Carpentry & Wood Processing – I 1,05,000 2 Carpentry & Wood Processing – II 1,05,000 3 Black-smithy 1,00,000 4 Rice Hulling 1,00,000 5 Chow Making 1,00,000 6 Petty Trade – I (Grocery Shop) 1,00,000 7 Petty Trade – IV (Wayside-Fooding Stall) 1,00,000 8 Leather & Hood Works and Shoe Repair 1,00,000
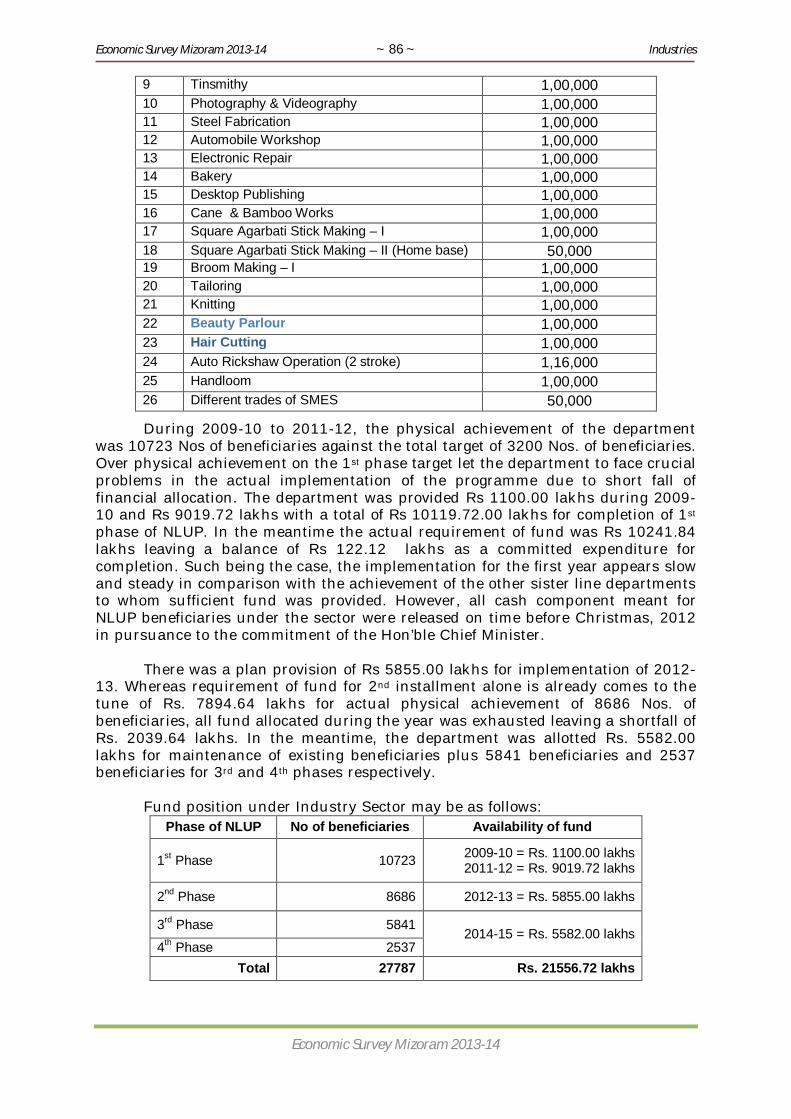
Economic Survey Mizoram 2013-14 ~ 86 ~ Industries
Economic Survey Mizoram 2013-14
9 Tinsmithy 1,00,000 10 Photography & Videography 1,00,000 11 Steel Fabrication 1,00,000 12 Automobile Workshop 1,00,000 13 Electronic Repair 1,00,000 14 Bakery 1,00,000 15 Desktop Publishing 1,00,000 16 Cane & Bamboo Works 1,00,000 17 Square Agarbati Stick Making – I 1,00,000 18 Square Agarbati Stick Making – II (Home base) 50,000 19 Broom Making – I 1,00,000 20 Tailoring 1,00,000 21 Knitting 1,00,000 22 Beauty Parlour 1,00,000 23 Hair Cutting 1,00,000 24 Auto Rickshaw Operation (2 stroke) 1,16,000 25 Handloom 1,00,000 26 Different trades of SMES 50,000
During 2009-10 to 2011-12, the physical achievement of the department was 10723 Nos of beneficiaries against the total target of 3200 Nos. of beneficiaries. Over physical achievement on the 1st phase target let the department to face crucial problems in the actual implementation of the programme due to short fall of financial allocation. The department was provided Rs 1100.00 lakhs during 2009-10 and Rs 9019.72 lakhs with a total of Rs 10119.72.00 lakhs for completion of 1st phase of NLUP. In the meantime the actual requirement of fund was Rs 10241.84 lakhs leaving a balance of Rs 122.12 lakhs as a committed expenditure for completion. Such being the case, the implementation for the first year appears slow and steady in comparison with the achievement of the other sister line departments to whom sufficient fund was provided. However, all cash component meant for NLUP beneficiaries under the sector were released on time before Christmas, 2012 in pursuance to the commitment of the Hon’ble Chief Minister.
There was a plan provision of Rs 5855.00 lakhs for implementation of 2012-
13. Whereas requirement of fund for 2nd installment alone is already comes to the tune of Rs. 7894.64 lakhs for actual physical achievement of 8686 Nos. of beneficiaries, all fund allocated during the year was exhausted leaving a shortfall of Rs. 2039.64 lakhs. In the meantime, the department was allotted Rs. 5582.00 lakhs for maintenance of existing beneficiaries plus 5841 beneficiaries and 2537 beneficiaries for 3rd and 4th phases respectively.
Fund position under Industry Sector may be as follows:
Phase of NLUP No of beneficiaries Availability of fund
1st Phase 10723 2009-10 = Rs. 1100.00 lakhs 2011-12 = Rs. 9019.72 lakhs
2nd Phase 8686 2012-13 = Rs. 5855.00 lakhs
3rd Phase 5841 2014-15 = Rs. 5582.00 lakhs
4th Phase 2537 Total 27787 Rs. 21556.72 lakhs

Economic Survey Mizoram 2013-14 ~ 87 ~ Industries
Economic Survey Mizoram 2013-14
Most of the trades for 2nd phase were already completed and trades which required machines are also expected to be completed within 2013-14.
The achievement of Industry sector is satisfactory in general. There are many beneficiaries who already take up the activity successfully earning their livelihood with remarkable savings. Especially, Beneficiaries of Auto rickshaw trade are doing very well having average net annual income of Rs. 1.80 lakhs. Beneficiaries of other trade like Tailoring, Carpentry, Petty Trade, Auto Works, etc. are also doing their trade successfully.
…..

Economic Survey Mizoram 2013-14 ~ 88 ~ Sericulture
Economic Survey Mizoram 2013-14
SERICULTURE
There is a vast potential for the development of Sericulture in Mizoram. The
climatic condition, fertility of the soil, rainfall etc are most suitable for breeding of all kinds of silkworm. In Mizoram, all variety of skills like Mulberry, Eri, Muga and Tasar are commercially exploited of which mulberry is predominant. The State has made major advances in Sericulture during the last decade and now provides subsidiary income to around 7826 families. Area covered under Sericulture plantation is presently estimated to be 5826 Ha and it is recorded that Sericulture activities is being pursued in 314 villages. Production
Production of cocoons and raw silk yarn during the last five years are as below :-
Particulars Unit 2012-2013 upto March 2013
2013-2014 upto February 2014
Mulberry M.Tonnes 304.5 314.37 MT Muga Lakhs 8.34 0.74 MT Eri M.Tonnes 7.10 5 MT Oak Tasar Lakhs 1.18 0.4 MT Raw Silk M.Tonnes 29.67 33.133 MT
Promotion
The State Government made utmost attempt to bring maximum family towards Sericulture farming and silkworm rearing. As a means to promote Sericulture, State Government established one Research & Training Institute at Aizawl (Zemabawk) imparting training of one year certificate course in Sericulture and also conduct mobile training to farmers in the villages. Since Reelers and Weavers are not yet coming forth from the private sector the State Government established one reeling factory at Aizawl and another two small unit at Zobawk and Kolasib. Infrastructure facilities available under the State Government for development of mulberry silk are as follows :-
1) Research & Training Institute - 1 2) Reeling factory - 1 3) Silk yarn processing unit - 1 4) Mulberry farms - 12 5) Chowki Rearing Centres - 6 6) Grainage Centres - 2
Under NLUP programmes, the Department covered 2206 farmers upto 4th
phase. In spite of all advantages that the State of Mizoram has for the development of Sericulture, the growth of Sericulture industry has been at a very slow pace the reasons could be attributed to lack of infrastructural facilities, paucity of fund, inadequate personnel and non-traditional practice of Sericulture activities.
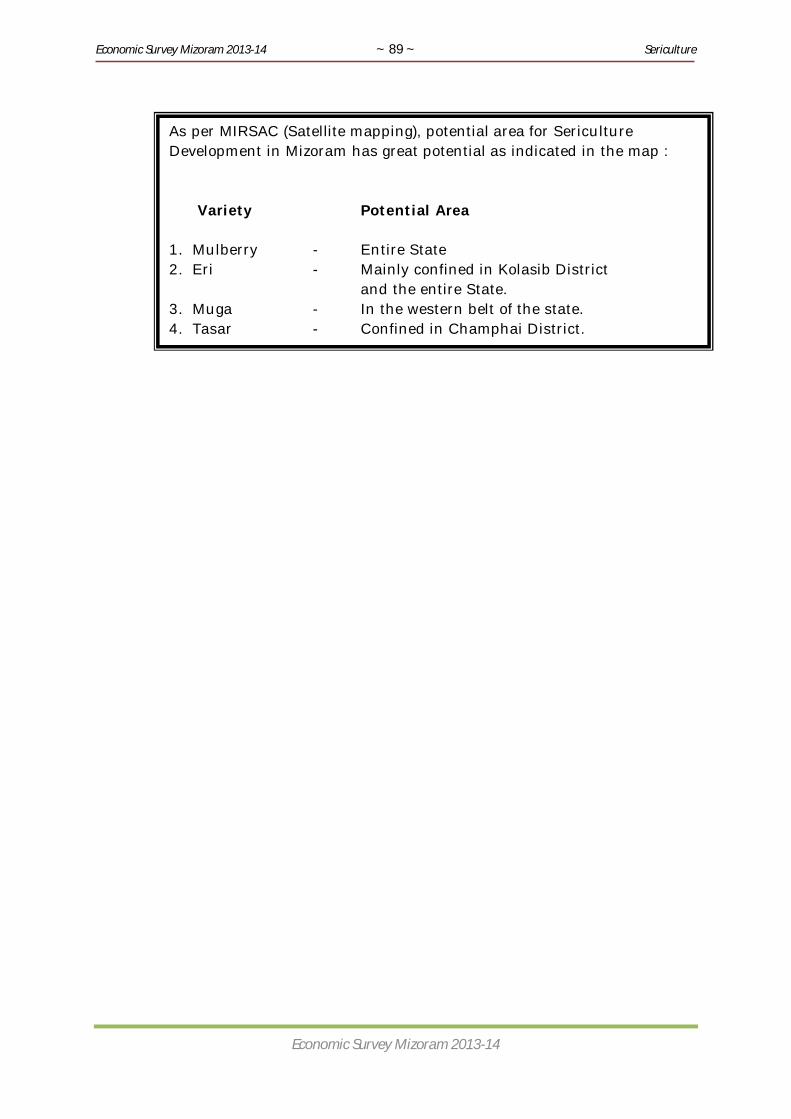
Economic Survey Mizoram 2013-14 ~ 89 ~ Sericulture
Economic Survey Mizoram 2013-14
…….
As per MIRSAC (Satellite mapping), potential area for Sericulture Development in Mizoram has great potential as indicated in the map : Variety Potential Area 1. Mulberry - Entire State 2. Eri - Mainly confined in Kolasib District
and the entire State. 3. Muga - In the western belt of the state. 4. Tasar - Confined in Champhai District.

Economic Survey Mizoram 2013-14 ~ 90 ~ Tourism
Economic Survey Mizoram 2013-14
TOURISM Tourism has emerged as an important economic activity and one of the
fastest growing industries in the world. Globally, Tourism is the fastest growing industry and in terms of value, it comes third only after Petroleum and Transport Industry. As such, Tourism Department in Mizoram is also one of the fastest growing Departments in Mizoram. Promotion of Tourism in the State is the main function of the Department. The Department has achieved these objectives by constructing Tourist Lodge, Tourist Resort and other Tourist amenities in difference places of Mizoram through liberal financing of Ministry of Tourism, Government of India. As such, the Department has completed the following projects during 11th Five Year Plan. Name of Projects Govt.of India
Sanction Amount 1. Southern Tourist Circuit Phase II (6 units) Rs.706.67 lakhs 2. Tourist Destination Sakawrdai (4 units) Rs.472.07 lakhs 3. Tourist Destination Kanhmun (4 units) Rs.499.20 lakhs 4. Aerosport Rs.298.38 lakhs At present, the Department operates 39 Tourist Lodges with 364 rooms and 782 beds all over Mizoram. The year wise Revenue receive with number of Tourist Arrival recorded from the operation of these units during the last five years are as below :- Number of Tourist Arrived and Amount of Revenue collected
The Department has on going project during the current Five Year Plan as mentioned below :- Name of the Projects Govt.of India Sanction Amount 1. Tourist Destination Chakhang Rs.203.56 lakhs 2. Tourist Destination Niawhtlang Rs.203.56 lakhs 3. Convention Centre at Berawtlang Rs.467.71 lakhs 4. Tourist Destination Chawngte Rs.388.47 lakhs 5. Tourist Destination Palak Rs.437.75 lakhs 6. Tourist Circuit Maubawk – Chakheitla Rs.694.88 lakhs 7. Tourist Lodge Serchhip Rs.172.02 lakhs
Year No. of Tourists Revenue Collected
Domestic Foreign 2008-09 56793 842 110.lakhs 2009-10 57639 675 123.51lakhs 2010-11 57623 619 148.15lakhs 2011-12
53512
744
153.64 lakhs
2012-13 48416uptoDec’12 511uptoDec‘12
145.40 lakhs
Total :- 273983 3391 680.70 lakhs

Economic Survey Mizoram 2013-14 ~ 91 ~ Tourism
Economic Survey Mizoram 2013-14
8. Serlui ‘B’ Lake Destination Rs.384.39 lakhs 9. Tourist Destination Aizawl ( units) Rs.457.61 lakhs 10.Tourist Lodge Khawzawl Rs.337.47 lakhs 11.Tourist Destination Demagri Rs.484.63 lakhs In the field of Human Resource Development the Ministry of Tourism has accorded Financial sanction to tune of Rs.10.00 crores for setting up of Institute of Hotel Management at Aizawl. Society for this institute has been formed and 75% of construction of work is now completed. This institute will conduct Degree Course as well as Diploma Course. It is expected that this Institute will be beneficial to the Youth of Mizoram. As a part of publicity campaign, the Department organized 3 festival in a year i.e. Chapchar Kut in March, Thalfavang Kut in November to December and Anthurium Festival in September through the financial assistance of Ministry of Tourism, Government of India. These festivals are attraction for potential tourists and the response has been encouraging.
….
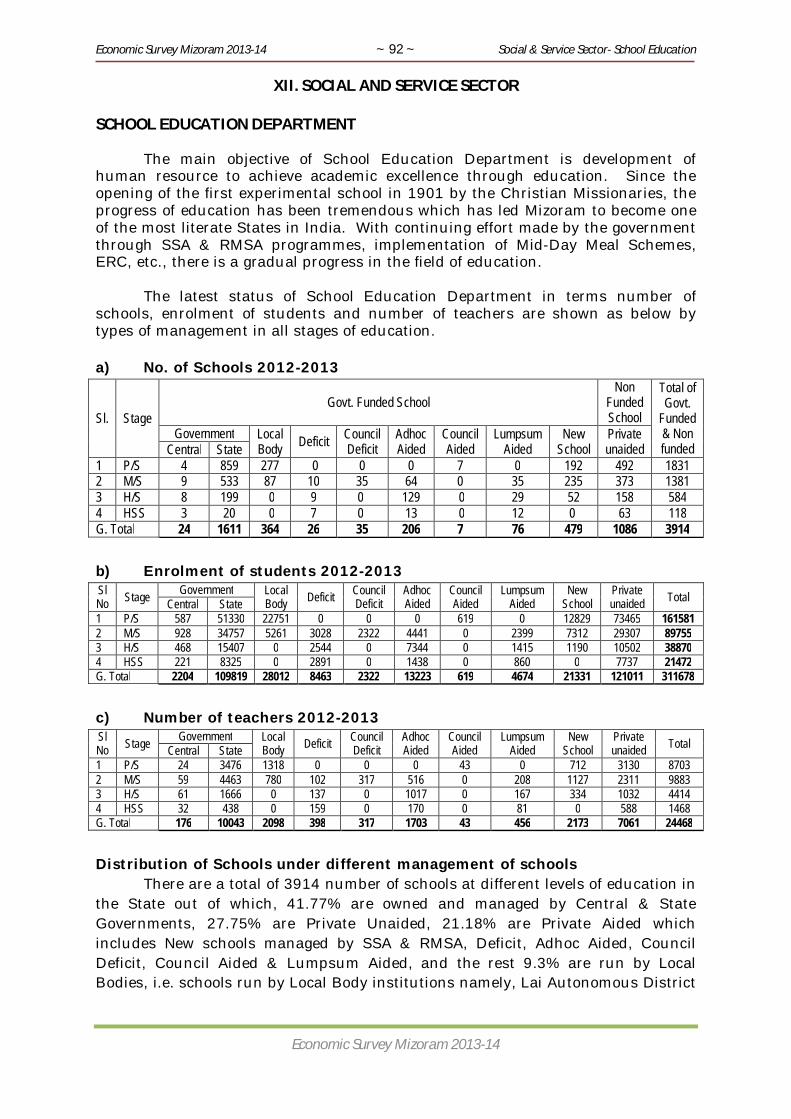
Economic Survey Mizoram 2013-14 ~ 92 ~ Social & Service Sector- School Education
Economic Survey Mizoram 2013-14
XII. SOCIAL AND SERVICE SECTOR SCHOOL EDUCATION DEPARTMENT
The main objective of School Education Department is development of human resource to achieve academic excellence through education. Since the opening of the first experimental school in 1901 by the Christian Missionaries, the progress of education has been tremendous which has led Mizoram to become one of the most literate States in India. With continuing effort made by the government through SSA & RMSA programmes, implementation of Mid-Day Meal Schemes, ERC, etc., there is a gradual progress in the field of education. The latest status of School Education Department in terms number of schools, enrolment of students and number of teachers are shown as below by types of management in all stages of education. a) No. of Schools 2012-2013
Sl. Stage Govt. Funded School
Non Funded School
Total of Govt.
Funded & Non funded
Government Local Body Deficit Council
Deficit Adhoc Aided
Council Aided
Lumpsum Aided
New School
Private unaided Central State
1 P/S 4 859 277 0 0 0 7 0 192 492 1831 2 M/S 9 533 87 10 35 64 0 35 235 373 1381 3 H/S 8 199 0 9 0 129 0 29 52 158 584 4 HSS 3 20 0 7 0 13 0 12 0 63 118 G. Total 24 1611 364 26 35 206 7 76 479 1086 3914 b) Enrolment of students 2012-2013 Sl No Stage Government Local
Body Deficit Council Deficit
Adhoc Aided
Council Aided
Lumpsum Aided
New School
Private unaided Total Central State
1 P/S 587 51330 22751 0 0 0 619 0 12829 73465 161581 2 M/S 928 34757 5261 3028 2322 4441 0 2399 7312 29307 89755 3 H/S 468 15407 0 2544 0 7344 0 1415 1190 10502 38870 4 HSS 221 8325 0 2891 0 1438 0 860 0 7737 21472 G. Total 2204 109819 28012 8463 2322 13223 619 4674 21331 121011 311678 c) Number of teachers 2012-2013 Sl No Stage Government Local
Body Deficit Council Deficit
Adhoc Aided
Council Aided
Lumpsum Aided
New School
Private unaided Total Central State
1 P/S 24 3476 1318 0 0 0 43 0 712 3130 8703 2 M/S 59 4463 780 102 317 516 0 208 1127 2311 9883 3 H/S 61 1666 0 137 0 1017 0 167 334 1032 4414 4 HSS 32 438 0 159 0 170 0 81 0 588 1468 G. Total 176 10043 2098 398 317 1703 43 456 2173 7061 24468 Distribution of Schools under different management of schools There are a total of 3914 number of schools at different levels of education in the State out of which, 41.77% are owned and managed by Central & State Governments, 27.75% are Private Unaided, 21.18% are Private Aided which includes New schools managed by SSA & RMSA, Deficit, Adhoc Aided, Council Deficit, Council Aided & Lumpsum Aided, and the rest 9.3% are run by Local Bodies, i.e. schools run by Local Body institutions namely, Lai Autonomous District
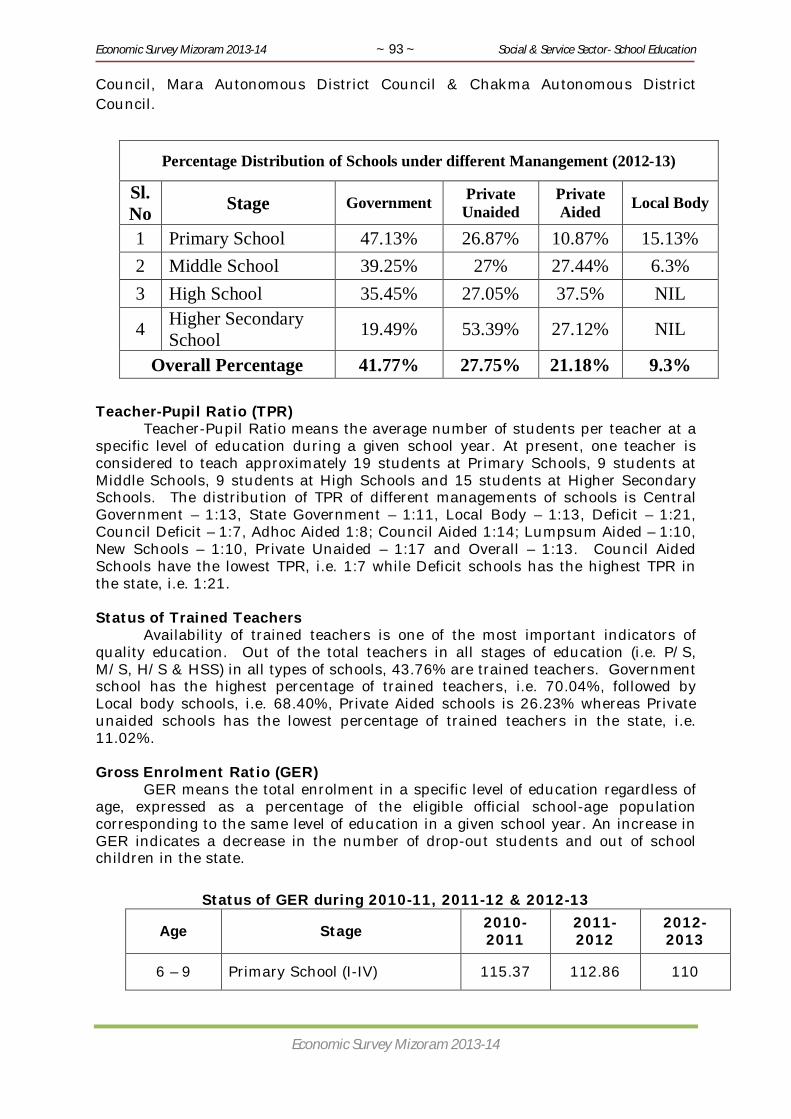
Economic Survey Mizoram 2013-14 ~ 93 ~ Social & Service Sector- School Education
Economic Survey Mizoram 2013-14
Council, Mara Autonomous District Council & Chakma Autonomous District Council.
Percentage Distribution of Schools under different Manangement (2012-13)
Sl. No Stage Government Private
Unaided Private Aided Local Body
1 Primary School 47.13% 26.87% 10.87% 15.13% 2 Middle School 39.25% 27% 27.44% 6.3% 3 High School 35.45% 27.05% 37.5% NIL
4 Higher Secondary School 19.49% 53.39% 27.12% NIL
Overall Percentage 41.77% 27.75% 21.18% 9.3% Teacher-Pupil Ratio (TPR)
Teacher-Pupil Ratio means the average number of students per teacher at a specific level of education during a given school year. At present, one teacher is considered to teach approximately 19 students at Primary Schools, 9 students at Middle Schools, 9 students at High Schools and 15 students at Higher Secondary Schools. The distribution of TPR of different managements of schools is Central Government – 1:13, State Government – 1:11, Local Body – 1:13, Deficit – 1:21, Council Deficit – 1:7, Adhoc Aided 1:8; Council Aided 1:14; Lumpsum Aided – 1:10, New Schools – 1:10, Private Unaided – 1:17 and Overall – 1:13. Council Aided Schools have the lowest TPR, i.e. 1:7 while Deficit schools has the highest TPR in the state, i.e. 1:21.
Status of Trained Teachers Availability of trained teachers is one of the most important indicators of quality education. Out of the total teachers in all stages of education (i.e. P/S, M/S, H/S & HSS) in all types of schools, 43.76% are trained teachers. Government school has the highest percentage of trained teachers, i.e. 70.04%, followed by Local body schools, i.e. 68.40%, Private Aided schools is 26.23% whereas Private unaided schools has the lowest percentage of trained teachers in the state, i.e. 11.02%. Gross Enrolment Ratio (GER)
GER means the total enrolment in a specific level of education regardless of age, expressed as a percentage of the eligible official school-age population corresponding to the same level of education in a given school year. An increase in GER indicates a decrease in the number of drop-out students and out of school children in the state.
Status of GER during 2010-11, 2011-12 & 2012-13
Age Stage 2010-2011
2011-2012
2012-2013
6 – 9 Primary School (I-IV) 115.37 112.86 110
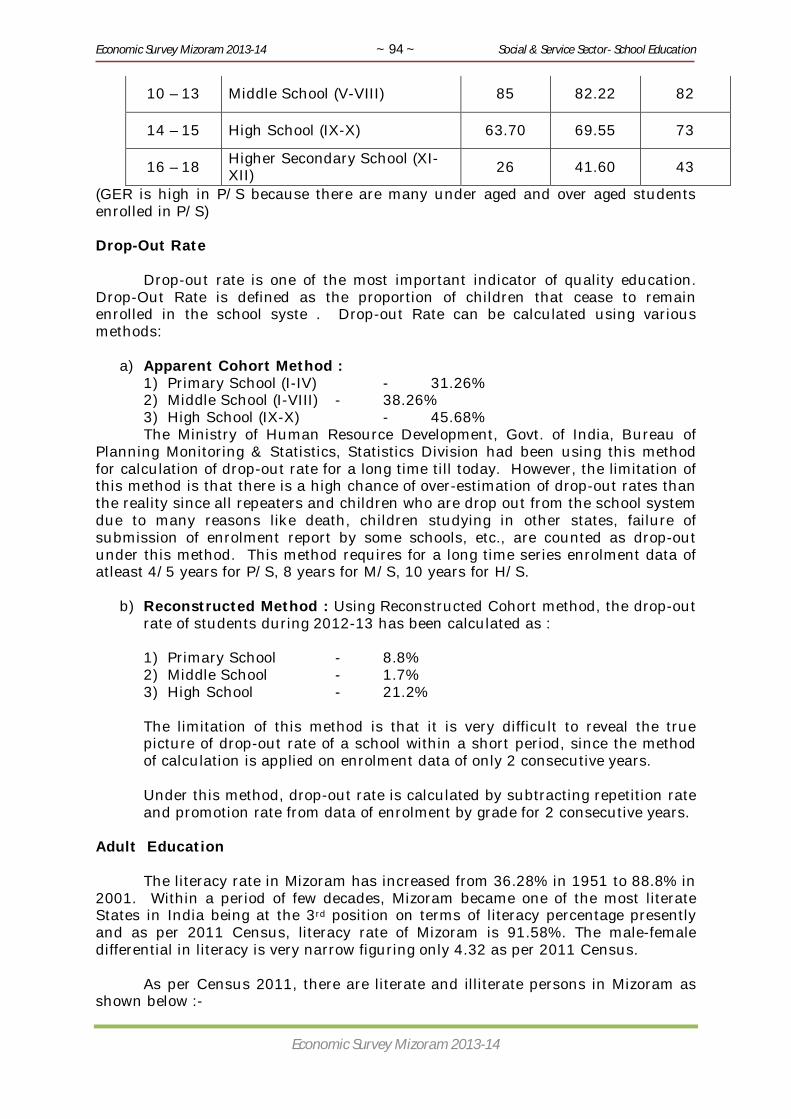
Economic Survey Mizoram 2013-14 ~ 94 ~ Social & Service Sector- School Education
Economic Survey Mizoram 2013-14
10 – 13 Middle School (V-VIII) 85 82.22 82
14 – 15 High School (IX-X) 63.70 69.55 73
16 – 18 Higher Secondary School (XI-XII) 26 41.60 43
(GER is high in P/S because there are many under aged and over aged students enrolled in P/S) Drop-Out Rate Drop-out rate is one of the most important indicator of quality education. Drop-Out Rate is defined as the proportion of children that cease to remain enrolled in the school syste . Drop-out Rate can be calculated using various methods:
a) Apparent Cohort Method : 1) Primary School (I-IV) - 31.26% 2) Middle School (I-VIII) - 38.26% 3) High School (IX-X) - 45.68% The Ministry of Human Resource Development, Govt. of India, Bureau of
Planning Monitoring & Statistics, Statistics Division had been using this method for calculation of drop-out rate for a long time till today. However, the limitation of this method is that there is a high chance of over-estimation of drop-out rates than the reality since all repeaters and children who are drop out from the school system due to many reasons like death, children studying in other states, failure of submission of enrolment report by some schools, etc., are counted as drop-out under this method. This method requires for a long time series enrolment data of atleast 4/5 years for P/S, 8 years for M/S, 10 years for H/S.
b) Reconstructed Method : Using Reconstructed Cohort method, the drop-out
rate of students during 2012-13 has been calculated as : 1) Primary School - 8.8% 2) Middle School - 1.7% 3) High School - 21.2% The limitation of this method is that it is very difficult to reveal the true picture of drop-out rate of a school within a short period, since the method of calculation is applied on enrolment data of only 2 consecutive years. Under this method, drop-out rate is calculated by subtracting repetition rate and promotion rate from data of enrolment by grade for 2 consecutive years.
Adult Education The literacy rate in Mizoram has increased from 36.28% in 1951 to 88.8% in 2001. Within a period of few decades, Mizoram became one of the most literate States in India being at the 3rd position on terms of literacy percentage presently and as per 2011 Census, literacy rate of Mizoram is 91.58%. The male-female differential in literacy is very narrow figuring only 4.32 as per 2011 Census. As per Census 2011, there are literate and illiterate persons in Mizoram as shown below :-

Economic Survey Mizoram 2013-14 ~ 95 ~ Social & Service Sector- School Education
Economic Survey Mizoram 2013-14
MIZORAM POSITION AS PER
2011 CENSUS
LITERATE PERSONS ABOVE 7 YEARS
ILLITERATE PERSONS ABOVE 7 YEARS
Male Female Total Male Female Total 93.72 % 89.40 % 91.58 6.28% 10.60% 8.42% 438949 408643 847592 29425 48461 77886
THE UP-TO-DATE ONGOING LITERACY PROGRAMMES UNDER ADULT EDUCATION 1. Continuing Education programmes : Adult Education Wing, Department of School Education have been running Continuing Education Programmes till date for 40 Nodal Continuing Education Centres (NCECs) and 360 Continuing Education Centres (CECs) in Mizoram since 1998 and Asst. Preraks are engaged and entrusted for eradication by using mopping programme in each Centre. 2. Each-One-Teach-One-Scheme: Each-One-Teach-One-Scheme is still going on to combat thousands of illiterates within Mizoram with special focus areas for Champhai District and Mamit District having target of 600 illiterates during 2012-2013. During 2012-2013 target of 600 illustrate is achieved. For new financial year ie.. 2013-2014 the same target of 600 illiterates is being laid. 3. Special Literacy Drive : Special Literacy Drive within Lunglei District and Lawngtlai District is to be implemented during 12th Five year plan ie., 2012-2017. This drive is started in 2012-2013 having a target of 1000 illiterates. As many as 700 out of 1000 illiterates is achieved during 2012-2013. This is an on-going scheme so the same target of 1000 illiterates is kept again for the next financial year 2013-2014. 4. Social Service Camp and Literacy Campaign : Social Service Camp and Literacy Campaign have been organized annually as awareness campaign among the illiterates and for all other members of the community interested in acquiring knowledge about the importance of literacy for the befitting and fruitful implementation of various Literacy Programmes. Sarva Shiksha Abhiyan (SSA) 550 PS Teachers and 1643 UPS Teachers have been appointed till 2013-14 410 Art Education Instructors and 404 Health & Physical Education Instructors appointed. Free Textbook was distributed to171075 students. 7650 Children with Special Needs (CWSN) were provided Aids and Appliances. Maintenance Grant was distributed to 2237 schools. 11 Residential Hostels are successfully running. 2 sets of uniform was provided to 163393 students. Out of 7362 Out of School Children, 6468 were mainstreamed in age appropriate class through Special Training. Kasturba Gandhi Balika Vidhyalaya (KGBV) One (1) Residential Hostel with capacity of 100 girl child is running in Lungsen Block, Lunglei district.
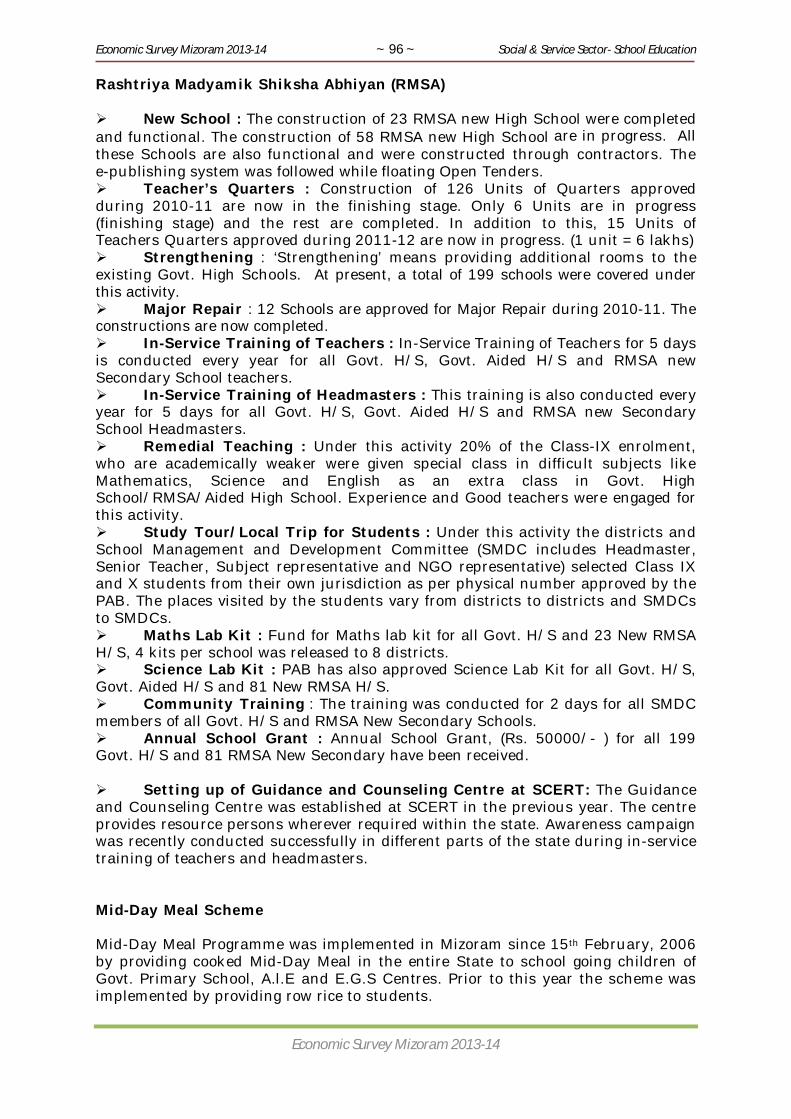
Economic Survey Mizoram 2013-14 ~ 96 ~ Social & Service Sector- School Education
Economic Survey Mizoram 2013-14
Rashtriya Madyamik Shiksha Abhiyan (RMSA) New School : The construction of 23 RMSA new High School were completed and functional. The construction of 58 RMSA new High School are in progress. All these Schools are also functional and were constructed through contractors. The e-publishing system was followed while floating Open Tenders. Teacher’s Quarters : Construction of 126 Units of Quarters approved during 2010-11 are now in the finishing stage. Only 6 Units are in progress (finishing stage) and the rest are completed. In addition to this, 15 Units of Teachers Quarters approved during 2011-12 are now in progress. (1 unit = 6 lakhs) Strengthening : ‘Strengthening’ means providing additional rooms to the existing Govt. High Schools. At present, a total of 199 schools were covered under this activity. Major Repair : 12 Schools are approved for Major Repair during 2010-11. The constructions are now completed. In-Service Training of Teachers : In-Service Training of Teachers for 5 days is conducted every year for all Govt. H/S, Govt. Aided H/S and RMSA new Secondary School teachers. In-Service Training of Headmasters : This training is also conducted every year for 5 days for all Govt. H/S, Govt. Aided H/S and RMSA new Secondary School Headmasters. Remedial Teaching : Under this activity 20% of the Class-IX enrolment, who are academically weaker were given special class in difficult subjects like Mathematics, Science and English as an extra class in Govt. High School/RMSA/Aided High School. Experience and Good teachers were engaged for this activity. Study Tour/Local Trip for Students : Under this activity the districts and School Management and Development Committee (SMDC includes Headmaster, Senior Teacher, Subject representative and NGO representative) selected Class IX and X students from their own jurisdiction as per physical number approved by the PAB. The places visited by the students vary from districts to districts and SMDCs to SMDCs. Maths Lab Kit : Fund for Maths lab kit for all Govt. H/S and 23 New RMSA H/S, 4 kits per school was released to 8 districts. Science Lab Kit : PAB has also approved Science Lab Kit for all Govt. H/S, Govt. Aided H/S and 81 New RMSA H/S. Community Training : The training was conducted for 2 days for all SMDC members of all Govt. H/S and RMSA New Secondary Schools. Annual School Grant : Annual School Grant, (Rs. 50000/- ) for all 199 Govt. H/S and 81 RMSA New Secondary have been received. Setting up of Guidance and Counseling Centre at SCERT: The Guidance and Counseling Centre was established at SCERT in the previous year. The centre provides resource persons wherever required within the state. Awareness campaign was recently conducted successfully in different parts of the state during in-service training of teachers and headmasters. Mid-Day Meal Scheme
Mid-Day Meal Programme was implemented in Mizoram since 15th February, 2006 by providing cooked Mid-Day Meal in the entire State to school going children of Govt. Primary School, A.l.E and E.G.S Centres. Prior to this year the scheme was implemented by providing row rice to students.

Economic Survey Mizoram 2013-14 ~ 97 ~ Social & Service Sector- School Education
Economic Survey Mizoram 2013-14
The scheme has a good impact to the students also parents of students who are indirectly the beneficiary of the scheme in the sense that they can work freely without having to worry about their children's lunch. It is popularly known to common people in the State and very much welcome. Its impact may be stated as the increase in enrolment, retention and increase average attendance rate and reduce drop-out students etc. The main objectives of the scheme are – improving the nutritional status of children, increasing and encouraging, retaining and reducing drop-out students. Mid-Day Meal Programme was also implemented in Educationally Backward Block of Lungsen in Lunglei District from 15th October, 2007 and was officially launched on 7th December, 2007 by Shri Lalmalsawma, lAS, Finance & Planning Commissioner, Govt. of Mizoram. Shri Arvin Suri, Director (MDM), Ministry of Human Resource Development, Govt. of India, also grace the occasion. Since 1st August 2009 Mid-Day Meal was implemented in Govt. Middle Schools and SSA assisted schools all over the state. The scheme covered Class Vlll from the academic session of 2011-2012.
During 2013-14, as many as 123971 Primary (Class-1–V) and 50547 Upper Primary (Class VI-VIII) students avail Mid-day Meal in every schooling day and Cook-cum-helper engaged under Mid-Day Meal Scheme in Mizoram stands at 3174 for Primary and 2115 for Upper Primary. EDUCATION REFORMS COMMISSION (ERC)
In order to reform the system of education, Government of Mizoram set up the Education Reforms Commission, Mizoram (ERCM) to recommend ways and means to raise standard of education and improvement of quality. The commission’s terms of reference were wide ranging, covering all sectors of education, namely – pre-school, elementary, secondary, higher and professional education. A wide spectrum of issues including quality of education in relation to academic achievement of students and performance level of schools, drastic reduction of drop-out rate, development of skills for wage and self-employment through vocationalization of education, rejuvenating curriculum reform progress, language development, education in universal human values, overhauling the system of governance, have been reflected upon in the report of the Commission. The very setting up of this Commission is a pointer to the expectations the State has from the reformed system of education in the State. Mizoram is the one State in the Country which can be legitimately credited with this pioneering decision. The Commission also visited institutions to have an actual feel of the ground realities. This included Mizoram University, Colleges of General Education, Teachers’ Education Institutions, Polytechnics, Industrial Training Institute, SCERT, MBSE and different categories of schools. It studied relevant Acts, Government Notifications, Policy Documents, Reports of Committees and Research Reports. On the basis of its understanding on issue and concerns of education and the possible reform strategies, the Commission has prepared its Report which consist of 15 chapters, including a consolidated summary of recommendations. The Government of Mizoram constituted Group of Experts which comprises of Chairman, Secretary and 3 members on 24th September, 2010 to –

Economic Survey Mizoram 2013-14 ~ 98 ~ Social & Service Sector- School Education
Economic Survey Mizoram 2013-14
1) Scrutinize and make recommendation to the Government from the report of the Education Reforms Commission. 2) Determine those actions which are necessary to be taken up on priority basis from the recommendation of the Education Reforms Commission. 3) Prepare road map for implementation of the report of the Education Reforms Commission. The Group of Experts have submitted the report to the Chief Minister on 28th February, 2011. After the expiry of the term of the Group of Expert, Task Force was then constituted to take follow up action on the report of Group of Expert on priority basis. The Task force then formed 5 (Five) Working Groups entrusted to have a close study of various issues as follows : 1. Working Group No – I. - To study viability of small schools and school mapping. 2. Working Group No – II. - To examine the feasibility of creating common cadre for SCERT and DIET. 3. Working Group No – III. - To study problems relating to under-qualified teachers. 4. Working Group No – IV. - To prepare Draft Code of Professional Ethics for teachers. 5. Working Group No – V. - To study the feasibility of constituting the Mizoram Education Service. After all the Working Groups submitted their reports to the Task Force, the Task Force discussed and examine all the reports and submitted to the Government (School Education Department). At present, the Government in the School Education Department is considering the reports and takes necessary action to materialised the reports.
……

Economic Survey Mizoram 2013-14 ~ 99 ~ Social & Service Sector- Health & Medical
Economic Survey Mizoram 2013-14
HEALTH & MEDICAL
Hospital & Medical Education
A. INRODUCTION: The Directorate of Hospital & Medical Education is one of the two wings of Health & Family Welfare Department with a separate budget since 2006-2007. Since its inception, the department is functioning to look after various Hospitals of Mizoram including Mizoram College of Nursing, Regional Cancer Centre (Cancer Hospital), Zemabawk and Nursing School, Lunglei as indicated below for ensuring good health care to the people of Mizoram. Sub-Ordinate Offices under Directorate of Hospital & Medical Education.
1. Civil Hospital, Aizawl 2. Civil Hospital, Lunglei 3. District Hospital, Saiha 4. District Hospital, Kolasib 5. Jawahar Lal Nehru Memorial Hospital, Serchhip 6. District Hospital, Champhai 7. District Hospital, Lawngtlai 8. District Hospital, Mamit 9. Kulikawn Hospital, Aizawl 10. Referral Hospital, Falkawn 11. Mizoram College of Nursing, Aizawl 12. School of Nursing, Lunglei 13. Mizoram State Cancer Institute (Cancer Hospital/RCC) Zemabawk
In order to offer good health care to the people of Mizoram, the department has initiated steps for building good infrastructures, diagnostic equipment as well as increase in manpower. Steps are also taken to avoid large no. of patients being referred outside the State for investigations and treatment as heavy financial loss is incurred to the Government exchequer. The various Hospitals are being well equipped with machineries and diagnostic equipments. With the increasing incidence of Cancer cases detected in the State of Mizoram, various steps have been undertaken to reduce the morbidity and mortality due to this dreaded disease High-tech additional equipments and being proceed manpower so as to provide a more comprehensive treatment modality to cancer patients that result in increase survival of patients a long with better quality of life post cancer. The Department has also been making effort to achieve various programmes like (National Programme for Prevention & Control of Cancer, Diabetes, Cardiovascular Diseases & Stroke) NPCDCS, Tobacco Control Programme, Oral Health Programme and Mental Health Programme, National Programme for Health Care of the Elderly, National Programme for prevention and Control of Deafness.
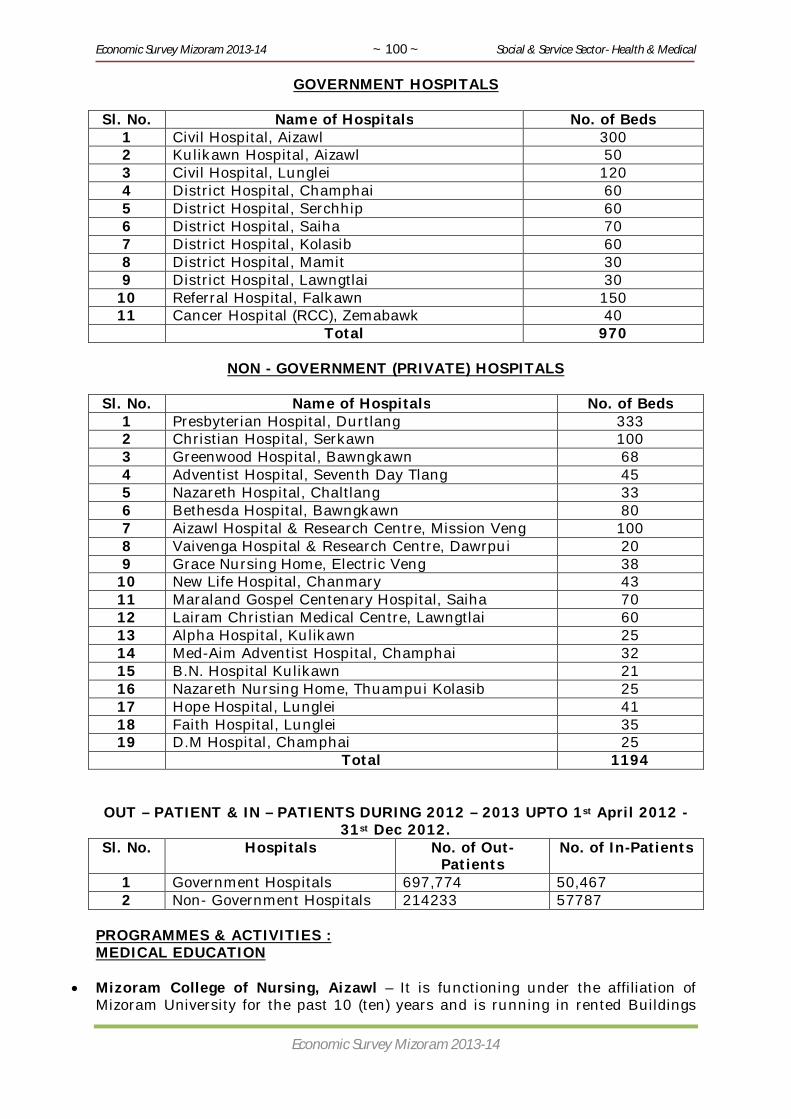
Economic Survey Mizoram 2013-14 ~ 100 ~ Social & Service Sector- Health & Medical
Economic Survey Mizoram 2013-14
GOVERNMENT HOSPITALS
Sl. No. Name of Hospitals No. of Beds 1 Civil Hospital, Aizawl 300 2 Kulikawn Hospital, Aizawl 50 3 Civil Hospital, Lunglei 120 4 District Hospital, Champhai 60 5 District Hospital, Serchhip 60 6 District Hospital, Saiha 70 7 District Hospital, Kolasib 60 8 District Hospital, Mamit 30 9 District Hospital, Lawngtlai 30
10 Referral Hospital, Falkawn 150 11 Cancer Hospital (RCC), Zemabawk 40
Total 970
NON - GOVERNMENT (PRIVATE) HOSPITALS
Sl. No. Name of Hospitals No. of Beds 1 Presbyterian Hospital, Durtlang 333 2 Christian Hospital, Serkawn 100 3 Greenwood Hospital, Bawngkawn 68 4 Adventist Hospital, Seventh Day Tlang 45 5 Nazareth Hospital, Chaltlang 33 6 Bethesda Hospital, Bawngkawn 80 7 Aizawl Hospital & Research Centre, Mission Veng 100 8 Vaivenga Hospital & Research Centre, Dawrpui 20 9 Grace Nursing Home, Electric Veng 38
10 New Life Hospital, Chanmary 43 11 Maraland Gospel Centenary Hospital, Saiha 70 12 Lairam Christian Medical Centre, Lawngtlai 60 13 Alpha Hospital, Kulikawn 25 14 Med-Aim Adventist Hospital, Champhai 32 15 B.N. Hospital Kulikawn 21 16 Nazareth Nursing Home, Thuampui Kolasib 25 17 Hope Hospital, Lunglei 41 18 Faith Hospital, Lunglei 35 19 D.M Hospital, Champhai 25
Total 1194
OUT – PATIENT & IN – PATIENTS DURING 2012 – 2013 UPTO 1st April 2012 - 31st Dec 2012.
Sl. No. Hospitals No. of Out-Patients
No. of In-Patients
1 Government Hospitals 697,774 50,467 2 Non- Government Hospitals 214233 57787
PROGRAMMES & ACTIVITIES : MEDICAL EDUCATION
Mizoram College of Nursing, Aizawl – It is functioning under the affiliation of Mizoram University for the past 10 (ten) years and is running in rented Buildings
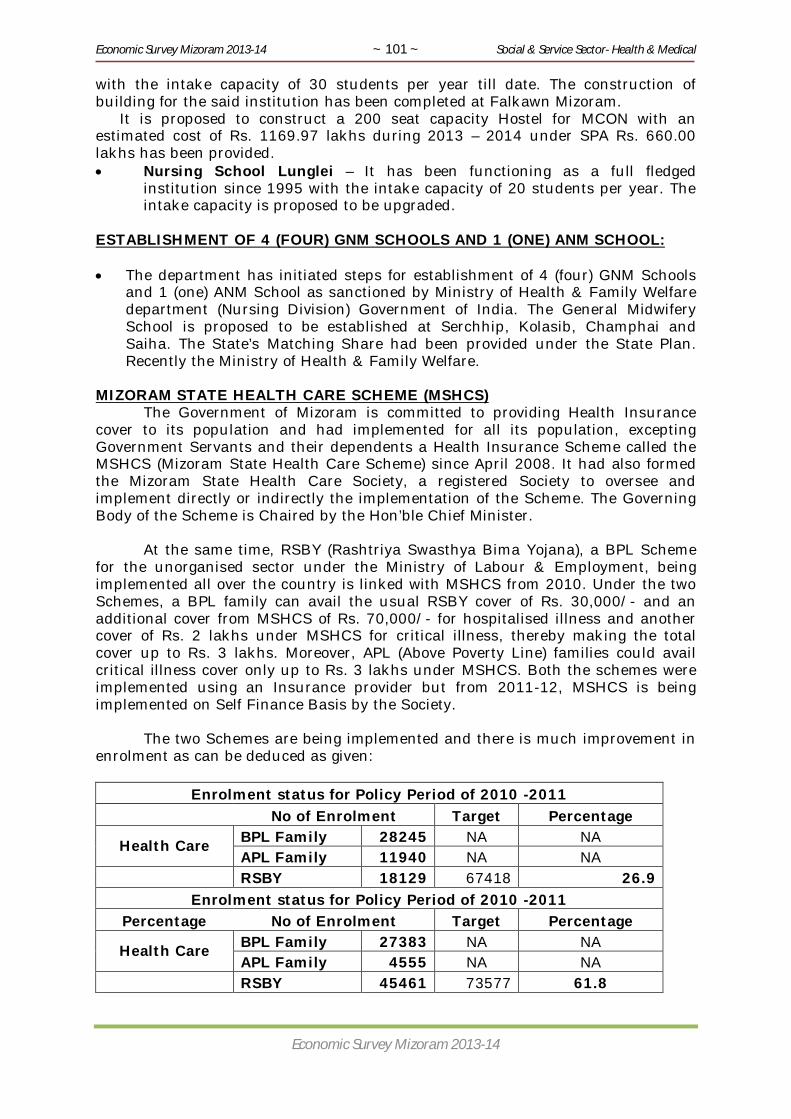
Economic Survey Mizoram 2013-14 ~ 101 ~ Social & Service Sector- Health & Medical
Economic Survey Mizoram 2013-14
with the intake capacity of 30 students per year till date. The construction of building for the said institution has been completed at Falkawn Mizoram.
It is proposed to construct a 200 seat capacity Hostel for MCON with an estimated cost of Rs. 1169.97 lakhs during 2013 – 2014 under SPA Rs. 660.00 lakhs has been provided. Nursing School Lunglei – It has been functioning as a full fledged
institution since 1995 with the intake capacity of 20 students per year. The intake capacity is proposed to be upgraded.
ESTABLISHMENT OF 4 (FOUR) GNM SCHOOLS AND 1 (ONE) ANM SCHOOL: The department has initiated steps for establishment of 4 (four) GNM Schools
and 1 (one) ANM School as sanctioned by Ministry of Health & Family Welfare department (Nursing Division) Government of India. The General Midwifery School is proposed to be established at Serchhip, Kolasib, Champhai and Saiha. The State’s Matching Share had been provided under the State Plan. Recently the Ministry of Health & Family Welfare.
MIZORAM STATE HEALTH CARE SCHEME (MSHCS)
The Government of Mizoram is committed to providing Health Insurance cover to its population and had implemented for all its population, excepting Government Servants and their dependents a Health Insurance Scheme called the MSHCS (Mizoram State Health Care Scheme) since April 2008. It had also formed the Mizoram State Health Care Society, a registered Society to oversee and implement directly or indirectly the implementation of the Scheme. The Governing Body of the Scheme is Chaired by the Hon’ble Chief Minister. At the same time, RSBY (Rashtriya Swasthya Bima Yojana), a BPL Scheme for the unorganised sector under the Ministry of Labour & Employment, being implemented all over the country is linked with MSHCS from 2010. Under the two Schemes, a BPL family can avail the usual RSBY cover of Rs. 30,000/- and an additional cover from MSHCS of Rs. 70,000/- for hospitalised illness and another cover of Rs. 2 lakhs under MSHCS for critical illness, thereby making the total cover up to Rs. 3 lakhs. Moreover, APL (Above Poverty Line) families could avail critical illness cover only up to Rs. 3 lakhs under MSHCS. Both the schemes were implemented using an Insurance provider but from 2011-12, MSHCS is being implemented on Self Finance Basis by the Society.
The two Schemes are being implemented and there is much improvement in enrolment as can be deduced as given:
Enrolment status for Policy Period of 2010 -2011 No of Enrolment Target Percentage
Health Care BPL Family 28245 NA NA APL Family 11940 NA NA
RSBY 18129 67418 26.9 Enrolment status for Policy Period of 2010 -2011
Percentage No of Enrolment Target Percentage
Health Care BPL Family 27383 NA NA APL Family 4555 NA NA
RSBY 45461 73577 61.8
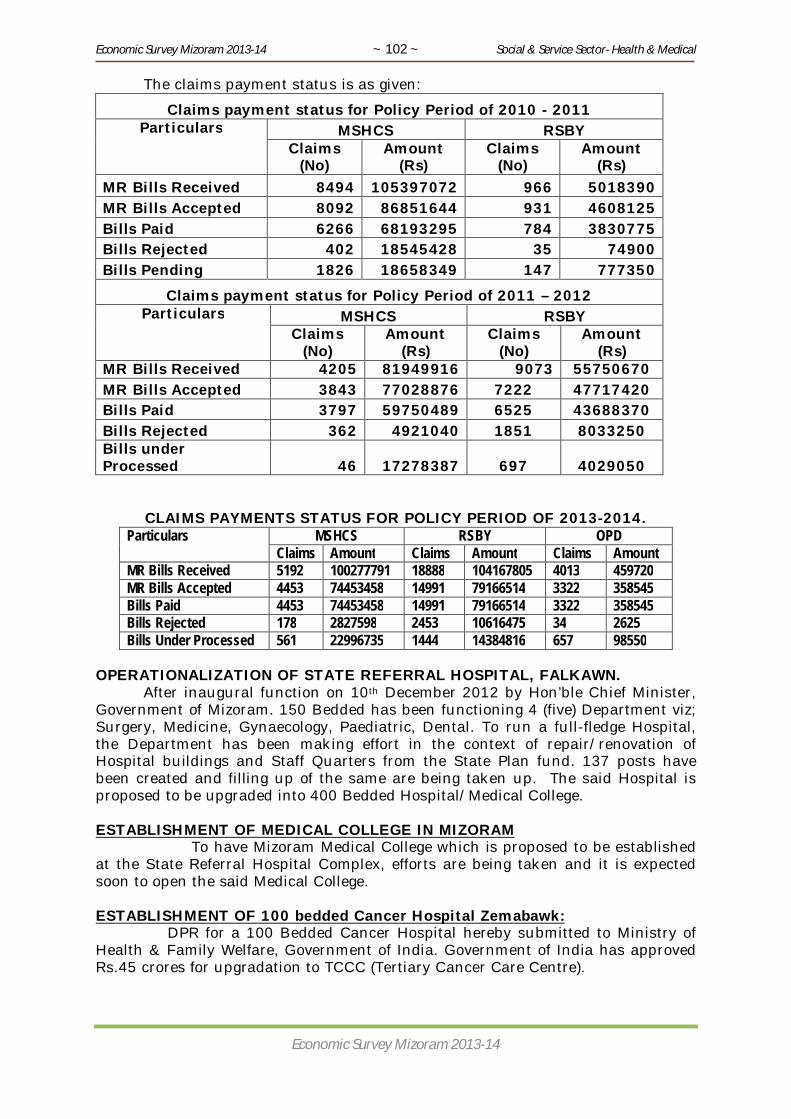
Economic Survey Mizoram 2013-14 ~ 102 ~ Social & Service Sector- Health & Medical
Economic Survey Mizoram 2013-14
The claims payment status is as given:
Claims payment status for Policy Period of 2010 - 2011 Particulars MSHCS RSBY
Claims (No)
Amount (Rs)
Claims (No)
Amount (Rs)
MR Bills Received 8494 105397072 966 5018390 MR Bills Accepted 8092 86851644 931 4608125 Bills Paid 6266 68193295 784 3830775 Bills Rejected 402 18545428 35 74900 Bills Pending 1826 18658349 147 777350
Claims payment status for Policy Period of 2011 – 2012 Particulars MSHCS RSBY
Claims (No)
Amount (Rs)
Claims (No)
Amount (Rs)
MR Bills Received 4205 81949916 9073 55750670 MR Bills Accepted 3843 77028876 7222 47717420 Bills Paid 3797 59750489 6525 43688370 Bills Rejected 362 4921040 1851 8033250 Bills under Processed 46 17278387 697 4029050
CLAIMS PAYMENTS STATUS FOR POLICY PERIOD OF 2013-2014. Particulars MSHCS RSBY OPD
Claims Amount Claims Amount Claims Amount MR Bills Received 5192 100277791 18888 104167805 4013 459720 MR Bills Accepted 4453 74453458 14991 79166514 3322 358545 Bills Paid 4453 74453458 14991 79166514 3322 358545 Bills Rejected 178 2827598 2453 10616475 34 2625 Bills Under Processed 561 22996735 1444 14384816 657 98550
OPERATIONALIZATION OF STATE REFERRAL HOSPITAL, FALKAWN.
After inaugural function on 10th December 2012 by Hon’ble Chief Minister, Government of Mizoram. 150 Bedded has been functioning 4 (five) Department viz; Surgery, Medicine, Gynaecology, Paediatric, Dental. To run a full-fledge Hospital, the Department has been making effort in the context of repair/renovation of Hospital buildings and Staff Quarters from the State Plan fund. 137 posts have been created and filling up of the same are being taken up. The said Hospital is proposed to be upgraded into 400 Bedded Hospital/Medical College. ESTABLISHMENT OF MEDICAL COLLEGE IN MIZORAM To have Mizoram Medical College which is proposed to be established at the State Referral Hospital Complex, efforts are being taken and it is expected soon to open the said Medical College. ESTABLISHMENT OF 100 bedded Cancer Hospital Zemabawk:
DPR for a 100 Bedded Cancer Hospital hereby submitted to Ministry of Health & Family Welfare, Government of India. Government of India has approved Rs.45 crores for upgradation to TCCC (Tertiary Cancer Care Centre).

Economic Survey Mizoram 2013-14 ~ 103 ~ Social & Service Sector- Health & Medical
Economic Survey Mizoram 2013-14
UPGRADATION OF CIVIL HOSPITAL AIZAWL
With the approved cost of Rs. 54.23 crores from Government of India, Rs. 10.00 crores has been released for the 1st installment under NRHM – flexi pool fund, the fund is meant for reconstruction of Staff Quarters, Gyneacology Block, Vertical Extension of OPD Block, Radiology and Imaging Department, Demolition of old buildings and staff quarters have been completed and the construction work is also being undertaken. Gynecology building has been completed. Additional Rs.5 crores have also been released by Government of India recently under National Health Mission flexi pool.
UPGRADATION OF DISTRICT HOSPITAL, CHAMPHAI:
With approved estimated cost of Rs.26.43 crores from Government of India under NRHM, flexi-pool fund. Works about 80% of the projects has been completed. WATER SUPPLY & POWER SUPPLY TO THE HOSPITALS :
In order to have sufficient clean and safe water supply installation of water treatment plants at referral Hospital, Falkawn, District Hospital, Lawngtlai, Champhai and Mamit is being undertaken on BOOT Basis (Build Own Operate and Transfer) by Intergen Energy Limited. The State’s contribution toward the said scheme had been provided under the State Plan. ISO 9000 – 2008 CERTIFICATION
The only Government Hospital in North Eastern Region and third in India so far, Civil Hospital Aizawl has been awarded a prestigious Certificate by IMAX – Gurgaon (Government of India undertaking).
SOLAR POWER PLANT AT VARIOUS HOSPITALS :
In order to have good back up power for Hospitals, the Solar Power Plants along with batteries – 100 Kwp each have been installed at the Hospitals noted below Ministry of New & Renewable Energy, Government of India, has funded the project.
1. State Referral Hospital, Falkawn. 2. District Hospital, Champhai. 3. District Hospital, Serchhip. 4. District Hospital, Lawngtlai 5. District Hospital, Mamit.
SHIFTING OF INCINERATOR:
As per recommended by the Public Accounts Committee, Mizoram, the Incinerator, Hauruang Village has been shifted to the Civil Hospital Complex, Lunglei under the State Plan. Under DoNER Ministry : (a) Upgradation of District Hospital, Saiha – The Ministry of DoNER,
Government of India conveyed sanction of an amount of Rs. 1592.52 lakhs for upgradation of District Hospital, Saiha to 100 Bed. Necessary actions are being taken by State PWD and the Department for commencement of the said project.
(b) 50 Bedded Lawngtlai Hospital – The Detail Project Report amounting to Rs. 14.53 crores for construction of 50 Bedded Lawngtlai Hospital has been submitted to the DoNER Ministry, Government of India.
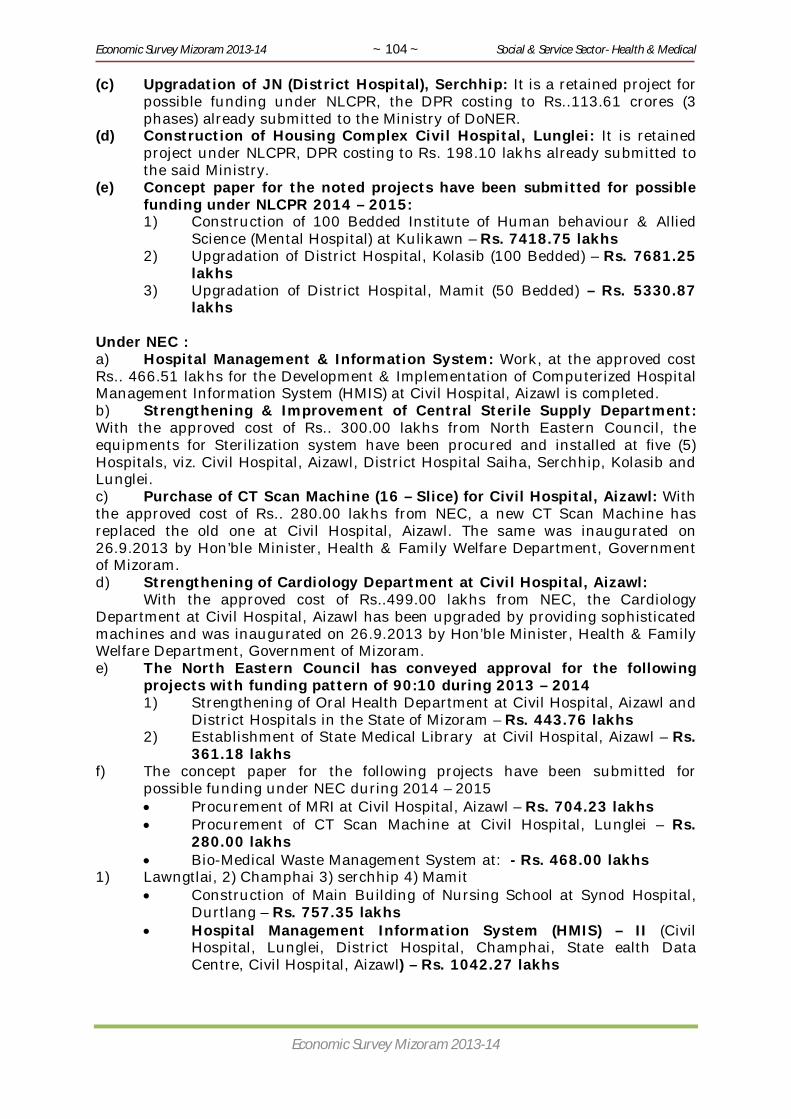
Economic Survey Mizoram 2013-14 ~ 104 ~ Social & Service Sector- Health & Medical
Economic Survey Mizoram 2013-14
(c) Upgradation of JN (District Hospital), Serchhip: It is a retained project for possible funding under NLCPR, the DPR costing to Rs..113.61 crores (3 phases) already submitted to the Ministry of DoNER.
(d) Construction of Housing Complex Civil Hospital, Lunglei: It is retained project under NLCPR, DPR costing to Rs. 198.10 lakhs already submitted to the said Ministry.
(e) Concept paper for the noted projects have been submitted for possible funding under NLCPR 2014 – 2015: 1) Construction of 100 Bedded Institute of Human behaviour & Allied
Science (Mental Hospital) at Kulikawn – Rs. 7418.75 lakhs 2) Upgradation of District Hospital, Kolasib (100 Bedded) – Rs. 7681.25
lakhs 3) Upgradation of District Hospital, Mamit (50 Bedded) – Rs. 5330.87
lakhs Under NEC : a) Hospital Management & Information System: Work, at the approved cost Rs.. 466.51 lakhs for the Development & Implementation of Computerized Hospital Management Information System (HMIS) at Civil Hospital, Aizawl is completed. b) Strengthening & Improvement of Central Sterile Supply Department: With the approved cost of Rs.. 300.00 lakhs from North Eastern Council, the equipments for Sterilization system have been procured and installed at five (5) Hospitals, viz. Civil Hospital, Aizawl, District Hospital Saiha, Serchhip, Kolasib and Lunglei. c) Purchase of CT Scan Machine (16 – Slice) for Civil Hospital, Aizawl: With the approved cost of Rs.. 280.00 lakhs from NEC, a new CT Scan Machine has replaced the old one at Civil Hospital, Aizawl. The same was inaugurated on 26.9.2013 by Hon’ble Minister, Health & Family Welfare Department, Government of Mizoram. d) Strengthening of Cardiology Department at Civil Hospital, Aizawl:
With the approved cost of Rs..499.00 lakhs from NEC, the Cardiology Department at Civil Hospital, Aizawl has been upgraded by providing sophisticated machines and was inaugurated on 26.9.2013 by Hon’ble Minister, Health & Family Welfare Department, Government of Mizoram. e) The North Eastern Council has conveyed approval for the following
projects with funding pattern of 90:10 during 2013 – 2014 1) Strengthening of Oral Health Department at Civil Hospital, Aizawl and
District Hospitals in the State of Mizoram – Rs. 443.76 lakhs 2) Establishment of State Medical Library at Civil Hospital, Aizawl – Rs.
361.18 lakhs f) The concept paper for the following projects have been submitted for
possible funding under NEC during 2014 – 2015 Procurement of MRI at Civil Hospital, Aizawl – Rs. 704.23 lakhs Procurement of CT Scan Machine at Civil Hospital, Lunglei – Rs.
280.00 lakhs Bio-Medical Waste Management System at: - Rs. 468.00 lakhs
1) Lawngtlai, 2) Champhai 3) serchhip 4) Mamit Construction of Main Building of Nursing School at Synod Hospital,
Durtlang – Rs. 757.35 lakhs Hospital Management Information System (HMIS) – II (Civil
Hospital, Lunglei, District Hospital, Champhai, State ealth Data Centre, Civil Hospital, Aizawl) – Rs. 1042.27 lakhs

Economic Survey Mizoram 2013-14 ~ 105 ~ Social & Service Sector- Health & Medical
Economic Survey Mizoram 2013-14
UNDER MINISTRY OF H&FW, GOVERNMENT OF INDIA 1. National Programme for Health Care of the Elderly (NPHCE)
The NPHCE is to be implemented in 2 (two) Districts – namely Aizawl & Lunglei. This programme envisages 10 bedded Geriatics Ward at Civil Hospital, Aizawl and Civil Hospital, Lunglei.
2. National Programme for Prevention and Control of Deafness
The NPPCD is to be implemented in 2 (two) Districts – namely Aizawl & Lunglei.
3. National Programme for Prevention & Control of Cancer, Diabetes,
Cardivascular Disease & Stroke NPCDCS to be implemented in 2 (two) Districts – Aizawl & Lunglei
MEDICAL TREATMENT & REFERRAL 1. Empanelled Hospitals outside the State a) Kolkata –
i) BM Birla Heart Research Institute ii) Kothari Medical Centre iii) AMRI Hospital iv) Calcutta medical research Institute v) Apollo Gleneagleas Hospital vi) Chitaranjan National Cancer hospital vii) DESUN Hospital
b) Guwahati –
i) BBCI ii) GNRC Hospital iii) Downtown Hospital iv) International Hospital v) Pratiksha Hospital vi) Arya hospital vii) Sankardeva Netralaya
c) New Delhi –
i) Indian Spinal Injury Centre ii) Indraprathasta Apollo Hospital iii) St. Stephens Hospital iv) Escort Heart Institute & Research Centre v) Sitaram Bhartia Hospital
d) Mumbai – Tata Memorial Hospital e) Shillong – Bethany Hospital f) Vellore – Christian Medical College g) Apollo Hospitals – Chennai & Hyderabad h) Bangalore – Narayana Hrudayalaya Institute of cardiac Science
Total No. of Referred to the Empanneled Hospital Outside the State (1st April
2013 till date) – 2379 Patients. • Empanelled Hospitals within the State

Economic Survey Mizoram 2013-14 ~ 106 ~ Social & Service Sector- Health & Medical
Economic Survey Mizoram 2013-14
Aizawl – 1. Presbyterian Hospital, Durtlang 2. Greenwood Hospital 3. Bethesda Hospital 4. Nazareth Hospital 5. New Life Hospital 6. Grace Nursing Home 7. Vaivenga Hospital & Research Foundation 8. Aizawl Hospital 9. Seventh Day Adventist Hospital, Aizawl 10. Mizoram Health Care Lunglei – 1. Christian Hospital, Serkawn 2. Hope Hospital 3. Faith Hospital Lawngtlai – 1. Lairam Christian Medical Centre Saiha – 1. Maraland Gospel Centenary Hospital Kolasib – Nazareth nursing Home Champhai – DM Hospital, Med. Adventist, Sevenday Hospital. TELE-MEDICINE 1. National Rural Tele-Medicine Network coverage has included Aizawl, Saiha,
Champhai, Lunglei, Mamit, Serchip and Kolasib which is operational with the technicians provided by NESAC, Shillong.
2. Problems due to shortage of specialist Doctors at various Health Centres are reduced to a large extent with Tele-consultations as well as Telephonic consultant.
3. Tata Memorial Institute, Mumbai also offers MOA for the benefit of our cancer patients. This will be even more relevant when a separate Cancer Hospital is set up in the State. In fact, Government of india offers Onco Net in the far flung areas of north east States.
MENTAL HEALTH PROGRAMME
In 1999 – 2000 District Mental Health Programme, Aizawl District was
launched by Government of India with the following Manpower (co-terminus), and the posts mentioned below have been absorbed by Government of Mizoram during 2011 – 2012.
1. Clinical Psychologist 2. Psychiatrist Specialist 3. Trained Social worker 4. Psychiatric Nurse 5. Statistician/Clerk 6. Driver 7. Nursing orderly/attendant 8. Safai Karamchari
Economic Survey Mizoram 2013-14 ~ 107 ~ Social & Service Sector- Health & Medical
Economic Survey Mizoram 2013-14
In 2006 – 2007 Lunglei District Mental health Programme was launched with similar Manpower.
The District Mental Health Programme, Aizawl had been absorbed by the Government of Mizoram.
The District Mental Health Programme – Saiha & Champhai District are proposed to be implemented during 2014-15. STATE ILLNESS ASSISTANCE FUND (SIAF) Introduced in the State since 1998 – 1999. NIAF is released at the 50% of the fund allocated by the State government. The fund is meant for BPL patients on reimbursement basis for specified lists of illness. BPL card Certificate from BDO Certificate from Medical Board Maximum amount payable to the patient is Rs. 1.5 lakhs at a time. PRE-CONCEPTION & PRENATAL DIAGNOSTIC TECHNIQUES
Pre-conception & Pre-Natal Diagnostic Techniques (PC&PNDT) Act 1994 prohibits sex selection and regulates Pre-Natal Diagnostic techniques to prevent their misuse for sex determination leading to female foeticide. This act prohibits sex selection in any form and also bans advertisement relating to sex selection.
The State Government has organized seminars/meeting for implementing
PC & PNDT Act. There are 30 (thirty) nos. of PC & PNDT clinics registered at present.
Registration Fee - Rs. 3000/- every 5 years Renewal Fee - Rs. 15,00/-
Regular inspections of all Ultrasound Machines are carried out for compliance. MIZORAM NURSING COUNCIL
Established in 1991. Looks after nursing education and maintain quality service. Conducts nursing examination except B.Sc Nursing. Affiliated to Indian Nursing Council.
…..
Economic Survey Mizoram 2013-14 ~ 108 ~ Social & Service Sector- Water Supply & Sanitation
Economic Survey Mizoram 2013-14
WATER SUPPLY AND SANITATION Rural Water Supply
Rural Drinking Water Supply are implemented mainly by providing Piped Water Supply using Gravity Flow, Pumping Scheme, Rain Water Harvesting Scheme (RWHS), Hand Pump Tube Well, Improvement of Village Spring Source and Impounding Reservoir, etc. As per Habitation Survey 2003 conducted by PHED, Mizoram and as revalidated by Indian Institute of Public Administration, New Delhi, there are 777 Rural Habitations in Mizoram.
The Government has introduced new guidelines of National Rural Drinking Water Programme (NRDWP) with effect from 1.4.2009 which envisages covering of all rural habitations by 2012. The status of Rural habitations as on 1.4.2011 was as under: 1. Non-Covered (NC) i.e upto 10 lpcd = 0 habitations 2. Partially Covered (PC) i.e above10 lpcd but below 40 lpcd = 188 habitations 3. Fully Covered habitation (FC) i.e above 40 lpcd = 589 habitations
Total = 777 habitations The present status as on 1.4.2012 is as under: 1. Non-Covered (NC) i.e upto 10 lpcd = 0 habitations 2. Partially Covered (PC) i.e above10 lpcd but below 40 lpcd = 66 habitations 3. Fully Covered habitation (FC) i.e above 40 lpcd = 711 habitations
Total = 777 habitations Rural Sanitation (TSC):
Total Sanitation Campaign (TSC) was introduced in 2003-04, the Implementing Department has constructed 79216 nos. of Individual Household Latrines, 3219 nos. of school toilets and 1310 nos. of Anganwadi toilets and 551 nos. of Sanitary complex have been constructed so far. Urban Water Supply: Mizoram is still on its way in achieving the National norms of Water Supply Level (70 lpcd) in Urban Water Supply Programme. Out of 22 towns in Mizoram, 10 towns have been brought under fully covered status (70 lpcd) and 3 towns are non-covered. Water Supply Projects: There are some projects which are being implemented under various sources of funding with a view to bring the towns/ village to fully covered status. They are as follows:-
S. No. Name of Project Approved
cost Programme/ Funded by
1 Greater Lawngtlai Water Supply Scheme 2564.50 DoNER 2 Greater Hnahthial Water Supply Scheme 825.60 DoNER 3 Tuipang Water Supply Scheme 941.13 DoNER 4 Lower Sakawrdai Water Supply Scheme 133.70 DoNER 5 Greater Saitual Water Supply Scheme 2153.00 DoNER 6 Bilkhawthlir Water Supply Scheme 780.47 DoNER 7 W. Phaileng Water Supply Scheme 995.19 DoNER 8 Bairabi Water Supply Scheme 490.37 DoNER 9 S. Khawbung Water Supply Scheme 827.38 DoNER
Economic Survey Mizoram 2013-14 ~ 109 ~ Social & Service Sector- Water Supply & Sanitation
Economic Survey Mizoram 2013-14
10 Greater Aizawl Water Supply Scheme Ph-I 1681.80 JNNURM (UIG)
11 Greater Lunglei Water Supply Scheme 867.00 JNNURM (UIDSSMT)
12 Greater Serchhip Water Supply Scheme 687.60 JNNURM (UIDSSMT)
13 Greater Saiha Water Supply Scheme 2070.20 10% L.S. Grant under Urban Ministry
14 Tlabung Water Supply Scheme 441.00 10% L.S. Grant under Urban Ministry
15 Greater Khawzawl Water Supply Scheme 2497.00 10% L.S. Grant under Urban Ministry (New Scheme)
16 Sangau Water Supply Scheme 484.00 NEC 17 Phuaibuang Water Supply Scheme 391.50 NEC 18 Bualpui ‘NG’ & Lungzarhtum Water Supply
Scheme 493.00 NEC
19 Lengpui Town & Lengpui Airport WSS (Pumping)
458.20 NEC
20 Sangau Water Supply Scheme (Pumping) Ph-II 471.60 NEC (New Scheme)
21 Darlawn Water Supply Scheme (Aug) 485.20 NEC (New Scheme)
Slipped Back Problems: In Mizoram, sources of water becomes lesser day by day and even dries up in various places on account of deforestation of catchment areas and other factors. Many schemes have slipped back due to those reasons. Methods like Rain Water Harvesting, Sustainability approach through Scientific Source finding, Isotope study in catchment for Recharging spring sources are being tried and adopted to solve the ever increasing problem of drying up of water sources.
……

Economic Survey Mizoram 2013-14 ~ 110 ~ Social & Service Sector- Social Welfare
Economic Survey Mizoram 2013-14
SOCIAL WELFARE The details of schemes/works with physical targets and achievements undertaken by Social Welfare Department during 2013 – 2014 is given in the table shown below : 1. STATE PLAN WELFARE OF HANDICAPPED (PLAN) The State Government has started rehabilitating handicapped persons since 1973 to help them make out their living by providing vocational training, stipend, economic rehabilitation, special appliances and pensions.
Name of Schemes/Works Unit
Physical Achievement during 2013 - 2014 as on 31st January 2014
Disability Pension (Plan) Persons 200 Grants to Handicapped Educate unemployed (Plan) Persons 25
Hostel for Handicapped (Plan & Non Plan) Maintenance 2 NPRPD (Plan) Centres 2 Economic Rahabilitation (Plan) Persons 50 Prothetic Aids (Plan) Persons 23 Handicapped trainees stipend & Machine (Plan & Non Plan) Persons 79 nos.
Handicapped student stipend (Non Plan) Persons 680
(j) Various Aids & appliances (Plan) Beneficiaries No fund is provided for purchase of aids
& appliances Government of Mizoram issued Notification for creation of 11 (eleven) posts for the office of the Commissioner for Persons with Disabilities under Social Welfare Department No. B. 13016/35/06 – SWD dt. 15.4.2009.
The Office of the Commissioner for Persons with Disabilities under Social Welfare Department has started functioning with the following staffs as follows :- 1. Assistant Commissioner - On Deputation 2. Research cum Programme Assistant - Contract Basis 3. Assistant - Regular Selection of remaining 8 staffs will be carried out in short time. 2. CHILD WELFARE
Development is the key concern of all the nations. Full development of human resource and efficient utilization is one of the most important resources in the nation building activities. For the fullest development of human resource, its foundation must be laid in the early stages of life. Social Welfare Department is implementing various schemes that caters to the needs of children of different age groups to mould their characters as well as their all round development.

Economic Survey Mizoram 2013-14 ~ 111 ~ Social & Service Sector- Social Welfare
Economic Survey Mizoram 2013-14
Name of Schemes/Works Unit Physical Achievement during 2013 – 2014 as on January 31st 2014
(a) Pre-School for Children (Plan & Non Plan) Centres 10
(b) Creche/Day Care Centre (Plan & Non Plan) Centres 29
(c) State Council for Child Welfare (Plan) Centre 1
(d) Adoption Cell Centre 1
(e) Bal Bhavan (Plan) Persons 700 3. WOMEN WELFARE
To reduce the acute Social & economic problems faced by unfortunate widows, divorces, unmarried mothers and destitute women particularly with minor children to look after, the scheme of socio-economic development programmes have been implemented since 1985 – 1986 with considerable success. (a) Socio-economic Programme for Destitute (Plan) Persons 67
(b) RITC for 25 inmates (Non Plan) Center 1
(c) Women Commission (Plan) Centre 1
(d) Vocational Training Centers (CSS) Centres 5
(e) Protective Home/Reception Centre (Plan) Centre 1
(f) Observation/Remand Home Centres 2
4. WELFARE OF AGED, INFIRM & DESTITUE
The State Government has been implementing the ‘IGNOAP’ by providing Old Age Pension to poor, destitute Older Persons who have attained 60 years and above 55 years in case of physically and mentally handicapped living below poverty line.
To provide shelter, security & protection to older persons above 60 years and having no near relative or supporter, an Old Age Home is run since 1989. (a) Old Aged Home (Non Plan) Home 1 (b) IGNOAPS (ACA) Persons 25251 (c) IGNWPS (ACA) Persons 1925 (d) IGNDPS (ACA) Persons 618 (e) NFBS (ACA) Persons 197 5. INTEGRATED CHILD DEVELOPMENT SCHEME(CSS)

Economic Survey Mizoram 2013-14 ~ 112 ~ Social & Service Sector- Social Welfare
Economic Survey Mizoram 2013-14
In pursuance of the National Policy for Children adopted in 22nd August,
1974 which laid emphasis on the integrated delivery of early childhood services for children below 6 years and expectant and nursing women. Based on the recommendation of the Inter-Ministerial Study Teams set up by the Planning Commission, the scheme of Integrated Development Services (ICDS) was evolved to make a coordinated effort for an integrated programme of delivery of package of such services. The first 33 pilot projects were set up in 1975 – 1976. Later on the Planning Commission on the basis of the evaluation report sanctioned more projects. By the turn of the 11th Five Year Plan, the ICDS Programme is planned to be universalize covering all the habitations of India. Data of ICDS in the State is shown below :- No. of ICDS Projects 27 No. of AWC 2244 No. AWWs Persons 2244 No. of children enrolled 6 months – 6 years Persons 73402 No. of AWTC 1 + 1 (at Lunglei) No. of Pregnant Women Persons 9675 No. of Lactating Women Persons 10157 No. of AWC providing PSE for 21 days 1980
No. of beneficiaries (i) Boys (ii) Girls
Persons
37181 36221
6. SUPPLEMENTARY NUTRITION PROGRAMME PLAN & CSS
Supplementary Nutrition Programme aims at reducing the prevalence of malnutrition among children between 6 months to 6 years, pregnant and lactating mother and adolescent girls. It provides supplementary feeding to an extent of 500 calories and 12 – 15 grams of protein to children, 800 calories and 20 25 grams of protein to pregnant, lactating mothers and adolescent girls.
In the State of Mizoram, different types of foods rich in proteins and calories, fortified with micro-nutrient are selected as supplementary foods for distribution to the beneficiaries at Anganwadi Centres. To combat micro-nutrients deficiencies, micronutrients such as Vitamin A, Iron, Zinc, Vitamin B Complex and Calcium are given in the form of syrups and tablets.
The State Government has compiled with the nutritional and feeding norms of the Government of India. It provides feeding for 300 days in a year. Physical Achievement : Beneficiaries covered during the year 2013 -2014
Year Normal Children
Malnourished Children
Severely Malnourished
Children Mothers Adolescent
Girls TOTAL
2013 –
2014 115901 41046 1302 40549 8043 206841

Economic Survey Mizoram 2013-14 ~ 113 ~ Social & Service Sector- Social Welfare
Economic Survey Mizoram 2013-14
7. CAPACITY BUILDING (CSS)
In order to combat micronutrient deficiency disorders and to fill the gap left by the Supplementary Nutrition Programme in providing protective nutrients in lactating and nursing mothers and children below 6 years, the CBPR programme will be implemented in Mizoram during the 11th Five Year Plan. The Programme is being implemented in 100 Anganwadi Centres within Aizawl District. 8. RAJIV GANDHI SCHEME FOR EMPOWERMENT OF ADOLESCENT GIRLS (RSGEAG) ‘SABLA’
‘Rajiv Gandhi Scheme for Empowerment of Adolescent Girls (RSGEAG) SABLA’ is implemented within Mizoram. The main objectives of the scheme are : i) Enable the AGs for self-development and empowerment. ii) Improve their nutrition and health status. iii) Promote awareness about health, hygiene, nutrition, Adolescent Reproductive and Sexual Health (ARSH) and family and child care. iv) Upgrade their home based skill, life skills and tie up with National Skill Development Programme (NSDP) for vocational skills. v) Mainstream out of school AGs into formal/non-formal education. vi) Provide information/guidance about existing public services such as PHC, CHC, Post Office, Bank, Police Station etc. The Scheme will be implemented within 12 ICDS Projects as under :-
District No. of ICDS Project No. of beneficiaries covered as on 31st
January 2013 Aizawl 6 23516 Lunglei 4 8735 Saiha 2 4134
9. BAL BHAVAN
Bal Bhavan is a creativity resources centre for children within the age group of 5 to 15 years. Bal Bhavan aims at enhacing the creative abilities of children by providing them with numerous activities and opportunities for expression. The objective of the scheme is to indentify creative talents, nurturing and honoring children; creating awareness about advocating creativity. Bal Bhavan caters to all walks of children irrespective of cast, creed or religion. The Mizoram Bal Bhavan was established during the early years of the 11th Plan period. There are more than 1000 nos. of children enrolled. Out of the 70 activities only four broad areas of activities are taken up at the Bal Bhavan at 4 (four) centres viz –
i) Creative innovation Science ii) Creative Performance iii) Creative Writing iv) Creative Fine Arts
National Bal Bhavan will provide equipments and facilities required, but the
running and maintenance cost has to be met from the State Plan Fund.
Economic Survey Mizoram 2013-14 ~ 114 ~ Social & Service Sector- Social Welfare
Economic Survey Mizoram 2013-14
10. GRANTS IN AID TO VOLUNTARY ORGANIZATION (PLAN) For promoting and strengthening Voluntary Organizations like YMA, MUP,
MHIP etc. rendering welfare services grant-in-aid / assistance are given in cash or in kind. The drug problem in Mizoram probably started as a spillover of the international drug trafficking. Mizoram is vulnerable because of the extensive international border as well as to close proximity to the Golden Triangle. Ethnic ties with residents in Manipur and Myanmar make the border porous.
For the prevention and treatment of drug addicts, alcoholism and diseases relating to AIDS etc. certain centres run by NGOs who are found deserving are given Financial Assistance. (a) Assistance to NGOs Organization 452 11. TRIBAL WELFARE SCHEME UNDER ARTICLE 275(ACA) & OTHERS
Under Article 275(1), grants are provided to the States on the basis of ST population percentage in the State of the total tribal population of the Country. The fund are released to the State Government against specific projects for the welfare of Scheduled Tribes and strengthening of administration of tribal areas. The scheme is valid with effect from 2002 – 2003 in the State of Mizoram. Major Projects taken up under this Schemes are – Tribal Art Centre – 1 , Eklavya Model Residential School – 2, Forest Village Development. 12. INTEGRATED CHILD PROTECTION SCHEME (ICPS) (CSS/PLAN)
The Government of India, Ministry of Women & Child Development has formulated a new Centrally Sponsored Scheme called Integrated Child Protection Scheme which has been initiated during the 11th Five Year Plan. The scheme is broadly based on the Juvenile Justice (Care & Protection of Children) Act 2000, and its Amendment Act 2006. The Government of India views child protection as an essential component of the country’s strategy to place ‘Development of the Child at the Centre of the Plan’ As per the scheme all the existing child welfare schemes comes under one umbrella. The following structures and support services are established :-
i) State Child Protection Society - 1 ii) District Child Protection Unit - 8 iii) Recognized Children Home - 28 iv) Specialized Adoption Agency - 4 v) Observation Home - 2 vi) Special Home - 2 vii) Child Welfare Committee - 8 viii) Juvenile Justice Board - 8 ix) Special Juvenile Police Unit - 8
Funding pattern for the cost of the implementation of the Scheme will be
shared by the Central Government and State Government in the ration of 90:10.
…..

Economic Survey Mizoram 2013-14 ~ 115 ~ Social & Service Sector- Cooperation
Economic Survey Mizoram 2013-14
COOPERATION
Cooperation Department in Mizoram has been playing a vital role to overcome the problem of common people and become self-reliant through Cooperatives. The Cooperation Department objective is to strengthen, boost up and enhance the process of Cooperative Movement in Mizoram which broadly aimed at the socio-economic Development of the people of Mizoram and try to bring most of developmental activities under the umbrella of Cooperation Department in the State through the cooperative sectors in all level. That is by providing financial, technical and policy-aid and all other possible assistances to Cooperatives and its members in order to reduce poverty, inequality, unfair-means, exploitation of the weaker section, etc. for a specified period to be determined by State Legislature in furtherance to fulfillment of directive principles of State policy as enshrined in Part IV of the Constitution of India. For this aspect, there are at present 1430 Primary Cooperative Societies and 10 State Level Cooperative Societies scattered all over the State serving the people for their economic upliftment and improving their economic conditions. The position of Different types of Cooperative Societies in Mizoram including 10 State Level Cooperative Societies at a glance for the year 2011-12 can be seen from the following table.
(Rupees in lakhs)
Sl. No. Types of Coop. Societies No. of
Societies No. of
Members Paid up Share Capital
Business Turnover
No. of Societies running in
profit 1 2 3 4 5 6 7
1. Industrial Cooperatives 81 1,618 107.75 28.39 42 2. Multipurpose Cooperatives 168 4,873 46.59 379.49 128 3. Dairy Cooperatives 90 2,299 12.11 945.66 54 4. Livestock Cooperatives 33 809 5.25 7.44 18 5. Piggery Cooperatives 244 6,140 42.26 81.73 134 6. Handloom Cooperatives 179 4,494 54.70 3057.59 135 7. Consumer Cooperatives 125 5,694 49.00 616.72 83 8. Service Cooperatives 49 2,124 27.77 325.15 32 9. Fishery Cooperatives 63 1,498 17.84 18.64 23 10. Farming Cooperatives 271 12,755 98.08 155.37 143 11. Poultry Cooperatives 21 344 1.87 2.95 6 12. Canteen Cooperatives 13 476 5.97 1.76 10 13. Labour Cooperatives 08 530 3.19 10.66 1 14. Sericulture Cooperatives 35 1,093 5.38 3.30 10 15. Housing Cooperatives 08 185 3.28 0.17 3 16. Marketing Cooperatives 12 316 8.31 163.28 3 17. Floriculture Cooperatives 06 119 0.33 1.72 3
18. Meat Processing Cooperatives 11 283 1.91 15.51 4
19. Large Size Agriculture 11 967 22.53 109.34 4 20. Banking Cooperatives 02 3,903 336.10 646.00 1 21. State Level Cooperatives 10 - 1630.52 37,293.01 10
TOTAL 1440 50,520 2,480.74 43,863.88 847
POSITION OF STATE LEVEL COOPERATIVE SOCIETIES
1. MIZORAM COOERATIVE APEX BANK LTD. :
This Bank was established in 1981 and play vital role in the upliftment of the poor economy of the State. The Bank is running 12 Branches in various places of Mizoram for providing credit for Agriculture and other productive purposes.
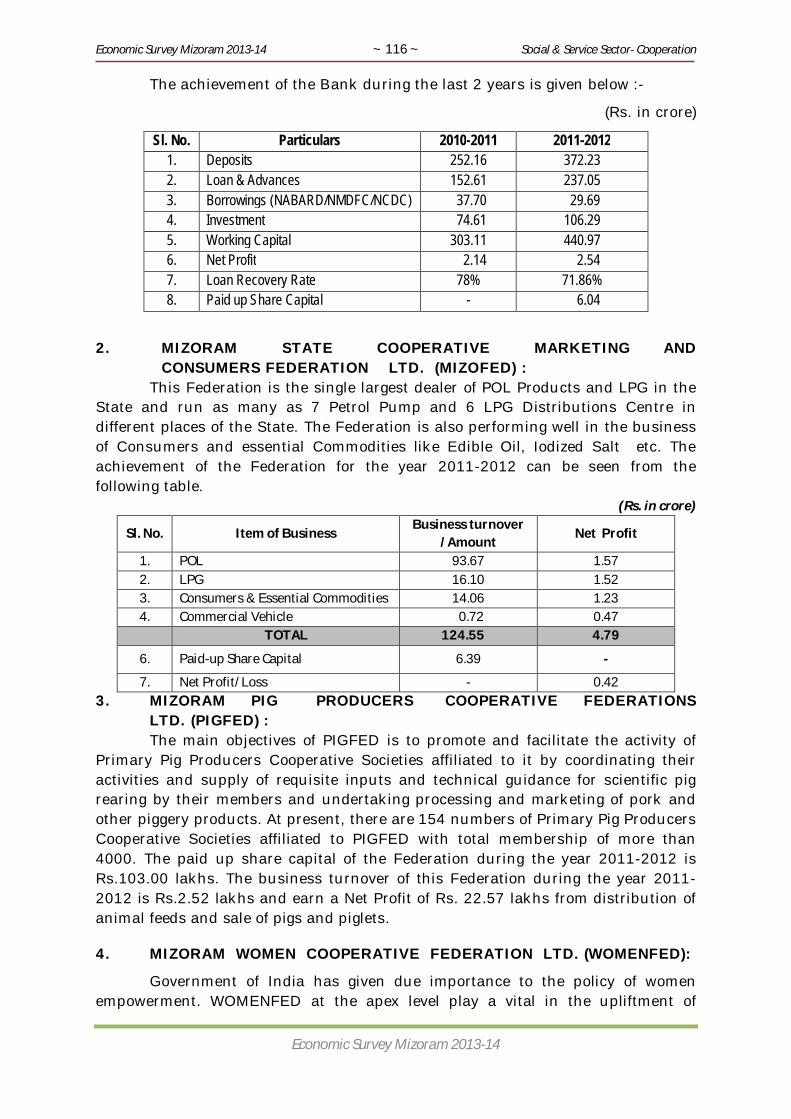
Economic Survey Mizoram 2013-14 ~ 116 ~ Social & Service Sector- Cooperation
Economic Survey Mizoram 2013-14
The achievement of the Bank during the last 2 years is given below :-
(Rs. in crore)
Sl. No. Particulars 2010-2011 2011-2012 1. Deposits 252.16 372.23 2. Loan & Advances 152.61 237.05 3. Borrowings (NABARD/NMDFC/NCDC) 37.70 29.69 4. Investment 74.61 106.29 5. Working Capital 303.11 440.97 6. Net Profit 2.14 2.54 7. Loan Recovery Rate 78% 71.86% 8. Paid up Share Capital - 6.04
2. MIZORAM STATE COOPERATIVE MARKETING AND CONSUMERS FEDERATION LTD. (MIZOFED) :
This Federation is the single largest dealer of POL Products and LPG in the State and run as many as 7 Petrol Pump and 6 LPG Distributions Centre in different places of the State. The Federation is also performing well in the business of Consumers and essential Commodities like Edible Oil, Iodized Salt etc. The achievement of the Federation for the year 2011-2012 can be seen from the following table.
(Rs. in crore)
Sl. No. Item of Business Business turnover
/Amount Net Profit
1. POL 93.67 1.57 2. LPG 16.10 1.52 3. Consumers & Essential Commodities 14.06 1.23 4. Commercial Vehicle 0.72 0.47 TOTAL 124.55 4.79
6. Paid-up Share Capital 6.39 -
7. Net Profit/Loss - 0.42 3. MIZORAM PIG PRODUCERS COOPERATIVE FEDERATIONS
LTD. (PIGFED) : The main objectives of PIGFED is to promote and facilitate the activity of Primary Pig Producers Cooperative Societies affiliated to it by coordinating their activities and supply of requisite inputs and technical guidance for scientific pig rearing by their members and undertaking processing and marketing of pork and other piggery products. At present, there are 154 numbers of Primary Pig Producers Cooperative Societies affiliated to PIGFED with total membership of more than 4000. The paid up share capital of the Federation during the year 2011-2012 is Rs.103.00 lakhs. The business turnover of this Federation during the year 2011-2012 is Rs.2.52 lakhs and earn a Net Profit of Rs. 22.57 lakhs from distribution of animal feeds and sale of pigs and piglets.
4. MIZORAM WOMEN COOPERATIVE FEDERATION LTD. (WOMENFED):
Government of India has given due importance to the policy of women empowerment. WOMENFED at the apex level play a vital in the upliftment of
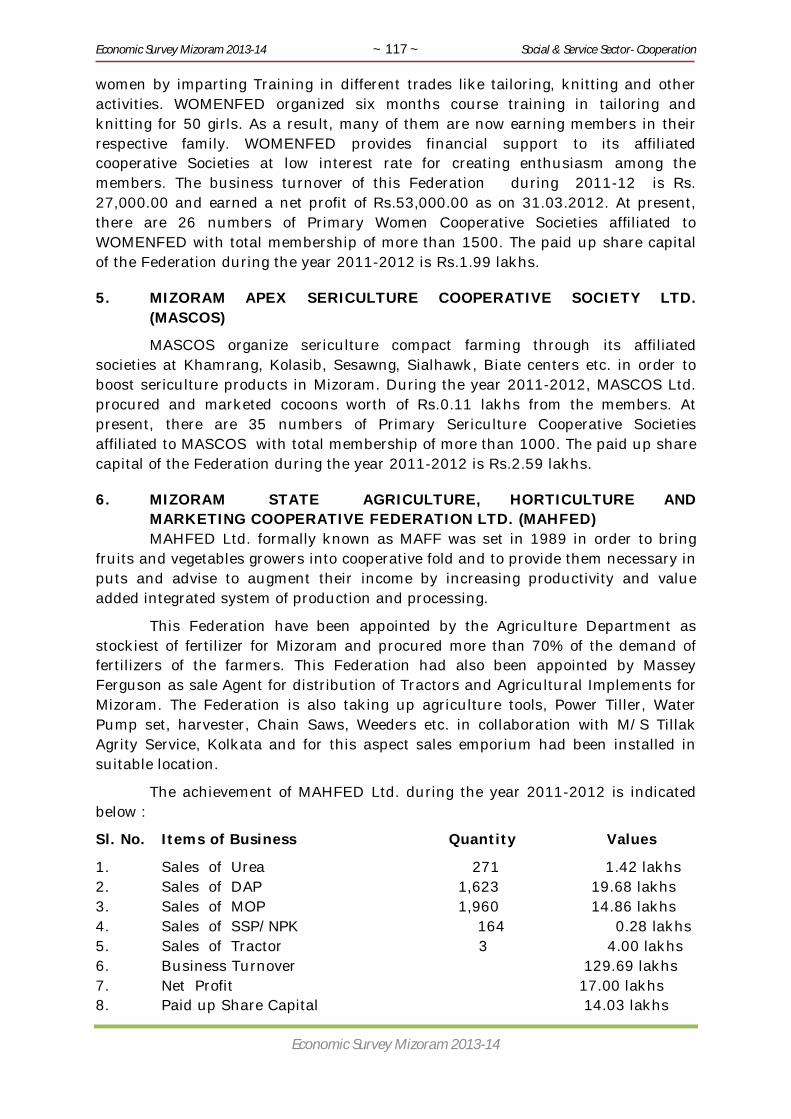
Economic Survey Mizoram 2013-14 ~ 117 ~ Social & Service Sector- Cooperation
Economic Survey Mizoram 2013-14
women by imparting Training in different trades like tailoring, knitting and other activities. WOMENFED organized six months course training in tailoring and knitting for 50 girls. As a result, many of them are now earning members in their respective family. WOMENFED provides financial support to its affiliated cooperative Societies at low interest rate for creating enthusiasm among the members. The business turnover of this Federation during 2011-12 is Rs. 27,000.00 and earned a net profit of Rs.53,000.00 as on 31.03.2012. At present, there are 26 numbers of Primary Women Cooperative Societies affiliated to WOMENFED with total membership of more than 1500. The paid up share capital of the Federation during the year 2011-2012 is Rs.1.99 lakhs.
5. MIZORAM APEX SERICULTURE COOPERATIVE SOCIETY LTD. (MASCOS)
MASCOS organize sericulture compact farming through its affiliated societies at Khamrang, Kolasib, Sesawng, Sialhawk, Biate centers etc. in order to boost sericulture products in Mizoram. During the year 2011-2012, MASCOS Ltd. procured and marketed cocoons worth of Rs.0.11 lakhs from the members. At present, there are 35 numbers of Primary Sericulture Cooperative Societies affiliated to MASCOS with total membership of more than 1000. The paid up share capital of the Federation during the year 2011-2012 is Rs.2.59 lakhs.
6. MIZORAM STATE AGRICULTURE, HORTICULTURE AND MARKETING COOPERATIVE FEDERATION LTD. (MAHFED)
MAHFED Ltd. formally known as MAFF was set in 1989 in order to bring fruits and vegetables growers into cooperative fold and to provide them necessary in puts and advise to augment their income by increasing productivity and value added integrated system of production and processing.
This Federation have been appointed by the Agriculture Department as stockiest of fertilizer for Mizoram and procured more than 70% of the demand of fertilizers of the farmers. This Federation had also been appointed by Massey Ferguson as sale Agent for distribution of Tractors and Agricultural Implements for Mizoram. The Federation is also taking up agriculture tools, Power Tiller, Water Pump set, harvester, Chain Saws, Weeders etc. in collaboration with M/S Tillak Agrity Service, Kolkata and for this aspect sales emporium had been installed in suitable location.
The achievement of MAHFED Ltd. during the year 2011-2012 is indicated below :
Sl. No. Items of Business Quantity Values
1. Sales of Urea 271 1.42 lakhs 2. Sales of DAP 1,623 19.68 lakhs 3. Sales of MOP 1,960 14.86 lakhs 4. Sales of SSP/NPK 164 0.28 lakhs 5. Sales of Tractor 3 4.00 lakhs 6. Business Turnover 129.69 lakhs 7. Net Profit 17.00 lakhs 8. Paid up Share Capital 14.03 lakhs
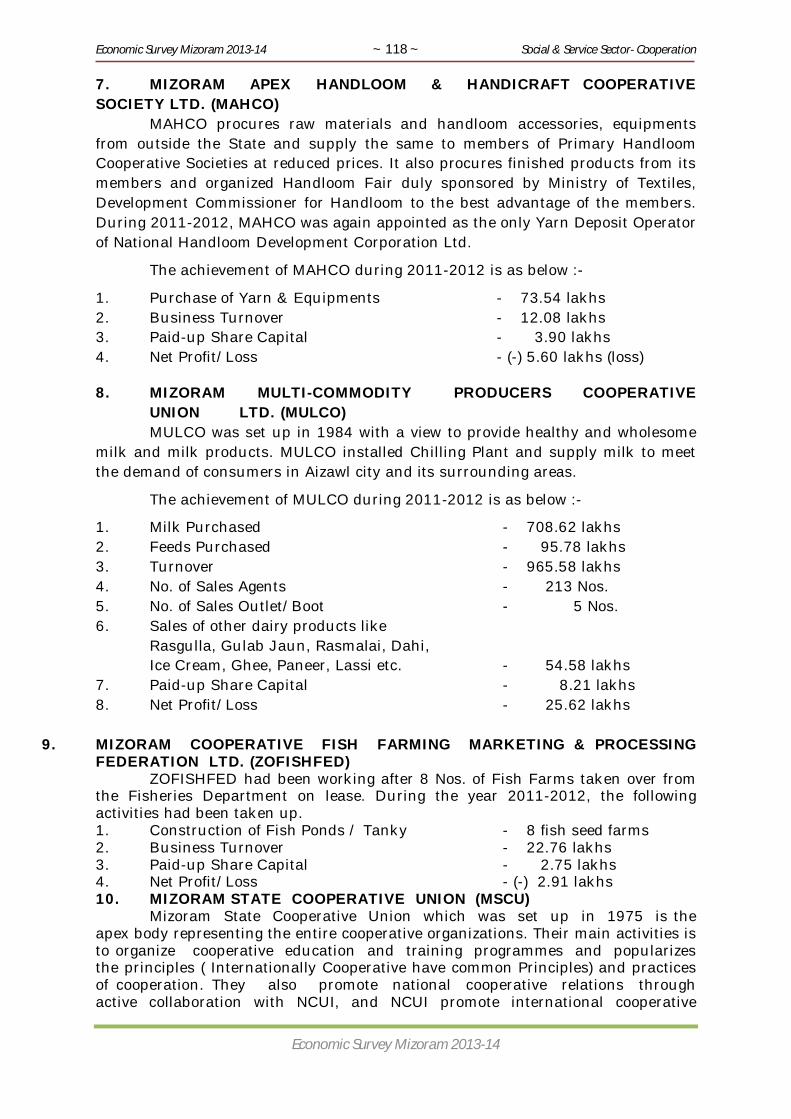
Economic Survey Mizoram 2013-14 ~ 118 ~ Social & Service Sector- Cooperation
Economic Survey Mizoram 2013-14
7. MIZORAM APEX HANDLOOM & HANDICRAFT COOPERATIVE SOCIETY LTD. (MAHCO) MAHCO procures raw materials and handloom accessories, equipments from outside the State and supply the same to members of Primary Handloom Cooperative Societies at reduced prices. It also procures finished products from its members and organized Handloom Fair duly sponsored by Ministry of Textiles, Development Commissioner for Handloom to the best advantage of the members. During 2011-2012, MAHCO was again appointed as the only Yarn Deposit Operator of National Handloom Development Corporation Ltd.
The achievement of MAHCO during 2011-2012 is as below :-
1. Purchase of Yarn & Equipments - 73.54 lakhs 2. Business Turnover - 12.08 lakhs 3. Paid-up Share Capital - 3.90 lakhs 4. Net Profit/Loss - (-) 5.60 lakhs (loss)
8. MIZORAM MULTI-COMMODITY PRODUCERS COOPERATIVE UNION LTD. (MULCO)
MULCO was set up in 1984 with a view to provide healthy and wholesome milk and milk products. MULCO installed Chilling Plant and supply milk to meet the demand of consumers in Aizawl city and its surrounding areas.
The achievement of MULCO during 2011-2012 is as below :-
1. Milk Purchased - 708.62 lakhs 2. Feeds Purchased - 95.78 lakhs 3. Turnover - 965.58 lakhs 4. No. of Sales Agents - 213 Nos. 5. No. of Sales Outlet/Boot - 5 Nos. 6. Sales of other dairy products like Rasgulla, Gulab Jaun, Rasmalai, Dahi, Ice Cream, Ghee, Paneer, Lassi etc. - 54.58 lakhs 7. Paid-up Share Capital - 8.21 lakhs 8. Net Profit/Loss - 25.62 lakhs
9. MIZORAM COOPERATIVE FISH FARMING MARKETING & PROCESSING FEDERATION LTD. (ZOFISHFED) ZOFISHFED had been working after 8 Nos. of Fish Farms taken over from the Fisheries Department on lease. During the year 2011-2012, the following activities had been taken up. 1. Construction of Fish Ponds / Tanky - 8 fish seed farms 2. Business Turnover - 22.76 lakhs 3. Paid-up Share Capital - 2.75 lakhs 4. Net Profit/Loss - (-) 2.91 lakhs 10. MIZORAM STATE COOPERATIVE UNION (MSCU) Mizoram State Cooperative Union which was set up in 1975 is the apex body representing the entire cooperative organizations. Their main activities is to organize cooperative education and training programmes and popularizes the principles ( Internationally Cooperative have common Principles) and practices of cooperation. They also promote national cooperative relations through active collaboration with NCUI, and NCUI promote international cooperative

Economic Survey Mizoram 2013-14 ~ 119 ~ Social & Service Sector- Cooperation
Economic Survey Mizoram 2013-14
relations with ICA, UNO, FAO, ILO, UNDP, UNIDO and other international agencies involved in cooperative movement. The achievement of MULCO during 2011-2012 is as below :- Village Education Programme 1. No. of Village visited - 3 2. No. of members participants - 28 3. No. of non-members participants - 11 City Education Programme 1. No. of area visited - 3 2. No. of participants - 17 Computer Awareness Courses Sl.No. Name of Course Duration No. of Trainers 1. Certificate in Computer Application (CCA) 3 months 75 2. Diploma in Computer Application (DCA) 6 months 388 3. Advance Diploma in Computer Application (ADCA) 9 months 4 4. Office course 4 months 7 Certificate Awarded Certificate Awarded to successful Trainees 1100 Printing Press 1. Order received from Cooperatives 43 2. Order received from Private Firms 24 3. Order received from Association 27 MIZORAM URBAN COOPERATIVE BANK LTD. (MUCO BANK) ( PRIMARY COOPERATIVE SOCIETY) MUCO Bank is a Primary Cooperative Society and was set up with a view to play a vital role in the economic upliftment of urban poor. During 2011-2012, this Bank have disbursed different Loans and Advances as below :-
Sl. No. Particulars Beneficiaries Amount 1. Consumer Loan 108 183.00 lakhs 2. Housing Loan 22 100.00 lakhs 3. Cash Credit 09 34.00 lakhs 4. Temporary over Draft 10 63.00 lakhs 5. Term Loan 20 186.00 lakhs 6. Allied Agriculture 03 5.00 lakhs 7. Demand Loan 50 60.00 lakhs 8. Festival Advance 90 15.00 lakhs TOTAL 312 646.00 lakhs
9. Paid up Share Capital - 336.06 lakhs 10. Net profit / loss - 31.00 lakhs
……

Economic Survey Mizoram 2013-14 ~ 120 ~ Social & Service Sector- Sports
Economic Survey Mizoram 2013-14
SPORTS & YOUTH SERVICES 1. Rajiv Gandhi Stadium at Mualpui Estimate cost : Phase – I Rs. 25.00 crore Phase – II Rs.125.00 crore The foundation stone of the first full fledged stadium in Mizoram, namely Rajiv Gandhi Sports Stadium was laid by the United Progressive Alliance Chairman, Smt. Sonia Gandhi on 6th March, 2010. Since then, work goes on in full swing. Out of the total estimate of Rs. 150.00 crore, the 12th Finance Commission had sanctioned Rs. 25.00 crore with which the first phase has been completed. Earth work in leveling and filling for the main Stadium and parking area, retaining wall, RCC counter fort retaining wall, Upper Western Gallery Pre-Engineered Building (PEB) and 70% of Artificial Football Turf was completed under Phase – I. To complete the whole Stadium, detailed project for Phase – II with an estimate of Rs. 125.00 crore was prepared. Construction of RCC Lower gallery (Eastern Stands), Western gallery (lower portion), sanitary and water supply, internal electrification, fire fighting works, preparation of ground area, courtyards etc, completion of artificial turf for Football pitch, laying of IAAF standard 8 – lane synthetic Athletic track, Construction of approach road, parking, fencing and drainage system are to be taken up. Apart from the fund received from the 12th Finance Commission for Phase – I, the Government of Mizoram set aside Rs. 25.00 crore under state plan for Phase – II. Even before completion of the Stadium, it is being utilized for hosting of the 26th North East Games. 52% of overall physical work is completed with financial progress of Rs.44.70 crore.
Source of Fund 12th Finance Commission : Rs. 25.00 cr State Plan 2010-11(SPA) : Rs. 10.00 cr State Plan 2011-12(SPA) : Rs. 15.00 cr Total : Rs. 50.00 cr
2. Indoor Stadium at Pitarte Tlang, Republic Veng, Aizawl.
Funding source : DoNER(NLCPR) Approved cost : Rs. 1305.22 lakhs Admissible grant (Central share) : Rs. 1174.70 lakhs Loan portion : Rs. 130.52 lakhs Fund Received Central State Total 1st Instalment 410.90 45.66 456.56 2nd Instalment 506.50 56.28 562.78 3rd Instalment 223.08 24.79 247.87 Total 1140.48 126.73 1267.21
The Ministry of DoNER conveyed administrative and financial approval for construction of Indoor Stadium at Pitarte Tlang, Republic Veng, Aizawl on 26th Sept., 2007 with an approved cost of Rs.1305.22 lakhs. Construction work is completed and is being utilized for venue of various contact sport games in the 26th North East Games Festival.

Economic Survey Mizoram 2013-14 ~ 121 ~ Social & Service Sector- Sports
Economic Survey Mizoram 2013-14
3. Additional Works for Indoor Stadium at Pitarte Tlang. Funding source : DoNER(NLCPR) Approved cost : Rs. 245.11 lakhs Admissible grant (Central share) : Rs. 220.60 lakhs Loan portion : Rs. 24.51 lakhs Fund Received Central State Total 1st Instalment 88.24 0.00 88.24
The Ministry of DoNER conveyed administrative and financial approval for additional works for Indoor Stadium at Pitarte Tlang, on 21st Aug., 2013 with an approved cost of Rs.245.11 lakhs. Construction work is going on. Additional fund received will be used for construction of RCC counterfort retaining wall to check possible landslide and stone masonry retaining wall to increase the parking area around the compound. 4. Champhai Indoor Stadium (Vanlallawma Indoor Stadium) :
Funding source : DoNER(NLCPR) Approved cost : Rs. 1159.99 lakhs Admissible grant : Rs. 1043.99 lakhs Loan portion : Rs. 116.00 lakhs Fund Received Central State Total 1st Instalment 354.75 39.41
394.16 2nd Instalment 405.43 45.05
450.48 3rd Instalment 253.40 28.16
281.56 Total 1013.58 112.16 1126.20
With an approved cost of Rs. 1159.99 lakhs sanctioned by the Ministry of DoNER on 31st March, 2006, construction work is completed and was inaugurated by the Hon’ble Chief Minister on 1st August, 2013. The project will go a long way in bridging the infrastructural gap of the eastern region of the state. 5. Cricket Stadium at Sihhmui.
Funding source : Ministry of DoNER(NLCPR) Approved cost : Rs. 1128.16 lakhs Admissible grant : Rs. 1015.34 lakhs Loan portion : Rs. 112.82 lakhs Fund Received Central State Total 1st Instalment 398.17 44.24 442.41 2nd Instalment 398.17 44.24 442.41 3rd Instalment 199.09 22.12 221.21
Total 995.43 110.60 1106.03 The first ever Cricket Stadium in Mizoram is constructed from the fund received form the Ministry of DoNER with an approved cost of Rs.1128.16 lakhs. Administrative Approval of the Gov’t. of India was conveyed on 21st December 2009. Work completed.

Economic Survey Mizoram 2013-14 ~ 122 ~ Social & Service Sector- Sports
Economic Survey Mizoram 2013-14
6. Indoor Stadium, Bungtlang. Funding source : Ministry of DoNER(NLCPR) Approved cost : Rs. 173.75 lakhs Admissible grant : Rs. 156.38 lakhs Loan Portion : Rs. 17.37 lakhs Fund Received Central State Total 1st Instalment 62.55 6.95 69.50 2nd Instalment 43.85 0.00 43.85 Total 106.40 6.95 113.35
The Ministry of DoNER has conveyed administrative approval of the project on 27th December, 2010. The work is executed by the State PWD. 90% of physical work is completed with anticipated date of completion on Oct. 2014 7. Indoor Stadium, Keitum.
Funding source : Ministry of DoNER(NLCPR) Approved cost : Rs. 173.75 lakhs Admissible grant : Rs. 156.38 lakhs Loan Portion : Rs. 17.37 lakhs Fund Received Central State Total 1st Instalment 62.55 6.95 69.50 2nd Instalment 40.00 4.44 44.44 Total 102.55 11.39 113.94
With an approved cost of Rs.173.75 lakhs sanctioned by the Ministry of DoNER on 27th December, 2010, work is going on in earnest. The State PWD has floated work tender notice on 31st March, 2011. 99% of physical work is completed with target date of completion on Mar. 2014. 8. State Sports Academy, Zobawk.
Funding source : Ministry of DoNER(NLCPR) Approved cost : Rs. 1751.24 lakhs Admissible grant : Rs. 1576.12 lakhs
Loan Portion : Rs. 175.12 lakhs
Fund Received Central State Total 1st Instalment 630.45 70.05 700.50
For this Project, Ministry of DoNER, Government of India approved Rs.1751.24 lakhs on cost sharing basis in the ratio of 90:10 Central and State share on 2nd August, 2010. Work started in earnest with overall physical progress of 7%. Anticipated date of completion is March, 2015. 9. Mini Sports Complex, Lengpui.
Funding source : NEC Approved cost : Rs. 470.00 lakhs Loan Portion : Nil

Economic Survey Mizoram 2013-14 ~ 123 ~ Social & Service Sector- Sports
Economic Survey Mizoram 2013-14
The North Eastern Council has approved the construction of Mini Sports Complex, Lengpui at a cost of Rs. 470.00 lakhs on 3rd December, 2010. The NEC has already released Rs.188.00 lakhs and Rs.147.83 lakhs as 1st & 2nd instalment. Overall physical progress is 75% with target date of completion on May, 2014. 10. Regional Sports Training Centre, Saidan, Kolasib.
Funding source : NEC Approved cost : Rs. 495.20 lakhs Loan Portion : Nil
The first Regional Sports Training centre at Saidan, Kolasib which will accommodate Boys trainees from the North Eastern State is established out of the fund received from the North Eastern Council with an approved cost of Rs.495.20 lakhs, and with the release of Rs.495.20 lakhs in three consecutive instalment, construction work goes ahead as planned. At present the centre is used as a residential football coaching academy for boys by Directorate of Sports & Youth Services. Physical progress is 80% with target date of completion on May, 2014 11. Indoor Stadium at Electric Veng, Aizawl:
Funding source : NEC Approved cost : Rs. 493.63 lakhs Admissible grant(90%) : Rs. 444.27 lakhs Loan Portion (10%) : Rs. 49.36 lakhs
The North Eastern Council has accorded Administrative Approval on 23rd Nov. 2012 with released of Rs. 177.78 lakh as 1st instalment. Work is going on in earnest. 12. Astro Turf at A.R. Lammual, Aizawl. Artificial turf for Football pitch at A.R. Lammual was laid at the cost of Rs.4.00 crore under State Plan fund. This was inaugurated by the Hon’ble Chief Minister on 28th February, 2011. This being the first in the North East and the third in the whole country. 13. Astro Turf at Thuamluaia Mual, Lunglei. Artificial turf for Football is being laid at Thuamluaia Mual, Lunglei at an approved cost of Rs.4.00 crore under the State Plan fund. Work is completed. 14. Astro Turf Hockey Playground at Boys Hockey Academy, Kawnpui.
Funding source : Ministry of Youth Affairs & Sports (PYKKA) Approved cost : Rs. 5.00 crore Loan Portion : Nil
Under the scheme, “assistance for the creation of Urban Sports Infrastructure”, the Ministry of Youth Affairs & Sports has approved Rs.5.00 crore for laying Astro Turf Hockey Playground at Boys Hockey Academy, Kawnpui. Work is completed. 15. Multi-purpose Hall at Mualpui, Aizawl.

Economic Survey Mizoram 2013-14 ~ 124 ~ Social & Service Sector- Sports
Economic Survey Mizoram 2013-14
Funding source : Ministry of Youth Affairs & Sports (PYKKA) Approved cost : Rs. 6.00 crore Loan Portion : Nil
The Ministry of Youth Affairs & Sports (PYKKA) under the scheme “assistance for the creation of Urban Sports Infrastructure”, has approved Rs.6.00 core for construction of Multi-purpose Hall at Mualpui, Aizawl. For this, 1st instalment amounting to Rs.4.50 crore has been released on19th October, 2011. Work is going on in earnest. 16. Construction of Multi-Sports Centre at Muallungthu.
Funding source : NEC Approved cost : Rs. 377.00 lakhs Admissible grant (90%) : Rs. 339.30 lakhs Loan Portion (10%) : Rs. 37.70 lakhs
The North Eastern Council has accorded administrative approval for the project at an estimated cost of Rs.377.00 lakhs on 16th November, 2011. 1st instalment of the grant to the payment of Rs.166.67 lakhs was conveyed on the same date. 2nd instalment of Rs.122.00 lakh was released on 13th Aug., 2013. 75% of physical work is completed with target date of completion on Oct. 2014. 17. Construction and Establishment of State Sports Centre at Phulpui.
Funding source : NEC Approved cost : Rs. 394.00 lakhs Admissible grant (90%) : Rs. 354.30 lakhs Loan Portion (10%) : Rs. 39 40 lakhs
The North Eastern Council has accorded administrative approval towards the project at an estimated cost of Rs.394.00 lakhs on 12th October, 2011. Payment of Rs.140.00 lakhs as grant was conveyed on the same date. 2nd instalment of Rs.144.00 lakhs was released with 70% of physical work completed. Target date of completion is Oct. 2014-03-11 18. Sports Infrastructure Development of Hachhek Area at Mizoram.
Funding source : NEC Approved cost : Rs. 489.86 lakhs Admissible grant (90%) : Rs. 440.87 lakhs Loan Portion (10%) : Rs. 48.98 lakhs
The North Eastern Council has accorded administrative approval towards the project at an estimated cost of Rs.489.86 lakhs on 1st Oct. 2013. Payment of Rs.76.35 lakhs as grant was conveyed on the same date. Work not yet started. 19. Indoor Stadium at Chanmari, Lunglei.
Funding source : Ministry of DoNER(NLCPR) Approved cost : Rs. 496.19 lakhs Admissible grant (90%) : Rs. 446.57 lakhs Loan Portion (10%) : Rs. 49.62 lakhs
Ministry of DoNER has conveyed administrative and financial approval towards the project at an estimated cost of Rs.496.19 lakhs on 18th Feb. 2014.

Economic Survey Mizoram 2013-14 ~ 125 ~ Social & Service Sector- Sports
Economic Survey Mizoram 2013-14
Payment of Rs.178.63 lakhs as grant for the 1st instalment was conveyed on the same date. Work not yet started. 20. Improvement of Sports Infrastructure under State Plan Fund. Several sports infrastructure works is to be undertaken under State Plan Fund. For this, Rs.555.55 lakhs is earmarked under SPA (2013 – 14). Project to be undertaken are :- 1. Construction of Indoor Stadium (4 nos) at Lunglei District - Rs. 230.00 lakhs 2. Construction of Judo Hall at Zemabawk, Aizawl - Rs. 150.00 lakhs 3. Construction of Taekwondo Hall at Republic Veng, Aizawl - Rs. 400.00 lakhs Grand Total - Rs.555.55 lakhs
…..

Economic Survey Mizoram 2013-14 ~ 126 ~ Rural & Urban Development
Economic Survey Mizoram 2013-14
XIII. RURAL AND URBAN DEVELOPMENT RURAL DEVELOPMENT 1. Mahatma Gandhi National Rural Employment Guarantee Act (MGNREGA) The National Rural Employment Guarantee Act (NREGA) provides enhancement of livelihood security to households in rural areas by means of a legal guarantee of at least one hundred days of wage employment in every financial year to every household whose adult members volunteer to do unskilled manual work.
In Mizoram, the two southern districts of Saiha and Lawngtlai were amongst the notified 200 districts of the country on 2nd February, 2006 started implementation in 2006-07 under Phase-I. It was subsequently extended to Lunglei and Champhai districts during 2007-08 under Phase-II. Finally, under Phase-III, it was further extended to cover the remaining districts viz, Aizawl, Mamit, Kolasib and Serchhip during 2008-09.
1.1 Physical and Financial Achievement : The total Central Assistance received for the implementation of MGNREGA in
the State during 2013-14 till date is Rs.18474.17 lakhs, whereas the approved outlay for the State contribution is Rs.1950.00 lakhs out of which an expenditure of Rs.1002.31 lakhs have been incurred so far which includes Rs.143.86 lakhs being under process as matching share, for Government concurrence and sanction.
The important parameters in the implementation of the scheme during the last 5 years is tabulated below:-
Sl.No Financial Year
Cumulative No. of households
provided employment
Central share received (Rs.
in lakh)
State share received
(Rs. in lakh)
Persondays Generated (
inlakh)
1 2009-10 180140 22433.83 965.114 170.33 2 2010-11 166567 26866.03 2929.34 165.99 3 2011-12 174031 32956.72 *2995.00 121.53 4 2012-13 173967 25,229.244 2,821.919 127.42
5 2013-14 (up to Dec, 2013
174937
18474.17 1002.31 85.122
Rs. 20 crores received for convergence with NLUP through Agriculture Department
2. Integrated Watershed Management Programme (IWMP)
Integrated Watershed Management Programme intends to restore ecological balance by harnessing, conserving and developing natural resources such as oil, vegetative cover and water, while at the same time, providing sustainable livelihood options to the people residing in watershed areas. IWMP will cater to livelihood intervention for landless households. A total of 170 projects covering an area of 631046 Ha. With an estimated project cost of Rs.94,656.90 lakh has been approved

Economic Survey Mizoram 2013-14 ~ 127 ~ Rural & Urban Development
Economic Survey Mizoram 2013-14
by Government of India to be implemented in a phased manner up to to 14th Five Year Plan.
The total project cost targetted during 2013-14 is Rs.8667.30 lakhs while
actual fund received till date (i.e. 4.3.2014) is Rs.6917.38 lakhs. The funding pattern is 90:10 between the Centre and the State respectively. While the requirement of matching share against actual Central released is Rs.768.55 lakhs, approved outlay from the State Budget 2013-14 is only Rs.300.00 lakhs. An amount of Rs.279.017 lakh matching share has been sanctioned by the State Government but yet to be drawn from the Treasury due to want of special permission for drawal from Finance Department to meet the shortfalls of Rs.652.329 lakhs for additional SMS, additional requirement has been moved for reallocation in the Revised Estimate 2013-14.
Year wise sanctioned project and fund received from Government of India
and Government of Mizoram is as under : (Rs in lakh)
Project sanctioned
No. of projects Area in Ha. Total Project Fund received from
Govt. of India Fund received from Govt. of Mizoram
2009-10 16 62435 9365.25 1685.75 187.305 2010-11 16 65880 9882.00 533.63 59.292 2011-12 17 72094 10814.10 583.96 64.885 2012-13 15 59144 8871.60 1643.84 20.823 2013-14 14 57782 8667.30 6917.38 0.00
Physical achievement : i) Creation of different land development through- a) Plantation 2446 Ha b) Soil & moisture conservation 1712 Ha c) Water harvesting structure 734 Ha ii) Area of activities a) WRC created 942 b) Checkdams 428 c) Terrace 257 d) Bunds 34 e) Others 52 f) No of User families assisted 105 nos iii) Livelihood and Production and Micro-Enterprise a) No of Self Help Group formed 220 b) No of assistance provided to individual/groups 250 3. Integrated Wasteland Development Programme (IWDP): IWDP aims at integrated development of wasteland/degraded lands based on village/Micro-watershed plan. There are 52 IWDP projects covering an area of 433808 hectares in the State. Out of these projects, 6 projects were foreclosed and 4 Project to be foreclosed during the current financial year. Fund for final installments is released to 35 projects. Final installment for 7 projects is yet to be received from the Central Government.
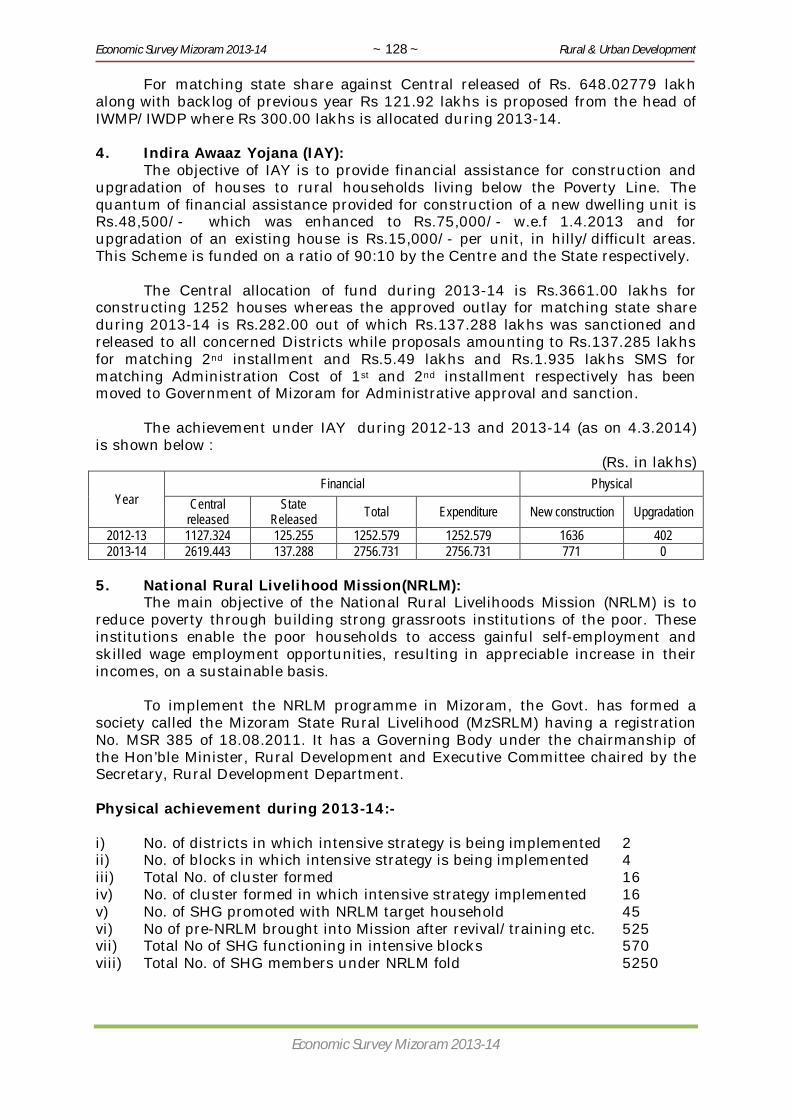
Economic Survey Mizoram 2013-14 ~ 128 ~ Rural & Urban Development
Economic Survey Mizoram 2013-14
For matching state share against Central released of Rs. 648.02779 lakh along with backlog of previous year Rs 121.92 lakhs is proposed from the head of IWMP/IWDP where Rs 300.00 lakhs is allocated during 2013-14. 4. Indira Awaaz Yojana (IAY):
The objective of IAY is to provide financial assistance for construction and upgradation of houses to rural households living below the Poverty Line. The quantum of financial assistance provided for construction of a new dwelling unit is Rs.48,500/- which was enhanced to Rs.75,000/- w.e.f 1.4.2013 and for upgradation of an existing house is Rs.15,000/- per unit, in hilly/difficult areas. This Scheme is funded on a ratio of 90:10 by the Centre and the State respectively.
The Central allocation of fund during 2013-14 is Rs.3661.00 lakhs for constructing 1252 houses whereas the approved outlay for matching state share during 2013-14 is Rs.282.00 out of which Rs.137.288 lakhs was sanctioned and released to all concerned Districts while proposals amounting to Rs.137.285 lakhs for matching 2nd installment and Rs.5.49 lakhs and Rs.1.935 lakhs SMS for matching Administration Cost of 1st and 2nd installment respectively has been moved to Government of Mizoram for Administrative approval and sanction.
The achievement under IAY during 2012-13 and 2013-14 (as on 4.3.2014) is shown below :
(Rs. in lakhs)
Year Financial Physical
Central released
State Released Total Expenditure New construction Upgradation
2012-13 1127.324 125.255 1252.579 1252.579 1636 402 2013-14 2619.443 137.288 2756.731 2756.731 771 0
5. National Rural Livelihood Mission(NRLM):
The main objective of the National Rural Livelihoods Mission (NRLM) is to reduce poverty through building strong grassroots institutions of the poor. These institutions enable the poor households to access gainful self-employment and skilled wage employment opportunities, resulting in appreciable increase in their incomes, on a sustainable basis. To implement the NRLM programme in Mizoram, the Govt. has formed a society called the Mizoram State Rural Livelihood (MzSRLM) having a registration No. MSR 385 of 18.08.2011. It has a Governing Body under the chairmanship of the Hon’ble Minister, Rural Development and Executive Committee chaired by the Secretary, Rural Development Department. Physical achievement during 2013-14:- i) No. of districts in which intensive strategy is being implemented 2 ii) No. of blocks in which intensive strategy is being implemented 4 iii) Total No. of cluster formed 16 iv) No. of cluster formed in which intensive strategy implemented 16 v) No. of SHG promoted with NRLM target household 45 vi) No of pre-NRLM brought into Mission after revival/training etc. 525 vii) Total No of SHG functioning in intensive blocks 570 viii) Total No. of SHG members under NRLM fold 5250

Economic Survey Mizoram 2013-14 ~ 129 ~ Rural & Urban Development
Economic Survey Mizoram 2013-14
Financial Achievement during 2013-14:-
Fund released (Rs. in lakh) Remarks Central State Total 236.00 21.78 257.78 4.44 lakh SMS under
process 6. Rural Housing :
Under Rural Housing Scheme, Galvanised Corrugated Iron (GCI) sheets are distributed to the rural households living in dilapidated dwellings and also to those households affected by natural as well as man made disaster @ 4 bundles per family. Achievement is shown below :-
Year Expenditure (Rs. in lakh)
GCI Sheets distributed (in bundles)
2010-2011 400.00 12581 2011-2012 100.00 3194 2012-2013 400.00 12545
7. Border Area Development Programme :
The Border Area Development Programme is a 100% Centrally funded programme and has the main objective of meeting the special development needs of the people living in remote and inaccessible areas located along the International border where preference/priority is given to the villages/habitation which are closer to the International border. Villages/habitation located within 0-20 km range from the International border is covered by the programme. The year-wise allocation of fund under different sectors may be presented as :-
Sector
Year 2011-12 2012-13 2013-14
No of items Expenditure No of items
Expenditure
No of items
Expenditure
Education (i.e. school building, playground, pavilion etc.)
127 716.50 92 636.00 109 737.75
Health ( i.e. sub centre building, medical quarter etc)
22 165.00 16 117.33 16 90.80
Agriculture & allied sector (for irrigation channel, link road etc)
46 366.50 32 272.00 32 236.50
Infrastructure ( i.e. road, bridge, side-drain, market shed etc)
170 1599.62 202 1741.61 235 1909.65
Social (i.e. community hall, NGO buildings etc)
76 544.38 102 790.61 100 644.90
Security (BPO, Police out post etc)
29 270.00 39 320.50 32 165.00
Capacity building 61 212.15 55 184.90 Miscellenous 4 24.50 1 7.50 Total including monitoring fund 470 3702.00 548 4154.73 588 3977.33
8. Social Education :
The scheme aims at creating durable assets of public utility and civic infrastructure genuinely needed by the society. Projects having a direct bearing on
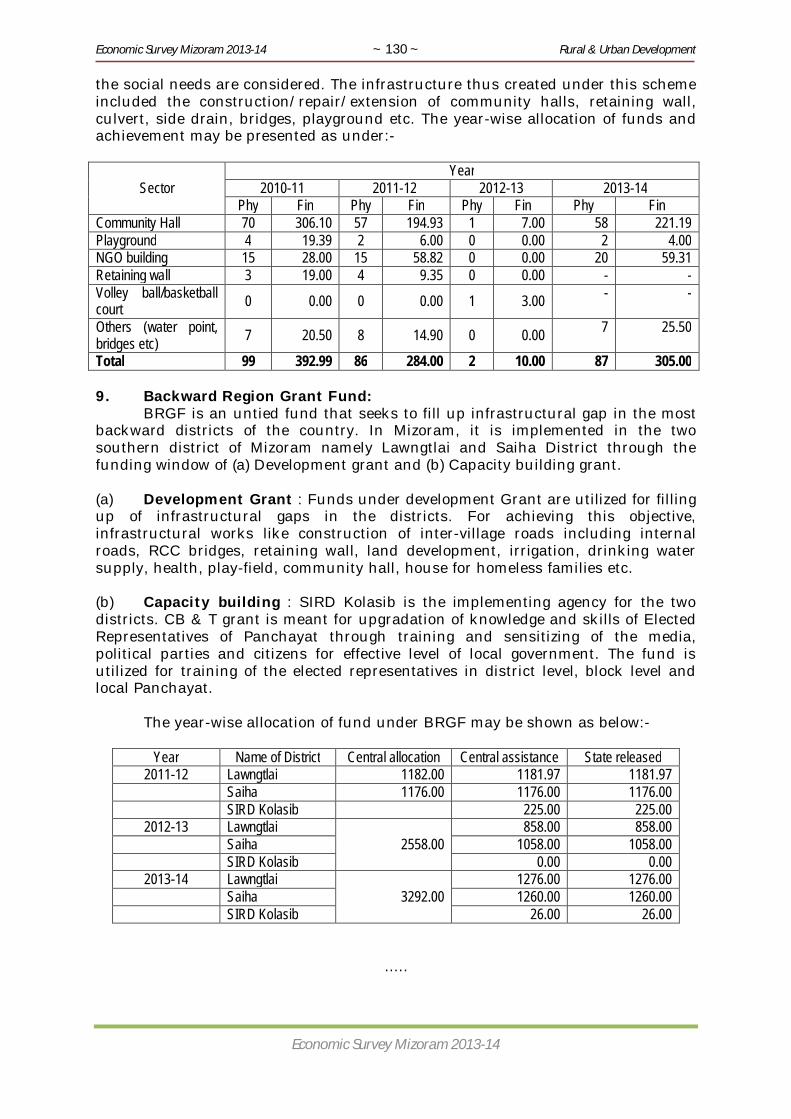
Economic Survey Mizoram 2013-14 ~ 130 ~ Rural & Urban Development
Economic Survey Mizoram 2013-14
the social needs are considered. The infrastructure thus created under this scheme included the construction/repair/extension of community halls, retaining wall, culvert, side drain, bridges, playground etc. The year-wise allocation of funds and achievement may be presented as under:-
Sector Year
2010-11 2011-12 2012-13 2013-14 Phy Fin Phy Fin Phy Fin Phy Fin
Community Hall 70 306.10 57 194.93 1 7.00 58 221.19 Playground 4 19.39 2 6.00 0 0.00 2 4.00 NGO building 15 28.00 15 58.82 0 0.00 20 59.31 Retaining wall 3 19.00 4 9.35 0 0.00 - - Volley ball/basketball court 0 0.00 0 0.00 1 3.00 - -
Others (water point, bridges etc) 7 20.50 8 14.90 0 0.00 7 25.50
Total 99 392.99 86 284.00 2 10.00 87 305.00 9. Backward Region Grant Fund:
BRGF is an untied fund that seeks to fill up infrastructural gap in the most backward districts of the country. In Mizoram, it is implemented in the two southern district of Mizoram namely Lawngtlai and Saiha District through the funding window of (a) Development grant and (b) Capacity building grant. (a) Development Grant : Funds under development Grant are utilized for filling up of infrastructural gaps in the districts. For achieving this objective, infrastructural works like construction of inter-village roads including internal roads, RCC bridges, retaining wall, land development, irrigation, drinking water supply, health, play-field, community hall, house for homeless families etc. (b) Capacity building : SIRD Kolasib is the implementing agency for the two districts. CB & T grant is meant for upgradation of knowledge and skills of Elected Representatives of Panchayat through training and sensitizing of the media, political parties and citizens for effective level of local government. The fund is utilized for training of the elected representatives in district level, block level and local Panchayat.
The year-wise allocation of fund under BRGF may be shown as below:-
Year Name of District Central allocation Central assistance State released 2011-12 Lawngtlai 1182.00 1181.97 1181.97
Saiha 1176.00 1176.00 1176.00 SIRD Kolasib 225.00 225.00
2012-13 Lawngtlai 2558.00
858.00 858.00 Saiha 1058.00 1058.00 SIRD Kolasib 0.00 0.00
2013-14 Lawngtlai 3292.00
1276.00 1276.00 Saiha 1260.00 1260.00 SIRD Kolasib 26.00 26.00
…..

Economic Survey Mizoram 2013-14 ~ 131 ~ Rural & Urban Development
Economic Survey Mizoram 2013-14
URBAN DEVELOPMENT & POVERTY ALLEVIATION
Urban Development & Poverty Alleviation Department was functioned since 2007-2008 (Created on ; vide Notification No. A. 46013/2/06-LAD dt. 24.8.2006). The Department has been mandated to implement various schemes and programmes on urban development, housing and urban poverty alleviation of the Central Government and the State Government. I. IMPLEMENTATION OF MAJOR SCHEMES/PROGRAMMES A. Jawaharlal Nehru National Urban Renewal Mission (JNNURM): 1) Under the sub-scheme of Urban Infrastructure and Governance (UIG): a) Renovation of Aizawl Greater Water Supply Scheme, Phase-I is implemented under PHED. Total project cost is Rs. 1681.80 lakhs. Central Share up to third installment and amounting to Rs. 1372.28 lakhs as well as the full State Matching Share of Rs. 168.00 lakhs have already been released. Last installment of Central Share is expected to be released soon, and the project is expected to be completed within the same period. b) Three road development projects for Aizawl are also approved and sanctioned by the Central Government. These are:- (a) Improvement and Widening of Aizawl City Road Phase-I amounting to Rs 3873.40 lakh (b) Sihhmui to Mizoram University as spur of Aizawl City Ring Road (16.70 km.) amounting to Rs 5309.32 lakh and (c) Widening and improvement of Vaivakawn to Mizoram University road (10.50 km.) amounting to Rs 1907.64 lakh. The 1st & 2nd Instalments of both Central Share and State Matching Share for these three road projects amounting to Rs. 3368.32 lakhs have been already released. The State PWD is implementing all these three projects, and works are in good progress under the first and the third projects. The process of land acquisition for the second project, that is, Sihhmui to Mizoram University as spur of Aizawl City Ring Road is going on, and construction works will be started as soon as this is over. Subsequent installments for all these projects are expected during 2014 – 2015. 2) Under the Sub-Schemes of Basic Services to Urban Poor (BSUP): For provision of housing and other basic amenities to families below poverty line and economically weaker section of the society, 3 (three) housing projects namely, Chite Lawipu Combined EWS (Rs.3403.43.35 lakhs), Rangvamual EWS (Rs. 3075.14 lakhs) and Durtlang EWS (Rs. 2623.73 lakhs) projects are being implemented under Basic Services to Urban Poor (BSUP). These three projects together will provide housing to 1096 urban poor families. The Central Government has already released an amount of Rs. 5285.59 lakhs out of its share and the State Matching Share of Rs. 1129.49 lakhs has also been released. The remaining Central Share of Rs. 2687.22 lakhs which is expected to be released soon and State Share is already fully matched. 3) Under the Sub-Scheme of Integrated Housing and Slum Development Programme (IHSDP): Eight projects worth Rs. 3927.31 lakhs for Construction of EWS Housing at Lunglei, Saiha, Champhai (two projects), Kolasib (two projects), Serchhip and Mamit were approved and sanctioned by the Central Government for construction of 1950 units/houses under Integrated Housing and Slum Development Programme (IHSDP). The Central and State share of the fund have been released in full, and 52% of the works have so far been completed.
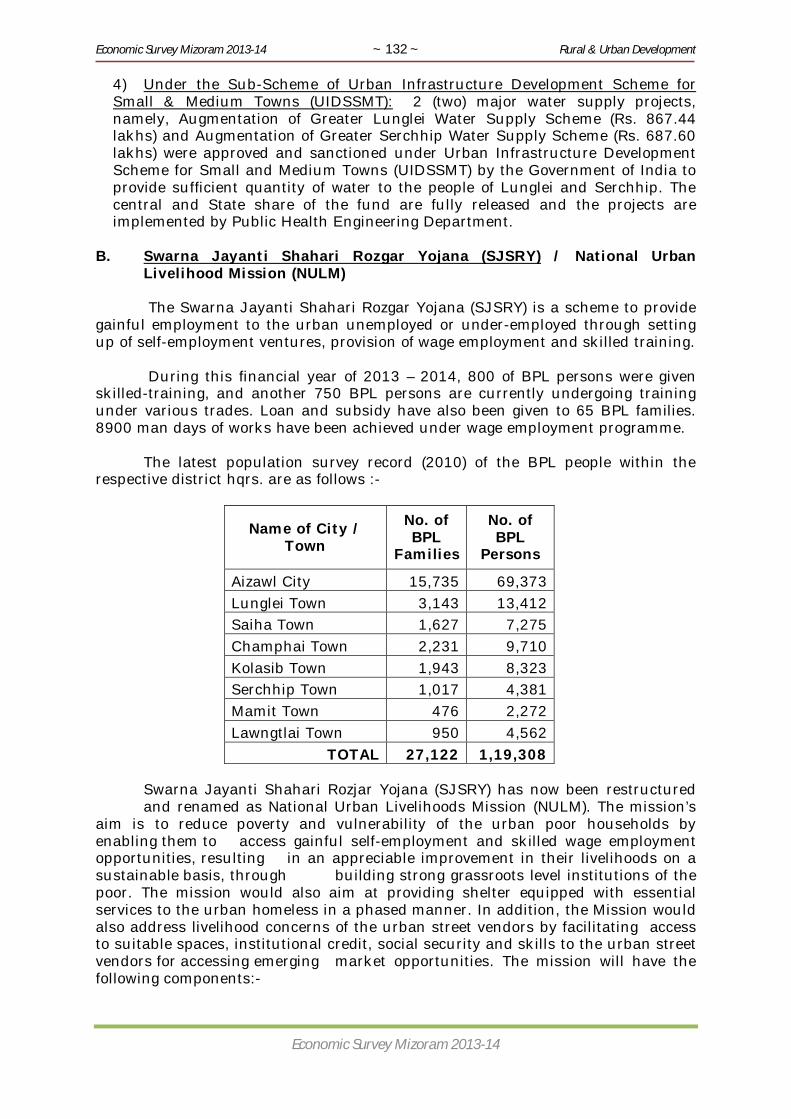
Economic Survey Mizoram 2013-14 ~ 132 ~ Rural & Urban Development
Economic Survey Mizoram 2013-14
4) Under the Sub-Scheme of Urban Infrastructure Development Scheme for Small & Medium Towns (UIDSSMT): 2 (two) major water supply projects, namely, Augmentation of Greater Lunglei Water Supply Scheme (Rs. 867.44 lakhs) and Augmentation of Greater Serchhip Water Supply Scheme (Rs. 687.60 lakhs) were approved and sanctioned under Urban Infrastructure Development Scheme for Small and Medium Towns (UIDSSMT) by the Government of India to provide sufficient quantity of water to the people of Lunglei and Serchhip. The central and State share of the fund are fully released and the projects are implemented by Public Health Engineering Department.
B. Swarna Jayanti Shahari Rozgar Yojana (SJSRY) / National Urban
Livelihood Mission (NULM)
The Swarna Jayanti Shahari Rozgar Yojana (SJSRY) is a scheme to provide gainful employment to the urban unemployed or under-employed through setting up of self-employment ventures, provision of wage employment and skilled training.
During this financial year of 2013 – 2014, 800 of BPL persons were given
skilled-training, and another 750 BPL persons are currently undergoing training under various trades. Loan and subsidy have also been given to 65 BPL families. 8900 man days of works have been achieved under wage employment programme.
The latest population survey record (2010) of the BPL people within the
respective district hqrs. are as follows :-
Name of City / Town
No. of BPL
Families
No. of BPL
Persons
Aizawl City 15,735 69,373 Lunglei Town 3,143 13,412 Saiha Town 1,627 7,275 Champhai Town 2,231 9,710 Kolasib Town 1,943 8,323 Serchhip Town 1,017 4,381 Mamit Town 476 2,272 Lawngtlai Town 950 4,562
TOTAL 27,122 1,19,308
Swarna Jayanti Shahari Rozjar Yojana (SJSRY) has now been restructured and renamed as National Urban Livelihoods Mission (NULM). The mission’s aim is to reduce poverty and vulnerability of the urban poor households by enabling them to access gainful self-employment and skilled wage employment opportunities, resulting in an appreciable improvement in their livelihoods on a sustainable basis, through building strong grassroots level institutions of the poor. The mission would also aim at providing shelter equipped with essential services to the urban homeless in a phased manner. In addition, the Mission would also address livelihood concerns of the urban street vendors by facilitating access to suitable spaces, institutional credit, social security and skills to the urban street vendors for accessing emerging market opportunities. The mission will have the following components:-

Economic Survey Mizoram 2013-14 ~ 133 ~ Rural & Urban Development
Economic Survey Mizoram 2013-14
1. Social Mobilisation & Institutional Development (SM&ID) 2. Capacity Building & Training (CB&T) 3. Employment through Skills Training & Placement (EST&P) 4. Self-Employment Programme (SEP) 5. Support to Urban Street Vendors 6. Shelter for Urban Homeless (SUH) 7. Innovative and Special Projects 8. A&OE (2% of allocation) 9. IEC (3% of allocation)
The mission is proposed to be taken up in the 8 District Hqrs., viz. (i)
Aizawl, (ii) Lunglei, (iii) Saiha, (iv) Champhai, (v) Kolasib, (vi) Serchhip, (vii) Lawngtlai and (viii) Mamit. The sharing pattern between the Central Government and the State Government is 90:10.
The extent and size of the NULM is yet to be made known by the
Central Government. Since it will be a nation-wide mission programme on urban poverty States. The State Planning Department has allocate Rs 900.00 lakhs (CSS) in the outlay (BE) of 2014 – 2015, which required to match in 90:10 ratio, but Rs 50.00 lakhs for SMS is allocated in the BE stage due to limited Plan fund and yet to be enhanced to meet the Centre’s allocation as and when it comes.
C. 10% Lumpsum Grants for NER:
Various Urban Infrastructure Development projects and Slum Area Development Projects are being implemented under 10% Lumpsum Grant provisions for North East India both under the Ministry of Urban Development and the Ministry of Housing & Urban Poverty Alleviation, Government of India. Aizawl, Lunglei, Saiha, Champhai, Serchhip, Kolasib, Lawngtlai, Saitual, N. Vanlaiphai, Tlabung, Khawzawl, Zawlnuam and Darlawn are being covered under this provision, and efforts are on to expand its coverage to all the 23 notified towns. This Department, perhaps, is the only Department under the Govt. of Mizoram which has availed funds under 10% Lumpsum Grant. The following shows our achievement so far:- 1. 11 nos. of Projects are already completed under Ministry of Urban
Development. 2. 9 nos. of projects are on-going under Ministry of Urban Development. 3. 10 nos. of Projects are already completed under Ministry of Housing & Urban
Poverty Alleviation. 4. 7 nos. of projects are on-going under Ministry of Housing & Urban Poverty
Alleviation.
D. Solar City Scheme for Aizawl : The Ministry of New and Renewable Energy (MNRE) has approved to develop Aizawl as a Solar City, and the Aizawl Solar City Master Plan has since been prepared and submitted to the Ministry. The Ministry had already approved and sanctioned Rs 48.09 lakhs for preparatory activities to develop Aizawl as a Solar City, out of which Rs 17.09 lakhs has already been released by the Central Government. The amount so released is being utilized for preparation of Aizawl Solar City Master Plan, promotional activities and for setting up of Aizawl Solar City Cell. The funding pattern between Central and State/beneficiaries varies depending upon the component of the scheme, with some components having funding ratios of 60:40, 90:10, etc.
Even though the Government Sectors to be covered under the Aizawl Solar City Scheme will cover a number of different departments who will be expected to
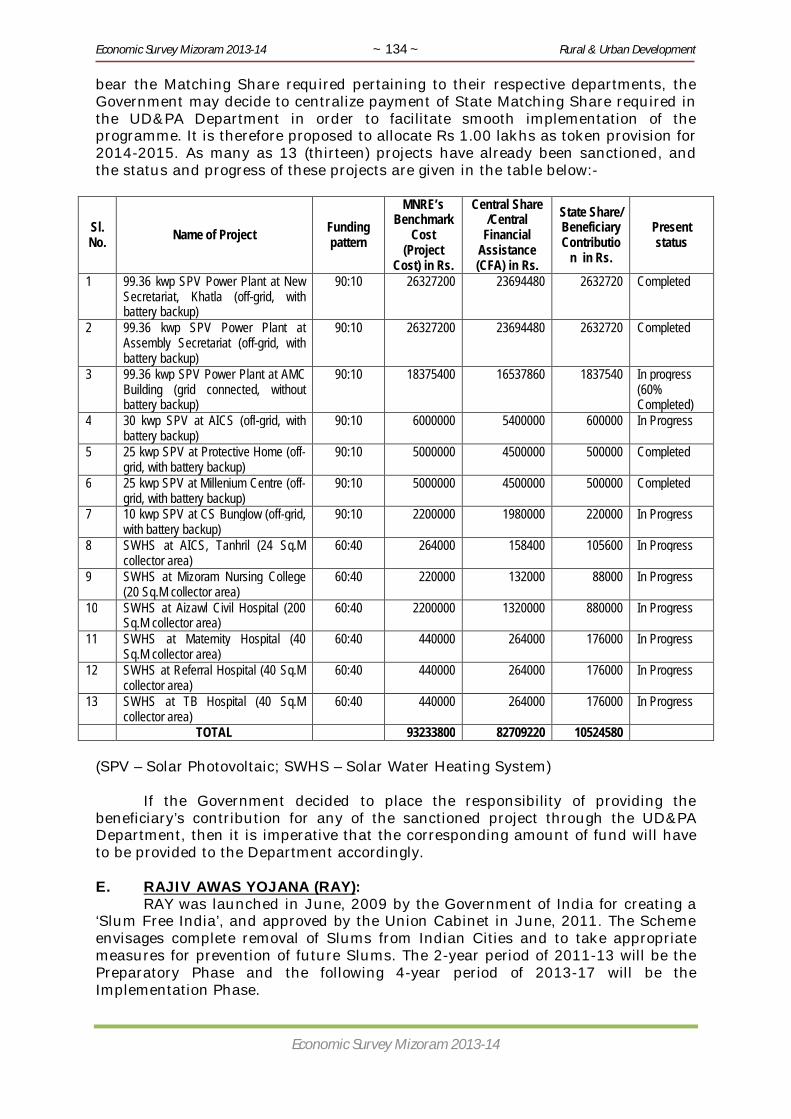
Economic Survey Mizoram 2013-14 ~ 134 ~ Rural & Urban Development
Economic Survey Mizoram 2013-14
bear the Matching Share required pertaining to their respective departments, the Government may decide to centralize payment of State Matching Share required in the UD&PA Department in order to facilitate smooth implementation of the programme. It is therefore proposed to allocate Rs 1.00 lakhs as token provision for 2014-2015. As many as 13 (thirteen) projects have already been sanctioned, and the status and progress of these projects are given in the table below:-
Sl. No. Name of Project Funding
pattern
MNRE’s Benchmark
Cost (Project
Cost) in Rs.
Central Share /Central
Financial Assistance (CFA) in Rs.
State Share/ Beneficiary Contributio
n in Rs.
Present status
1 99.36 kwp SPV Power Plant at New Secretariat, Khatla (off-grid, with battery backup)
90:10 26327200 23694480 2632720 Completed
2 99.36 kwp SPV Power Plant at Assembly Secretariat (off-grid, with battery backup)
90:10 26327200 23694480 2632720 Completed
3 99.36 kwp SPV Power Plant at AMC Building (grid connected, without battery backup)
90:10 18375400 16537860 1837540 In progress (60% Completed)
4 30 kwp SPV at AICS (off-grid, with battery backup)
90:10 6000000 5400000 600000 In Progress
5 25 kwp SPV at Protective Home (off-grid, with battery backup)
90:10 5000000 4500000 500000 Completed
6 25 kwp SPV at Millenium Centre (off-grid, with battery backup)
90:10 5000000 4500000 500000 Completed
7 10 kwp SPV at CS Bunglow (off-grid, with battery backup)
90:10 2200000 1980000 220000 In Progress
8 SWHS at AICS, Tanhril (24 Sq.M collector area)
60:40 264000 158400 105600 In Progress
9 SWHS at Mizoram Nursing College (20 Sq.M collector area)
60:40 220000 132000 88000 In Progress
10 SWHS at Aizawl Civil Hospital (200 Sq.M collector area)
60:40 2200000 1320000 880000 In Progress
11 SWHS at Maternity Hospital (40 Sq.M collector area)
60:40 440000 264000 176000 In Progress
12 SWHS at Referral Hospital (40 Sq.M collector area)
60:40 440000 264000 176000 In Progress
13 SWHS at TB Hospital (40 Sq.M collector area)
60:40 440000 264000 176000 In Progress
TOTAL 93233800 82709220 10524580 (SPV – Solar Photovoltaic; SWHS – Solar Water Heating System)
If the Government decided to place the responsibility of providing the beneficiary’s contribution for any of the sanctioned project through the UD&PA Department, then it is imperative that the corresponding amount of fund will have to be provided to the Department accordingly. E. RAJIV AWAS YOJANA (RAY): RAY was launched in June, 2009 by the Government of India for creating a ‘Slum Free India’, and approved by the Union Cabinet in June, 2011. The Scheme envisages complete removal of Slums from Indian Cities and to take appropriate measures for prevention of future Slums. The 2-year period of 2011-13 will be the Preparatory Phase and the following 4-year period of 2013-17 will be the Implementation Phase.
Economic Survey Mizoram 2013-14 ~ 135 ~ Rural & Urban Development
Economic Survey Mizoram 2013-14
An amount of Rs. 467.07 lakhs has already been sanctioned and released by MoHUPA as first installment for taking up preparatory activities. RAY Technical Cell is already established in the SLNA. Various activities towards preparation of Slum Free City Plan of Action were initiated. Socio-Economic Survey and MIS Development for Aizawl City is completed and is in progress for Lunglei Town. GIS Map for Aizawl City is already procured by the Aizawl Municipal Council and procurement of GIS Map for Lunglei Town from National Remote Sensing Centre (NRSC) is in progress. Consultancy input is being sought for which necessary steps are being taken up by the SLNA. As required, the Stakeholders meeting in all Municipal Wards of Aizawl have been completed. Preparation of Household Survey of Slum Pockets is underway. RAY Pilot Project at Zuangtui, Aizawl: Pilot Project for Aizawl City with approved cost of Rs. 1120.00 lakh was approved by the 3rd CSMC on 11.09.2012. The 1st installment of Central Share amounting to Rs. 316.34 lakhs and the corresponding State Matching Share of Rs. 57.00 lakhs have been released DURING 2012 - 2013, works are being started and 2nd Installment of SMS is released during 2013 – 2014 while 2nd Installment Central Share is being awaited from Central Government RAY Pilot Project at Lunglei, Mizoram: Pilot Project for Lunglei Town is being finalized with a total project cost of Rs. 1185.00 lakh which is expected to be submitted it to the Central Government soon for consideration and approval. F. NORTH EAST REGION CAPITAL CITIES DEVELOPMENT INVESTMENT PROGRAMME (NERCCDIP) : Government of India is taking Loan from Asian Development Bank for Urban Development and Services Improvement with Capacity Building of various concerned Projects implementing Agencies and Institutions for Aizawl City under the North Eastern Region Capital Cities Development Investment Program (NERCCDIP) in 3-Multi-tranch Financing Facilities (MFF) with total investment of Rs. 330 crore for 7-years. This Program envisages development and Services improvement for Aizawl Water Supply, Sewerage & Sanitations and Solid Waste Management. The Government of Mizoram in coordination with Ministry of Urban Development and Asian Development Bank constituted consolidated State Investment Program Management and Implementation Unit (SIPMIU) under the UD & PA Department headed by Project Director and SIPMIU actively served to achieved time-bound projects implementation. Project-2 comprising of rehabilitation of existing water distribution networks and Sewerage and Sanitations is under implementation as details indicated below: 1. The following Contract packages were awarded during 2012 – 13 and contracts are under execution and are likely to be completed within March, 2014 (i) Supply, Installation & Commissioning of 2 sets of Booster Pumps with a
contract amount of Rs. 50.64 lakh. (ii) Supply & Commissioning of 5 nos. of Cess Pool Cleaner with a contract
amount of Rs. 87.57 lakh (iii) Supply & Installation of 85 Bulk & 20000 nos. of Domestic Water Meters
with a contract amount of Rs. 638.82 lakh (iv) Construction of 3 nos. of Water Reservoirs with a contract amount of Rs.
285.99 lakh (v) Construction of Approach Road and Land Development for Sewerage
Treatment Plant (STP) with a contract amount of Rs. 145.87 lakh

Economic Survey Mizoram 2013-14 ~ 136 ~ Rural & Urban Development
Economic Survey Mizoram 2013-14
2. The following Contract packages were awarded during 2013 – 14 and works are expected to be started by November, 2013 (i) Construction of 10 nos. of Community Toilet Blocks at Aizawl with a
contract amount of Rs. 176.93 lakh. (ii) Rehabilitation & Extension of Feeder Mains & Distribution networks of
Aizawl Water Supply System with a contract amount of Rs. 3943.84 lakh (iii) Construction of Primary & Secondary Sewerage Networks at Aizawl with a
contract amount of Rs. 3172.93 lakh (iv) Construction of Sewerage Treatment Plant (STP) with a contract amount of
Rs. 2246.27 lakh (v) Providing dedicated 132 KV power supply to PHED Water Treatment Plant at
Dihmunzawl with a contract amount of Rs. 1641.63 lakh
Under this program Capacity Building of newly established Aizawl Municipal Council (AMC) on transfer of various functions as per 74th Amendment of India Constitutions alongwith modern Accounting system, property profiling. User charges, e-governance are in progress with the assistance of Institutional Development Consultants engaged under the program. With the assistance of this program an example of change in the institutional management on sustainable urban development and its Services Improvement will be created. The following schemes are approved to be implemented in Aizawl City :- Tranche 1 - 2009 – 15 Water Supply - Rs 102.54 crore Tranche 2 - 2010 – 15 Solid Waste Management - Rs 85.84 crore Tranche 3 - 2011 - 15 Sewerage and Sanitation - Rs 17.01 crore Capacity Building - Rs. 5.72 crore Project Management - Rs. 17.10 crore Tax, duties and contingencies - Rs. 101.89 crore TOTAL - Rs. 330.10 crore II. IMPLEMENTATION OF UNDER ANNUAL PLAN. (a) Minor Works Schemes:
Various Minor works are successfully implemented by this Department under the Annual Plan Schemes to address critical infrastructure needs of urban areas. Schemes like Link Roads, Parks & Recreation Centres, Step, R/Wall, Footpath, Fly Over, Monsoon Damage Rehabilitation Schemes, Dumping Ground, Urban Forestry, Public Utilities, Beautification Scheme, and Domestic Waste Disposal Line are taken up annually under this scheme.
(b) Solid Waste Management:
The Department is responsible for providing Solid Waste collections and disposal in urban areas. Maintenance of garbage vehicles, hiring of private trucks for collection and disposal of garbage, provision of support to various urban localities who are taking up garbage collection and disposal on their own initiatives through community contributions, purchase of lands for dumping grounds/solid waste management centres and development of dumping grounds are being taken up.
c) Special Plan Assistance (SPA) / State Priority Projects
The Department has been availing One Time Grant, ‘Special Plan Assistance (SPA)’ since 2012 – 2013 and the following works are implemented fruitfully :-

Economic Survey Mizoram 2013-14 ~ 137 ~ Rural & Urban Development
Economic Survey Mizoram 2013-14
A sum of Rs. 777.77 lakhs has been earmarked for 2013 – 2014 under
Special Plan Assistance. Within this earmarked amount, the Department will take up the following projects:-
Rs. In Lakh Sl. Name of Works/Programmes Total STATUS 1 Construction of Directorate Building, UD&PA 500.00 Being proposed
2 Setting up of Crematorium at Sairang for Aizawl. (Sairang) 100.00 Sanctioned & Bills
prepared for drawing
3 Construction of Link Road and Pedestrian Footpath. 177.77 Sanctioned & Bills
prepared for drawing TOTAL 777.77
Again, during the year 2014 – 2015, the following projects are proposed to be implemented under UD&PA:-
S.N NAME OF PROJECTS AMOUNT
(Rs. In crore)
1 Construction of District Complexes at Lunglei, Champhai, Kolasib and Serchhip 5.00
2 Development of Solid Waste Management Centre at Lunglei and Kolasib 2.00
3 Construction of pedestrian fly-over at Treasury Square junction, Aizawl 3.00
4 Setting up of crematorium Phase-II at Aizawl 2.50
5 Construction of cement flooring to support metalled road within Durtlang area, Aizawl 1.20
6 Construction of rigid pavement with side drain approached to BSUP Projects at Edenthar, Durtlang and Lawipu 3.00
7 Development of Diakkawn Square at Kolasib 1.13 8 Development of Pukpui Centenary Park at Lunglei 1.17 TOTAL 19.00
d) NEW LAND USE POLICY (NLUP):
NLUP is the Flagship Programme of the Government of Mizoram. UD&PA is one of the line Departments and has been assigned ten (10) trades within Aizawl city since the 2nd phase of NLUP. The following trades are look after under UD&PA:- 1) Automobile Works 6) Knitting 2) Beauty Parlour 7) Leather & Hood Works 3) Desktop Publishing 8) Photography & Videography 4) Electronics Repairing 9) Shoe Repairing 5) Hair Cutting 10) Tailoring
Sl.No. NAME OF WORKS AMOUNT (in lakh)
1 Improvement of Gallery with lighting system at Lammual Ground Aizawl 791.50
2 Composite Urban Development Project. 532.21
3 RCC building Type UV for All India Services Transit Quarters at Aizawl 231.29
TOTAL 1555.00
Economic Survey Mizoram 2013-14 ~ 138 ~ Rural & Urban Development
Economic Survey Mizoram 2013-14
The updated beneficiaries under NLUP are as under:- a) 1412 nos. of beneficiaries under 2nd Phase b) 1289 nos. of beneficiaries under 3rd Phase c) 553 nos. of beneficiaries under 4th Phase
Rs 460.40 lakhs was received from Industries Department and Rs 1490.00 lakh is allocated during 2013 – 2014 under UD&PA (Total = 1950.40 lakhs). Out of the total available of fund, Rs 1408.40 lakhs was already disbursed to the beneficiaries and the remaining of Rs 542.00 lakhs is being drawn from Treasury. III. THE MUNICIPALITIES: In an attempt to create Urban Local Body in conformity with the provision of the Constitution (74th Amendment), the Mizoram Municipalities Act, 2007 (as amended in 2009) and Rules thereunder have been enacted. Besides, the Mizoram Municipalities (Election of Councillors) Rules, 2007 (as amended in 2010) have also been made. The Mizoram Municipalities (Ward Committee and Local Council) Rules, 2010 and the Aizawl Municipal Council (Facilities to Chairman, Vice Chairman, Executive Councillors and Councillors) Rules, 2010 have also been framed.
As provided under the provision of the Mizoram Municipalities Act, 2007 (as amended in 2009) and Rules there-under, the State Election Commission conducted the first election to the Aizawl Municipal Council on 3.11.2010 successfully, and swearing in of all the elected Councillors took place on 16.11.2010. This is truly an epochal event in the history of Mizoram. It may also be pointed out that the process for constitution of the State Finance Commission is almost completed.
There are 19 wards and 80 Local Councils under Aizawl Municipal Council. The following are made for implementation of the works by the councils: 1) The Aizawl Municipal Council (Facilities to Chairman, Vice Chairman,
Executive Councillors and Councillors) Rules, 2010; 2) The Mizoram Municipalities (Ward Committee and Local Council) Rules,
2010 Presently, the following four business of works are already allocated to the Aizawl Municipal Council 1. Solid Waste Management 2. Cemetery and Burial Ground 3. Parking Lots 4. Street Lighting & High Mast Constitution 12th Scheduled function mentioned that the following are to be under the authority of Aizawl Municipal Council, which is now not fully implemented but be transferred one by one to AMC:- 1. Urban planning including town planning. 2. Regulation of land use and construction of buildings. 3. Planning for economic and social development. 4. Roads and bridges. 5. Water supply for domestic, industrial and commercial purposes. 6. Public health, sanitation conservancy and solid waste management. 7. Fire services.

Economic Survey Mizoram 2013-14 ~ 139 ~ Rural & Urban Development
Economic Survey Mizoram 2013-14
8. Urban forestry, protection of the environment and promotion of ecological aspects.
9. Safeguarding the interests of weaker sections of society, including the handicapped and mentally retarded.
10. Slum improvement and upgradation. 11. Urban poverty alleviation. 12. Provision of urban amenities and facilities such as parks, gardens,
playgrounds. 13. Promotion of cultural, educational and aesthetic aspects. 14. Burials and burial grounds; cremations, cremation grounds and electric
crematoriums. 15. Cattle pounds, prevention of cruelty to animals. 16. Vital statistics including registration of births and deaths. 17. Public amenities including street lighting, parking lots, bus stops and public
conveniences. 18. Regulation of slaughter houses and tanneries. Thirteenth Finance Commission Grant for Urban Local Bodies There is an allocation of Rs. 6140.00 lakh and Rs 3251.00 lakh on Basic Grant and Performance Grant respectively under the Thirteenth Finance Commission, Urban Local Bodies Grant, during 2010-11 to 2014-15 as shown at below:-
Year
URBAN LOCAL BODIES GRANT (Rs in lakhs) TOTAL
(Rs in lakhs) General Basic Grant
General Performance Grant
2010 - 2011 864.00 NIL 864.00 2011 – 2012 1107.00 68.05 1175.05 2012 – 2013 1555.33 426.67 1982.00 2013 – 2014 1405.00 960.00 2365.00 2014 – 2015 1662.00 1131.00 2793.00
TOTAL 6593.33 2585.72 9179.05 The allocation is broadly divided into two schemes of service, such as:-
1) Core services - Civic Amenities, Drinking Water, Sewerage, Solid Waste Management leh Street Lighting
2) Non-core Services - Office building and staffing, Information, Education and Communication (IEC), Technical Guidance and Supervision for maintaining Accounts and Data Base. The actual receipt from Govt. of India and utilization of fund for the three years are as under:- Expenditure during 2010 - 11
Rs. in Lakhs
Sl. EXPENDITURE HEAD / PARTICULAR AMOUNT
1 TOTAL OF CORE SERVICES 834.00 2 TOTAL OF NON CORE SERVICES 40.00
GRAND TOTAL 2010 - 2011 864.00

Economic Survey Mizoram 2013-14 ~ 140 ~ Rural & Urban Development
Economic Survey Mizoram 2013-14
Expenditure during 2011 - 12 Rs. in Lakhs
Sl. EXPENDITURE HEAD / PARTICULAR AMOUNT
1 TOTAL OF CORE SERVICES 1034.53 2 TOTAL OF NON CORE SERVICES 140.52
GRAND TOTAL 2011 - 2012 1175.05 Expenditure during 2012 - 13
Rs. in Lakhs
Sl. EXPENDITURE HEAD / PARTICULAR AMOUNT
1 TOTAL OF CORE SERVICES 1841.31 2 TOTAL OF NON CORE SERVICES 140.69
GRAND TOTAL 2011 - 2012 1982.00 Updated Status during 2013 - 14
Rs. in Lakhs
Sl. EXPENDITURE HEAD / PARTICULAR AMOUNT
1 TOTAL OF CORE SERVICES 698.76 2 TOTAL OF NON CORE SERVICES 35.00
GRAND TOTAL 2011 - 2012 733.76 ULB Grants is utilized by Aizawl Municipal Council in line with Action Plan prepared by them and approved by High Level Monitoring Committee under the chairmanship of Chief Secretary. The Action Plan for the year 2014 – 2015 also preparing to be submitted to the Government for approval. Performance Grants under 13th Finance Commission Grant for Urban Local Bodies The following nine conditions are also achieved by the Department to availed Performance Grant; as such the department received from the central Government Rs 68.05 lakh and Rs 426.67 lakh during 2011-12 and 2012 – 13 respectively.

Economic Survey Mizoram 2013-14 ~ 141 ~ Rural & Urban Development
Economic Survey Mizoram 2013-14
Sl.No. Conditions Corresponding
paras in guidelines
Status of Compliance (Documents/ Certificates to be enclosed wherever required
in support of the compliance
1 General Conditions
Paras 6.1 and Paras 6.2
First election to the AMC held on 3. 11. 2010.
2 Finance, Accounts and Budget
Paras 6.4.2 and Paras 6.4.3
Accounting Manual (Vol I & II) for Aizawl Municipal Council was notified on 25. 3. 2011. The Manual was prepared in line with the National Municipal Accountying Manual. There after, The IDC (under NERCCDIP) recommended some changes and amendment in the Aizawl Municipal Council Accounting Manual which was submitted to the Government on 5. 9. 2012 for implementation.
3 Audit of PRIs / ULBs Paras 6.4.4
Annual Technical Inspection Report of the Director, Local Funds Accounts, Govt. of Mizoram was laid before the Legislative Assembly. A Certificate to that effect was also given by the Principal Accountant General, Mizoram, Aizawl.
4 Ombudsmen Paras 6.4.5 Achieved. Passed by Mizoram Legislative Assembly on 2nd August, 2012
5 Electronic Transfer of funds within 5 days
Paras 6.4.6
1. Achieved in 2010 – 2011. 2. 2011 - 2012 grants already released with penal interest. 3. 2012 - 2013 grants already released with penal interest on.
6 Constitution of State Finance Commission.
Paras 6.4.7 State Finance Commission of Mizoram constituted vide No.G.11021/13/93-FCC Dt. 30th August, 2012.
7 Levy of Property tax Paras 6.4.8
Achieved. Aizawl Municipal Council entrusted to collect Property Tax within Aizawl Municipal Areas. Calculation and collection of Property Tax in Unit Area Method is under process.
8 Property tax Board Paras 6.4.9 Property Tax Board constituted vide No.G.11023/4/2011-FMC dt. 6th September, 2011.
9 Service delivery Benchmarks Paras 6.4.10
Achieved and Service Level Bench Mark for 2013-14 has been Notified in the Mizoram Gazette No. 126 of 11/3/2013
10 Disaster Management Paras 6.4.11 Not applicable for Aizawl. Only applicable to
cities with population of one million or more.
…….

Economic Survey Mizoram 2013-14 ~ 142 ~ List of Annexures
Economic Survey Mizoram 2013-14
XIV. LIST OF ANNEXURES
Annexure TITLE Page No
i Population of Mizoram through Decadal Census 143
ii District Wise Population of Mizoram 144
iii GSDP at Factor cost by Industry of origin at Current Price 145
iv GSDP at Factor cost by Industry of origin at Constant Price 146
v Area, Production & Average yield of Major Agricultural Crops 147
vi Land Use Statistics 148
vii Area, Production & Yield of Major Horticulture Crops 149
viii Number of Vehicle on Roads upto 31ST MARCH 2012 150
ix Average Price of essential Commodities 151
x Wholesale Price of selected essential commodities 154
xi Percentage Distribution of Total Workers, Marginal Workers & Main workers by broad industrial 155
xii Number of Primary, Middle, High & Higher Secondary and Enrolment therein Mizoram 156
xiii Teacher-Pupil Ratio 157
xiv Bank-wise Business and Credit Deposit Ratio (C:D Ratio) 158
xv Sector-wise Actual Expenditure & Percentage to total expenditure under Plan Scheme 159
xvi Actual Expenditure under Plan Scheme 160
xvii Taxes by Type 164
xviii Financial Achievement of IAY & SGSY during 2010-11 & 2011-12 165
xix No. of School, Enrolement & Teachers 166

Economic Survey Mizoram 2013-14 ~ 143 ~ Population of Mizoram through decadal census
Economic Survey Mizoram 2013-14
Annexure-I
POPULATION OF MIZORAM THROUGH DECADAL CENSUS
Sl No. Year
Population ( in nos.) Percentage decadal variation Male Female Total
1 2 3 4 5 6 1 1901 39,004 43,430 82,434 - 2 1911 430,028 48,176 91,204 (+) 10.64 3 1921 46,652 51,754 98,406 (+) 7.90 4 1931 59,186 65,218 1,24,404 (+) 26.42 5 1941 73,855 78,931 1,52,786 (+) 22.81 6 1951 96,136 1,00,066 1,96,202 (+) 28.42 7 1961 1,32,465 1,33,598 2,66,063 (+) 35.61 8 1971 1,70,824 1,61,566 3,32,390 (+) 24.93 9 1981 2,57,239 2,36,518 4,93,757 (+) 48.55
10 1991 3,58,978 3,30,778 6,89,756 (+) 39.70 11 2001 4,59,109 4,29,464 8,88,573 (+) 28.82 12 2011 (P) 552,339 538,675 1,091,014 (+)22.80
(P) : Provisional Figure
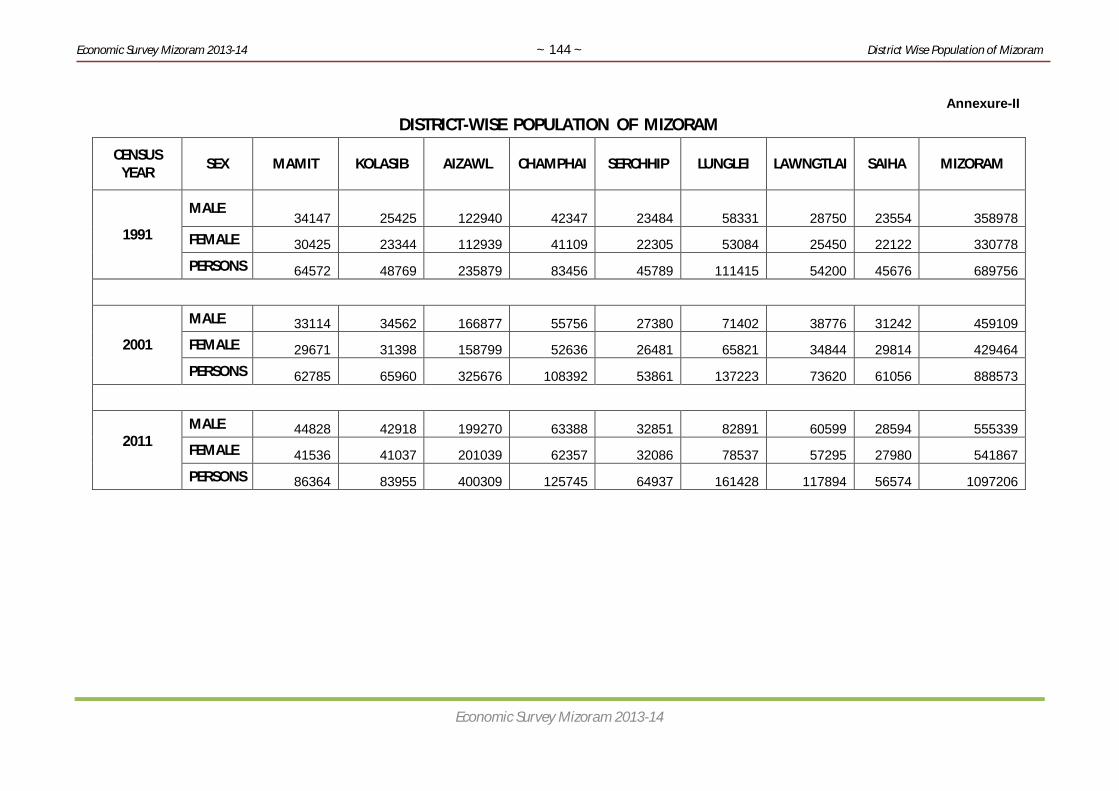
Economic Survey Mizoram 2013-14 ~ 144 ~ District Wise Population of Mizoram
Economic Survey Mizoram 2013-14
Annexure-II DISTRICT-WISE POPULATION OF MIZORAM
CENSUS YEAR
SEX MAMIT KOLASIB AIZAWL CHAMPHAI SERCHHIP LUNGLEI LAWNGTLAI SAIHA MIZORAM
1991
MALE 34147 25425 122940 42347 23484 58331 28750 23554 358978
FEMALE 30425 23344 112939 41109 22305 53084 25450 22122 330778 PERSONS 64572 48769 235879 83456 45789 111415 54200 45676 689756
2001
MALE 33114 34562 166877 55756 27380 71402 38776 31242 459109 FEMALE 29671 31398 158799 52636 26481 65821 34844 29814 429464 PERSONS 62785 65960 325676 108392 53861 137223 73620 61056 888573
2011
MALE 44828 42918 199270 63388 32851 82891 60599 28594 555339 FEMALE 41536 41037 201039 62357 32086 78537 57295 27980 541867 PERSONS 86364 83955 400309 125745 64937 161428 117894 56574 1097206

Economic Survey Mizoram 2013-14 ~ 145 ~ Gross Domestic Product
Economic Survey Mizoram 2013-14
Sector 2004-05 2005-06 2006-07 2007-08 2008-09 2009-2010 2010-2011 2011-12(P) 2012-13(Q) 2013-14(Pr)1 Agriculture 36138 37848 40782 52208 64830 75931 93447 101111 109404 1183762 Forestry & logging 23867 23866 24608 25800 27090 29218 30138 31040 22803 198353 Fishing 3020 3073 3175 2101 2145 2687 4621 4854 5099 5356
Agr and Allied 63025 64787 68565 80109 94065 107836 128206 137005 137305 1435674 Mining & quarrying 802 610 1084 1683 2425 1674 1796 2323 3005 3886a Sub Total of Primary 63827 65397 69649 81792 96490 109510 130002 139328 140310 1474535 Manufacturing 3767 3904 4783 5987 6002 6040 6946 7690 8763 10339
5.1 Manu-Registered 571 824 582 676 548 672 1145 1756 2693 41305.2 Manu-Unregistered 3196 3080 4201 5311 5454 5368 5801 5934 6070 62096 Construction 28901 42655 45021 52065 73610 78957 80651 89441 99189 1099997 Electricity,gas and Water supply 11059 12614 13320 16610 13164 16058 21038 22675 24439 26341b Sub Total of Secondary 43727 59173 63124 74662 92776 101055 108635 119806 132391 146680
Industry 44529 59783 64208 76345 95201 102729 110431 122129 135396 1505668 Transport,storage & communication 7187 7806 8836 10073 11142 11632 12735 14354 16181 18242
8.1 Railways 25 26 35 47 32 38 40 42 44 468.2 Transport by other means 5592 5917 6717 7812 8674 8764 9779 10980 12328 138438.3 Storage 54 57 68 83 100 120 147 179 218 2658.4 Communication 1516 1806 2016 2131 2336 2710 2769 3153 3590 40889 Trade,hotels and restaurants 25717 28852 32957 39102 45517 51723 58489 64064 70170 76859
10 Banking & Insurance 7297 7714 8967 10131 11723 13544 15072 20808 28727 3966011 Real estate,ownership of dwellings and business services 36517 42599 49681 58174 65676 74595 93731 117157 146438 18303712 Public administration 49498 49681 54875 60227 76669 97390 133127 149136 167070 18716113 Other services 34427 35893 40909 47390 57718 66536 86997 95129 104021 113744c. Sub Total of Tertiary 160643 172545 196225 225097 268445 315420 400151 460648 532607 61870314 State domestic product (Rs. lacs) 268197 297115 328998 381551 457711 525985 638788 719782 805309 91283615 Calculated State domestic product (Rs. lacs) 268197 297115 328998 381551 457711 525985 638788 719782 805309 91283616 Population 972986 997943 1023540 1049794 1076721 1104338 1132665 1161717 1191514 122207817 State Per Capita Income (Rs.) 27564 29773 32143 36345 42510 47629 56397 61958 67587 7469518 Calculated State Per Capita Income (Rs.) 27564 29773 32143 36345 42510 47629 56397 61958 67587 74695
GROSS DOMESTIC PRODUCT AT FACTOR COST BY INDUSTRY OF ORIGIN( MIZORAM STATE - 2004-2005 SERIES AT CURRENT PRICES )
(Rs in Lakhs)
Annexure-I I I

Economic Survey Mizoram 2013-14 ~ 146 ~ Gross Domestic Product
Economic Survey Mizoram 2013-14
Sector 2004-2005 2005-2006 2006-2007 2007-2008 2008-2009 2009-2010 2010-2011 2011-12(P) 2012-13(Q) 2013-14(Pr)1 Agriculture 36138 37055 38559 47274 56909 64153 77292 72580 68155 640002 Forestry & logging 23867 23925 23551 24007 23317 23196 23177 23102 22803 226183 Fishing 3020 3073 2117 1977 1972 2388 4005 4088 4173 4259
Agr and Allied 63025 64053 64227 73258 82198 89737 104474 99770 95131 908784 Mining & quarrying 802 551 1046 1355 2028 1241 1287 1687 2211 2899a Sub Total of Primary 63827 64604 65273 74613 84226 90978 105761 101457 97342 937765 Manufacturing 3767 3844 4480 5361 5194 5047 5381 6933 8934 11516
5.1 Manu-Registered 571 789 522 578 434 512 850 1060 1322 16485.2 Manu-Unregistered 3196 3055 3958 4783 4760 4535 4531 5873 7612 98676 Construction 28901 40790 40361 44492 57771 60171 59567 59985 60406 608307 Electricity,gas and Water supply 11059 12012 11939 14119 11296 12358 15632 16293 16982 17700b Sub Total of Secondary 43727 56646 56780 63972 74261 77576 80580 83211 86322 90045
Industry 44529 57197 57826 65327 76289 78817 81867 84898 88534 929448 Transport,storage & communication 7187 7804 8850 9965 10616 10595 11232 11855 12516 13219
8.1 Railways 25 26 33 41 27 29 33 35 37 398.2 Transport by other means 5592 5725 6103 6676 6919 6443 6643 6912 7192 74838.3 Storage 54 55 61 71 79 92 109 122 137 1538.4 Communication 1516 1998 2653 3177 3591 4031 4447 4786 5151 55439 Trade,hotels and restaurants 25717 27950 30126 34254 37624 41700 45324 45166 45009 4485210 Banking & Insurance 7297 8309 9913 11314 12472 14451 14932 19959 26678 3566011 Real estate,ownership of dwellings and business services 36517 39656 43019 46837 50986 56209 62290 66633 71279 7624912 Public administration 49498 47541 49840 52254 62274 74286 98221 101424 104731 10814713 Other services 34427 34432 36786 40412 45678 59101 79592 86087 93112 100710c. Sub Total of Tertiary 160643 165692 178534 195036 219650 256342 311591 331124 353326 37883614 State domestic product (Rs. lacs) 268197 286942 300587 333621 378137 424896 497932 515792 536990 56265815 Calculated State domestic product (Rs. lacs) 268197 286942 300587 333621 378137 424896 497932 515792 536990 56265816 Population 972986 997943 1023540 1049794 1076721 1104338 1132665 1161717 1191514 122207817 State Per Capita Income (Rs.) 27564 28753 29367 31780 35119 38475 43961 44399 45068 4604118 Calculated State Per Capita Income (Rs.) 27564 28753 29367 31780 35119 38475 43961 44399 45068 46041
Annexure-IVGROSS DOMESTIC PRODUCT AT FACTOR COST BY INDUSTRY OF ORIGIN
( MIZORAM STATE - 2004-2005 SERIES AT CONSTANT PRICES )(Rs in Lakhs)

Economic Survey Mizoram 2013-14 ~ 147 ~ Average Yield
Economic Survey Mizoram 2013-14
1 2 3 4 5 6 7 8 9 102000 - 01 51,839 103,673 2,000 6,643 16,436 2,474 2,374 3,960 1,668
2001 - 02 55,881 105,715 1,892 7,378 16,646 2,256 2,677 3,799 1,419
2002 - 03 57,067 109,205 1,914 7,489 14,879 1,987 4,666 4,986 1,068
2003 - 04 59,196 114,630 1,936 10,481 20,282 1,935 4,892 4,313 881
2004 - 05 57,085 107,661 1,886 10,505 19,788 1,884 6,741 7,971 1,182
2005 - 06 56,460 107,740 1,908 11,742 22,703 1,933 6,861 8,663 1,262
2006 - 07 52,851 42,091 796 10,775 20,969 1,946 5,054 5,833 1,154
2007 - 08 54,541 15,688 288 7,328 729 99 5,048 2,632 521 2008 - 09 51,990 68,917 1,326 9,558 9,318 975 3,931 3,646 927 2009-10 47,204 66,132 1,400 8,551 11,510 1,350 3,920 6,479 1,650 2010-11 40,692 67,429 1,657 9,005 13,499 1,499 3,957 6,065 1,5332011-12 38,976 75,566 1.939 6,905 8,397 1.216 3,836 5,331 1.3892012-13 39,342 77,471 1.969 6,175 8,063 1.306 3,100 3,288 1.061
Pulses
Area(in Ha.)
Production (tonnes)
Production (tonnes)
Area(in Ha.)
Production (tonnes)
Yield (Kg per Ha)
AREA, PRODUCTION & AVERAGE YIELD OF MAJOR AGRICULTURAL CROPS
Annexure-V
Area(in Ha.)
Year / District
Yield (Kg per Ha)
Yield (Kg per Ha)
Paddy Maize
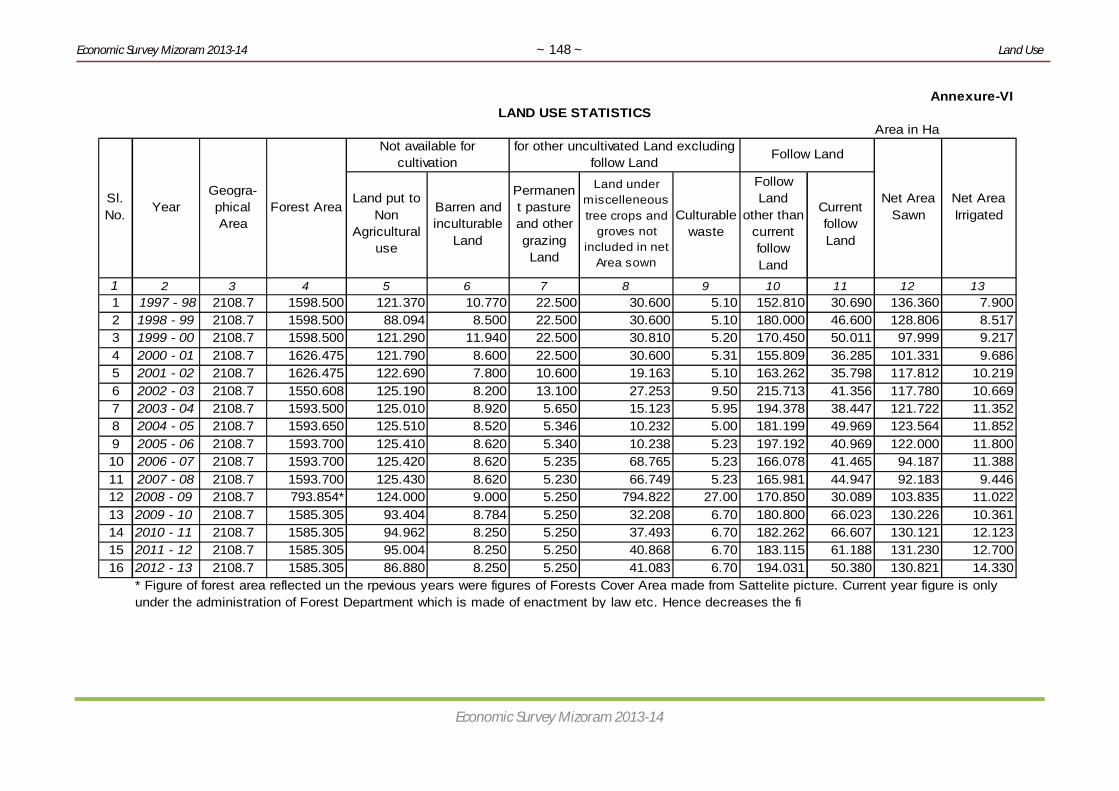
Economic Survey Mizoram 2013-14 ~ 148 ~ Land Use
Economic Survey Mizoram 2013-14
1 2 3 4 5 6 7 8 9 10 11 121 1997 - 98 2108.7 1598.500 121.370 10.770 22.500 30.600 5.10 152.810 30.690 136.3602 1998 - 99 2108.7 1598.500 88.094 8.500 22.500 30.600 5.10 180.000 46.600 128.8063 1999 - 00 2108.7 1598.500 121.290 11.940 22.500 30.810 5.20 170.450 50.011 97.9994 2000 - 01 2108.7 1626.475 121.790 8.600 22.500 30.600 5.31 155.809 36.285 101.3315 2001 - 02 2108.7 1626.475 122.690 7.800 10.600 19.163 5.10 163.262 35.798 117.8126 2002 - 03 2108.7 1550.608 125.190 8.200 13.100 27.253 9.50 215.713 41.356 117.7807 2003 - 04 2108.7 1593.500 125.010 8.920 5.650 15.123 5.95 194.378 38.447 121.7228 2004 - 05 2108.7 1593.650 125.510 8.520 5.346 10.232 5.00 181.199 49.969 123.5649 2005 - 06 2108.7 1593.700 125.410 8.620 5.340 10.238 5.23 197.192 40.969 122.00010 2006 - 07 2108.7 1593.700 125.420 8.620 5.235 68.765 5.23 166.078 41.465 94.18711 2007 - 08 2108.7 1593.700 125.430 8.620 5.230 66.749 5.23 165.981 44.947 92.18312 2008 - 09 2108.7 793.854* 124.000 9.000 5.250 794.822 27.00 170.850 30.089 103.835 11.02213 2009 - 10 2108.7 1585.305 93.404 8.784 5.250 32.208 6.70 180.800 66.023 130.226 10.36114 2010 - 11 2108.7 1585.305 94.962 8.250 5.250 37.493 6.70 182.262 66.607 130.121 12.12315 2011 - 12 2108.7 1585.305 95.004 8.250 5.250 40.868 6.70 183.115 61.188 131.230 12.70016 2012 - 13 2108.7 1585.305 86.880 8.250 5.250 41.083 6.70 194.031 50.380 130.821 14.330
Annexure-VI
Sl. No.
LAND USE STATISTICSArea in Ha
YearGeogra- phical Area
Forest Area
Not available for cultivation
Land put to Non
Agricultural use
Barren and inculturable
Land
Permanent pasture and other grazing Land
for other uncultivated Land excluding follow Land
9.44611.388
9.68610.21910.669
Land under miscelleneous tree crops and
groves not included in net
Area sown
Culturable waste
Follow Land
* Figure of forest area reflected un the rpevious years were figures of Forests Cover Area made from Sattelite picture. Current year figure is only under the administration of Forest Department which is made of enactment by law etc. Hence decreases the fi
11.800
137.9008.5179.217
Net Area Sawn
11.35211.852
Follow Land
other than current follow Land
Current follow Land
Net Area Irrigated
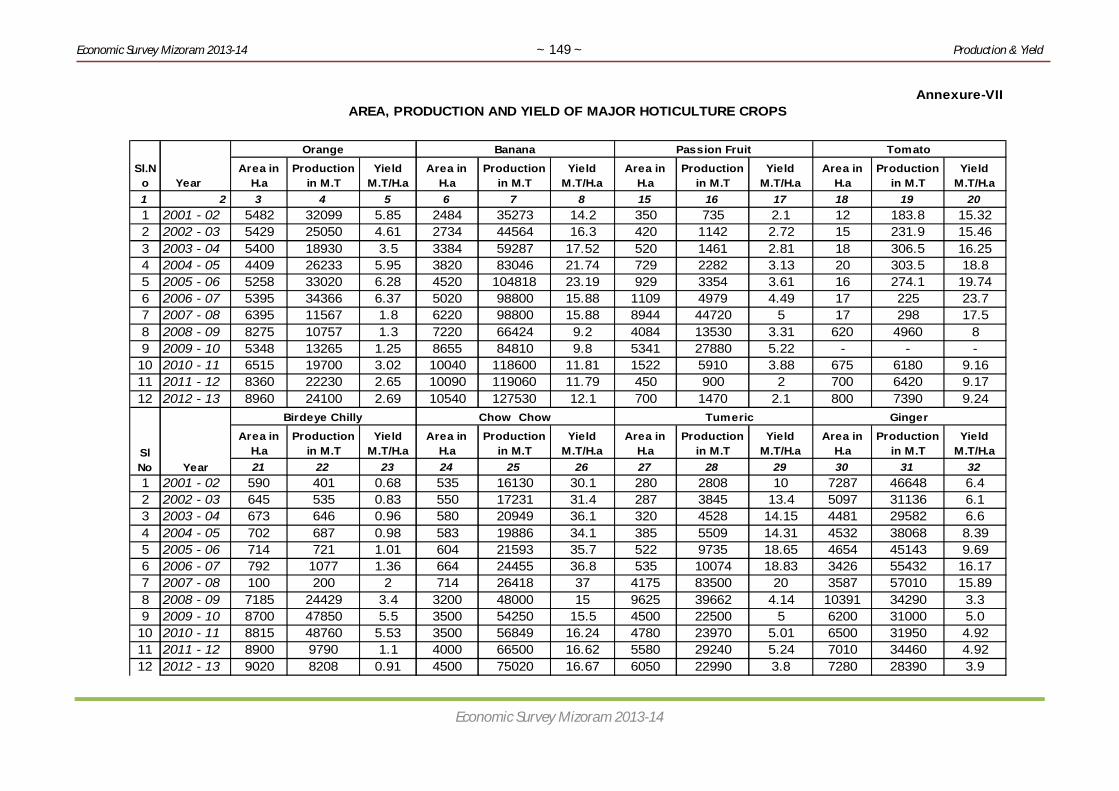
Economic Survey Mizoram 2013-14 ~ 149 ~ Production & Yield
Economic Survey Mizoram 2013-14
1 2 3 4 5 6 7 8 15 16 17 18 19 201 2001 - 02 5482 32099 5.85 2484 35273 14.2 350 735 2.1 12 183.8 15.322 2002 - 03 5429 25050 4.61 2734 44564 16.3 420 1142 2.72 15 231.9 15.463 2003 - 04 5400 18930 3.5 3384 59287 17.52 520 1461 2.81 18 306.5 16.254 2004 - 05 4409 26233 5.95 3820 83046 21.74 729 2282 3.13 20 303.5 18.85 2005 - 06 5258 33020 6.28 4520 104818 23.19 929 3354 3.61 16 274.1 19.746 2006 - 07 5395 34366 6.37 5020 98800 15.88 1109 4979 4.49 17 225 23.77 2007 - 08 6395 11567 1.8 6220 98800 15.88 8944 44720 5 17 298 17.58 2008 - 09 8275 10757 1.3 7220 66424 9.2 4084 13530 3.31 620 4960 89 2009 - 10 5348 13265 1.25 8655 84810 9.8 5341 27880 5.22 - - -
10 2010 - 11 6515 19700 3.02 10040 118600 11.81 1522 5910 3.88 675 6180 9.1611 2011 - 12 8360 22230 2.65 10090 119060 11.79 450 900 2 700 6420 9.1712 2012 - 13 8960 24100 2.69 10540 127530 12.1 700 1470 2.1 800 7390 9.24
21 22 23 24 25 26 27 28 29 30 31 321 2001 - 02 590 401 0.68 535 16130 30.1 280 2808 10 7287 46648 6.42 2002 - 03 645 535 0.83 550 17231 31.4 287 3845 13.4 5097 31136 6.13 2003 - 04 673 646 0.96 580 20949 36.1 320 4528 14.15 4481 29582 6.64 2004 - 05 702 687 0.98 583 19886 34.1 385 5509 14.31 4532 38068 8.395 2005 - 06 714 721 1.01 604 21593 35.7 522 9735 18.65 4654 45143 9.696 2006 - 07 792 1077 1.36 664 24455 36.8 535 10074 18.83 3426 55432 16.177 2007 - 08 100 200 2 714 26418 37 4175 83500 20 3587 57010 15.898 2008 - 09 7185 24429 3.4 3200 48000 15 9625 39662 4.14 10391 34290 3.39 2009 - 10 8700 47850 5.5 3500 54250 15.5 4500 22500 5 6200 31000 5.0
10 2010 - 11 8815 48760 5.53 3500 56849 16.24 4780 23970 5.01 6500 31950 4.9211 2011 - 12 8900 9790 1.1 4000 66500 16.62 5580 29240 5.24 7010 34460 4.9212 2012 - 13 9020 8208 0.91 4500 75020 16.67 6050 22990 3.8 7280 28390 3.9
Sl.No Year
Orange Banana
Area in H.a
Production in M.T
Yield M.T/H.a
Area in H.a
Production in M.T
AREA, PRODUCTION AND YIELD OF MAJOR HOTICULTURE CROPS
Yield M.T/H.a
Passion Fruit Tomato
Area in H.a
Production in M.T
Yield M.T/H.a
Area in H.a
Production in M.T
Yield M.T/H.a
Tumeric
Production in M.T
Yield M.T/H.a
Birdeye Chilly
Area in H.a
Production in M.T
Yield M.T/H.a
Production in M.T
Yield M.T/H.a
Annexure-VII
Ginger
Area in H.aSl
No Year
Area in H.a
Production in M.T
Yield M.T/H.a
Area in H.a
Chow Chow

Economic Survey Mizoram 2013-14 ~ 150 ~ No. of Vehicles
Economic Survey Mizoram 2013-14
Annexure-VIII
1998- 1999
1999-2000
2000-2001
2001-2002
2002-2003
2003-2004
2004-2005
2005-2006
2006-2007
2007-2008
2008-2009
2009-2010
2010-2011
2011-2012
2012-2013
1 2 3 4 5 6 7 8 9 10 11 12 13 14 15 15
1 Two wheeler 9926 11267 12945 14499 16267 18786 21132 23993 26350 29571 34396 41939 49962 59360 695092 Auto 53 216 450 623 863 1148 1336 1534 1736 1941 2103 2217 2475 2955 35523 Auto Rickshaw[Goods] 5 17 38 47 65 65 70 1134 Motor cab 1737 2012 2480 2728 2952 3301 3593 4110 4722 4436 4697 5050 5594 6237 69545 Maxi cab 45 110 264 333 407 550 723 878 1022 1137 1297 1416 1653 1946 22706 Motor cars 2020 2494 2923 3476 3896 4741 5311 6014 6702 8753 9697 10721 11896 13577 152837 Jeep 1796 1858 2027 2127 2238 2316 2406 2524 2665 6257 6908 7456 8197 9090 101078 Gypsy 1203 1712 1799 1863 1928 2019 2106 2204 2197 2692 2739 2766 2807 2822 28539 Stage carriage [Buses] 414 442 493 524 551 575 672 704 744 728 760 786 807 850 886
10 Ambulance 1 1 1 4 5 10 1611 Fire fighter 1 1 112 Recovery van 2 8 8 9 10 13 1313 Truck & Lorries 2210 2377 2586 2787 3012 3498 3966 4317 4659 2688 2901 3047 3379 3812 414514 Tractor 147 146 158 169 175 178 196 205 214 181 187 194 218 238 24915 Trailer 83 83 85 91 95 93 103 107 112 72 73 77 79 79 7916 Excavator 3 29 54 95 158 217 349 405 470 573 709 80817 Mac Crane / Road Roller 1 5 2 3 7 9 13 1618 Others 37 46 48 48 48 4919 TOTAL (PRIVATE) 19634 22717 26210 29223 32413 37259 41639 46754 51365 58891 66268 76272 87778 101830 11690320 GOVERNMENT
VEHICLE (All type) 3994 2084 2287 2495 2672 2613 2552 2733 2823 3441 3609 3911 4144 42754427
21 GRAND TOTAL 23628 24801 28497 31718 35085 39872 44191 49487 54188 62332 69877 80183 91922 106105 121330
Sl. No.
PRIVATE
Category
NUMBER OF VEHICLES ON ROAD UPTO 31ST MARCH 2012Y E A R S

Economic Survey Mizoram 2013-14 ~ 151 ~ Essential Commodities
Economic Survey Mizoram 2013-14
Annexure-IX AVERAGE RETAIL PRICE OF ESSENTIAL COMMODITIES
(Price in Rupees)
Sl. No Name of Commodities Unit 2000-
01 2001-
02 2002-
03 2003-
04 2004-
05 2005-
06 2006-
07 2007-
08 2008-
09 2009-
10 2010-11 2011-2012
1 2 3 4 5 6 7 8 9 10 11 12 13 14 15 I CEREALS 1 Rice Kg 13.92 13.37 13.17 14.33 12.21 14.08 16.54 20.30 20.88 24.67 24.00 26.00 2 Atta Kg 12.13 12.33 12.00 14.08 14.75 14.50 15.56 17.25 17.38 18.12 29.00 24.00 3 Maida Kg 14.00 13.24 13.08 14.79 14.04 15.62 19.38 20.00 20.25 20.43 25.00 26.00 4 Suji Kg 16.50 17.20 15.96 15.91 17.04 19.42 20.31 27.50 27.25 24.88 33.00 35.00 5 Bread (400g) No. 10.00 10.00 10.00 10.00 10.00 10.00 10.00 11.25 13.75 11.89 12.00 15.00 6 Biscuit (Good Day) 100g No. 10.00 10.33 1067.00 10.50 10.08 10.42 10.00 10.00 10.00 10.64 11.00 12.00 II PULSES 7 Masur dal (small) Kg 30.50 29.61 33.33 36.79 37.83 34.69 42.75 56.00 73.75 76.28 69.00 73.00 8 Black Gram Kg 23.71 25.37 27.21 27.91 28.87 27.71 40.31 41.25 41.88 42.13 42.00 51.00 9 Local Pulse (Bete) Kg 28.33 24.35 28.50 28.81 28.75 30.50 32.50 35.00 48.75 48.67 50.00 61.00
10 Motor Chana (Dry peas) Kg 19.25 19.75 19.50 19.50 21.08 19.75 22.81 30.63 31.88 31.09 33.00 39.00 11 Soyabean Kg 26.14 24.11 27.48 30.21 24.58 28.96 27.50 40.00 42.63 49.15 49.00 62.00 III OILS & FATS
12 Mastard Oil (refined veg.oil) Litr. 41.25 39.91 51.79 60.54 59.17 57.46 61.06 78.12 85.00 78.87 82.00 95.00
13 Vanaspati (Dalda / Rasoy) Kg. 61.88 52.91 59.42 60.00 60.83 59.16 61.88 80.00 80.63 78.40 79.00 91.00 IV MEAT, FISH & EGG 14 Pork Kg. 93.75 95.00 95.00 98.75 98.75 98.75 102.50 122.00 145.00 150.42 162.00 182.00 15 Beef Kg. 87.50 88.75 91.46 102.50 101.25 102.50 112.50 123.75 146.25 159.58 180.00 198.00 16 Mutton Kg. 102.85 99.99 105.71 108.57 118.57 102.50 133.33 136.67 167.50 181.28 223.00 250.00 17 Chicken (Broiler) Kg. 103.33 98.88 95.39 113.01 120.71 120.00 118.75 132.86 147.50 157.44 168.00 168.00 18 Fish (Rohu) Kg. 103.33 103.13 102.50 119.58 125.10 130.66 112.50 114.28 131.25 142.94 149.00 156.00

Economic Survey Mizoram 2013-14 ~ 152 ~ Essential Commodities
Economic Survey Mizoram 2013-14
19 Egg (Farm) Dozen 28.55 28.54 28.38 28.75 30.00 30.00 36.25 34.12 48.00 68.48 99.00 59.00 V MILK & ITS PRODUCTION 20 Milk (Private) Lit. 23.00 23.33 23.87 24.58 26.87 28.87 28.87 27.62 30.63 32.73 39.00 42.00 21 Everyday (milk powder) Kg 69.12 69.21 68.83 69.50 74.62 77.08 88.75 101.87 110.88 111.66 134.00 160.00 22 Amul Butter (100g.) No. 15.75 15.04 14.92 15.16 15.04 16.17 16.25 19.25 19.75 20.63 27.00 30.00 VI CONDIMENTS & SPICES 23 Salt (Tata) Kg 7.87 7.96 9 8.5 9.17 9.25 9.88 10 11.25 11.72 14.00 15.00 24 Turmeric (100g) Gram 9.37 9.38 10 10 10.12 9.79 10.66 9.37 10.88 11.09 20.00 22.00 25 Garlic Kg 38.12 61 54.75 57.7 50.41 57.29 82.5 69.28 68.75 87.51 172.00 140.00 26 Ginger Kg 13.25 13.66 10.79 10.54 16.29 16.25 12.5 12.12 21.88 21.25 30.00 30.00 27 Chilly Powder (100g.) Gram 9.5 10.66 12.29 8 9.83 9.42 10.63 20 20.25 17.56 18.00 22.00 VII VEGETABLES 28 Potato Kg 10.7 13.04 12.77 10.8 11.83 13.54 12.69 12.5 14.5 22.42 18.00 22.00 29 Onion Kg 16.25 16.91 15.92 21.37 19.41 22.83 22.83 19.37 27.5 30.58 45.00 24.00 30 Brinjal Kg 12 14.53 15.46 15.1 13.79 16.44 20 24.14 30.59 26.58 38.00 41.00 31 Tomato Kg 20.48 33.2 31.4 27.64 26.45 27.75 30.62 30.62 33.35 49.48 43.00 67.00 32 French Bean Kg 24.28 26.35 25.42 22.12 25.21 24.58 29.69 26.87 39.38 40.48 49.00 62.00 33 Bitter Guard Kg 27.25 26.25 30.38 29.68 30 27.22 32.5 37.5 39.38 40.93 36.00 60.00 34 Chilly Green Kg 46.66 41.59 37.2 26.56 37.38 32.91 45 66.25 94.38 93.49 69.00 99.00 35 Squash Kg 20 11.87 12.14 11.8 12.67 12.98 17.5 20 19.17 16.82 21.00 24.00 36 Mustard Leaf Kg 20.71 21.5 22 23.75 23.96 18.54 21.56 20 27.5 26.14 45.00 37 Pumpkin Leaf Kg 21.5 22.5 23 24 24 24 24 21.25 28.75 26.76 36.00 45.00 38 Cowpea Leaf (Behlawi) Kg 24 23 22 22 23 24 24 30 25 27.23 35.00 42.00
VIII FRUITS 39 Banana Dozen 27 26.4 23.52 23.16 26.52 30 27 24 29.28 25.88 36.00 48.00 40 Pineapple Kg 12.5 10 15 8.25 10 12 12 15 18.75 15.48 30.00 29.00 IX BEVERAGE 41 Sugar Kg 20.06 20 20.17 20 23.12 24.71 25 23.62 27.25 34.43 43.00 44.00
42 Tea Leaf (Uphaar Red) 250g. Gram 40 41 42 39.04 42.33 42.33 53.13 51.25 55.6 60.21 61.00 66.00
43 Gur Kg 21.67 21.91 21.9 21.87 26.56 24.37 26.25 30 30.94 36.5 46.00 60.00

Economic Survey Mizoram 2013-14 ~ 153 ~ Essential Commodities
Economic Survey Mizoram 2013-14
X INTOXICATES 44 Finished Pan No. 1.00 1.00 1.00 1.00 1.00 1.00 1.00 1.00 1.00 1.00 1.00 2.00 45 Tobacco Leaf Kg 112.50 122.58 118.75 110.00 117.91 152.08 138.75 147.50 178.75 182.20 223.00 240.00 46 Mizo zial (10 Sticks) No. 2.00 1.97 2.00 2.00 2.06 2.75 3.15 3.00 3.60 2.83 3.00 3.00 47 Wills Navy Cut (10 Sticks) No. 19.75 25.79 13.73 14.37 14.87 15.00 24.88 28.60 35.38 37.63 42.00 45.00 XI FUEL & LIGHTING 48 L.P.G. Gas (14.20 Kg) Cylinder 243.00 254.00 250.25 260.27 305.60 305.40 305.63 305.63 325.00 320.44 361.00 416.00 49 Electricity (Below 50w) Unit 1.31 1.31 1.31 1.31 1.31 1.31 1.31 1.45 1.45 1.45 1.40 1.70 XII SOAP 50 Washing Soap (Ball) Per Ball 10.00 10.38 10.25 11.25 11.67 11.75 12.00 13.75 15.50 15.58 18.00 20.00 51 Cinthol (Bathing Soap) No. 12.50 13.21 12.08 12.46 12.83 18.13 19.50 20.00 23.10 23.23 25.00 27.00
XIII EDUCATION
52 School Uniform Shoe (Intac) Pair 246.00 287.50 288.75 362.50 358.50 399.84 406.40 411.00 449.00
53 School Tution Fee (Pvt.) Month 153.75 154.17 161.66 200.00 200.00 200.00 200.00 212.50 240.00 242.08 294.00 372.00 XIV MEDICAL CARE
54 Doctor Consultation Fee Per Visit 50.00 66.66 79.58 93.75 93.33 100.00 100.00 100.00 100.00 100.00 122.00 137.00
55 Paracetamol Per Strip 4.88 5.21 5.00 5.00 5.00 5.88 5.50 5.83 6.00 6.46 7.00 8.00
XV BEDDING & CLOTHING 56 Secondhand Shirt No. 60.00 70.00 75.00 80.00 90.00 95.00 100.00 100.00 103.13 139.17 164.00 160.00 57 Secondhand Pant No. 150.00 140.00 160.00 180.00 190.00 200.00 200.00 210.00 178.75 188.45 199.00 217.00 58 Mattress – 3 Kgs Cotton No. 351.25 393.29 360.42 294.58 373.33 343.75 417.14 407.14 457.50 451.08 584.00 638.00 59 Rizai – 2Kgs Cotton No. 281.25 289.16 286.16 298.75 297.92 281.25 330.00 347.14 387.50 387.97 500.00 459.00 60 Mosquito Net (Double) No. 340.00 350.00 360.00 350.00 360.00 380.00 450.00 380.00 393.75 419.47 352.00 544.00 61 Mosquito Net (Single) No. 270.00 290.00 300.00 240.95 250.00 300.00 350.00 310.00 320.00 310.42 462.00 393.00
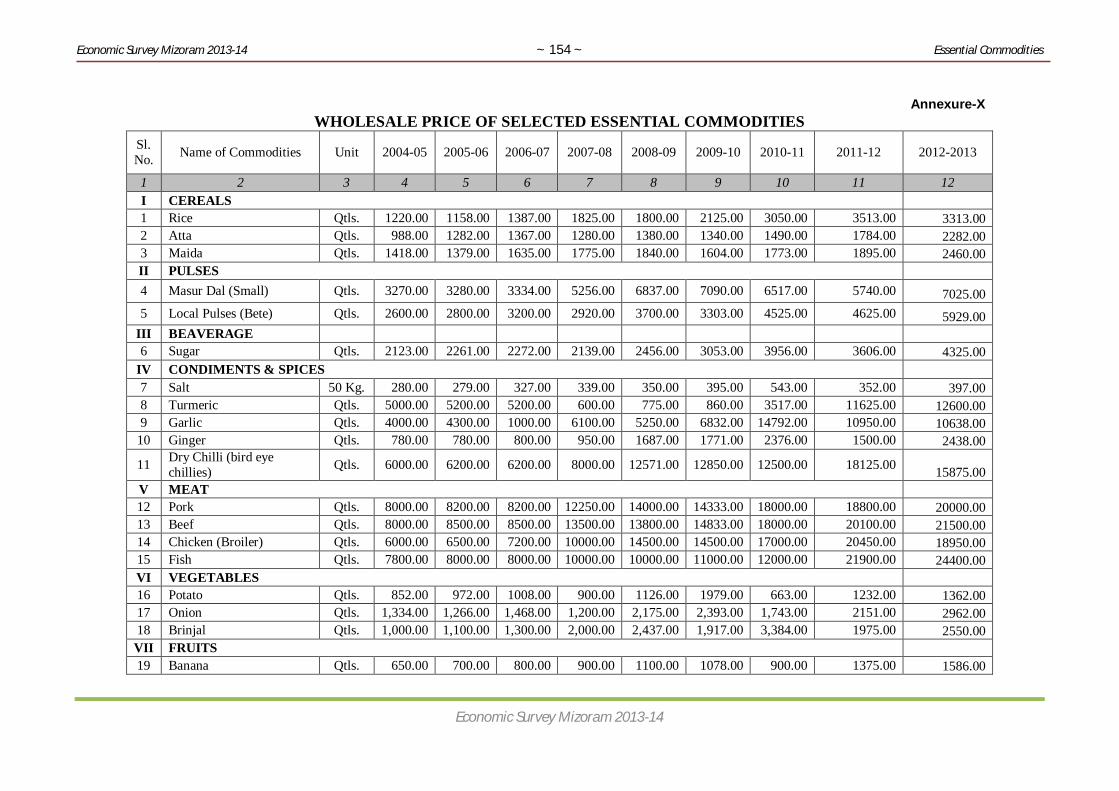
Economic Survey Mizoram 2013-14 ~ 154 ~ Essential Commodities
Economic Survey Mizoram 2013-14
Annexure-X
WHOLESALE PRICE OF SELECTED ESSENTIAL COMMODITIES Sl. No. Name of Commodities Unit 2004-05 2005-06 2006-07 2007-08 2008-09 2009-10 2010-11 2011-12 2012-2013
1 2 3 4 5 6 7 8 9 10 11 12 I CEREALS 1 Rice Qtls. 1220.00 1158.00 1387.00 1825.00 1800.00 2125.00 3050.00 3513.00 3313.00 2 Atta Qtls. 988.00 1282.00 1367.00 1280.00 1380.00 1340.00 1490.00 1784.00 2282.00 3 Maida Qtls. 1418.00 1379.00 1635.00 1775.00 1840.00 1604.00 1773.00 1895.00 2460.00 II PULSES 4 Masur Dal (Small) Qtls. 3270.00 3280.00 3334.00 5256.00 6837.00 7090.00 6517.00 5740.00 7025.00 5 Local Pulses (Bete) Qtls. 2600.00 2800.00 3200.00 2920.00 3700.00 3303.00 4525.00 4625.00 5929.00
III BEAVERAGE 6 Sugar Qtls. 2123.00 2261.00 2272.00 2139.00 2456.00 3053.00 3956.00 3606.00 4325.00
IV CONDIMENTS & SPICES 7 Salt 50 Kg. 280.00 279.00 327.00 339.00 350.00 395.00 543.00 352.00 397.00 8 Turmeric Qtls. 5000.00 5200.00 5200.00 600.00 775.00 860.00 3517.00 11625.00 12600.00 9 Garlic Qtls. 4000.00 4300.00 1000.00 6100.00 5250.00 6832.00 14792.00 10950.00 10638.00
10 Ginger Qtls. 780.00 780.00 800.00 950.00 1687.00 1771.00 2376.00 1500.00 2438.00
11 Dry Chilli (bird eye chillies) Qtls. 6000.00 6200.00 6200.00 8000.00 12571.00 12850.00 12500.00 18125.00 15875.00
V MEAT 12 Pork Qtls. 8000.00 8200.00 8200.00 12250.00 14000.00 14333.00 18000.00 18800.00 20000.00 13 Beef Qtls. 8000.00 8500.00 8500.00 13500.00 13800.00 14833.00 18000.00 20100.00 21500.00 14 Chicken (Broiler) Qtls. 6000.00 6500.00 7200.00 10000.00 14500.00 14500.00 17000.00 20450.00 18950.00 15 Fish Qtls. 7800.00 8000.00 8000.00 10000.00 10000.00 11000.00 12000.00 21900.00 24400.00 VI VEGETABLES 16 Potato Qtls. 852.00 972.00 1008.00 900.00 1126.00 1979.00 663.00 1232.00 1362.00 17 Onion Qtls. 1,334.00 1,266.00 1,468.00 1,200.00 2,175.00 2,393.00 1,743.00 2151.00 2962.00 18 Brinjal Qtls. 1,000.00 1,100.00 1,300.00 2,000.00 2,437.00 1,917.00 3,384.00 1975.00 2550.00 VII FRUITS 19 Banana Qtls. 650.00 700.00 800.00 900.00 1100.00 1078.00 900.00 1375.00 1586.00

Economic Survey Mizoram 2013-14 ~ 155 ~ School Enrolement:Teacher-Pupil Ratio
Economic Survey Mizoram 2013-14
Annexure-XI Percentage Distribution of Total Workers, Marginal Workers & Main workers by broad industrial categories
Sl No.
Year / District
Total wor-kers(% to
total popul-ation)
Marginal workers -(% to total popula-
tion)
Main wor-kers (% to
total popula-tion)
% to total main workers
Cultivators Agricul-tural labourers
House-hold Industry workers
Other wor-kers
1 2 3 4 5 6 7 8 9 10
1 1981 Rural 36.66 3.12 33.54 82.86 1.31 0.43 15.38 Urban 8.77 0.58 8.18 20.53 7.25 2.55 69.64 Com-bine 45.44 3.71 41.73 70.63 2.48 0.85 26.03
2 1991 Rural 51.2 5.7 45.5 82 1.65 0.4 16.42 Urban 46.2 8.2 38.1 33 5.56 1.87 59.43 Com-bine 48.9 6.8 42.1 61 3.28 1.02 34.35
3 2001 Rural 28.82 6.13 22.69 81.66 2 0.73 15.59 Urban 23.75 5.66 18.1 23.77 4.22 1.8 70.2 Com-bine 52.57 11.78 40.79 62.14 3.32 1.33 44.22
4 2011 Rural 23.00 3.15 19.85 46.31 4.60 0.60 9.30 Urban 21.36 3.38 17.97 9.01 5.47 1.29 40.68 Com-bine 44.36 6.53 37.83 55.32 10.07 1.89 49.99
District-wise (2001)
1 Mamit 3.58 0.29 3.30 6.91 0.62 0.06 1.89 2 Kolasib 3.34 0.64 2.71 4.34 1.43 0.14 2.93 3 Aizawl 15.92 2.17 13.80 9.46 2.75 0.81 29.05 4 Champhai 5.50 0.66 4.84 9.24 1.40 0.24 3.66 5 Serchhip 2.95 0.23 2.72 5.25 0.31 0.22 2.02 6 Lunglei 7.14 1.48 5.65 11.67 2.57 0.20 5.15 7 Lawngtlai 4.15 0.68 3.47 7.03 0.76 0.15 3.04 8 Saiha 1.77 0.43 1.34 2.15 0.23 0.08 2.24
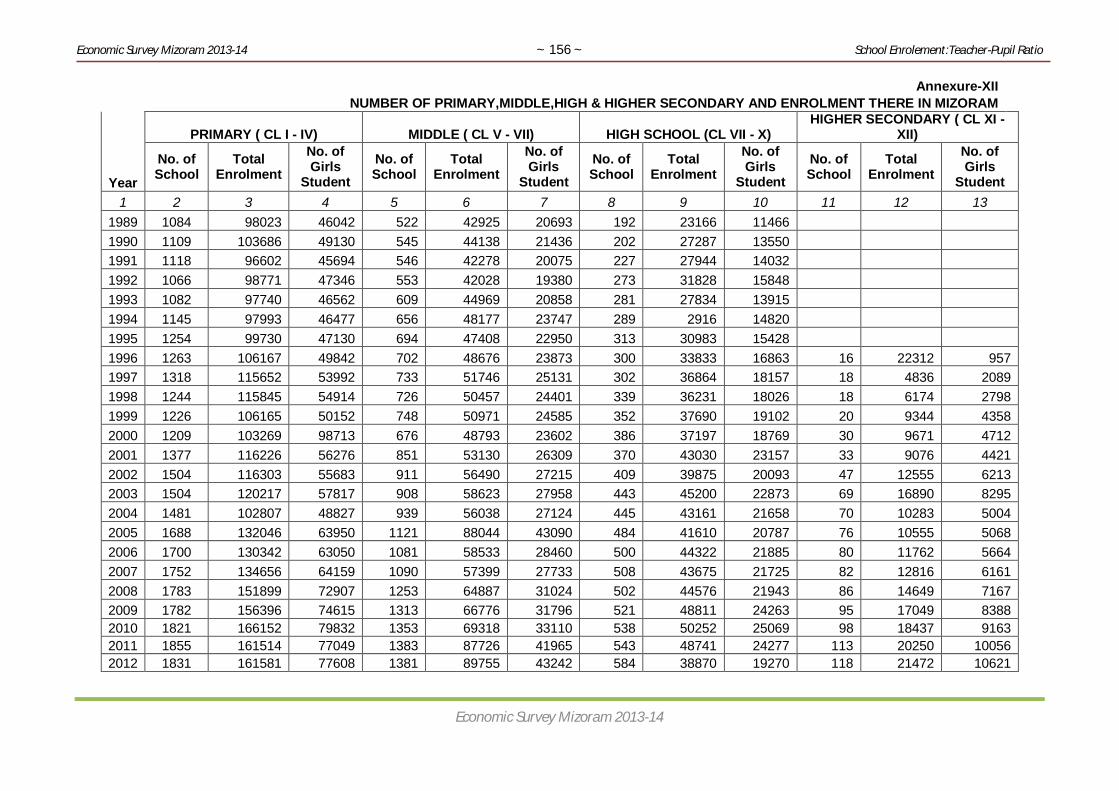
Economic Survey Mizoram 2013-14 ~ 156 ~ School Enrolement:Teacher-Pupil Ratio
Economic Survey Mizoram 2013-14
Annexure-XII NUMBER OF PRIMARY,MIDDLE,HIGH & HIGHER SECONDARY AND ENROLMENT THERE IN MIZORAM
Year
PRIMARY ( CL I - IV) MIDDLE ( CL V - VII) HIGH SCHOOL (CL VII - X) HIGHER SECONDARY ( CL XI -
XII)
No. of School
Total Enrolment
No. of Girls
Student No. of School
Total Enrolment
No. of Girls
Student No. of School
Total Enrolment
No. of Girls
Student No. of School
Total Enrolment
No. of Girls
Student 1 2 3 4 5 6 7 8 9 10 11 12 13
1989 1084 98023 46042 522 42925 20693 192 23166 11466 1990 1109 103686 49130 545 44138 21436 202 27287 13550 1991 1118 96602 45694 546 42278 20075 227 27944 14032 1992 1066 98771 47346 553 42028 19380 273 31828 15848 1993 1082 97740 46562 609 44969 20858 281 27834 13915 1994 1145 97993 46477 656 48177 23747 289 2916 14820 1995 1254 99730 47130 694 47408 22950 313 30983 15428 1996 1263 106167 49842 702 48676 23873 300 33833 16863 16 22312 957 1997 1318 115652 53992 733 51746 25131 302 36864 18157 18 4836 2089 1998 1244 115845 54914 726 50457 24401 339 36231 18026 18 6174 2798 1999 1226 106165 50152 748 50971 24585 352 37690 19102 20 9344 4358 2000 1209 103269 98713 676 48793 23602 386 37197 18769 30 9671 4712 2001 1377 116226 56276 851 53130 26309 370 43030 23157 33 9076 4421 2002 1504 116303 55683 911 56490 27215 409 39875 20093 47 12555 6213 2003 1504 120217 57817 908 58623 27958 443 45200 22873 69 16890 8295 2004 1481 102807 48827 939 56038 27124 445 43161 21658 70 10283 5004 2005 1688 132046 63950 1121 88044 43090 484 41610 20787 76 10555 5068 2006 1700 130342 63050 1081 58533 28460 500 44322 21885 80 11762 5664 2007 1752 134656 64159 1090 57399 27733 508 43675 21725 82 12816 6161 2008 1783 151899 72907 1253 64887 31024 502 44576 21943 86 14649 7167 2009 1782 156396 74615 1313 66776 31796 521 48811 24263 95 17049 8388 2010 1821 166152 79832 1353 69318 33110 538 50252 25069 98 18437 9163 2011 1855 161514 77049 1383 87726 41965 543 48741 24277 113 20250 10056 2012 1831 161581 77608 1381 89755 43242 584 38870 19270 118 21472 10621

Economic Survey Mizoram 2013-14 ~ 157 ~ School Enrolement:Teacher-Pupil Ratio
Economic Survey Mizoram 2013-14
Annexure-XIII TEACHER-PUPIL RATIO
Sl. No Year /District
Primary School Middle School High School Higher Secondary School Teacher Pupil Ratio Teacher Pupil Ratio Teacher Pupil Ratio Teacher Pupil Ratio
1 2 3 4 5 6 7 8 9 10 11 12 13 14
1 2000-2001 4505 103269 1:23 4999 48793 1:10 2805 37197 1:13 504 9871 1:20 2 2001-2002 5429 114229 1:21 5747 53130 1:9 2853 43030 1:15 485 9076 1:19 3 2002-2003 5855 116303 1:20 5599 56490 1:10 2923 39875 1:14 648 12555 1:19 4 2003-2004 5861 120217 1:21 5608 58623 1:10 3108 45200 1:15 669 16890 1:25 5 2004-2005 5469 102807 1:19 7067 56038 1:8 3592 43161 1:12 845 10283 1:12 6 2005-2006 5210 132046 1:25 7983 88044 1:11 3694 41610 1:11 854 10555 1:12 7 2006-2007 8099 130342 1:16 7271 58533 1:8 3768 44322 1:12 929 11762 1:13 8 2007-2008 8002 134656 1:17 6846 57399 1:8 3935 43675 1:11 941 12816 1:13 9 2008-2009 8716 151899 1:17 7754 64887 1:8 3886 44576 1:11 1058 14649 1:13
10 2009-2010 8477 156396 1:18 7564 66776 1:9 3853 48811 1:13 1224 17049 1:14 11 2010-2011 8310 166152 1:20 7824 69318 1:9 3870 50252 1:13 1224 18437 1:15 12 2011-2012 8488 161514 1:19 9638 87726 1:9 4212 48741 1:12 1367 20250 1:15 13 2012-2013 8703 161581 1:19 9883 89755 1:9 4414 38870 1:9 1468 21472 1:15
District-wise 2012-2013 1 Mamit 663 12057 1:18 728 5950 1:8 272 1833 1:7 39 265 1:7 2 Kolasib 554 13343 1:24 741 6988 1:9 300 2704 1:9 77 798 1:10 3 Aizawl 2597 49967 1:19 3042 32874 1:11 1677 16695 1:10 788 13258 1:17 4 Champhai 890 19474 1:22 1312 12111 1:9 557 4371 1:8 123 1362 1:11 5 Serchhip 493 8522 1:17 654 5882 1:9 283 2492 1:9 99 953 1:10 6 Lunglei 1544 23536 1:15 1658 12212 1:7 748 5484 1:7 222 2913 1:13 7 Lawngtlai 1128 21751 1:19 1096 8001 1:7 341 3065 1:9 60 1006 1:17 8 Saiha 834 12931 1:16 652 5737 1:9 236 2226 1:9 60 917 1:15 Total 8703 161581 1:19 9883 89755 1:9 4414 38870 1:9 1468 21472 1:5
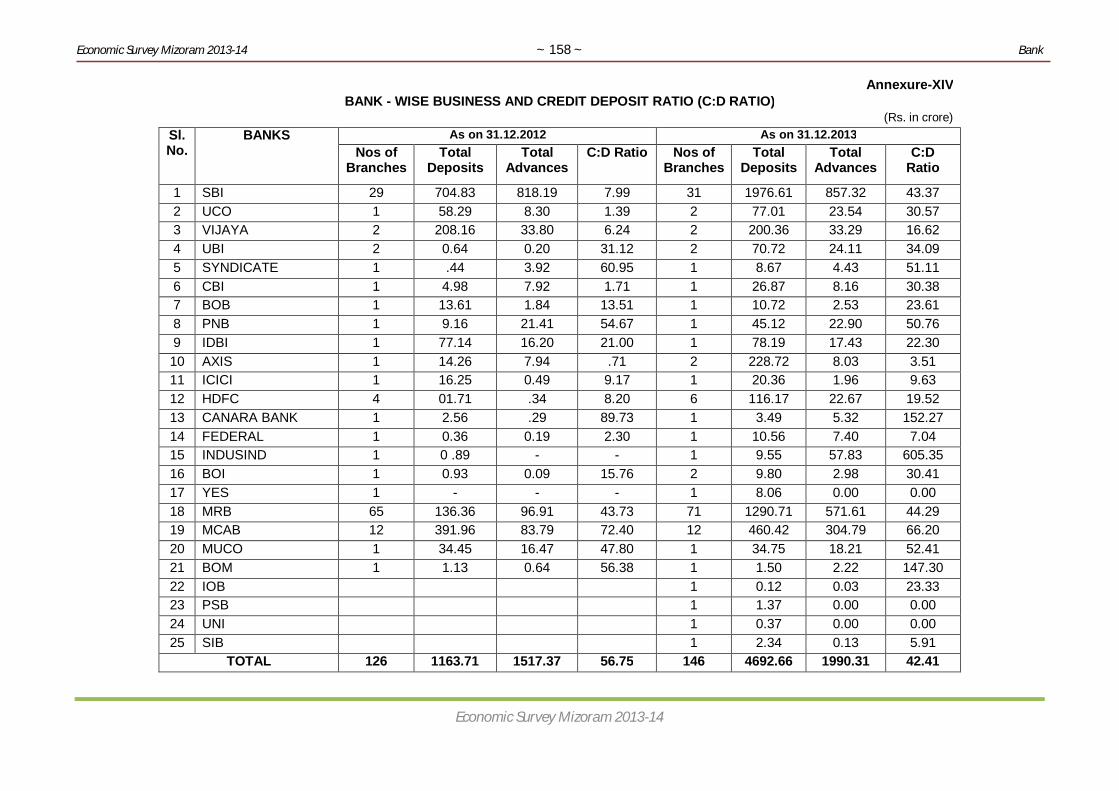
Economic Survey Mizoram 2013-14 ~ 158 ~ Bank
Economic Survey Mizoram 2013-14
Annexure-XIV BANK - WISE BUSINESS AND CREDIT DEPOSIT RATIO (C:D RATIO)
(Rs. in crore) Sl. No.
BANKS As on 31.12.2012 As on 31.12.2013 Nos of
Branches Total
Deposits Total
Advances C:D Ratio Nos of
Branches Total
Deposits Total
Advances C:D
Ratio
1 SBI 29 704.83 818.19 7.99 31 1976.61 857.32 43.37 2 UCO 1 58.29 8.30 1.39 2 77.01 23.54 30.57 3 VIJAYA 2 208.16 33.80 6.24 2 200.36 33.29 16.62 4 UBI 2 0.64 0.20 31.12 2 70.72 24.11 34.09 5 SYNDICATE 1 .44 3.92 60.95 1 8.67 4.43 51.11 6 CBI 1 4.98 7.92 1.71 1 26.87 8.16 30.38 7 BOB 1 13.61 1.84 13.51 1 10.72 2.53 23.61 8 PNB 1 9.16 21.41 54.67 1 45.12 22.90 50.76 9 IDBI 1 77.14 16.20 21.00 1 78.19 17.43 22.30 10 AXIS 1 14.26 7.94 .71 2 228.72 8.03 3.51 11 ICICI 1 16.25 0.49 9.17 1 20.36 1.96 9.63 12 HDFC 4 01.71 .34 8.20 6 116.17 22.67 19.52 13 CANARA BANK 1 2.56 .29 89.73 1 3.49 5.32 152.27 14 FEDERAL 1 0.36 0.19 2.30 1 10.56 7.40 7.04 15 INDUSIND 1 0 .89 - - 1 9.55 57.83 605.35 16 BOI 1 0.93 0.09 15.76 2 9.80 2.98 30.41 17 YES 1 - - - 1 8.06 0.00 0.00 18 MRB 65 136.36 96.91 43.73 71 1290.71 571.61 44.29 19 MCAB 12 391.96 83.79 72.40 12 460.42 304.79 66.20 20 MUCO 1 34.45 16.47 47.80 1 34.75 18.21 52.41 21 BOM 1 1.13 0.64 56.38 1 1.50 2.22 147.30 22 IOB 1 0.12 0.03 23.33 23 PSB 1 1.37 0.00 0.00 24 UNI 1 0.37 0.00 0.00 25 SIB 1 2.34 0.13 5.91
TOTAL 126 1163.71 1517.37 56.75 146 4692.66 1990.31 42.41
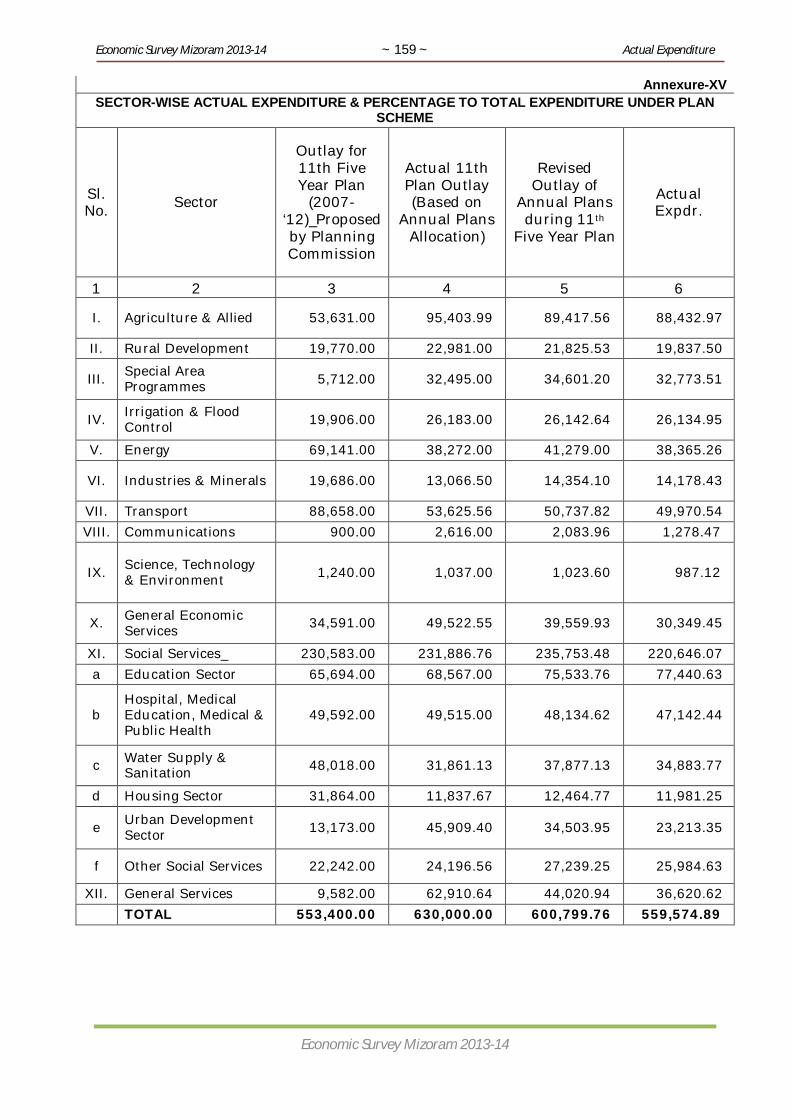
Economic Survey Mizoram 2013-14 ~ 159 ~ Actual Expenditure
Economic Survey Mizoram 2013-14
Annexure-XV SECTOR-WISE ACTUAL EXPENDITURE & PERCENTAGE TO TOTAL EXPENDITURE UNDER PLAN
SCHEME
Sl. No. Sector
Outlay for 11th Five Year Plan
(2007-‘12)_Proposed by Planning Commission
Actual 11th Plan Outlay (Based on
Annual Plans Allocation)
Revised Outlay of
Annual Plans during 11th
Five Year Plan
Actual Expdr.
1 2 3 4 5 6
I. Agriculture & Allied 53,631.00 95,403.99 89,417.56 88,432.97
II. Rural Development 19,770.00 22,981.00 21,825.53 19,837.50
III. Special Area Programmes 5,712.00 32,495.00 34,601.20 32,773.51
IV. Irrigation & Flood Control 19,906.00 26,183.00 26,142.64 26,134.95
V. Energy 69,141.00 38,272.00 41,279.00 38,365.26
VI. Industries & Minerals 19,686.00 13,066.50 14,354.10 14,178.43
VII. Transport 88,658.00 53,625.56 50,737.82 49,970.54 VIII. Communications 900.00 2,616.00 2,083.96 1,278.47
IX. Science, Technology & Environment 1,240.00 1,037.00 1,023.60 987.12
X. General Economic Services 34,591.00 49,522.55 39,559.93 30,349.45
XI. Social Services_ 230,583.00 231,886.76 235,753.48 220,646.07 a Education Sector 65,694.00 68,567.00 75,533.76 77,440.63
b Hospital, Medical Education, Medical & Public Health
49,592.00 49,515.00 48,134.62 47,142.44
c Water Supply & Sanitation 48,018.00 31,861.13 37,877.13 34,883.77
d Housing Sector 31,864.00 11,837.67 12,464.77 11,981.25
e Urban Development Sector 13,173.00 45,909.40 34,503.95 23,213.35
f Other Social Services 22,242.00 24,196.56 27,239.25 25,984.63
XII. General Services 9,582.00 62,910.64 44,020.94 36,620.62 TOTAL 553,400.00 630,000.00 600,799.76 559,574.89

Economic Survey Mizoram 2013-14 ~ 160 ~ Actual Expenditure
Economic Survey Mizoram 2013-14
Sl. No. Major Head/Minor Head of Development 2005-06 2006-07 2007-08 2008-09 2009-10 2010-11 2011-12 2012-13
1 2 4 5 6 7 8 9 9 9I AGRI & ALLIED ACTIVITIES
Crop Husbandry 33.18 31.84 33.48 36.74 22.58 109.24 167.21 196.32 Horticulture 7.37 6.79 8.23 8.50 7.83 60.37 23.36 107.19 Soil & Water Conservation 3.88 3.00 3.04 3.58 3.41 17.52 28.77 44.56 Animal Husbandry 7.26 6.20 6.60 6.62 6.79 41.77 89.20 98.47 Dairy Development 0.40 0.40 0.50 0.49 0.50 0.50 0.49 0.40 Fisheries 2.30 2.34 3.13 4.54 6.54 10.49 16.70 24.43 Forestry & Wildlife 10.47 13.35 13.00 11.17 9.76 37.76 29.76 36.21 Agri. Research & Education 0.10 0.12 1.18 0.12 0.13 2.58 2.58 5.50 Co-operation 5.15 6.45 6.56 6.02 6.65 6.32 7.96 5.77 Agri. Marketing & Qlty control (Trade & Commerce) 3.35 2.06 1.95 2.20 3.15 4.00 2.38 2.61 TOTAL : 73.46 90.54 77.67 79.98 67.34 290.55 368.41 521.46
II RURAL DEVELOPMENT Special Programme for R.D. a) IRDP & Allied Programme 3.23 3.36 12.36 5.60 - - - 4.22 b) Self Employment Programme for Rural Dev. - - - - 3.97 4.20 5.32 5.42 c) SLMC & IAC - - - - 0.49 0.56 0.46 - NREGS - - - - 9.65 9.34 9.95 28.22 Rural Employment a) SGRY/IAY 2.61 2.73 1.68 15.34 - - - 1.25 Land Reforms 3.63 3.93 4.11 3.92 3.79 3.91 3.73 3.46 Other Rural Development Prog. including Com. Dev. & Panchayat I) Rural Housing 6.26 6.26 - - - 4.00 1.00 3.99 ii) Indira Awas Yojona (IAY) 0.76 1.05 1.01 2.61 1.40 1.50 1.50 - iii) Others 7.01 20.57 27.87 15.89 11.98 14.63 11.40 - TOTAL : 23.50 37.89 47.03 43.36 31.28 38.14 33.36 46.56
III SPECIAL AREA PROGRAMME Border Area Dev. Prog. BADP 8.87 13.02 - 30.25 22.14 32.07 36.99 41.57 Fund under Article 275 (I) 2.64 3.24 2.03 4.24 3.94 8.61 5.10 2.77 Others I) Sinlung Hills Dev. Council 1.07 1.25 1.41 1.96 2.50 2.47 2.34 3.00 ii) Backward Dist. Area funds 7.50 22.50 15.00 20.97 21.48 27.75 25.83 19.16 iii) M.L.A., LAD Scheme 2.00 4.00 6.00 8.00 10.00 10.00 10.00 12.00 TOTAL : 22.08 44.01 24.44 65.42 60.06 80.90 80.26 78.50
(Rs. In crore)
ANNEXURE - XVIACTUAL EXPENDITURE UNDER PLAN SCHEME

Economic Survey Mizoram 2013-14 ~ 161 ~ Actual Expenditure
Economic Survey Mizoram 2013-14
IV IRRIGATION AND FLOOD CONTROL Major & Medium Irrigation 0.01 0.01 0.01 0.10 0.01 0.01 0.01 0.01 Minor Irrigation 18.80 31.53 33.10 66.43 48.01 59.41 53.59 5.04 Command Area Development 0.15 0.15 0.18 0.15 0.15 0.15 0.15 0.10 TOTAL 18.96 31.69 33.29 66.68 48.17 59.57 53.75 5.15
V ENERGY Power 90.26 68.34 67.00 50.40 101.62 73.59 90.25 97.80 Non-Conventional Sources 0.50 0.50 0.45 0.50 - - 0.50 0.40 Integrated Rural Energy Prog.IREP 0.11 0.11 0.10 0.11 - - 0.11 0.11 TOTAL 90.87 68.95 67.55 51.01 101.62 73.59 90.86 98.31
VI INDUSTRY & MINERALS Village & Small Industries I) Industry 24.37 20.35 14.86 23.35 13.88 33.72 21.36 77.85 2) Sericulture 3.62 3.55 3.84 3.91 3.97 10.87 5.28 17.73 Industries (other than V & SI) 1.00 1.20 1.44 0.10 0.10 0.10 0.10 0.10 Mines & Minerals 0.90 1.01 1.08 0.65 0.62 0.70 0.99 0.90 TOTAL 29.89 26.11 21.22 28.01 18.57 45.39 27.73 96.58
VII TRANSPORT Aviation 0.07 0.29 0.82 2.27 0.67 1.25 0.86 1.43 Roads and Bridges 126.47 112.61 138.62 47.26 66.49 125.34 85.85 70.00 Road Transport 4.71 4.95 4.30 3.97 6.01 5.00 4.99 4.33 Inland Water Transport 0.05 0.32 0.04 0.04 0.05 0.04 0.05 0.05 M.V. Wing 0.82 1.01 1.15 1.01 0.93 1.06 1.09 0.84 TOTAL 132.12 119.18 144.93 54.55 74.15 132.69 92.84 76.65
VIII COMMUNICATION Other Communication Capacity Building under National E. Governance Action Plan 0.41 0.73 - 4.49 2.67 2.65 2.19 5.99 TOTAL 0.41 0.73 - 4.49 2.67 2.65 2.19 5.99
IX SCIENCE, TECH & ENVIRONMENT Scientific Research (inc S&T) 1.33 1.51 2.09 1.98 2.00 2.00 1.97 1.60 Ecology & Environment 0.04 0.04 0.04 0.04 - 0.40 0.04 0.04 TOTAL 1.37 1.55 2.13 2.02 2.00 2.40 2.01 1.64
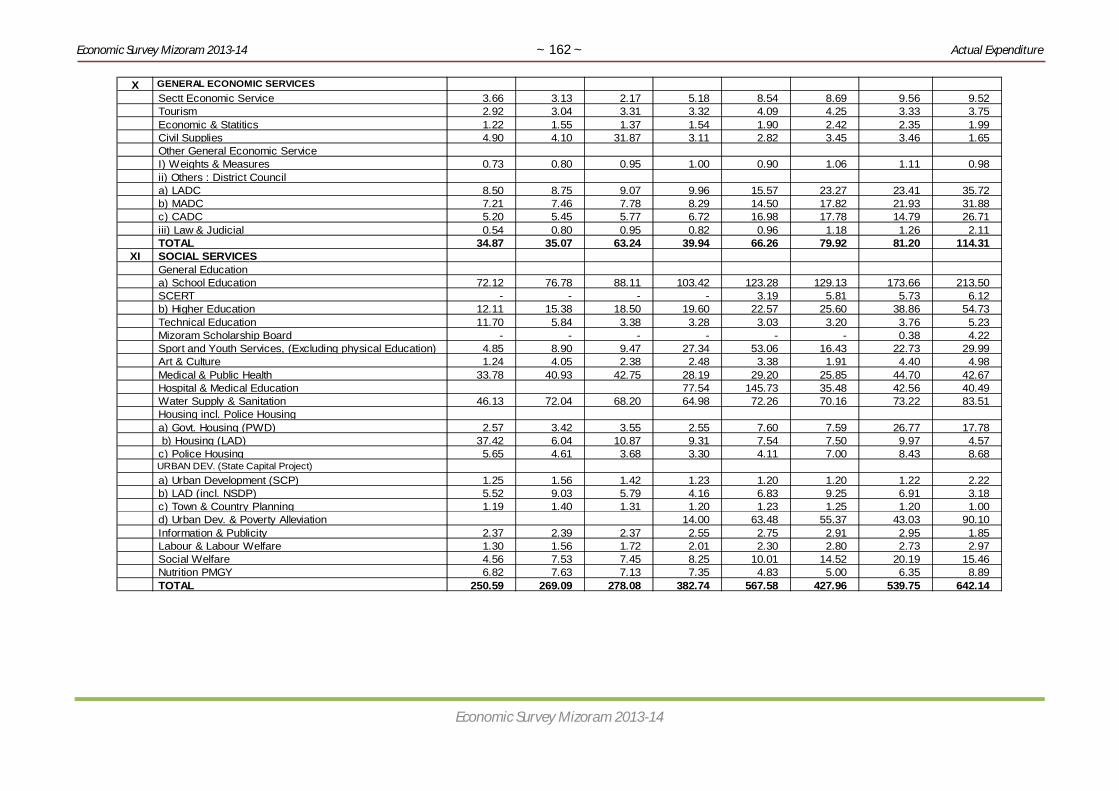
Economic Survey Mizoram 2013-14 ~ 162 ~ Actual Expenditure
Economic Survey Mizoram 2013-14
X GENERAL ECONOMIC SERVICES Sectt Economic Service 3.66 3.13 2.17 5.18 8.54 8.69 9.56 9.52 Tourism 2.92 3.04 3.31 3.32 4.09 4.25 3.33 3.75 Economic & Statitics 1.22 1.55 1.37 1.54 1.90 2.42 2.35 1.99 Civil Supplies 4.90 4.10 31.87 3.11 2.82 3.45 3.46 1.65 Other General Economic Service I) Weights & Measures 0.73 0.80 0.95 1.00 0.90 1.06 1.11 0.98 ii) Others : District Council a) LADC 8.50 8.75 9.07 9.96 15.57 23.27 23.41 35.72 b) MADC 7.21 7.46 7.78 8.29 14.50 17.82 21.93 31.88 c) CADC 5.20 5.45 5.77 6.72 16.98 17.78 14.79 26.71 iii) Law & Judicial 0.54 0.80 0.95 0.82 0.96 1.18 1.26 2.11 TOTAL 34.87 35.07 63.24 39.94 66.26 79.92 81.20 114.31
XI SOCIAL SERVICES General Education a) School Education 72.12 76.78 88.11 103.42 123.28 129.13 173.66 213.50 SCERT - - - - 3.19 5.81 5.73 6.12 b) Higher Education 12.11 15.38 18.50 19.60 22.57 25.60 38.86 54.73 Technical Education 11.70 5.84 3.38 3.28 3.03 3.20 3.76 5.23 Mizoram Scholarship Board - - - - - - 0.38 4.22 Sport and Youth Services, (Excluding physical Education) 4.85 8.90 9.47 27.34 53.06 16.43 22.73 29.99 Art & Culture 1.24 4.05 2.38 2.48 3.38 1.91 4.40 4.98 Medical & Public Health 33.78 40.93 42.75 28.19 29.20 25.85 44.70 42.67 Hospital & Medical Education 77.54 145.73 35.48 42.56 40.49 Water Supply & Sanitation 46.13 72.04 68.20 64.98 72.26 70.16 73.22 83.51 Housing incl. Police Housing a) Govt. Housing (PWD) 2.57 3.42 3.55 2.55 7.60 7.59 26.77 17.78 b) Housing (LAD) 37.42 6.04 10.87 9.31 7.54 7.50 9.97 4.57 c) Police Housing 5.65 4.61 3.68 3.30 4.11 7.00 8.43 8.68 URBAN DEV. (State Capital Project) a) Urban Development (SCP) 1.25 1.56 1.42 1.23 1.20 1.20 1.22 2.22 b) LAD (incl. NSDP) 5.52 9.03 5.79 4.16 6.83 9.25 6.91 3.18 c) Town & Country Planning 1.19 1.40 1.31 1.20 1.23 1.25 1.20 1.00 d) Urban Dev. & Poverty Alleviation 14.00 63.48 55.37 43.03 90.10 Information & Publicity 2.37 2.39 2.37 2.55 2.75 2.91 2.95 1.85 Labour & Labour Welfare 1.30 1.56 1.72 2.01 2.30 2.80 2.73 2.97 Social Welfare 4.56 7.53 7.45 8.25 10.01 14.52 20.19 15.46 Nutrition PMGY 6.82 7.63 7.13 7.35 4.83 5.00 6.35 8.89 TOTAL 250.59 269.09 278.08 382.74 567.58 427.96 539.75 642.14

Economic Survey Mizoram 2013-14 ~ 163 ~ Actual Expenditure
Economic Survey Mizoram 2013-14
XII GENERAL SERVICES Jails 2.87 2.88 2.73 2.82 3.11 2.70 7.34 1.78 Stationery & Printing 1.00 1.80 1.41 1.91 1.50 1.65 1.78 1.49 Public Work 9.73 14.82 12.36 12.60 18.27 8.49 14.68 38.22 Other Administration Services I) Training (ATI) 0.89 0.96 0.95 0.66 1.32 0.97 0.94 0.77 ii) Other (Forensic Science) 0.04 0.04 0.10 0.10 0.15 0.25 0.35 0.25 iii) Fire Service Organisation - - - - 1.72 1.86 1.70 7.57 iv) GAD - - - - 1.38 2.25 5.77 4.37 v) Finance Department (incl. A & T) - - - - 85.60 36.76 129.90 - TOTAL 14.53 20.50 17.55 18.09 113.05 54.93 162.46 54.45 GRAND TOTAL 692.64 745.32 777.13 836.29 1,152.75 1,288.69 1,534.82 1,741.74
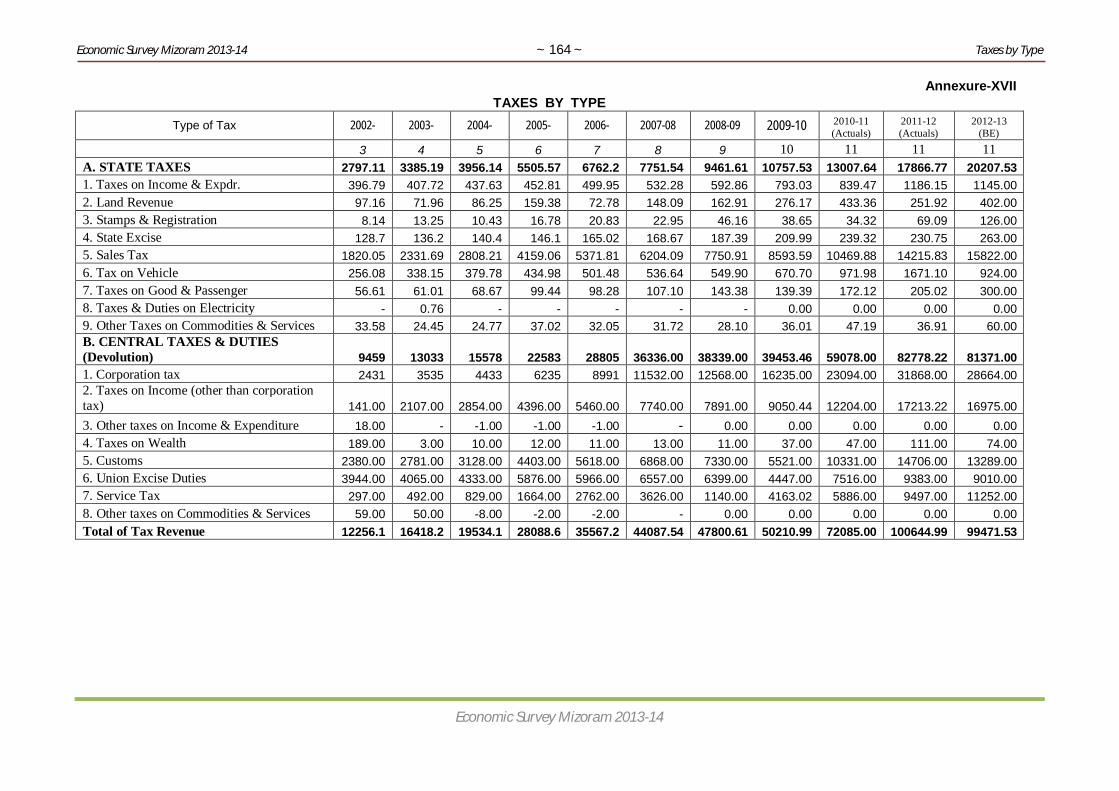
Economic Survey Mizoram 2013-14 ~ 164 ~ Taxes by Type
Economic Survey Mizoram 2013-14
Annexure-XVII TAXES BY TYPE
Type of Tax 2002- 2003- 2004- 2005- 2006- 2007-08 2008-09 2009-10 2010-11 (Actuals)
2011-12 (Actuals)
2012-13 (BE)
3 4 5 6 7 8 9 10 11 11 11 A. STATE TAXES 2797.11 3385.19 3956.14 5505.57 6762.2 7751.54 9461.61 10757.53 13007.64 17866.77 20207.53 1. Taxes on Income & Expdr. 396.79 407.72 437.63 452.81 499.95 532.28 592.86 793.03 839.47 1186.15 1145.00 2. Land Revenue 97.16 71.96 86.25 159.38 72.78 148.09 162.91 276.17 433.36 251.92 402.00 3. Stamps & Registration 8.14 13.25 10.43 16.78 20.83 22.95 46.16 38.65 34.32 69.09 126.00 4. State Excise 128.7 136.2 140.4 146.1 165.02 168.67 187.39 209.99 239.32 230.75 263.00 5. Sales Tax 1820.05 2331.69 2808.21 4159.06 5371.81 6204.09 7750.91 8593.59 10469.88 14215.83 15822.00 6. Tax on Vehicle 256.08 338.15 379.78 434.98 501.48 536.64 549.90 670.70 971.98 1671.10 924.00 7. Taxes on Good & Passenger 56.61 61.01 68.67 99.44 98.28 107.10 143.38 139.39 172.12 205.02 300.00 8. Taxes & Duties on Electricity - 0.76 - - - - - 0.00 0.00 0.00 0.00 9. Other Taxes on Commodities & Services 33.58 24.45 24.77 37.02 32.05 31.72 28.10 36.01 47.19 36.91 60.00 B. CENTRAL TAXES & DUTIES (Devolution) 9459 13033 15578 22583 28805 36336.00 38339.00 39453.46 59078.00 82778.22 81371.00 1. Corporation tax 2431 3535 4433 6235 8991 11532.00 12568.00 16235.00 23094.00 31868.00 28664.00 2. Taxes on Income (other than corporation tax) 141.00 2107.00 2854.00 4396.00 5460.00 7740.00 7891.00 9050.44 12204.00 17213.22 16975.00 3. Other taxes on Income & Expenditure 18.00 - -1.00 -1.00 -1.00 - 0.00 0.00 0.00 0.00 0.00 4. Taxes on Wealth 189.00 3.00 10.00 12.00 11.00 13.00 11.00 37.00 47.00 111.00 74.00 5. Customs 2380.00 2781.00 3128.00 4403.00 5618.00 6868.00 7330.00 5521.00 10331.00 14706.00 13289.00 6. Union Excise Duties 3944.00 4065.00 4333.00 5876.00 5966.00 6557.00 6399.00 4447.00 7516.00 9383.00 9010.00 7. Service Tax 297.00 492.00 829.00 1664.00 2762.00 3626.00 1140.00 4163.02 5886.00 9497.00 11252.00 8. Other taxes on Commodities & Services 59.00 50.00 -8.00 -2.00 -2.00 - 0.00 0.00 0.00 0.00 0.00 Total of Tax Revenue 12256.1 16418.2 19534.1 28088.6 35567.2 44087.54 47800.61 50210.99 72085.00 100644.99 99471.53

Economic Survey Mizoram 2013-14 ~ 165 ~ IAY & GSY
Economic Survey Mizoram 2013-14
1 Aizawl 112.67 6.26 118.93 88.06 8.10 96.16 22.01 2.03 24.04 2 Champhai 119.08 11.36 130.44 116.34 10.70 127.04 - - - 3 Kolasib 73.90 7.05 80.95 57.75 5.31 63.06 14.44 1.33 15.77 4 Lawngtlai 272.17 19.03 291.20 274.89 15.27 290.16 - - - 5 Lunglei 222.90 21.27 244.17 174.22 16.03 190.25 43.55 4.01 47.56 6 Mamit 135.10 9.14 144.24 105.58 9.71 115.30 26.40 2.43 28.83 7 Saiha 109.89 6.11 116.00 110.35 9.88 120.23 - - - 8 Serchhip 31.69 1.58 33.27 24.78 2.29 27.06 6.19 0.57 6.77
Total 1,077.40 81.79 1,159.19 951.96 77.30 1,029.26 112.60 10.36 122.96
1 Aizawl 66.40 0.15 75.80 5.11 80.91 66.40 7.44 73.84 2 Champhai 49.27 0.39 67.53 4.99 72.52 49.28 5.51 54.79 3 Kolasib 24.11 0.56 43.38 3.48 46.86 12.06 1.35 13.41 4 Lawngtlai - 1.93 59.39 4.48 63.87 40.80 4.58 45.38 5 Lunglei - - 70.43 5.18 75.61 52.30 5.85 58.15 6 Mamit - 0.20 47.78 3.53 51.31 28.68 3.23 31.91 7 Saiha 19.31 0.03 38.77 3.19 41.96 19.32 2.17 21.49 8 Serchhip - 0.04 44.37 3.53 47.90 25.13 1.40 26.53
Total 159.09 3.30 447.45 33.45 480.90 293.97 31.53 325.50
Annexure-XVIII
Financial Achievement on IAY during 2010-2011 & 2011-2012(Rs in lakhs)
Sl.No DistrictCentral Fund
released State Share
released Total fund received
New Construction Upgradation
Central Fund released
State Share released
Total fund received
Central Fund released
State Share released
Total fund received
2010-2011 2011-2012 (Upto Jan 2012) 2011-2012 (Upto Jan 2012)
Financial Achievement on SGSY during 2010-2011 & 2011-2012(Rs in lakhs)
Sl.No District Central Allocation
OB as on 1st April
2011
Central Fund released
State Share released
Total fund received
Total fund received Remarks
2010-2011 2011-2012 (Upto Jan 2012)
Central Fund
released
State Share released
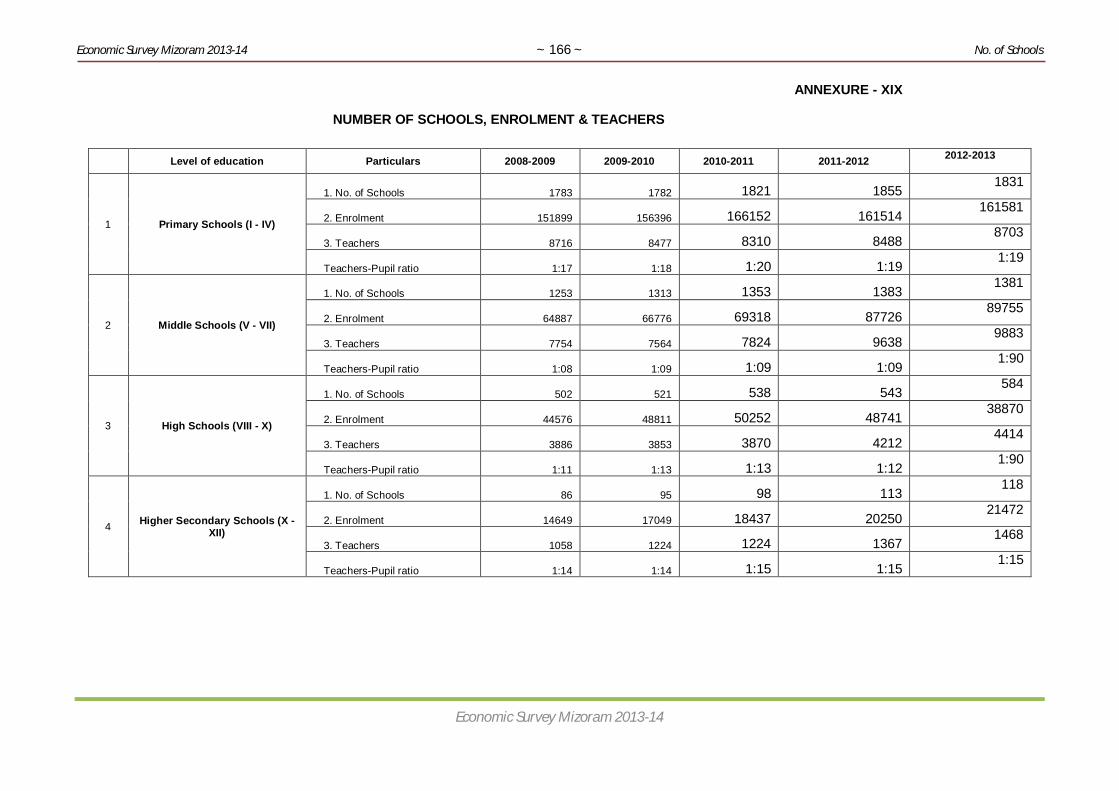
Economic Survey Mizoram 2013-14 ~ 166 ~ No. of Schools
Economic Survey Mizoram 2013-14
ANNEXURE - XIX
NUMBER OF SCHOOLS, ENROLMENT & TEACHERS
Level of education Particulars 2008-2009 2009-2010 2010-2011 2011-2012 2012-2013
1 Primary Schools (I - IV)
1. No. of Schools 1783 1782 1821 1855 1831
2. Enrolment 151899 156396 166152 161514 161581
3. Teachers 8716 8477 8310 8488 8703
Teachers-Pupil ratio 1:17 1:18 1:20 1:19 1:19
2 Middle Schools (V - VII)
1. No. of Schools 1253 1313 1353 1383 1381
2. Enrolment 64887 66776 69318 87726 89755
3. Teachers 7754 7564 7824 9638 9883
Teachers-Pupil ratio 1:08 1:09 1:09 1:09 1:90
3 High Schools (VIII - X)
1. No. of Schools 502 521 538 543 584
2. Enrolment 44576 48811 50252 48741 38870
3. Teachers 3886 3853 3870 4212 4414
Teachers-Pupil ratio 1:11 1:13 1:13 1:12 1:90
4 Higher Secondary Schools (X - XII)
1. No. of Schools 86 95 98 113 118
2. Enrolment 14649 17049 18437 20250 21472
3. Teachers 1058 1224 1224 1367 1468
Teachers-Pupil ratio 1:14 1:14 1:15 1:15 1:15


