Page 1
Economic Transfers and Social Cohesion in a Refugee-hosting Setting
Elsa Valli, Amber Peterman ,and Melissa Hidrobo
UNICEF Office of Research | Innocenti Working Paper
WP-2018-10 | June 2018
Page 2
Economic Transfers and Social Cohesion in a Refugee-hosting Setting
Elsa Valli, Amber Peterman and Melissa Hidrobo1
This Innocenti Working Paper has been published without undergoing layout, copy-editing
or proofreading. It is being released to rapidly share results of our work with the wider
research and practitioner communities, and to encourage discussion of methods and
findings.
Abstract
There is increasing interest in understanding if social protection has the ability to foster social
cohesion, particularly between refugees and host communities. Using an experimental
evaluation of transfers, including cash, food and food vouchers to Colombian refugees and
poor Ecuadorians in urban and peri-urban areas we examine if transfers resulted in changes in
social cohesion measures. The evaluation was a cluster-randomized control trial examining a
short-term programme implemented over six months by the World Food Programme. We
examine six aggregate dimensions of social cohesion, derived from 33 individual indicators,
in addition to an overall index of social cohesion. Overall results suggest that the programme
1 Elsa Valli and Amber Peterman are with the Social and Economic Policy Unit at the UNICEF Office for
Research–Innocenti. Melissa Hidrobo is with the Poverty, Health and Nutrition Division of the International
Food Policy Research Institute. Corresponding authors: Elsa Valli and Amber Peterman, Piazza SS. Annunziata
12, Florence, Italy 50122: [email protected] ; [email protected] .
We are grateful to the Centro de Estudios de Poblacion y Desarrollo Social for data collection and management
and to the World Food Programme (WFP) (Quito and Rome) for collaboration and programme implementation.
We thank colleagues at the International Food Policy Research Institute for support during the design and
implementation of the impact evaluation, including John Hoddinott, Amy Margolies and Vanessa Moreira and
participants at the 2017 International Conference on Social Protection in Contexts of Fragility and Forced
Displacement in Brussels, the 2018 Centre for the Study of African Economies Conference in Oxford, the 2018
Conference on Rigorous Evaluation in Europe in Turin, and Tilman Brück, Jose Cuesta, Jacobus de Hoop, and
Ugo Gentilini for helpful comments and feedback.
Page 3
1
contributed to integration of Colombians in the hosting community through increases in
personal agency, attitudes accepting diversity, confidence in institutions, and social
participation. However, while having no impact for the Ecuadorian population. There were
no negative impacts of the programme on indicators or domains analysed. Although we are
not able to specifically identify mechanisms, we hypothesize that these impacts are driven by
joint targeting, messaging around social inclusion and through interaction between
nationalities at mandated monthly nutrition trainings.
Key words: Social transfers, Colombian refugees, social cohesion
JEL codes: I38, J15, O19
Page 4
2
1. INTRODUCTION
According to the Office of the United Nations High Commissioner for Refugees (UNHCR),
an estimated 65 million individuals were forcibly displaced in 2015, an increase of nearly six
million individuals from the previous year (UNHCR, 2016). In response, global actors have
committed to exploring policies and interventions to mitigate against health, economic and
social consequences for both displaced populations and populations living in fragility in
sending countries. Social protection, including the use of social transfers, has been identified
as a key intervention for vulnerable populations in these settings, as signalled by the recent
high-level commitments at the World Humanitarian Summit, the Grand Bargain, and the
High-Level Panel on Humanitarian Cash Transfers (ODI and CGD, 2015).2 As the use of
social protection schemes among refugee populations of diverse ethnic groups within fragile
settings increases, the effects of these policies on social cohesion is being questioned. Social
protection has the potential to boost (directly or indirectly) measures of social cohesion by
creating good will, feelings of equal treatment (both within and between groups), trust in
institutions, and social capital through interaction with other beneficiaries during programme-
related activities (for example, training, community meetings) (Leites et al., 2017). However,
it is equally possible that implementation of social protection could generate feelings of
resentment and jealousy towards recipients by non-recipients and trigger or exacerbate
intracommunity or intra-ethnic tensions (Devereux et al., 2017).
The concept of social cohesion has been used to describe social relations, including
cooperation and solidarity between groups and individuals in a society, and their interrelation
with broader economic, social and political outcomes (Babajanian, 2012). Because of the
variety of definitions that have been produced, varying by discipline, context, or issues, it has
2 See ‘World Humanitarian Summit’, Meetings Coverage and Press Releases, United Nations, New York, 24
May, 2016, https://www.un.org/press/en/2016/iha1401.doc.htm.
Page 5
3
been described as a quasi-concept (Beauvais and Jenson, 2002; Green, Janmaat, and Han,
2009). Definitions often respond to policy needs and foci of agencies and institutions. For
instance, the Council of Europe, among the most active promoters of the concept, has broadly
referred to social cohesion as “the capacity of a society to ensure the welfare of all its
members, minimizing disparities and avoiding polarizations” (Council of Europe, 2004, p. 3).
The Organisation for Economic Co-operation and Development proposes that social cohesion
is associated with three aspects – social inclusion, social capital and social mobility – and
defines a cohesive society as one that “works towards the well-being of all its members,
fights exclusion and marginalization, creates a sense of belonging, promotes trust, and offers
its members the opportunity of upward social mobility” (OECD, 2012, p. 51). Yet, while
common ideas underlay various definitions of social cohesion, there has not been a unified
understanding of the specific components, nor the measurement of the concept.
A better understanding of the dynamics between social protection and social cohesion is
justified by the fact that social protection is viewed as a crucial policy to promote social
justice, of which social cohesion and inclusion are an integral part (Devereux, McGregor, and
Sabates-Wheeler, 2011). In addition, social cohesion plays a key role in fostering economic
and development outcomes, through, for instance, its influence on the quality of institutions
and, in turn, on the implementation of pro-growth policies (Easterly, Ritzan, and Woolcock,
2006; Ferroni, Mateo, and Payne, 2008; Hayami, 2009; Ritzen, Easterly, and Woolcock,
2000; World Bank, 2005).3 Social cohesion is also widely viewed as crucial in relation to
peacebuilding and conflict prevention (Colletta and Cullen, 2000; King, Samii, and Snilstveit,
2010).4 While the development impacts of social protection have been widely studied, the
3 For example, it has been argued that social cohesion, including substantial trust in institutions as well as
inclusiveness among communities, is necessary if politicians are to implement pro-poor development policies.
Cohesive societies are also more well equipped to share the costs associated with the short-term losses attached
to welfare reforms (Ferroni, Mateo, and Payne, 2008; Ritzen, Easterly, and Woolcock, 2000).
4 There is a growing related literature exploring the potential of social protection to contribute to peacebuilding
and state-building (Beazley, Morris, and Vitali, 2016; Chioda, de Mello, and Soares, 2016; Crost, Felter, and
Page 6
4
contribution of social protection to social cohesion and state-building has been primarily
assumed based on theory (Babajanian, 2012).
On the microlevel, the evidence of the impact of social protection on various social cohesion
outcomes is limited and inconclusive. There is only one example in a refugee hosting setting.
In Lebanon, the cash component of a winterization programme targeting Syrian refugees had
a positive impact on social relations between beneficiaries and other community members
(Lehmann and Masterson, 2014).5 In particular, the treatment group was found to be
statistically more likely to be helped by Lebanese community members and less likely to be
insulted by them. Other examples come from non-refugee settings of government
programmes. For example, Familias en Accion, Colombia’s flagship conditional cash transfer
(CCT) was found to increase social capital, proxied by the willingness to cooperate among
community members during a public good game (Attanasio, Polania-Reyes, and Pellerano,
2015). The Peruvian CCT Juntos was also found to have a positive impact on confidence in
institutions, but not on membership in social organizations (Camacho, 2014). In Tanzania, a
community-managed CCT was found to increase trust that beneficiaries have in local leaders,
particularly in those who are elected by citizens to run the programme (Evans, Holtemeyer,
and Kosec, 2018). In Lesotho, the Child Grant Programme strengthened informal sharing
arrangements in the community, and beneficiary households were more likely to receive
informal support from family members, friends and neighbours and to provide support to the
rest of the community (Pellerano et al., 2014).
However, there is also evidence suggesting the potential for adverse effects of social
protection on social cohesion. In Indonesia, poor targeting of the Bantuan Lansung Tunai, a
national unconditional cash transfer aimed at compensating the poor for the increase in the
Johnston, 2016). Despite the interest in these links, these outcomes are more likely to be goals of dedicated
programming, rather than fall under the mandate of social protection.
5 Winterization is a term used by the humanitarian community to refer to the process of assisting beneficiaries
in staying warm, dry, and healthy during winter months (Lehmann and Masterson, 2014).
Page 7
5
price of kerosene as a consequence of the reduction of fuel subsidies, which erroneously
included a large number of more well off households, resulted in deteriorated social capital,
as measured by participation in community groups, as well as increased crime rates (Cameron
and Shah, 2013).6 Qualitative studies also report a number of negative consequences mostly
deriving from discontent around targeting. For instance, in Zimbabwe, the dissatisfaction
linked to the targeting procedures of an emergency pilot programme was found to increase
community tensions, although this dynamic was found in communities receiving cash
transfers, as opposed to communities receiving food transfers (Kardan, MacAuslan, and
Marimo, 2010). In Kenya and Yemen, feelings of jealousy around targeting led to a
considerable degree of tension between beneficiaries and non-beneficiaries of an
unconditional cash transfer (Pavanello et al., 2016). Envy, jealousy and resentment were
reported in Nicaragua and the State of Palestine for similar reasons (Adato and Roopnaraine,
2004; Pavanello et al., 2016). Overall, evidence suggests that context and programme design
(for example, targeting, complementary activities, and programme framing) are crucial in
explaining diverse findings.
Using an experimental evaluation of transfers, including cash, food and food vouchers,
targeted on Colombian refugees and poor Ecuadorians in urban and peri-urban areas, we
investigate whether the transfers resulted in changes in social cohesion measures. The
evaluation was a cluster-randomized control trial examining a short-term programme
implemented over six months by the World Food Programme (WFP). The results suggest that
the programme contributed to the integration of Colombians in the hosting community,
expanding social cohesion through increases in personal agency, the emergence of attitudes
accepting diversity, confidence in institutions and social participation among Colombians
6 The definition of crime used by the authors include theft, looting, pillaging, assault, arson, rape, misuse of
drugs, illegal drugs, murder, the sale of children and other. These categories were predefined and collected in
the Indonesian Village Census, one of the data sources used in the analysis.
Page 8
6
specifically, while having no impact on Ecuadorian participants. These effects appear to be
largely independent of the type of transfer and also appear to accrue to all Colombian
nationals, regardless of their motivation for migration (for example, economic versus political
or personal). There were no negative impacts of the programme on the indicators or domains
analysed. Although we are not able to identify specific mechanisms, we hypothesize that
these impacts are driven by joint targeting and messaging around social inclusion and through
interaction between nationalities at mandated monthly nutrition training sessions.
This paper contributes to the literature in several ways. First, it adds to the scarce literature on
the effects of social cohesion in refugee hosting settings; indeed, it is the first experimental
evidence of quantitative impacts of which we are aware. Second, the paper contributes to
discussions on measurement, analysing the most comprehensive operationalization of social
cohesion thus far and suggesting areas where measurement could be improved in future
studies. Finally, we discuss potential design components and mechanisms through which
social protection has the potential to affect measures of social cohesion, an important area of
further study with direct policy and programme implementation implications.
2. FRAMEWORK
Various authors and institutions have suggested approaches to analyse or measure social
cohesion. Beauvais and Jenson (2002), for instance, suggest a framework that distinguishes
between those dimensions that capture social bonds and associational activity (often referred
as social capital) and those which emphasize solidarity and equity. Similarly, Babajanian
(2012) reviews social protection and its contribution to social cohesion and state-building. He
distinguishes between distributional and relational dimensions of social cohesion, the former
referring to “the patterns and the extent of distribution of resources and opportunities in a
Page 9
7
society” and the latter to “the nature and quality of interpersonal and social relations” (p. 13).
For the purpose of this analysis, we follow the approach theorized by Babajanian (2012) by
focusing on a subset of the relational components proposed, including the domains of
“empowerment, community cooperation and solidarity [and] social participation” (p. 8). We
complement this definition with two domains suggested by Green, Janmaat, and Han (2009),
who review regimes and definitions of social cohesion, specifically (1) tolerance and respect
for other individuals and cultures and (2) interpersonal and institutional trust. Because of data
availability and appropriateness of the domain in relation to social protection, we do not
include all components suggested by the authors, for example, conflict and stability, as
suggested by Babajanian (2012), or shared values and goals, as suggested by Green, Janmaat,
and Han (2009). As pointed out by Green, Janmaat, and Han (2009), definitions of social
cohesion do not necessarily need to include all these characteristics. Our operational
definition of social cohesion is therefore based on six aggregated indicators, as follows:
(1) trust in individuals and social connectedness, (2) personal agency, (3) attitudes accepting
diversity, (4) freedom from discrimination, (5) confidence in institutions, and (6) social
participation. We discuss these domains in more detail in the methodology.
Social protection can, on theoretical grounds, influence social cohesion in a number of ways.
Different design features and characteristics of social protection can have direct or indirect,
intended or unintended effects on various components of social cohesion. We briefly
summarize key features identified in the literature, along with the implications for design
considerations. These include (1) targeting, (2) communication (for example, messaging and
framing around implementation), (3) type of implementer (for example, government or other
actor), (4) the size of benefits provided and (5) complementary activities or system links.
A key consideration in social protection programmes with implications for social cohesion is
targeting. The most commonly observed and reported negative effect concerns between-
Page 10
8
group tensions and feelings of resentment arising because of the exclusion of vulnerable
groups from programming (Babajanian, 2012; Leites et al., 2017; Pavanello et al., 2016).
This is especially the case of complex targeting that is not completely transparent. For
example, poverty targeting with proxy-means tests, particularly in areas of widespread
poverty, will result in beneficiary lists that may not be easily distinguishable from
populations excluded by community members and other stakeholders. Other targeting
methods, such as categorical targeting, that identify beneficiaries based on demographics are
more transparent and less prone to this type of dissatisfaction. However, it has been suggested
that, in some cases, categorical targeting of social groups deemed undeserving of assistance,
such as ex-combatants in post-conflict contexts, might result in feelings of resentment by
those excluded from the programme, thus impairing the process of peacebuilding (Holmes,
2009). Furthermore, some researchers suggest that community-based targeting results in
higher levels of acceptance because of the involvement of key local stakeholders and
community members relative to methods such as proxy-means testing (Alatas et al., 2012;
Ellis, 2012). Clear communication about programme objectives and targeting and the
involvement of the community in programme design and beneficiary selection can therefore
significantly reduce the risks associated with intracommunity tensions and negative state-
society relations (Pavanello et al., 2016).
The receipt of resources and services can foster social cohesion through enhancement of self-
confidence, agency and empowerment. The greater availability of resources that allow
beneficiaries to participate in ceremonial, cultural and other social activities can help
strengthen social ties and break isolation (Pavanello et al., 2016). Better economic and
financial standing can also reduce feelings of shame and stigma related to poverty and
decrease social marginalization (Roelen, 2017). Children able to attend school can feel more
accepted among their peers, greater satisfaction with their achievements and more self-worth,
Page 11
9
contributing to the agency of children and adolescents (Attah et al., 2016). Being selected to
receive a regular programme transfer, particularly if it is a benefit from a state actor, can
improve the confidence an individual has about the future and can strengthen trust in
institutions (Pavanello et al., 2016). These impacts can accrue not only from the receipt of
financial resources, but also from the complementary services and system links layered onto
or integrated into programmes (Roelen et al., 2017). For example, numerous social protection
programmes require or encourage the active social engagement of beneficiaries, which has
the potential to expand social networks and social capital. These design features could
include participation in training and other group activities or social events (whether
conditional or unconditional) that have been found to generate feelings of solidarity, mutual
support and enhanced dignity (Pavanello et al., 2016). However, the creation of groups and
activities associated with the programme can also foster social divisions, particularly if
beneficiaries are part of already socially marginalized groups (Skoufias, 2005).
These design features and mechanisms may be critical within social protection programmes
targeting minorities or isolated and vulnerable groups, including refugees. For example, if
programmes exclusively select a minority non-national citizen group, excluded local
vulnerable individuals could perceive this as unfair, resulting in higher levels of social
fragmentation and tension. These tensions may be more likely if the benefits are being
received from government sources, which may be viewed as crowding out funding for other
national priorities. Social protection could also foster solidarity among refugees and national
beneficiaries, especially if the social interaction is encouraged for the first time through the
programme. This was the case in post-conflict Nepal and Sierra Leone, where cash transfers
were implemented with the rationale of contributing to the peace process and social cohesion
by targeting marginalized groups (Holmes, 2009). According to definitions of Narayan
(1999) and Putnam (2000), social protection can foster bonding social capital, that is,
Page 12
10
solidarity among members of a same group, and bridging social capital, that is, linking
between social groups.
As documented by an extensive literature (reviewed by Bauer et al., 2016), individuals who
have been exposed to crime or war appear to exhibit more pro-social behaviour and more
civic and political engagement, particularly within groups of similarly affected individuals.
For example, in Sierra Leone, individuals who had experienced more violence were also
more likely to attend community meetings, vote, join social and political groups, and
participate in school committees and road brushing (Bellows and Miguel, 2006, 2009). They
were also more altruistic and more inequality averse towards in-group members during lab-
in-field experiments (Bauer et al., 2014). However, Bauer et al. (2016) hypothesize that the
substantial within-group cohesion is associated with a lack of social cohesion between groups
as a direct consequence of parochial attitudes. This has the potential to promote conflict
cycles and a return to violence. A social protection policy focused on refugees therefore has
the potential for both positive and negative effects on both intra- and intergroup social
cohesion.
3. PROGRAMME, EVALUATION DESIGN AND METHODOLOGY
3a. Programme and Context
Ecuador is the largest refugee-hosting country in Latin America. It hosts primarily
Colombian nationals fleeing from the decades-long conflict initiated by the Revolutionary
Armed Forces of Colombia. According to UNHCR (2012), Ecuador was hosting
approximately 55,500 refugees at the time of the study in 2012, nearly all of whom had
originated in Colombia. However, because of increasingly stringent application and approval
processes, there were estimated to be approximately 68,300 people in refugee-like status and
Page 13
11
14,400 asylum seekers of Colombian nationality, with nearly 70 per cent of refugees residing
in urban areas. International actors have therefore focused on strengthening the
implementation of urban programming and assistance to these groups. There is evidence that
Colombian refugees are subject to discrimination and stigma, with implications for economic
and health outcomes (Erk, 2016; Shedlin et al., 2014). In some cases, this can be explicitly
linked to common perceptions that Colombian refugees are linked to violence and the drug
trade, a belief that stakeholders have sought to address through media and other campaigns
(UNHCR, 2012).
In response to the vulnerabilities experienced by Colombian refugees, WFP initiated the a
cash, food and voucher pilot programme that ran from April 2011 to September 2011. The
programme was targeted on Colombian refugees and poor Ecuadorians across urban and peri-
urban neighbourhoods in seven urban centres in the northern provinces of Carchi and
Sucumbíos. The three objectives of the programme were to (1) improve food consumption by
facilitating access to more nutritious foods, (2) enhance the role of women in household
decision-making related to food consumption and (3) reduce tensions between Colombians
and host Ecuadorian populations. Neighbourhoods within the seven urban centres were
selected for programme implementation based on consultations with UNHCR because both
areas included large numbers of refugees and significant poverty. Households qualified for
the transfers provided through the programme if they met the poverty threshold as determined
by a proxy-means test and if they were not currently receiving benefits from the government
flagship cash transfer programme. Transfers equivalent to US$40 were targeted on women
and delivered monthly. Cash transfers were delivered on pre-paid ATM cards. Food transfers
consisted of rice, vegetable oil, lentils and canned sardines. Food vouchers were redeemable
for pre-approved nutritious foods at local supermarkets. Transfer and voucher beneficiaries
were required to attend monthly sessions on nutrition training.
Page 14
12
Previous analysis of the data indicates that the transfers were successful in meeting food
security objectives. They raised both the quantity and quality of the food consumed, and also
resulted in decreases in intimate partner violence (Buller et al. 2016; Hidrobo, Peterman, and
Heise, 2016; Hidrobo et al., 2014).
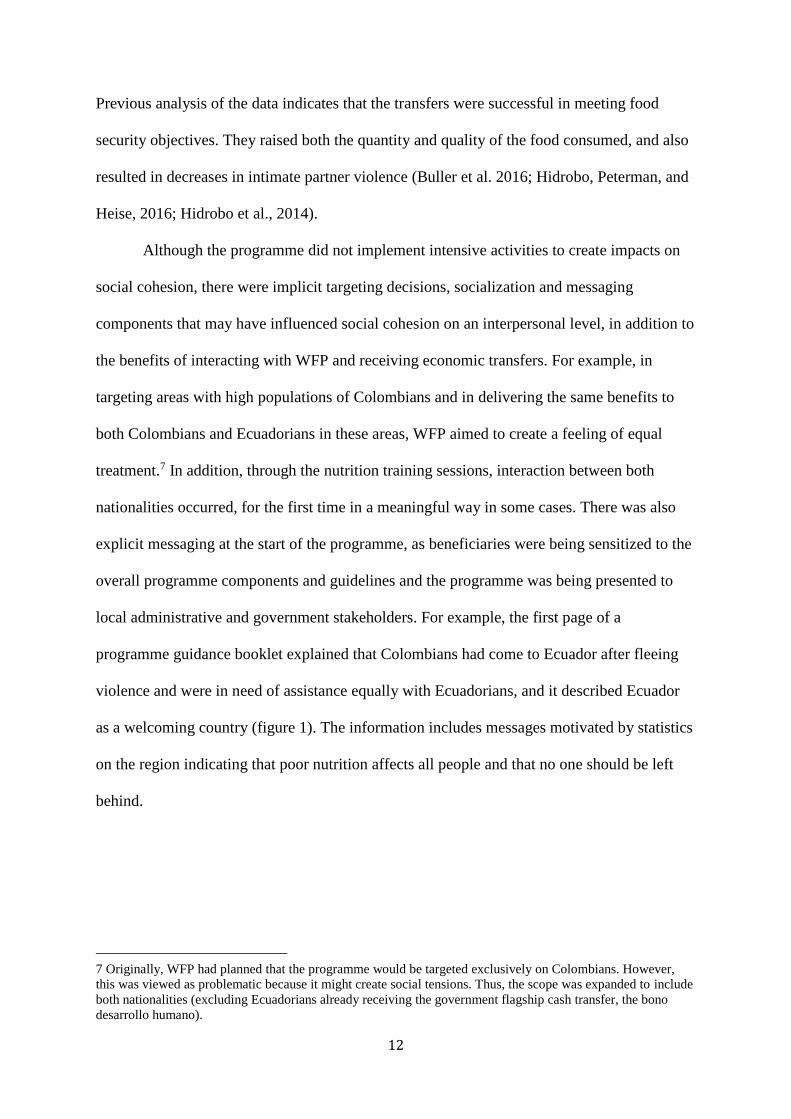
Although the programme did not implement intensive activities to create impacts on
social cohesion, there were implicit targeting decisions, socialization and messaging
components that may have influenced social cohesion on an interpersonal level, in addition to
the benefits of interacting with WFP and receiving economic transfers. For example, in
targeting areas with high populations of Colombians and in delivering the same benefits to
both Colombians and Ecuadorians in these areas, WFP aimed to create a feeling of equal
treatment.7 In addition, through the nutrition training sessions, interaction between both
nationalities occurred, for the first time in a meaningful way in some cases. There was also
explicit messaging at the start of the programme, as beneficiaries were being sensitized to the
overall programme components and guidelines and the programme was being presented to
local administrative and government stakeholders. For example, the first page of a
programme guidance booklet explained that Colombians had come to Ecuador after fleeing
violence and were in need of assistance equally with Ecuadorians, and it described Ecuador
as a welcoming country (figure 1). The information includes messages motivated by statistics
on the region indicating that poor nutrition affects all people and that no one should be left
behind.
7 Originally, WFP had planned that the programme would be targeted exclusively on Colombians. However,
this was viewed as problematic because it might create social tensions. Thus, the scope was expanded to include
both nationalities (excluding Ecuadorians already receiving the government flagship cash transfer, the bono
desarrollo humano).
Page 15
13
3b. Evaluation Design
The cluster-randomized control trial included four arms and 145 clusters randomized to cash,
food, food vouchers and a control. Because of the close geographical proximity between
clusters, the randomization was performed in a two-stage process whereby, first,
neighbourhoods were randomized into treatment and control, and, subsequently, clusters
within treatment neighbourhoods were randomized to treatment arms (cash, food and food
vouchers) (see figure A.1). The baseline survey was conducted in March and April 2011,
before the first transfers, and the endline survey was carried out approximately seven months
later, in October–November 2011. The evaluation was implemented by the International
Food Policy Research Institute, along with the data collection partner, the Centro de Estudios
de Poblacion y Desarrollo Social, The ethics review took place at the International Food
Policy Research Institute in Washington, DC, and at the Centro de Estudios de Poblacion y
Desarrollo Social in Quito, Ecuador. In total, 2,122 households were surveyed in both waves.
The household attrition rate was approximately 10 per cent. For this analysis, we restrict the
sample to the panel of individuals who responded to the questionnaire at both baseline and
midline (who were most often also the transfer beneficiaries). The overall attrition rate among
individuals was 20 per cent, indicating that, in approximately 10 per cent of the baseline
households, different individuals answered the questionnaires at different times. Although the
individual attrition rate was slightly higher in the control group (table A.1), the difference is
not statistically significant.
Despite the similar overall attrition rates between the treatment and control groups,
differential attrition may still threaten the internal validity of the study if the characteristics of
the individuals who left the panel are different from those of individuals who stayed, and
these characteristics also influence social cohesion. We therefore examine if individuals who
left the survey are different between treatment and control groups with respect to background
Page 16
14
characteristics and the outcomes of social cohesion at baseline. Comparing the p-value of
differences from tests of means, only one of 18 background characteristics appears to exhibit
a statistical difference between control and treatment attritors at the p < .10 level or higher
(table A.2, column 8). Specifically, treatment attritors live in smaller households compared
with control attritors (3.8 members versus 4.11 members; p-value: .09). Because of these few
differences, we can assume that attrition is unlikely to be a concern for the internal validity of
the study, a conclusion also reached by other analysis using these evaluation data (Hidrobo,
Peterman, and Heise, 2016; Hidrobo et al., 2014).
Demonstration of equivalence between treatment and control groups at baseline is also a
prerequisite for the internal validity of the study and estimation of unbiased treatment effects.
Table 1 shows that, among the 18 background characteristics, six are statistically different
between the treatment and control groups at the p < .10 level or higher (Colombian
nationality, including those who resided in the urban centre for more than 20 years,
household size, number of children aged 6–15 years, and second and fifth wealth quintiles).
These baseline imbalances of background characteristics are larger than expected, given the
demonstrated balance of the household panel and result primarily from the use of the
individual panel in this analysis (Hidrobo et al., 2014). We perform a joint orthogonality test
by regressing the background characteristics on an indicator of treatment and computing the
F-test across background characteristics, which confirms joint imbalance (F-stat = 2.01; p =
.024). Thus, to address these differences and improve the precision of estimates, we explicitly
control for baseline measures in our estimation strategy.
In addition, we examine the disaggregated social cohesion components into 33 indicators and
find that eight are statistically different at the p < .10 level or higher, of which one is an
aggregate indicator (table 2). In particular, the standardized sum of the lack of discrimination
indicator is lower in the treatment group (−0.16 versus 0.00; p-value: .05). Because of this
Page 17
15
imbalance, we interpret impacts on discrimination with caution, as well as individual
disaggregated indicators showing imbalances (which primarily fall into the same
discrimination index). We return to this discussion in the limitation section.
3c. Analysis Methodology
We use the analysis of covariance models (ANCOVA), which predict our social cohesion
outcome of interest, while controlling for baseline values of the same indicator (Hidrobo,
Peterman, and Heise, 2016; Hidrobo et al., 2014). ANCOVA estimates are preferred over
difference in differences estimates in scenarios where autocorrelation of outcomes is low over
time and provide a more efficient estimation of the effect (McKenzie, 2012). Autocorrelation
for our main outcomes are low, ranging from 0.05 to 0.30 for the standardized aggregate
indices (see table A.3). We run simple unadjusted models and models adjusting for covariates
and cluster standard errors at the cluster level, using the basic model equation (1):
𝑌ℎ𝑗1 = ∝ +𝛽𝑝𝑇𝑟𝑒𝑎𝑡𝑗 + 𝛾𝑌ℎ𝑗0 + 𝛿𝐶ℎ𝑗 + 𝜃𝑃ℎ𝑗 + 𝜇𝑗 + 휀ℎ𝑗, (1)
where 𝑌ℎ𝑗1 is the social cohesion outcome of interest for household ℎ from cluster j at follow-
up, and 𝑌ℎ𝑗0 is the same at baseline. Treatj is an indicator of presence in a treatment cluster,
which can be broken down into three indicators, one each for food, cash and vouchers. Bp is
the intent-to-treat estimator for the pooled treatment, or the effect of being assigned to any
treatment arm. 𝛿𝐶ℎ𝑗 represents a set of basic covariates for our adjusted models, including the
following: respondent’s attainment of secondary education or higher (dummy); age (years),
sex (female dummy), if married (dummy) and nationality (Colombian dummy); household
size; number of children aged 0–5 years; number of children aged 6–15 years; dummies for
wealth quintiles (based on a wealth index constructed using assets and dwelling
infrastructure); and an indicator of residence in an urban centre for less than or equal to 20
years (dummy). Our indicator of Colombian nationality is based on a simple question
Page 18
16
regarding self-reported nationality; however, our findings are robust to an alternative
indicator asking about the country of birth (not shown). We cannot explicitly distinguish
refugees and asylum seekers (or refugee-like individuals) or other types of migrants using
this definition, and thus our assumption is that Colombian nationals in these areas are likely
to be refugees. In all models (both adjusted and unadjusted), we control for residence in
Carchi Province because the randomization was stratified at the province level (𝜃𝑃ℎ𝑗).
Finally, 𝜇𝑗 and 휀ℎ𝑗 are iid errors across clusters and across households within clusters.
Our outcome indicators representing social cohesion include six indices that capture various
dimensions: (1) interpersonal trust and social connectedness, (2) personal agency,
(3) attitudes accepting diversity, (4) lack of discrimination, (5) confidence in institutions, and
(6) social participation (table 2). We also analyse an overall social cohesion indicator that is
an aggregate of all six subindices. Following the procedure set out in Banerjee et al. (2015),
we construct the indices by first equally weighting the average z-scores of each indicator that
composes the six dimensions of social cohesion (obtained by subtracting the control group
mean for each round and dividing it by the control standard deviation) and then by
standardizing these again with reference to the control group. We also calculate the indices
through principal component analysis (PCA), although the scale reliability coefficient for
some of the aggregated indices suggests that this methodology performs poorly in
summarizing these indicators (table A.4).8 We therefore rely primarily on the standardized z-
score index, but still perform robustness checks using PCA.
All outcome measures are built from questions elicited in a module focused on perceptions
and discrimination that was collected both at baseline and endline. To allow aggregation, all
8 To assess whether the combination of individual indicators are a proxy for the underlying conceptual variable
we use Cronbach’s alpha, according to which indicators with alpha levels lower than 0.5 are unacceptable
(Boermans and Kattenberg, 2011). Among our set of aggregate indicators, two perform as unacceptable, three
between poor and questionable, and two as acceptable (see table A.4).
Page 19
17
questions were converted so higher values equate to higher levels of social cohesion. For
instance, questions on the experience of discrimination were transformed into questions about
freedom from discrimination. In addition, as different indicators included varying response
options (some binary; some on a Likert scale), standardization ensures that each contributes
equally to the overall domain of social cohesion. We consider all measures collected that fit
the domain definitions; however, in a few cases, we combine indicators where the incidence
is too low to allow inclusion (for example, group participation).
Our main analysis seeks to understand if transfers affect social cohesion measures, and if
these effects differ between Colombians and Ecuadorians. We test the difference between
nationalities by interacting the indicator of baseline Colombian nationality with the treatment
indicator. We then consider if these dynamics differ based on the type of transfer (cash, food,
or voucher) or the history of migration among Colombians, as measured by the self-reported
motivation for migrating. We hypothesize that migrants who are motivated by, for example,
conflict or political reasons may have different profiles, with implications for social cohesion
impacts compared with those who migrate for economic gain. We collect self-reported
migration information only for those individuals who migrated in the previous 20 years and
collapse self-reported migration into three domains: economic, political, and personal or
other. We compare interactions with these three categories or the alternative of residing in the
urban centre for more than 20 years with the pooled treatment to assess if transfers affect
social cohesion differentially by migrant type.
4. RESULTS
Table 1 shows that 34 per cent of the sample identify as Colombian nationals, while 9 per
cent reported they were Colombian and migrating for economic or political reasons; 6 per
Page 20
18
cent reported they were Colombian and migrating for personal or other reasons, and 10 per
cent reported they were Columbian and a resident in the urban centre for over 20 years.
Approximately 80 per cent of the sample are female and are, on average, 39 years old.
Approximately 36 per cent have some secondary education or higher, and, on average,
households contain nearly four members. Table 2 supplies detailed domain and indicator
information as well as baseline values for the 33 social cohesion indicators aggregated into
seven domain outcomes. Although we analyse the standardized indices for reasons mentioned
above, we report the raw values of indicators here for ease of interpretation and to
contextualize levels of social cohesion. The majority of indicators are either reported as
binary or on a Likert scale ranging from 1 (strongly disagree) to 4 (strongly agree). For
example, most individuals believe that people from different nationalities live together well
in their communities (score 3.5 of 4.0, indicator 3 in attitudes accepting diversity), and 86 per
cent of the sample reports they have not been discriminated against in the past six months
because of their nationality (binary indicator, indicator 7 in freedom from discrimination). In
total, the raw aggregate social cohesion indicator ranges from 35 to 115, with an average
score of 67.3 among the full sample.
The main regression results are reported in table 3 as adjusted models whereby we assess the
impact of the transfers on social cohesion (odd columns) and explore whether the treatment
had differential effects on Colombians and Ecuadorians (even columns). Transfers have a
positive effect on agency, confidence in institutions, and overall social cohesion, on average,
within the sample. The size of these effects are similar across these dimensions, ranging from
0.15 to 0.18 standard deviations. The coefficient for Colombian national across outcomes is
typically negative, indicating that Colombians, on average, show statistically lower levels of
social cohesion, particularly in relation to confidence in institutions and lack of
discrimination. Alternatively, Colombians exhibit, on average, higher outcomes regarding
Page 21
19
attitudes accepting diversity. When the treatment is interacted with the indicator of
Colombian nationality, there is a differential impact by nationality for personal agency (0.46
standard deviations higher), attitudes accepting diversity (0.22 standard deviations higher)
and social participation (0.21 standard deviations higher). We also compute the absolute
treatment effect for Colombians, reported in the bottom row of the table, which indicates that
transfers improved four domains of social cohesion among Colombians (agency, attitudes
accepting diversity, confidence in institutions, and social participation), as well as the overall
social cohesion outcome.9 These net impacts are sizeable, ranging from 0.23 to 0.46 standard
deviation increases. These results indicate that overall positive treatment effects across
domains are driven primarily by the effect on treated Colombians.
We run the same regressions using the social cohesion indices constructed through PCA for
robustness and find that, where indicators performed reliably, the results are in line with table
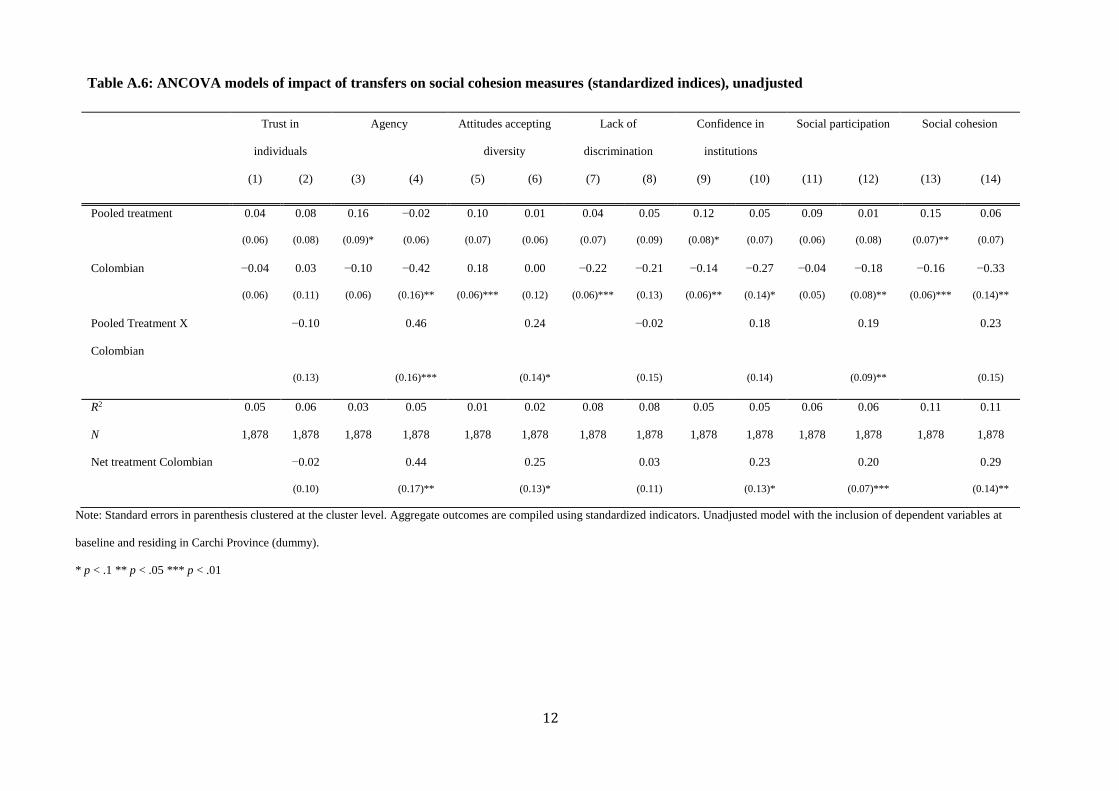
3 (table A.5).10 In addition, we replicate table 3 using unadjusted models and report our
findings in table A.6. The unadjusted results are similar to our main models; however, they
tend to be larger and more significant. This is likely partly because we are no longer
controlling for length of residence in the community, which may be correlated with
nationality and our outcome measures.
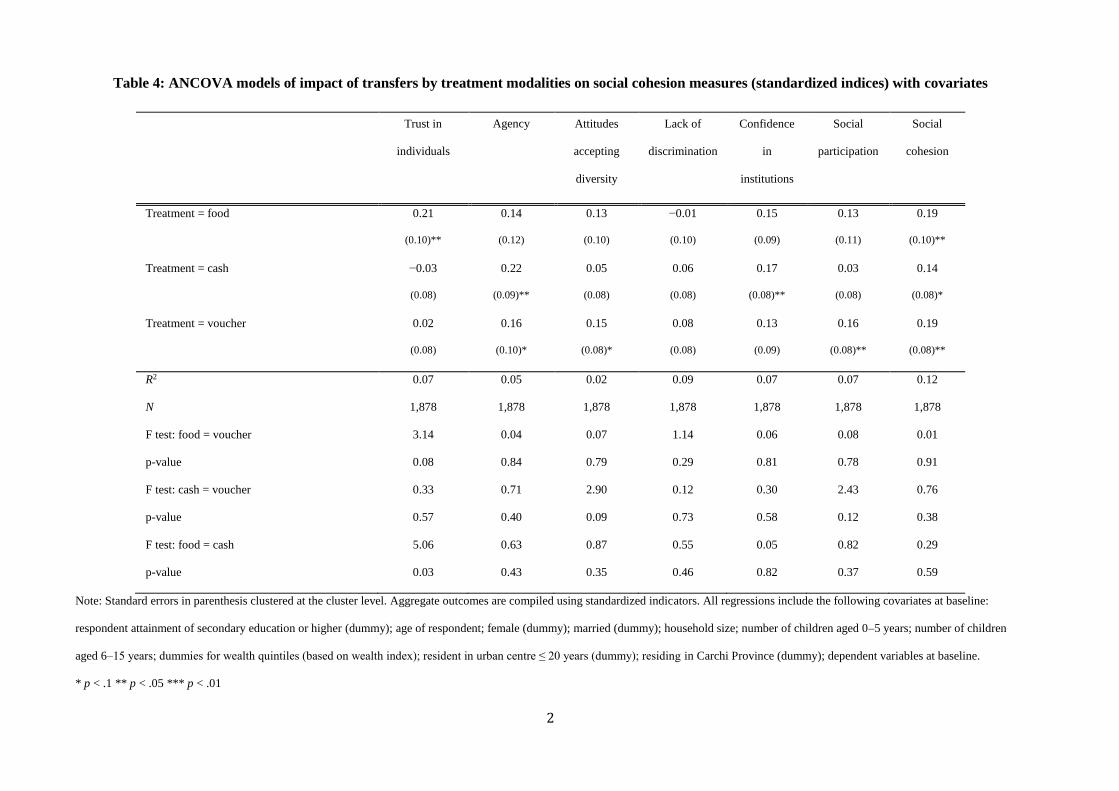
Because the treatment was implemented in three forms (food, cash, and food vouchers), we
investigate whether the treatment results differed by arm. As the results reported in table 4
indicate, there is no clear pattern showing that one arm differentially increased social
cohesion. As shown by tests of equivalency at the bottom of the table, there are statistical
differences in only two cases. For trust in individuals, food transfers are statistically larger
9 The overall (or net) effect is obtained as a linear combination of the parameters on treatment and the treatment
for Colombians. 10 To assess whether the combination of individual indicators is a proxy for the underlying conceptual variable,
we use Cronbach’s alpha, according to which indicators with alpha levels lower than 0.5 are unacceptable
(Boermans and Kattenberg, 2011). Among our set of aggregate indicators, two perform as unacceptable, three
between poor and questionable, and two as acceptable (see table A.4).
Page 22
20
than cash and voucher transfers, and, for attitudes accepting diversity, cash impacts are larger
than vouchers. While the significance of coefficients varies across outcome domains, the F-
tests indicating statistical significance cannot be rejected in any other case. Similar to the
result using the pooled treatment, each transfer arm (cash, food and voucher) show significant
effects on overall social cohesion, ranging from 0.14 to 0.19 standard deviations. We interact
the three treatment arms with the dummy for Colombian national, and no clear pattern
emerges regarding differential treatment by modality and nationality (results not reported).
However, the study is not powered to examine these heterogeneities; we thus cannot exclude
the possibility that this lack of significance arises because of insufficient power.
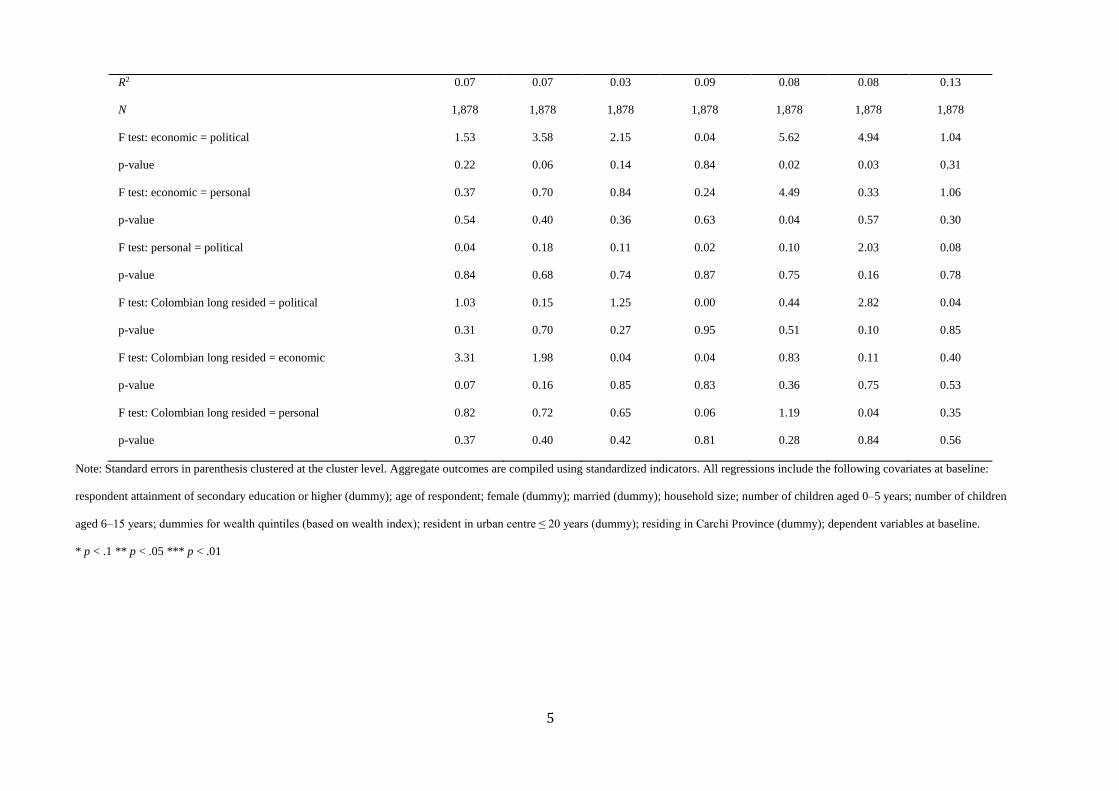
To explore possible differential effects by type of Colombian migrant, we examine
interactions between motivation for migration and the pooled treatment. The results reported
in table 5 show few differential effects by migration motivation, with the exception of
differences by economic migration. First, economic migrants have a statistically higher
treatment effect on agency and confidence in institutions, but a lower treatment effect on
social participation compared with political migrants. Economic migrants also have a higher
treatment effect on confidence in institutions compared with migrants for personal reasons.
Colombians who migrated for economic reasons have a lower treatment effect on trust in
individuals compared with Colombians who are long-term residents. We therefore conclude
that economic migrants show some differential attributes and treatment outcomes with
respect to other groups; however, few other patterns emerge.
To understand how migrant types differ, we provide descriptive profiles of the Colombian
sample by migration status (table A.7). Colombians who moved for economic reasons appear
similar on most background characteristics; however, they exhibit some demographic
differences, specifically in relation to politically motivated migrants (smaller household size
and fewer young children). Economic migrants appear to have moved, on average, more
Page 23
21
often (1.6 times, not counting the most recent move), while a smaller share moved with the
entire household the first time they moved (38 per cent) relative to political migrants. In
addition, they are less likely to be female, have smaller household size, have fewer school-
age children and have suffered select adverse experiences since moving, including lower
incidence of verbal threats (24 per cent) and levels of kidnapping (2 per cent) relative to
personal migrants. All samples report unacceptably high levels of adverse violent events
since migrating, including verbal insults or attacks (24–37 per cent), physical threats or
attacks with a knife or gun (8–12 per cent), or robbery or property damage (17–23 per cent).
We analyse disaggregated indicators that we used to construct the six dimensions of social
cohesion to investigate which indicators drive the results on aggregate indicators, while
adjusting for issues of multiple testing. As suggested by Anderson (2008), we adjust the p-
values of each indicator to reflect the multiple-inference problem by controlling the
familywise error rate through Sidak-Bonferroni corrections.11 We report these by domain in
annex tables A.8–A.13. Overall, we find that few specific indicators are significant, which
may not be surprising given the gains in power from aggregating into domains. For example,
among the aggregates we find significant in table 3, three of the five indicators capturing
personal agency are significant for the treated Colombians: “My life is determined by my
own actions”, “I have the power to take important decisions to change my life”, and “I am
satisfied with my life”. Among the indicators for attitudes accepting diversity, none are
individually statistically significant with familywise error rate corrections (although two are
individually statistically significant without the correction). In relation to confidence in
institutions, only the non-interacted treatment effect for one indicator is statistically
significant (the indicator associated with the question: “If I am a victim of a crime, I can go to
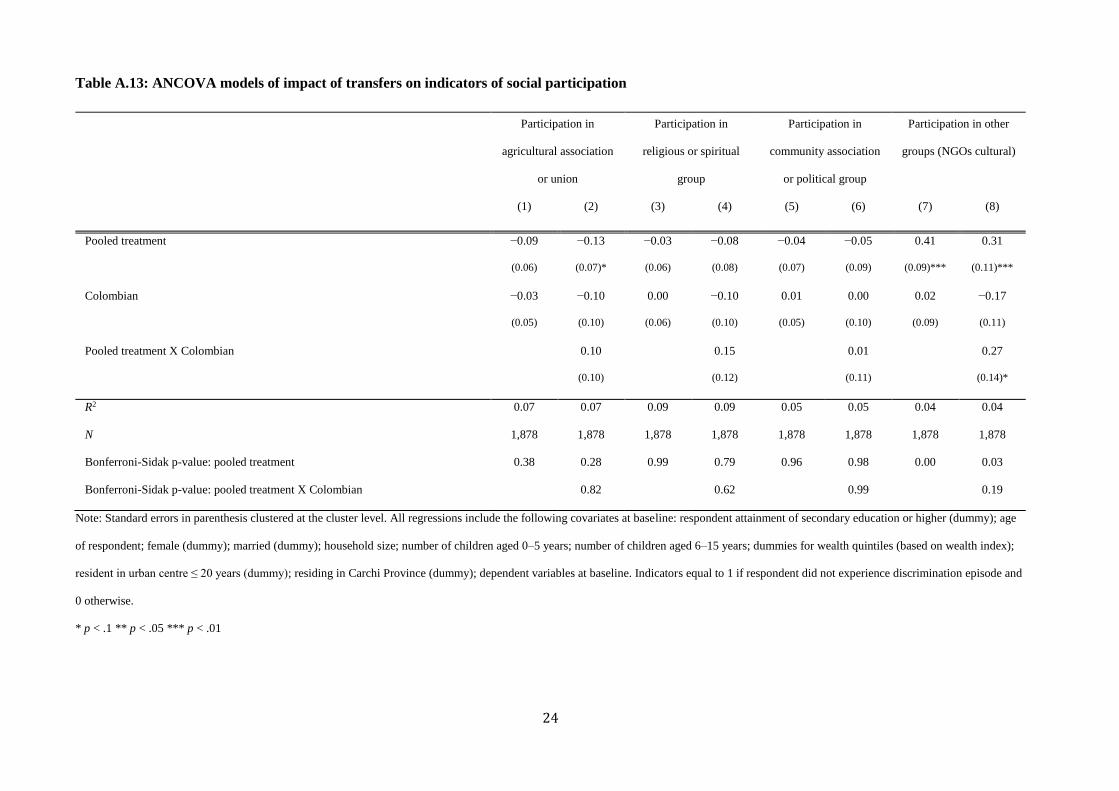
the police to get help”). For social participation, the indicator on participation in NGOs and
11 𝑎𝑑𝑗𝑢𝑠𝑡𝑒𝑑 𝛼 = 1 − (1 − 𝑢𝑛𝑎𝑑𝑗𝑢𝑠𝑡𝑒𝑑 𝛼)𝐶 , where C is the number of indicators in the domain.
Page 24
22
cultural groups appears to drive the overall treatment impacts found in the aggregate index;
however, after adjustment for the familywise error rate, the differential effect by Colombian
nationality is no longer significant. The impact on NGO participation could reflect
participation in the cash and voucher programme, rather than an effect on broader group
participation.
5. DISCUSSION AND CONCLUSIONS
Using an experimental evaluation of cash, food and food vouchers targeted on Colombian
refugees and poor Ecuadorians in urban and peri-urban areas, we examine whether the
programme resulted in short-term changes in social cohesion measures. Overall results across
six domains of social cohesion suggest that the programme contributed to the integration of
Colombians in the hosting communities through increases in personal agency, attitudes
accepting diversity, confidence in institutions, social participation, and overall social
cohesion for Colombians specifically. The size of the impacts on domains of social cohesion
among Colombians is substantial; net increases range from 0.23 to 0.46 standard deviations,
compensating for lower baseline values of cohesion. However, there were no measurable
impacts on social cohesion among Ecuadorian participants. In addition, two of the six
dimensions of social cohesion are not affected by the treatment among either group, namely,
trust in individuals and freedom from discrimination. There were no negative impacts of the
programme on indicators or domains analysed here, although qualitative or other
methodologies may be more well suited to the identification of such effects.
Our results are in line with the positive effects found by Lehmann and Masterson
(2014), who found that cash transfers to Syrian refugees resulted in an approximately 19 per
cent increase in receiving help from Lebanese community members (26 per cent in controls
Page 25
23
versus 31 per cent in treatment, including looking after children when you are sick, help with
the housework, or giving money). Recipients were also 66 per cent less likely to be insulted
by Lebanese community members (10 per cent in control versus 6 per cent in treatment). The
authors hypothesize that transfers were shared among community members, thus creating
goodwill and facilitating social networks. The increased financial support was hypothesized
to relax time and mental constraints; thus, the time previously spent on income generation
could be used to build social ties. This example is somewhat comparable with our study
because the cash transfer was also implemented by a non-governmental actor (UNHCR and
partners) and for a relatively short time (US$575 in total over six months). Although different
in programme design, our results are also in line with a number of other studies in
development settings across measures of social capital and trust in institutions or community
leaders and implemented by government actors over longer periods (Attanasio, Polania-
Reyes, and Pellerano, 2015; Camacho, 2014; Evans, Holtemeyer, and Kosec, 2018).
Because the evaluation was not designed explicitly to examine the mechanisms through
which the programme improved social cohesion, we are limited in the additional analysis
possible to examine mechanisms explicitly. The economic transfers, targeting, messaging and
nutrition training that facilitated interaction among nationalities were components of every
treatment arm; thus, it is impossible to disentangle specific contributions. However, we
conduct descriptive analysis to understand if transfers allowed the sharing of resources (thus
potentially leading to increased network size and trust in individuals) and if control and
treatment households were differentially affected by adverse shocks at endline (indicating
potential targeted attacks because of jealously or adverse effects associated with the
programme). We find evidence of a greater sharing of resources in the number of meals with
non-household members, suggesting a potential mechanism, but not in total household cash
and in-kind transfers in and out of the household. Furthermore, we find no differential
Page 26
24
experience of adverse shocks at endline between treatment and control groups (including
theft of money, food or other goods from home, destruction of property, physical attacks, loss
of job).12
There are several limitations. We are not able to distinguish with certainty if the sample of
Colombian nationals can be truly classified as refugees (legally defined). In addition, we may
lack sufficient power to detect differential effects among subsamples analysed here, for
example differential analysis by migration motivation. Although gender differences in these
outcomes are undoubtedly interesting, we are unable to say if impacts varied by the gender of
the target recipient because our sample contained primarily women and was not randomized
by sex,. Similarly, we analyse the perspective of only one adult household member. Thus, we
cannot say if, for example, there are diverse (positive or negative) social cohesion
experiences among other household members, including children. In fact, we are not aware of
any publication that has examined children’s perspectives on social cohesion within an
empirical evaluation of a social protection programme. Because of imbalances at baseline, the
results on lack of discrimination outcomes and specific disaggregated indicators exhibiting
imbalances must be interpreted with caution; they may be biased because of differential
initial values. Although we conduct additional descriptive analysis, we are unable to
disentangle sufficiently the part of the programme or the combination of parts that were
responsible for impacts.
Although there is little consensus on the exact domains and indicators necessary to measure
social cohesion comprehensively, a more unified framework and consensus on the relevant
components would facilitate future research. In our own analysis, because of data limitations,
we excluded several relevant dimensions theorized by some to be critical to social cohesion,
including crime, conflict and stability (Babajanian, 2012). In some contexts, for example,
12 Results, not shown, are available upon request.
Page 27
25
cash transfer recipients in the State of Palestine, increased marginalization and stigma have
been reported, which may also be relevant in assessing the impact of transfers on social
cohesion (Pavanello et al., 2016; Roelen, 2017). These dimensions are quite nuanced, similar
to measures we assessed (for example, discrimination), and may require qualitative work to
unpack specific measures. Other researchers have proposed that a behavioural approach (for
example, field experiments and lab experiments) are more suitable for capturing unbiased
measures of outcomes, including trust, cooperation and social capital. However, it is not clear
that analysis using these measures differs significantly from survey-based outcomes
(Attanasio, Polania-Reyes, and Pellerano, 2015; Avdeenko and Gilligan, 2015; Glaeser et al.,
2000). For many of these indicators, it would be important to collect information on overall
community dynamics, including spillover effects on non-recipient households in treatment
communities, to assess potential negative effects on those not eligible for benefits. Overall,
additional investment is needed in rigorous testing of indicators, domains and indices to
capture locally relevant and contextual measures of social cohesion confidently.
This study demonstrates that even short-term social protection schemes hold promise
for positively affecting social cohesion between refugees and host populations. As
programming is scaled up in diverse settings, including communities hosting Syrian refugees
in the Middle East, Europe and elsewhere, there is a need for more programme-specific
evidence. For example, dynamics may be different in settings where there are higher
proportions of refugees and starker differences between ethnicity, culture and social standing
of refugee and hosting communities. Impacts may differ between men and women, by rural
or urban setting, or by programme design components, particularly related to messaging,
complementary programming, and the transparency and inclusiveness of targeting. We
encourage further mixed-methods evaluations in diverse settings, as well as methodological
Page 28
26
innovation to identify the most promising and contextually relevant outcome indicators of
social cohesion and mechanisms through which impacts may be realized.
6. REFERENCES
Adato, Michelle, and Terry Roopnaraine (2004) ‘A Social Analysis of the Red de Protección
Social (RPS) in Nicaragua’. With Fabiola Alvarado Álvarez, Leticia Böttel Peña, and
Gladys Meléndez Castrillo (December) (International Food Policy Research Institute,
Washington, DC).
Alatas, Vivi, Abhijit Banerjee, Rema Hanna, Benjamin A. Olken, and Julia Tobias (2012)
‘Targeting the Poor: Evidence from a Field Experiment in Indonesia’. American
Economic Review, 102(4), pp. 1206–1240.
Anderson, Michael L. (2008) ‘Multiple Inference and Gender Differences in the Effects of
Early Intervention: A Reevaluation of the Abecedarian, Perry Preschool, and Early
Training Projects’. Journal of the American Statistical Association, 103(484), pp.
1481–1495.
Attah, Ramlatu, Valentina Barca, Andrew Kardan, Ian MacAuslan, Fred Merttens, and Luca
Pellerano (2016) ‘Can Social Protection Affect Psychosocial Wellbeing and Why
Does This Matter? Lessons from Cash Transfers in Sub-Saharan Africa’. Journal of
Development Studies, 52(8), pp. 1115–1131.
Attanasio, Orazio, Sandra Polania-Reyes, and Luca Pellerano (2015) ‘Building Social
Capital: Conditional Cash Transfers and Cooperation’. Journal of Economic Behavior
and Organization, 118(October), pp. 22–39.
Avdeenko, Alexandra, and Michael J. Gilligan (2015) ‘International Interventions to Build
Social Capital: Evidence from a Field Experiment in Sudan’. American Political
Science Review, 109(3), pp. 427-449.
Page 29
27
Babajanian, Babken (2012) Social Protection and Its Contribution to Social Cohesion and
State-Building. (Eschborn, Germany: Deutsche Gesellschaft für Internationale
Zusammenarbeit).
Banerjee, Abhijit Vinayak, Esther Duflo, Nathanael Goldberg, Dean S. Karlan, Robert Osei,
William Parienté, Jeremy Shapiro, Bram Thuysbaert, and Christopher Udry (2015) ‘A
Multifaceted Program Causes Lasting Progress for the Very Poor: Evidence from Six
Countries’. Science 348(6236), pp. 772–789.
Bauer, Michal, Christopher Blattman, Julie Chytilová, Joseph Henrich, Edward Miguel, and
Tamar Mitts (2016) ‘Can War Foster Cooperation?’ Journal of Economic
Perspectives, 30(3), pp. 249–274.
Bauer, Michal, Alessandra Cassar, Julie Chytilová, and Joseph Henrich (2014) ‘War’s
Enduring Effects on the Development of Egalitarian Motivations and In-group
Biases’. Psychological Science, 25(1), pp. 47–57.
Beauvais, Caroline, and Jane Jenson (2002) ‘Social Cohesion: Updating the State of the
Research’. CPRN Discussion Paper, No. F|22 (Canadian Policy Research Networks,
Ottawa).
Beazley, Rodolfo, Robert Morris, and Anna Vitali (2016) ‘Designing Public Works
Programmes and Cash Transfers to Promote Growth and Mitigate Violence’. EPS-
Peaks Helpdesk Request (Oxford Policy Management, Oxford).
Bellows, John, and Edward Miguel 2006 ‘War and Institutions: New Evidence from Sierra
Leone’. American Economic Review, 96(2), pp. 394–399.
——— (2009) ‘War and Local Collective Action in Sierra Leone’. Journal of Public
Economics, 93(11–12), pp. 1144-1157.
Boermans, Martijn Adriaan, and Mark A. C. Kattenberg (2011) ‘Estimating Reliability
Coefficients with Heterogeneous Item Weightings Using Stata: A Factor Based
Page 30
28
Approach’. Discussion Paper, 11(19) (Tjalling C. Koopmans Research Institute,
Utrecht School of Economics, Utrecht University, Utrecht, the Netherlands).
Buller, Ana Maria, Melissa Hidrobo, Amber Peterman, and Lori Heise (2016) ‘The Way to a
Man’s Heart Is through His Stomach?: A Mixed Methods Study on the Causal
Mechanisms through which Cash and In-kind Food Transfers Decreased Intimate
Partner Violence’. BMC Public Health, 16(488), pp. 1–13.
Camacho, Luis A. (2014) ‘The Effects of Conditional Cash Transfers on Social Engagement
and Trust in Institutions: Evidence from Peru's Juntos Programme’. Discussion Paper,
24/2014 (German Development Institute, Bonn).
Cameron, Lisa, and Manisha Shah (2013) ‘Can Mistargeting Destroy Social Capital and
Stimulate Crime? Evidence from a Cash Transfer Program in Indonesia’. Economic
Development and Cultural Change, 62(2), pp. 381–415.
Chioda, Laura, João M. P. de Mello, and Rodrigo R. Soares (2016) ‘Spillovers from
Conditional Cash Transfer Programs: Bolsa Família and Crime in Urban Brazil’.
Economics of Education Review, 54(October), pp. 306–320.
Colletta, Nat J., and Michelle L. Cullen (2000) Violent Conflict and the Transformation of
Social Capital: Lessons from Cambodia, Rwanda, Guatemala, and Somalia. Conflict
Prevention and Post-Conflict Reconstruction Series (Washington, DC: World Bank).
Council of Europe (2004) ‘A New Strategy for Social Cohesion’ (European Committee for
Social Cohesion, Council of Europe, Strasbourg).
Crost, Benjamin, Joseph H. Felter, and Patrick B. Johnston (2016) ‘Conditional Cash
Transfers, Civil Conflict and Insurgent Influence: Experimental Evidence from the
Philippines’. Journal of Development Economics, 18(January), pp. 171–182.
Page 31
29
Devereux, Stephen, Edoardo Masset, Rachel Sabates-Wheeler, Michael Samson, Althea-
Maria Rivas, and Dolf te Lintelo (2017) ‘The Targeting Effectiveness of Social
Transfers’. Journal of Development Effectiveness, 9(2), pp. 162–211.
Devereux, Stephen, J. Allister McGregor, and Rachel Sabates-Wheeler (2011) ‘Introduction:
Social Protection for Social Justice’. IDS Bulletin Special Issue: Social Protection for
Social Justice, 42(6), pp. 1–9.
Easterly, William, Jozef Ritzen, and Michael Woolcock (2006) ‘Social Cohesion,
Institutions, and Growth’. Economics and Politics, 18(2), pp. 103–120.
Ellis, Frank (2012) ‘“We Are All Poor Here”: Economic Difference, Social Divisiveness, and
Targeting Cash Transfers in Sub-Saharan Africa’. Journal of Development Studies,
48(2), pp. 201–214.
Erk, Carolina Echeverri (2016) ‘Mental Health of Colombian Refugees in Ecuador: Trauma
Exposure, Discrimination and Resilience’. Master’s thesis (Universidade Nova de
Lisboa, Lisbon). http://hdl.handle.net/10362/19172.
Evans, David K., Brian Holtemeyer, and Katrina Kosec (2018) ‘Cash Transfers Increase
Trust in Local Government’. Policy Research Working Paper, 8333 (World Bank,
Washington, DC).
Ferroni, Marco A., Mercedes Mateo, and Mark Payne (2008) ‘Development under Conditions
of Inequality and Distrust: Social Cohesion in Latin America’. IFPRI Discussion
Paper 00777 (International Food Policy Research Institute, Washington, DC).
Glaeser, Edward L., David I. Laibson, José A. Scheinkman, and Christine L. Soutter (2000)
‘Measuring Trust’. Quarterly Journal of Economics, 115(3), pp. 811–846.
Green, Andy, Jan Germen Janmaat, and Christine Han (2009) Regimes of Social Cohesion.
LLAKES Research Paper, 1 (London: Centre for Learning and Life Chances in
Knowledge Economies and Societies, Institute of Education, University of London).
Page 32
30
Hayami, Yujiro (2009) ‘Social Capital, Human Capital, and the Community Mechanism:
Toward a Conceptual Framework for Economists’. Journal of Development Studies,
45(1), pp. 96–123.
Hidrobo, Melissa, John F. Hoddinott, Amber Peterman, Amy Margolies, and Vanessa
Moreira (2014) ‘Cash, Food, or Vouchers? Evidence from a Randomized Experiment
in Northern Ecuador’. Journal of Development Economics, 107, pp. 144–156.
Hidrobo, Melissa, Amber Peterman, and Lori Heise (2016) ‘The Effect of Cash, Vouchers
and Food Transfers on Intimate Partner Violence: Evidence from a Randomized
Experiment in Northern Ecuador’. American Economic Journal: Applied Economics,
8(3), pp. 284–303.
Holmes, Rebecca (2009) ‘Cash Transfers in Post-Conflict Contexts’. Project Briefing No. 32
(November) (Overseas Development Institute, London).
Kardan, Andrew, Ian MacAuslan, and Ngoni Marimo (2010) Evaluation of Zimbabwe’s
Emergency Cash Transfer (ZECT) Programme: Final Report (July) (Oxford: Oxford
Policy Management).
King. Elisabeth, Cyrus Samii, and Birte Snilstveit (2010) ‘Interventions to Promote Social
Cohesion in Sub-Saharan Africa’. Journal of Development Effectiveness, 2(3), pp.
336–370.
Lehmann, Christian, and Daniel Masterson (2014) ‘Emergency Economies: The Impact of
Cash Assistance in Lebanon’ (International Rescue Committee, Beirut).
Leites, Martin, Gustavo Pereira, Andres Rius, Gonzalo Salas, and Andrea Vigorito (2017)
‘Protocol: The Effect of Cash Transfers on Social Solidarity: A Systematic Review’.
(16 June) (Campbell Collaboration, Oslo).
McKenzie, David J. (2012) ‘Beyond Baseline and Follow-Up: The Case for More T in
Experiments’. Journal of Development Economics, 99(2), pp. 210–221.
Page 33
31
Narayan, Deepa (1999) ‘Bonds and Bridges: Social Capital and Poverty’. Policy Research
Working Paper, No. 2167 (World Bank, Washington, DC).
ODI (Overseas Development Institute) and CGD (Center for Global Development) (2015)
‘Doing Cash Differently: How Cash Transfers Can Transform Humanitarian Aid;
Report of the High-Level Panel on Humanitarian Cash Transfers’ (September) (ODI,
London). https://www.odi.org/sites/odi.org.uk/files/odi-assets/publications-opinion-
files/9828.pdf.
OECD (Organisation for Economic Co-operation and Development) (2012). Perspectives on
Global Development 2012: Social Cohesion in a Shifting World (Paris: OECD).
Pavanello, Sara, Carol Watson, W. Onyango-Ouma, and Paul Bukuluki (2016) ‘Effects of
Cash Transfers on Community Interactions: Emerging Evidence’. Journal of
Development Studies, 52(8), pp. 1147–1161.
Pellerano, Luca, Marta Moratti, Maja Jakobsen, Matěj Bajgar, and Valentina Barca (2014)
Child Grants Programme Impact Evaluation: Follow-up Report. Oxford: Oxford
Policy Management.
Putnam, Robert D. (2000) Bowling Alone: The Collapse and Revival of American
Community. (New York: Simon and Schuster).
Ritzen, Jozef, William Easterly, and Michael Woolcock (2000) ‘On “Good” Politicians and
“Bad” Policies: Social Cohesion, Institutions, and Growth’. Policy Research Working
Paper, No. 2448 (World Bank, Washington, DC).
Roelen, Keetie (2017) ‘Shame, Poverty and Social Protection’. IDS Working Paper, No. 489
(IDS, Brighton, UK).
https://opendocs.ids.ac.uk/opendocs/bitstream/handle/123456789/12998/Wp489_Onli
ne.pdf?sequence=174.
Page 34
32
Roelen, Keetie, Stephen Devereux, Abdul-Gafaru Abdulai, Bruno Martorano, Tia Palermo,
and Luigi Peter Ragno (2017) ‘How to Make “Cash Plus” Work: Linking Cash
Transfers to Services and Sectors’. Innocenti Working Paper, 2017-10 (Office of
Research, United Nations Children’s Fund, Florence).
Shedlin, Michele G., Carlos U. Decena, Hugo Noboa, and Óscar Betancourt (2014) ‘Sending-
Country Violence and Receiving-Country Discrimination: Effects on the Health of
Colombian Refugees in Ecuador’. Journal of Immigrant and Minority Health, 16(1),
pp. 119–124.
Skoufias, Emmanuel (2005) ‘Progresa and Its Impacts on the Welfare of Rural Households in
Mexico’. IFPRI Research Report 139 (International Food Policy Research Institute,
Washington, DC).
UNHCR (Office of the United Nations High Commission for Refugees) (2012) ‘2012 Global
Report: Ecuador’ (UNHCR, Geneva). http://www.unhcr.org/51b1d6470.pdf.
——— (2016) ‘Global Trends: Forced Displacement in 2015’. (20 June) (UNHCR, Geneva).
http://www.unhcr.org/statistics/unhcrstats/576408cd7/unhcr-global-trends-2015.html.
World Bank (2005) ‘Empowering People by Transforming Institutions: Social Development
in World Bank Operations’. Report 31494 (World Bank, Washington, DC).
Page 35
33
Figures and Tables
Figure 1. Programme booklet introducing the motivation behind targeting Colombian nationals
(‘Ecuador: A welcoming country’)
Source: WFP programme materials, cash and voucher intervention, 2011.
Page 36
34
Table 1: Baseline Characteristics of Respondents and test of equivalence at baseline
All Control Treatment p-value of diff.
Colombian 0.34 0.42 0.31 0.06
Colombian: economic motivation for migration 0.09 0.10 0.09 0.72
Colombian: political motivation for migration 0.09 0.10 0.09 0.56
Colombian: personal motivation for migration 0.06 0.06 0.05 0.54
Colombian: resided in urban centre > 20 years 0.10 0.16 0.07 0.00
Female 0.81 0.80 0.81 0.63
Age 39.01 39.27 38.91 0.71
Married 0.27 0.27 0.26 0.87
Secondary education or higher 0.36 0.33 0.38 0.27
Household size 3.75 3.92 3.69 0.06
Number of children aged 0–5 years 0.60 0.56 0.61 0.31
Number of children aged 6–15 years 0.89 0.99 0.86 0.05
Wealth index: 2nd quintile 0.19 0.14 0.21 0.00
Wealth index: 3rd quintile 0.21 0.22 0.21 0.82
Wealth index: 4th quintile 0.21 0.20 0.21 0.73
Wealth index: 5th quintile 0.20 0.26 0.18 0.05
Resident in urban centre ≤ 20 years 0.40 0.40 0.40 0.89
Carchi Province 0.39 0.33 0.40 0.48
N 1,878 505 1,373
Note: p-values are reported from Wald tests on the equality of means of treatment and control for each variable. Standard
errors are clustered at the cluster level.
Page 37
35
Table 2: Baseline social cohesion aggregate outcomes, individual indicators and test of equivalence at baseline
All Control Treatment p-value of diff.
Trust in individuals and social connectedness (standardized index) -0.03 -0.00 -0.04 0.54
Trust in individuals and social connectedness (sum; range: 3-65) 11.84 12.36 11.65 0.15
(1) I trust most people* 2.46 2.44 2.47 0.77
(2) I can rely on my neighbour for sending mail* 2.56 2.49 2.58 0.37
(3) I can rely on my neighbour to take care of my house if I am away* 2.81 2.79 2.82 0.75
(4) Network size (Number of people who would lend US$10 in time of need) 2.13 2.33 2.06 0.06
(5) Network size (Number of people who would lend US$100 in time of need) 1.88 2.30 1.73 0.11
Personal agency (standardized index) 0.05 0.00 0.07 0.50
Personal agency (sum; range: 5-20) 17.73 17.59 17.78 0.45
(1) My life is determined by my own actions* 3.78 3.73 3.80 0.25
(2) I have the power to take important decision to change my life* 3.67 3.60 3.69 0.16
(3) I am satisfied with my life* 3.55 3.53 3.56 0.69
(4) I am capable of protecting my own interests* 3.81 3.80 3.81 0.92
(5) Overall, how do you feel lately? (1=very unhappy – 4=very happy) 2.92 2.93 2.92 0.70
Attitudes accepting diversity (standardized index) 0.04 0.00 0.06 0.49
Attitudes accepting diversity (sum; range: 3-12) 9.01 8.91 9.04 0.40
(1) Cultural diversity is good* 3.61 3.61 3.61 0.95
(2) Xenophobia is not an issue* 1.92 1.84 1.96 0.26
(3) In my community people from different nationalities live well together* 3.47 3.47 3.48 0.90
Lack of discrimination (last 6 months, standardized index) -0.12 -0.00 -0.16 0.05
Lack of discrimination (last 6 months, sum; range: 0-10) 9.07 9.18 9.03 0.15
(1) Freedom from discrimination due to ethnic (=1) 0.94 0.95 0.93 0.06
(2) Freedom from discrimination due to gender (=1) 0.95 0.97 0.95 0.05
(3) Freedom from discrimination due to social condition (=1) 0.73 0.73 0.73 1.00
(4) Freedom from discrimination due to occupation (=1) 0.86 0.87 0.85 0.25
(5) Freedom from discrimination due to political views (=1) 0.96 0.98 0.95 0.00
(6) Freedom from discrimination due to disability (=1) 0.90 0.91 0.90 0.24
(7) Freedom from discrimination due to nationality (=1) 0.86 0.85 0.87 0.67
(8) Freedom from discrimination due to religious beliefs (=1) 0.94 0.96 0.93 0.09
(9) Freedom from discrimination due to physical appearance (=1) 0.95 0.96 0.94 0.05
(10) Freedom from discrimination due to other reasons (=1) 0.98 0.98 0.98 0.92
Confidence in institutions (standardized index) 0.02 0.00 0.03 0.72
Confidence in institutions (sum; range: 6-24) 18.98 18.94 18.99 0.84
(1) The Government would help my family in an emergency* 3.01 3.02 3.01 0.88
Page 38
36
(2) Politicians represent my interests* 2.02 2.01 2.02 0.90
(3) If I am victim of a crime, I can go to the police to get help* 3.54 3.54 3.54 0.97
(4) I have the space to participate in the decisions of my community* 2.98 3.04 2.96 0.44
(5) I have the right to social basic assistance* 3.74 3.69 3.77 0.26
(6) I feel part of the community* 3.68 3.64 3.70 0.42
Social participation (standardized index) -0.09 0.00 -0.12 0.16
Social participation (sum; range: 0-4) 0.71 0.78 0.68 0.22
(1) Participation in agricultural association or union (=1) 0.06 0.10 0.05 0.07
(2) Participation in religious or spiritual group (=1) 0.28 0.29 0.28 0.86
(3) Participation in community association or political group (=1) 0.24 0.23 0.24 0.88
(4) Participation in other groups (NGOs, cultural) (=1) 0.13 0.16 0.11 0.12
Social cohesion (standardized index) -0.06 0.00 -0.08 0.31
Social cohesion (sum; range: 35-115) 67.34 67.76 67.18 0.43
Note: p-values are reported from Wald tests on the equality of means of treatment and control for each variable. Standard errors are clustered at the cluster level. PCA = principal component
index.
* Values range from 1 (strongly disagree) to 4 (strongly agree).
Page 39
1
Table 3: ANCOVA models of impact of transfers on social cohesion measures (standardized indices)
Trust in
individuals
Agency Attitudes
accepting diversity
Lack of
discrimination
Confidence in
institutions
Social participation Social cohesion
(1) (2) (3) (4) (5) (6) (7) (8) (9) (10) (11) (12) (13) (14)
Pooled treatment 0.05 0.10 0.18 −0.00 0.11 0.02 0.05 0.06 0.15 0.06 0.11 0.02 0.17 0.08
(0.07) (0.08) (0.09)** (0.05) (0.07) (0.06) (0.07) (0.10) (0.08)* (0.07) (0.07) (0.08) (0.07)** (0.07)
Colombian 0.01 0.09 −0.02 −0.35 0.20 0.04 −0.17 −0.14 −0.12 −0.27 0.00 −0.15 −0.09 −0.26
(0.07) (0.11) (0.07) (0.16)** (0.06)*** (0.12) (0.07)** (0.14) (0.06)* (0.14)** (0.05) (0.08)* (0.06) (0.14)*
Pooled treatment X
Colombian
−0.11 0.46 0.22 −0.03 0.22 0.21 0.24
(0.13) (0.16)*** (0.13)* (0.14) (0.15) (0.10)** (0.15)
R2 0.07 0.07 0.05 0.07 0.02 0.02 0.09 0.09 0.07 0.07 0.07 0.07 0.12 0.12
N 1,878 1,878 1,878 1,878 1,878 1,878 1,878 1,878 1,878 1,878 1,878 1,878 1,878 1,878
Net treatment Colombian −0.01 0.46 0.25 0.03 0.28 0.24 0.32
(0.10) (0.17)*** (0.13)* (0.11) (0.14)** (0.08)*** (0.14)**
Note: Standard errors in parenthesis clustered at the cluster level. Aggregate outcomes are compiled using standardized indicators. All regressions include the following covariates at baseline:
respondent attainment of secondary education or higher (dummy); age of respondent; female (dummy); married (dummy); household size; number of children aged 0–5 years; number of children
aged 6–15 years; dummies for wealth quintiles (based on wealth index); resident in urban centre ≤ 20 years (dummy); residing in Carchi Province (dummy); dependent variables at baseline.
* p < .1 ** p < .05 *** p < .01
Page 40
2
Table 4: ANCOVA models of impact of transfers by treatment modalities on social cohesion measures (standardized indices) with covariates
Trust in
individuals
Agency Attitudes
accepting
diversity
Lack of
discrimination
Confidence
in
institutions
Social
participation
Social
cohesion
Treatment = food 0.21 0.14 0.13 −0.01 0.15 0.13 0.19
(0.10)** (0.12) (0.10) (0.10) (0.09) (0.11) (0.10)**
Treatment = cash −0.03 0.22 0.05 0.06 0.17 0.03 0.14
(0.08) (0.09)** (0.08) (0.08) (0.08)** (0.08) (0.08)*
Treatment = voucher 0.02 0.16 0.15 0.08 0.13 0.16 0.19
(0.08) (0.10)* (0.08)* (0.08) (0.09) (0.08)** (0.08)**
R2 0.07 0.05 0.02 0.09 0.07 0.07 0.12
N 1,878 1,878 1,878 1,878 1,878 1,878 1,878
F test: food = voucher 3.14 0.04 0.07 1.14 0.06 0.08 0.01
p-value 0.08 0.84 0.79 0.29 0.81 0.78 0.91
F test: cash = voucher 0.33 0.71 2.90 0.12 0.30 2.43 0.76
p-value 0.57 0.40 0.09 0.73 0.58 0.12 0.38
F test: food = cash 5.06 0.63 0.87 0.55 0.05 0.82 0.29
p-value 0.03 0.43 0.35 0.46 0.82 0.37 0.59
Note: Standard errors in parenthesis clustered at the cluster level. Aggregate outcomes are compiled using standardized indicators. All regressions include the following covariates at baseline:
respondent attainment of secondary education or higher (dummy); age of respondent; female (dummy); married (dummy); household size; number of children aged 0–5 years; number of children
aged 6–15 years; dummies for wealth quintiles (based on wealth index); resident in urban centre ≤ 20 years (dummy); residing in Carchi Province (dummy); dependent variables at baseline.
* p < .1 ** p < .05 *** p < .01
Page 42
4
Table 5: ANCOVA models of differential impact of transfers on social cohesion measures (sum) with respect to Colombian Migration reasons
Trust in
individuals
Agency Attitudes
accepting
diversity
Lack of
discrimination
Confidence
in
institution
Social
participation
Social
cohesion
Pooled treatment 0.10 −0.00 0.02 0.06 0.06 0.02 0.08
(0.08) (0.06) (0.06) (0.10) (0.07) (0.08) (0.07)
Colombian: economic motivation for migration 0.41 −0.52 −0.08 −0.10 −0.47 0.03 −0.26
(0.20)** (0.27)* (0.18) (0.17) (0.23)** (0.13) (0.20)
Colombian: political motivation for migration 0.03 −0.35 0.13 −0.37 −0.18 −0.15 −0.34
(0.14) (0.22) (0.18) (0.24) (0.22) (0.11) (0.26)
Colombian: personal motivation for migration 0.13 −0.33 0.09 0.03 0.01 −0.18 −0.07
(0.21) (0.19)* (0.15) (0.29) (0.20) (0.16) (0.22)
Colombian: resided in urban centre > 20 years −0.06 −0.25 0.03 −0.12 −0.30 −0.19 −0.28
(0.14) (0.14)* (0.13) (0.16) (0.14)** (0.12) (0.13)**
Treatment X Colombian: economic motivation for migration −0.34 0.69 0.35 0.03 0.48 0.05 0.37
(0.22) (0.27)** (0.21)* (0.18) (0.24)** (0.15) (0.20)*
Treatment X Colombian: political motivation for migration −0.11 0.40 0.06 −0.04 0.07 0.45 0.19
(0.15) (0.23)* (0.21) (0.25) (0.23) (0.14)*** (0.27)
Treatment X Colombian: personal motivation for migration −0.16 0.49 0.14 −0.10 −0.02 0.17 0.10
(0.23) (0.20)** (0.18) (0.29) (0.20) (0.19) (0.22)
Treatment X Colombian: resided in urban centre > 20 years 0.07 0.30 0.31 −0.02 0.24 0.12 0.24
(0.16) (0.15)** (0.16)* (0.21) (0.16) (0.16) (0.16)
Page 43
5
R2 0.07 0.07 0.03 0.09 0.08 0.08 0.13
N 1,878 1,878 1,878 1,878 1,878 1,878 1,878
F test: economic = political 1.53 3.58 2.15 0.04 5.62 4.94 1.04
p-value 0.22 0.06 0.14 0.84 0.02 0.03 0.31
F test: economic = personal 0.37 0.70 0.84 0.24 4.49 0.33 1.06
p-value 0.54 0.40 0.36 0.63 0.04 0.57 0.30
F test: personal = political 0.04 0.18 0.11 0.02 0.10 2.03 0.08
p-value 0.84 0.68 0.74 0.87 0.75 0.16 0.78
F test: Colombian long resided = political 1.03 0.15 1.25 0.00 0.44 2.82 0.04
p-value 0.31 0.70 0.27 0.95 0.51 0.10 0.85
F test: Colombian long resided = economic 3.31 1.98 0.04 0.04 0.83 0.11 0.40
p-value 0.07 0.16 0.85 0.83 0.36 0.75 0.53
F test: Colombian long resided = personal 0.82 0.72 0.65 0.06 1.19 0.04 0.35
p-value 0.37 0.40 0.42 0.81 0.28 0.84 0.56
Note: Standard errors in parenthesis clustered at the cluster level. Aggregate outcomes are compiled using standardized indicators. All regressions include the following covariates at baseline:
respondent attainment of secondary education or higher (dummy); age of respondent; female (dummy); married (dummy); household size; number of children aged 0–5 years; number of children
aged 6–15 years; dummies for wealth quintiles (based on wealth index); resident in urban centre ≤ 20 years (dummy); residing in Carchi Province (dummy); dependent variables at baseline.
* p < .1 ** p < .05 *** p < .01
Page 44
6
8. Annex Figures and Tables
Figure A.1. Distribution of treatment and control neighbourhoods across Carchi and Sucumbíos
Page 45
7
Table A.1: Individual-level attrition (from baseline to endline) by treatment status
N All Control Treatment p-value of diff.
Attrition rate 2,357 0.20 0.23 0.19 0.19
Note: p-value obtained from Wald test on the equality of means of Treatment and Comparison attrition rate. Standard errors clustered at the cluster level.
* p < .1 ** p < .05 *** p < .01
Table A.2: Testing individual differential attrition (from baseline to endline) by baseline characteristics and outcomes
Control Treatment Difference
Attritors Non-
attritors
p-value Attritors Non-
attritors
p-value Col(1)-
Col(4)
p-value
(1) (2) (3) (4) (5) (6) (7) (8)
Colombian 0.48 0.42 0.35 0.44 0.31 0.00 0.03 0.70
Colombian: economic motivation for migration 0.17 0.10 0.10 0.15 0.09 0.01 0.02 0.63
Colombian: political motivation for migration 0.16 0.10 0.09 0.16 0.09 0.00 0.00 0.94
Colombian: personal motivation for migration 0.07 0.06 0.69 0.09 0.05 0.06 −0.01 0.69
Colombian: resided in urban centre > 20 years 0.07 0.16 0.00 0.05 0.07 0.12 0.02 0.43
Secondary education or higher 0.44 0.33 0.06 0.45 0.38 0.01 −0.02 0.76
Age (years) 37.60 39.27 0.32 35.62 38.91 0.00 1.98 0.22
Female 0.71 0.80 0.06 0.70 0.81 0.00 0.00 0.96
Married 0.23 0.27 0.44 0.27 0.26 0.90 −0.04 0.45
Household size 4.11 3.92 0.33 3.80 3.69 0.30 0.31 0.09
Page 46
8
Number of children aged 0–5 years 0.62 0.56 0.40 0.63 0.61 0.78 −0.01 0.92
Number of children aged 6–15 years 0.96 0.99 0.75 0.82 0.86 0.55 0.14 0.18
Wealth index: 2nd quintile 0.23 0.14 0.00 0.23 0.21 0.42 −0.00 0.99
Wealth index: 3rd quintile 0.18 0.22 0.45 0.14 0.21 0.01 0.04 0.34
Wealth index: 4th quintile 0.16 0.20 0.32 0.17 0.21 0.14 −0.01 0.73
Wealth index: 5th quintile 0.26 0.26 0.98 0.16 0.18 0.47 0.10 0.12
Resident in urban centre ≤ 20 years 0.60 0.40 0.00 0.56 0.40 0.00 0.04 0.57
Carchi Province 1.63 1.67 0.58 1.59 1.60 0.86 0.05 0.69
Trust in individuals 0.06 −0.02 0.38 −0.09 −0.06 0.65 0.15 0.13
Agency −0.01 0.00 0.91 0.01 0.07 0.37 −0.02 0.85
Attitudes accepting diversity −0.00 0.00 0.96 0.07 0.06 0.87 −0.07 0.57
Lack of discrimination −0.14 0.04 0.08 −0.31 −0.10 0.06 0.17 0.22
Confidence in institutions −0.16 0.05 0.04 −0.19 0.08 0.00 0.03 0.83
Social participation −0.11 0.03 0.14 −0.15 −0.10 0.44 0.04 0.70
Social cohesion −0.13 0.04 0.09 −0.26 −0.04 0.00 0.13 0.30
N 147 505 332 1,373
Note: p-values are reported from Wald tests on the equality of means of Treatment and Control for each variable. Standard errors clustered at the cluster level.
* p < .1 ** p < .05 *** p < .01
Page 47
9
Table A.3: Correlations baseline and follow-up: Aggregate outcomes
PCA Standardized
index
Trust in individuals 0.249 0.217
Agency 0.077 0.110
Attitudes accepting diversity 0.065 0.064
Lack of discrimination 0.263 0.245
Confidence in institutions 0.182 0.170
Social participation 0.238 0.236
Social cohesion 0.295 0.296
Note: Correlation is calculated on the analysis sample (N = 1,878). PCA = principal component analysis.
Table A.4: Scale Reliability Coefficient for Principal Component Analysis measures: Alpha
Baseline Follow-up
Trust in individuals 0.548 0.580
Agency 0.594 0.617
Attitudes accepting diversity 0.140 0.306
Lack of discrimination 0.745 0.777
Page 48
10
Confidence in institutions 0.483 0.568
Social Participation 0.344 0.361
Social cohesion 0.674 0.751
Note: Tests of scale reliability are performed separately for baseline and follow-up and performed on the analysis sample (N = 1,878).
Page 49
11
Table A.5: ANCOVA models of impact of transfers on social cohesion measures (Principal Component Analysis)
Trust in
individuals
Agency Attitudes
accepting
diversity
Lack of
discrimination
Confidence in
institutions
Social
participation
Social cohesion
(1) (2) (3) (4) (5) (6) (7) (8) (9) (10) (11) (12) (13) (14)
Pooled treatment 0.01 0.02 0.18 −0.02 0.01 −0.06 0.07 0.08 0.18 0.08 0.05 −0.01 0.21 0.10
(0.07) (0.09) (0.10)* (0.06) (0.08) (0.08) (0.07) (0.10) (0.09)** (0.08) (0.05) (0.07) (0.11)** (0.10)
Colombian −0.01 0.02 −0.06 −0.42 0.04 −0.09 −0.15 −0.14 −0.15 −0.32 0.00 −0.10 −0.15 −0.35
(0.08) (0.13) (0.07) (0.16)*** (0.06) (0.15) (0.07)** (0.14) (0.08)* (0.15)** (0.04) (0.06) (0.09)* (0.20)*
Pooled treatment X
Colombian
−0.05 0.51 0.18 −0.02 0.24 0.15 0.29
(0.15) (0.17)*** (0.15) (0.14) (0.17) (0.08)* (0.21)
R2 0.08 0.08 0.04 0.06 0.02 0.02 0.10 0.10 0.08 0.08 0.07 0.08 0.11 0.12
N 1,878 1,878 1,878 1,878 1,878 1,878 1,878 1,878 1,878 1,878 1,878 1,878 1,878 1,878
Net treatment Colombian −0.02 0.50 0.12 0.05 0.32 0.14 0.38
(0.12) (0.18)*** (0.15) (0.11) (0.16)** (0.07)** (0.19)**
Note: Standard errors in parenthesis clustered at the cluster level. All regressions include the following covariates at baseline: respondent attainment of secondary education or higher (dummy); age
of respondent; female (dummy); married (dummy); household size; number of children aged 0–5 years; number of children aged 6–15 years; dummies for wealth quintiles (based on wealth index);
resident in urban centre ≤ 20 years (dummy); residing in Carchi Province (dummy); dependent variables at baseline.
* p < .1 ** p < .05 *** p < .01
Page 50
12
Table A.6: ANCOVA models of impact of transfers on social cohesion measures (standardized indices), unadjusted
Trust in
individuals
Agency Attitudes accepting
diversity
Lack of
discrimination
Confidence in
institutions
Social participation Social cohesion
(1) (2) (3) (4) (5) (6) (7) (8) (9) (10) (11) (12) (13) (14)
Pooled treatment 0.04 0.08 0.16 −0.02 0.10 0.01 0.04 0.05 0.12 0.05 0.09 0.01 0.15 0.06
(0.06) (0.08) (0.09)* (0.06) (0.07) (0.06) (0.07) (0.09) (0.08)* (0.07) (0.06) (0.08) (0.07)** (0.07)
Colombian −0.04 0.03 −0.10 −0.42 0.18 0.00 −0.22 −0.21 −0.14 −0.27 −0.04 −0.18 −0.16 −0.33
(0.06) (0.11) (0.06) (0.16)** (0.06)*** (0.12) (0.06)*** (0.13) (0.06)** (0.14)* (0.05) (0.08)** (0.06)*** (0.14)**
Pooled Treatment X
Colombian
−0.10 0.46 0.24 −0.02 0.18 0.19 0.23
(0.13) (0.16)*** (0.14)* (0.15) (0.14) (0.09)** (0.15)
R2 0.05 0.06 0.03 0.05 0.01 0.02 0.08 0.08 0.05 0.05 0.06 0.06 0.11 0.11
N 1,878 1,878 1,878 1,878 1,878 1,878 1,878 1,878 1,878 1,878 1,878 1,878 1,878 1,878
Net treatment Colombian −0.02 0.44 0.25 0.03 0.23 0.20 0.29
(0.10) (0.17)** (0.13)* (0.11) (0.13)* (0.07)*** (0.14)**
Note: Standard errors in parenthesis clustered at the cluster level. Aggregate outcomes are compiled using standardized indicators. Unadjusted model with the inclusion of dependent variables at
baseline and residing in Carchi Province (dummy).
* p < .1 ** p < .05 *** p < .01
Page 51
13
Table A.7: Background and migration characteristics by motivation for migrating
Means of characteristics p-value of difference
Economic Political Personal Col(1)-
Col(2)
Col(1)-
Col(3)
Col(2)-
Col(3)
Background characteristics (1) (2) (3) (4) (5) (6)
Secondary education or higher 0.25 0.25 0.25 0.95 0.98 0.97
Age (years) 33.07 34.24 34.12 0.37 0.42 0.94
Female 0.77 0.84 0.92 0.12 0.00 0.03
Married 0.16 0.13 0.13 0.29 0.52 0.92
Household size 3.66 3.92 4.46 0.16 0.00 0.06
Number of children aged 0–5 years 0.68 0.75 0.70 0.44 0.91 0.59
Number of children aged 6–15 years 0.85 0.96 1.56 0.29 0.00 0.00
Wealth index: 2nd quintile 0.22 0.26 0.24 0.43 0.71 0.69
Wealth index: 3rd quintile 0.18 0.20 0.27 0.59 0.09 0.24
Wealth index: 4th quintile 0.16 0.12 0.14 0.30 0.73 0.63
Wealth index: 5th quintile 0.08 0.07 0.11 0.74 0.40 0.27
Carchi province 0.44 0.36 0.18 0.12 0.00 0.00
Migration characteristics
Area of origin: urban 0.25 0.20 0.32 0.29 0.23 0.03
Number of times moved excluding the most recent 1.59 1.15 2.20 0.01 0.00 0.00
Respondent moved with entire household during the first move 0.38 0.50 0.32 0.02 0.41 0.01
Respondent already had relatives in this urban centre when first moved 0.41 0.34 0.44 0.20 0.66 0.11
Page 52
14
Respondent or household member experienced (since first move):
Verbal threats 0.24 0.27 0.37 0.60 0.04 0.10
Verbal insults 0.27 0.30 0.34 0.48 0.16 0.42
Physically threatened with knife/gun 0.15 0.20 0.19 0.26 0.42 0.88
Physically attacked with knife/gun 0.08 0.09 0.10 0.77 0.73 0.96
Physically attached/injured in other ways 0.08 0.12 0.08 0.26 0.78 0.18
Kidnapped 0.02 0.02 0.07 0.96 0.07 0.07
Obliged to do any manual work or other labour 0.09 0.06 0.08 0.49 0.71 0.73
Extorted for money or other goods 0.06 0.04 0.10 0.33 0.24 0.09
Robbed or damaged any property 0.17 0.19 0.23 0.68 0.21 0.40
Obliged to join military forces 0.07 0.09 0.10 0.52 0.49 0.87
Sexual aggression 0.05 0.09 0.06 0.13 0.65 0.24
Note: p-values are reported from Wald tests on the equality of means of treatment and control for each variable. Standard errors are clustered at the cluster level. N economic migrants = 177. N
political migrants = 171. N personal reasons migrants = 105.
* p < .1 ** p < .05 *** p < .01
Page 53
15
Table A.8: ANCOVA models of impact of transfers on indicators of trust in individuals
I trust most peoplea I can rely on my
neighbour for
sending maila
I can rely on my
neighbour to take
care of my house if I
am awaya
Network size
(number of people
who would lend
US$10 in time of
need)
Network size
(number of people
who would lend
US$100 in time of
need)
(1) (2) (3) (4) (5) (6) (7) (8) (9) (10)
Pooled treatment 0.07 0.09 −0.01 −0.04 −0.01 −0.00 0.04 0.13 0.05 0.11
(0.06) (0.07) (0.06) (0.07) (0.06) (0.07) (0.07) (0.07)* (0.09) (0.09)
Colombian 0.01 0.05 0.00 −0.06 0.00 0.00 0.03 0.18 0.01 0.12
(0.06) (0.10) (0.06) (0.10) (0.06) (0.10) (0.08) (0.13) (0.09) (0.12)
Pooled treatment X Colombian −0.04 0.09 −0.00 −0.21 −0.15
(0.11) (0.11) (0.12) (0.14) (0.15)
R2 0.06 0.06 0.05 0.05 0.06 0.06 0.06 0.07 0.03 0.03
N 1,878 1,878 1,878 1,878 1,878 1,878 1,878 1,878 1,878 1,878
Bonferroni-Sidak p-value: pooled treatment 0.72 0.74 0.99 0.98 0.99 0.99 0.98 0.33 0.99 0.73
Bonferroni-Sidak p-value: pooled treatment X Colombian 0.99 0.93 0.99 0.54 0.87
Note: Standard errors in parenthesis clustered at the cluster level. All regressions include the following covariates at baseline: respondent attainment of secondary education or higher (dummy); age
of respondent; female (dummy); married (dummy); household size; number of children aged 0–5 years; number of children aged 6–15 years; dummies for wealth quintiles (based on wealth index);
resident in urban centre ≤ 20 years (dummy); residing in Carchi Province (dummy); dependent variables at baseline.
a. Values range from 1 (strongly disagree) to 4 (strongly agree).
* p < .1 ** p < .05 *** p < .01
Page 55
17
Table A.9: ANCOVA models of impact of transfers on indicators of agency
My life is determined
by my own actionsa
I have the power to
take important
decision to change my
lifea
I am satisfied with my
lifea
I am capable of
protecting my own
interestsa
Overall how do you
feel lately? (1 = very
unhappy – 4=very
happy)
(1) (2) (3) (4) (5) (6) (7) (8) (9) (10)
Pooled treatment 0.15 −0.01 0.13 −0.02 0.10 −0.07 0.16 0.04 0.04 0.04
(0.08)* (0.06) (0.08) (0.06) (0.07) (0.06) (0.09)* (0.06) (0.06) (0.07)
Colombian −0.06 −0.35 −0.07 −0.33 0.03 −0.27 −0.04 −0.25 0.03 0.03
(0.06) (0.14)** (0.06) (0.12)*** (0.06) (0.13)** (0.07) (0.16) (0.07) (0.10)
Pooled treatment X Colombian 0.41 0.37 0.42 0.29 0.01
(0.16)** (0.13)*** (0.14)*** (0.17)* (0.11)
R2 0.03 0.04 0.03 0.04 0.09 0.10 0.04 0.04 0.03 0.03
N 1,878 1,878 1,878 1,878 1,878 1,878 1,878 1,878 1,878 1,878
Bonferroni-Sidak p-value: pooled treatment 0.31 0.99 0.46 0.99 0.63 0.75 0.37 0.96 0.95 0.98
Bonferroni-Sidak p-value: pooled treatment X Colombian 0.05 0.03 0.01 0.37 0.99
Note: Standard errors in parenthesis clustered at the cluster level. All regressions include the following covariates at baseline: respondent attainment of secondary education or higher (dummy); age
of respondent; female (dummy); married (dummy); household size; number of children aged 0–5 years; number of children aged 6–15 years; dummies for wealth quintiles (based on wealth index);
resident in urban centre ≤ 20 years (dummy); residing in Carchi Province (dummy); dependent variables at baseline.
a. Values range from 1 (strongly disagree) to 4 (strongly agree).
* p < .1 ** p < .05 *** p < .01
Page 57
19
Table A.10: ANCOVA models of impact of transfers on indicators of attitudes accepting diversity
Cultural diversity is good Xenophobia is not an issue In my community people
from different nationalities
live well together
(1) (2) (5) (6) (7) (8)
Pooled treatment 0.03 −0.08 0.08 0.10 0.08 0.02
(0.08) (0.07) (0.08) (0.09) (0.08) (0.07)
Colombian 0.04 −0.17 0.19 0.23 0.13 0.02
(0.06) (0.14) (0.07)*** (0.11)** (0.06)** (0.14)
Pooled treatment X Colombian 0.29 −0.05 0.15
(0.15)* (0.13) (0.15)
R2 0.01 0.02 0.01 0.01 0.02 0.02
N 1,878 1,878 1,878 1,878 1,878 1,878
Bonferroni-Sidak p-value: pooled treatment 0.99 0.72 0.77 0.68 0.76 0.99
Bonferroni-Sidak p-value: pooled treatment X Colombian 0.22 0.99 0.79
Note: Standard errors in parenthesis clustered at the cluster level. All regressions include the following covariates at baseline: respondent attainment of secondary education or higher (dummy); age
of respondent; female (dummy); married (dummy); household size; number of children aged 0–5 years; number of children aged 6–15 years; dummies for wealth quintiles (based on wealth index);
resident in urban centre ≤ 20 years (dummy); residing in Carchi Province (dummy); dependent variables at baseline. Values range from 1 (strongly disagree) to 4 (strongly agree).
* p < .1 ** p < .05 *** p < .01
Page 58
20
Table A.11: ANCOVA models of impact of transfers on indicators of freedom from discrimination due to:
Ethnicity Gender Social condition Occupation Political views Disability Nationality Religious beliefs Physical
appearance
Other reasons
(1) (2) (3) (4) (5) (6) (7) (8) (9) (10) (11) (12) (13) (14) (15) (16) (17) (18) (19) (20)
Pooled
treatment
−0.07 −0.02 0.02 0.02 0.06 0.03 0.10 0.10 0.04 0.07 0.07 0.04 0.02 0.02 0.07 0.09 −0.01 0.01 −0.09 −0.12
(0.05) (0.06) (0.07) (0.09) (0.07) (0.08) (0.07) (0.09) (0.05) (0.07) (0.06) (0.07) (0.05) (0.05) (0.05) (0.07) (0.08) (0.12) (0.06) (0.06)*
Colombian −0.10 −0.02 0.04 0.03 −0.04 −0.10 −0.04 −0.04 −0.00 0.04 −0.05 −0.10 −0.43 −0.42 −0.04 −0.01 −0.11 −0.07 −0.14 −0.18
(0.07) (0.11) (0.06) (0.11) (0.06) (0.10) (0.07) (0.12) (0.05) (0.09) (0.06) (0.14) (0.07)*** (0.11)*** (0.06) (0.11) (0.08) (0.17) (0.08)* (0.11)
Pooled
treatment X
Colombian
−0.12 0.01 0.08 −0.00 −0.06 0.08 −0.02 −0.05 −0.05 0.07
(0.12) (0.11) (0.12) (0.13) (0.10) (0.15) (0.12) (0.11) (0.16) (0.13)
R2 0.05 0.05 0.03 0.03 0.07 0.07 0.06 0.06 0.04 0.04 0.07 0.07 0.19 0.19 0.07 0.07 0.03 0.03 0.01 0.01
N 1,878 1,878 1,878 1,878 1,878 1,878 1,878 1,878 1,878 1,878 1,878 1,878 1,878 1,878 1,878 1,878 1,878 1,878 1,878 1,878
Bonferroni-
Sidak p-
value: tooled
treatment
0.83 0.99 0.99 0.99 0.99 0.99 0.78 0.95 0.99 0.98 0.95 0.99 0.99 0.99 0.86 0.91 0.99 0.99 0.76 0.45
Bonferroni-
Sidak p-
value: pooled
treatment X
Colombian
0.97 0.99 0.99 0.99 0.99 0.99 0.99 0.99 0.99 0.99
Note: Standard errors in parenthesis clustered at the cluster level. All regressions include the following covariates at baseline: respondent attainment of secondary education or higher (dummy); age
Page 59
21
of respondent; female (dummy); married (dummy); household size; number of children aged 0–5 years; number of children aged 6–15 years; dummies for wealth quintiles (based on wealth index);
resident in urban centre ≤ 20 years (dummy); residing in Carchi Province (dummy); dependent variables at baseline. Indicators equal to 1 if respondent did not experience discrimination episode and
0 otherwise.
* p < .1 ** p < .05 *** p < .01
Page 60
22
Table A.12: ANCOVA models of impact of transfers on indicators of confidence in institutions
The Government
would help my
family in an
emergency
Politicians
represent my
interests
If I am victim of a
crime I can go to the
police to get help
I have the space to
participate in the
decisions of my
community
I have the right to
social basic
assistance
I feel part of the
community
(1) (2) (3) (4) (5) (6) (7) (8) (9) (10) (11) (12)
Pooled treatment 0.11 0.03 −0.09 −0.07 0.16 0.12 0.12 0.06 0.12 0.07 0.13 0.04
(0.06)* (0.07) (0.07) (0.10) (0.06)** (0.06)* (0.07)* (0.07) (0.08) (0.07) (0.08) (0.06)
Colombian −0.03 −0.16 −0.08 −0.06 −0.02 −0.09 −0.13 −0.23 −0.13 −0.22 −0.07 −0.24
(0.06) (0.10) (0.07) (0.12) (0.06) (0.12) (0.06)** (0.12)* (0.07)* (0.14) (0.06) (0.14)*
Pooled treatment X Colombian 0.19 −0.03 0.09 0.15 0.13 0.24
(0.11)* (0.13) (0.13) (0.14) (0.15) (0.15)
R2 0.05 0.05 0.02 0.02 0.04 0.04 0.07 0.07 0.06 0.06 0.03 0.03
N 1,878 1,878 1,878 1,878 1,878 1,878 1,878 1,878 1,878 1,878 1,878 1,878
Bonferroni-Sidak p-value: pooled treatment 0.34 0.99 0.81 0.97 0.09 0.32 0.43 0.95 0.49 0.89 0.50 0.99
Bonferroni-Sidak p-value: pooled treatment X
Colombian
0.45 0.99 0.98 0.86 0.94 0.53
Note: Standard errors in parenthesis clustered at the cluster level. All regressions include the following covariates at baseline: respondent attainment of secondary education or higher (dummy); age
of respondent; female (dummy);married (dummy); household size; number of children aged 0–5 years; number of children aged 6–15 years; dummies for wealth quintiles (based on wealth index);
resident in urban centre ≤ 20 years (dummy); residing in Carchi Province (dummy); dependent variables at baseline. Values range from 1 (strongly disagree) to 4 (strongly agree).
* p < .1 ** p < .05 *** p < .01
Page 62
24
Table A.13: ANCOVA models of impact of transfers on indicators of social participation
Participation in
agricultural association
or union
Participation in
religious or spiritual
group
Participation in
community association
or political group
Participation in other
groups (NGOs cultural)
(1) (2) (3) (4) (5) (6) (7) (8)
Pooled treatment −0.09 −0.13 −0.03 −0.08 −0.04 −0.05 0.41 0.31
(0.06) (0.07)* (0.06) (0.08) (0.07) (0.09) (0.09)*** (0.11)***
Colombian −0.03 −0.10 0.00 −0.10 0.01 0.00 0.02 −0.17
(0.05) (0.10) (0.06) (0.10) (0.05) (0.10) (0.09) (0.11)
Pooled treatment X Colombian 0.10 0.15 0.01 0.27
(0.10) (0.12) (0.11) (0.14)*
R2 0.07 0.07 0.09 0.09 0.05 0.05 0.04 0.04
N 1,878 1,878 1,878 1,878 1,878 1,878 1,878 1,878
Bonferroni-Sidak p-value: pooled treatment 0.38 0.28 0.99 0.79 0.96 0.98 0.00 0.03
Bonferroni-Sidak p-value: pooled treatment X Colombian 0.82 0.62 0.99 0.19
Note: Standard errors in parenthesis clustered at the cluster level. All regressions include the following covariates at baseline: respondent attainment of secondary education or higher (dummy); age
of respondent; female (dummy); married (dummy); household size; number of children aged 0–5 years; number of children aged 6–15 years; dummies for wealth quintiles (based on wealth index);
resident in urban centre ≤ 20 years (dummy); residing in Carchi Province (dummy); dependent variables at baseline. Indicators equal to 1 if respondent did not experience discrimination episode and
0 otherwise.
* p < .1 ** p < .05 *** p < .01