19
Economic Update Idaho Workforce Development Council Meeting March 8, 2012 Bob Uhlenkott Chief Research Officer Idaho Department of Labor
| Date post: | 30-Dec-2015 |
| Category: |
Documents |
| Upload: | kareem-owens |
| View: | 31 times |
| Download: | 0 times |

Economic Update
Idaho Workforce Development
Council MeetingMarch 8, 2012
Bob UhlenkottChief Research Officer
Idaho Department of Labor
19971998
19992000
20012002
20032004
20052006
20072008
20092010
20112012
20132014
20152016
$-
$10,000
$20,000
$30,000
$40,000
$50,000
$60,000
$70,000
$80,000
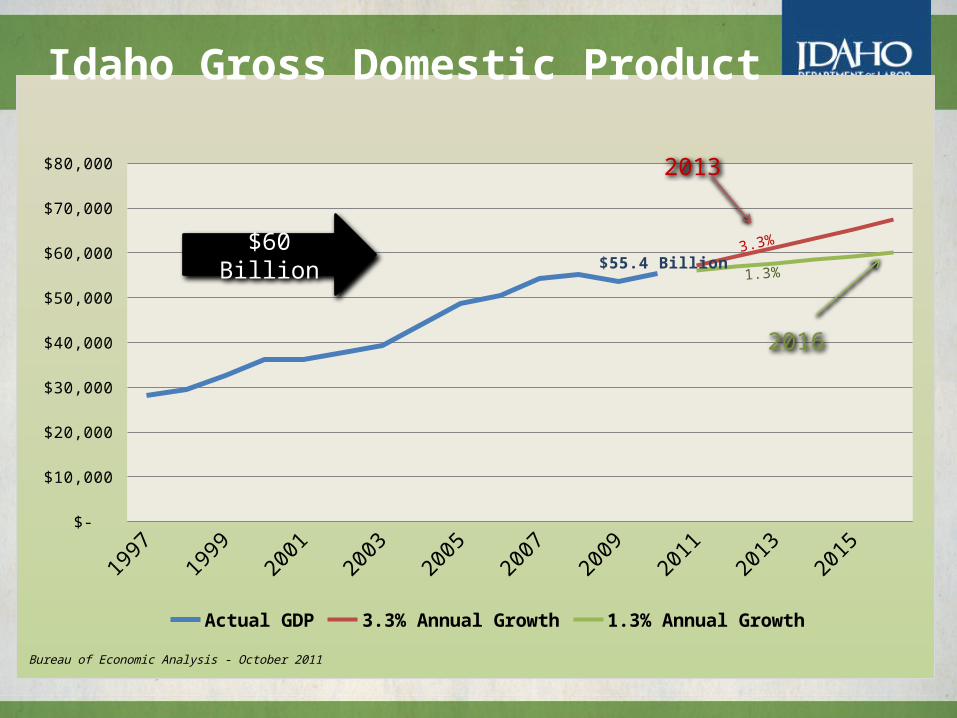
Actual GDP 3.3% Annual Growth 1.3% Annual Growth
Bureau of Economic Analysis - October 2011
3.3%
1.3%$55.4 Billion
Idaho Gross Domestic Product
2013
2016
$60 Billion

Job Creation With Health Benefits
To reach the 40,000 job creation metric Idaho needs annualized job growth rates of around 1.5 percent. And to reach the health insurance metric around 1.2 percent annualized growth rates over four years.
Measure - “Create 40,000 jobs with at least two-thirds with $12.00 or better wage rates with health benefits by 2015.”
Idaho’s Fringe Benefits Survey found that around 78 percent of employees that were making at least $12.00 per hour were offered medical insurance in 2011.

Idaho Seasonally Adjusted Unemployment Rate19
7819
7819
7919
8019
8119
8119
8219
8319
8419
8419
8519
8619
8719
8719
8819
8919
9019
9019
9119
9219
9319
9319
9419
9519
9619
9619
9719
9819
9919
9920
0020
0120
0220
0220
0320
0420
0520
0520
0620
0720
0820
0820
0920
1020
11
0
2
4
6
8
10
12
Perc
ent
Source: Idaho Department of Labor and the US Department of Labor - April 2012.
7.9 %8.2 %
March 2012
(9.6%) Previous RecordDec-1982 to Feb-1983
(2.7%) Nov-2006 to Mar-2007

Alternative Unemployment Measures
U-1 U-2 U-3 U-4 U-5 U-6
United States 5.1 5 8.7 9.3 10.2 15.6
Alaska 2.9 4 7.6 8.1 9.1 13.5
Arizona 5.3 4.9 9.1 9.7 10.7 17.1
California 6.9 6.8 11.5 12.2 13.3 20.8
Colorado 4.6 5 8.1 8.4 9.3 14.7
Idaho 4 4.7 8.3 8.7 9.6 16.3
Montana 2.9 4.1 6.9 7.2 8.1 14.9
Nebraska 1.8 2.3 4.5 4.8 5.2 9.1
Nevada 8.3 8 12.7 13.7 15.2 22.3
North Dakota 1.1 1.5 3.5 3.6 4.1 6.3
Oregon 4.9 5.5 9.2 9.6 10.7 17.2
Utah 3 3.8 6.6 6.9 7.6 12.6
Washington 4.9 5.1 9 9.5 10.8 17.6
Wyoming 2.2 2.8 5.8 6 6.8 10
State
Measure (Percent)U-1 U-2 U-3 U-4 U-5 U-6
United States 5.1 5 8.7 9.3 10.2 15.6
Alaska 2.9 4 7.6 8.1 9.1 13.5
Arizona 5.3 4.9 9.1 9.7 10.7 17.1
California 6.9 6.8 11.5 12.2 13.3 20.8
Colorado 4.6 5 8.1 8.4 9.3 14.7
Idaho 4 4.7 8.3 8.7 9.6 16.3
Montana 2.9 4.1 6.9 7.2 8.1 14.9
Nebraska 1.8 2.3 4.5 4.8 5.2 9.1
Nevada 8.3 8 12.7 13.7 15.2 22.3
North Dakota 1.1 1.5 3.5 3.6 4.1 6.3
Oregon 4.9 5.5 9.2 9.6 10.7 17.2
Utah 3 3.8 6.6 6.9 7.6 12.6
Washington 4.9 5.1 9 9.5 10.8 17.6
Wyoming 2.2 2.8 5.8 6 6.8 10
State
Measure (Percent)

Conference Board Data (October 2011)
5/1/2
007
7/1/2
007
9/1/2
007
11/1/2
007
1/1/2
008
3/1/2
008
5/1/2
008
7/1/2
008
9/1/2
008
11/1/2
008
1/1/2
009
3/1/2
009
5/1/2
009
7/1/2
009
9/1/2
009
11/1/2
009
1/1/2
010
3/1/2
010
5/1/2
010
7/1/2
010
9/1/2
010
11/1/2
010
1/1/2
011
3/1/2
011
5/1/2
011
7/1/2
011
9/1/2
01110,000
12,000
14,000
16,000
18,000
20,000
22,000
24,000
26,000
Help Wanted Online – September 2011
October Mtg.

Conference Board Data (March 2012)
10,000
12,000
14,000
16,000
18,000
20,000
22,000
24,000
5/1/
2007
7/1/
2007
9/1/
2007
11/1
/200
7
1/1/
2008
3/1/
2008
5/1/
2008
7/1/
2008
9/1/
2008
11/1
/200
8
1/1/
2009
3/1/
2009
5/1/
2009
7/1/
2009
9/1/
2009
11/1
/200
9
1/1/
2010
3/1/
2010
5/1/
2010
7/1/
2010
9/1/
2010
11/1
/201
0
1/1/
2011
3/1/
2011
5/1/
2011
7/1/
2011
9/1/
2011
11/1
/201
1
1/1/
2012
3/1/
2012
Help Wanted Online - The Conference Board March 2012

Idaho New Hire Counts by Month
5000
10000
15000
20000
25000
30000
35000
1999 2000 2001 2002 2003 2004 2005 2006
2007 2008 2009 2010 2011 2012 Average

National Employment Performance 1st Qtr. 2011
October Mtg.

National Employment Y-o-Y 2nd Qtr. 2011

National Employment Y-o-Y 3rd Qtr. 2011

-9.1%
Construction Employment Y-o-Y 1st Qtr. 2011

-5.6%
Construction Employment Y-o-Y 3rd Qtr. 2011

Location Quotient for Construction 3rd Qtr. 2011

Employment Outlook
JanMar
May JulSep
Nov JanMar
May JulSep
Nov JanMar
May JulSep
Nov JanMar
May Jul-8.00%
-7.00%
-6.00%
-5.00%
-4.00%
-3.00%
-2.00%
-1.00%
0.00%
1.00%
2.00% Idaho NonFarm Job Performance During Recessions
1980-1982 1986 2001-2002 2008-2011Duration
Year
-to-
Year
% C
hang
e
Idaho Department of Labor - October 2011
October Mtg.

-8.00%
-7.00%
-6.00%
-5.00%
-4.00%
-3.00%
-2.00%
-1.00%
0.00%
1.00%
2.00%
Jan
Feb
Mar
Apr
May Jun
Jul
Aug Sep
Oct
Nov
Dec Jan
Feb
Mar
Apr
May Jun
Jul
Aug Sep
Oct
Nov
Dec Jan
Feb
Mar
Apr
May Jun
Jul
Aug Sep
Oct
Nov
Dec Jan
Feb
Mar
Apr
May Jun
Jul
Aug Sep
Oct
Nov
Dec Jan
Feb
Mar
Yea
r-to
-Yea
r %
Cha
nge
Idaho NonFarm Job Performance During the Great Recession
Source: Idaho Department of Labor for the Workforce DevelopmentCouncil Meeting - May 2012
When will Idaho recover to pre-recession levels?

Workforce Information Planning 2012/2013
Formula Grant - $338,014. 2012/2013 Workforce Information Plan is due June
15, 2012. This is your plan and needs to be endorsed by the
Workforce Development Council.
Core Deliverables: Populate the WIDb database Produce industry and occupational employment projections Develop and maintain web delivery of Labor Market Information Publish auxiliary LMI research and consult with the Workforce
Development Council

Education and Training Pay!


