Policy Research Working Paper 5422 Economic Valuation of Development Projects A Case Study of a Non-Motorized Transport Project in India Hua Wang Ke Fang Yuyan Shi e World Bank Development Research Group Environment and Energy Team September 2010 WPS5422 Public Disclosure Authorized Public Disclosure Authorized Public Disclosure Authorized Public Disclosure Authorized Public Disclosure Authorized Public Disclosure Authorized Public Disclosure Authorized Public Disclosure Authorized
Transcript
Policy Research Working Paper 5422
Economic Valuation of Development Projects
A Case Study of a Non-Motorized Transport Project in India
Hua Wang Ke Fang
Yuyan Shi
The World BankDevelopment Research GroupEnvironment and Energy TeamSeptember 2010
WPS5422P
ublic
Dis
clos
ure
Aut
horiz
edP
ublic
Dis
clos
ure
Aut
horiz
edP
ublic
Dis
clos
ure
Aut
horiz
edP
ublic
Dis
clos
ure
Aut
horiz
edP
ublic
Dis
clos
ure
Aut
horiz
edP
ublic
Dis
clos
ure
Aut
horiz
edP
ublic
Dis
clos
ure
Aut
horiz
edP
ublic
Dis
clos
ure
Aut
horiz
ed
Produced by the Research Support Team
Abstract
The Policy Research Working Paper Series disseminates the findings of work in progress to encourage the exchange of ideas about development issues. An objective of the series is to get the findings out quickly, even if the presentations are less than fully polished. The papers carry the names of the authors and should be cited accordingly. The findings, interpretations, and conclusions expressed in this paper are entirely those of the authors. They do not necessarily represent the views of the International Bank for Reconstruction and Development/World Bank and its affiliated organizations, or those of the Executive Directors of the World Bank or the governments they represent.
Policy Research Working Paper 5422
One of the major difficulties in doing cost-benefit analysis of a development project is to estimate the total economic value of project benefits, which are usually multi-dimensional and include goods and services that are not traded in the market. Challenges also arise in aggregating the values of different benefits, which may not be mutually exclusive. This paper uses a contingent valuation approach to estimate the economic value of a non-motorized transport project in Pune, India,
This paper—a product of the Environment and Energy Team, Development Research Group—is part of a larger effort in the department to understand and improve environmental governance in developing countries.. Policy Research Working Papers are also posted on the Web at http://econ.worldbank.org. The author may be contacted at [email protected].
across beneficiaries. The heads of households which are potentially affected by the project are presented with a detailed description of the project, and then are asked to vote on whether such a project should be undertaken given different specifications of costs to the households. The total value of the project is then derived from the survey answers. Econometric analysis indicates that the survey responses provide generally reasonable valuation estimates.
Economic Valuation of Development Projects: A Case Study
of a Non-Motorized Transport Project in India
Hua Wang1
Ke Fang
Yuyan Shi
1 Authors are Sr. Economist, Sr. Transport Specialist and Consultant of the World Bank respectively. Views expressed in this paper are solely of those authors and do not necessarily represent those of the World Bank, its Board of Executive Directors or the countries they represent. Special thanks go to Ms. Shabari Shetty and her team for helping conduct the household survey in Pune, India. Corresponding email address: [email protected].
2
1. Introduction
One of the major difficulties in doing cost-benefit analyses of development projects is to
estimate total values of the project benefits, which are usually multi-dimensional and include
goods and services that are not traded in the market. Take a non-motorized transport (NMT)
project for example. The major benefits may include improving travel convenience and safety,
reducing congestion and saving time, improving environmental quality, and reducing driving
costs. Most of the benefits, however, are nonmarket goods and cannot be easily valued2. Even if
an economic value can be estimated for each of the project benefits, the final aggregation may
still face a number of issues such as double counting. One potentially feasible solution to
estimating the total value of a development project can be the contingent valuation (CV) method,
with which a survey can be designed and implemented to collect preference information of the
potential project beneficiaries and a total value of the project in monetary terms can be inferred.
As the utility level of a respondent should be affected by the various aspects of the multi-
dimensional benefits associated with a development project, a CV survey can be so designed that
a respondent is required to consider a total value of the benefits of the project for his/her family.
After 50 years of research in the area of non-market valuation, the CV method has been
developed from its initial controversial stage to a legitimate and most popular valuation approach,
given that a number of survey design and execution requirements are satisfied. The CV method
has been successfully developed and applied in the area of environmental economics, but has not
been well tested in estimating the total value of a transport project. As a big part of the benefits of
a transport project, such as time savings, improvements in environmental quality and public
health, increased land value, etc., are not generally traded in the market, no such information on
market demand or competitive market prices is readily available, especially in developing
2 Transport economists have developed sophisticated valuation models for time savings, but for other benefits there has been no much research.
3
countries. Therefore, development and use of the CV method can be very important for cost-
benefit analyses of transport projects in developing countries.
This paper reports a contingent valuation study of an NMT project in Pune, India.
Recently, it has been proposed to have the World Bank finance an NMT project under India’s
Sustainable Urban Transport Program (SUTP) which aims to improve road conditions for
pedestrians and cyclists. A CV survey is developed and applied to potential beneficiaries of the
Pune NMT project3, and an internal validity test on the WTP estimation is conducted. This study
has also tested the heteroskedasticity assumption in WTP modeling which has been mostly
neglected in the literature.
The paper is organized as follows: in the following section, we briefly review existing
literature on CV from various threads, especially the application of CV method in transportation
sector and the evolution of heteroskedasticity treatment in recent years. In section 3, we introduce
the policy context, goal and proposed activities of Pune NMT project and the potential benefits
this project may generate. Section 4 summarizes the survey design and implementation, the WTP
elicitation strategy, and the descriptive statistics of major questions in the questionnaire. In
section 5, we present our analytical framework that accommodates heteroskedasticity assumption
in payment card (PC) elicitation strategy. The estimation results are also shown in this section.
Section 6 discusses and concludes the paper.
2. Literature Review
The CV method is principally developed and established in the area of environmental
economics; however, application of the CV approach in the transport sector has become more
widespread over the past decade. Feitelson (1996) examined the effects of aircraft noise following
an airport expansion by using the open-ended (OE) CV approach. Verhoef (1997) asked
3 The survey was applied to the original version of the project proposal, dated as of December, 2008. The final version of the project design has been changed significantly after the survey was conducted.
4
respondents the minimum time gains they required for a certain road process, the answers to
which implied a maximum WTP for time gains. Painter (2002) employed the OE CV elicitation
strategy to measure the economic value of regional rural transit that had both user and nonuser
values. Also with an OE value elicitation strategy, Walton (2004) found motorists were willing to
pay for improved fuel efficiency and reduced interior vehicle noise from road surface pavement,
but reduction in vehicle stopping distance resulting from the same project was not valued by
motorists. There has been little consideration given to valuing the total benefit of a transport
project as the one presented in this paper. In the meantime, despite the increasing volume of
transportation literature in contingent valuation, WTP has been obtained from fairly simple
elicitation strategies such as open ended (OE) or dichotomous choice (DC) questions, and
homogeneous variance is the common assumption for such estimates. A few papers have
attempted to either accommodate heteroskedasticity in error terms, or employed more advanced
elicitation techniques that acknowledged individual uncertainty. Carlsson (2000) found that the
estimated marginal effects of WTP for improved air quality are quite robust to homoskedasticity
assumption based on OE elicitation questions. Using split-sample design, Afroz (2005)
investigated the convergent validity of different CV strategies including OE, DC and payment
card (PC). The results suggested that WTP values for air quality improvement did not differ
significantly across strategies.
In the CV literature, some studies relying on conventional elicitation strategies, such as
OE questions and one bid DC questions, have acknowledged and tested the heteroskedasticity
assumption in error terms. For example, Lanford (1994) detected the presence of over dispersion
of un-observables which may lead to biased parameter estimates or overestimated significance
levels in DC models. Cameron (2002) found that dispersion of error terms vary systematically
with elicitation models across elicitation techniques including OE, DC, PC, and multiple bounded
discrete choice strategies (MBDC), based on results from split-sample design. Violation of
homoskedasticity assumption does not result in biased or inconsistent coefficient estimates in OE
5
ordinary linear square models, but it may cause the variance of the coefficients underestimated.
Thus weighted least square regression is often used to correct heteroskedasticity in such models
in order to judge the true relationship of significance. One bid DC models that fail to represent
empirical heterogeneity in variance, however, may yield substantial bias or inconsistency in
coefficient estimates as well as WTP estimates (Halvorsen, 1998). Horowitz (1993) argued that if
the specified distribution function is qualitatively different from true data generation process, i.e.,
error dispersion is not drawn from the same distribution, the bias in coefficient estimates based on
maximum likelihood estimation could be substantial. Their finding is consistent with another
study by Gourieroux (1984) that estimation of discrete choice models are suggested quite
sensitive to distribution error term assumptions.
The concept that an individual’s valuation for goods or services is best viewed as a
random variable associated with a distribution or a range of possible values rather than a single
point value has been gradually accepted in the community of CV research (Welsh and Bishop
1993, 1998; Wang, 1997; Wang and Whittington, 2005). The concern of respondents’ WTP
uncertainty has led to the more advanced elicitation techniques that allow respondents explicitly
state their choice uncertainty or increase number of bids offered to respondents so as to enhance
the information about WTP qualitatively or quantitatively (Wang and Whittington, 2005). The
representative examples of such development are doubled bounded DC, PC and MBDC strategies.
Unlike one bid, yes/no type of DC questions, doubled bounded and PC strategies cover a wider
range of biding prices presented to respondents in order to narrow down the underlying WTP
interval for the given good or services. In recently developed MBDC questions, respondents are
shown a number of different possible prices, and instead of asking them to simply accept or reject
each of these prices, the respondents are asked to select one of several pre-established
possibilities, such as Definitely Not, Probably Not, Not Sure, Probably Yes, Definitely Yes, that
the respondent would accept the price. This approach has been suggested to yield more
meaningful results and better match the hypothetical nature of the survey.
6
Although recent improvement of CV questionnaires has to some extent accommodated
the uncertain nature of respondents’ WTP distribution, most of such studies assume the variance
of WTP distribution is homoskedastistic with only a few exceptions (Alberini et al, 1997; Wang
and Whtington, 2005). For example, Welsh and Poe (1998) adapted the “return potential” format
and employed MBDC strategy that asked respondents to express both the choice and voting
certainty for the referendum at each bid value. They found MBDC questions significantly reduced
confidence intervals around the estimated WTP mean. However, as pointed out by Wang and
Whittington (2005), the underlying assumption in Welsh and Poe model is that all respondents
share same distribution, and heterogeneity in WTP variance was not considered. Alberini et al
(2003) built upon the random valuation threshold model of Wang (1997) to model WTP
thresholds be functions of respondent characteristics. While the uncertainty in thresholds was
acknowledged, the variance estimated in their model was still based on homoskedasticity
assumptions. Alberini et al (1997) also noticed the heteroskedasticity possibility in doubled
bounded DC strategies and modeled the WTP distance to price bids to capture the heterogeneity
in variance. Although the results were mixed depending on model specifications, the assumption
of heteroskedasticity was not rejected.
This study considers the role of heteroskedastic variance in WTP estimation based on the
payment card approach, in which respondents are asked to present their WTPs as intervals.
3. NMT Project in Pune
Pune, located near the west coast of India, is the eighth largest metropolitan city in the
country. According to 2001 Census, Pune has about 244 square kilometers in municipal area and
population density - 10,403 per square kilometers (World Bank, 2008). The area in the center of
the city is densely populated. The main driver of the economy of Pune is auto industry and its
educational, research and development institutions.
7
Pune is historically known for its use of bicycles. While the usage of bicycle has been
gradually coming down over recent years with increasing urban sprawl and rising income levels,
it still consists of a major component of Pune transportation due to the significant slum
population and student population. Walking and cycling currently constitute approximately 33-
35% of the total trips in Pune (World Bank, 2008).
The current transport infrastructure in Pune, however, does not adequately meet the needs
of NMT mode. It is characterized by traffic congestion with rapid increase in private cars and
economic status; (3) Household current use of transportation system; (4) Perceptions about the
proposed project; (5) Project impacts; and (6) Personal uncertainties.
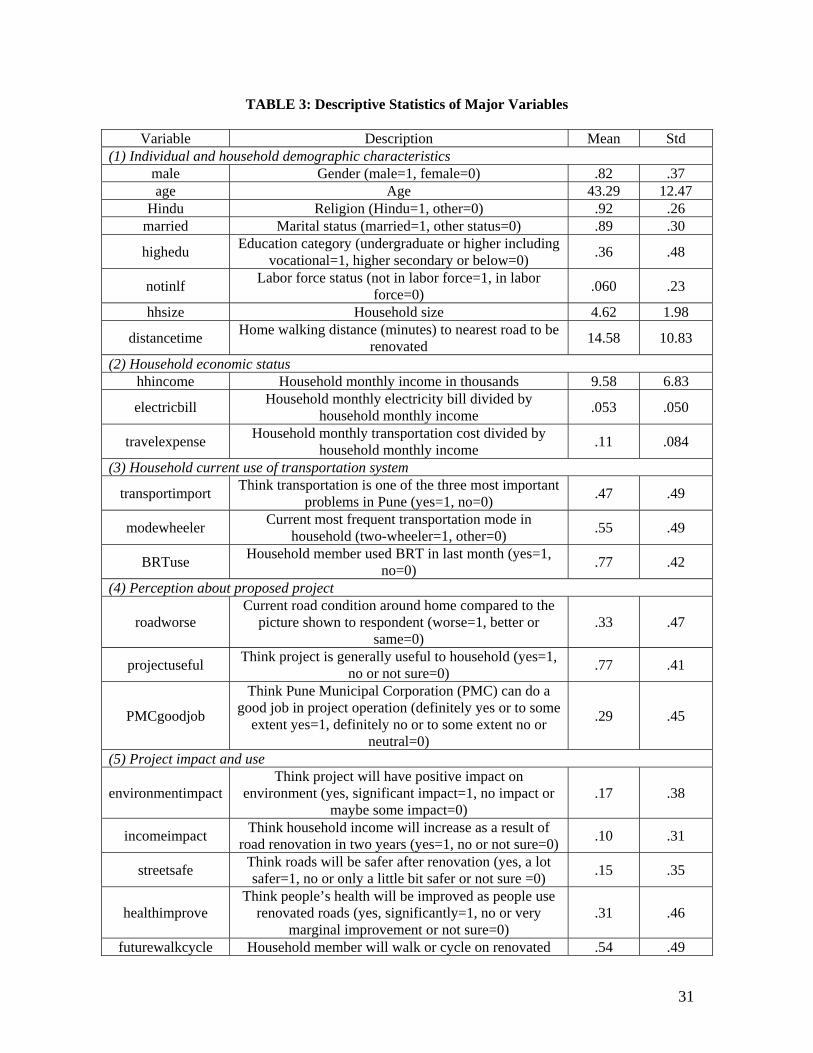
Statistics showed that 82.74% respondents were male. Average age of the respondents
was 43 years old. 92% of respondents reported Hindu as their religion, and 89% were married.
Approximately one third of respondents had undergraduate diploma or higher, very few of them
currently inactive in labor force (6%). Average household size was 4 persons. On average it takes
14.6 minutes of walking from home to the nearest roads to be renovated.
The average monthly income of the households that participated in our survey was
approximately 9.58 thousand Rupees5 (equivalent to 192 USD). Electricity bill accounted for
about 5% of total household income, and 11% of income was spent on transportation associated
activities.
On matters pertaining to transportation, 47% people viewed transportation as one of the
top three most important problems that Pune needs to urgently address, while the top transport
related issues were road congestion, maintenance and safety. According to the respondents, the
5 One India Rupee equals to roughly 0.02 US Dollar.
13
most favorable option for reducing traffic congestion and transport related air pollution was
improving public transportation and stricter enforcement of vehicle emission limits. 99% of the
respondents said that improving current transport of the city was important or very important.
73% of the respondents had family members who used public transport last month and most of
them said it was not easy to access to the public transport system. Over a half of the households
reported two-wheeler as the most frequent transportation mode, and 70% families used two-
wheeler in last two months. Almost all of the respondents were aware of BRTS in PUNE and
77% of them had family members who used the BRTS last month in various ways, but most of
them (73%) were not satisfied with their experience in using BRTS. 62% of the respondents
thought the BRTS were very useful or somewhat useful, and 76% agreed that it’s good idea for
Pune to construct more BRTS type of roads.
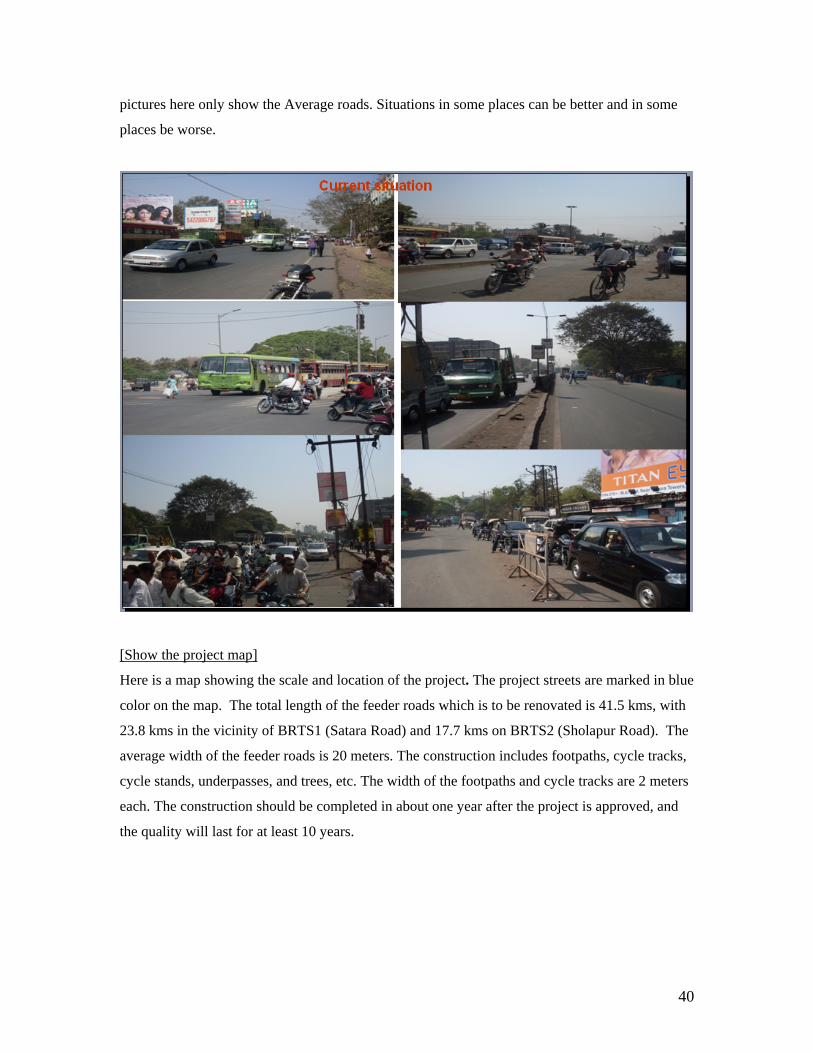
33% respondents said the roads around their home were worse than the average road in
Pune shown in the picture (Appendix 2). For 41% of the respondents, they witnessed some
accidents in the NMT project affected streets in the past 3 months. 77% of the respondents
thought the project is useful to their families and 90% said the project would be very important or
somewhat important to their families. Only 30% of the respondents asserted that PMC could do a
good job in managing the implementation of the project. Population confidence in money
collection feasibility was not very high as well: only 11% stated that PMC would not have any
problem at all to collect money and another 39% believed there will be some problem but it was
still possible.
Various impacts of the NMT project were explored during survey. 17% respondents said
the project would have significant positive impacts on city environment, 15% said the streets
would be a lot safer after renovation, and a third of them thought people’s health would be
significantly improved as people walk or cycle on the renovated roads more. The direct income
effect of the NMT project is deemed marginal: only 10% stated their household income would be
14
increased as a result of road construction. Majority of households stated that they would use
renovated streets in various ways including walking, cycling, driving or taking bus.
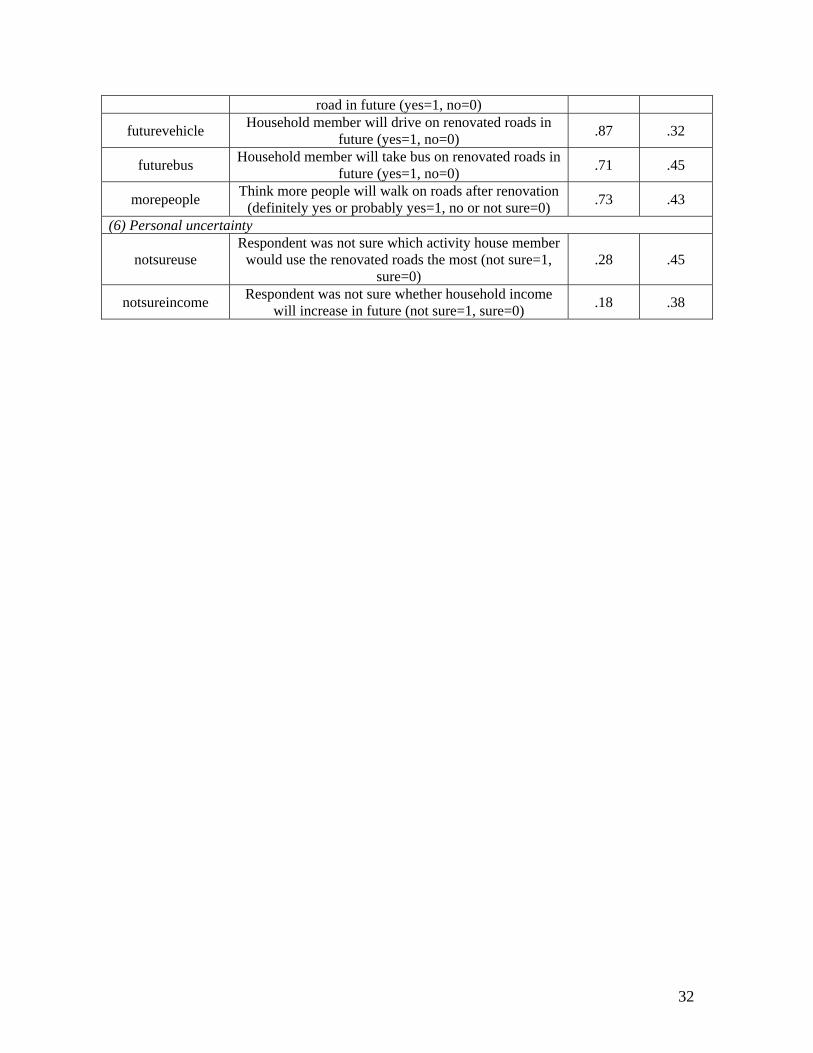
All the above 5 broad categories of major explanatory variables would be included in the
maximum likelihood function for WTP mean estimation. To estimate WTP standard
deviation , we would also include a unique set of variables revealing personal perception on
future uncertainty. We hypothesized that individual WTP dispersion increases when a person has
relatively higher uncertainty in the specified commodity or in the future expectation associated
with purchase capabilities. Two indicators were therefore generated to represent personal degree
of future uncertainty: whether or not respondent knew how to use roads after construction, and
whether or not respondent had faith in their household future income increase. Concerning the
degree of certainty that respondents had with respect to future use of roads after construction,
statistics shows that 28% respondents were not sure about which activity the household would use
most. A smaller proportion (18%) of respondents was uncertain regarding the expectation of
future household income growth.
5. Analytical Framework and Estimation Results
As stated above, each of the respondents has a lower value on the payment card where a
“yes” answer is recorded and an upper value where a “no” answer is recorded. Modeling this
double bounded payment response can be built upon the double bounded dichotomous choice
model introduced by Hanemann (1991) and conventional payment card approach developed by
Mitchell and Carson (1981). Combining the advantages of both strategies, the double bounded
payment card can be more efficient because it not only asks individual preference at a lengthy list
of price bids, as the payment card approach does, but also progressively narrows WTP down to a
narrower and more accurate bid interval, as the double bounded discrete choice model does.
15
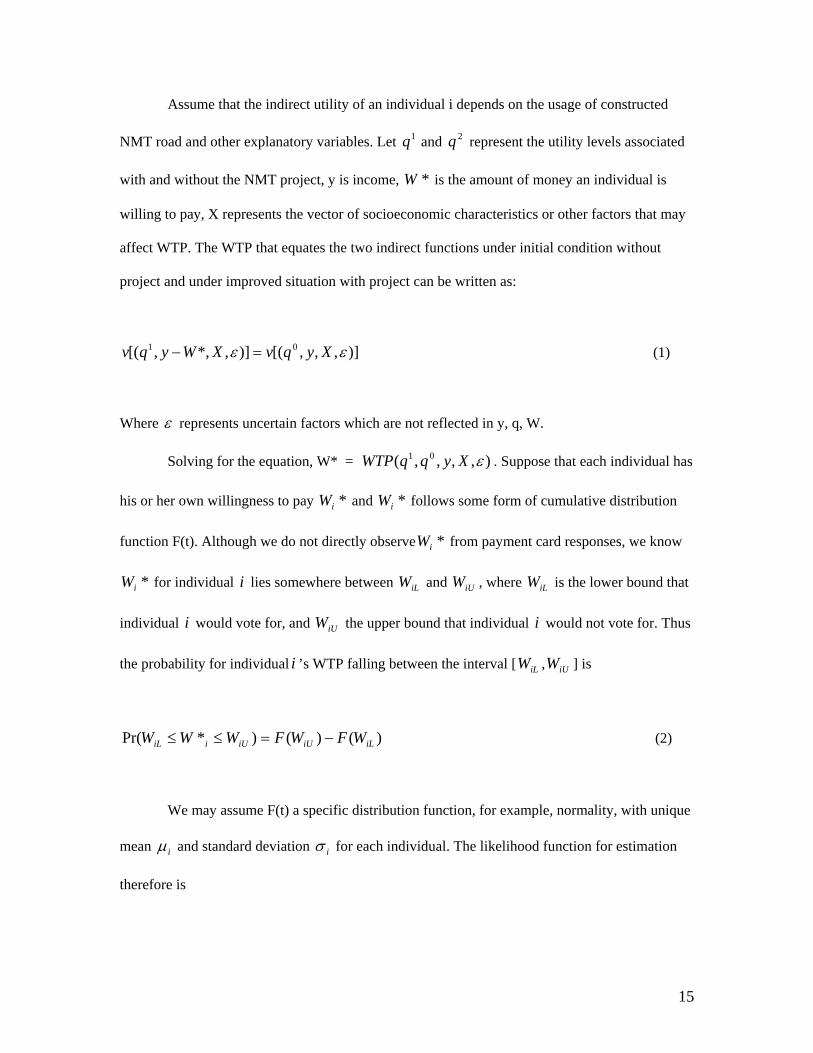
Assume that the indirect utility of an individual i depends on the usage of constructed
NMT road and other explanatory variables. Let 1q and 2q represent the utility levels associated
with and without the NMT project, y is income, *W is the amount of money an individual is
willing to pay, X represents the vector of socioeconomic characteristics or other factors that may
affect WTP. The WTP that equates the two indirect functions under initial condition without
project and under improved situation with project can be written as:
)],,,[()],*,,[( 01 XyqvXWyqv (1)
Where represents uncertain factors which are not reflected in y, q, W.
Solving for the equation, W* = ),,,,( 01 XyqqWTP . Suppose that each individual has
his or her own willingness to pay *iW and *iW follows some form of cumulative distribution
function F(t). Although we do not directly observe *iW from payment card responses, we know
*iW for individual i lies somewhere between iLW and iUW , where iLW is the lower bound that
individual i would vote for, and iUW the upper bound that individual i would not vote for. Thus
the probability for individual i ’s WTP falling between the interval [ iLW , iUW ] is
)()()*Pr( iLiUiUiiL WFWFWWW (2)
We may assume F(t) a specific distribution function, for example, normality, with unique
mean i and standard deviation i for each individual. The likelihood function for estimation
therefore is
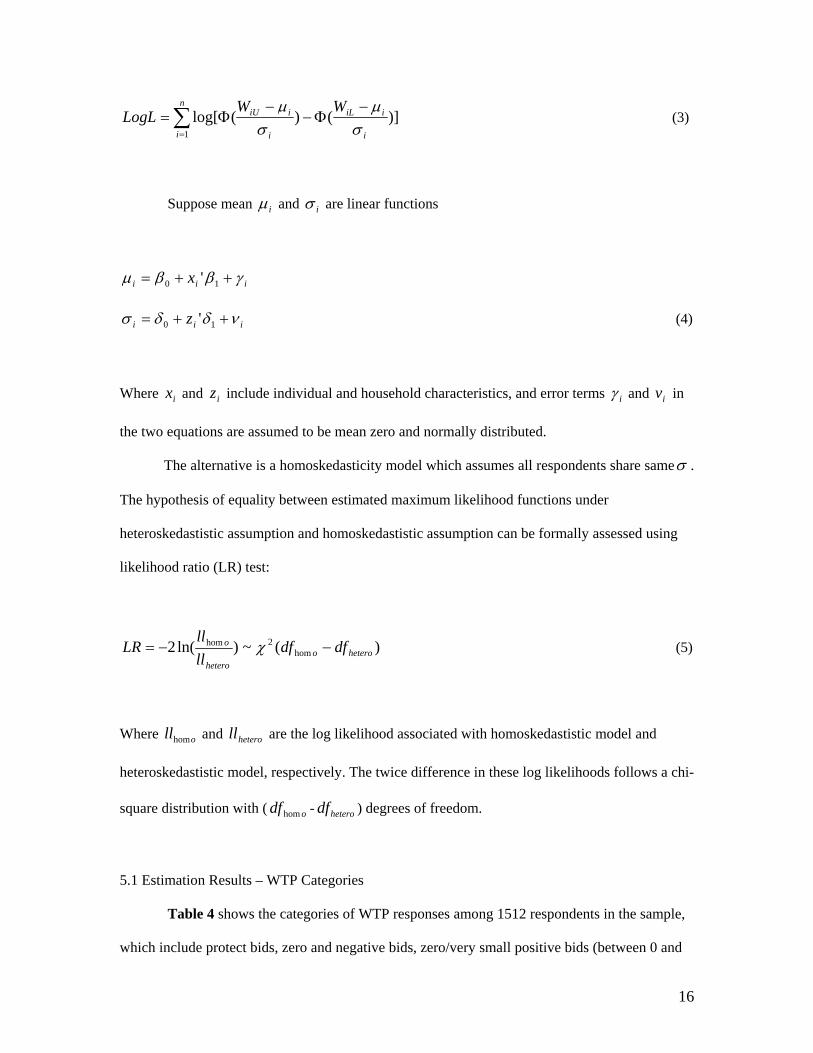
16
n
i i
iiL
i
iiU WWLogL
1
)]()(log[
(3)
Suppose mean i and i are linear functions
iii x 10 '
iii z 10 ' (4)
Where ix and iz include individual and household characteristics, and error terms i and iv in
the two equations are assumed to be mean zero and normally distributed.
The alternative is a homoskedasticity model which assumes all respondents share same .
The hypothesis of equality between estimated maximum likelihood functions under
heteroskedastistic assumption and homoskedastistic assumption can be formally assessed using
likelihood ratio (LR) test:
)(~)ln(2 hom2hom
heteroohetero
o dfdfll
llLR (5)
Where ollhom and heteroll are the log likelihood associated with homoskedastistic model and
heteroskedastistic model, respectively. The twice difference in these log likelihoods follows a chi-
square distribution with ( odf hom - heterodf ) degrees of freedom.
5.1 Estimation Results – WTP Categories
Table 4 shows the categories of WTP responses among 1512 respondents in the sample,
which include protect bids, zero and negative bids, zero/very small positive bids (between 0 and
17
10 rupees, the lowest price in the payment card), and significant positive bids. In order to
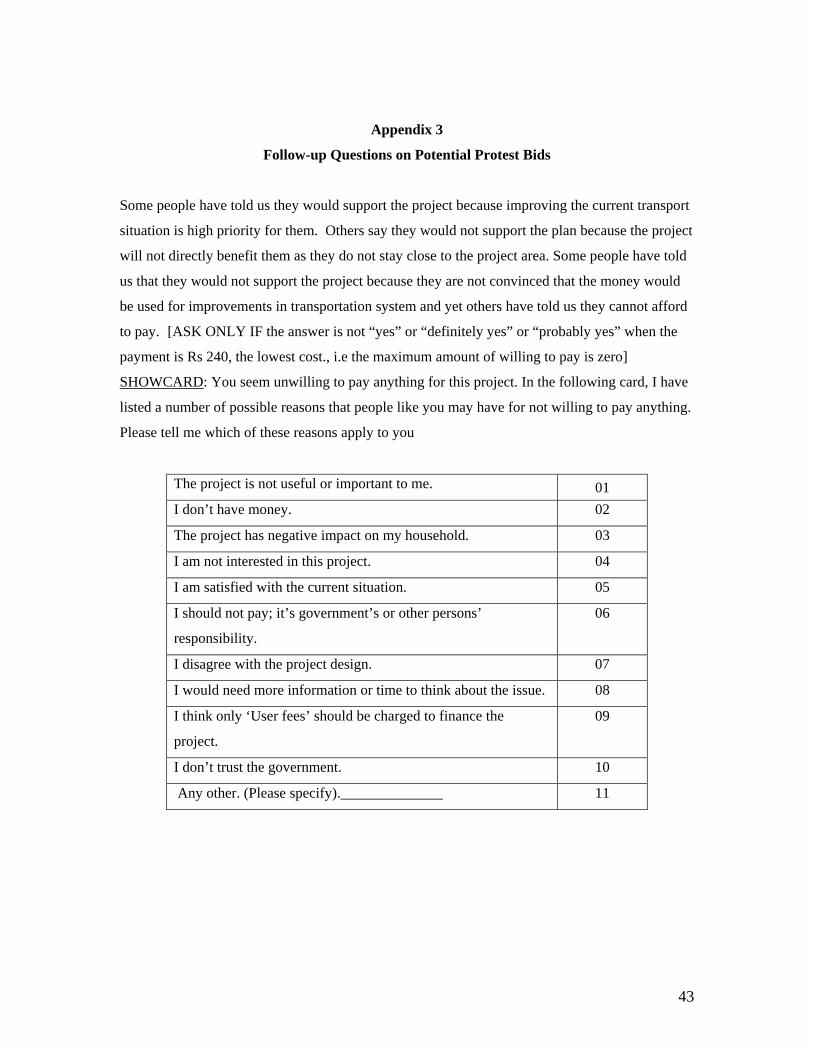
distinguish protest bids from valid positive WTP responses and investigate their motivations, we
asked a follow-up question for those respondents why they said “no” to the price of zero
(Appendix 3). Among the 10 statements provided, 5 were classified as valid answers for
zero/negative WTPs, and the other 5 were classified as protesting to the WTP scenario. Based on
the answers to the follow-up questions, 41 responses were identified as protest bids, 59 as
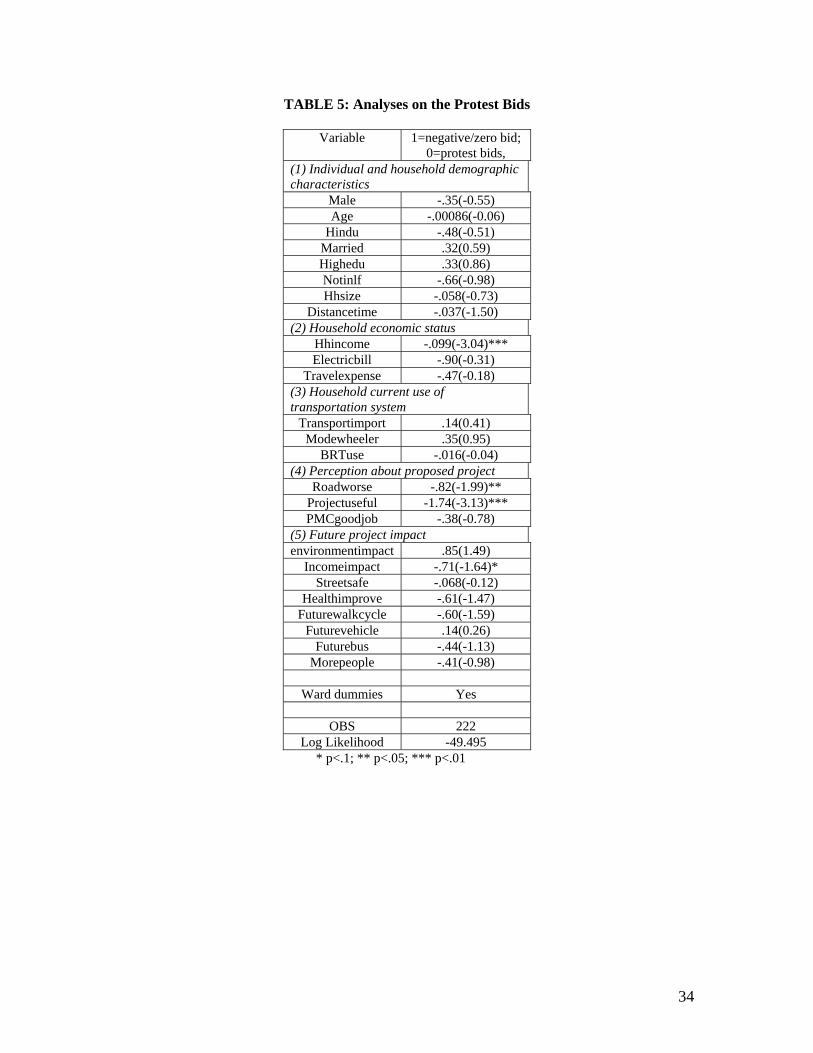
negative bids and 124 as true zeros. To better understand the protest bids, we did binary Probit
analyses on those who said “no” to the price of zero, and the results are reported in Table 5. In
general, the results are consistent with expectation. If a respondent was with high income or bad
current condition of roads close to the household or thought that the project was useful or that the
project might generate positive impact on their income but still gave a negative response to the
price of zero, the answer is more likely a protest bid.
A total of 1,286 respondents were willing to contribute some positive values to the
proposed project. Despite the high participation rate in the proposed NMT project (85%), it did
not translate into high WTP. Among the 1,286 respondents, 841 were only willing to pay very
limited amount ranging between 0 and 10 Rupees per month; another 445 reported at least 10
Rupees per month as their WTP lower bound. Two observations do not have complete
information on WTP, and they need to be removed from further analysis.
INSERT TABLE 4
INSERT TABLE 5
5.2 Estimation Results – WTP distribution estimation
The distribution of aggregate WTP curve based on the response of lower bound price bid
in PC is illustrated in Figure 1. For each price listed as the minimum value that a respondent
would vote for, the fraction of such respondents out of total 1286 was provided. Roughly two
thirds (65%) of positive WTP respondents were willing to pay a very limited positive amount of
18
something between 0 and its adjacent price 10. The percentage of respondents who reported
positive lower bound answers dropped dramatically as price went up, indicating the underlying
WTP for majority respondents were relatively small amounts.
INSERT FIGURE 1
Table 6 shows the maximum likelihood estimation results of six different model
specifications. Coefficients, t-values (in parentheses), log likelihood values were listed. Mean
and 95% confidence intervals of average WTP and standard deviation were simulated using
Krinsky and Robb (1986) approach. Statistical significance level is indicated using asterisks.
INSERT TABLE 6
Under heteroskedasticity distribution assumption, we hypothesized that WTP
distributions are likely to be more dispersed as WTP going up because WTP for some
respondents may be high enough to make them indifferent to a range of values around the mean.
Therefore the estimated becomes a natural regressor in equation. In addition, the WTP
elicitation design in our study was such that the intervals between two adjacent listed prices on
PC were not a constant, but rather exponentially increased. Then, there should be a design effect
on the correlation between the WTP mean and the variance. Alberini et al (1997) treated variance
as a function of the distance between WTP and bid price provided to respondents. We also
incorporated the difference between WTP lower bound and upper bound in the estimation as a
replacement of .
We started with benchmark model 1, which included full set of regressors and assumed
variance heterogeneity is captured by determinants of and individual uncertainties. An
effective sample of 1,272 respondents who were willing to pay some positive WTP was analyzed.
Based on the estimation results of this benchmark model, simulated average positive WTP for
NMT project is 20.91 Rupees per month or $10 in two years, and the 95% confidence interval is
19.09-22.75 Rupees per month among population that were willing to finance the project.
19
In model 1, it is assumed that those who are willing to pay zero or a very small amount
behave in the same way as those who are willing to pay a significant positive amount. In order to
better understand the difference, we conducted sub-sample experiments using 437 respondents
who were willing to pay more than 10 Rupees per month, with three alternative models under
same heteroskedasticity assumption. Results were listed in subsequent column 4- column9 in
Table 6. Model 2 was simply the sub-sample analysis of the benchmark model 1. Model 3 only
kept individual demographic characteristics and uncertainty in estimation and neglected the
association between and WTP; while Model 4 defined standard deviation as a function of
WTP interval, personal uncertainty plus basic individual demographic characteristics. Among the
three alternative heteroskedasticity models, Model 3 yielded highest mean WTP of 59.64 Rupee
per month or $28.6 in two years (%95 CI: 52.34-66.37 Rupees per month), followed by Model 2
for 58.43 Rupees per month (%95 CI: 52.61-63.69) and Model 4 for 55.10 Rupees per month
(%95 CI: 50.43-61.60); while mean of standard deviation was 45.03, 44.70 and 45.03 Rupees per
month for Model 2, 3 and 4 respectively.
Because Benchmark Model 1 utilized full sample information, in some cases we
observed quite different results in variable significance levels or even coefficient signs relative to
three alternative models, but in general the determinants of mean value and standard deviation
were quite consistent in four alternative heteroskedasticity models, and WTP varied generally
in logical ways with most explanatory variables and had substantial face validity. Among
individual demographic explanatory characteristics, religion, education levels and labor force
status were found significantly associated with WTP levels. The coefficient of home distance to
nearest renovated road, however, switched its sign from significantly positive in full sample
analysis to significantly negative in sub-sample analysis. This indicated that the unexpected
positive relationship between distance and WTP was primarily driven by WTP responses from
people who were willing to pay merely a very small amount. In general households living nearby
20
should be willing to spend larger amount on the project because they were supposed to benefit
more. As for household economic status, we may expect richer households would spend more if
road construction is a normal good. This was confirmed by positive and significant estimates of
household income, travel expense, and electricity bill6. Households whose current transportation
mode was two-wheeler were willing to pay 30%-40% more than other transportation mode users.
The current condition of the roads around home in general did not affect the level of WTP. The
sign of people’s perception on project usefulness indicated an insignificant and negative
relationship with WTP in benchmark Model 1, but the sign changed to its opposite in three sub-
sample models and the significance level substantially increased in Model 4. As for the capability
of project operation, the positive sign suggested that people did seriously consider this issue and
such confidence led them to pay 6-10 Rupees more per month relative to incredulous respondents.
Among the variables of project future impact, the effects of direct income increase,
environmental benefit and street safety were mixed depending on the sample analyzed, while
personal health improvement and future street use were consistently associated with respondents’
valuation of the project across four heteroskedasticity models7.
Regarding distribution standard deviation estimation equation, most significant
variables that appeared in estimates were shown significantly correlated with in benchmark
Model 1. This supported our prior hypothesis that estimated WTP captured a large portion of the
distribution heterogeneity. The difference between WTP lower bound and upper bound was also
illustrated a significant and positive relationship with WTP standard deviation, confirming our
second hypothesis that WTP variation was partly picked up by the pre-set payment card intervals.
The increased log likelihood suggested that incorporation of WTP in estimate in Model 2 and
Model 4 had led to a substantial improvement of model fit relative to Model 3 that included only 6 The effects of electricity bill may also capture some start point effects, as respondents started working on the payment cards at values close to one third of their electricity bills. 7 We also tested on the effects of questionnaire version dummies in all four models and found that the dummy variables were not significant. The results are not shown in the tables but are available upon request.
21
individual and household demographic characteristics and individual uncertainties to capture
WTP variance heterogeneities. The uncertainty of future street use mode further enlarged the
WTP dispersion around the mean, as we expected, and the uncertainty of future household
income also significantly and positively contributed to WTP variance in sub-sample models.
Comparing the benchmark model, model 1, with the three alternative heteroskedasticity
models, we find that the alternative models, which are run for those who are willing to pay a
significant amount for the project, perform much better. Two important variables – distance from
home to project site and usefulness of the project, show correct sign in the alternative models.
This may indicate that those who are willing to pay zero or very little have different behaviors
from those who are willing to pay a significant amount. Among the three alternative models,
model 4 gives the best results, which show that for those who have higher income or higher
education, are not in job force (staying at home), using two-wheelers, viewing the project as
useful, having positive health impact, believing that PMC can do a good job, or having family
members walking or cycling in the renovated streets, WTP is higher, while for those who are
Hindu, far away from the renovated streets, or taking bus in the renovated, or thought that
transportation improvement in Pune was very important, the WTP is less. It seems
counterintuitive for those who think transportation improvement in Pune to be very important to
be willing to pay less. One reason could be that those people are not satisfied with the current
project design or scale and would like to have a bigger improvement. Significant variables in the
variance equation include gender (men have lower variance), Hindu (higher variance with those
Hindu), education (positive correlation), uncertainty with future use of the renovated streets, and
WTP interval (the design effect and natural correlation between WTP mean and variance).
The last four columns of Table 6 present the WTP mean estimate under
homoskedasticity assumptions. In model 5, it includes the full sample of those who are at least
positive at the price of zero, and in model 6 those who are negative at the lowest price (10 rupees)
are removed. Despite the significant level and even the coefficient signs varied in a few cases,
22
two homoskedasticity models yielded generally similar estimation results relative to their
heteroskedasticity model counterparts. Hausman test suggested that the difference in coefficients
between homoskedasticity model and heteroskedasticity model was systematic, and likelihood
ratio test also supported our hypothesis that the models controlling for variance heteroskedasticity
substantially improved data fit. Simulation generated slightly but significantly higher average
WTPs than the heteroskedasticity models. Homoskedasticity Model 5 based on full sample
yielded an average WTP of 23.64 Rupees/month (%95 CI: 21.38-25.78), and an average WTP of
60.41 (%95 CI: 55.31-65.43) is obtained for those who reported WTPs significantly different
from zero in homoskedasticity Model 6.
6. Conclusion and Discussion
This paper presents a contingent valuation study of non-motorized transport (NMT)
project in Pune, India, which has multi-dimensional benefits, including public health, safety,
environment, congestion and convenience, etc. The respondents are presented with a detailed
description of the project: the current status and use of the roads, the project activities and
objectives, the potential project impacts, etc., and then are asked to vote on whether or not to have
such a project under a list of costs to the households. The respondents are reminded that if the
project passes the referendum with a total payment higher than the project cost, the project will be
implemented and the payments will be enforced by the government via the electricity bill, but if
the total payment is less than the project cost, the project would not be implemented. As this
study is based upon a real development project under consideration, the respondents are found to
take the survey seriously. The econometric analyses show that the survey responses are generally
reasonable and are consistent with economic theories.
In the design and implementation of the study, the respondents are assumed to have
valuation ranges or distributions, rather than single true values, in their minds. The results show
that household income, distance from the renovated roads, current use of the transport service,
23
future use of the project streets, perceived project impacts, views on the usefulness of the project,
the importance of transportation improvements and the effectiveness of PMC in implementing the
project, as well as respondents’ education, job status, religion background, can all significantly
affect the WTP, as expected. Respondents’ uncertainties in the future use of the project roads are
found positively significantly correlated with WTP variance, also as expected. It is also found that
considering heteroskedasticity in the modeling process will produce different estimates of the
model coefficients and the final WTP, which suggest that heteroskedasticity should be considered
in such studies.
The final results of this study show that the total willingness to pay for the project in
Pune is not high. Most respondents living in or close to the project area are willing to finance the
proposed NMT project, but only 35% of total respondents are willing to pay some positive
amounts significantly higher than zero, or more than 10 Rupees per month. On average, a
household is willing to pay a biennial amount $8.73 after considering those who do not want to
contribute anything to the project. This will generate an aggregate WTP of roughly 10 million US
dollars, which is about two thirds of the estimated project cost8. Including those who are only
willing to pay a very small amount for the project into the modeling process is found to make the
conventional linear WTP modeling technique not fit well, and excluding those responses with
very small WTPs can provide a better fit.
The conventional way of estimating the total value of a development project with multi-
dimensional benefits is to first estimate the value of each benefit component and then add the
values of all benefit components together. Challenges exist with the conventional approach not
only in estimating the values of different benefit components, each of which can be a very serious
valuation study, but also in aggregating the values of different benefits, which are sometimes not
mutually exclusive. The contingent valuation approach, as presented in this study, may provide an
8 World Bank estimated the project cost to be about $16.8 million. As mentioned earlier, after the survey, the final project design has been significantly changed.
24
alternative solution. It is generally believed that individuals understand their own preferences
better than researchers, especially after a series of communications conducted on all relevant
issues involved in the valuation process. However, it is always a challenge to help respondents to
form and reveal their values accurately. It is also hard to conduct an external validity test on a CV
study, which may well pass an internal validity test, such as the one presented in this paper.
25
References
(1) Alberini. A, Kanninen B., Carson. T. R. (1997). Modeling response incentive effects in
dichotomous choice contingent valuation data. Land economics 73(1997), 309-324
(2) Alberini, A., K. Boyle and M. P.Welsh (2003), “Analysis of contingent valuation data with
multiple bids and responses options allowing respondents to express uncertainty”. Journal of
Environmental Economics and Management 45(2003), 40-62.
(3) Afroz Rafia, Hassan Nasir Mohd, Awang Muhamad, Ibrahim Akma Noor (2005).
“Willingness to pay for air quality improvements in Klang Valley Malaysia”. American Journal
of Environmental Sciences 1 (2005) 194-201
(4) Cameron T.A., Poe L. G, Ethier G. R, Schulze D. W (2002). Alternative non-market value-
elicitation methods: are the underlying preferences the same? Journal of Environmental
Economics and Management 44(2002), 391-425
(5) Carlsson Fredrik, Johansson-Stenman Olof (2000). “Willingness to pay for improved air
quality in Sweden”. Applied Economics 32 (2000), 661-669
(6) Duan, N., Manning,W.G., Morris, C.N., Newhouse, J.P., (1983). A comparison of alternative
models for the demand for medical care. Journal of Business and Economic Statistics 1 (2) (1983),
115–126.
(7) Duan, N., Manning, W.G., Morris, C.N., et al., (1984). Choosing between the sample-
selection model and the multipart model. Journal of Business and Economic Statistics 2 (1984),
283–289.
(8) Gourieroux, C., Monfort, A., Trognon, A. (1984), “Pseudo maximum likelihood methods:
theory,” Econometrica 52 (1984), 681-700
(9) Halvorsen B, Soelensminde K. Differences between willingness-to-pay estimates from open-
ended and discrete-choice contingent valuation methods: the effects of heteroskedasticity. Land
TABLE 3: Descriptive Statistics of Major Variables
Variable Description Mean Std (1) Individual and household demographic characteristics
male Gender (male=1, female=0) .82 .37 age Age 43.29 12.47
Hindu Religion (Hindu=1, other=0) .92 .26 married Marital status (married=1, other status=0) .89 .30
highedu Education category (undergraduate or higher including
vocational=1, higher secondary or below=0) .36 .48
notinlf Labor force status (not in labor force=1, in labor
force=0) .060 .23
hhsize Household size 4.62 1.98
distancetime Home walking distance (minutes) to nearest road to be
renovated 14.58 10.83
(2) Household economic status hhincome Household monthly income in thousands 9.58 6.83
electricbill Household monthly electricity bill divided by
household monthly income .053 .050
travelexpense Household monthly transportation cost divided by
household monthly income .11 .084
(3) Household current use of transportation system
transportimport Think transportation is one of the three most important
problems in Pune (yes=1, no=0) .47 .49
modewheeler Current most frequent transportation mode in
household (two-wheeler=1, other=0) .55 .49
BRTuse Household member used BRT in last month (yes=1,
no=0) .77 .42
(4) Perception about proposed project
roadworse Current road condition around home compared to the
picture shown to respondent (worse=1, better or same=0)
.33 .47
projectuseful Think project is generally useful to household (yes=1,
no or not sure=0) .77 .41
PMCgoodjob
Think Pune Municipal Corporation (PMC) can do a good job in project operation (definitely yes or to some
extent yes=1, definitely no or to some extent no or neutral=0)
.29 .45
(5) Project impact and use
environmentimpact Think project will have positive impact on
environment (yes, significant impact=1, no impact or maybe some impact=0)
.17 .38
incomeimpact Think household income will increase as a result of
road renovation in two years (yes=1, no or not sure=0) .10 .31
streetsafe Think roads will be safer after renovation (yes, a lot safer=1, no or only a little bit safer or not sure =0)
.15 .35
healthimprove Think people’s health will be improved as people use
renovated roads (yes, significantly=1, no or very marginal improvement or not sure=0)
.31 .46
futurewalkcycle Household member will walk or cycle on renovated .54 .49
32
road in future (yes=1, no=0)
futurevehicle Household member will drive on renovated roads in
future (yes=1, no=0) .87 .32
futurebus Household member will take bus on renovated roads in
future (yes=1, no=0) .71 .45
morepeople Think more people will walk on roads after renovation
(definitely yes or probably yes=1, no or not sure=0) .73 .43
(6) Personal uncertainty
notsureuse Respondent was not sure which activity house member
would use the renovated roads the most (not sure=1, sure=0)
.28 .45
notsureincome Respondent was not sure whether household income
will increase in future (not sure=1, sure=0) .18 .38
33
TALBE 4: Categories of Response Pattern to the PC Valuation Questions
Category Category of response pattern Percentage1 Protest bids: respondents who gave a negative answer to the price of zero
and chose one of the following as the reason: “I should not pay; it is government’s or other persons’ responsibility”, “I disagree with the project design”, “I would need more information or time to think about the issue”, “I think only ‘user fees’ should be charged to finance the project”, and “I
don’t trust the government”
41 (2.71%)
2 Negative bids: respondents who gave a negative answer to the price of zero and responded “yes” to the reason “the project has negative impact on my
household”
59 (3.90%)
3 Zero bids: respondents who gave a negative answer to the price of zero and chose one of the following as the reason: “the project is not useful or
important to me”, “I do not have money”, , “I am not interested in this project”, and “I am satisfied with the current situation”
124 (8.20%)
4 Zero or very small WTP (between 0 and 10 (monthly)): respondents who said “yes” to the price of zero but “no” to 10 rupees, the lowest price listed
in the payment card
841 (55.62%)
5 Significant positive bids: respondents who said “yes” to the price of 10 rupees, the lowest bid in the payment card.
445 (29.43%)
6 Missing WTP information 2 (0.13%)
Total 1512
34
TABLE 5: Analyses on the Protest Bids
Variable 1=negative/zero bid; 0=protest bids,
(1) Individual and household demographic characteristics
Male -.35(-0.55) Age -.00086(-0.06)
Hindu -.48(-0.51) Married .32(0.59) Highedu .33(0.86) Notinlf -.66(-0.98) Hhsize -.058(-0.73)
Distancetime -.037(-1.50) (2) Household economic status
Hhincome -.099(-3.04)*** Electricbill -.90(-0.31)
Travelexpense -.47(-0.18) (3) Household current use of transportation system
Transportimport .14(0.41) Modewheeler .35(0.95)
BRTuse -.016(-0.04) (4) Perception about proposed project