ECONOMIC VALUATION OF ENVIRONMENTAL RESOURCES: A CASE STUDY OF THE CENTRAL ZOO OF NEPAL A THESIS SUBMITTED FOR THE PARTIAL FULFILLMENT OF THE REQUIREMENT FOR THE MASTER’S DEGREE OF SCIENCE IN ENVIRONMENTAL SCIENCE BY TEK JUNG MAHAT Exam Roll no. 1566, TU Regd. No. 5-2-37-299-98 CENTRAL DEPARTMENT OF ENVIRONMENTAL SCIENCE TRIBHUVAN UNIVERSITY KATHMANDU, NEPAL DECEMBER 2004
Transcript
ECONOMIC VALUATION OF ENVIRONMENTAL RESOURCES: A CASE STUDY OF THE CENTRAL ZOO OF NEPAL
A THESIS SUBMITTED FOR THE PARTIAL FULFILLMENT OF THE
REQUIREMENT FOR THE MASTER’S DEGREE OF SCIENCE IN
ENVIRONMENTAL SCIENCE
BY TEK JUNG MAHAT
Exam Roll no. 1566, TU Regd. No. 5-2-37-299-98 CENTRAL DEPARTMENT OF ENVIRONMENTAL SCIENCE
TRIBHUVAN UNIVERSITY KATHMANDU, NEPAL
DECEMBER 2004
ii
Letter of Recommendation
This is to certify that Mr. Tek Jung Mahat has completed the Thesis work entitled
“Economic Valuation of Environmental Resources: A Case Study of the Central Zoo of
Nepal.” under my guidance and supervision.
The entire work is based on the original research and contains useful outcome in recent
environmental research and development. Therefore I recommend this Thesis for final
approval and acceptance for the partial fulfillment of the requirements for the Degree of
Masters of Science in Environmental Science.
_____________________ Dr. Madan Koirala Associate Professor (Advisor) Date: December 20, 2004
iii
Letter of Approval The Thesis paper submitted by Mr. Tek Jung Mahat entitled “Economic Valuation of
Environmental Resources: A Case Study of the Central Zoo of Nepal.” towards partial
fulfillment of Degree of Master of Science in Environmental Science has been approved for
the final selection.
____________________________
Dr. S. B. Karmacharya Professor
(Head of Department, CDES, TU)
____________________________ Dr. Madan Koirala Associate Professor (Advisor)
____________________________ Dr. Devendra P. Chapagain
Former Hon’ble Member, National Planning Commission (External Examiner)
____________________________ Mr. Kedar Rijal Lecturer, CDES, TU (Internal Examiner)
Date of Examination: 4 January 2005 (BS 2061 Poush 20)
iv
Certificate of Acceptance The Thesis paper submitted by Mr. Tek Jung Mahat entitled “Economic Valuation of
Environmental Resources: A Case Study of the Central Zoo of Nepal.” towards partial
fulfillment of Degree of Master of Science in Environmental Science is hereby accepted. It is
based on the original research and study under the guidance of Dr. Madan Koirala. The thesis
in part or full is the property of the Central Department of Environmental Science (TU)
and thereof should not be used for the purpose of awarding any academic degree in any other
institution.
______________________ Dr. S. B. Karmacharya Professor (Head of Department, CDES, TU) Date:
v
Acknowledgements It is my great pleasure to acknowledge the contribution made by various persons and organizations in completing this study. The study would not have been possible without their encouragement, help and valuable comments. There is a long list of persons who contributed to this study, some of whom might be unconsciously omitted. First of all I would like to express my gratitude to my supervisor Dr. Madan Koirala, for his acceptance to supervise this thesis and for his continual guidance. Despite his busy schedule, he always provided me with valuable suggestions, critical comments, and guidance to complete this task. I can never forget his kind guidance, supervision and inspiration during the preparation of this Thesis. I would also like to thank Mr. Bidyanath Bhattarai, Environmental Economist, Mr. Rajeswor Shreshtha, Under Secretary, MoFSC, and Mr. Santosh Nepal, Environmental Manager for their valuable suggestions during the study. My special thanks also go to the head of the department Prof. Dr. S. B. Karmacharya and Prof. Dr. Umakant Roy Yadav, former head of the department and the entire CDES family for their support and encouragement throughout the study period. My Sincere gratitude goes to the Environment and Sustainable Development Organization (ESDO) unit for financial assistance to carry out this research project. I also like to thank Prof. Dr. Sarad Sharma, Department of Economics, TU, Dr. Ahsan Uddin Ahmed, Director, Centre for Water and Environment (BUP), Dhaka, Prof. Dr. Joyashree Roy, Department of Economics, Jadavpur University, Kolkata, India, Dr. Kal Bahadur Rokaya, Member, Rural Area Development Commission, Dr. Nanda Bahadur Singh, Lecturer, Central Department of Zoology, TU, Mr. Bhairab Rishal, Senior Journalist, Nepal Forum for Environmental Journalists (NEFEJ), and Ms. Anuradha Kafle, Research officer (SANDEE) for their support and kindness. I would like to express my cordial thanks to Mr. Bishnu Katuwal, Statistical Analyst (ESDO), and Mr. Sashi Devkota, Language editor (ESDO) for his support and valuable comments. I am particularly grateful to Mrs. Sarita Gyawali, Mr. Ganesh Koirala, Mr. Sukra Gurung, and other staff members of the Central Zoo who always encouraged me and provided valuable guidance and comments to complete this work. While in the field, I got a lot of assistance from various persons particularly from Mr. Sushil Anu, Mr. Madhu Khadka Chhetri, Mr. Subash Khadka, Mr. Deepesh Sharma, Mr. Navin Thapa, Mr. Padam Raj Joshi, Ms. Rashila Deshar, Mr. Sudeep Devkota, Mr. Raju Gyawali, and Mr. Bijesh Sharma. I am very grateful to them and many others for their active co-operation, hospitality and support. Similarly, I would like to acknowledge Mr. Jaya Jung Mahat, Ms. Durgesh Mahat and Mr. Kul Raj Devkota for their support during field work. I also wish to express my sincere thanks to all my colleagues at CDES, TU for their kind support and company throughout the study. Finally, my special thanks go to my parents, brothers and sisters for their support and encouragement throughout the study period.
vi
Abstract Economic valuation is a frequently applied measure of resource conservation in the developed
world and its use is growing in the developing countries. It mainly aims to identify the role
and importance of particular resources and to estimate their quantities. This is a very recent
issue in Nepal, and has been used for the study of the Central Zoo, which is a major attraction
for local and international tourists with the net annual visit of about 800,000. Some indicators
show that the zoo needs further improvement and prompt action to improve its services. Less
is known about how and where to start. There is an urgent need to assess the satisfaction level
of the visitors and identify possible fund raising sources. The major objectives of the study
include identification of the economic value of the zoo and the degree of relationship in
between travel cost and the zoo visit. It further aims to investigate the management and
financial status of the zoo, which could suggest sustainable measures to strengthen zoo
facilities. To identify the economic value of the zoo the travel cost method was adopted and
several other methods were applied to collect information on zoo management and the nature
of the visitors. These methods include questionnaire survey, key informant interview, direct
observation, direct count and focus group discussion.
The study shows that a higher proportion of school children, college students and adults visit
the zoo in comparison to visitors of other age groups and professions. Brahmin, Chhetri and
Newar are the dominant visiting castes. The zoo has an excellent public transportation access
and it has achieved success in attracting a high proportion of visitors with relatively poor
incomes. Public buses, tempos and microbuses are the widely used transportation facilities.
There are limited numbers of visitors from SAARC countries and from the rest of the world.
Visitor’s level of education and their direct association with environment related
organizations is not a significant determinant of the number and nature of visits. It is
concluded that there is an inverse relationship between the travel cost and the number of zoo
visits. The per capita economic value of the zoo is estimated to be NRs. 226.286 (US $ 3.15).
It would be better to improve environmental hygiene inside the zoo premises and expand
facilities provided by the zoo. The existing entry fee for the college students could be
increased by NRs 5 to10 to raise funds for the zoo. It can strengthen economic strength of the
zoo to improve its services. The zoo is found to be congested and needs expansion in its area.
Greenery, peace, addition of animals, and availability of sufficient resting places are other
major sectors for improvement.
vii
Table of Contents Chapter Title Page
Title Page I Letter of Recommendation II Letter of Approval III Certificate of Acceptance IV Acknowledgement V Abstract VI Table of Contents VII List of Tables and Figures IX List of Photo plates X List of Acronyms XI
I. INTRODUCTION 1
1.1. Background 2 1.2. Resource Conservation 2 1.3. Concept of Zoo 3 1.4. Tourism, Ecotourism and Protected Areas 5 1.5. Status of Biodiversity in Nepal 6 1.6. Statement of the Problem 10 1.7. Study Area 11 1.8. Rationale of the Study 11
II. LITERATURE REVIEW 13
2.1. Importance of Economic Tools for Environmental Resource Management 13 2.2. Valuation 15 2.3. Significance of Resource Valuation 16 2.4. Resource Valuation Methods and Issues in Travel Cost Method 18
III. OBJECTIVES AND SCOPE 27
3.1. General objectives of the Study 27 3.2. Specific Objectives 27 3.3. Scope and Limitation of the Study 27
IV. MATERIALS AND METHODS 28
4.1. Information Collection 28 4.2. Hypothesis 29 4.3. Data Analysis 29
V. RESULT AND DISCUSSION 30
5.1. Management and Financial aspects of the Zoo 31 5.2. Nature and structure of the visitors 34 5.3. Economic value of the Zoo 44
viii
VI. CONCLUSIONS AND RECOMMENDATIONS 46
6.1. Findings and the Conclusion 46 6.2. Recommendation 47 6.3. Recommendation for further study 48
REFERENCES 49 APPENDICES
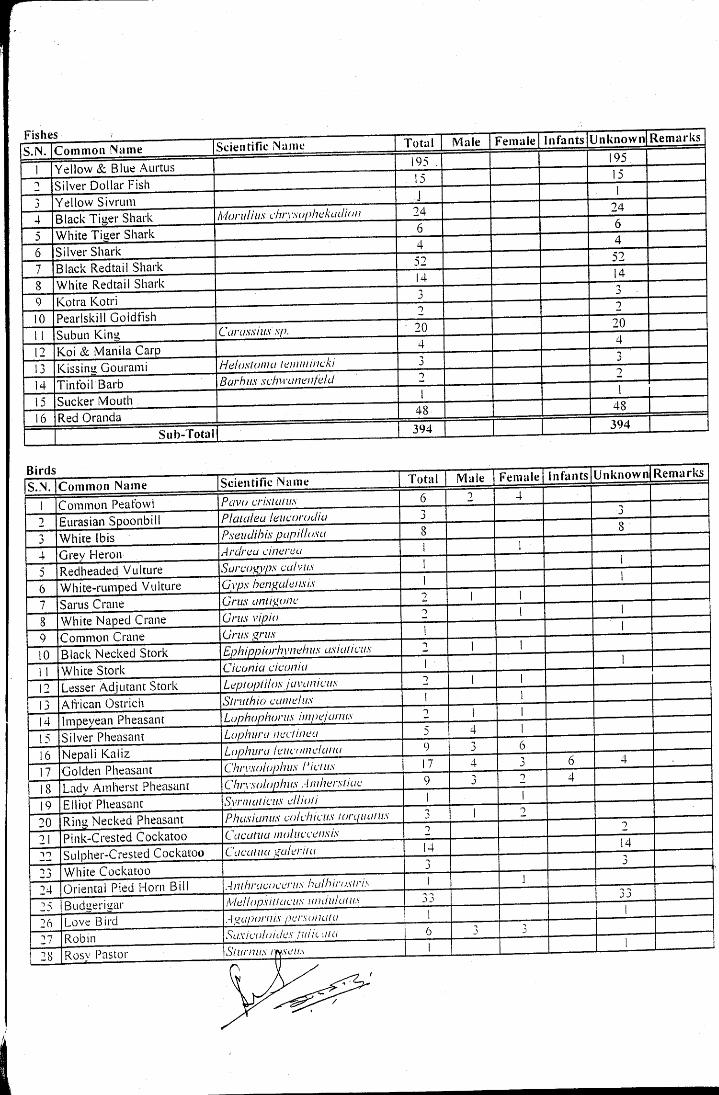
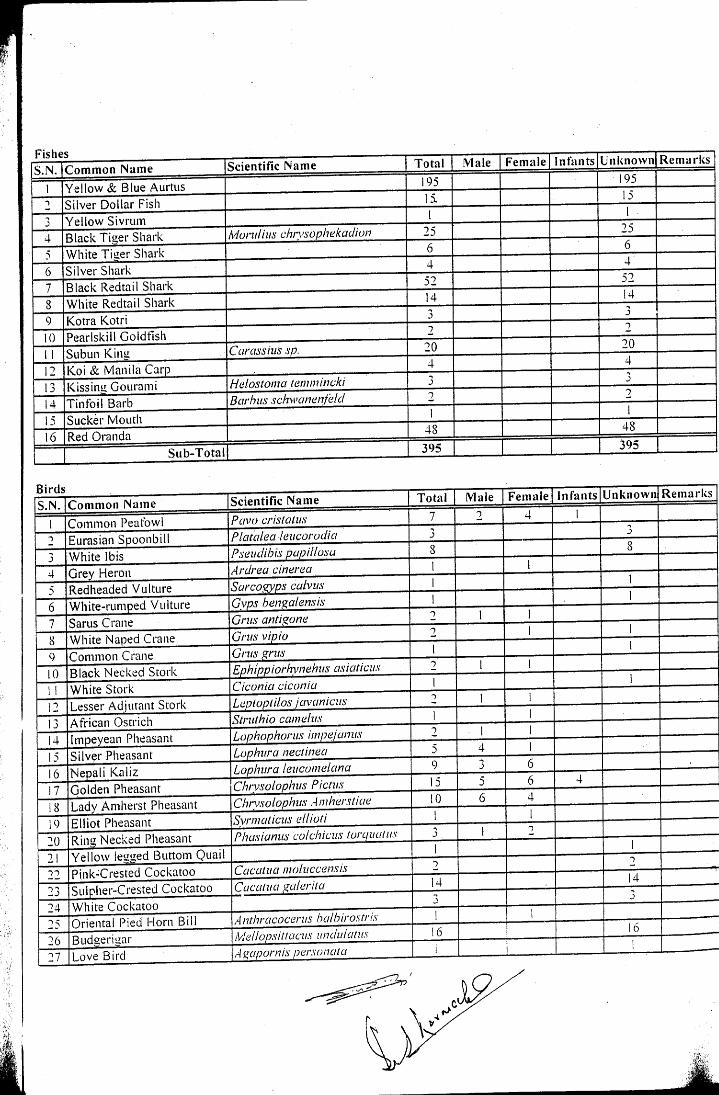
Appendix 1: Questionnaire designed for the visitor’s survey A Appendix 2: List of animals and birds in the Zoo for two different months B Appendix 3: Airfare for some major routes inside the Nepal H Appendix 4: Bus fare for important routes in Nepal J Appendix 5: Water Quality Parameters of the pond during sampling season K
ix
List of Tables and Figures
No. Title Page Tables:
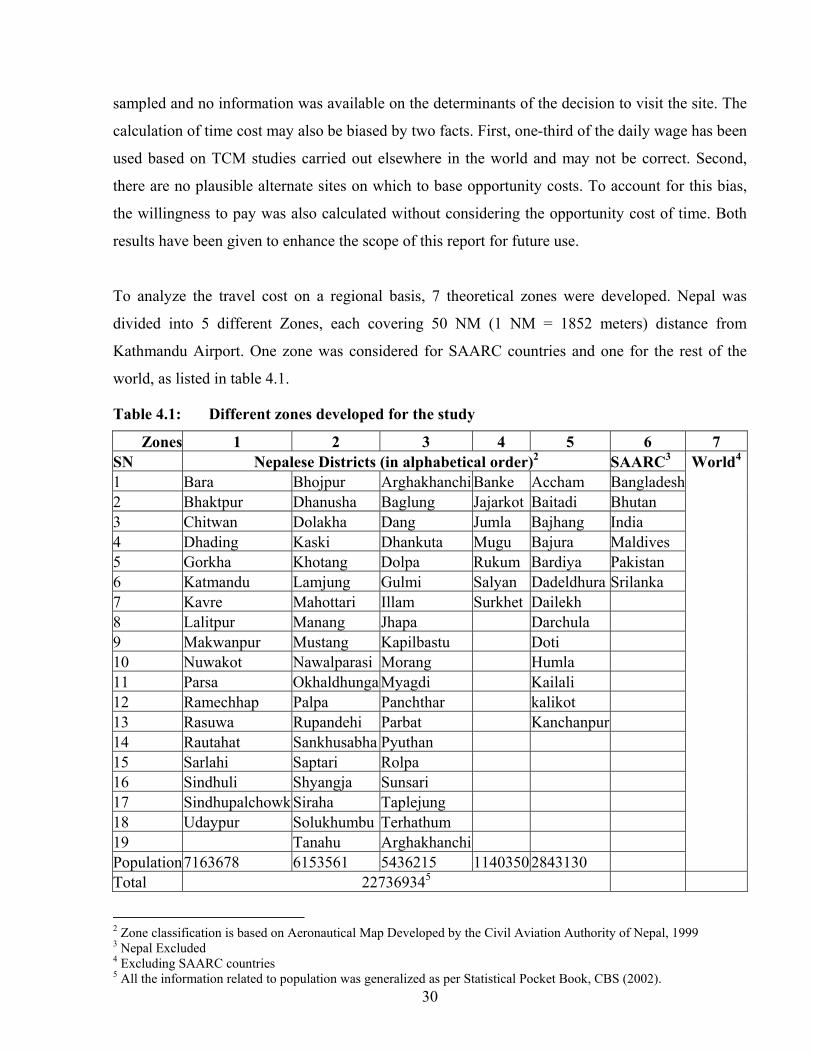
Table 1.1: An overview of species richness in Nepal 7 Table 1.2: Number of flowering plants and endemic species in protected areas 7 Table 1.3: Protected areas in Nepal 8 Table 1.4: Revenue Generation in Protected Areas 9 Table 1.5: Endemic species in Nepal 9 Table 4.1: Different zones developed for the study 30 Table 5.1: Zoo creatures by category 31 Table 5.2: Key Employees of the Central Zoo 31 Table 5.3: Important facilities provided by the zoo 32 Table 5.4: Lalitpur Income and Expenditure of CZ for consecutive three years 33 Table 5.5: Estimated number of visitors in special Events 34 Table 5.6: Number of Visitors during sampling week 34 Table 5.7: Visitor’s mode of Transport 35 Table 5.8: Income groups of Visitors 36 Table 5.9: Number of Visitors (BS 2052/53-2061/62) 37 Table 5.10: Frequency Table for Sex and Caste of the visitors 38 Table 5.11: Peoples WTP as an entry fee if zoo improves its services 38 Table 5.12: Frequency tables for Major purpose of visit, Occupation and Direct association with environment related organizations 39 Table 5.13: Categorization of Zoo visitors according to age group 40 Table 5.14: Educational Level of the Zoo visitors 40 Table 5.15: Preferred season to visit zoo 40 Table 5.16: Level of Satisfaction 41 Table 5.17: Area of improvement for Zoo suggested by the visitors 41 Table 5.18: Visitors suggestions to raise funds for sustainable management of the zoo 42 Table 5.19: Comparative Table of TCM results from around the world 45 Figures: Figure 1.1: Location map of Central Zoo 12
Figure 5.2: Number of Nepalese Visitors and growth trends for last decade 37
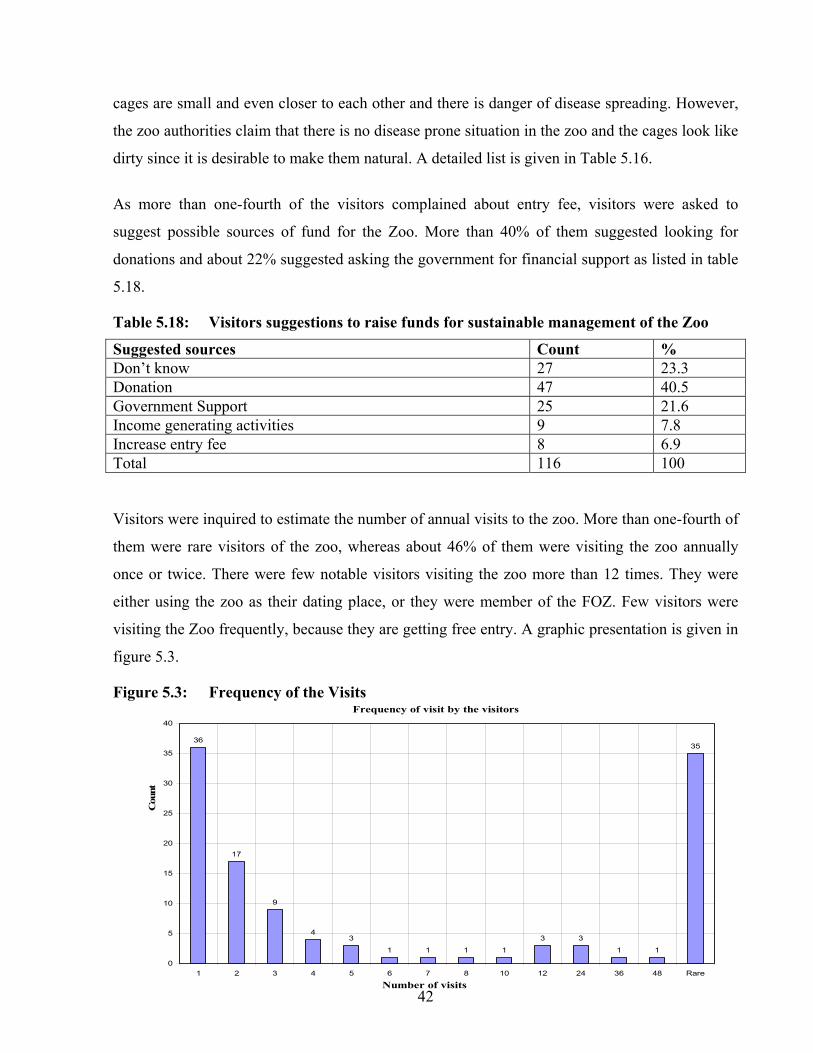
Figure 5.3: Frequency of the Visits 42
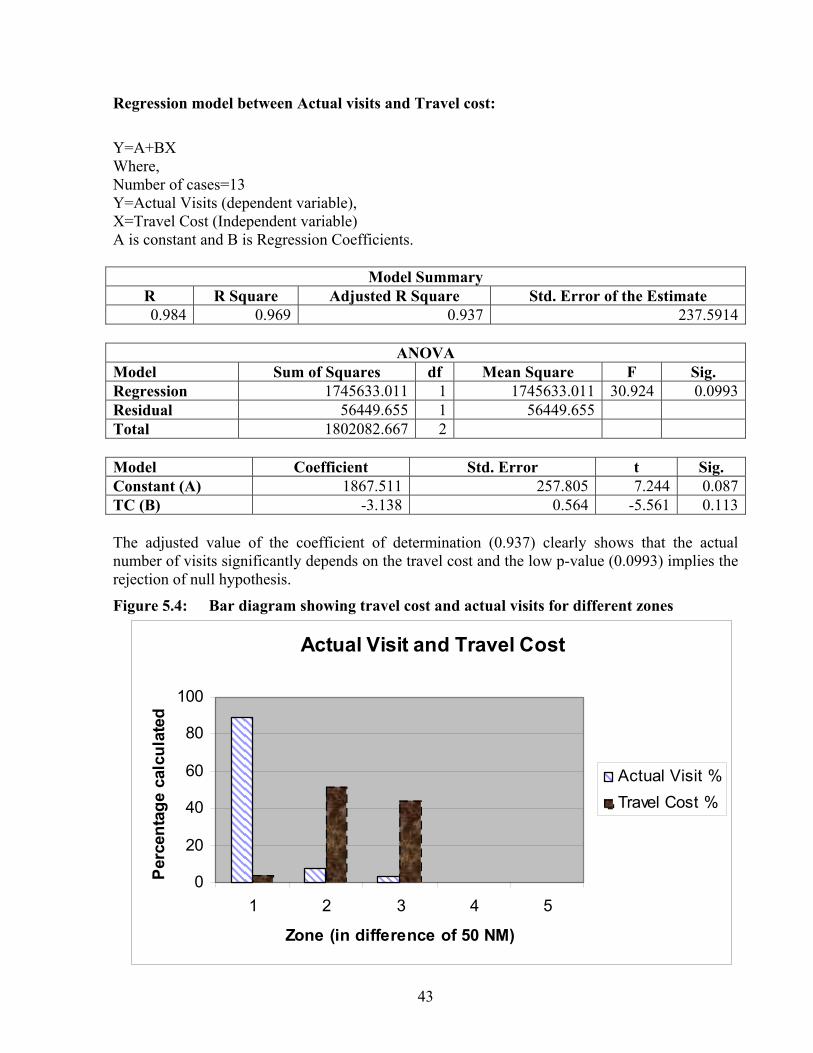
Figure 5.4: Bar diagram for travel cost and actual visit 43
x
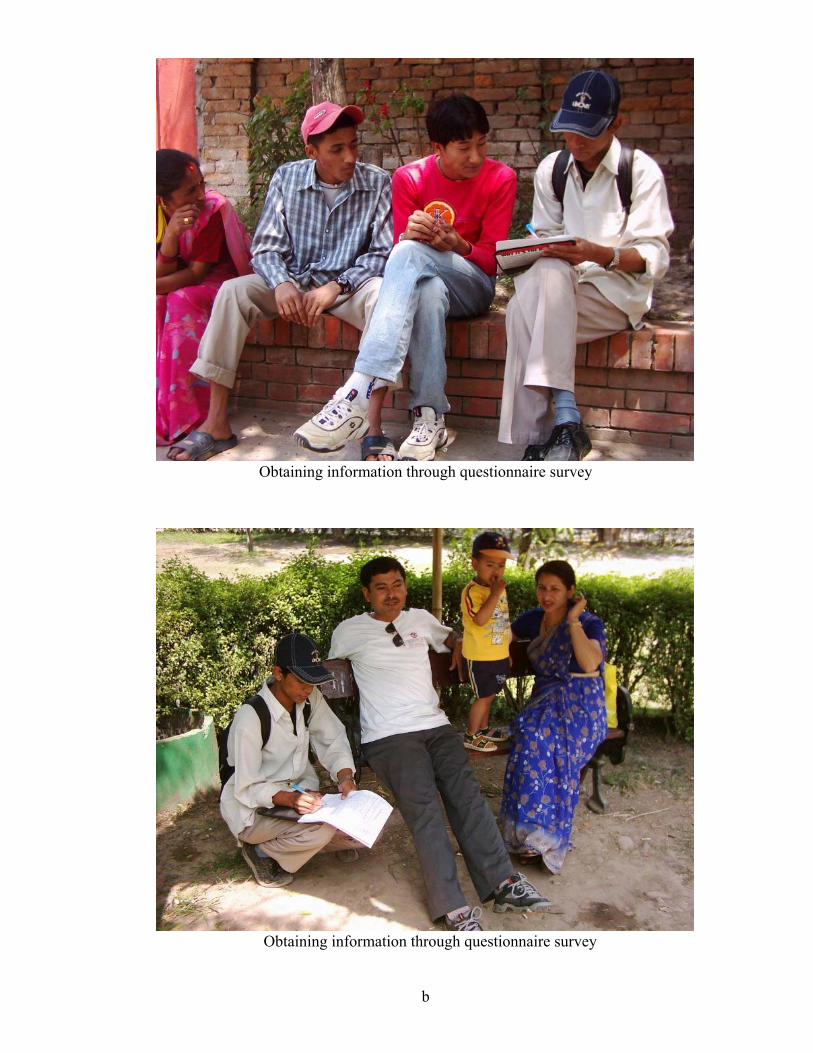
List of Photo Plates No. Title Page Photo Plate 1: Couples resting near the pond a Photo Plate 2: Obtaining information through questionnaire survey a Photo Plate 3: Obtaining information through questionnaire survey b Photo Plate 4: Obtaining information through questionnaire survey b Photo Plate 5: Visitor’s queue at drinking water tank c Photo Plate 6: Hippopotamus resting inside the cage c Photo Plate 7: Zoo is growing its popularity as a favorite picnic
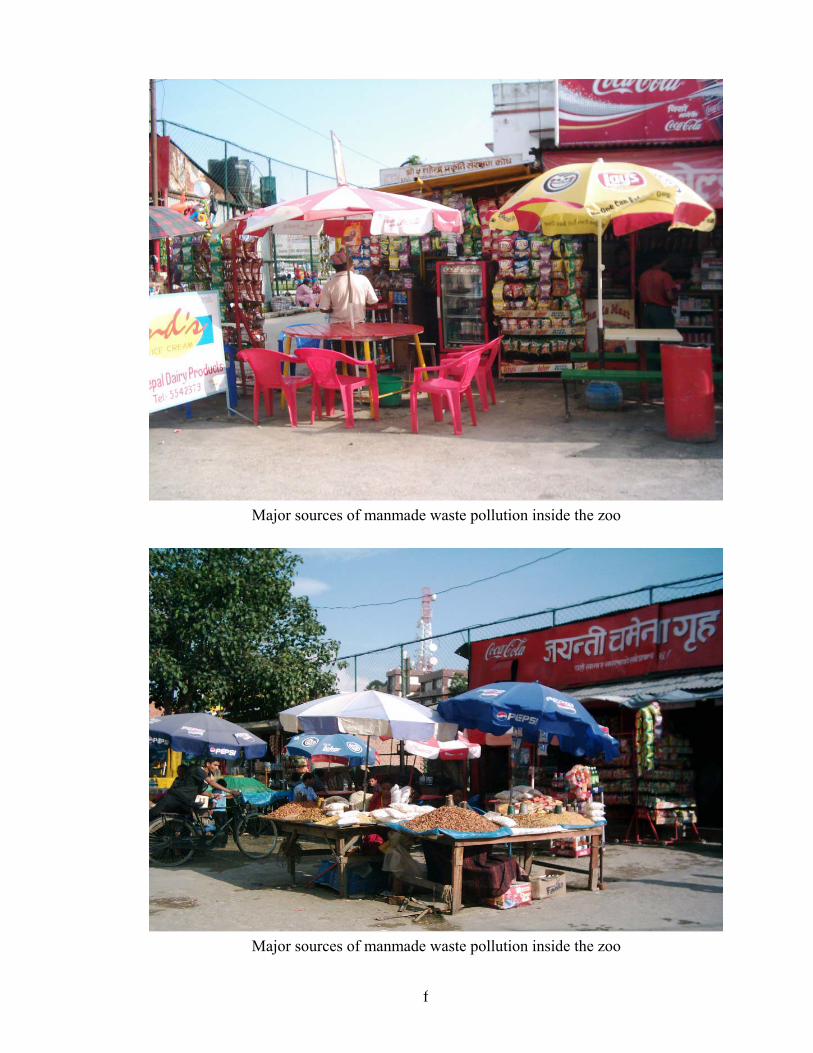
destination among schoolchildren d Photo Plate 8: Ostrich in the Central Zoo e Photo Plate 9: Schoolchildren enjoying zoo facilities e Photo Plate 10: Major sources of manmade waste pollution inside the zoo f Photo Plate 11: Major sources of manmade waste pollution inside the zoo f
xi
List of Acronyms
ADB Asian Development Bank
BUP Bangladesh Unnayan Parishad
CDES Central Department of Environmental Science
CZ Central Zoo
EEU Environmental Economics Unit
ENS Environment News Centre
ESDO Environment and Sustainable Development Organization
ESEE European Society of Ecological Economics
FOZ Friends of the Zoo
IPR Intellectual Property Right
ISEE International Society of Ecological Economics
IUCN World Conservation Union
KMTNC King Mahendra Trust for Nature Conservation
MFSC Ministry of Forest and Soil Conservation
MoPE Ministry of Population and Environment
NEFEJ Nepal Forum of Environmental Journalists
NPC National Planning Commission
NRs Nepalese Rupees (Nepalese Currency)
SAARC South Asian Association for Regional Cooperation
SANDEE South Asian Network for Development and Environmental Economics
TCM Travel Cost Method
TRIPS Trade Related Intellectual Property Right
TU Tribhuvan University
WB World Bank
WWF Worldwide Fund for Nature
HMG/N His Majesty’s Government of Nepal
1
I. Introduction
Human beings, the superior species on the planet earth, have existed over a period of at least 5
million years. Since the Vedic and Pre-Vedic period, nature is the source for meeting human
demands including drinking water, breathing air, habitat to live, clothes to wear and food to eat.
Not only to human beings, the earth ageing about 4.5 billion years has nourished and continues
nourishing millions of species of flora and fauna. With climatic adversities and gradual ecological
and geological degradation many of them have vanished. The present generation could hardly
estimate the ecological, medical and economic values of extinct species. Extinction of such species
was mainly forced due to natural causes, for example extinction of dinosaurs due to environmental
changes linked to the gradual withdrawal of shallow seas from the continents at the end of the
dinosaurian era.
Many people look at natural resources as a source of direct benefits in a growing economy and
undermine the roles played by the earth to maintain warm hospitality and earthly living. Abrupt
ecological changes occurred with the shift of agricultural society to industrial society and
afterwards inducing a great threat to nature through excessive pollution, adverse land use change,
widening gap between “the haves and have nots”, exploitation of energy resources, and of course,
extinction of biodiversity.
With the establishment of the Yellowstone National park in 1872, mankind has shown its desire to
preserve nature, but degradation of nature continues while attempts to reverse the trend are
inadequate. During the early years of the 20th century people generated idea to harvest aesthetic
and educational value of nature with the establishment of highly facilitated captivity, gradually
changing it to ex-situ conservation practice. Animals and plants with higher threat of extinction
were placed in it to reshape, and it started a conservation revolution.
But this effort of human beings has not achieved the expected goal, which is indicated by
thickening of the IUCN Red data book. To fill the information gap for such conservation
measures, economic valuation, a judgment tool to identify the value of natural resources, is
growing mainly after 1960s. It is a universal fact that “higher the value of an object, higher will be
2
the investment to save it”. The present work is an attempt to apply this concept in the Nepalese
territory.
1.1. Background Nepal is a landlocked country roughly rectangular in shape. It borders India to the East, West and
South and China to the North with a total land area of 147181 km2, ranging in altitude from less
than 100 meters in the south to over 8,848 meters in the north. It extends from east to west with an
average length of 885 km with non-uniform north-south width of 193 km. For administrative
purpose the country is divided into 75 districts with 16 districts in the north (Mountain Region), 39
districts in the middle (Hills), and 20 districts in the south (Terai) (MoPE, 2001).
With the altitudinal and climatic variation Nepal is rich in biodiversity. Though it has only 0.09%
of the total landmass of the world, yet about 2.6% of the flowering plants, 3.2% of Pteridophytes,
6% of Bryophytes, 8.57% of birds, 4.3% of mammals, and 1.5% of reptiles of the world’s flora
and fauna have been recorded in Nepal so far (MoPE, 2000). About 500 species of plants are
endemic to Nepal. Over 1,000 species are described from Nepalese flora. Of the total species
recorded, 20 plant species are included in the CITES appendices and 13 species are legally
protected. HMG has also given legal protection to 26 species of mammals, 9 species of birds and 3
species of reptiles (MoPE, 2000). These species are conserved in 9 National Parks, 3 Wildlife
Reserves, 3 Conservation Areas and 1 Hunting Reserves as well as other national and community
forest areas. However species outside the protected areas are facing threat due to habitat loss and
degradation, unregulated collection of forest products, poaching and hunting of wild animals.
1.2. Resource Conservation Lekhak et al (2003), has described natural resources as “goods and services supplied by our living
or non-living environment to meet human needs and wants”. These are of two types, Material or
tangible resources (measurable in quantities). Some material resources such as fresh air, clean
surface water, fertile soil, and useful plants are directly available for use. Most material resources
such a petroleum, iron, groundwater and modern crops are not directly available and their supplies
are limited. They become resources with some efforts and technological endeavor. Material
resources are often classified as nonrenewable, potentially renewable and perpetual. Nonmaterial
3
or intangible resources (that can’t be measured, but only felt by human sense) include solitude,
tranquility, joy, security, beauty, love, skill and knowledge..
Literally, conservation means preservation and prevention of loss, waste, damage etc. (The Pocket
Oxford Dictionary, 2001). Thus nature conservation is preservation of any natural wealth such as
water, vegetation, soil, minerals etc. through their reasonable use to improve the quality of living
of present human population ass well as of the future generations. Unfortunately, conservation is
understood as hoarding or rationing of supplies of goods from nature so that something is left for
future use. Every day about 260,000 humans are added to the world population, 470 Km2 of forests
are cleared, 170 Km2 of new deserts are created, 66 million metric tons of top soil are eroded, 10-
100 species of living beings are eliminated and 71 million metric tons of heat trapping CO2 and
1600 metric tons of ozone depleting chlorofluorocarbons are added to the atmosphere. Beyond any
doubt, the critical environmental resources are now under stress (Lekhak et al 2003).
Environmentalists express doubt about sustainability of resources and human lives if present
human population growth rate and present resource consumption rate remain unchanged. Mankind
as an intellect creature of god is responsible for depletion and degradation of the environment and
resources. Man has learnt to fly in the air like a bird, and swim in the water like a fish, but he has
forgotten to live in harmony with nature. He harbors the wrong belief, that “he is the master of
nature”. Hence all the results of his misunderstanding of nature has created loss of “Golden
moments and spiritually peaceful healthy yesterday and the days before that” (Mahat 2003).
Hence learning from the past, our society should turn to sustainable society to harmonize in
between economy, environment and physical development. Our present demand is development
with environmental considerations i.e. Sustainable Development.
1.3. Concept of a Zoo The aim of conservation is to bring biodiversity to use for society by making the people and
communities knowledgeable about, capable of, and responsible for its management (Chaudhary
1998). There are two types of conservation measures, in-situ conservation, for conservation of
ecosystems and their natural habitats and maintenance and recovery of viable population of species
in their natural habitats (National parks, conservation areas, Nature reserves, protected areas are
4
suitable examples), and ex-situ conservation, meaning conservation of components of biodiversity
outside their natural habitats. Examples include gene and seed banks, botanical gardens, in-vitro
storage Cryopreservation, DNA bank-net, zoos etc. These are essential for the preservation of wild
lives when natural habitat is unfavorable or undesirable for such species due to change in various
components.
The Convention on Biological Diversity (1992), in Article 9, has made provision for the
establishment and management of ex-situ conservation. It says that each Contracting Party shall, as
far as possible and as appropriate, and predominantly for the purpose of complementing in-situ
measures:
(a) Adopt measures for the ex-situ conservation of components of biological diversity, preferably
in the country of origin of such components;
(b) Establish and maintain facilities for ex-situ conservation of and research on plants, animals and
micro- organisms, preferably in the country of origin of genetic resources;
(c) Adopt measures for the recovery and rehabilitation of threatened species and for their
reintroduction into their natural habitats under appropriate conditions;
(d) Regulate and manage collection of biological resources from natural habitats for ex-situ
conservation purposes so as not to threaten ecosystems and in-situ populations of species, except
where special temporary ex-situ measures are required under subparagraph (c) above; and
(e) Cooperate in providing financial and other support for ex-situ conservation outlined in
subparagraphs (a) to (d) above and in the establishment and maintenance of ex-situ conservation
facilities in developing countries.
The zoo is a unique place, which holds collection of live, and in most cases endangered animals. It
has significantly contributed to safeguarding the long-term survival of animals, as well provided
services as a place of research, recreation and education to visitors (Chaudhary, 1998)). It is
estimated that collectively more than 600 million people visit zoos all around the world. Zoos are
accepted globally as open schools for biological and social information. The changing roles of
zoos nowadays have taken the form of centres of conservation and education.
5
1.4. Tourism, Ecotourism and Protected Areas Tourism is an important source of foreign exchange for many developing countries. Development
of tourism in and around protected areas is seen as one of the best ways of delivering economic
benefits to remote areas by providing local employment, stimulating local markets, and improving
transportation and communication infrastructure (MoPE, 2004). Since ecotourism is related with
nature travel in rural, remote and protected areas, tourism in Nepal is often viewed from an
ecotourism perspective (SNV, 2003). The term ‘ecotourism’ is defined as traveling to relatively
undisturbed or uncontaminated natural areas with specific objectives such as studying, admiring,
and enjoying the scenery with its flora and fauna, as well as any existing cultural manifestations
(both past and present) found in these areas. By this definition, nature-oriented tourism implies a
scientific, aesthetic or philosophical approach to travel, although the ecologically motivated tourist
need not be a professional scientist, artist or philosopher. The main feature of such tourism is that
the person who practices ecotourism has the opportunity of immersing himself/herself in nature in
a manner generally not available in the urban environment (MoPE, 2004). Ecotourism differs from
other forms of tourism particularly due to the opportunity for observation and learning. It
contributes to cultural conservation and long-term sustainability of communities and natural
resources. Therefore, it is a form of sustainable tourism that benefits the community, environment
and local economy. This may be achieved through various means such as employment for local
people or programs where tourists contribute money or labor to community activities such as tree
planting or conservation of local monuments or sites (SNV, 2003).
The growth in tourism was accompanied by a growth in undesirable socio-cultural and
environmental problems in the destination areas. This situation called for special efforts to protect
the environmental integrity and ensure development of the host areas. As a result, several protected
areas including environmental projects came into existence with a strong tourism development
component (MoPE, 2004). In Nepal such areas includes various national parks, conservation areas,
religious sites and Himalayan regions, rivers (rafting) and the only national zoo which has
experienced large pressure from local visitors.
6
1.5. Status of Biodiversity in Nepal As already mentioned Nepal comprises only 0.09% of the land area on a global scale, but it
possesses a disproportionately rich diversity of flora and fauna at genetic, species and ecosystem
levels. These species are found in the dense tropical monsoon forests of the Terai, in the deciduous
and coniferous forests of the subtropical and temperate regions, and in the sub-alpine and alpine
pastures and snow-covered Himalayan peaks. Nepal falls within two bio-geographical realms, the
Indo-Malayan and the Palaearctic realm, which add to the high biodiversity level. A
comprehensive summary of biodiversity is given in table 1.1.
The first legislation to protect Nepal's wildlife was introduced more than a hundred and fifty years
ago in the 1840s, during the regime of Jung Bahadur Rana, when restrictions were placed on the
hunting of certain animals. The Central Zoo was also established during this period. The
importance of conserving wild species of fauna and flora was first recognized by HMGN in
Nepal's first Five-Year Development Plan (1956-1961). The Rhino Patrol, established in 1961 as a
result of this first Plan, was fairly successful in controlling the poaching of large mammals. It was
only after the 1970s that an effective conservation program allowed for the establishment of
protected areas. So far, nine national parks, three wildlife reserves, three conservation areas, and
one hunting reserve have been established in the three different ecological zones of Nepal: the
terai, mid-hills and high mountains (MFSC 2002).
7
Table 1.1: An overview of species richness in Nepal (MFSC 2002) Number of Species Group of
Other Insects 751,000 5,052 Thapa 1997 0.7Fishes 18,150 182 Shrestha 2001 1.0Amphibians 4,184 43 Shah 1995 1.0Reptiles 6,300 100 Shah 1995 1.6Birds 9,040 852 Grimmet et al. 2000 9.3Mammals 4,000 181 Suwal & Verheugt 1995 4.5 1Wilson (1988; 1992), 2Akiyama et al. added 50 new species of Nepalese flowering plants to the list of Koba et al., NA = Not Available
Table 1.2: Number of flowering plants and endemic species in protected areas (after MFSC 2002) Protected Area Number of Species1 Number of Endemic Speciess2
Total 979 Hunting Reserve (HR) Dhorpatan HR (1987) 1,325 2,850-7,000
Total 1,325 Kanchenjunga CA (1997) 2,035 1,200-8,598 Manaslu CA (1998) 1,663 1,360-8,163 Conservation Area (CA) Annapurna CA (1986, 1992) 7,629 1,000-8,092
Total 11,327 Royal Chitwan NP 750 Royal Bardia NP 328 Makalu Barun NP 830 Langtang NP 420 Shey Phoksundo NP 449
Buffer Zone
Sagarmatha NP 275 Total 3,051 Total Area Protected (% of Nepal Territory) 26,970 (18.32) Source: MoFSC 2002
Protected areas in the country generate revenue from different sources such as issuing filming
license, entrance fees, royalty from hotels in and around protected areas, elephant ride, issuing
hunting license in a regulated way, fines, and issuing license to export materials made from bones
of domestic animal (DNPWC website 2004). Table 1.4 presents the revenue generated by different
protected areas in the fiscal year.
9
Table 1.4: Revenue Generation in Protected Areas (DNPWC website dated November 2004)1 S.N. Name of Protected Area 057/058 058/059 059/60
1. Department of National Parks & Wildlife Conservation
2,09,53,326.20 7054414.59 7254831.16
2. Royal Chitwan National Park 7,43,02,801.36 38887119.06 30831199.47 3. Royal Bardia National Park 98,21,783.51 4376585.83 2777654.94 4. Sagarmatha National Park 1,54,39,746.19 11355101.00 10819019.00 5. Langtang National Park 85,50,227.00 4490787.21 4866446.21 6. Rara National Park 1,00,372.00 74065.00 59000.00 7. Shey phoksundo National Park 1,93,790.00 481216.00 159460.00 8. Khaptad National Park 94,302.46 34789.00 22276.00 9. Makalu Barun National Park 3,13,927.60 44059.00 131872.00
Total 13,40,98,495.53 7,11,83,709.09 6,08,13,795.85
Recent studies in Nepal have shown that 342 plant species and 160 animal species are endemic to
its territory.
Table 1.5: Endemic species in Nepal Group No. of Species Reference Lichens 39 Sharma, 1995 Fungi 16 Joshi & Joshi, 1991 Algae 3 Joshi & Joshi, 1991 Bryophytes 30 Joshi & Joshi, 1991 Pteridophytes 8 Joshi & Joshi, 1991 Angiosperms 246 Shrestha and Joshi, 1996 Total 342 Spiders 108 Thapa, 1995 Butterflies & Moths *30 Smith, 1997 (pers. com.) Fishes 8 Shrestha 1995 Amphibians & Reptiles 11 Shah, 1995 Birds 2 Shah, 1995 Mammals 1 Suwal & Verheugt, 1995 Total 160 (*Possible endemic taxa), Oberonia nepalensis is a recently reported endemic species of angiosperm (Shakya & Chaudhary 1999), and Tomoptera maskeyi is an endemic amphibian species. Source: MoFSC 2002
1 Revenue generation from the zoo is not mentioned.
10
1.6. Statement of the Problem The economic wellbeing of Nepal is very closely connected with its natural resources, scenic
beauty, topography, agricultural land, wetlands, forests, and protected areas. Economic
development and livelihood improvement are urgent needs and the rapid population increase,
unplanned urbanization, deforestation, various forms of pollution, social conflicts, civil war etc are
highly pronounced environmental problems. The natural resource base is undergoing more and
more pressure and the demand is crossing the ecological limit (carrying capacity). Such
unsustainable anthropogenic activities are creating environmental panics and if these trends remain
unchanged, the day is not so far in which concrete jungles will replace the forest. As we know,
some decades ago Nepal was proud of its forest wealth, which was even an enchanting national
slogan. The changes in quality of the land, air and water as well as the loss of flora and fauna have
raised concern about such costs of development. In this context, especially after the Rio Summit in
1992 the global community has raised a strong voice to cut off or reduce such unsustainable
resource use patterns. Delayed awareness (mainly after the 1990s) has witnessed loss of thousands
of species of flora and fauna. Further delay may lead to irrecoverable loss of diversity at ecosystem
level.
Nepal is a signatory of many biodiversity conservation related treaties most of which are ratified
by the parliament as well. But due to poor institutional framework, increasing human pressure and
natural calamities, the environment is degrading day by day (Bhattarai, 2003). In this regard,
fragile ecosystems with higher pressures should be designated as conservation areas and protected
for future use without compromising the livelihood of the present settlers. If such effort is not
enough to conserve the natural resource base, such species should be translocated to ex-situ
conservation areas. Ex-situ conservation is a tool to protect animals and plants from being extinct.
In addition to this it helps to provide information related to natural resources, strengthen the
economy by generating revenues, and acts as an entertaining site as well. Valuation of such
resources suggests us to assess its effectiveness and the gap between people’s willingness to pay
and services provided by a resource.
11
1.7. Study Area The Central Zoo (CZ) of Nepal extended in an area of 6 hectares and located in Jawalakhel
(Southern part of the Kathmandu Valley) provides facilities for viewing, studying, and preserving
wildlife in captivity. Records have shown that about 1 million people visit it annually (Chaudhary
1998). The Zoo holds a collection of fauna, mainly threatened animals from different ecological
zones of the country and gifted by other institutions of the world. Notable collections include the
rhino, tiger, panther, crocodile, black bear, and hippopotamus etc. Few years ago the King
Mahendra Trust for Nature Conservation (KMTNC), a national NGO supported by HMG Nepal
had introduced a management plan of the zoo to support the goal of conservation of natural
heritage of the country. The same management is continuing till to date.
1.8. Rationale of the Study Establishing conservation areas alone is not enough to realize full conservation. Promotion of
conservation education is only a potential key to enable people toward sustainable resource
consumption. The zoo has its own place to achieve this goal. But poor understanding of the
people’s demand and ecological issues are hindering progress in many places worldwide and the
case of the zoo is no exception. Problems such as inadequate solid waste disposal, poor water
supply and sanitation and low air quality often observed in the Central Zoo led this researcher to
focus this study on it.
12
Figure 1.1: Location map of Central Zoo
13
II. Literature Review
2.1. Importance of Economic Tools for Environmental Resource Management Valuation of natural resources is a relatively new area of research in South Asia and a very recent
approach for Nepal. Few researches related to forests, parks and wetlands are available. Based on
the published literature the present research is a second attempt in South Asia to know people’s
willingness to pay for the services provided by the zoo. A similar study was made in Bangladesh
by Shammin in 1999. This is a pioneer research in Nepal, and it lacks related literature for
comparative studies. In this section literatures related to other aspects and methods of resource
valuation are also considered.
Hecht (1999) has described that when the environmental movement began gaining strength in the
1960s, it was perceived to present a tradeoff between improved standards of living and a clean
environment. Increasingly, however, both environmentalists and development advocates are
recognizing that to maximize living standards in the long run, we must protect the environment.
Improvements in the well being of much of the world’s population depend on finding ways to use
our resources without destroying them. The field of environmental economics and ecological
economics are both responses to this challenge. They constitute an economist’s strategy for
ensuring that the decisions of individuals, firms, and governments reflect the economic importance
of the environment and that the development paths we choose will be sustainable. The
environment plays four critical roles in sustaining economic activity; life support, supply of raw
materials, absorption of waste products, and supply of amenity services.
Environmental Accounting can also help detect which is an illusory growth, and which it is not,
and it can even show that a transitory gain in income by depleting natural resources leads to a
permanent loss in wealth (Ahmed et al 1999). Economic decisions, market prices and
environmental regulation are the main forces driving the stock of natural capital. Accordingly,
economic theory and, in particular, resource economics, faces the challenge of providing adequate
solutions for the trade-offs between environmental protection and economical needs faced by
today’s generations. Within the broader interdisciplinary approach to sustainability, research in
14
resource economics has to be directed at finding and establishing the rules for a world society,
which is intrinsically compatible with its natural environment (WIF).
Tiwari (1998) has explained the relationship between the economy and environment. The
environment supplies resources to the economy and waste flows occur from the economy to the
environment. The two laws of thermodynamics support the circular linkage: in each of the three
stages of the process, namely resource collection, production and consumption. Since energy and
matter cannot be destroyed (the first law of thermodynamics), it is clear that the utilized resources
will generate an equal amount of waste (and energy) in any period of time. Recycling is only
possible way to a certain extent, due to the second law of thermodynamics that states that mainly
entropical processes take place. This circular flow is sometimes represented by the material
balance model, which identifies three ways of environmental conservation: reducing the
production output and therefore input requirements, reducing production residuals and increasing
the recycling of production and consumption residuals. In order to sustain the economy, renewable
resources should be used in such a way that their harvest rate is not greater than their natural
regeneration rate, and waste flows should be kept at a level below the assimilative capacity of the
environment. The use of resources should thus be as efficient as possible.
The concept of environmental protection has come to existence in connection with the economic
quest of securing means for a better life. The ongoing depletion of exhaustive natural resources has
been the issue of economic endeavor. Sustainable management of natural resources is connected to
the concept of people’s participation. The question of empowering the local community in the
management of natural resources has been a part of economic programs. The process of
development gradually leads to a gradual integration of local communities into a larger social and
economic framework (WECD, 1987).
IUCN (1998) has given emphasis on the understanding of flow and distribution of economic
benefits from tourism, which is one of the most critical elements in park economies. Policy
makers, planners, and managers, can influence this flow and its distribution, and need to consider
their options carefully. International bodies (such as the World Bank), all levels of the government,
corporations/businesses of all kinds, and especially those involved in tourism, and local citizens
and visitors to protected areas all make decisions on future investments of money and time which
15
affect protected areas. Economic benefit valuation can inform many of these decisions. Protected
area managers and their supporters should therefore do all they can to provide such valuations and
communicate the results widely.
The World Bank website (2004) has cited that developing "greener" national accounts holds the
promise of placing environmental problems into a framework that key economic ministries in any
government will understand. For too long now, ministries of finance and planning have paid scant
attention to the exploitation of the natural resource base, or the damaging effects of environmental
pollution. At the same time, countries have been developing national environmental action plans
that read as if they were written by the environment ministry with no links to the finance ministry.
2.2. Valuation Valuation is the system of expressing goods and services in economic terms. Economic value is
one of many possible ways to define and measure the work of a good or service. Although other
types of value are often important, economic values are useful to consider when making economic
choices, which involve tradeoffs in allocating resources. Measures of economic value are based on
what people want (their preferences). Economists generally assume that individuals, not the
government, are the best judges of what they want. Thus, the theory of economic valuation is
based on individual preferences and choices. People express their preferences through choices and
tradeoffs that they make, given certain constraints, such as those on income or available time
(King et al 2004). Sustainable management of Natural resources requires sound knowledge in
ecological and economic perspectives and values of such resources (Mahat 2001).
Characteristics of economic value:
• Products or services have value only if human beings want them for a price, directly or
indirectly.
• Value is measured in terms of trade-offs, and is therefore relative.
• Typically, money is used as a unit of account.
• To determine values for society as a whole, values are aggregated from individual values.
In order to internalize the externalities (costs/benefits imposed by consumption and production
decisions on third parties not directly participating in the decision) into the economic market
prices, the value of environmental resources (and therefore environmental damages) should be
16
known. This will help in designing pollution charges, in carrying out cost-benefit analyses of
projects including environmental impacts, and in constructing environmental accounts that could
be integrated with the conventional System of National Accounts, annually presenting the national
(macro-) economic situation. The total economic value of a resource consists of its 1) direct,
indirect and option use values and 2) non-use values (for example: existence values). These values
are difficult to estimate, even though several theoretical methods are available. Direct valuation
methods include the contingent valuation, hedonic pricing and Travel Cost Method (TCM), while
indirect valuation methods include estimating dose-response relationships (Tiwari 1998).
Miller (2002), explains that Conservation biologists and ecologists contend that wild species,
natural ecosystems, and the earth’s overall biodiversity have two types of values, intrinsic (species
or ecosystem centered) and instrumental (human centered) values. Instrumental value is further
classified as Utilitarian (goods, ecological services, information, option, and recreation) and Non-
utilitarian (existence, aesthetic and bequest).
Mahat (2004) has explained economic valuation, which includes cost of tangible as well as
intangible benefits together, as an excellent idea for the investigation and realization of the true
value of environmental resources. He has suggested that community efforts with optimum
allocation of resources could solve the problem of “Tragedy of the commons” (a situation in which
free access resources are degraded due to over exploitation) and it leads the way for sustainable
resource management. He further adds moral, market and legal forces together can bind people to
manage it.
2.3. Significance of Resource Valuation To understand why resource valuation may be important for sustainability of zoo management and
policy, it is necessary first to review the role of valuation in decisions that concern the use of
environmental resources. By providing a means for measuring and comparing the various benefits
of the zoo, economic valuation can be a powerful tool to aid and improve its wise use and
management of Zoo. Although we know intuitively that such resources may be important, this may
not be enough if we are to ensure their wise use. Many environmental resources are complex and
multifunctional, and it is not obvious how the myriad goods and services provided by these
resources affect human welfare. In some cases, it may be worthwhile to deplete or degrade
17
environmental resources; in others, it may be necessary to ‘hold on’ to these resources. Economic
valuation provides us with a tool to assist with the difficult decisions involved. Valuation is only
one element in the effort to improve management of environmental resources (such as zoo). At the
same time, decision-makers must take account of many competing interests in deciding how best
to use a resource. Economic valuation may help inform such management decisions, but only if
decision-makers are aware of the overall objectives and limitations of valuation (Barbier et al
1997).
The World Bank’s World Development Report (1992) addresses importance of valuation as “an
essential step in determining what should be done about environmental damage is to value it and
compare it with the costs of preventing the damage. Measurement is essential, since tradeoffs are
unavoidable”. There are many practical problems in deriving credible estimates of economic value.
But four broad approaches can be used in setting priorities.
I. Market prices
II. Costs of replacement
III. Surrogate markets (effect on other markets)
IV. Surveys
Adhikary et al (1998) has given notes on “economic assessment of protected areas: guidelines for
their assessment”. He has emphasized on market-based instruments for environmental
management and described on its application potential in Nepal.
Finally, economic valuation is concerned ultimately with the allocation of such resources to
improve human welfare. Consequently, the various environmental benefits are measured in terms
of their contribution to providing goods and services of value to humanity. However, some
members of society may argue that certain systems and the living resources they contain may have
an additional ‘preeminent’ value in themselves beyond what they can provide in terms of
satisfying human preferences or needs. From this perspective, preserving resources is a matter of
moral obligation rather than efficient or even fair allocation. There may be other motivations for
managing resources in particular ways, such as political considerations. Thus, economic values
represent just one input into decision-making, alongside other important considerations. The goal
18
of this text is to assist planners and decision-makers with increasing the input from economic
valuation in decision-making (Adhikary et al, 1998).
Economic theory suggests that the amount that consumers are willing to pay (WTP) for a marginal
increase in consumption should be about the same as the amount they are willing to accept (WTA)
as compensation for an equivalent decline in consumption. Few researches have shown that WTA
amounts exceed WTP by a wide margin. To date there is no satisfactory explanation for the
divergence in WTP and WTA (Gunton 1991). Valuation of a zoo could explore the status of
visitor’s willingness to pay and the services provided by the zoo, which ultimately helps to
harmonize the relationship between both these factors.
2.4. Resource Valuation Methods and Issues in Travel Cost Method The economic value of a particular item, or good, for example a loaf of bread, is measured by the
maximum amount of other things that a person is willing to give up to have that loaf of bread. If
we simplify our example “economy” so that the person only has two goods to choose from, bread
and pasta, the value of a loaf of bread would be measured by the most pasta that the person is
willing to give up to have one more loaf of bread. Thus, economic value is measured by the most
someone is willing to give up in other goods and services in order to obtain a good, service, or
state of the world. In a market economy, dollars (or some other currency) are a universally
accepted measure of economic value, because the number of dollars that a person is willing to pay
for something tells how much of all other goods and services he/she is willing to give up to get that
item. This is often referred to as “willingness to pay.” It is often incorrectly assumed that a good’s
market price measures its economic value. However, the market price only tells us the minimum
amount that people who buy the good are willing to pay for it. When people purchase a marketed
good, they compare the amount they would be willing to pay for that good with its market price.
They will only purchase the good if their willingness to pay is equal to or greater than the price.
Many people are actually willing to pay more than the market price for a good, and thus their
values exceed the market price (King et al 2004).
Resource values are measures of how important resource services are to people and what they are
worth. Resource valuation can be a difficult and controversial task, and economists have often
been criticized for trying to put a “price tag” on nature. However, agencies in charge of protecting
19
and managing natural resources must often make difficult spending decisions that involve tradeoffs
in allocating resources (King et al 2004).
Decisions about ecosystem management are complicated by the fact that various types of market
failure are associated with natural resources and the environment. Market failures occur when
markets do not reflect the full social costs or benefits of a good. There are various forms, from
monopoly to perfect competition, of market in the society though both are rarely found in the real
economy due to presence of poverty, inequality in income and wealth, unemployment, dualistic
nature of economic policy, fluctuation of agricultural production, improper utilization of natural
resources, etc. (Bhattarai 2003). For example, the price of gasoline does not fully reflect the costs,
in terms of pollution, that are imposed on society by burning gasoline. Market failures related to
ecosystems include the facts that: (i) many resources provide services that are public goods (goods
for which two or more individuals can consume the same unit at the same time and not reduce its
availability to others); (ii) many resource services are affected by externalities; and (iii) resource
related property rights (endemic resources and original creative works that have economic value
are protected by law and have trademark and copyright law) and their services are often not clearly
defined.
However, King et al. (2004) has described three widely accepted approaches to estimating dollar
values of a resource provided services. Each approach includes several methods. They are
1. Market Prices –Revealed Willingness to Pay
The values of some ecosystem goods or services can be measured using market prices. Some
ecosystem products, such as fish or wood, are traded in markets. Thus, estimating consumer and
producer surplus can estimate their values, as with any other market good. Other ecosystem
services, such as clean water, are used as inputs in production, and their value may be measured by
their contribution to the profits made from the final good. Some ecosystem or environmental
services, like aesthetic views or many recreational experiences, may not be directly bought and
sold in markets. However, the prices people are willing to pay in markets for related goods can be
used to estimate their values. For example, people often pay a higher price for a home with a view
of the ocean, or will take the time to travel to a special spot for fishing or bird watching. These
20
kinds of expenditures can be used to place a lower bound on the value of the view or the
recreational experience. These methods include:
• Market Price Method (MPM)’
• Productivity Method (PM),
• Hedonic Pricing Method (HPM), and
• Travel Cost Method (TCM)
2. Circumstantial Evidence –Imputed Willingness to Pay
The value of some ecosystem services can be measured by estimating what people are willing to
pay, or the cost of actions they are willing to take, to avoid the adverse effects that would occur if
these services were lost, or to replace the lost services. For example, wetlands often provide
protection from floodwaters. The amount that people pay to avoid flood damage in areas similar
to those protected by the wetlands can be used to estimate willingness to pay for the flood
protection services of the wetland. These methods include:
• Damage Cost Avoided,
• Replacement Cost, and
• Substitute Cost Methods
3. Surveys –Expressed Willingness to Pay
Many ecosystem services are not traded in markets, and are not closely related to any marketed
goods. Thus, people cannot “reveal” what they are willing to pay for them through their market
purchases or actions. In these cases, surveys can be used to ask people directly what they are
willing to pay based on a hypothetical scenario. Alternatively, people can be asked to make
tradeoffs among different alternatives, from which their willingness to pay can be estimated. These
methods include:
• Contingent Valuation Method, and
• Contingent Choice Method
Economic value (consumer’s surplus) of a particular output (e.g. sport fishing) of a public project
also can be found by estimating the consumer demand curve for that output (US Department of the
Army Corps of Engineers, 1999).
21
Economic values associated with ecosystems or sites that are used for recreation are generally
measured with the application of the TCM. Credit for the TCM is attributed to Harold Hotelling,
who proposed the basic notion of the method to a park service director in a 1947 letter. It was not
put into practice extensively until the late 1960’s, and has only reached a more refined state in
relatively recent years. Jack Clawson and Marion Knetsch are widely regarded as two of the most
important figures in the early development of the TCM. Philosophically, the TCM falls into the
general category of neo-classical welfare economics, which assumes that individuals maximize
their utility subject to certain constraints. This has implications for both the technical exposition of
the method and for the premises upon which it is built. Debate about the merits or demerits of
alternative economic theories exceed the scope of this study, but it is important to be conscious of
the model’s theoretical foundations.
The basic premise of the TCM is that time and travel cost expenses that people incur to visit a site
represent the “price” of access to the site. Thus, peoples’ willingness to pay to visit the site can be
estimated based on the number of trips they make at different travel costs. This is analogous to
estimating peoples’ willingness to pay for a marketed good based on the quantity demanded at
different prices.
The Australian Government Publishing Service (AGPS, 1995) has recommended applying the
TCM to know;
• How does the value of recreation change when the environment changes?
• Do increases in recreation benefits from improvements in environmental quality exceed the
cost of the improvements?
• Does the increase in recreation benefits from conserving an area exceed the loss in
development benefits from conservation?
To resolve these questions, monetary values need to be estimated for the benefits of recreation and
environmental quality and the costs of deterioration in environmental quality and recreational
amenity. AGPS (1995) has explained that this technique has been applied to value the benefits of
recreation in the Grampians forests of Victoria (1973), the Warrumbungles National Park of New
South Wales (1978), the Great Barrier Reef in (1987), Kakadu National Park in the Northern
Territory in (1991), and the state forests of southeastern New South Wales and East Gippsland in
Victoria in (1992).
22
TCM is an appropriate choice for this research, because;
• The site is primarily valuable to people as a recreational site.
• The expenditures for projects to protect the site are relatively low.
• A relatively inexpensive method like the travel cost makes the most sense.
The travel cost approach is based on the theory of consumer demand. The fundamental principle of
TCM is that the value people attach to a location of environmental significance can be inferred
from the cost they incur in traveling to it. Value is placed on non-marketed environmental goods
by incorporating the patterns of consumption in related markets. Such costs of consuming the
services of an environmental asset include travel costs, entry fees, on-site expenditure, outlay of
capital expenditure necessary for consumption, and the opportunity cost (the sacrifice of some
good or service made because of a decision to acquire some other good or service) of time. The
method assumes a complementarity between an environmental asset and consumption expenditure,
and thus can also be applied to determine the marginal utility of quality improvements. Therefore,
if consumption expenditure becomes zero, the marginal utility also becomes zero. For example, if
the travel cost to a national park becomes so expensive that the number of visitors is zero, then the
marginal social benefit of an increase or decrease in quality is also zero. TCM has also been
applied to determine the willingness to pay (WTP) for sites where the cost of visiting substitute
sites is also taken into account (Shammin, 1999). Hanley and Spash (1993) have described the
total cost for each individual “i” to visit a given site “j” as;
Cij = C (DCij, TCij, Fj) where, i = 1…n
Where,
Cij = Total cost for individual "i" to visit site "j".
Cij = Distance costs for each individual dependent on the distance the person has to
travel and the cost per mile of travelling.
TCij = Time costs which include the time spent in travelling to the site, the time spent
inside the site and the value of the individual’s time.
Fj = Entrance fee to the site
Wood, Trice, Knetsch and Clawson used an approach to TCM known as the zonal model. In this
approach, the area around the site is divided into several zones and travel costs for each zone are
calculated to generate the demand curve. Typically the surrounding area of the site is divided into
23
concentric circles of specified distance with some reference to the administrative districts. The
demand curve is estimated by regressing the number of visits from each zone against the travel
costs. People’s willingness to pay for the given site is expressed as cost per visitor day. Another
model for generating the demand curve is to take the number of visits made by each individual as
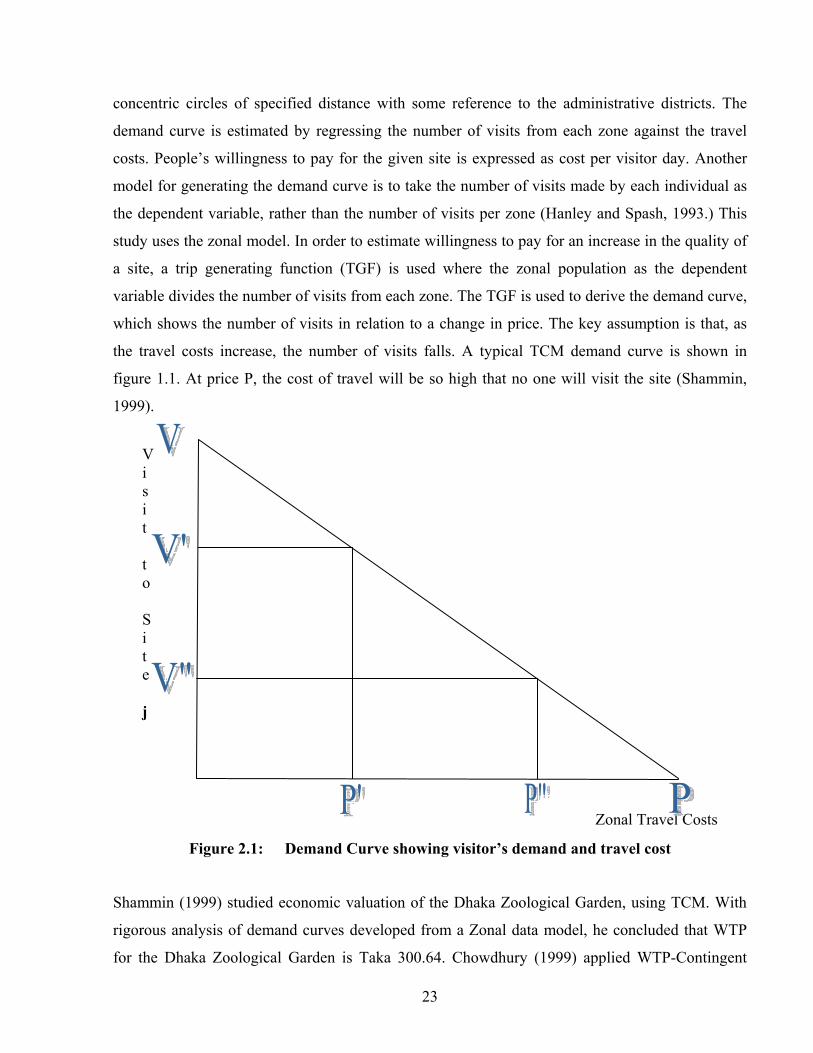
the dependent variable, rather than the number of visits per zone (Hanley and Spash, 1993.) This
study uses the zonal model. In order to estimate willingness to pay for an increase in the quality of
a site, a trip generating function (TGF) is used where the zonal population as the dependent
variable divides the number of visits from each zone. The TGF is used to derive the demand curve,
which shows the number of visits in relation to a change in price. The key assumption is that, as
the travel costs increase, the number of visits falls. A typical TCM demand curve is shown in
figure 1.1. At price P, the cost of travel will be so high that no one will visit the site (Shammin,
1999).
Figure 2.1: Demand Curve showing visitor’s demand and travel cost
Shammin (1999) studied economic valuation of the Dhaka Zoological Garden, using TCM. With
rigorous analysis of demand curves developed from a Zonal data model, he concluded that WTP
for the Dhaka Zoological Garden is Taka 300.64. Chowdhury (1999) applied WTP-Contingent
Zonal Travel Costs
Visit to Site j
24
Valuation Method to identify the WTP for water in Dhaka slums. Based on interviews with 232
respondents she concluded that the monthly average WTP for water is Taka 82.62 per household.
Khalil (1999) studied valuation of the Mangrove ecosystem along the Karachi coastal areas and
concluded that this resource has a significant importance to the region and to the country as a
whole. This study has also focused on resource degradation due to threats like decreased river
flow, overuse, pollution, and other pressures.
Khan (2004) has studied the demand for Ecotourism in Margalla Hills National Park in Northern
Pakistan using TCM. He has estimated the annual benefits from the park as US $ 0.4 million. He
has concluded that travel cost, household income, and quality of the park have influenced the
visitors demand.
Cesario et al. (1970) have concluded that the opportunity cost of time taken to travel to a site
should be included along with the out of pocket costs of travel. Failure to include time costs results
in an underestimate of site value. Estimating the opportunity cost of time, however, is difficult.
Cesario (1976) concludes based on a review of a number of studies that the cost of time is
equivalent to between one-quarter and one-half of the wage rates. Freeman (1979) correctly
observes, however, that these estimates used by Cesario are based on travel to work which are not
applicable to recreational travel. Indeed, studies by Sutherland (1982) and Walsh et al. (1985)
indicate that travel time can be a benefit improving the overall recreation experience, not a cost.
Another problem noted by Bishop et al. (1979) is that the wage rate overestimates the opportunity
cost of time because it is unlikely that the time spent traveling to a recreational site would
otherwise be spent working at the same job. The issue of appropriate travel time costs continues to
be an unresolved problem which can bias estimates.
Chapagain (1984) studied the common property right issues and clearly addressed the problems of
public land use in Nepal from an institutional point of view. He discussed the open access and
common property right on public lands of Nepal. He has explained how people are intentionally
encroaching the forest both individually and institutionally.
25
Budhathoki (1992) has studied the cause of deforestation and its impacts in the Nepalese economy.
He has discussed on the rate of deforestation and role of various stakeholders in deforestation for
different purposes like open grazing, Shifting cultivation etc.
Hamilton and Lutz (1996) have documented few case studies of resource and environmental
accounting. Natural resource accounting has been identified as one of 15 possible policy changes
to promote (ecologically) sustainable development in Australia. Canadian has developed pilot
physical and monetary accounts of forest resources in Alberta, covering the period 1964-1990. The
intention is to gain information on sustainability of the services that natural capital provides.
Similar studies from Costa Rica, Finland, France, Germany, India, Indonesia, Japan, Mexico, the
Netherlands, New Zealand, Norway, Papua New Guinea, the Philippines, Sweden, Tanzania,
Thailand, United Kingdom, United States of America, Zimbabwe etc also address the need of
economic valuation and policy changes for sustainable management of resources.
Adhikari (2003) has tried to examine the contribution of community forestry to household level
income with particular emphasis on group heterogeneity and equity in benefit distribution. He has
concluded that poor people are relatively less benefited and are less dependent on forest resources.
Kandel et al. (2003) has studied on impact on the income distribution due to private tree farming
and analyzed the significance of upland (Pakhobari) for livelihood improvement of such people.
Bhattarai (2003) has made an econometric analysis of environmental degradation in Nepal, using
secondary data. It focuses on degradation of different resources like forest, energy, soil, water, loss
of biodiversity etc. Bhattarai (2004) worked on valuation of Nepalese wetlands using the
contingent valuation method. He has compared different parameters and their relation with the
willingness to pay for wetlands.
Dhital (2003) has evaluated the Royal Chitwan National Park, using environmental economic
2 Zone classification is based on Aeronautical Map Developed by the Civil Aviation Authority of Nepal, 1999 3 Nepal Excluded 4 Excluding SAARC countries 5 All the information related to population was generalized as per Statistical Pocket Book, CBS (2002).
31
V. Result and Discussion
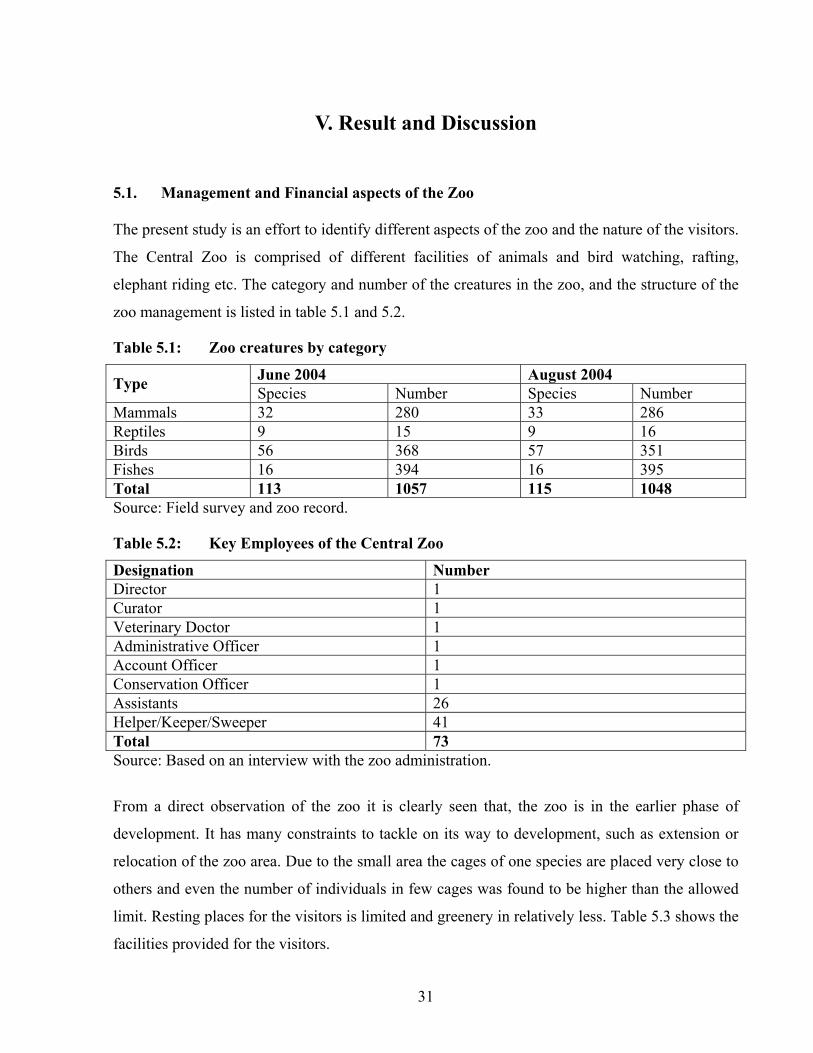
5.1. Management and Financial aspects of the Zoo The present study is an effort to identify different aspects of the zoo and the nature of the visitors.
The Central Zoo is comprised of different facilities of animals and bird watching, rafting,
elephant riding etc. The category and number of the creatures in the zoo, and the structure of the
zoo management is listed in table 5.1 and 5.2.
Table 5.1: Zoo creatures by category
June 2004 August 2004 Type Species Number Species Number Mammals 32 280 33 286 Reptiles 9 15 9 16 Birds 56 368 57 351 Fishes 16 394 16 395 Total 113 1057 115 1048 Source: Field survey and zoo record.
Table 5.2: Key Employees of the Central Zoo
Designation Number Director 1 Curator 1 Veterinary Doctor 1 Administrative Officer 1 Account Officer 1 Conservation Officer 1 Assistants 26 Helper/Keeper/Sweeper 41 Total 73 Source: Based on an interview with the zoo administration.
From a direct observation of the zoo it is clearly seen that, the zoo is in the earlier phase of
development. It has many constraints to tackle on its way to development, such as extension or
relocation of the zoo area. Due to the small area the cages of one species are placed very close to
others and even the number of individuals in few cages was found to be higher than the allowed
limit. Resting places for the visitors is limited and greenery in relatively less. Table 5.3 shows the
facilities provided for the visitors.
32
Table 5.3: Important facilities provided by the Central Zoo
Zoo Facility Quantity Remarks Land area 6 ha Lakes/pond 1
Animals 35 Cages Birds 17 Few cages are empty
Raft 1 Paddle boat 4 Raft and boats Duck boat 2
Public toilet 3 Fountain 1 Play ground for children 1 Animal hospital 1 Artifacts 1 Fish Aquarium 7 Information and Research Center 1 Friends of the Zoo (Conservation Education Center) 1 Stores 3 Temples 2 Statue 2 Restaurants 2 Shop 1 Drinking water tanks 2 Source: Field survey and interview with the zoo administration.
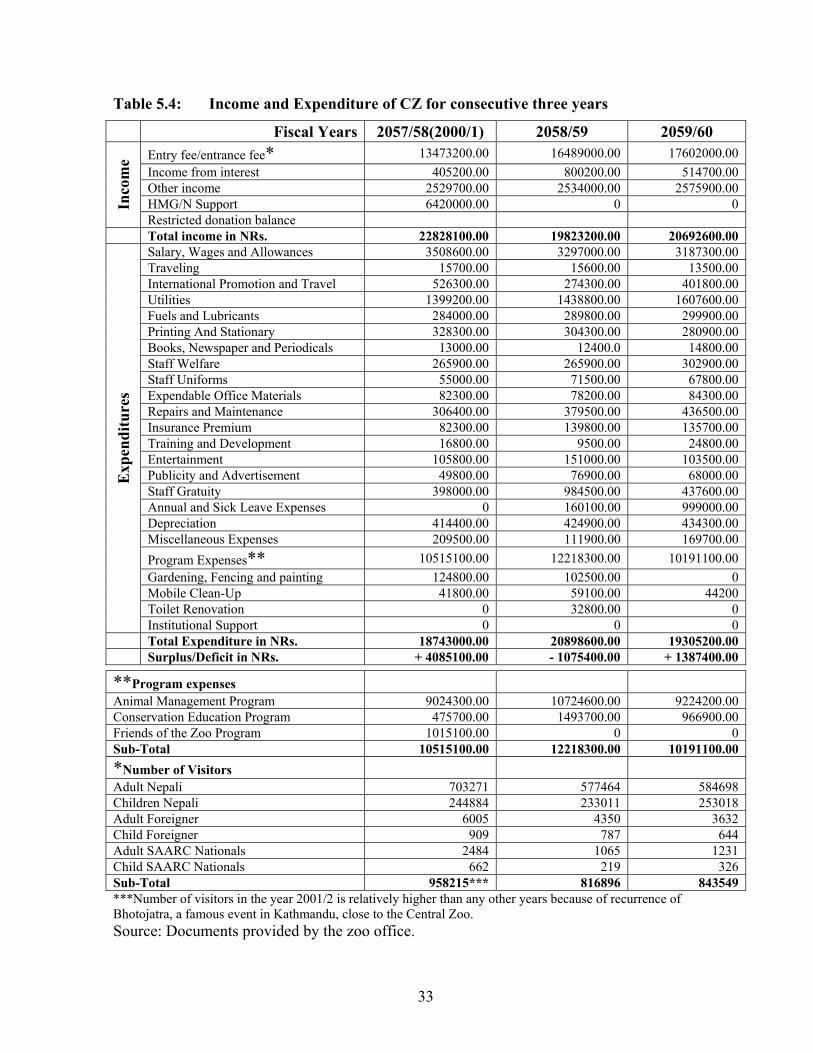
The annual cash flow of the Central Zoo is given in table 5.4. Considering the estimates of the
year 2001-2003, the annual operating cost of the zoo is about NRs. 19,6489,33. More than one-
fifth of the budget goes to the salary of the staff. More than one-half of the budget is allocated to
the ongoing programs including conservation education program, animal management program
and the programs of Friends of the Zoo (FOZ). The Central Zoo generates about NRs. 20 million
annually from the entry fee alone.
Bhotojatra is the peak event for the zoo as well, because it receives the maximum number of
visitors ranging from 25,000 to 30,000 (more the 12 times of daily average). Other peak times for
zoo visitors includes the Nepalese New Year, every Friday and Saturday. Being a part of the
national economy and politics the zoo is not apart from national events. Rainy days and different
types of political strikes have highly affected the number of zoo visitors falling in number up to
2000. Natural systems are also limiting factors for the zoo visitors. Table 5.5 gives a glimpse of
such events and estimated number of visitors in the zoo.
33
Table 5.4: Income and Expenditure of CZ for consecutive three years
Fiscal Years 2057/58(2000/1) 2058/59 2059/60 Entry fee/entrance fee* 13473200.00 16489000.00 17602000.00 Income from interest 405200.00 800200.00 514700.00 Other income 2529700.00 2534000.00 2575900.00 HMG/N Support 6420000.00 0 0 In
com
e
Restricted donation balance Total income in NRs. 22828100.00 19823200.00 20692600.00
Salary, Wages and Allowances 3508600.00 3297000.00 3187300.00 Traveling 15700.00 15600.00 13500.00 International Promotion and Travel 526300.00 274300.00 401800.00 Utilities 1399200.00 1438800.00 1607600.00 Fuels and Lubricants 284000.00 289800.00 299900.00 Printing And Stationary 328300.00 304300.00 280900.00 Books, Newspaper and Periodicals 13000.00 12400.0 14800.00 Staff Welfare 265900.00 265900.00 302900.00 Staff Uniforms 55000.00 71500.00 67800.00 Expendable Office Materials 82300.00 78200.00 84300.00 Repairs and Maintenance 306400.00 379500.00 436500.00 Insurance Premium 82300.00 139800.00 135700.00 Training and Development 16800.00 9500.00 24800.00 Entertainment 105800.00 151000.00 103500.00 Publicity and Advertisement 49800.00 76900.00 68000.00 Staff Gratuity 398000.00 984500.00 437600.00 Annual and Sick Leave Expenses 0 160100.00 999000.00 Depreciation 414400.00 424900.00 434300.00 Miscellaneous Expenses 209500.00 111900.00 169700.00 Program Expenses** 10515100.00 12218300.00 10191100.00 Gardening, Fencing and painting 124800.00 102500.00 0 Mobile Clean-Up 41800.00 59100.00 44200 Toilet Renovation 0 32800.00 0
Exp
endi
ture
s
Institutional Support 0 0 0 Total Expenditure in NRs. 18743000.00 20898600.00 19305200.00 Surplus/Deficit in NRs. + 4085100.00 - 1075400.00 + 1387400.00
***Number of visitors in the year 2001/2 is relatively higher than any other years because of recurrence of Bhotojatra, a famous event in Kathmandu, close to the Central Zoo. Source: Documents provided by the zoo office.
**Program expenses
Animal Management Program 9024300.00 10724600.00 9224200.00 Conservation Education Program 475700.00 1493700.00 966900.00 Friends of the Zoo Program 1015100.00 0 0 Sub-Total 10515100.00 12218300.00 10191100.00 *Number of Visitors
Table 5.5: Estimated number of visitors in special Events
Event Days Visitors flow range Saturday (Maximum in a week) 4000 – 6000 Normal 1800 – 2200 New Year 12000 – 17000 Bhotojatra 25000 – 30000 Nepal Band and Chakkajaam and Strikes* 500 – 1200 Whole rainy day 400 – 800 Average visitors no. per day for survey week 2423 (Source: Based on interview with zoo staff)
5.2. Nature and structure of the visitors
The Sampling of zoo visitors was held in the month of April 2004. A summary of the visitors in
the sampling week is given in table 5.6. It is seen that number of nationals other than Nepali
(especially from India and non-SAARC countries) is negligible, whereas no visitors were
observed from SAARC countries excluding India and Nepal.
Table 5.6: Number of Visitors during sampling week
Source: Based on Zoo records and interview with zoo staff.
Visitors were asked to list a maximum of 10 most liked creatures of the zoo. Findings show that
the tiger, hippopotamus and ostrich are three major attractions of the zoo. Peacock, bear,
pheasants, fishes in the aquarium etc are other mentionable popular features inside the zoo.
Figure 5.1 shows details of the findings.
* Nepal Band is a political strike in which all the economic activities like industries, transportation, schools and colleges, offices etc. are forced to close by the organizers. Chakkajaam is relatively light step of strike in which transportation in closed.
SN Type of Ticket Apr. 2 Apr. 3 Apr. 4 Apr. 5 Apr. 6 Apr. 7 Apr. 8 1 Nepali Adult 1731 1304 2110 0 1024 862 1249 2 Nepali Children 1027 634 1149 0 353 308 448 Nepalese Total 2758 1938 3259 0 1377 1170 1697 3 Foreign Adult 22 27 21 0 12 20 36 4 Foreign Children 6 16 5 0 0 1 14 5 SAARC Adult 3 1 0 0 0 2 0 6 SAARC Children 4 0 0 0 0 0 0 Other’s Total 35 34 26 0 12 23 50
35
Visotor's ranking of zoo features
58
53
47
42 4240
37
2926 26
2420
17 1613
0
10
20
30
40
50
60
70Ti
ger
Hip
popo
tam
us
Ost
rich
Chi
mpa
njee
Peac
ock
Rhi
no
Elep
hant
Dan
fe (I
mpe
yeon
Phea
sant
)
Fish
es (A
quar
ium
)
Bear
Leop
ard
Pyt
hon
Bird
s
Dee
r
Cro
codi
le
Features
Ran
k by
vis
itors
Figure 5.1: Visitors ranking of Zoo features
Table 5.7: Visitor’s mode of Transport
Transport Frequency Percent Discussion Bus and taxi 1 0.9Car 1 0.9Private vehicle 1 0.9Bus and on foot 2 1.7Microbus and Taxi
Less than 10% visitors use private vehicles including motorcycle whereas about 80% of visitor’s mode of transport is public vehicle and about 9% of visitors are not using any vehicle. It clearly reflects the economic status of the visitors. It also shows easier availability of buses, microbuses, tempos and other public vehicles in respective routes.
Considering the middle and low income group as those, whose monthly income is less than NRs. 5,000. More than 70% visitors are from these groups. It is also due to a higher proportion of students with relatively less or no income.
Regression between Number of Visit and Monthly Income: Y=A+BX Where, Number of sample=116 Y=Number of Visits (dependent variable), X=Monthly Income (Independent variable) A is constant and B is Regression Coefficients
Model Summary R R Square Adjusted R Square Std. Error of the Estimate
0.496 0.246 0.057 11.6939
ANOVA Model Sum of Squares df Mean Square F p-value
Model Coefficient Std. Error t Sig. Constant (A) 22.844 5.678 4.023 .016
Monthly Income (B) -1.560E-04 .000 -1.142 .317 The value of coefficient of determination and the p-value was found to be 0.057, indicating a weak relationship between the number of visits and monthly income.
Figure 5.2: Number of Nepalese Visitors and growth trends for last decade
† Figure of Fiscal year 2061/62 covers visitors for first five months only (July 18 to November 23 2004)).
38
Table 5.10: Frequency Table of Sex and Caste of the visitors
Table 5.11: Peoples WTP as an entry fee if zoo improves its services
Choices Count % Discussion
No change 49 42.24
Reduce entry fee 31 26.72
Increase entry fee 36 31.03
Total 116 100
About 69% visitors are not willing to pay higher prices for services provided by the zoo. Out of them 27% visitors suggested zoo management to reduce entry fee, whereas other 42% accepted present entry fee is suitable. About one third of the total zoo visitors (most of them are belonging to age group 15-24), suggested to increase entry fee, at least along with improvement in present services and the facilities provided by the zoo.
Sex Count % Discussion Male 93 80.2 Female 23 19.8
Direct observation shows that the proportion of male to female is about 3:2. This figure obtained from questionnaire survey is different because many female visitors rejected to participate.
There is high proportion of Brahmin and Chhetri visitors in the zoo because of their higher population in the country (about 40%). About 20% visitors are from Newar society because of their remarkable presence in all the cities of Kathmandu Valley (Kathmandu, Kirtipur, Lalitpur and Bhaktpur). There is remarkable presence of Janajati; most of them are working as laborers in Kathmandu. There are limited visitors from the dalit society, who are supposed to be economically weak. It may be due to their engagement as labor most of time. Number of international tourists is limited due to less exposure of the zoo in media and less facilities which are not sufficient to meet their expectations.
39
Table 5.12: Frequency tables for Major purpose of visit, Occupation and Direct association with environment related organizations
Major Purposes of the Visit Count % Discussion Animals, boating 1 0.9Entertainment, for family 1 0.9Entertainment, to visit friends 1 0.9Environment 1 0.9For children, time pass, educational
1 0.9
For peaceful environment, animals and birds
1 0.9
Fun, friend and holiday 1 0.9Peace 1 0.9Picnic, educational 1 0.9Social welfare, for children 1 0.9Time pass, study 1 0.9Trekking, cultural, time pass 1 0.9Boating and elephant riding 3 2.6Visiting friends 3 2.6Conservation education 4 3.4Entertainment, for children 4 3.4For children 9 7.8Entertainment 12 10.3For family members 13 11.2Time pass 13 11.2No thing special 21 18.1Animals and birds 22 19.0
Total 116 100
About 21% visitors in the zoo come to watch birds and animals, who are especially people, from rural areas. About 36% visitors were found to be in the zoo without any special purposes. Most of them were young couples, and their unexplained purpose was dating. It is mainly due to lack of greenery and romantic places in the town. Simply they are using the zoo as dating place because it is safe, relatively cheap (in comparison to expensive restaurants) and there is flexible limit of time. There is remarkable presence of people who are visiting zoo to entertain their children and other family members or relatives. There are limited visitors who are really visiting for conservation education except school children. Greenery, peaceful environment, elephant riding and boating are other popular features in the zoo.
There is limited presence of tourism professionals. Students are the dominant group in terms of Zoo visit. Job holders and labor workers are also utilizing zoo as a good “time pass station”. Especially on Friday and Saturday school children and teachers accounts about 30% of total visit, for picnic and conservation education.
Direct association with environmental organizations Choice Count % Discussion Yes 8 6.9 No 108 93.1 Total 116 100
This study reveals that there is no relation between the total visit and direct association with Environment related organizations (In case of school children direct association is ignored).
40
Table 5.13: Categorization of Zoo visitors according to age group
Table 5.14: Educational Level of the Zoo visitors
Table 5.15: Preferred season to visit Zoo
Preferred Season Count % Discussion Spring and Autumn 1 0.9Spring and Summer 1 0.9Spring and Winter 3 2.6Autumn 5 4.3No comment 6 5.2Summer 11 9.5Winter 15 12.9Spring 74 63.8Total 116 100
When visitors were asked to suggest for optimum season to visit the zoo, about 65% of them answered spring. 5.2% answered that they have no idea, about 10% suggested winter and second largest group (about 14%) recommended winter as suitable season to visit the zoo. Notable number of visitors suggested summer as suitable season to visit the zoo.
Age Group
Count % Discussion
0-14 1 0.9 15-24 55 47.4 25-59 57 49.1 60+ 3 2.6
Excluding children directly from schools, there is a small number of visitors below 14 years of age. Few of them are with their parents. There is relatively less proportion of elderly people. The dominant visitor age group is 15-24 years.
School children for picnic and other function of School
There are remarkable visitors from school and few of them are members of “friends of the Zoo”, a conservation education based program conducted by the zoo.
Years of Education Count Discussion 0 (Illiterate) 51 13 34 35 36 17 28 49 510 26School Children in School functions
Remarkable
11 412 2913 614 515 616 817 5
Increasing or decreasing years of education don’t show any direct relationship with the number of visits. School children have extensive presence in the zoo. Other groups with higher number of visit in the zoo include students of class 12 and class 10. But they rarely visit zoo for educational purpose and education is not the key factor behind their visit. Another cause for large visits of students (certificate level) also shows social transformation, mainly changes in the mode of life and their higher preferences for recreational sites.
41
Table 5.16: Level of Satisfaction
Table 5.17: Area of improvement for Zoo suggested by the visitors (language edited)
Develop system of guides to inform people about Zoo features 2 Improve visitors hospitality, make staff friendly 2 Put suggestion box 2 Add updated information board 3 Don’t ignore the situation of decrease in number of animals 3 Develop monitoring mechanism to clean the zoo 5 Add sport facilities for children 7 Take care of animal health 7 Manage lighting systems during evening 8 Reduce the prices at the canteen 9 Increase greenery by gardening 15 Relocate the zoo 16 Increase area of the Zoo, cages are narrow and congested and may have problem of aeration
19
Increase resting places for the visitors 19 Improve drinking water facility 21 Add toilet facilities 27 Reduce entry fee 31 Develop efficient waste management mechanism 31 Control bad smelling 34 Add more animals and birds with complete representation 57 Reduce pollution levels and improve sanitation status in cages 103 Visitors were requested to share their dislikes in the Zoo and suggest ideas to improve zoo
facilities to meet their expected level of satisfaction in the next visit. Nearly all visitors worried
about water pollution in the pond and in the cage of Hippopotamus. About 50% of them
suggested adding more animals and birds (if possible complete representation of biodiversity).
One-fourth of them worried on present system of waste management (burning), and more than
25% disagreed with the present entry fee. They suggested reducing the entry fee, but few visitors
favored increase in the entry fee to manage zoo facilities. Few of them raised their voice to
increase the area of the zoo or to relocate it. They believed that being limited to a small area,
Visitors, when requested to comment on level of satisfaction in present visit, about 91% replied that they are satisfied but are expecting further development in the Zoo. About 9% visitors were not satisfied with environmental hygiene present in the Zoo.
42
Frequency of visit by the visitors
36
17
9
43
1 1 1 1
3 3
1 1
35
0
5
10
15
20
25
30
35
40
1 2 3 4 5 6 7 8 10 12 24 36 48 Rare
Number of visits
Cou
nt
cages are small and even closer to each other and there is danger of disease spreading. However,
the zoo authorities claim that there is no disease prone situation in the zoo and the cages look like
dirty since it is desirable to make them natural. A detailed list is given in Table 5.16.
As more than one-fourth of the visitors complained about entry fee, visitors were asked to
suggest possible sources of fund for the Zoo. More than 40% of them suggested looking for
donations and about 22% suggested asking the government for financial support as listed in table
5.18.
Table 5.18: Visitors suggestions to raise funds for sustainable management of the Zoo
Suggested sources Count % Don’t know 27 23.3 Donation 47 40.5 Government Support 25 21.6 Income generating activities 9 7.8 Increase entry fee 8 6.9 Total 116 100 Visitors were inquired to estimate the number of annual visits to the zoo. More than one-fourth of
them were rare visitors of the zoo, whereas about 46% of them were visiting the zoo annually
once or twice. There were few notable visitors visiting the zoo more than 12 times. They were
either using the zoo as their dating place, or they were member of the FOZ. Few visitors were
visiting the Zoo frequently, because they are getting free entry. A graphic presentation is given in
figure 5.3.
Figure 5.3: Frequency of the Visits
43
Actual Visit and Travel Cost
0
20
40
60
80
100
1 2 3 4 5
Zone (in difference of 50 NM)
Perc
enta
ge c
alcu
late
d
Actual Visit %Travel Cost %
Regression model between Actual visits and Travel cost: Y=A+BX Where, Number of cases=13 Y=Actual Visits (dependent variable), X=Travel Cost (Independent variable) A is constant and B is Regression Coefficients.
Model Summary R R Square Adjusted R Square Std. Error of the Estimate 0.984 0.969 0.937 237.5914
ANOVA
Model Sum of Squares df Mean Square F Sig. Regression 1745633.011 1 1745633.011 30.924 0.0993Residual 56449.655 1 56449.655 Total 1802082.667 2 Model Coefficient Std. Error t Sig. Constant (A) 1867.511 257.805 7.244 0.087TC (B) -3.138 0.564 -5.561 0.113 The adjusted value of the coefficient of determination (0.937) clearly shows that the actual number of visits significantly depends on the travel cost and the low p-value (0.0993) implies the rejection of null hypothesis.
Figure 5.4: Bar diagram showing travel cost and actual visits for different zones
44
5.3. Economic value of the Zoo For the analysis to identify economic value of the zoo, information related to the Nepalese
national only was considered. Because presence of international tourists is negligible and hence
may truncate other values obtained from the majority of the population.
Observed number of visit: 116
Total number of visit = 14,342
Multiplying factor is calculated as ((14342/7)/116) = 17.66256158
Real data for each zone is produced by multiplying the observed data and the above calculated
multiplying factor. Considering the total travel cost, Shadow pricing of time spent during the zoo
visit, other expenses during zoo visit and entry fee. Per capita Economic value of the zoo is NRs.
226.286 or US $ 3.15. (1 US Dollar = NRs. 71.74, as December 12, 2004).
Average number of Visit per Day = 1800
Total number of Visit per Year = 843,549 (Reference to 2002-03)
Yearly revenue from entry fee =NRs. 20,692,600 (Reference to 2002-03)
Yearly willingness to pay by consumers based on this study = NRs. 1,908,83,329.014 (US $
2,660,766).
Yearly willingness to pay by consumers for the features and services per hectare of land in the
Zoo;
=NRs. 31,813,888.169
45
Table 5.19 shows people’s willingness to pay for different recreational sites. American and
Australian cases show higher WTP in comparison to South Asian examples. It is mainly due to
vast difference in economic status of the people and their preferences to visit such recreational
sites. This can be explained with reference to the Human Development Index (HDI) 2002, as
listed in Human Development Report (HDR) 2004 (UNDP 2004). It has calculated HDI as 0.946
for Australia, 0.939 for USA, 0.509 for Bangladesh and 0.504 for Nepal. Higher budget allocated
for recreational purpose in developed countries is also influenced by their mode of life and
matured status of tourism in those countries. In developing countries like Nepal and Bangladesh,
recreation is an optional issue and this activity receives less preference. The proportion of
recreational sites and neighboring urban areas also affects the WTP for such visits.
Results form Dhaka Zoological Garden and Central Zoo, Kathmandu are quite comparable. The
result for the Central Zoo is higher because of consideration of shadow pricing of time spent
during Zoo visit. Otherwise the result for Dhaka Zoological Garden may be higher.
Table 5.19: Comparative Table of TCM results from around the world (After Shammin 1998)
Location References Results in US $
Warrumbungle National Park, NSW, Australia
Ulph & Reynolds, 1981 $200
Green Island Queensland, Australia Economic Associates Australia, 1983 $29 Grapians State Forest, Melbourne, Australia
Graig, 1977 $3
Gerringgong-Gerroa, NSW, Australia James, 1993 $104 Hiking in Colorado, USA Sorg & Loomis, 1984 & Young 1991 $23 Backpacking in Oregon, USA Sorg & Loomis, 1984 & Young 1991 $133 Rivers of Rocky Mountains, Colorado, USA
• About 800,000 visitors visit the Central Zoo annually generating about NRs. 20,692,600
as revenue from entry fees. Bhotojatra, Nepalese New year day, every Saturday, Sunday
are the peak hours and Nepal band, Chakkajaam, strikes and rainy days usually hit the zoo
severely. Spring is the most popular season for Zoo visit followed by winter and summer
respectively.
• Being located in the heart of the valley, the zoo has excellent access of transportation
facilities and most popular mode of transport includes City bus, Tempo, Microbus etc.
• In terms of actual number of visit and frequency of visit, the dominant groups are school
children, adults and visitors belonging to middle or low levels of income.
• Due to lack of greenery and peaceful and safe areas elsewhere and also because of
expensive restaurants, popularity of the Zoo is growing among the adults of 15 to 24
years. The Zoo is also increasing its recognition as a picnic site but limited facilities are
available and may cross the carrying capacity..
• The number of foreign visitors is small and they are not satisfied with the limited zoo
facilities. Local visitors are also worried about poor environmental hygiene inside the zoo.
Most of the respondents suggested for addition of new species in the zoo, extension of the
zoo and recovery of environmental hygiene.
• The number of male visitors is higher than female. Brahmin and Chhetri alone account for
about 46% of the Zoo visit followed by the Newar community.
• Level of education and visitor’s direct association with environment related organizations
is not significant to define the number and nature of the visits.
47
6.2. Recommendation
The Zoo has great potential as a holiday and recreational site and is a safe place for young
couples. Very recently the zoo has released few of antelopes in the forest of Pashupati area. The
zoo is getting success to increase conservation awareness through its conservation platform
Friends of the Zoo (FOZ). The Assistant Curator of the zoo informed that the zoo is planning to
increase recreational facilities for children very soon. Dramatic change in the Zoo is not likely
possible however. It needs immediate action for its improvement and sustainable development.
The zoo is also planning to add and replace few animals and birds.
• The entry fee to the zoo may be raised to NRs. 15 to 20 for students while keeping
unchanged for school children and others. This would immediately generate enough
additional revenue to cover the operating and maintenance expenses of the zoo. This
study suggests that people would be willing to pay a much higher price for the zoo, if it
could maintain environmental hygiene in the zoo premises.
• Since visitors to the zoo come from a variety of income groups, the zoo may consider
developing several levels of service with progressively higher fees. The simplest option is
to allow the visitor a self guided tour. The next level may include a briefing at the
information center with a documentary on the zoo that will help the visitors make a better
plan. At the third level, the package may include a fully guided tour along with
refreshments. The idea is to cater to the needs of the visitors of differing socioeconomic
and cultural backgrounds. This way, it could generate more funds for the zoo.
• In Addition to animal manure, wastes inside the zoo include remains of fruits and food
materials, plastic, papers etc. sold in the shop inside the zoo and the market close to zoo
entrance gate. Hence following the “polluters to pay principle”, zoo may introduce
nominal taxes for these market stalls. The funds thus generated should be allocated to
improve the environmental quality of the zoo, maintenance and renovation to enhance the
quality of its facilities as mentioned in table 5.17.
• Light systems in the zoo should be improved for evenings and the zoo opening hours
should be increased. An alternate system to clean the zoo is promptly needed and Monday
should be open for zoo visitors.
• Zoo should increase required facilities and develop monitoring mechanism, to regulate
picnic and other gatherings inside the zoo, keeping harmony to natural environment
48
• Unhealthy or lean animals and birds should be immediately treated or replaced. The Zoo
should add more animals and birds in few empty cages (observed during direct
observation). Special care should be given to most liked animals and birds as listed in
figure 5.1.
• Finally, information in this study on willingness to pay, composition of visitors by
income, mode of transportation used, and features of attraction should be used in the
national budget, in preparing development plans for the zoo, in identifying areas of
weaknesses, and in assessing the benefits derived from the Central Zoo.
6.3. Recommendation for further study
There are various issues yet to be explored in economic valuation in Nepal. Few of them are as
follows;
• A large-scale survey could generate more and important issues for the zoo management.
• Different issues related to green accounting on micro areas by applying Willingness to
pay (WTP) and Willingness to Accept (WTA) in various sectors such as water supply
schemes, solid waste management, forest management, protected area management, river
ecosystems, lakes and ponds and other issues of urbanization and tourism destinations.
• Impact measurement of pollution, deforestation, loss of biodiversity, global warming and
other environmental degradation.
• Trade, environment and public debt.
• Environmental fiscal policy.
• Issues of Intellectual property Right (IPR) and Trade Related Intellectual Property Rights
(TRIP).
• Measurement of loss and benefits at ecosystem level, like impacts of water pollution in
particular species of a fish, loss of endangered species etc, with the application of
econometric tools.
49
References
Adhikari, B., (2003), “Property Rights and Natural Resources: Socio-Economic Heterogeneity and Distributional Implication of Common Property Resource Management in Nepal”, South Asian Network for Development and Environmental Economics, Kathmandu, Nepal.
Adhikary, A. P., Bhandari, B., Pyakuryal, B., (1998), “Environmental Economics in Nepal”, IUCN Nepal, pp 42-61, 62-65.
Ahmed, Q.K., Nishat, A., Haque, E., Rahman, A., and Chowdhury, Q. I. (Eds), (1999), “Environmental Economics in Bangladesh”, IUCN and AGAB, Dhaka, Bangladesh, pp. 16.
Australian Government Publishing Service (1995), “Techniques to Value Environmental Resources: An Introductory Handbook”, Australian Government Publishing Service, Australia.
Barbier, E. B., Acreman, M. and Knowler, D., (1997), “Economic valuation of wetlands: a guide for policy makers and planners”, Ramsar Convention Bureau, Gland, Switzerland.
Bhattarai, B. N., (2003), “A Macro-econometric analysis of Nepal’s environmental degradation”, Unpublished Dissertation for the Masters Degree in Environmental Management, Pokhara University.
Bhattarai, B. N., (2004), “Socio-economic Valuation of Nepalese Wetlands”, Published in A Journal of Environment, Ministry of Population and Environment, Nepal, Vol. 8, No. 9, pp. 66-76).
Bishop, R. C. and Heberlein, T., (1979), “Measuring Value of Extra Market Goods: Are Indirect Methods Bias”, American Journal of Agricultural Economics, Vol. 61, No. 5, pp. 926-930.
Budhathoki, P., (1992), “Deforestation in Nepal: Cause and Consequence”, Unpublished Dissertation for the Masters Degree, University College of North Wales, UK.
CBS, (2002), “Statistical Pocket Book”, Central Bureau of Statistics, Ramshahpath, Kathmandu, Nepal.
Cesario, F. and Knetsch, J. L., (1970), “Time Bias in Recreation Benefits Estimates”, Water Resource Research, Vol. 6, pp. 700-704.
Cesario, F., (1976), “Value of Time in Recreation Benefit Studies”, Land Economics, Vol. 55, pp. 32-41.
Chapagain, D. P., (1984), “Managing Public Lands as Common Property Resources: Village Case Study in Nepal”, Unpublished Dissertation for the Ph D. Degree, University of Wisconsin, Madison, Wisconsin, USA.
50
Chaudhary, R. P., (1998), “Biodiversity in Nepal: Status and Conservation”, S. Devi, Saharanpur (UP), India and Teepress books, Bangkok, Thailand.
Chowdhury, N. T., (1999), “ Willingness to pay for water in Dhaka Slums, A Contingent Valuation Study”, Published in “The Economic Value of the Environment: Cases from South Asia”, Kathmandu, Nepal, pp. 57-69
Dangol, D. R., (2002), “Economic uses of forest resources in western Chitwan, Nepal”, Published in Banko Janakari, Vol. 12, No. 2, November 2002, pp. 56-64.
Department of the Army Corps of Engineers (1999), “Sport fishery use and value on lower snake river reservoirs Phase 1 report part 2: willingness-to-pay and direct expenditures by anglers on the lower snake river reservoirs”, Department of the Army, Corps of Engineers, Walla-Walla District, Washington 99362.
Dhital, K., (2003), “Environmental Economic Methods of Evaluating Protected Area”, Sajana Sangam Dhital 126/29, Sachetanmarg, Bhimsengola, Baneswore, Kathmandu.
Freeman, A. M. III, (1979), “The Benefits of Environmental Improvement: Theory and Practice”, Baltimore: The Johns Hopkins University Press for Resources for the Future.
Gunton T., (1991), “Economic valuation of non-market values for forest land planning”, a report prepared for “The forest resource commission”, Burnaby, B. C.
Hamilton, K., Lutz, E., (July 1996), “Green National Accounts: Policy uses and empirical experience”, The World Bank.
Hanley, N and Spash, C. L., (1993), “Cost-Benefit Analysis and the Environment”, Edward Elgar Publishing, Ltd., London.
Hecht, J. (Ed.), 1999, “The Economic Value of the Environment: Cases from South Asia”, Kathmandu, Nepal, pp. 2-3.
HMGN/MFSC (2002). Nepal Biodiversity Strategy, Ministry of Forests and Soil Conservation, HMG, Nepal
http://www.dnpwc.gov.np (19 September 2004), Department of National Parks & Wildlife Conservation, Babarmahal, Kathmandu, Nepal.
http://www.worldbank.org (2004), “Green accounting” (Date: 2004 July 19)
IUCN (1998), “Economic Values of Protected areas: Guidelines for Protected area management”, IUCN
Kandel, K. R. and Sharma, A. R., (2003), “Economies of Private Trees: Impact on Income Distribution at Badikhel, Lalitpur, Nepal”, Published in Banko Janakari, Vol. 13, No. 2, November 2003, pp. 8-13.
Khalil, S., (1999), “Economic Valuation of the Mangrove Ecosystem, along the Karachi Coastal areas”, Published in “The Economic Value of the Environment: Cases from South Asia”, Kathmandu, Nepal, pp. 25-38
Khan, H, (2004), “Demand for Ecotourism: Estimating Recreational Benefits from the Margalla Hills National Park in Northern Pakistan”, South Asian Network for Development and Environmental Economics, Kathmandu, Nepal
51
King, D.M., Markowitz, J. Kenneth and Mazzotta, M. (Website visited date: June 15 2004), “Ecosystem Valuation”, www.ecosystemvaluation.org/index.html
Lekhak, H. D. and Lekhak, B., (2003), “Natural resource conservation and sustainable development in Nepal”, Kshitiz publication, Kathmandu, Nepal.
Mahat T. J., (2001), “Conservation of Biodiversity in KTWR: Status of Ecotourism” (unpublished case study), Department of Environmental Science, Trichandra Multiple College (TU), Ghantaghar, Kathamndu, Nepal.
Mahat, T. J., (2003), “Glacio-fluvial-lacustrine Geoenvironmental study of the Kalimati formation” (unpublished Case study), Central Department of Environmental Science, Tribhuvan University, Kathmandu, Nepal.
Mahat, T. J., April/May 2004, “Economic Valuation: Managing commons with common efforts”, Editorial published in Green Herald (a monthly magazine published by Central Department of Environmental Science, TU, Kathmandu, Nepal)
Markandya, A., (1992), "The value of the environment: a state of the art survey" In the Earthscan Reader in Environmental Economics, pages 142 – 166. (London: Earthscan Publications Ltd.)
McConnell, K and I. Strand, (1981). “Measuring the cost of time in recreation demand analysis” American Journal of Agricultural Economics, 61:153-156
Miller Junior, G.T. (2002) (12th edition), “Living in the Environment: Principles, Connections and Solutions”, Brooks/Cole, Thomson Learning, USA (P 560).
MoPE (2000), “Nepal’s State of the Environment”, Ministry of Population and Environment, Kathmandu, Nepal.
MoPE (2001), “Nepal’s State of the Environment (Agriculture and Forests)”, Ministry of Population and Environment, Kathmandu, Nepal.
MoPE (2004), “State of the Environment Nepal (Ecotourism)”, Ministry of Population and Environment, Kathmandu.
Shammin, Md. R., (1999), “Application of the travel cost method (TCM): a case study of environmental valuation of Dhaka Zoological garden”, Published in “The Economic Value of the Environment: Cases from South Asia”, Kathmandu, Nepal, pp. 39-56.
SNV, (2003), “Sustainable Tourism Development in Nepal, Vietnam and Lao PDR: Experience of SNV and Partner Organizations”, SNV - Netherlands Development Organization.
Sutherland, R., (1982), “Sensitivity of Travel Cost Estimates of Recreation Demand to the Functional Form and Definition of Origin Zones”, Western Journal of Agricultural Economics Vol. 64, 136-141.
Tiwari, B. N., (1998), “Environmental Economics Initiatives in Nepal”, Tribhuvan University, paper prepared for the Workshop on Environmental Economics Initiatives held on 6 September 1998 in Kathmandu, Nepal.
52
UNDP (2004), “Human Development Report 2004”, Oxford University Press, London.
UNEP (1992), Convention on Biological Diversity, United Nations.
Walsh, R. G., Sanders, L. D., and Loomis, J. B., (1985), “Wild and Scenic River Economics: Recreation use and Preservation Values”, Report to the American Wilderness Alliance.
WCED (1987), “Our Common Future”, oxford University Press, New Delhi.
WIF - Institute of Economic Research, (no date), “Chair of Economics/ Resource Economics”, WIF - Institute of Economic Research, ETH Zurich.
World Bank (1992), “World Development Report 1992”, World Bank
a
Photo Plates
Couples resting near the pond
Obtaining information through questionnaire survey
b
Obtaining information through questionnaire survey
Obtaining information through questionnaire survey
c
Visitor’s queue at drinking water tank
Hippopotamus resting inside the cage
d
Zoo is growing its popularity as a favorite picnic destination among schoolchildren
e
Ostrich in the Central Zoo
Schoolchildren enjoying zoo facilities
f
Major sources of manmade waste pollution inside the zoo
Major sources of manmade waste pollution inside the zoo
May I request you to fill up the questionnaire? This is designed to estimate the visitors demand for “Central Zoo”. This is the part of my M.Sc. dissertation work. I thank you for the cooperation.
Wish the best wishes for happy visit to Nepal. Yours,
Tek Jung Mahat, TU. Please select the appropriate choices in case of multiple choices or specify if necessary. 1. Name (Not compulsory) and caste: 2. Age (in Yrs.): 5-15 15-25 25-40 40-60 Above 60 3. Sex: 4. Nationality and Geography : For e.g. Asia/Nepal/Biratnagar 5. Education (Please fill in the blanks): Class 10-… Class 10+… Class 10+2+… 6. Occupation: 7. Monthly Income in NRs/US $ (use parents income if you do not earn and dependent on
8. Estimated family wealth and number of family members… /… 9. Estimated family expenditure per year............................................................................... 10. What is your major purpose of Zoo visit? 11. List most liked Zoo features, please specify in order;
11.1. …… 11.2. ….... 11.3. …… 11.4. …… 11.5. ……
11.6. …… 11.7. …… 11.8. …… 11.9. …… 11.10. ……
12. What is your mode of transport? Please specify in order along with estimated fare; in US $ or NRs.(For e.g. Taxi (24) +Airplane (200) +Microbus (2))
…………………………………………………………………………………………………..… 13. Type of Visit: Sole on the way If on the way specify the major…………………… 14. Time taken to visit (estimated): 15. Associated with environmental organization? Please specify…………………………… 16. Number of Visits (with reference to appropriate Unit): Monthly Yearly 17. Total expenditure during visit (including Entry fee, Transportation cost, Lodging and Fooding
etc): 18. What is your highest Willingness to Pay as entry fee? ……………. 19. If Escorting School Childs, what is the number of children? 20. In which season do you prefer to visit? 21. Would you like to visit Zoo again, why? 22. If answer is no, why? 23. Do you have suggestion for Zoo management? 24. Which alternate do you suggest zoo management to raise funds for the zoo?
Increase entry fee HMG Support Donations Other
Bus Fare for Important Routes in Nepal (For April 2004)
From To Fare (Night) Fare (Day) Taulihawa 190 Palpa 179 Bhairawa 162 203 Baglung 171 214 Pokhara 126 Besisahar 123 Gorkha 86 Birjang/Kalaiya 164 Dhading 82 So