123
Economic valuation of the British Library January 2013 A report for the British Library Andrew Tessler

Economic valuation of the British Library
January 2013
A report for the British Library
Andrew Tessler

Contents
Executive Summary.................................. ................................................ 1
1 Introduction ....................................... .............................................. 4
2 Methodology and scope.............................. .................................... 5
2.1 Basic approach .......................................................................................... 5 2.2 Total economic evaluation (TEV)............................................................... 7 2.3 Scope: national, and international.............................................................. 8 2.4 Below the line: Multi-criteria analysis ......................................................... 9
3 Costs .............................................. ................................................ 10
3.1 Overview of costs..................................................................................... 10 3.2 Grant in Aid .............................................................................................. 10 3.3 Donations ................................................................................................. 10 3.4 Environmental externalities ...................................................................... 11 3.5 Total costs................................................................................................ 12
4 Revenues ........................................... ............................................ 13
5 Reading Room services .............................. .................................. 14
5.1 Background .............................................................................................. 14 5.2 Survey results .......................................................................................... 15 5.3 Aggregated estimates .............................................................................. 18
6 Document Supply and bibliographic services........................................... ........................................................ 24
7 Web services ....................................... .......................................... 29
7.1 Background .............................................................................................. 29 7.2 Physical users .......................................................................................... 30
7.2.1 Survey results .................................................................................. 30 7.2.2 Physical users - Reading Room users 30 7.2.3 General physical users .................................................................... 31 7.2.4 Unit values for physical users .......................................................... 32 7.2.5 Aggregation for physical users ........................................................ 33
7.3 Non-physical users................................................................................... 34 7.3.1 Approach.......................................................................................... 34

7.3.2 Aggregation for non-physical users 34
7.4 Aggregate estimate .................................................................................. 35
8 UK Research Reserve ................................ ................................... 36
8.1 Background .............................................................................................. 36 8.2 Estimation of benefit................................................................................. 36
9 Exhibitions, events, general visitors and learning ........................................... ........................................................ 39
9.1 Exhibitions and events ............................................................................. 39 9.2 General interest visitors ........................................................................... 43 9.3 Learning ................................................................................................... 44 9.4 Total estimate........................................................................................... 45
10 Non-use value...................................... .......................................... 46
10.1 Background ............................................................................................ 46 10.2 Survey .................................................................................................... 47
11 Benefit cost assessment............................ ................................... 52
11.1 Base evaluation...................................................................................... 52 11.2 Taxpayer focussed and global evaluations ........................................................................................................ 53
12 Multi-criteria analysis ............................ ........................................ 57
13 References......................................... ............................................ 62
Appendix A: Survey forms........................... .......................................... 63

Value of the British Library January 2013
1
Executive Summary
The British Library (‘the Library’) is one of the nation’s – and the world’s great research libraries and is a British and international institution. It contains over 150 million items, with some 1.5 million visitors passing through its main site at St Pancras every year including half a million Reading Room users, holds treasures such as the Magna Carta, Leonardo da Vinci's Notebook and original Beatles manuscripts and has been the centre of learning for generations of writers, business people, philosophers and scholars.
Oxford Economics has been commissioned to undertake an economic evaluation of the British Library. This study is conducted using benefit cost analysis (BCA) within a Total Economic Valuation (TEV) framework. As its name suggests, a BCA compares benefits and costs to determine the economic value a given initiative, such as the Library, brings to society. The TEV framework is one which provides a broad view of the Library’s contribution to society, including the value it provides to both its users and to those who may never use it but nonetheless value its existence.
The approach used is consistent with standard welfare economics approach and is broadly consistent with HM Treasury guidelines as set out in the Green Book (HM Treasury 2003) along with its more recent supplements.
Further, this study also explores the Library’s contribution to global society as well as British society, through use of a parallel global evaluation framework. It also goes beyond conventional BCA and explores a multi-criteria analysis (MCA) to try and capture some of the Library’s non-monetary values.
Key features of the current study include:
� Valuation of the Library’s Reading Rooms at £70 million per annum, including over £20 million for the Business & IP Centre (BIPC).
� The valuation for the first time of the Library’s web services at some £19.5 million per annum.
� Assessment of the value the Library contributes to the Higher Education sector thorough operation of the UK Research Reserve (£5.4 million per annum).
� Evaluation of the value that broader society (non-users) place on the continued existence of the Library – some £413 million per annum.
� Assessment of key non-monetised benefits through an MCA including the finding that Reading Room users value the depth and breadth of the Library’s collections, free access and the Library’s role as a research resource as the Library’s most important features.
As indicated, a centrepiece of this study is its BCA. BCA results for the Library’s value to the UK in the year 2011/12 are indicated in the table below. These
Value of the British Library January 2013
2
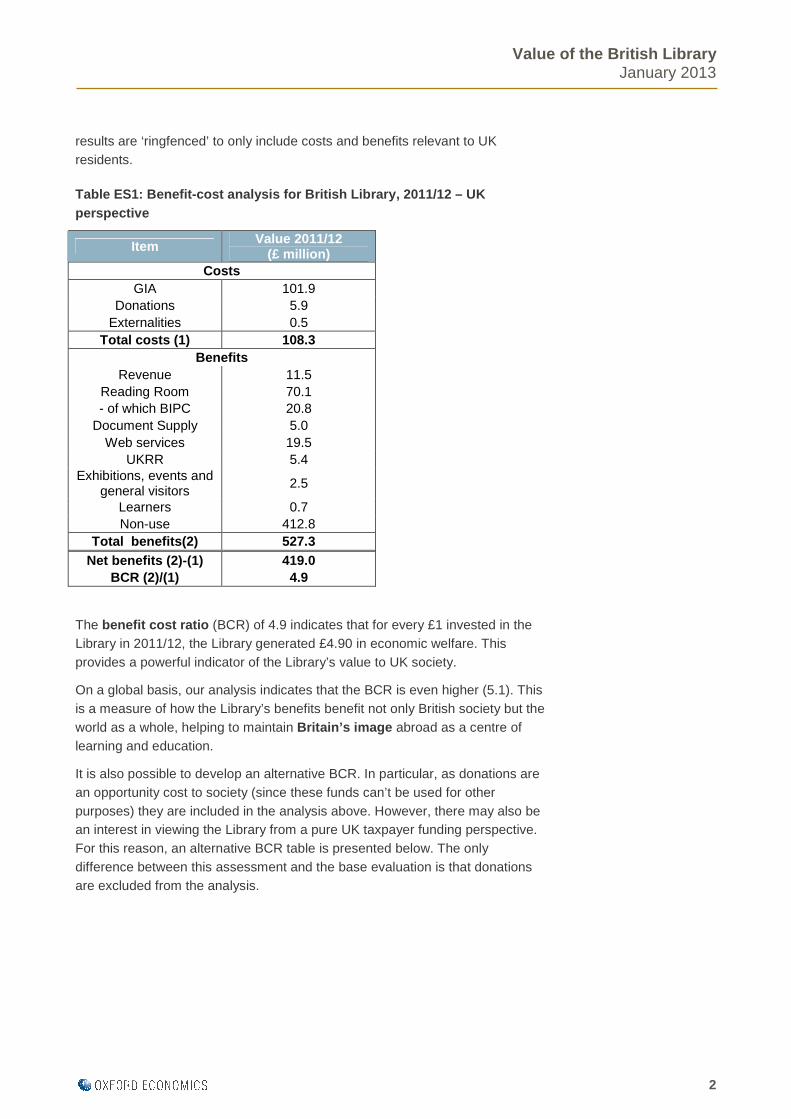
results are ‘ringfenced’ to only include costs and benefits relevant to UK residents.
Table ES1: Benefit-cost analysis for British Librar y, 2011/12 – UK perspective
Item Value 2011/12 (£ million)
Costs GIA 101.9
Donations 5.9 Externalities 0.5
Total costs (1) 108.3 Benefits
Revenue 11.5 Reading Room 70.1 - of which BIPC 20.8
Document Supply 5.0 Web services 19.5
UKRR 5.4 Exhibitions, events and
general visitors 2.5
Learners 0.7 Non-use 412.8
Total benefits(2) 527.3 Net benefits (2)-(1) 419.0
BCR (2)/(1) 4.9
The benefit cost ratio (BCR) of 4.9 indicates that for every £1 invested in the Library in 2011/12, the Library generated £4.90 in economic welfare. This provides a powerful indicator of the Library’s value to UK society.
On a global basis, our analysis indicates that the BCR is even higher (5.1). This is a measure of how the Library’s benefits benefit not only British society but the world as a whole, helping to maintain Britain’s image abroad as a centre of learning and education.
It is also possible to develop an alternative BCR. In particular, as donations are an opportunity cost to society (since these funds can’t be used for other purposes) they are included in the analysis above. However, there may also be an interest in viewing the Library from a pure UK taxpayer funding perspective. For this reason, an alternative BCR table is presented below. The only difference between this assessment and the base evaluation is that donations are excluded from the analysis.

Value of the British Library January 2013
3
Table ES2: Alternative benefit-cost analysis for Br itish Library, 2011/12 (excluding donations)
Item Value 2011/12 (£ million)
GIA 101.9 Externalities 0.5
Total costs (1) 102.4 Revenue 11.5
Reading Room 70.1 - of which BIPC 20.8
Document Supply 5.0 Web services 19.5
UKRR 5.4 Exhibitions, events and
general visitors 2.5
Learners 0.7 Non-use 412.8
Total benefits (2) 527.3 Net benefits (2)-(1) 424.9 Benefit–cost ratio
BCR (2)/(1) 5.1
As indicated in the table above, excluding donations increases the Library’s BCR to 5.1.

Value of the British Library January 2013
4
1 Introduction
The British Library (‘the Library’) is one of the nation’s – and the world’s great research libraries and is a British and international institution. It contains over 150 million items, with some 1.5 million visitors passing through its main site at St Pancras every year including half a million Reading Room users, holds treasures such as the Magna Carta, Leonardo da Vinci's Notebook and original Beatles manuscripts and has been the centre of learning for generations of writers, business people, philosophers and scholars.
Oxford Economics has been commissioned to undertake an economic evaluation of the British Library.
This work follows a previous study by Indepen and Spectrum Consulting: British Library Economic Impact Assessment (’the 2003 report’). However the current study includes examines a number of substantial new areas and issues not explored in that earlier work.
This study is conducted using benefit cost analysis (BCA) within a Total Economic Valuation (TEV) framework.
This study is organised as follows:
� Chapter 2 explores the methodology and scope of this study
� Chapter 3 discusses Library costs
� Chapter 4 examines Library revenues
� Chapter 5 values the Library’s Reading Rooms
� Chapter 6 reviews Document Supply and bibliographic services
� Chapter 7 assesses the Library’s web services
� Chapter 8 values the UK Research Reserve
� Chapter 9 assesses the value the Library has for visitors to its exhibitions, events, to general visitors and to Learners
� Chapter 10 deals with the Library’s non-use value – to those who never visit the facility but nonetheless value it
� Chapter 11 summarises the benefit-cost results
� Chapter 12 undertakes a multi-criteria analysis of Library attributes
� Appendix 1 provides a copy of the survey forms used in this report

Value of the British Library January 2013
5
2 Methodology and scope
2.1 Basic approach
This study provides an assessment of the value of the Library using benefit cost analysis (BCA) within a welfare economics framework.
As its name suggests, BCA involves comparing the benefits of a given project or initiative with the costs of that project or initiative.
On the cost side, operating the Library involves society incurring opportunity costs. Funds used to support the Library constitute resources that society could put to alternative uses – in areas such as defence, welfare, health, policing or education. (Incidentally, the same is true of any other activity – e.g. money spent on policing also constitutes an opportunity cost.)
On the benefit side, the Library provides a centre of learning, applied research and enjoyment to groups such as academics, commercial and higher education entities, business people, personal researchers and members of the general public through services such as its Reading Rooms, Document Supply services, website, events and exhibitions and educational services. The value that these groups place on the Library should reflect society’s overall valuation of the Library. The Library also earns commercial revenues through its activities and these form an additional source of value.
Dividing the Library’s benefits by its costs allows for the estimation of a benefit cost ratio (BCR). This reflects the Library’s value to society in relation to the investment in it. In this case, this report estimates a BCR for a one year period based on data from the 2011/12 financial year (i.e. 1 April 2011 to 31 March 2012)1.
More formally, the approach used is consistent with a standard welfare economics approach and is broadly consistent with HM Treasury guidelines as set out in the Green Book (HM Treasury 2003) along with its more recent supplements.
1 Data on costs and revenues reflect results for the 2011/12 financial year, as provided in the Library’s Annual Report 2011/12 (British Library (2012a). Other data such as surveys referred to in this report, were undertaken over the period April to August 2012 but are taken to provide a broad reflection of social values and preferences during the 2011/12 financial year.
Note that BCAs in other major investment projects (e.g. transport and infrastructure) are often made over a lengthy time period (e.g. 30 years), however ‘up front’ costs (e.g. construction costs) in such cases often occur over only a few years. In this case calculating a stream of years would add little value and involve considerable speculation about future funding flows and benefits. A more parsimonious approach is to estimate values for the most recent financial year just ended.

Value of the British Library January 2013
6
It is important to note that social welfare is comprised of both ‘consumer surplus’ and “producer surplus” (along with any ‘externalities’ (non-market effects of an initiative which are not borne by those who generate them).
The producer surplus (roughly, profit before allowing for fixed costs) is the difference between the price received by suppliers (the price line at price P in Figure 2.1 below) and the minimum price at which they would have been willing to sell commodities, i.e. the supply curve in Figure 2.1. This represents the benefit to be derived from the sale of the good (such as books), and is captured by the shaded blue area between the price line, at price P, and the supply curve in Figure 2.1 below2.
The consumer surplus represents the difference between what consumers pay and the maximum price they would be willing to pay for a commodity (the demand curve). For example, someone may pay £10 for a book but enjoy it so much that they would have been willing to pay £15 for it. The consumer surplus is £5. Perhaps a second customer also faces a price of £10 but is only willing to pay £12 for it – her consumer surplus is £2. The orange shaded area between the price line and the demand curve in Figure 2.1 below represents the sum of all these individual consumer surpluses – i.e. the total consumer surplus.
Adding up the changes in producer and consumer surpluses from some new initiative, along with any relevant externalities, gives the net total benefit to society as a whole from that initiative.
Actual modelling of these areas is much more complex in practice, given different starting points and assumptions on the respective demand and supply curves and the shape of these curves.
Figure 2.1: Consumer and producer surplus
2 As discussed below, as a government subsidised entity in practice the Library does not make a profit. Nonetheless, it is important to allow for revenues earned by the Library as these also form a source of value.
Price (£s)
Quantity0
Producer surplus
Consumer surplus
Demand
Supply
Q
P

Value of the British Library January 2013
7
2.2 Total economic evaluation (TEV)
The above approach is often employed when estimating the value of commodities traded in markets (e.g. the sale of books). However, when assessing the value of cultural or environmental assets, the standard welfare framework described above can be broadened somewhat. Accordingly this study adopts a Total Economic Valuation (TEV) approach to estimating the value of the Library. The approach adopted is also suggested in O’Brien (2010) Measuring the value of culture.
While a TEV also aims to measure the sum of the producer surplus and consumer surplus (i.e. how much users and non-users benefit from the existence of the Library) it takes into account both market-traded commodities and non-traded values. So, the value of the Library’s sales is incorporated within a TEV but so too are non-traded values such as value which users place on the Reading Rooms which are free at the point of entry and the value which people who don’t even use the Library place on its existence.
As illustrated in Figure 2.2, a TEV approach takes into account both ‘use values’ and ‘non-use’ (or passive) values in assessing the benefits of the Library. These values can be summarised as follows:
� Use values – These include direct market-based values such as revenues from areas such as Document Supply, Library merchandising and paid exhibitions. The also include how much users of the Library’s services (e.g. Reading Rooms, web services) value them even though they do not actually have to pay for them. All of these form a type of consumer surplus3.
� Non use values – These are the values held by people who may never use the Library but nonetheless value its presence. They include option value (the option of one day using the Library), existence value (the fact the Library exists even though the person may never use it) and bequest value (the concept that the Library represents a store of knowledge to be passed to future generations).
A breakdown of the Library services analysed in this report using a TEV approach is provided in Figure 2.2 below.
3 There are various ways of assessing such use values. A variety of methods are explored in the chapters below. However, as indicated in the relevant chapters, a replacement cost measure is used to assess value in respect of the Reading Rooms and of the Document Supply service.

Value of the British Library January 2013
8
Figure 2.2: Total Economic Value (TEV)
2.3 Scope: national, and international
In theory a BCA relates to the costs and benefits of an initiative as they affect the world as a whole. However, in many cases, BCAs are ‘ring-fenced’ around a particular jurisdiction (such as the UK). In such cases only benefits to the people (consumer surplus) and entities (producer surplus) within a given jurisdiction should be considered in the context of assessing costs and benefits. The included people and entities form what is known as ‘the population of standing’.
In the case of this report, a key issue is on the costs and benefits which the Library provides to UK society as a whole. Accordingly, this analysis conducts a BCA from a UK standpoint.
However it also recognises that the Library provides benefits to people outside the UK, such as readers from overseas who use the Reading Room and web services users from outside the UK. A global assessment might also be of interest to policymakers due to the fact that services such as the Library form an important part of Britain’s ‘soft power’ – essentially the appeal a society might have to the rest of the world4. Britain’s cultural and historic heritage and its institutions are among its most appealing features to overseas visitors. The Library acts as a powerful signal of Britain as a centre of learning and education. To the extent that overseas users know of - and can access - Library services, this signal is enhanced.
Therefore a separate set of figures is presented through this analysis, valuing the Library on a global basis.
4 For example the BBC World Service is often cited as a source of British soft power – see for example http://www.theyworkforyou.com/whall/?id=2012-02-01b.325.0
Value of the British Library January 2013
9
2.4 Below the line: Multi-criteria analysis
Wherever possible, this report seeks to derive monetised values within a welfare framework. However, not everything can be monetised. While BCA remains an important decision-making tool, multi-criteria analysis (MCA) provides a useful non-monetary (or ’below the line’) supplement.
In essence, MCA involves assessing the attributes of a given scheme or initiative in terms which are important to defined stakeholders. These attributes typically include those which are absent from a BCA (or at best are only partly assessed through a BCA).
This report includes an MCA in respect of the Library’s Reading Rooms. This acts a supplement to the analysis and helps establish a set of non-monetary criteria on which the Library’s importance to its users can be assessed.

Value of the British Library January 2013
10
3 Costs
3.1 Overview of costs
The Library’s operations involve society incurring what economists term “opportunity costs”. Funds (whether from taxpayers or voluntary donations) represent resources spent on the Library which cannot be used for other social purposes such as defence, health, education or policing. In other words, in choosing to spend a given amount of money on a service such as the Library via public funding and donations, society is effectively sacrificing the opportunity to spend that same amount of money on other things. So the opportunity costs effectively relate to the value of Library funding in pounds.
In addition, the operation of the Library involves the imposition of social costs on third parties through the release of greenhouse gases and waste disposal. Costs incurred by the Library therefore fall into three categories:
� Grant in Aid (GIA) funding;
� Donations; and
� Environmental externalities
3.2 Grant in Aid
GIA for 2011/12 is provided in the Library’s Annual Report (British Library 2012a). These represent taxpayer-derived funds which are required to support the Library’s continued operations. Both capital and recurrent expenditure is relevant, as both represent opportunity costs and consume resources which could otherwise be deployed elsewhere.
In the 2011/12 financial year the Library received £101.9 million in GIA.
3.3 Donations
As indicated donations also constitute a form of opportunity cost. Although this may appear strange to some, recall that donors are part of society and that, in making donations, donors forgo the ability to deploy those resources for other purposes. From the point of view of society as a whole – which is what an economic valuation such as this one seeks to measure – donations must therefore be considered to be an opportunity cost. It should also be recalled that the benefits which Library users enjoy will in part be funded through such donations. Therefore it is consistent to include donations on the ’cost side’ of the ledger5.
5 Note that revenues are distinct from GIA and donations. Unlike GIA or donations, revenues are generated by actual service provision (e.g. Document

Value of the British Library January 2013
11
Some donations are derived from overseas sources and therefore the figure for UK donations varies from the global figure6. In 2011/12 the Library received an estimated £5.9 million in donations from UK sources and £6.7 million in total donations (including donors from other countries).
It is noted however that, by definition, donations are voluntary and do not form part of what would commonly be called taxpayer contributions. The Library ‘base valuation’ in Chapter 11 includes donations as an opportunity cost. However, because there may be some interest in determining the return that the Library provides to UK taxpayers per se the alternative valuations in that Chapter include the results of a valuation excluding such donations.
3.4 Environmental externalities
In addition to straightforward opportunity costs represented by GIA and donations, the operation of the Library also imposes externalities on society. As defined by the Green Book, externalities (which may be a cost or a benefit) are “non market impacts of an intervention which are not borne by those who generate them”. A typical externality is pollution which, if not fully priced, involves an activity where costs are borne by parties other than the polluter.
In this case there are two forms of externality costs:
� Greenhouse gasses; and
� Waste.
The quantity of greenhouse gas emissions for 2011/12 are provided in British Library (2012a). These amounted to 20,900 tonnes of CO2e in 2011/12 and arose from the Library’s use of non-renewable electricity, gas and gas-oil.
The cost of these emissions can be established by reference to the carbon prices for 2012 set out in DECC (2011a). This publication provides externality costs for electricity (£14 per tonne), gas and oil (both £54 tonne)7. Applying the reported proportions of electricity, gas and oil used to generate the Library’s
Supply) and reflect the benefits of such provision to the Library rather than an opportunity cost. They therefore appear on the benefits side of the ledger.
6 In effect, overseas donors forgo the opportunity to contribute to society outside the UK. So if the BCA is ringfenced around the UK then it should only include UK-sourced donations. A global BCA, however, includes donations regardless of the source.
7 Note that these prices were consistent with DECC (2011b) definitions, which would place electricity in the (ETS) trade sector and gas and oil in the non-traded sector.

Value of the British Library January 2013
12
CO2 emissions, produces a figure of £0.54 million in greenhouse gas externality costs8.
The Annual Report also provides figures for waste in 2011/12. This amounted to 2,600 tonnes excluding waste which was recycled or incinerated with energy recovery. 2,510 tonnes of this total comprised of construction waste to landfill. An average landfill waste cost of £2.35 per tonne was estimated based on DEFRA (2003)9.
This allowed for an estimate of £6,107 in waste costs (2,600t*£2.35).
3.5 Total costs
The table below indicates the total economic costs associated with the operation of the Library. Note global costs incorporate UK costs (even though items like GIA are sourced purely from the UK) since they represent costs borne by global society as a whole.
Table 3.1: Costs in 2011/12 (£ million)
8 For example, British Library (2012a) indicates that 33.3 million kWh (or 73%) of the Library’s energy consumption comprised of non-renewable electricity. So, 73%*20,900t*£14 ~ £0.21 million. Allowing for the residual 27% of power generated by gas and gas-oil produced an estimate of the total greenhouse gas externality.
9 This figure was derived by averaging the high and low estimates of landfill costs reported by DEFRA (2003) and indexing these to inflation since 2003.
Item UK Global GIA 101.9 101.9
Donations 5.9 6.7 Externalities 0.5 0.5
Total 108.3 109.2

Value of the British Library January 2013
13
4 Revenues
In assessing the total benefits that the Library provides to society it is important to allow for the revenues it generates through its services.
In technical terms, the fact that the Library charges users for certain services (e.g. Document Supply, some exhibitions and events) means that consumer surplus is lower than would otherwise be the case. For example, if Document Supply services were to be free of charge, consumption of such services would increase (everything else being equal) and the consumer surplus associated with such services would be larger (while revenues would be zero).
Conversely, the fact that the Library does indeed charge for Document Supply services means that some of the economic benefit associated with this service is transferred from consumers to the Library in the form of revenues. In effect it could be said that revenues have ‘captured’ some of this erstwhile consumer surplus. The same is true of other services. Revenues must therefore be accounted for in any assessment of total economic value10.
Assessment of the revenue benefits is relatively straightforward. British Library (2012a) provides details on revenues earned both within the UK and outside it. Consultation with Library Finance and Corporate Services staff indicated that a small amount of events revenue was excluded from the reported totals as it constitutes a ‘non-priced service’. This has been added into the calculation of revenues. Conversely, because this is an economic appraisal (as opposed to a financial one) and concerned with real resource flows, investment income has not been included in the calculation of revenues. These adjustments make only minor changes to the final calculation of revenues.
The table below indicates revenues on both a UK ‘ringfenced’ and global basis.
Table 4.1: Revenues in 2011/12 (£ million)
10 Note that account must be taken of revenues even though the Library does not realise an overall ‘producer surplus’ in the conventional sense - i.e. does not turn a profit (excluding fixed costs) across all its activities. The principle remains the same - revenues earned by the Library represent a form of economic benefit and must be accounted for when assessing the Library’s total economic value.
Item UK Global Provision of services 11.4 19.9
Events 0.05 0.09 Total 11.5 20.0
Value of the British Library January 2013
14
5 Reading Room services
5.1 Background
The Library’s Reading Rooms form its most celebrated centrepiece. They consist of facilities at the Library’s main site (St Pancras) , where 11 separate Reading Rooms are located, as well as a Newspaper Reading Room located at Colindale (North London) and a small additional facility at Boston Spa in Yorkshire.
The Library has also recently seen the development of the Business & IP Centre (BIPC) as one of its St Pancras Reading Rooms. The BIPC was launched in March 2006 and supports entrepreneurs, inventors and small businesses. It offers free access to a comprehensive collection of business and intellectual property databases and publications, including general start-up advice, information on funding sources, market research, company data, business news and information on patents, trade marks, registered designs and copyright. It also supports workshops, events and advice sessions aimed at supporting business.
Some 511,044 trips (from both UK and overseas residents) were made to the Library’s Reading Rooms in 2011/12 of which 486,832 (95%) were to the St Pancras site, 21,025 (4%) to Colindale and 3,187 (1%) to Boston Spa11.
In 2011/12 a monthly average of some 117,995 people held British Library Reading Room Passes, of whom 100,651 (i.e. 85%) were from the UK12.
As indicated above, establishing the value which services such as the Reading Rooms provide to society involves estimating the consumer surplus associated with such services.
The 2003 report undertook survey work to establish the value of this consumer surplus and a similar approach has been adopted for the current study, based on that past study13.
Survey work took place in June 2012. As a part of this, a web-based survey was placed on areas of the Library’s website accessed by Reading Room users. In
11 Data received through Communications Team, British Library 22/5/12.
12 Based on data received through Communications Team, British Library 18/5/12. Note that readers in Colindale do not necessarily have Reading Room Passes but rather may hold Newspaper Reader Passes. Boston Spa users are not required to hold Passes.
13 Note however that the 2003 work undertook 229 face to face interviews. Resourcing limits meant that this was not possible for the current study. Instead, both web-based and hard copy surveys were used. The 2003 questionnaire was used as the basic template for the current work, though a number of updates and modifications were made to it to reflect current issues.

Value of the British Library January 2013
15
addition, a hard copy version of this survey was distributed in the Library’s Reading Rooms at all of its three sites. Both UK residents and overseas residents were surveyed.
Respondents were asked a series of questions which sought to measure consumer surplus using a variety of measures. These included using the following approaches:
� Willingness to pay (WTP) – Respondents were asked about the maximum amount they would be willing to pay to support the continuation of the Library’s Reading Room services.
� Willingness to accept (WTA) – Respondents were asked about the minimum amount they would be willing to accept in return for no longer being able to access the Library’s Reading Room services. This was done by asking how much they would accept in return for selling their Library Pass.
� Incremental replacement cost – Respondents were asked about the additional costs they would face if they were forced to use alternatives to the Library’s Reading Rooms14.
A variety of other demographic, travel and usage data were also gathered, along with questions about how readers valued the Library in qualitative terms15. Information about the purposes of using the Library was also gathered, including various categories indicating whether the usage was for academic, personal or business purposes and whether respondents used the BIPC.
5.2 Survey results
Some 960 usable results were retrieved from the web-based survey, of which 791 (or 82%) related to UK residents. An additional 1,105 usable responses were retrieved from the hard copy survey, with 86% of respondents being UK residents16. This made for a combined total of 2,065 usable responses, of which 1,742 (84%) were UK residents.
14 More specifically respondents were asked to consider additional transport and accommodation costs, as well as additional costs involved in accessing materials. Respondents were not asked to specify any additional time taken to access materials at an alternative source, so these values are potentially conservative ones.
15 These qualitative valuations were used to develop the multi-criteria analysis described in Chapter 12.
16 This is similar to the known proportion of Reading Room users who are UK residents (85%).
Value of the British Library January 2013
16
Results from the two surveys were then examined and combined to derive average values17. Outliers, which could potentially bias results, were discarded18.
In traditional economic theory WTP and WTA should be identical to each other. For example, a person may be willing to pay a maximum of £10 for a new book. If someone else destroys the book then the purchaser might be expected to ask for £10 in compensation.
However, in practice, WTP is generally significantly lower than WTA. Behavioural economists note that there may be many reasons for this. These include loss aversion (the fact that people may feel more strongly about losses than they do about gains), acquisition bias (the fact that owning an object - or thinking that you have ownership rights to it – means that you attribute a value to it beyond its notional purchase price) and the fact that WTA responses lacks an effective budget constraint.
In contrast, respondents to WTP questions are likely to do so with a budget constraint very much in mind. A difficulty with WTP however may be a form of strategic bias. That is, if, for example, respondents feel that asking questions about charges may be a precursor to an actual introduction of (or increase in) such charges they may understate the amounts they are willing to pay in their answers to surveys. (This is despite the fact that in the case of the current survey, participants were explicitly told that the Library had no plans to introduce charging for the Reading Rooms.)
Replacement cost is related to concepts often explored in related disciplines such as environmental economics. For example, the shoreline protection value of a reef might be valued by assessing the cost of building a replacement barrier.
Survey results for UK respondents are listed in the table below. These (and the other estimates below) reflect combined results for the electronic and hard copy surveys.19
17 Quantitative results from the electronic and hard copy surveys were generally found to be similar.
18 This was done using a standard ‘rule of thumb’ and removing observations more than three standard deviations above the mean. Since data in this and other surveys for this report tended to be positively skewed, only outliers above the mean were removed. Unless otherwise indicated this approach has been adopted for all surveys in this report.
It is acknowledged that this may result in a conservative (i.e. downward) bias in some of the reported results. Nonetheless, the number of outlier observations removed were generally small and it is be preferable to trade off some conservatism for increased reliability.
19 Overseas readers are excluded for illustrative simplicity. As indicated below, the global aggregated estimates below include overseas Reading Room users.
Value of the British Library January 2013
17
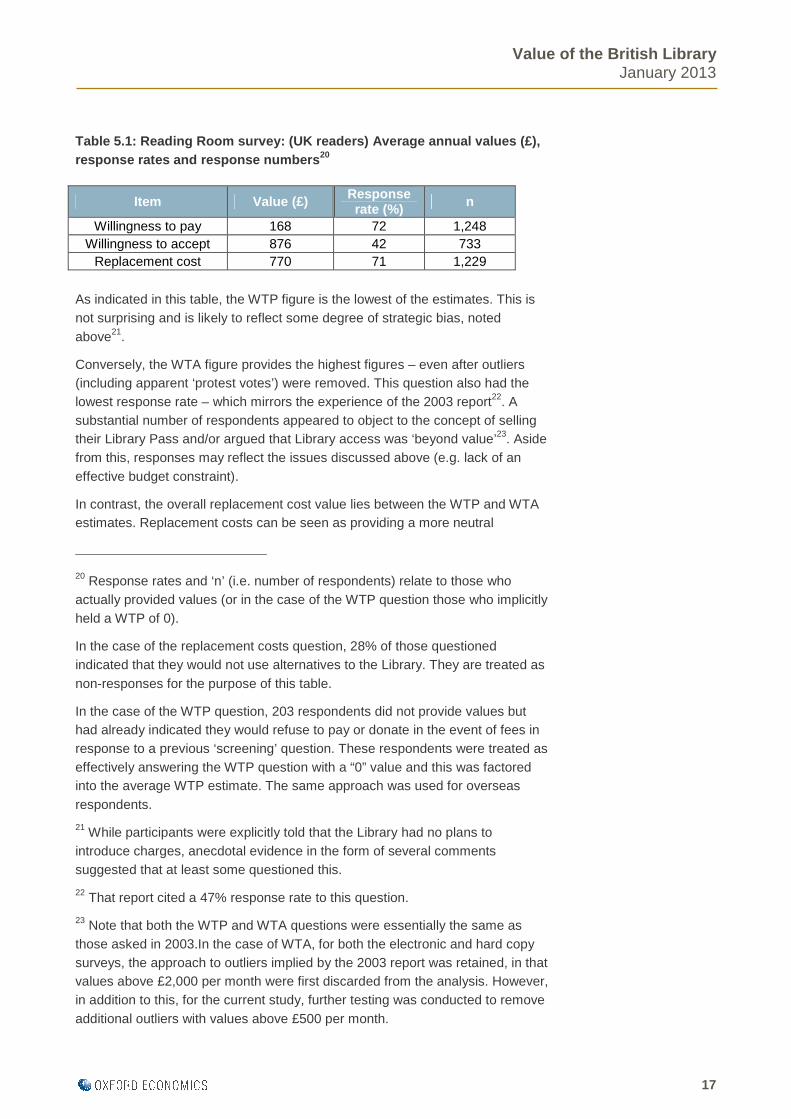
Table 5.1: Reading Room survey: (UK readers) Averag e annual values (£), response rates and response numbers 20
As indicated in this table, the WTP figure is the lowest of the estimates. This is not surprising and is likely to reflect some degree of strategic bias, noted above21.
Conversely, the WTA figure provides the highest figures – even after outliers (including apparent ‘protest votes’) were removed. This question also had the lowest response rate – which mirrors the experience of the 2003 report22. A substantial number of respondents appeared to object to the concept of selling their Library Pass and/or argued that Library access was ‘beyond value’23. Aside from this, responses may reflect the issues discussed above (e.g. lack of an effective budget constraint).
In contrast, the overall replacement cost value lies between the WTP and WTA estimates. Replacement costs can be seen as providing a more neutral
20 Response rates and ‘n’ (i.e. number of respondents) relate to those who actually provided values (or in the case of the WTP question those who implicitly held a WTP of 0).
In the case of the replacement costs question, 28% of those questioned indicated that they would not use alternatives to the Library. They are treated as non-responses for the purpose of this table.
In the case of the WTP question, 203 respondents did not provide values but had already indicated they would refuse to pay or donate in the event of fees in response to a previous ‘screening’ question. These respondents were treated as effectively answering the WTP question with a “0” value and this was factored into the average WTP estimate. The same approach was used for overseas respondents.
21 While participants were explicitly told that the Library had no plans to introduce charges, anecdotal evidence in the form of several comments suggested that at least some questioned this.
22 That report cited a 47% response rate to this question.
23 Note that both the WTP and WTA questions were essentially the same as those asked in 2003.In the case of WTA, for both the electronic and hard copy surveys, the approach to outliers implied by the 2003 report was retained, in that values above £2,000 per month were first discarded from the analysis. However, in addition to this, for the current study, further testing was conducted to remove additional outliers with values above £500 per month.
Item Value (£) Response rate (%) n
Willingness to pay 168 72 1,248 Willingness to accept 876 42 733
Replacement cost 770 71 1,229
Value of the British Library January 2013
18
response to the question of valuation. In essence they constitute additional costs which users believe they are able to avoid due to the existence of the Library. Doing this avoids the potential biases associated with the WTP and WTA approaches.
For this reason a replacement cost approach was adopted as the basis for valuation of the Library’s Reading Rooms24.
Given this, it is possible to further disaggregate the replacement cost values by separating out BIPC users and non-BIPC users. The annual BIPC replacement cost value per person (£1,349) is substantially higher than that for other users (£661) 25.
The replacement cost results for BIPC users may reflect the fact that such users have a commercial focus, with the need to bring concepts and products to market uppermost in their minds. For example, obtaining start-up advice, obtaining focussed market research and getting specific information on funding sources may be expensive undertakings in the world outside the Library. The free provision of Library services which provide an effective ‘one stop shop’ for business research and advice is therefore an important attribute for such users. Conversely, the cost of replacement may reflect the difficulty of pursuing commercially focussed research without the support of the Library.
While the Library also provides a central point for academic and other users, such as authors and family researchers, it is likely that the lower replacement values associated with these users reflect the fact that their research is not pursued with any intention to bring products and concepts directly to market. Accordingly, while accessing other sources would bring its own difficulties for such users, the additional costs of focussing on bringing services to market would be absent.
These issues, and the use of the BIPC values as one indication of the Library’s contribution to innovation, are examined further below.
5.3 Aggregated estimates
As indicated the Library has some 117,995 Reading Room users (of whom 100,651 reside in the UK). Multiplying these figures by the unit WTP and WTA values recorded in the survey allows for the estimation of aggregated WTP and WTA values on both a UK and global basis. This follows the approach adopted in the 2003 report. In addition, the figures were adjusted upward by some 5% to allow for the benefits experienced by Colindale and Boston Spa users.
24 This is in contrast to the 2003 report which adopted WTA as the basis for Reading Room valuation.
25 Formal tests indicate that the difference between the average values of the two UK sub-populations of BIPC users and other users is statistically significant.

Value of the British Library January 2013
19
In grossing up the replacement cost estimates an additional complexity is that the scenario described is somewhat different to that in the WTP and WTA questions, in that users are no longer able to access the Reading Rooms and it is known that a certain proportion of users would not pursue any alternatives. Specifically, some 28% of users indicated that in such a situation they would not experience additional costs as there are no alternatives to the use of the British Library26. These users were excluded from the average values estimated for replacement costs above.
One approach is to infer that such users would share the average values of those who provided estimates for the additional cost of alternative information sources. That is the approach adopted in the 2003 report.
An alternative – and more conservative - approach is to ‘take such users at their word’ and recognise the fact that they would effectively ‘drop out’ of the market for similar library services if they were no longer able to access the British Library. It is known that these users would indeed no longer demand these library services but their unit values are unknown. In such cases, a common approach is to take half the unit values of the group who remain in the market and apply it to these ‘drop outs’27.
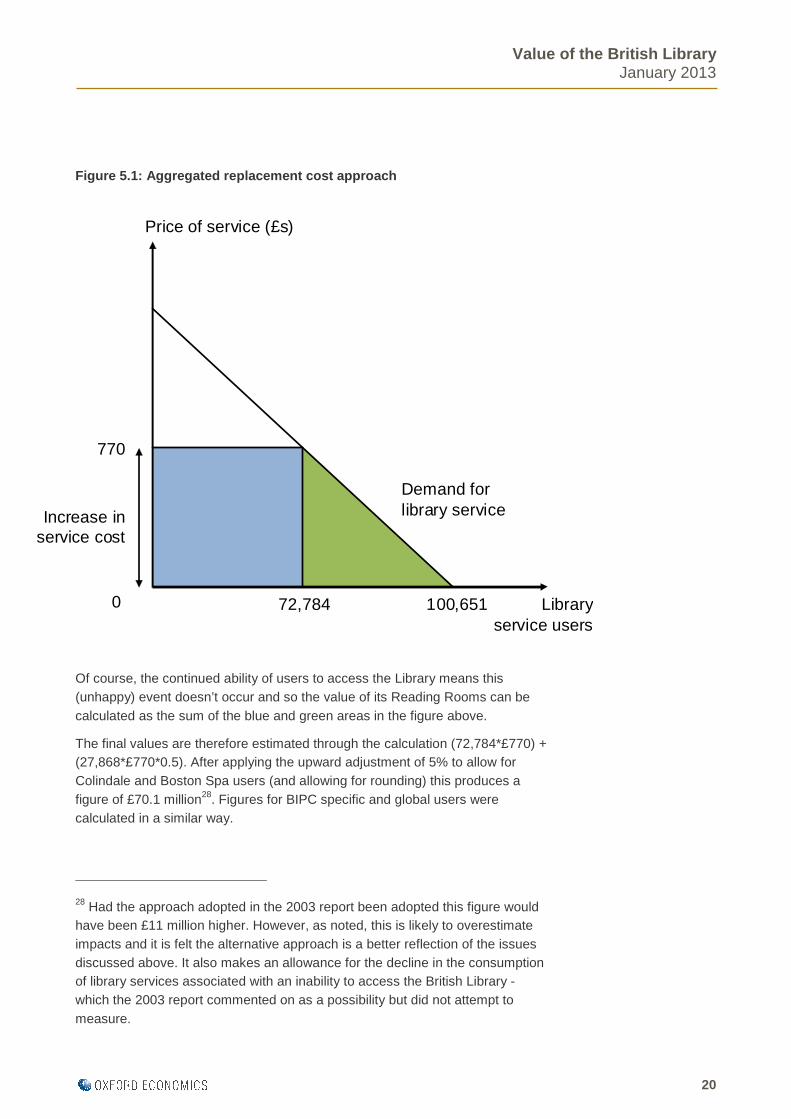
The figure below illustrates the approach. 72,784 UK users (0.72*100,651 ~72,784) would remain “in the market” if they were not able to access the British Library and would face additional library costs of £770 per person. 27,868 users (i.e. 0.28*100,651 ~ 27,868) would leave the market for such library services.
26 The 2003 report recorded an almost identical figure (i.e. 30%).
27 This is often known as the ‘rule of a half’. Another consideration is that only 15% of BIPC users indicated they would be unable to find an alternative information source as opposed to the ‘all user’ average of 28%. Given that BIPC users have higher replacement costs than the average of all users, this also suggests that applying the all user average would produce an overestimate.
Value of the British Library January 2013
20
Figure 5.1: Aggregated replacement cost approach
Of course, the continued ability of users to access the Library means this (unhappy) event doesn’t occur and so the value of its Reading Rooms can be calculated as the sum of the blue and green areas in the figure above.
The final values are therefore estimated through the calculation (72,784*£770) + (27,868*£770*0.5). After applying the upward adjustment of 5% to allow for Colindale and Boston Spa users (and allowing for rounding) this produces a figure of £70.1 million28. Figures for BIPC specific and global users were calculated in a similar way.
28 Had the approach adopted in the 2003 report been adopted this figure would have been £11 million higher. However, as noted, this is likely to overestimate impacts and it is felt the alternative approach is a better reflection of the issues discussed above. It also makes an allowance for the decline in the consumption of library services associated with an inability to access the British Library - which the 2003 report commented on as a possibility but did not attempt to measure.
Price of service (£s)
Library service users
0 72,784 100,651
770
Increase in service cost
Demand for library service

Value of the British Library January 2013
21
Results are indicated in the table below, with the preferred replacement cost valuation approach marked in bold.
A comparison has also been made with values recorded in the 2003 report, in both inflation adjusted and unadjusted terms and in terms of both aggregate and unit vales.
In making the aggregated comparison it should be noted that:
� The 2003 report only relates to UK residents.
� The base number of UK Reading Room users reported in 2003 was 113,000 compared to some 100,651 UK users in 2012. This means the 2012 figures are smaller than would have been the case if the same number of Readers had been used as a gross up. The same is true for the global figures.
� The replacement cost gross up methodology used in 2012 is more conservative than that in 2003. This also has the effect of making the replacement cost figures smaller (by some £11 million) than would be the case if a more liberal interpretation was used, as in 2003.
� The results of the St Pancras/Boston Spa and Colindale Reading Rooms were reported separately in the 2003 report but are combined here.
� The sample size used for the current report (1,742 UK residents) is substantially larger than that of the 2003 report (229 UK residents).
Table 5.2 Reading Room value: Aggregated comparison s (£ million)
As indicated, it is also possible to compare the inflation adjusted unit values for 2003 with those for 2012. As it relates to values before ‘gross ups’ are applied, this effectively controls for the use of differing base figures and replacement cost methodologies, identified above. This aids comparability across these time periods. This comparison is presented in Table 5.3 below.
Item UK – 2012 UK – 2003 (Inflation
unadjusted)
UK – 2003 (Inflation adjusted)
Global - 2012
Willingness to pay 17.7 13.4 17.0 21.9 Willingness to accept 92.6 34.2 43.4 108.0 Replacement cost 70.1 64.3 81.7 82.7
of which BIPC 20.8 n.a n.a 20.8
Value of the British Library January 2013
22
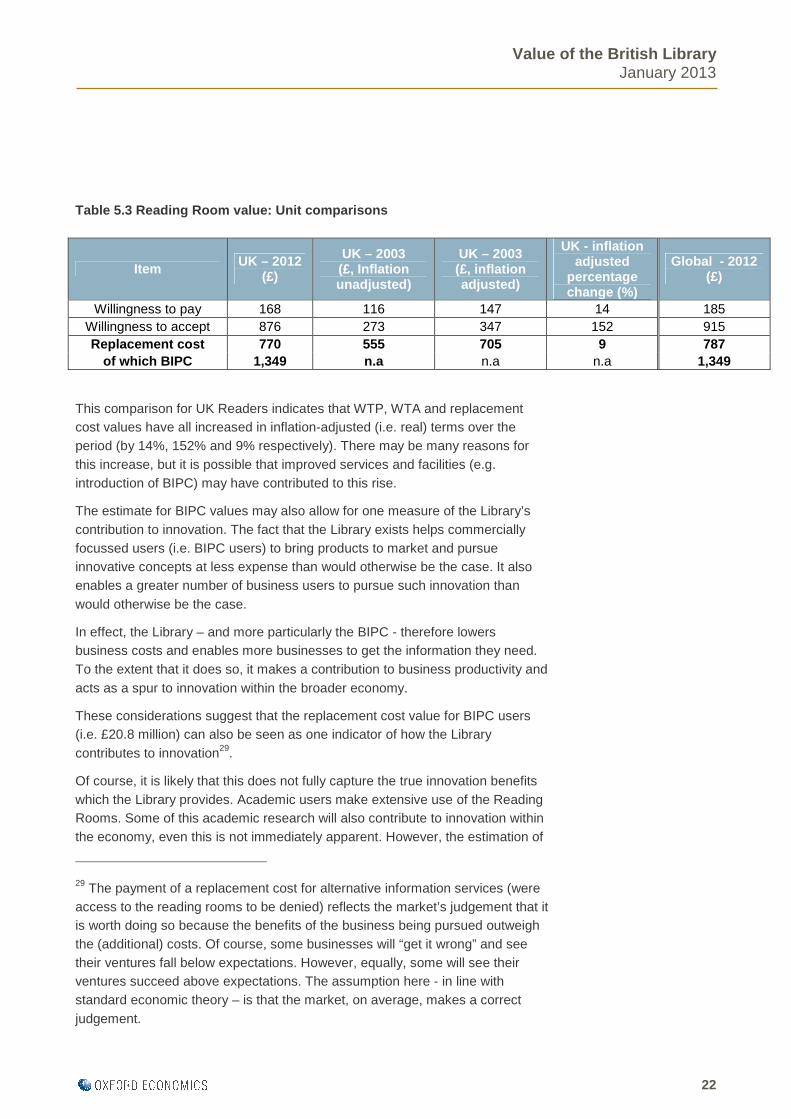
Table 5.3 Reading Room value: Unit comparisons
This comparison for UK Readers indicates that WTP, WTA and replacement cost values have all increased in inflation-adjusted (i.e. real) terms over the period (by 14%, 152% and 9% respectively). There may be many reasons for this increase, but it is possible that improved services and facilities (e.g. introduction of BIPC) may have contributed to this rise.
The estimate for BIPC values may also allow for one measure of the Library’s contribution to innovation. The fact that the Library exists helps commercially focussed users (i.e. BIPC users) to bring products to market and pursue innovative concepts at less expense than would otherwise be the case. It also enables a greater number of business users to pursue such innovation than would otherwise be the case.
In effect, the Library – and more particularly the BIPC - therefore lowers business costs and enables more businesses to get the information they need. To the extent that it does so, it makes a contribution to business productivity and acts as a spur to innovation within the broader economy.
These considerations suggest that the replacement cost value for BIPC users (i.e. £20.8 million) can also be seen as one indicator of how the Library contributes to innovation29.
Of course, it is likely that this does not fully capture the true innovation benefits which the Library provides. Academic users make extensive use of the Reading Rooms. Some of this academic research will also contribute to innovation within the economy, even this is not immediately apparent. However, the estimation of
29 The payment of a replacement cost for alternative information services (were access to the reading rooms to be denied) reflects the market’s judgement that it is worth doing so because the benefits of the business being pursued outweigh the (additional) costs. Of course, some businesses will “get it wrong” and see their ventures fall below expectations. However, equally, some will see their ventures succeed above expectations. The assumption here - in line with standard economic theory – is that the market, on average, makes a correct judgement.
Item UK – 2012 (£)
UK – 2003 (£, Inflation unadjusted)
UK – 2003 (£, inflation adjusted)
UK - inflation adjusted
percentage change (%)
Global - 2012 (£)
Willingness to pay 168 116 147 14 185 Willingness to accept 876 273 347 152 915 Replacement cost 770 555 705 9 787
of which BIPC 1,349 n.a n.a n.a 1,349
Value of the British Library January 2013
23
such longer term effects is challenging and would likely require further study. The £20.8 million figure can therefore be thought of as an “at least” measure of the Library’s contribution to innovation.

Value of the British Library January 2013
24
6 Document Supply and bibliographic services
The Library’s Document Supply and bibliographic services (referred to as ‘Document Supply’ in the rest of this report) enable individuals or organisations to access material from the Library’s collections. Material supplied to customers include copies of documents or loans of specific items.
The Library’s Document Supply services generated a total of £6.7 million in revenue during 2011/12, of which £4.5 million was sourced from UK customers. There are some 4,300 Document Supply customers in total, of which 2,164 are based in the UK.
The revenue impacts of the Document Supply service are incorporated into the revenue estimates in Chapter 3. However, there is also a need to assess the benefit the consumer surplus which the service provides to customers.
The 2003 report undertook survey work to establish this consumer surplus benefit and a similar approach has been adopted for the current study.30
Survey work undertaken for this study involved the dispatch of some 3,000 emails to Document Supply customers in August 2012. Some 223 usable responses were received (i.e. a response rate of approximately 7%), of which 141 were from the UK (i.e. 63%)31.
Respondents were asked a series of questions which sought to measure consumer surplus using a variety of measures. These included:
� Willingness to pay – Respondents were asked about the maximum additional percentage increase (on top of current spending) they would be willing to pay to support the continuation of Document Supply services
� Willingness to accept – Respondents were asked about the minimum amount they would be willing to accept in return for no longer being able to access Document Supply services.
� Incremental replacement cost – Respondents were asked about the additional time and money costs they would face if they were forced to use alternatives to the Library’s Document Supply services
30 Note however that the 2003 work undertook 102 face to face interviews with UK residents (only). This was not possible for the current study where an email/web based response format was used. The 2003 questionnaire was used as the basic template for the current work, though a number of updates and modifications were made to it to reflect current issues. The current survey also included overseas respondents.
31 This is somewhat higher than the actual proportion of Document Supply customers based in the UK (50%).
Value of the British Library January 2013
25
� Change in usage with change in price – Respondents were asked how much their usage would change if Document Supply prices were to increase by 50%. This approach allows for the estimation of the price elasticity of demand (as well as forming another approach for the measurement of consumer surplus)32.
Results were derived for the first three of these measures. In addition, the change in usage results indicate that UK service usage would decline by an average 24% in association with a 50% increase in costs (i.e. a price elasticity of 0.48)33.
Data gathered were examined and outliers removed using the process described above. Average results for UK customers are presented in the table below34. This table is similar to Exhibit 21 in the 2003 report, which allows for some comparison of results, as indicated below. Note, however, that the 2003 results are expressed in their original values, without allowance for inflation. (The £ 2003 values would be roughly 27% higher if expressed in £ 2012.)
32 Price elasticity of demand measures the responsiveness of quantity demanded to price changes. For example a price elasticity with an (absolute) value of 0.1 means that for every 10% increase in prices the quantity demanded falls by 1%.
33 This is slightly higher than the 2003 price elasticity result which suggested a 17% decline in usage for a 50% price increase (or a price elasticity of 0.34). There may be many reasons for this, though one possibility is increased market competition which makes customers more responsive to alternatives.
34 To expand on this, the increase in average WTP spend (10%) multiplied by the average spend per customer in 2011/12 from Library data (£2,091) approximately equals some £200. Likewise, the average time survey respondents said they spent using Document Supply services was 9.54 hours per week so 29% *9.54 ~ 2.7. Average increase in replacement costs is derived by multiplying the average additional replacement cost spend by average spend per customer (i.e. 27% * £2091 ~ £600 (rounded)).

Value of the British Library January 2013
26
Table 6.1: Average results for UK Document Supply c ustomers
* After exclusion of outliers (if any).
** Expressed in hours per day in 2003. The 2003 figure of 0.9 hours per day would
equate to 4.5 hours over a 5-day working week.
The comparison with 2003 values is interesting in that it suggests the value of the service to respondents may have fallen over time, independent of anything else. For example the additional (maximum) percentage over existing costs which respondents are willing to pay for the service has dropped from 22% to 10%. Likewise the WTA value has fallen even before adjusting for inflation.
Compounding this is the fact that, spend per UK customer has declined from approximately £3,500 to £2,091 while the number of UK Document Supply customers in 2012 (2,164) is half that of 2003 (4,262). These facts mean that some of the percentages above are in turn applied to a lower base. For example, the 10% WTP figure is applied to average customer spend of £2,091 to derive the average WTP figure of approximately £200 per entity.
Speculating on the reasons for this is beyond the scope of this report but factors might include increased competition and/or the rise of data provision through the internet.
Item Units Value 2003 value Response rate (%)* n
Average WTP
% by which willing to increase spend % 10% 22% 94% 132
Average WTP £ 000/year 0.2 0.8
Average WTA £ 000/year 5.1 5.6 30% 43
Incremental replacement cost
Average % increase in time for replacement
% 29% 58% 96% 135
- Equivalent time increase for replacement
Hours/week 2.7 **
- Value of time increase for replacement (1) £ 000/year 2.0 2.5
Average % increase in time for replacement
% 27% n.a. 89% 125
- Equivalent value of expenditure increase for
replacement (2) £ 000/year 0.6 1.3
Total (3) = (1) + (2) £ 000/year 2.6 3.8
Usage charge +50%
Average change in usage with 50% price
increase % 24% 17% 99% 139

Value of the British Library January 2013
27
As was the case for the analysis of the Reading Room data, the WTP results are the lowest of those provided. This is consistent with the 2003 report and as was noted at that time, it is likely that strategic decision-making (i.e. concerns about answers being used to introduce fee-paying services) played a role in this.
Conversely the WTA results are likely to reflect the same issues discussed above when considering the Reading Room survey results.
Accordingly, the replacement cost approach is preferred as a measure for assessment.
Nonetheless the grossed up values for all three results are presented below for purposes of comparison. WTP results were derived by multiplying the estimated increase in spending per customer by the number of Document Supply customers. Likewise, the WTA figures were grossed up by multiplying the average WTA response by the number of Document Supply customers35.
The replacement cost estimates were grossed up using a slightly different approach, given that the scenario in question was somewhat different – i.e. one in which Library services were completely withdrawn. This approach was similar to that adopted for Reading Room replacement costs and was as follows:
� Based on the price elasticity results cited above, and the fact that the cessation of Document Supply services would increase total user costs (including time and direct financial costs) by 28% (or £2,569), it was estimated that consumption of such services by former Library users would fall by some 13% if the Library were to cease to offer them.
� The economists ‘rule of a half’ suggests that these users would experience half the unit benefits of the remaining 87% of users.36
35 In both cases an adjustment was made for the number of customers who indicated that they used UK Research Reserve services (roughly 4%). This was to avoid double counting with UKRR values.
36 This approach mirrors the economists ’rule of a half’, as applied to major project investments. See Boardman et al (2005) and BTE (1999).
In reality some of these organisations might seek alternative Document Supply services. However, the results of the elasticity question suggest that there is a group of ‘marginal users’ who place less value on the Library’s Document Supply services than those who would be prepared to accept a price increase. At the same time, absent any price increase, they value the Library’s document services more than substitutes – otherwise they would already be using other services (or not using any services). The rule of a half reflects the welfare loss to this group by effectively attributing half the unit benefits of other users to this group of marginal users.
While somewhat crude, the material affect of this adjustment is relatively small.

Value of the British Library January 2013
28
� An adjustment was also made to allow for potential double counting of UK Research Reserve customers, which left an adjusted total of 2,072 UK customers. Accordingly, the value of Document Supply services on a replacement cost basis was estimated as (87%*£2,569*2,072)+(13%*£2,569*2072*0.5) ~ £5.0 million
The value which overseas Document Supply customers attach to the service was estimated in the same way as that for the UK. The table below summarises these results with the preferred valuation option (replacement cost) marked in bold. Figures are provided on a UK and global basis.
Note that the global values are only slightly larger than the UK ones, despite the fact that half of all Document Supply customers originate from overseas. There are many potential reasons for this (including the fact that overseas spend per customer is lower than equivalent UK spend) but it may also be that overseas customers attach relatively less value to the service due to the presence of local competition and/or rise of alternative information sources.
UK values for 2003 are also presented for purposes of comparison.
Table 6.2: Value of Document Supply services (£ mil lion)
Item UK 2011/12 UK 2003 Global 2011/12 Willingness to pay 0.4 3.3 0.6
Willingness to accept 10.7 24.0 12.4 Replacement cost 5.0 16.6 5.5
Value of the British Library January 2013
29
7 Web services
7.1 Background
The Library’s website (http://www.bl.uk/ ) provides a highly useful resource to its people both within the UK and abroad. Uses to which it is typically put include helping to locate and order items in the Library’s Main Catalogue (‘Explore the British Library’) with its 56 million items, browsing though the Library’s collection of treasures, obtaining information on current or forthcoming events, exhibitions and other attractions, and assisting Learners to obtain information on educational resources. Some 7,073,470 unique hosts (excluding staff users) were recorded on the Library’s website in 2011/1237.
For the purposes of this evaluation, users of the Library’s web services can be divided into two basic types:
� Physical users - Website users who physically travel into the Library. These users might benefit from time savings either due to their usage of the website before attending the Library or during their attendance at the Library. They might also benefit from the fact that using the website saves them the time and expense of trips to the Library which they might otherwise have had to make.
� Non-physical users – These are website users who never travel into the Library. These users would benefit from the fact the website allows them to access resources they could never have otherwise accessed.
Website usage can produce clear cut time and travel benefits for the first group. (Survey results discussed below are dominated by this group.) These benefits are effectively a form of (additional) consumer surplus. When physical users save time in the Library they can spend that time on other activities such as work or leisure. When they save trips to the Library this means that they can experience at least some of the benefits of the Library without actually going there. In effect, the average (or unit) costs of Library usage decline for such users. They are able to get a given amount of Library services at a lower effective cost because the Library’s web services mean they are saving the time and travel costs of getting there.
The key question for this group is: how does the existence of the website save users time and travel costs?
The second of these groups also experiences some of the benefits of Library services. A separate estimate of such user benefits is provided below.
37 Unique hosts served is the best approximation of individual website users.

Value of the British Library January 2013
30
7.2 Physical users
7.2.1 Survey results
In order to assess the benefits of website usage a survey of website users was conducted in June 2012. The survey was posted on the Library’s website. The survey covered all users whether or not they ever physically travelled into the Library. However, it focussed on measuring benefits to physical users and, as indicated below, was dominated by such users.
A wide variety of data on respondents was collected including information relating to their usage of the Library’s website and social media, travel patterns to and from the Library and demographic information. Respondents were also asked about the website services they used (e.g. catalogues, What’s On).
Some 1,412 usable responses were received. UK respondents made up 70% of the total respondents38. The UK results, in turn, were heavily dominated by users of the Library’s catalogue who travelled into the Library. 82% of UK respondents indicated that they physically travelled into the Library at some point, while 86% of those physical visitors were catalogue users.
In essence then, the UK survey results were heavily dominated by those who used the catalogue and travelled into the Library. Combined with the fact that many such users indicated they used the website for academic purposes this suggests that Reading Room users are likely to be the predominant survey respondents.
Overall, 72% of global (i.e. UK plus overseas) respondents indicated they physically travelled into the Library, while 86% of physical users were catalogue users.
Again this suggests that physical users (and Reading Room users in particular) dominated results. For this reason the sub-section below relates to website users identified as Reading Room users.
7.2.2 Physical users - Reading Room users
As indicated the survey results were dominated by Reading Room users. Average values for these users were determined as follows for UK residents:
� As a part of the survey, respondents who made physical use of the Library were asked if they saved any time when they visited the Library as a result of using the Library’s website. They were also asked if the website saved them making visits to the Library and how much an average return trip cost (in terms of fares, other costs and travel time).
38 In contrast, Library data suggests that 51% of browsers originated in the UK, indicating that UK respondents are over-represented in the sample.

Value of the British Library January 2013
31
� Survey respondents were also asked about their annual incomes. An average hourly value of time for respondents (£16.01) was estimated on this basis39.
� The average value of time savings within the Library itself was estimated by multiplying the average time savings reported by users for a typical visit by the average value of time reported above.
� The average unit cost of a trip to the Library was estimated in two steps. First, the average respondent value of time was multiplied by the average time taken per visit to make the trip. Second, this was then combined with respondent data on average fares spent per visit to derive a total travel cost of travel to the Library. Survey responses also allowed for an estimate of the percentage of annual trips saved due to the existence of the website.
The assessment for non-UK residents followed the same procedure as for UK residents in respect of measuring time savings due to use of web services before entering the Library. However no ‘visits saved’ assessment was made for this group40.
7.2.3 General physical users
Based on the survey results, 16% of UK physical users did not make use of the catalogues but nonetheless visited the Library. The majority of these users indicated that they visited the Library for a mix of personal, leisure or other reasons, so they can effectively be distinguished as a broad class of recreational users.
Average values for these users were determined in the same way as for the Reading Room users above. However the value of time for such users was determined based on Department for Transport (DfT) data on the hourly value leisure time (estimated as £4.73 per hour for 2012)41.
39 This figure was based on survey results indicating an average annual income of £25,984 for this sub-group. This was used to derive an hourly value of time (VoT) including a 21.2% uplift as recommended by DfT (2012). This produced a VoT of £17.78 per hour. An adjustment was then made to allow for the 14% of users who indicated they used the catalogues for some family or recreational purpose. These users were assigned a standard non-leisure time value (4.73 per hour) based on DfT (2012). This process produced the average VoT of £16.01.
40 This is because it would seem unlikely that visits to the UK would be dependent on whether or not the Library website was in existence.
41 Based on DfT (2012)

Value of the British Library January 2013
32
Valuation for non-UK residents was undertaken in the same way. However no assessment was made of visits saved.
7.2.4 Unit values for physical users
The average values for UK physical users are summarised in the table below. All units exclude outliers (if any).
Table 7.1: Average values for UK physical website u sers
42 It is interesting to compare this figure to Library staff advice that use of the website for pre-ordering volumes before visiting the Library typically saves some 70 minutes per user.
Item Unit Value Reading Room users
Time savings Average value of time (1) £/hour £16.01
Time saved in Library due to website per visit (2)42
Minutes/person 53.68
Average value of time saving in Library per visit (3) = (1)*(2)/60
£/visit £14.33
Saved trips - Average time taken per return trip
(4) minutes 132
- Average cost of return trip (fares, food, accommodation, other) (5)
£/vest £20.93
Cost of average return trip (6) = ((4)*(1)/60)+(5)
£/visit £56.11
Average annual % of visits saved due to website
% 32%
General physical users Time savings
Average value of time (7) £/hour 4.73 Time saved in Library due to
website per visit (8) Minutes/person 30.57
Average value of time saving in Library per visit (9) = (7)*(8)/60
£/visit 2.41
Saved trips - Average time taken per return trip
(10) minutes 135
- Average cost of return trip (fares, food, accommodation, other) (11)
£/visit 16.53
Cost of average return trip (12) = ((10)*(7)/60)+(11)
£/visit 27.15
Average annual % of visits saved due to website
% 46%
Value of the British Library January 2013
33
7.2.5 Aggregation for physical users
Web usage is increasingly instrumental to usage of the Library for Reading Room users and the survey responses were heavily dominated by catalogue users who physically travelled into the Library. Accordingly for Reading Room users:
� The per visit time savings values above (£14.33) were grossed up by the number of Reading Room visits undertaken to the Library’s three sites in 2011/12 (i.e. 429,777 visits by UK residents and 511,044 on a global basis)43.
� The total cost of saved visits was estimated by multiplying visits per annum (429,777) by average visitor cost (£56.11 from the table above). In order to determine the annual visit cost savings due to web services this figure was then multiplied by the percentage of annual visits saved (32%).
This produced values of £14.0 million in the case of UK users only and £15.8 million globally44.
It is noted that the number of saved trips may imply a level of suppressed demand which could imply additional capital and recurrent savings for the Library not taken into account above.
Figures for general physical users were estimated based on the Reading Room trip numbers and the proportion of physical users who were not catalogue users (i.e. 14% in the case of the UK). This process produced values of £0.9 million for the UK and £1.0 million globally45.
43 Reading Room data supplied by the Library suggests that some 84% of users are UK residents. (The Reading Room survey produces a similar figure.) Given that 511,044 visits were made to the Library’s three sites in 2011/12 this suggests a figure of 429,777 visits by UK residents.
44 Although, in practice, not all trips to the Library would involve needing to use the website, it is equally the case that not all users recorded time savings. Note that users were asked about the savings they would make during a typical trip to the Library. To the extent that some users said that a typical trip would involve 0 time savings due to web usage, this was factored into the results. Moreover even those who provided non-zero values would implicitly experience 0 time savings in some cases and larger values in others – their responses would be included within an average figure.
45 Specifically, since 14% of users were not catalogue users, the UK catalogue visit figures were multiplied by 14% to produce a visitor total of 61,553. An alternative approach is to use MHM (2012) library survey data indicating that some 12% of non-Reading Room users used the website as the primary source of information before visiting the Library. Given approximately 1 million non-Reading Room users per annum and the MHM (2012) finding that 62% of general visitors had a UK origin, this suggests a figure of approximately 72,000.
Value of the British Library January 2013
34
The combined total value of website services for all physical users was £14.9 million for UK residents and £16.7 million globally.
7.3 Non-physical users
7.3.1 Approach
As indicated, non-physical users may also derive a benefit from the website through the fact that they are able to access Library services which they could not access before. This can be seen as a form of induced demand – effectively an increase in consumption of a good associated with an increase in supply. In this case the increase in supply relates to the provision of Library services to people who never come into the Library but are nonetheless able to benefit from its resources (e.g. users viewing online collections, teachers downloading study resource materials). These benefits constitute a form of consumer surplus.
There have been relatively few studies of the consumer surplus associated with the internet. However recent work by McKinsey suggests that the consumer surplus associated with recreational internet services for UK users equates to €20 per person per month (or some £15.87 at current exchange rates)46. This figure can be used in conjunction with the relative proportion of time spent on the Library’s website to derive a consumer surplus value, as indicated below.
7.3.2 Aggregation for non-physical users
Survey data indicated that approximately 5.7% of UK non-physical user recreational internet time was spent on the Library website. Accordingly, this suggests that the monthly consumer surplus for non-physical users attributable to the Library was some £0.90 (i.e. 5.7%*£15.87). Multiplying through by Library data on the number of unique browsers each month (and adjusting the figures to remove physical users above and allow for multiple visits by a given browser over a given year)47 indicates an aggregated value of £9.1 million, of which £4.6 million relates to UK users, given information from the Library that 51% of all browsers are based in the UK48.
46 McKinsey (2011) Internet Matters: The Net’s sweeping impact on jobs, growth and prosperity
47 Estimated physical catalogue browsers were excluded to avoid double counting as was the value of physical non-catalogue browsers. While monthly data records unique numbers of browsers, information supplied through the Digital and Marketing Operations Team on 28 August indicates that the number of average visits per browser over the year as a whole was some 1.7 during the year. Accordingly, values were uplifted by this ratio.
48 Data provided by Digital and Marketing Operations Team, British Library, 31 August 2012.
Value of the British Library January 2013
35
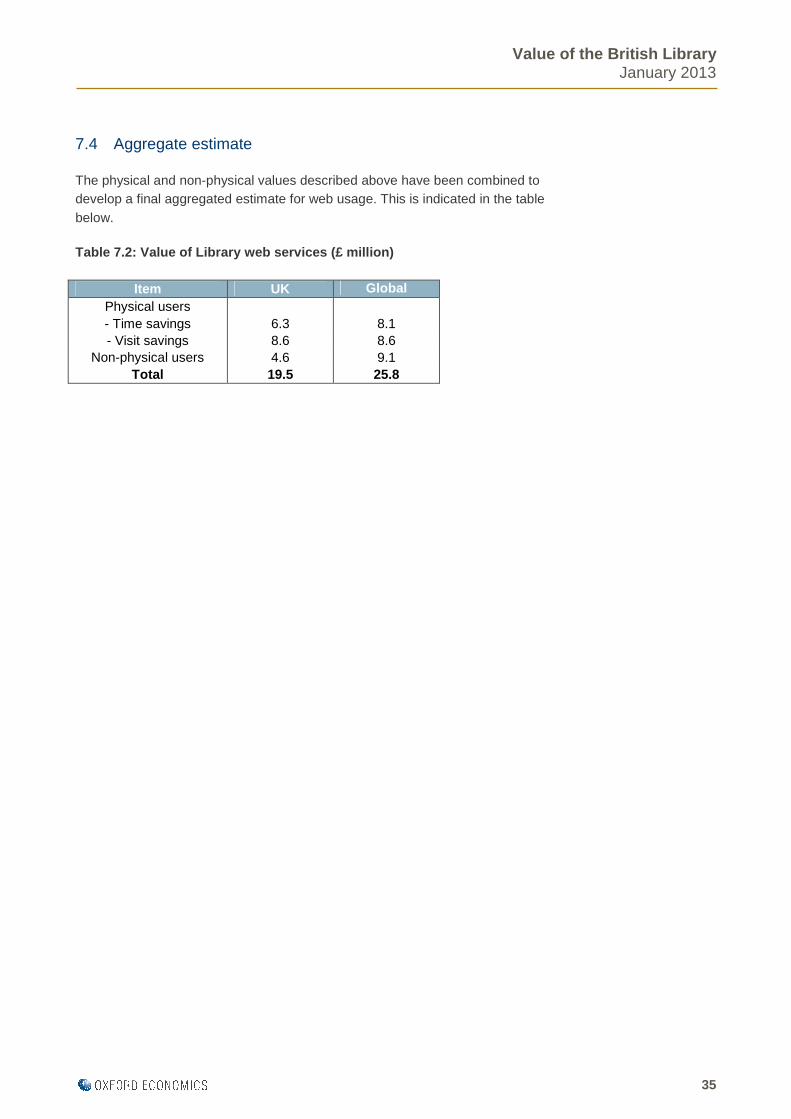
7.4 Aggregate estimate
The physical and non-physical values described above have been combined to develop a final aggregated estimate for web usage. This is indicated in the table below.
Table 7.2: Value of Library web services (£ million )
Item UK Global
Physical users - Time savings 6.3 8.1 - Visit savings 8.6 8.6
Non-physical users 4.6 9.1 Total 19.5 25.8

Value of the British Library January 2013
36
8 UK Research Reserve
8.1 Background
The UK Research Reserve (UKRR) is a collaborative distributed national research collection managed by a partnership between the Higher Education (HE) sector and the British Library. It is aimed at removing duplicate copies of low-use journals and so freeing up space within HE sector libraries.
The scheme commenced in 2007, with a pilot phase (Phase One) running from January 2007 to August 2008. Phase Two commenced in 2009 and is due to run until 2014. Some 29 HE institutions are now members of the scheme49.
Under the scheme, the British Library holds one copy of a low-use journal (the ‘access copy’) while two other copies are retained elsewhere in the HE system. Remaining copies are removed from other HE libraries, freeing up space in those libraries. Freeing up this space has allowed for the development of more study areas, social spaces, PC rooms, and has allowed for the accommodation of other teaching and learner needs. It has also enabled some scheme members to cancel their commercial storage requirements, thereby reducing expenditure.50
In economic terms this represents a benefit. Space occupied by shelving for journal provision is now freed up by UKRR for other purposes (and/or the need to undertake new capital construction to provide educational facilities is averted). So the opportunity cost of providing journals is reduced, even though the journals themselves are still available (via UKRR).
Note that while the British Library incurs (some of) the costs of the UKRR the benefits do not accrue to the British Library per se but to the HE sector/HE students (i.e. UK society outside of the Library itself). In this respect the UKRR represents a positive externality. Just as the negative externalities described in Section 3.4 must be allowed for, so too must positive externalities such as the UKRR51.
8.2 Estimation of benefit
The space savings associated with the UKRR as at June 2012 were reported in British Library (2012b). This work also referred to the earlier work by CHEMS Consulting (2008) which sought to quantify some of the earlier costs and
49 British Library (2012b)
50 Ibid
51 Also note that the costs to the Library of undertaking the UKRR are derived from its GIA and other funding sources and therefore already accounted for elsewhere in this report.

Value of the British Library January 2013
37
benefits brought about by Phase One of the UKRR. The CHEMS work estimated the savings associated with reduced recurrent HE estate management costs due to the UKRR and the capital value of the space released by the UKRR52.
Accordingly, the net benefits of the UKRR for 2011/12 were estimated as follows:
� Recurrent cost savings for Phase 2 were derived by multiplying the amount of freed up shelf space under Phase 2 as at June 2012 (equivalent to 9,249m2)53 by the HE recurrent cost saving per square metre (£191) reported by CHEMS (2008) – i.e. 9,249*£191 ~ £1.8 million.
� Capital cost savings for Phase Two were derived by multiplying the freed shelf space figure by CHEMS (2008) estimate of 2,000 m2 - i.e. 9,249 m2*£2,000 ~ £18.5 million.
� This made a total of £20.3 million since the start of Phase Two in 2009 and June 2012. Adjusting these figures to a monthly basis for the (41) months between the start of Phase Two and multiplying this figure by 12 produces an annual gross benefit of £5.9 million.
� However these gross benefits must be offset somewhat by the costs of disposal to HE institutions. CHEMS (2008) listed these as £11.99 in staff costs per metre of shelf space along with additional disposal costs of £18 per metre. This equates to total disposal costs of £29.99 per metre or £1.8 million since the start of Phase 2. Annualised costs therefore amount to some £0.5 million.
� The net benefits of the UKRR for 2011/12 are therefore estimated as £5.4 million.
The table below indicates the net benefits from the scheme. Note that the UK and global benefits are the same: the scheme provides no additional benefits to institutions outside the UK.
52 As CHEMS (2008) also notes, these ‘savings’ do not necessarily mean that HE institutions spend less in financial terms (though they might due to avoided capital expenditure and reduced storage costs). However as indicated, the key issue from an economic (as opposed to a financial) perspective is that they represent savings in opportunity costs, with resources now being freed up to be applied elsewhere.
53 As cited in British Library (2012b). This figure is derived by dividing the 61,041m of linear shelving freed up by 7 June 2012, under Phase 2, by the CHEMS (2008) estimate that 6.6 linear metres equates to 1 square metre of floor space, i.e. 61,041m/6.6 ~ 9,249 m2.
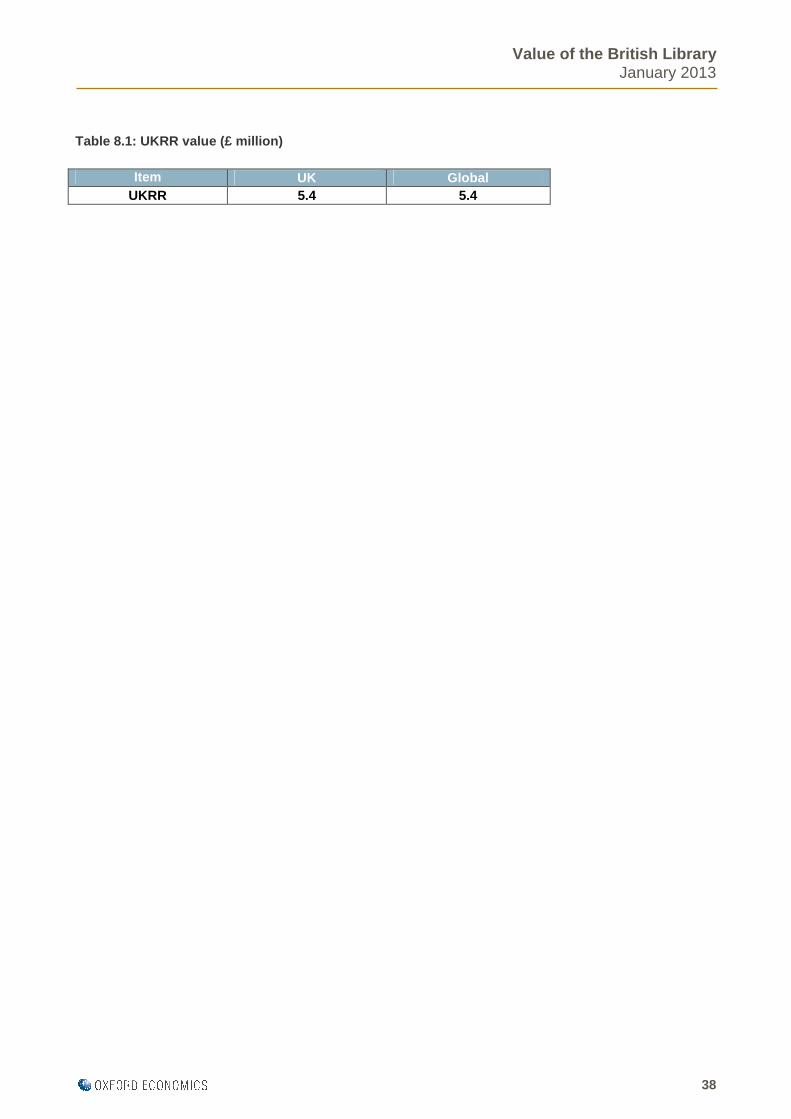
Value of the British Library January 2013
38
Table 8.1: UKRR value (£ million)
Item UK Global UKRR 5.4 5.4

Value of the British Library January 2013
39
9 Exhibitions, events, general visitors and learning
9.1 Exhibitions and events
An important part of the Library’s role is to provide exhibitions and events to the general public. Key exhibitions during 2011/12 included Out of this World and Royal Manuscripts54.
The Library also maintains a permanent exhibition of historical Treasures in its Sir John Ritblat Gallery. This contains over 200 items, including significant works such as the Magna Carta and the Gutenberg Bible, as well as works from Handel and the Beatles. It also holds Shakespeare’s First Folio which attracts a steady stream of visitors. The term ‘exhibition’ in this chapter refers to both temporary exhibitions and permanent displays.
In addition, the Library runs an events programme consisting of talks and functions connected with exhibitions or featuring other topics of interest.
In assessing how to derive the value of exhibitions and events it is again useful to reference the standard demand curve, such as that provided in Figure 9.1 below. With the exception of Royal Manuscripts, the Library’s exhibitions were free of charge to the public in 2011/12, although the Library adopted a policy of charging for exhibitions commencing in November 2011 (British Library (2012a)). A charge is levied for events.
Considering the Library’s free exhibitions in 2011/12 and recalling that consumer surplus is defined as the area above the price line (meaning the entry price in this case is £0), the consumer surplus associated with the Library’s free exhibitions can be represented by the sum of areas 1,2 and 3 in the diagram below.
54 Note that for reasons of illustrative similarity (and given the small overall numbers involved) the figures cited in Sections 9.1 and 9.2 below, relate to all visitors, regardless of whether they resided in the UK or not. MHM (2012) data for the 2011/12 financial year indicates that some 38% of non-Reading Room visitors to the Library were overseas visitors. The consumer surplus enjoyed by overseas visitors will form a part of the global estimate of benefit but for reasons of consistency the UK estimate of benefit must therefore be adjusted downward by 38%. This adjustment does not appear to have been made in the 2003 report.
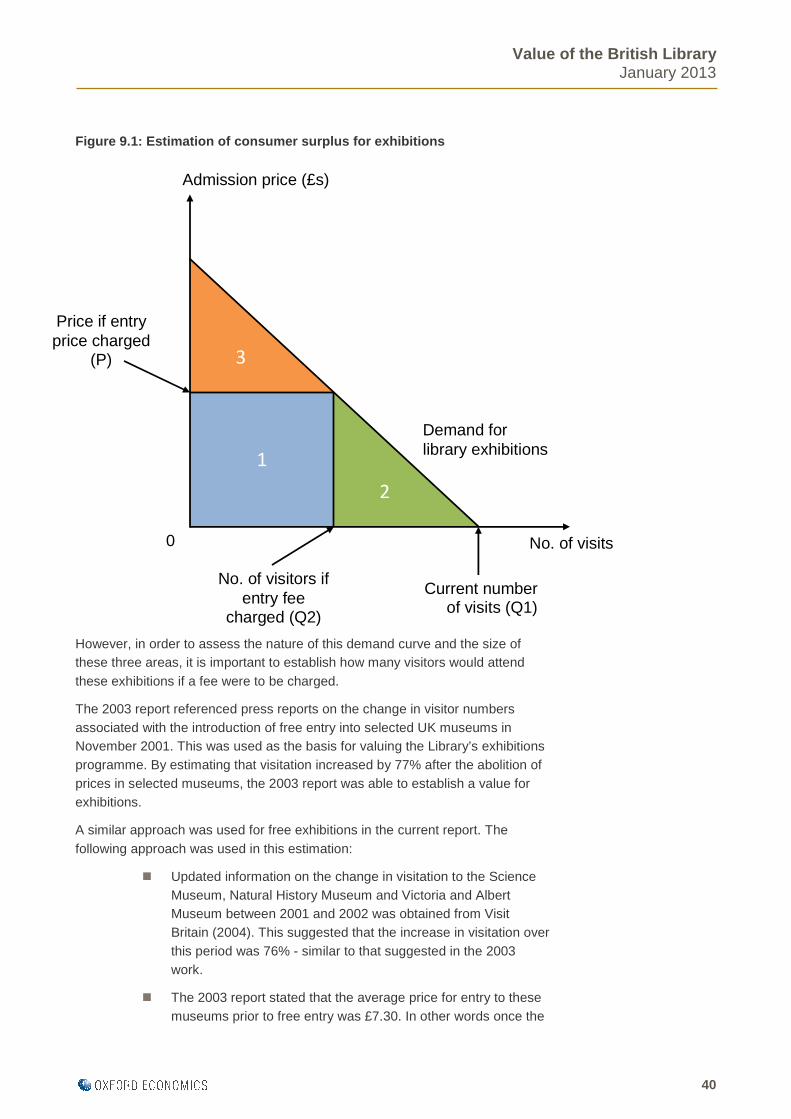
Value of the British Library January 2013
40
Figure 9.1: Estimation of consumer surplus for exhi bitions
However, in order to assess the nature of this demand curve and the size of these three areas, it is important to establish how many visitors would attend these exhibitions if a fee were to be charged.
The 2003 report referenced press reports on the change in visitor numbers associated with the introduction of free entry into selected UK museums in November 2001. This was used as the basis for valuing the Library’s exhibitions programme. By estimating that visitation increased by 77% after the abolition of prices in selected museums, the 2003 report was able to establish a value for exhibitions.
A similar approach was used for free exhibitions in the current report. The following approach was used in this estimation:
� Updated information on the change in visitation to the Science Museum, Natural History Museum and Victoria and Albert Museum between 2001 and 2002 was obtained from Visit Britain (2004). This suggested that the increase in visitation over this period was 76% - similar to that suggested in the 2003 work.
� The 2003 report stated that the average price for entry to these museums prior to free entry was £7.30. In other words once the
3
2
1
Admission price (£s)
No. of visits0
No. of visitors if entry fee
charged (Q2)
Current number of visits (Q1)
Price if entry price charged
(P)
Demand for library exhibitions
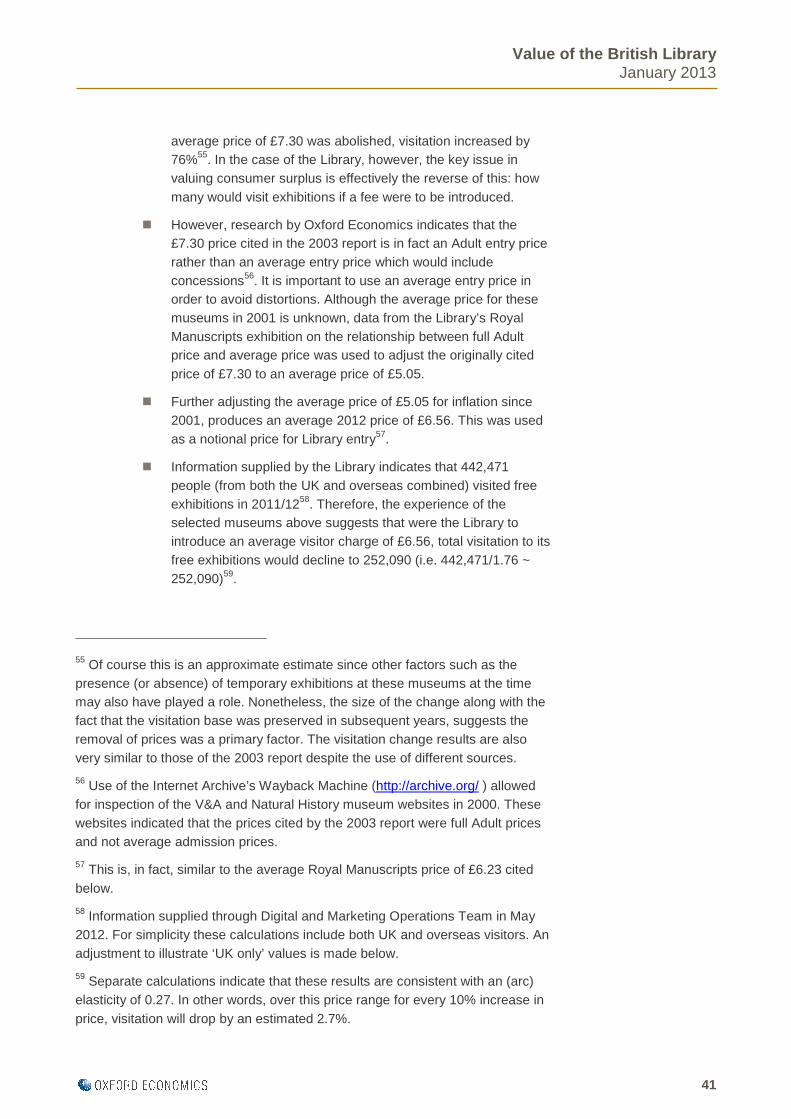
Value of the British Library January 2013
41
average price of £7.30 was abolished, visitation increased by 76%55. In the case of the Library, however, the key issue in valuing consumer surplus is effectively the reverse of this: how many would visit exhibitions if a fee were to be introduced.
� However, research by Oxford Economics indicates that the £7.30 price cited in the 2003 report is in fact an Adult entry price rather than an average entry price which would include concessions56. It is important to use an average entry price in order to avoid distortions. Although the average price for these museums in 2001 is unknown, data from the Library’s Royal Manuscripts exhibition on the relationship between full Adult price and average price was used to adjust the originally cited price of £7.30 to an average price of £5.05.
� Further adjusting the average price of £5.05 for inflation since 2001, produces an average 2012 price of £6.56. This was used as a notional price for Library entry57.
� Information supplied by the Library indicates that 442,471 people (from both the UK and overseas combined) visited free exhibitions in 2011/1258. Therefore, the experience of the selected museums above suggests that were the Library to introduce an average visitor charge of £6.56, total visitation to its free exhibitions would decline to 252,090 (i.e. 442,471/1.76 ~ 252,090)59.
55 Of course this is an approximate estimate since other factors such as the presence (or absence) of temporary exhibitions at these museums at the time may also have played a role. Nonetheless, the size of the change along with the fact that the visitation base was preserved in subsequent years, suggests the removal of prices was a primary factor. The visitation change results are also very similar to those of the 2003 report despite the use of different sources.
56 Use of the Internet Archive’s Wayback Machine (http://archive.org/ ) allowed for inspection of the V&A and Natural History museum websites in 2000. These websites indicated that the prices cited by the 2003 report were full Adult prices and not average admission prices.
57 This is, in fact, similar to the average Royal Manuscripts price of £6.23 cited below.
58 Information supplied through Digital and Marketing Operations Team in May 2012. For simplicity these calculations include both UK and overseas visitors. An adjustment to illustrate ‘UK only’ values is made below.
59 Separate calculations indicate that these results are consistent with an (arc) elasticity of 0.27. In other words, over this price range for every 10% increase in price, visitation will drop by an estimated 2.7%.
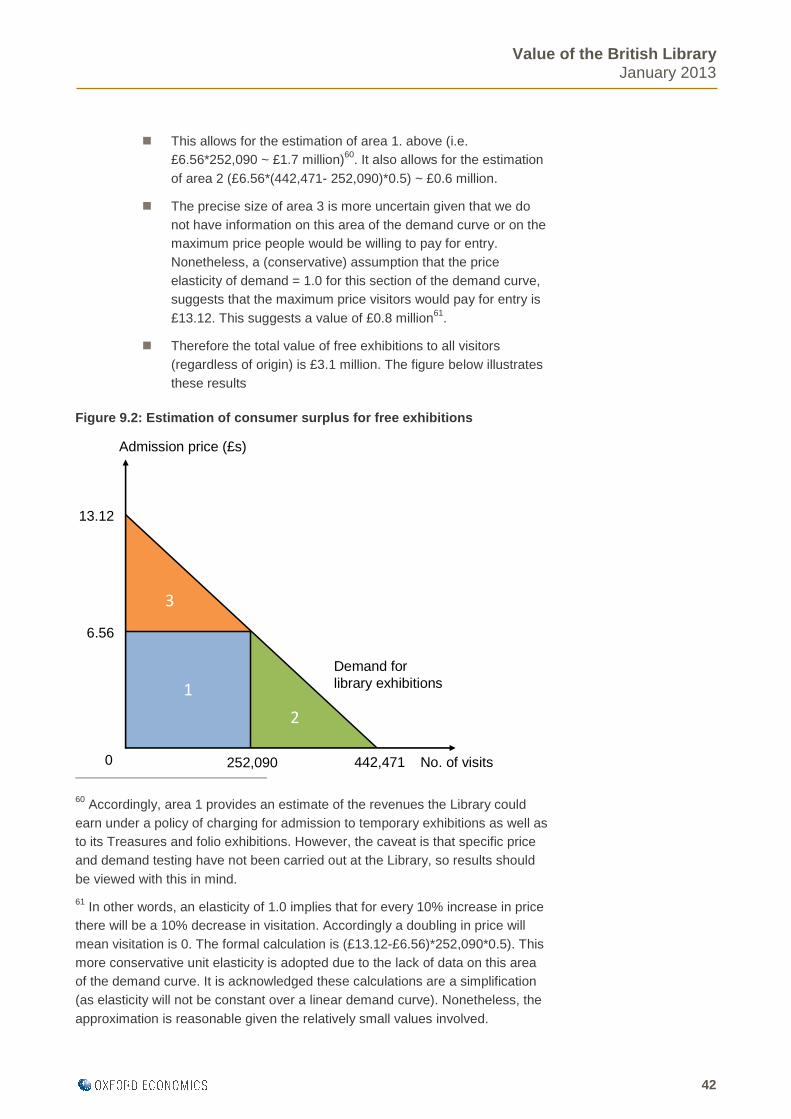
Value of the British Library January 2013
42
� This allows for the estimation of area 1. above (i.e. £6.56*252,090 ~ £1.7 million)60. It also allows for the estimation of area 2 (£6.56*(442,471- 252,090)*0.5) ~ £0.6 million.
� The precise size of area 3 is more uncertain given that we do not have information on this area of the demand curve or on the maximum price people would be willing to pay for entry. Nonetheless, a (conservative) assumption that the price elasticity of demand = 1.0 for this section of the demand curve, suggests that the maximum price visitors would pay for entry is £13.12. This suggests a value of £0.8 million61.
� Therefore the total value of free exhibitions to all visitors (regardless of origin) is £3.1 million. The figure below illustrates these results
Figure 9.2: Estimation of consumer surplus for free exhibitions
60 Accordingly, area 1 provides an estimate of the revenues the Library could earn under a policy of charging for admission to temporary exhibitions as well as to its Treasures and folio exhibitions. However, the caveat is that specific price and demand testing have not been carried out at the Library, so results should be viewed with this in mind.
61 In other words, an elasticity of 1.0 implies that for every 10% increase in price there will be a 10% decrease in visitation. Accordingly a doubling in price will mean visitation is 0. The formal calculation is (£13.12-£6.56)*252,090*0.5). This more conservative unit elasticity is adopted due to the lack of data on this area of the demand curve. It is acknowledged these calculations are a simplification (as elasticity will not be constant over a linear demand curve). Nonetheless, the approximation is reasonable given the relatively small values involved.
3
2
1
Admission price (£s)
No. of visits0 252,090 442,471
13.12
6.56
Demand for library exhibitions
Value of the British Library January 2013
43
In the case of paid exhibitions (i.e. Royal Manuscripts) entry is by definition not free. The average fee charged for the Royal Manuscripts exhibition was £6.23 and information supplied by the Library indicated that the exhibition attracted some 68,468 visitors62.
Accordingly, the equivalent of area 1. in Figure 9.2 is revenue (and is incorporated into the values described in the Revenues chapter)63. Area 2. is not accounted for since it represents consumer surplus lost due to reduced demand with the levying of a fee. Area 3 was estimated as above by assuming a price elasticity of demand of 1.0. This produced a consumer surplus value of £0.2 million.
Events (which attracted 17,441 visitors in 2011/12 with an average fee of £4.87) were treated in the same manner as paid exhibitions, with an estimated consumer surplus of £0.04 million64.
9.2 General interest visitors
Apart from visitors to specific exhibitions and events, the Library is also of interest to visitors who are simply curious to visit the premises. Data from survey work by Morris Hargreaves McIntyre (MHM) (2012) indicates that some 2% of visitors to the Library in 2011/12 cited “looked at the building” as the main reason for their trip, while 4% cited “other” reasons (i.e. apart from visiting exhibitions, events, Reading Rooms, café, friends, etc.). Information provided by
62 Information supplied through Digital and Marketing Operations Team in May 2012. Note that while the Royal Manuscripts price of £6.23 could have been used as a notional price for all exhibitions above, there was no corresponding data on the decline in visitation relative to identical free exhibitions. Accordingly, the approach adopted in 2003 was also used in this report, albeit with modifications. As the price used (£6.56) is similar in any case, the difference is marginal.
63 This revenue equates to £6.23*68,468 = £426,229 and forms a part of the Library’s revenues as described in Chapter 4. This area has not been “lost” to society – its value has simply been transferred from consumers to producers (i.e. the Library). Note this also illustrates the point made in that chapter: the collection of these revenues by the Library represents a transfer from consumers to the Library which must be accounted for in any estimation of total economic value.
64 The value of events was not allowed for in the 2003 report, through the figure itself is small. Consultations with the Library’s Financial and Corporate Services team indicated that events are not technically included as a part of the Library’s priced services and therefore do not appear as revenue in the Library’s Annual Report. However events revenue (£84,885) has been allowed for in the revenue estimate for this report.

Value of the British Library January 2013
44
the Library indicated that 1,491,326 visitors passed through the Library’s main entrance at St Pancras in 2011/12. 65
Given that this is the case, then some 6% of St Pancras visitors (or 89,480 people) visited the Library for reasons of general interest.
These figures allow for an estimate of general user values using the same approach as that derived for free exhibitions, described above. (In effect the Library itself was treated as an ‘exhibition’ of interest to general visitors, with a notional charge of £6.56 at the point of entry.) This approach produced an estimated value of £0.6 million for general interest visitors66.
9.3 Learning
In addition to its exhibitions and events programmes the Library also provides educational programmes for Learners. (Learners include teachers, school students, further, higher and adult education personnel and family groups). These programmes typically consist of workshops, teacher events and a range of other activities. Workshops in particular are often connected with major exhibitions held by the Library.
In 2011/12, some 18,578 Learners visited the Library67. Of these, 12,592 were school students, 551 were teachers and the reminder were various higher, further and adult education personnel and family groups68.
Schoolchildren generally attend the Library as a requirement of their education, so the conditions underlying free consumer choice (and therefore consumer surplus) are absent69. Likewise it may be difficult to ascribe a consumer surplus value to teachers.
Nonetheless an assessment could be made on a ‘gross’ basis by reference to the resources society invests in terms of teacher wages and pupil education. To the extent that society expects a return at least equal to its investment in pupils and teachers, then this provides an illustrative approach to valuation.
65 Information provided through Digital and Marketing Operations Team, May 2012.
66 No allowance for such visitors appears to have been made in the 2003 report.
67 British Library (2012a). The same source indicates that 1,286,000 unique visitors were recorded on the Library’s Learners website in 2011/12, although this figure would include non-UK users. Website usage values are incorporated in the estimates of web usage, discussed above.
68 Information provided through Communications Team, British Library, 26 June 2012.
69 The 2003 report also cites similar difficulties and declines to give a valuation for educational purposes.

Value of the British Library January 2013
45
Accordingly the benefits to Learners were estimated as follows:
� The average annual cost of education for primary and secondary students in England (£4,139 and £5,353 respectively) was derived from the Department for Education’s website70. Daily pupil costs were estimated by dividing these figures by the number of school days per year (195). The resultant was then multiplied by the number of pupil visits (12,592) to derive an estimate of value of £0.3 million
� The average hourly teacher wage (£22.32) derived from ONS (2011) was multiplied by the number of work hours involved in planning and visiting the Library (assumed to be 2 days or 14 hours of time). Given 551 teacher visits, this produces a value of £0.2 million.
� In the case of other Learners, visits were assumed to take a day’s worth of time (i.e. 8 hours inclusive of return transport). Measured using the non-work value of time referred to in the estimate of web user benefits (£4.73 per hour) by the number of FE, HE, Adult Education and Family Learners (5,435) this indicates a value of £0.2 million
Therefore the total gross value of Learner visits to the Library is estimated as (a rounded) £0.6 million. The global and UK values are synonymous as no overseas Learners take part in these programmes.
9.4 Total estimate
The table below provides the total estimate for exhibitions. events, general visitors and learners. Note the caveat above applies with respect to Learners (i.e. Learner estimates are based on gross values) though this does not materially affect the overall figures due to their relatively small size.
Table 9.1: Value of exhibitions, events, general vi sitation and Learners (£ million)
70 See http://www.education.gov.uk/researchandstatistics/datasets/a00196963/spend-per-pupil-school-data
Item UK Global Free exhibitions 1.9 3.1 Paid exhibitions 0.1 0.2
Events 0.02 0.04 General visitors 0.4 0.6
Learners 0.6 0.6 Total 3.0 4.5
Value of the British Library January 2013
46
10 Non-use value
10.1 Background
In assessing the value of the Library, it is important to pay attention not only to those who directly use its services but also to those who do not do so – i.e. the general population outside Library users. People may value the Library and support its continuation, regardless of whether they ever use it. It is therefore relevant to consider the Library’s non-use (or passive use) value.
Non-use value is a concept which is also common in environmental and cultural economics. For example, people may value the fact that opera exists and support its continued funding, even though they may never visit the opera themselves and it does not directly contribute to their everyday wellbeing.
Non-use value may be thought of as having three components71:
� Existence value – The value attached to the existence of the Library irrespective of whether a person ever visits it or not. For example, people may value the existence of the Library in the present even if they have no intention of visiting it.
� Bequest value – The value which the current generation places on preserving the Library for the benefit of future generations.
� Option value – This represents the value attached to potential future benefits from the Library. It is related to the ideas of risk and uncertainty. For example, people may attach some value to the possibility that they may one day want to visit the Library and/or use it for research purposes (whether commercial or otherwise). The loss of the Library would foreclose these options. (Note that: ‘option value’ may be alternatively defined as either a use or non-use value, depending on the context. Option value may also be an issue when undertaking more conventional economic appraisals – e.g. new transport services.)
The combination of these three components make up non-use value. In practice people may have a mix of all three of these issues in mind when assessing non-use values in situations such as the survey described below and it may be difficult to disentangle one from the other.
71 Existence and option value are also discussed in the Green Book’s discussion of the need to allow for irreversible risk. The importance of assessing non-use value within a TEV is also noted in Treasury and DWP’s 2011 supplement to the Green Book - Valuation Techniques for Social Cost Benefit Analysis.
Value of the British Library January 2013
47
10.2 Survey
In order to measure non-use value it is important to survey the general population in order to assess whether they hold any such values in respect of the Library72.
The 2003 report conducted a similar survey of non-use values. Accordingly, Oxford Economics adopted the survey used in the 2003 report (with some modifications) and commissioned Beresford Research to undertake an internet-based survey of the UK population in order to assess the value the general population placed on the Library.
The survey was undertaken in May 2012 and consisted of respondents aged 16 years and over from across the UK. A survey quota was established so as to ensure that the respondents reflected the UK population distribution73. A total of 1,211 responses were collected.
Respondents were asked a few short questions about the Library. Respondents were also asked if they:
� had ever used the Library;
� were aware of the Library but had not used it; or
� were not aware of the Library.
A variety of demographic data (including income, age, sex, educational and employment status, residence by region and postcode) was also collected.
In particular, respondents were asked the following question relating to their willingness to pay for the continued existence of the Library.
All UK taxpayers pay towards the upkeep and development of the British Library through taxes. On average, each UK income tax payer pays roughly £3.50 a year towards the British Library through taxes. If you were free to chose how your existing taxes were allocated, what would be the maximum you would be willing to pay, through taxes, each year, to maintain the British Library?
Note: These questions are designed to capture the v alue that you place on the British Library and are not an indicat ion that tax payers’ contributions will change.
72 The survey technique used in this case is formally known as contingent valuation.
73 Specifically, the proportion of the UK population aged 16 and above, residing in each government office region, Scotland, Wales and Northern Ireland was established. The number of overall survey respondents in each region reflected this regional distribution. For example 59 of the 1,211 respondents were from Wales, reflecting Wales’ share of the national 16+ population of 4.9%.

Value of the British Library January 2013
48
It is important you try to answer this question to enable us to place a value on the British Library and the services it provides.
The use of the term ‘tax’ is felt by some analysts to generate protest votes against any form of taxation in studies of this type. However, it was determined that it was important to include it as a part of the analysis in order to focus respondent’s minds clearly on the fact that funding the Library imposes a cost on society which must be met through their tax contributions.
A total of 716 respondents provided values to this question74. However 27.5% of respondents indicated that they had used the Library (whether now or in the past)75. While this implies visitation numbers which are far greater than in any one year, given the numbers visiting the Library each year, the figure is likely to reflect the build up of usage in previous years.
Arguably, previous users may mix in ‘use values’ with non-use values. In order to derive figures which more closely resembled ‘pure’ non-use values, only responses from those who indicated that they had never used the Library (or never heard of the Library) were taken to assess non-use values.
These ‘never used’/’never heard of’ values are therefore likely to be a better guide to a purer ‘non-use’ valuation (Rolfe and Windle 2010). The values produced by this group will be free of any use value components and reflect a purer existence value and bequest value. Any option values component might also be seen as somewhat ’purer’ in that it reflects the possibility of future usage rather than actual past usage.
In addition, outliers were removed using a rough rule of thumb, excluding values three standard deviations above the mean. This process involved the exclusion of 32 responses (13 of which were from the ‘never used/never heard of’ group). This left a total of 483 responses from the ‘never used’/’never heard of’ group – i.e. the group defined as non-users for the purposes of this analysis.
These adjustments produced the results in the table below.
74 The remaining users – i.e. some 41% gave “don’t know” as an answer to the valuation question. This is much higher than the 2003 survey (where 15% answered “don’t know”) although it is consistent with similar contingent valuation studies where high “don’t know” percentages have been reported in the past (Wang (1997) reports a 30% “Don’t Know” response in a contingent valuation study by Whittington et al.).
75 55.7% had never used the Library while a further 16.7% had never heard of the Library.

Value of the British Library January 2013
49
Table 10.1: Non-use survey results (£)
Category All Users Past Users ‘Never used’/’never heard of’ (Non-users)
Average Willingness to pay per
respondent 8.98 10.99 8.15
Number of responses providing values (n)
684 201 483
Response rate (i.e. proportion of all
respondents who provided (non-outlier)
values)
56% 60% 55%
Standard deviation 11.38 12.36 10.83
The value adopted to measure non-use benefits was therefore £8.15 per person76. That is, on average, respondents who had never used (or never heard of) the Library (non-users) were willing to pay £8.15 per person through tax in order to maintain it77.
This figure was then ‘grossed up’ in manner consistent with the 2003 report. Data from ONS (2011) for mid 2010 populations disaggregated by age were used to determine the size of the UK population aged 16 and over (50,653,848). This figure was then multiplied by the unit value per person in order to derive a non-use value of some £412.8 million (i.e. £8.15*50.7 million ~ £412.8 million)78.
76 Using a direct comparison the 2003 report estimated a figure of £6.30 per person. Adjusted for inflation this is equivalent to £8.00 per person in May 2012 terms or an increase of 2% in real terms.
However, this comparison ignores the fact that the 2012 figures used a narrower definition of non-use than the 2003 figures. If the intention is to make the comparison on a “like for like” basis, the most appropriate 2012 comparator to the 2003 results is the “all users” figure of £8.98. This indicates a 12% rise in values (in real terms) between 2003 and 2012.
77 It is possible to test the statistical robustness of the average value of £8.15 using the standard deviations provided above through use of a statistical test known as a confidence interval. The 95% confidence interval for the £8.15 average non-use value is £7.18 to £9.12 (i.e. about £1 either way). In other words if the non-use survey was conducted 100 times, the average WTP value for the non-user group would fall within the range £7.18 to £9.12 95 of those times.
78 Not every individual aged 16 and over pays income tax. However multiplying the unit value by the population 16 and over is consistent with the fact that these individuals would be prepared to see these funds (i.e. £8.15) spent to fund the Library rather than put to some alternative use (e.g. greater funding for health care for the elderly).

Value of the British Library January 2013
50
The amount respondents were prepared to pay varied by region and by income. Figure 10.1 below provides a WTP breakdown by region (with values displayed at the top of the chart columns and respondent numbers displayed at the bottom) while Figure 10.2 provides a breakdown by region (with a corresponding display of values and response numbers). The horizontal line represents average WTP. Note again that these disaggregations reflect the values held by non-users only.
Figure 10.1: Breakdown of non-user WTP by region
10.90
12.05
8.55
7.59
5.035.30
6.91
9.48
7.287.81
6.526.05
-
2.00
4.00
6.00
8.00
10.00
12.00
14.00
Central London (Zones 1-3)
Greater London (Zones 4-6)
South East (excluding Greater London)
South West England
East Midlands
West Midlands
East of England*
North East England
North West England
Yorkshire and the Humber
Scotland
Wales
WTP £
n = 26 n = 19n = 45n = 34n = 53n = 22n = 49n = 37n = 40n = 48n = 67n = 30

Value of the British Library January 2013
51
Figure 10.2: Breakdown of non-user WTP by income
Considerable caution must be exercised in reviewing these figures due to the relatively small sample sizes. However, the regional disaggregations suggest that WTP is highest in London. This is to be expected given the proximity of the Library to potential users (which may indicate an element of option value) and perhaps the higher level of incomes in London. Likewise, the south-east also has an above average WTP. WTP is surprisingly high in the North-East and is lowest in the Midlands79.
The income results indicate that the lowest two income groups have below average WTP. Again this is not surprising. However WTP peaks in the £21,501-£33,900 income group and falls off slightly thereafter. The reasons for this are not clear. It may be that the relationship of WTP to income is non-linear and that WTP simply flattens out after a certain point. Some previous studies of environmental WTP have noted that WTP for ecosystem services with respect to income growth is less than 1.0 – i.e. that as income rises by a given amount (e.g. 1%) WTP rises by a lesser amount. A similar phenomenon may be at work in terms of WTP for cultural assets such as the Library.
79 Northern Ireland is excluded from this chart. Its 13 respondents recorded an average WTP of £26.88. This result is likely to be unreliable given the small sample size.
5.59
7.76
9.94
8.08
8.618.16
-
2.00
4.00
6.00
8.00
10.00
12.00
Less than £12,400
£12,401 - £21,500
£21,501-£33,900
£33,901- £52,800
£52,801 - £71,100
Over £71,100
WTP £
n = 65 n = 25n = 46n = 111n = 125n = 104
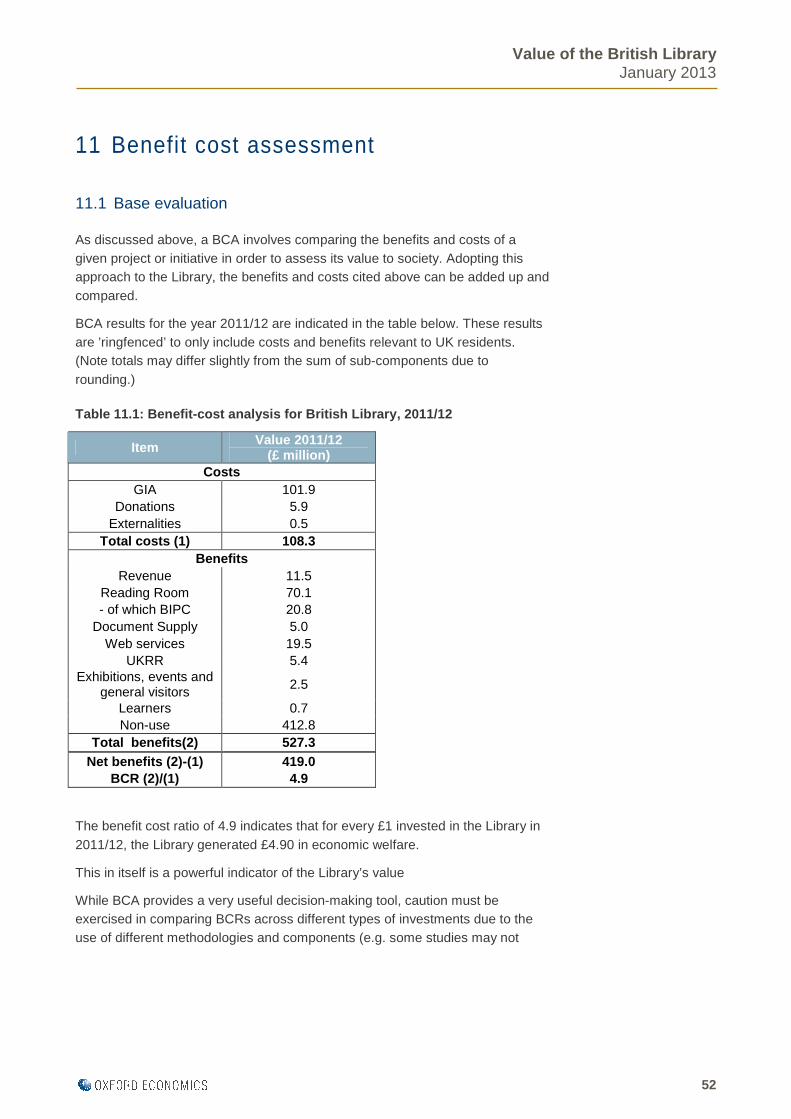
Value of the British Library January 2013
52
11 Benefit cost assessment
11.1 Base evaluation
As discussed above, a BCA involves comparing the benefits and costs of a given project or initiative in order to assess its value to society. Adopting this approach to the Library, the benefits and costs cited above can be added up and compared.
BCA results for the year 2011/12 are indicated in the table below. These results are ’ringfenced’ to only include costs and benefits relevant to UK residents. (Note totals may differ slightly from the sum of sub-components due to rounding.)
Table 11.1: Benefit-cost analysis for British Libra ry, 2011/12
Item Value 2011/12 (£ million)
Costs GIA 101.9
Donations 5.9 Externalities 0.5
Total costs (1) 108.3 Benefits
Revenue 11.5 Reading Room 70.1 - of which BIPC 20.8
Document Supply 5.0 Web services 19.5
UKRR 5.4 Exhibitions, events and
general visitors 2.5
Learners 0.7 Non-use 412.8
Total benefits(2) 527.3 Net benefits (2)-(1) 419.0
BCR (2)/(1) 4.9
The benefit cost ratio of 4.9 indicates that for every £1 invested in the Library in 2011/12, the Library generated £4.90 in economic welfare.
This in itself is a powerful indicator of the Library’s value
While BCA provides a very useful decision-making tool, caution must be exercised in comparing BCRs across different types of investments due to the use of different methodologies and components (e.g. some studies may not

Value of the British Library January 2013
53
include an assessment of non-use value). Further, one might have a low BCR attached to a project with a high net value in monetary terms.80
However the Americans for Libraries Council’s (ALC) (2007) comprehensive review of US libraries reported that a benefit-cost ratio of 3.1 or better was common among the Library studies it reviewed, noting that libraries “consistently outpace other sectors such as transportation, health and education in the efficient use of tax dollars”81. BCRs of between 2.8 and 4.2 have also be recorded for Australian and New Zealand public libraries in the past82.
Because of the large size of potential investments, transport economics is the field in which many of the theoretical underpinnings of BCA are practised and is the field in which BCA is most highly developed. Within the UK the Department for Transport (DfT) has set out Value for Money (VfM) Guidelines for use in the economic case of an overall transport business case.
Caution is needed in interpreting these guidelines in other contexts since their original intention is for use within a transport environment83. Nonetheless, they are reproduced below for purposes of comparison.
Table 11.1: DfT VfM typology (DfT 2008)
Category Description Poor VfM BCR less than 1.0 Low VfM BCR between 1.0 and 1.5
Medium VfM BCR between 1.5 and 2.0 High VfM BCR between 2.0 and 4.0
Very high VfM BCR greater than 4.0
11.2 Taxpayer focussed and global evaluations
As previously indicated, donations are included in the base evaluation discussed above. However, there may also be an interest in viewing the Library from a pure UK taxpayer funding perspective. For this reason, an alternative BCR table is presented below. The only difference between this assessment and the base evaluation is that donations are excluded from the analysis.
80 For example a project costing £10 billion might generate £11 billion in benefits. The BCR is 1.1, however benefits are £1 billion. Conversely a project costing £1 million might generate £3 million benefits – providing a BCR of 3 but benefits of only £2 million.
81 ALC (2007).
82 SGS Economics (2012).
83 Note however that there are also clear similarities even with some of the more abstract parts of the analysis above. For example, transport appraisals have made increasing use of concepts such as option value in determining project benefits.

Value of the British Library January 2013
54
Since the 2003 report also excluded donations, the values it reported have also been provided for purposes of comparison. The 2003 values have not been adjusted for inflation or real income growth (though such adjustments would not affect the 2003 BCR per se). Obviously, an important caveat in making these comparisons is that while some of the 2003 work was used as a guide for the current study, the valuations used for deriving many of the individual 2003 results differ considerably in some cases. For example, the 2003 study uses WTA as a measure of Reading Room benefits. Likewise, the 2003 study appears to have overestimated exhibitions benefits due to its use of an Adult entry fee as an average price point and its inclusion of overseas visitors in its assessment of UK values.
Table 11.3: Benefit-cost analysis for British Libra ry, 2011/12 (excluding donations), comparison with 2003 results.
Item Value 2011/12 (£ million)
Value 2003 (£ million)
Costs GIA 101.9 83
Externalities 0.5 Not assessed Total costs (1) 102.4 83
Benefits Revenue 11.5 Not assessed
Reading Room 70.1 33 - of which BIPC 20.8 Not in existence
Document Supply 5.0 24 Web services 19.5 Not assessed
UKRR 5.4 Not in existence Exhibitions, events and
general visitors 2.5 2
Learners 0.7 Not assessed Non-use 412.8 304
Total benefits (2) 527.3 363 Net benefits (2)-(1) 424.9 280
BCR (2)/(1) 5.1 4.4
The BCA results can also be seen through a global prism – as indicated above. The table below indicates how the world as a whole benefits from the UK government’s investment in the British Library. In this case there is no ringfencing and benefits accruing to both UK and overseas residents are allowed for. (Donations from both the UK and overseas are included in this analysis.)

Value of the British Library January 2013
55
Table 11.4: Benefit-cost analysis for British Libra ry, 2011/12 – global perspective
Item Value 2011/12 (£ million)
Costs GIA 101.9
Donations 6.7 Externalities 0.5
Total costs (1) 109.2 Benefits
Revenue 20.0 Reading Room 82.7 - of which BIPC 20.8
Document Supply 5.5 Web services 25.8
UKRR 5.4 Exhibitions, events and
general visitors 4.0
Learners 0.7 Non-use 412.8
Total benefits(2) 556.8 Net benefits (2)-(1) 447.7
BCR (2)/(1) 5.1
From a pure economic point of value this provides the best indication of the Library’s true value (though it is likely to be understated given that some elements such as overseas non-use value were not assessed). This is because, if a comprehensive accounting of economic benefits from an initiative such as the Library is desired, then whether or not these benefits are bestowed on a given country’s citizens is not, strictly speaking, relevant. Rather all benefits should be assessed, regardless of where they fall, consistent with the fact that all costs have been assessed. Ringfencing around national boundaries in a context where overseas residents gain significant benefits from an initiative such as the Library effectively means that there may be significant omitted benefits, as the difference between UK base evaluation and global benefit cost perspectives (£29.5 million in gross benefits) illustrates84.
The difference between the gross benefits in the base evaluation results and the global BCA (i.e. £29.5 million) can also be seen as one (lower bound) indicator of the Library’s contribution to the UK’s soft power.
Of course this is only a partial indication (and it was not the intention of this analysis to provide a comprehensive analysis of soft power). For example, non-
84 Of course there are also some omitted costs, but even on a net benefits basis the difference between the two (£28.7 million) is substantial. In general, it is typically the case that the costs of an initiative are concentrated within one given jurisdiction with the exception of some environmental externalities but at least some benefits accrue to ‘outsiders’.

Value of the British Library January 2013
56
use benefits to global residents were not assessed. Further, the MCA results (see below) suggest that overseas residents see the Library as making a contribution to the UK’s image abroad, however not all of the values implicit in this assessment may have been captured in the above BCA (nor was it intended that the BCA do so). Nonetheless, to the extent that the projection of the UK’s image abroad constitutes an additional benefit of importance to policymakers it is instructive to consider this result.

Value of the British Library January 2013
57
12 Multi-criteria analysis
While BCA is a useful tool it has its critics who point out that not everything can be measured in monetary terms. While BCA remains an important decision-making tool, multi-criteria analysis (MCA) provides a useful non-monetary (or ‘below the line‘) supplement.
There is no single accepted definition of MCA. However in essence it involves assessing the attributes of a given scheme or initiative in terms which are important to defined stakeholders. These attributes typically include those which are absent from a BCA (or at best are only partly assessed through a BCA)85.
MCA is referred to by both Treasury’s Green Book (2003) and in O’Brien (2010). As described in these publications it can involve assigning weights to defined criteria, and then scoring ‘options’ (e.g. a variety of health care investment options) in terms of how well they perform against those weighted criteria. The weighted scores are then summed, and these sums can be used to rank options.
In the case of the Library, however there are no ‘options’ to assess against one another. In effect the only ‘option’ is the existence of the Library itself (as opposed to its non-existence). Nonetheless, it is useful to examine how users rate the Library on non-quantitative measures. As suggested above, doing so can help illustrate the Library’s value in terms which go beyond a pure monetary assessment. This allows stakeholders to have an additional tool with which to assess the Library’s value and to explore issues which some may feel a BCA cannot deal with or can only deal with in a partial manner.
Accordingly, as a part of the Reading Room survey, described above, Reading Room users were also asked to rate the Library on a set of 15 attributes in the electronic survey and 16 attributes in the hard copy survey. As was the case for the Reading Room survey results described above, the results were combined to produce an overall average for both surveys.86
A formal decision was taken not to weight these attributes against each other during the survey design process. All attributes are therefore equally weighted.
85 Note that in some cases it is important to be aware of the potential for overlap between a BCA and MCA – e.g. where a BCA includes allowance for environmental externalities and questions on similar externalities are a part of an MCA. There may be some degree of overlap in the case of the Library, as discussed above. However the intention of the MCA here is to provide an indication of supplementary values rather than to form the basis of project selection.
86 The 15 attributes were identical in both surveys. An additional attribute referring to the Library’s schools and Learning programmes was included in the hard copy version of the survey. Accordingly, results for this attribute were derived only from the hard copy version of the survey
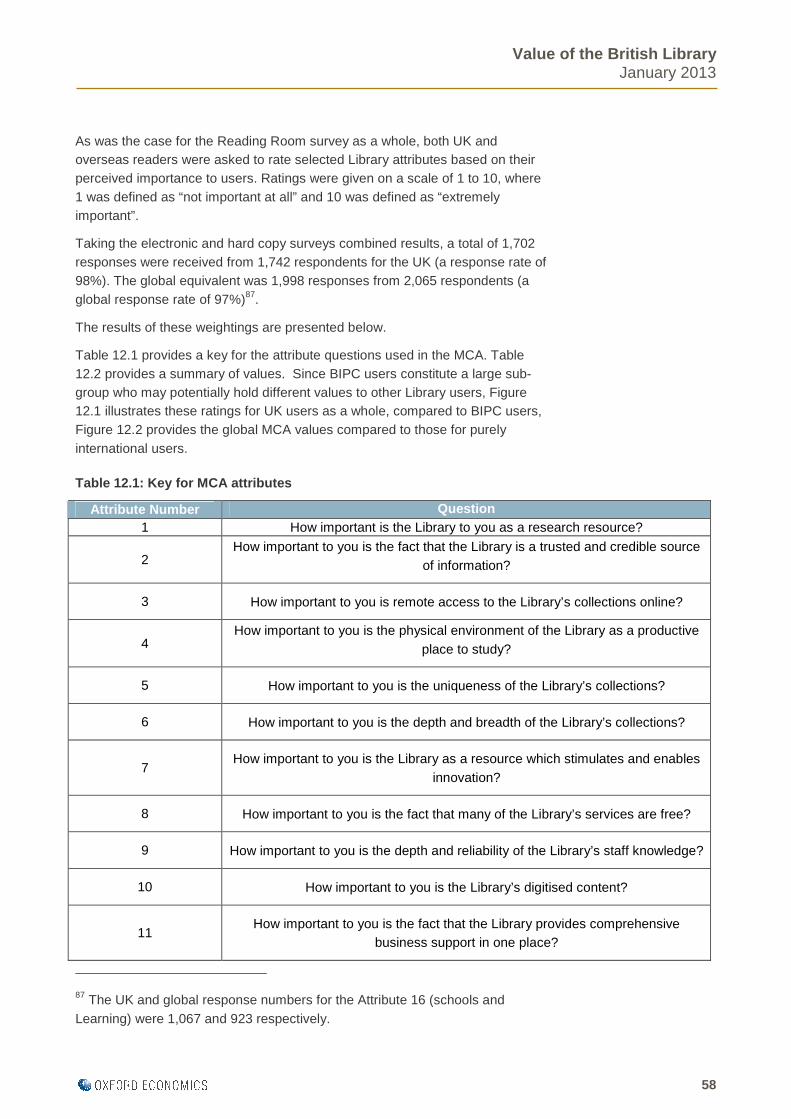
Value of the British Library January 2013
58
As was the case for the Reading Room survey as a whole, both UK and overseas readers were asked to rate selected Library attributes based on their perceived importance to users. Ratings were given on a scale of 1 to 10, where 1 was defined as “not important at all” and 10 was defined as “extremely important”.
Taking the electronic and hard copy surveys combined results, a total of 1,702 responses were received from 1,742 respondents for the UK (a response rate of 98%). The global equivalent was 1,998 responses from 2,065 respondents (a global response rate of 97%)87.
The results of these weightings are presented below.
Table 12.1 provides a key for the attribute questions used in the MCA. Table 12.2 provides a summary of values. Since BIPC users constitute a large sub-group who may potentially hold different values to other Library users, Figure 12.1 illustrates these ratings for UK users as a whole, compared to BIPC users, Figure 12.2 provides the global MCA values compared to those for purely international users.
Table 12.1: Key for MCA attributes
Attribute Number Question 1 How important is the Library to you as a research resource?
2 How important to you is the fact that the Library is a trusted and credible source
of information?
3 How important to you is remote access to the Library’s collections online?
4 How important to you is the physical environment of the Library as a productive
place to study?
5 How important to you is the uniqueness of the Library’s collections?
6 How important to you is the depth and breadth of the Library’s collections?
7 How important to you is the Library as a resource which stimulates and enables
innovation?
8 How important to you is the fact that many of the Library’s services are free?
9 How important to you is the depth and reliability of the Library’s staff knowledge?
10 How important to you is the Library’s digitised content?
11 How important to you is the fact that the Library provides comprehensive
business support in one place?
87 The UK and global response numbers for the Attribute 16 (schools and Learning) were 1,067 and 923 respectively.

Value of the British Library January 2013
59
12 How important to you is the Library’s role in providing for your own self-fulfilment
and general well-being?
13 How important to you is the international stature which the Library gives the UK?
14 How important to you is the role of the Library in preserving the nation’s
memory?
15 How important to you is the Library’s exhibition programme ?
16 How important to you are the Library’s programmes for schools and Learning?
Table 12.2: MCA ratings results
Sub-group
1 2 3 4 5 6 7 8 9 10 11 12 13 14 15 16 n
UK 9.0 8.9 7.2 8.5 8.8 9.2 7.0 9.1 7.7 7.1 4.2 7.5 7.5 8.5 6.4 5.8 1,702 BIPC 8.6 8.8 7.0 8.7 8.2 8.9 7.7 9.1 7.8 7.5 6.8 7.8 7.7 8.4 6.7 6.0 278
All users 9.0 8.9 7.3 8.5 8.9 9.2 7.1 9.1 7.8 7.2 4.2 7.5 7.5 8.5 6.4 5.8 1,998 Overseas 9.1 9.0 7.9 8.4 9.5 9.4 7.4 8.9 8.3 7.6 4.2 7.1 7.5 8.3 6.5 5.6 296
Figure 12.1: MCA results for UK and BIPC users
.
-
1.0
2.0
3.0
4.0
5.0
6.0
7.0
8.0
9.0
10.0
1 2 3 4 5 6 7 8 9 10 11 12 13 14 15 16
All UK usersBIPC usersScore

Value of the British Library January 2013
60
Figure 12.2: MCA results for all users and overseas users
As indicated by this data, UK respondents rated the depth and breadth of the Library’s collections, the fact the collection was free and its role as a research resource as the most important attributes. The views of BIPC users are broadly similar to those of average UK users, although BIPC users place higher values on innovation and substantially higher values on business support in one place than is the case for average UK library users.
Overall global views on the value of the Library are similar to those found for the UK, with the depth and breadth of the Library’s collections, the fact the collection was free and its role as a research resource being the highest rated attributes. Considering overseas users in isolation, this sub-group rated the uniqueness of the Library’s collections as the most important attribute, followed closely by the depth and breadth of the Library’s collections - placing even higher values on these attributes than their UK counterparts.
The MCA also contains hints of the Library’s impact in terms of the UK’s soft power. The fact that international respondents provide even higher ratings than UK ones for several attributes is one indication of this. International respondents also provide similar responses to UK residents when asked directly about the international stature that the Library gives the UK.
It is noted that some of these values may implicitly overlap with the results of the BCA above. For example, in assessing the value of the Library in monetary terms respondents might implicitly include the depth and breadth of the Library’s
-
1.0
2.0
3.0
4.0
5.0
6.0
7.0
8.0
9.0
10.0
1 2 3 4 5 6 7 8 9 10 11 12 13 14 15 16
All usersOverseas usersScore

Value of the British Library January 2013
61
collection when estimating the cost of replacement or their willingness to pay for continued access.
Further, the MCA only relates to a survey of Reading Room users and therefore obviously excludes other users although it does include Reading Room user responses to questions about the Library’s other functions
Nonetheless, the MCA provides a useful tool in dealing with questions which a formal BCA does not fully address.

Value of the British Library January 2013
62
13 References
Americans for Libraries Council (ALC) (2007) Worth Their Weight: An Assessment of the Evolving Field of Library Valuation
Boardman, A., Greenberg D., Vining, A., Weimer D., (2005) Cost-Benefit Analysis (3rd Edition)
British Library (2012a) The Power of Partnership: Thirty-ninth Annual Report and Accounts 2011/12
British Library (2012b) UK Research Reserve – A Sustainable Model from Print to E? Paper presented by Daryl Yang, UKRR Manager Kuopio Finland, August 2012, IFLA 2012 World Congress
Bureau of Transport Economics (BTE), Australia (1999) Facts and Furphies in Benefit-Cost Analysis:
Transport
CHEMS Consulting (2008) An Evaluation of Phase One of the UK Research Reserve: Report
Department for Environment, Food and Rural Affairs (DEFRA) (2003) A study to estimate the disamenity costs of landfill in Great Britain
Department for Transport (DfT), (2012, in draft) TAG UNIT 3.5.6 Values of Time and Vehicle Operating Costs
Department of Energy & Climate Change (DECC) (2011a) A brief guide to the carbon valuation methodology for UK policy appraisal
Department of Energy & Climate Change (DECC) (2011b) Valuation of energy use and greenhouse gas emissions for appraisal and evaluation
Department for Transport (DfT) (2008) Value for Money Assessments
HM Treasury (2003) The Green Book: Appraisal and Evaluation in Central Government
HM Treasury and Department for Work and Pensions (DWP) (2011) Valuation Techniques for Social Cost-Benefit Analysis: Stated Preference, Revealed Preference and Subjective Well-Being Approaches - A Discussion of the Current Issues
Indepen and Spectrum Consulting (2003): British Library Economic Impact Assessment
McKinsey & Company (2011) Internet matters: The Net's sweeping impact on growth, jobs, and prosperity
Morris Hargreaves McIntyre (MHM) (2012) The British Library 2011/12 - Annual rolling visitor research report
O’Brien, D. (2010) Measuring the value of culture: a report to the Department for Culture Media and Sport
Office for National Statistics (ONS) (2011) Mid-2010 Population Estimates: Single year of age and sex for local authorities in the United Kingdom; estimated resident population
Rolfe J. and Windle, J., (2010), Do values for protecting iconic assets vary across populations? A Great Barrier Reef case study, Environmental Economics Research Hub Research Reports Research Report No. 65
SGS Economics (2012) Dollars, Sense and Public Libraries
Wang., H. (1997) “Treatment of “Don’t Know” Responses in Contingent Valuation Surveys: A Random Valuation Model”, Journal of Environmental Economics and Management, Vol.32, pp.219-232

Value of the British Library January 2013
63
Appendix A: Survey forms
1. Reading Room Survey – Electronic version
Readers' Survey: Your chance to support our future The British Library is undertaking work with Oxford Economics to quantify how the British Library supports the UK economy. This surve y will help assess the value that the Library creates from the funding it receives. We would be grateful if you could spare approximate ly 15 minutes to take part in this important study by answering a few questions. Any information you provide will be treated in the strictest of confidence.
Which of the following best describes what you prim arily use the British Library Reading Rooms for? Please select only one.
Undergraduate research* (*i.e. Undertaken as staff or student of a university.) Postgraduate research* (*i.e. Undertaken as staff or student of a university.) Academic staff research* (*i.e. Undertaken as staff or student of a university.) Other Academic research* (*i.e. Undertaken as staff or student of a university.) Private sector business/work-related research as a company employee Private sector business/work-related research for your own company Non-governmental agency (NGO)/ charity research Public sector-related research Family history research Author-related research Other personal purposes
1.
Other Other, please specify:
If you have selected 'Other academic research', ple ase specify: 2.
Which Reading Rooms have you used in the last 12 mo nths? Please consider the St Pancras, Colindale and Boston Spa sites. Please answer all that apply.
Asian & African Studies Reading Room Business & IP Centre Humanities Reading Room Manuscripts Reading Room Maps Reading Room Rare Books & Music Reading Room Science Reading Rooms
3.
Social Sciences Reading Room

Value of the British Library January 2013
64
Newspaper Library (Colindale) Boston Spa Reading Room
Are you permanently resident in the UK (i.e. have you lived in the UK for at least the last six months )?
Yes
4.
No
On average, how many visits do you make each year t o the British Library Reading Rooms? (A visit is a single trip to the Library on a singl e day, not a visit over a period of several days)
1 - 2 visits each year 3 - 5 visits each year 6 - 12 visits each year 13 - 24 visits each year 25 - 52 visits each year 53 - 100 visits each year 101 - 200 visits each year 201 - 300 visits each year
5.
Over 300 visits each year
Approximately how long does it take you to make a r eturn trip from your home (or place of work) to the British Library and back agai n? If you are an overseas visitor, please indicate how long it takes you to travel to the British Library from where you were/are staying in the UK.
Less than 30 minutes 30 minutes to an hour 1 to 2 hours 2 to 3 hours 3 to 4 hours 4 to 5 hours 5 to 6 hours
6.
Over 6 hours
On average, how long do you spend in the British Li brary Reading Rooms on each single visit?
Less than 30 minutes 30 minutes to an hour 1 to 2 hours 2 to 3 hours
7.
3 to 4 hours

Value of the British Library January 2013
65
4 to 5 hours 5 to 6 hours Over 6 hours
What form of transport do you use to get to the Bri tish Library? If you use more than one type of transport, please indicate the type whi ch accounts for most of your journey time.
Tube Train Bus Car Walk Cycle
8.
Other Other, please specify:
Do you use a seasonal travel ticket (such as a week ly, monthly or yearly Oyster card, Travelcard or some other form of seasonal ticket) t o travel to and from the British Library? N.B. If you just use a ‘Pay as you go’ Oyster card or buy individual tickets to make your journeys, then your answer below should be ‘No’.
Yes - Weekly Oyster/Travelcard Yes - Monthly Oyster/Travelcard Yes - Yearly Oyster/Travelcard Yes - Other Oyster/Travelcard
9.
No
On average, how much does each visit to the British Library cost you, including transport costs, accommodation and other expenditur e?
Nothing Under £2 £2 - £5 £6 - £10 £11 - £30 £31 - £50 £51 - £100 £101 - £200 £201 - £500
10.
£501 - £1,000

Value of the British Library January 2013
66
Over £1,000
If possible, please also try to break down the majo r costs of the trip into transport, accommodation and food.
11.
Noth-ing
Un-der £2
£2-£5
£6-£10
£11-30
£31-50
£51-£100
£101-£200
£201-£500
Over £500
Transport
Accommodation
Food
How would your research be affected if you did not have access to British Library Reading Room services? Please select one.
Unaffected Somewhat affected
12.
Severely affected
For which of the following reasons do you use the B ritish Library Reading Rooms, rather than alternative sources of information? Please select all that apply.
Depth and breadth of the collections Unique items in the collections Up-to-date collections Support from British Library staff Comfortable working environment Costs me less to use the British Library than to use alternatives More likely to meet peers and colleagues at the British Library
13.
Other Other, please specify:
What additional costs would you have to incur per y ear if you were unable to use the British Library Reading Room services and therefore were reliant on alternatives? Please consider transport, accommodation and cost o f access to materials. Please try to provide an answer, even if you would not use these alternatives, in the event you were unable to use the British Library Re ading Rooms.
£1 - £100 £101 - £500 £501 - £1,000 £1,001 - £5,000 £5,001 - £10,000
14.
£10,001 +

Value of the British Library January 2013
67
Nothing, no alternatives are available Nothing, use of alternatives would not increase my costs
We would now like to ask you some questions designe d to help value the British Library Reading Rooms and the services they provide.
The British Library is funded primarily through gen eral taxation. In the unlikely event that this funding ceased to be provided, would you be willing to pay an amount, for example through donation or subscription, to help s upport the continuation of the British Library Reading Rooms and their services? These questions are not an indication that public f unding will end or that charges for services will be introduced. They are designed to c apture the value that you place on the British Library Reading Rooms and their service s. Please answer one option only.
Yes No
15.
Unable to answer
What would be the maximum amount you would be willi ng to pay per month as a donation or subscription to support the continuatio n of the British Library Reading Rooms and their services? These questions are not an indication that public f unding will end or that charges for services will be introduced. They are designed to c apture the value that you place on the British Library Reading Rooms and their service s. It is important that you try to answer this question to enable us to place a va lue on the Reading Rooms of the British Library and the services they provide.
16.
Imagine that the British Library ceased issuing Rea der Passes but allowed existing Readers to sell their Pass. What is the minimum amount you would be willing to accept as a monthly payment in return for your Pass? i.e. You would give up your Reader Pass forever in return for a monthly payment. This question is not an indication that the Library plans to stop issuing Reader Passes. It is designed to capture the value that you place on the British Library Reading Rooms. It is important you try to answer this ques tion, to enable us to place a value on the Reading Rooms of the British Library and the services they provide.
17.
Importance ratings Please providing a rating of how important the foll owing attributes of the British Library are to you. Indicate the number (on a scale of 1-10) that best corresponds to how important each attribute is to you. Give a higher rating to attrib utes that are more important to you and a lower one to those that are less important to you . For example, a 1 indicates the attribute is not imp ortant at all to you, while a 10 indicates it is extremely important to you.
17.
1 2 3 4 5 6 7 8 9 10

Value of the British Library January 2013
68
How important is the Library to you as a research resource?
How important to you is the fact that the Library is a trusted and credible source of information?
How important to you is remote access to the Library’s collections online?
How important to you is the physical environment of the Library as a productive place to study?
How important to you is the uniqueness of the Library’s collections?
How important to you is the depth and breadth of the Library’s collections?
How important to you is the Library as a resource which stimulates and enables innovation?
How important to you is the fact that many of the Library’s services are free?
How important to you is the depth and reliability of the Library’s staff knowledge?
How important to you is the Library’s digitised content?
How important to you is the fact that the Library provides comprehensive business support in one place?
How important to you is the Library’s role in providing for your own self-fulfilment and general well-being?
How important to you is the international stature which the Library gives the UK?
How important to you is the role of the Library in preserving the nation’s memory?
How important to you is the Library’s exhibition programme?
This section is for UK residents only. Please assist us by completing the following demogr aphic questions if possible. All information will be treated as confidential. The re ason we are collecting this information is to try and ascertain where our Reading Room users are from and how they compare to the general profile of the population.
Value of the British Library January 2013
69
This section is for UK residents only. Please assist us by completing the following demogr aphic questions if possible. All information will be treated as confidential. The re ason we are collecting this information is to try and ascertain where our Reading Room users are from and how they compare to the general profile of the population. Only answer the questions in this section if you ar e currently resident in the UK (i.e. you have lived here for at least six months).
Where is your permanent residence?
Central London (Zones 1-3) Greater London (Zones 4-6) South East England (excluding Greater London) South West England East Midlands West Midlands East of England* (* This includes Essex, Hertfordshire, Bedfordshire, Cambridgeshire, Norfolk and Suffolk.) North East England North West England Yorkshire and the Humber Scotland Northern Ireland
18.
Wales
What is your home town/city? 19.
What is your postcode? 20.
What is your nearest tube or train station? 21.
What is your gender?
Male Female
22.
Prefer not to say
What is your main occupation?
Full-time employment Part-time employment
23.
Self-employed

Value of the British Library January 2013
70
Student Unemployed Retired Long-term illness Other
Other, please specify:
What is the highest educational level you have reac hed?
GCSE/O-level/CSE Vocational qualification A-level or equivalent Bachelor degree or equivalent Masters/PhD or equivalent Other professional qualifications No formal qualifications
24.
Still studying
What is your age?
Under 18 18 - 24 25 - 34 35 - 44 45 - 54 55 - 64
25.
65+
Which of the following brackets does your annual pe rsonal income (before tax) fall into?
Less than £12,400 £12,401 - £21,500 £21,501 - £33,900 £33,901 - £52,800 £52,801 - £71,100
26.
Over £71,100 This section is for Overseas visitors only. Please do not complete it if you are a UK resident. Please assist us by completing the following questi ons if possible. All information will be treated as confidential. Only answer the questions in this section if you are NOT currently resident in the UK.
Value of the British Library January 2013
71
What country do you normally live in? 27.
What town do you normally live in? 28.
What is your zip or post code? 29.
You’ve indicated that you have travelled to the UK to use the British Library Reading Rooms. Approximately how many trips have you made t o the UK which involved visiting the British Library in the past year?
30.
Considering the last trip you made which included a British Library visit, how long did it take you to travel to the UK from the town/city and country where you normally live? Please provide an answer in hours or (if relevant) days.
31.
Considering the last trip you made which included a British Library visit, how long did you spend in the UK on that trip (excluding the tim e taken to get here)?
32.
Considering the last trip you made which included a British Library visit, what was the reason(s) for that trip to the UK (you can select m ore than one option)?
33.
Considering the last trip you made which included a British Library visit, what was the reason(s) for that trip to the UK (you can select m ore than one option)?
Visit to the British Library Tourism/lLeisure Work Study/Research
34.
Other Other, please specify:
Approximately how much, in total, do you estimate i t cost to visit and stay in the UK on that trip? Please provide your answer in pounds (£) . If you are used to thinking in other currencies suc h as Euros or US dollars, you can use the following conversion table to help you. For example €1 = £0.8. So €1,000 would be £800.
£1 - £200 £201 - £300 £301 - £400
35.
£401 - £500
Value of the British Library January 2013
72
£501 - £600 £601 - £700 £701 - £800 £801 - £900 £901 - £1000 £1001 - £2000 £2001 - £3000 £3001 - £4000 £4001 - £5000 £5,001 - £7,500 £7,501 - £10,000 Over £10,000
If possible, please also try to break down the majo r costs of the trip into travel, accommodation and food.
36.
£1-200
£201-300
£301-400
£401-500
£501-£1k
£1k-£2.5 £2k-
5k £5k- £7.5
£7.5- £10k
Over £10k
Travel Thank you for your participation in this important study. Now that the survey is complete we would like to re assure you that the British Library has no intention of charging for access to its Reading Roo ms as a result of this study. The questions in this survey are solely intended to help the British Library determine its economic impact and demonstrate value for money to the nation. The results of this study will help the British Library to continue providing lead ing services to researchers. If you are at all unclear on the purposes of this survey, ple ase email [email protected] <mailto:[email protected]>

Value of the British Library January 2013
73
2. Reading Room Survey – Hard copy version
Dear Reader,
The British Library is working with Oxford Economics to undertake an economic evaluation of the British Library – and we need your help!
As part of the evaluation, we are surveying users of our Reading Rooms to find out more about how you use our services and what you value about the British Library.
We would be grateful if you would agree to complete this survey. It will take no more than 5-10 minutes.
The research will aim to quantify the impact of the Library on the UK economy - both directly and indirectly and most importantly to show the value that is given for the public funding that we receive. We hope to use the findings to support our case to sustain our great research library and provide world-class services for research and learning, business and the general public.
If you have any questions or comments about the survey, please email [email protected]
Many thanks,
Dame Lynne Brindley
Chief Executive
The British Library
British Library: Your chance to support our future.
Value of the British Library January 2013
74
• We are undertaking work with Oxford Economics to quantify how the British Library
supports the UK economy. This survey will help assess the value that the Library
creates from the funding it receives.
• We would be grateful if you could spare approximately 5-10 minutes to take part in
this important study by answering a few questions.
• Any information you provide will be treated in the strictest of confidence.
• Please return your completed questionnaire to the Information Desk in the
Entrance Hall if you are in the St Pancras building (i.e. the British Library’s main
site in London), or to counter staff if you are in the Newspaper Library at Colindale
(North London) or the Reading Room at Boston Spa (Yorkshire).
-----------------------------------------------------------------------------------------------------
1. Which of the following best describes what you primarily use the British Library
Reading Rooms for? Please tick one only.
� Undergraduate research*
� Postgraduate research*
� Academic staff research*
� Other academic research* (Please specify:.........................................................)
� Private sector business/work-related research as a company employee
� Private sector business/work-related research for your own company
� Non-governmental agency (NGO)/charity research
� Public sector-related research
� Family history research
� Author-related research
� Other personal purposes
� Other (Please specify:.......................................................................................)
*i.e. Undertaken as staff or student of a university.
2. Do you hold the following passes? Please answer all that apply.
Reading Room Survey: Your chance to support our future
June 2012
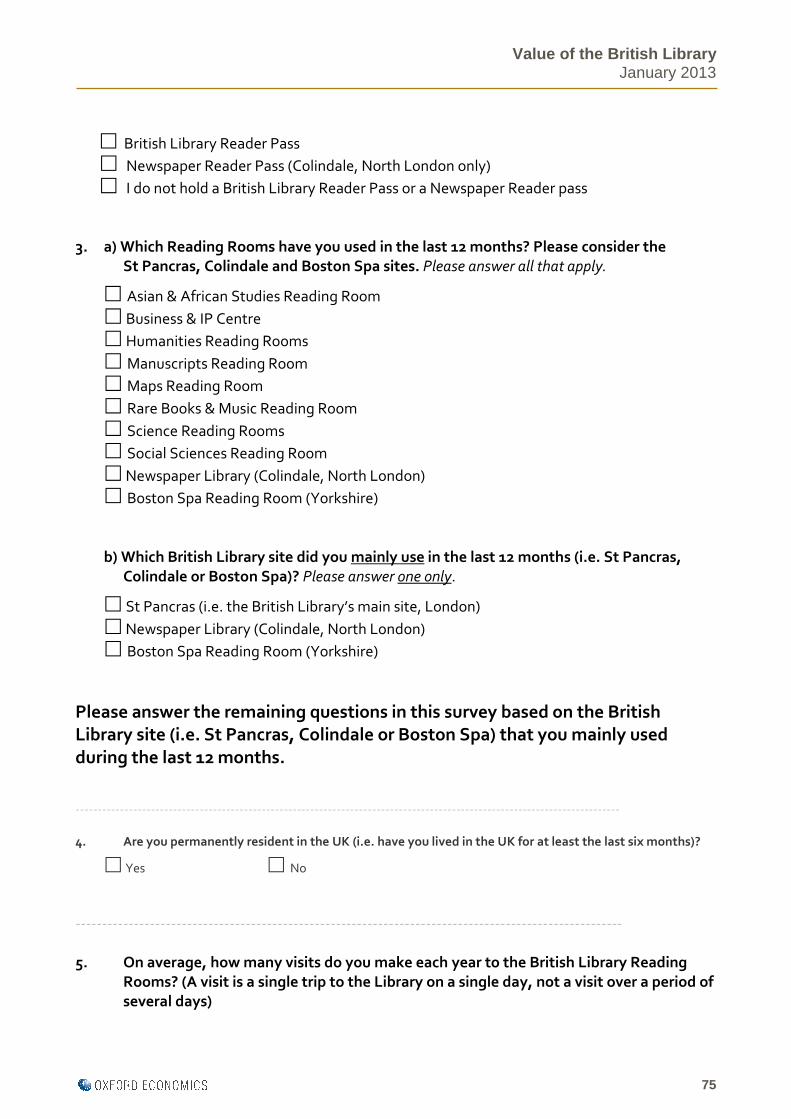
Value of the British Library January 2013
75
� British Library Reader Pass
� Newspaper Reader Pass (Colindale, North London only)
� I do not hold a British Library Reader Pass or a Newspaper Reader pass
3. a) Which Reading Rooms have you used in the last 12 months? Please consider the
St Pancras, Colindale and Boston Spa sites. Please answer all that apply.
� Asian & African Studies Reading Room
� Business & IP Centre
� Humanities Reading Rooms
� Manuscripts Reading Room
� Maps Reading Room
� Rare Books & Music Reading Room
� Science Reading Rooms
� Social Sciences Reading Room
� Newspaper Library (Colindale, North London)
� Boston Spa Reading Room (Yorkshire)
b) Which British Library site did you mainly use in the last 12 months (i.e. St Pancras,
Colindale or Boston Spa)? Please answer one only.
� St Pancras (i.e. the British Library’s main site, London)
� Newspaper Library (Colindale, North London)
� Boston Spa Reading Room (Yorkshire)
Please answer the remaining questions in this survey based on the British
Library site (i.e. St Pancras, Colindale or Boston Spa) that you mainly used
during the last 12 months.
---------------------------------------------------------------------------------------------------------------------------
4. Are you permanently resident in the UK (i.e. have you lived in the UK for at least the last six months)?
� Yes � No
-------------------------------------------------------------------------------------------------------
5. On average, how many visits do you make each year to the British Library Reading
Rooms? (A visit is a single trip to the Library on a single day, not a visit over a period of
several days)

Value of the British Library January 2013
76
Number of visits:
If you are not sure of the exact number, please indicate a range based on the options in the
table immediately below:
--------------------------------------------------------------------------------------------------
6. Approximately how long does it take you (in hours and/or minutes) to make a return
trip from your home (or place of work) to the British Library and back again?
Your journey time should be measured from where you normally travel to the British Library, be
that either from home or work and include the return trip time.
If you are an overseas visitor please indicate how long it takes you to travel to the British Library
from where you are staying in the UK. You will be asked about your trip to the UK in another
section of this questionnaire.
If you are not sure how long your complete trip time takes, please give an estimated range based
on the options in the table immediately below:
Return trip time
Less than 30 minutes
30 minutes to an hour
1 to 2 hours
2 to 3 hours
3 to 4 hours
4 to 5 hours
5 to 6 hours
Number of visits
1 – 2 visits each year
3 – 5 visits each year
6 – 12 visits each year
13 – 24 visits each year
25 – 52 visits each year
53 – 100 visits each year
101 – 200 visits each year
201 – 300 visits each year
Over 300 visits each year
Hours Minutes

Value of the British Library January 2013
77
Over 6 hours
-------------------------------------------------------------------------------------------------------
7. On average, how long do you spend in the British Library Reading Rooms on each
single visit?
If you are not sure how long you spend in the British Library Reading Rooms, please give an
estimate based on the ranges in the table immediately below:
Time spent in Library Reading Rooms
Less than 30 minutes
30 minutes to an hour
1 to 2 hours
2 to 3 hours
3 to 4 hours
4 to 5 hours
5 to 6 hours
Over 6 hours
------------------------------------------------------------------------------------------------------
8. a) What form of transport do you use to get to the British Library? If you use more than
one type of transport, please indicate the type which accounts for most of your journey
time.
Transport type
Tube
Train
Bus
Car
Walk
Cycle
Other
(Please specify.................)
Hours Minutes
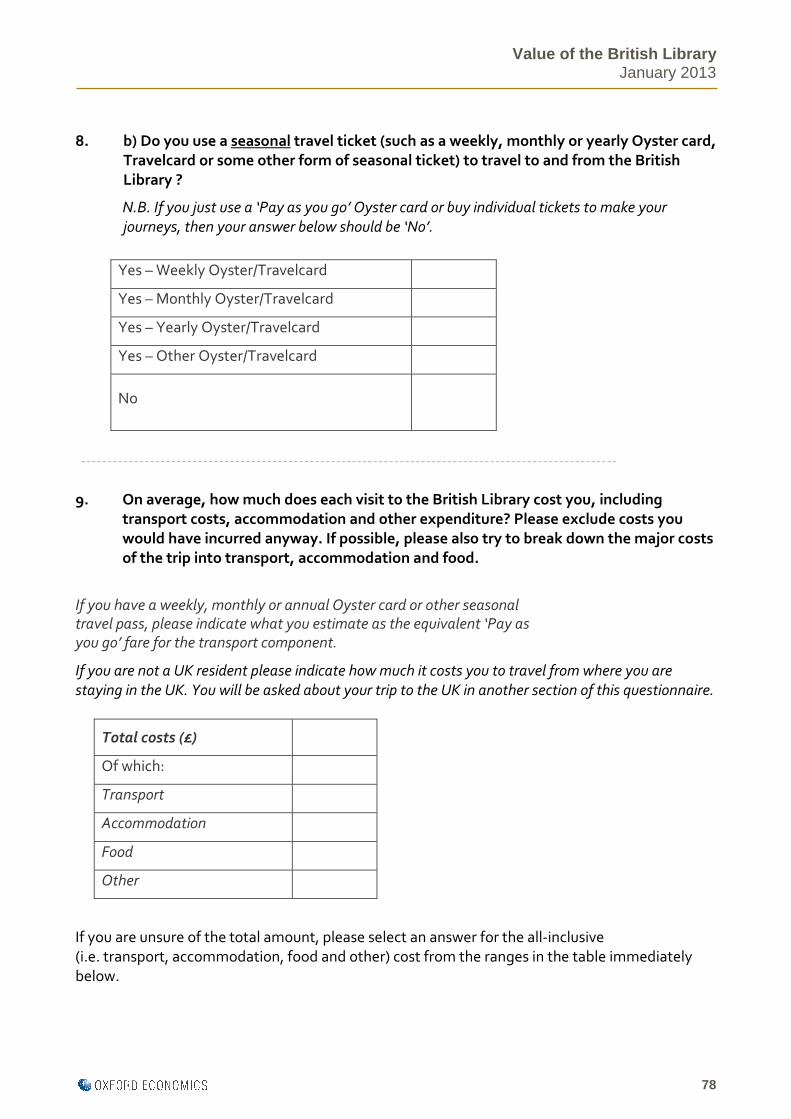
Value of the British Library January 2013
78
8. b) Do you use a seasonal travel ticket (such as a weekly, monthly or yearly Oyster card,
Travelcard or some other form of seasonal ticket) to travel to and from the British
Library ?
N.B. If you just use a ‘Pay as you go’ Oyster card or buy individual tickets to make your
journeys, then your answer below should be ‘No’.
-----------------------------------------------------------------------------------------------------
9. On average, how much does each visit to the British Library cost you, including
transport costs, accommodation and other expenditure? Please exclude costs you
would have incurred anyway. If possible, please also try to break down the major costs
of the trip into transport, accommodation and food.
If you have a weekly, monthly or annual Oyster card or other seasonal travel pass, please indicate what you estimate as the equivalent ‘Pay as you go’ fare for the transport component.
If you are not a UK resident please indicate how much it costs you to travel from where you are
staying in the UK. You will be asked about your trip to the UK in another section of this questionnaire.
Total costs (£)
Of which:
Transport
Accommodation
Food
Other
If you are unsure of the total amount, please select an answer for the all-inclusive
(i.e. transport, accommodation, food and other) cost from the ranges in the table immediately
below.
Yes – Weekly Oyster/Travelcard
Yes – Monthly Oyster/Travelcard
Yes – Yearly Oyster/Travelcard
Yes – Other Oyster/Travelcard
No

Value of the British Library January 2013
79
Cost
Nothing
Under £2
£2 - £5
£6 - £10
£11 - £30
£31 - £50
£51 - £100
£101 - £200
£201 - £500
£501 - £1,000
Over £1,000
--------------------------------------------------------------------------------------------------
10. How would your research be affected if you did not have access to British
Library Reading Room services? Please select one.
Unaffected
Somewhat affected
Severely affected
------------------------------------------------------------------------------------------------
11. For which of the following reasons do you use the British Library Reading
Rooms, rather than alternative sources of information? Please select all that
apply.
Depth and breadth of the collections
Unique items in the collections
Up-to-date collections
Support from British Library staff
Comfortable working environment
Costs me less to use the British Library than
to use alternatives
More likely to meet peers and colleagues at

Value of the British Library January 2013
80
the British Library
Other (please specify..............................)
12. What additional costs would you have to incur per year if you were unable to
use the British Library Reading Room services and therefore were reliant on
alternatives?
Please consider transport, accommodation and cost of access to materials.
Please try to provide an answer, even if you would not use these alternatives, in the event you
were unable to use the British Library Reading Rooms.
If you are unsure of the amount, please select one option from the table immediately below.
£1 - £100
£101 - £500
£501 - £1,000
£1,001 - £5,000
£5,001 - £10,000
£10,001 +
Nothing, no alternatives are available
Nothing, use of alternatives would not increase my costs
---------------------------------------------------------------------------------------------------
We would now like to ask you some questions designed to help value the British Library
Reading Rooms and the services they provide.
13. The British Library is funded primarily through general taxation. In the unlikely
event that this funding ceased to be provided, would you be willing to pay an
amount, for example through donation or subscription, to help support the
continuation of the British Library Reading Rooms and their services?
These questions are not an indication that public funding will end or that charges for services
will be introduced. They are designed to capture the value that you place on the British Library
Reading Rooms and their services.
Please answer one option only.
£ per
annum

Value of the British Library January 2013
81
Yes
No
Unable to answer
If you answered ‘Yes’, please go to Question 14 and then to Question 15. If you answered ‘No’, or ‘Unable to answer’ please go directly to Question 15.
-----------------------------------------------------------------------------------------------------
14. What would be the maximum amount you would be willing to pay per month as a
donation or subscription to support the continuation of the British Library Reading
Rooms and their services?
These questions are not an indication that public funding will end or that charges for services will
be introduced. They are designed to capture the value that you place on the British Library
Reading Rooms and their services.
It is important that you try to answer this question to enable us to place a value on the Reading
Rooms of the British Library and the services they provide.
Maximum amount you are
willing to pay per month (£)
Unable to answer
----------------------------------------------------------------------------------------------------
15. Imagine that the British Library ceased issuing Reader Passes but allowed existing
Readers to sell their Pass. What is the minimum amount you would be willing to
accept as a monthly payment in return for your Pass? i.e. You would give up your
Reader Pass forever in return for a monthly payment.
(Additional note to Colindale and Boston Spa users only: If your main use during
the last year was of the Colindale site and you have a Newspaper Reader Pass then
please answer with respect to your valuation of a Newspaper Reader Pass. Those
who mainly used the Boston Spa site do not need to answer this question.)
This question is not an indication that the Library plans to stop issuing Reader Passes. It is
designed to capture the value that you place on the British Library Reading Rooms.
It is important you try to answer this question, to enable us to place a value on the Reading

Value of the British Library January 2013
82
Rooms of the British Library and the services they provide.
Minimum amount you are willing
to accept per month (£)
Unable to answer
--------------------------------------------------------------------------------------------------------
16. Importance ratings
Please provide a rating of how important the following attributes of the British Library are to you.
Indicate the number (on a scale of 1-10) that best corresponds to how important each attribute is
to you. Give a higher rating to attributes that are more important to you and a lower one to those
that are less important to you.
For example, a 1 indicates the attribute is not important at all to you, while a 10 indicates it is
extremely important to you. In the example below, the rating of 8 means that the attribute is
towards the more important end of the scale.
Not important at all Extremely important
1 2 3 4 5 6 7 8 9 10
(Additional note to Colindale and Boston Spa users only: Please answer with respect to your
usage of Colindale, if your main use during the last year was of the Colindale site. If your main use
during the last year was of the Boston Spa site, then please answer with respect to your usage of
Boston Spa.)
How important is the Library to you as a research resource?
Not important at all Extremely important
1 2 3 4 5 6 7 8 9 10
How important to you is the fact that the Library is a trusted and credible source of information?
Not important at all Extremely important
1 2 3 4 5 6 7 8 9 10
--------------------------------------------------------------------------------------------------------
How important to you is remote access to the Library’s collections online?
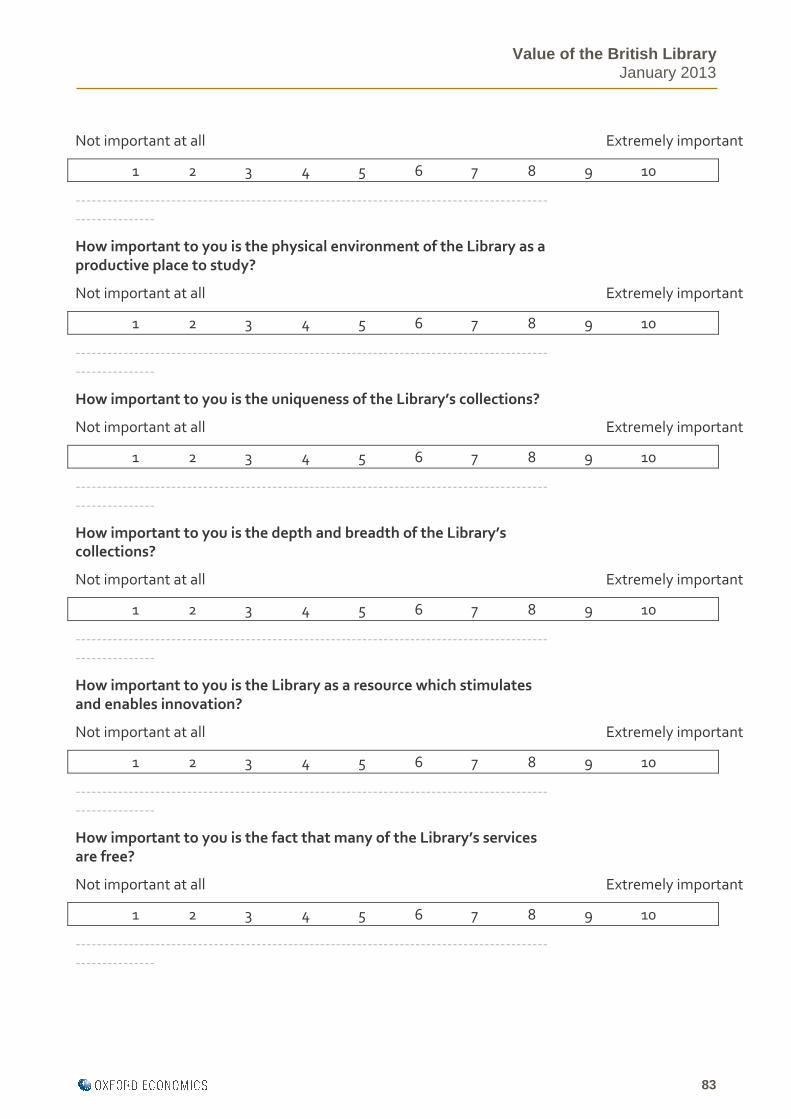
Value of the British Library January 2013
83
Not important at all Extremely important
1 2 3 4 5 6 7 8 9 10
--------------------------------------------------------------------------------------------------------
How important to you is the physical environment of the Library as a productive place to study?
Not important at all Extremely important
1 2 3 4 5 6 7 8 9 10
--------------------------------------------------------------------------------------------------------
How important to you is the uniqueness of the Library’s collections?
Not important at all Extremely important
1 2 3 4 5 6 7 8 9 10
--------------------------------------------------------------------------------------------------------
How important to you is the depth and breadth of the Library’s collections?
Not important at all Extremely important
1 2 3 4 5 6 7 8 9 10
--------------------------------------------------------------------------------------------------------
How important to you is the Library as a resource which stimulates and enables innovation?
Not important at all Extremely important
1 2 3 4 5 6 7 8 9 10
--------------------------------------------------------------------------------------------------------
How important to you is the fact that many of the Library’s services are free?
Not important at all Extremely important
1 2 3 4 5 6 7 8 9 10
--------------------------------------------------------------------------------------------------------
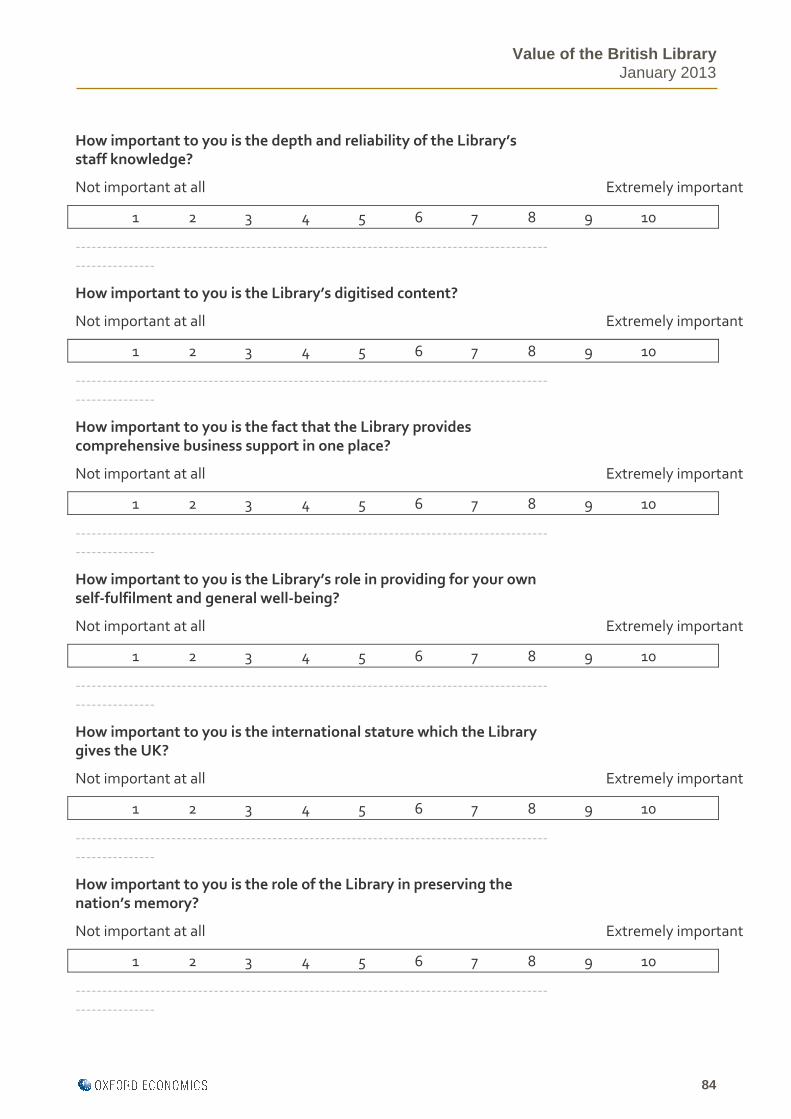
Value of the British Library January 2013
84
How important to you is the depth and reliability of the Library’s staff knowledge?
Not important at all Extremely important
1 2 3 4 5 6 7 8 9 10
--------------------------------------------------------------------------------------------------------
How important to you is the Library’s digitised content?
Not important at all Extremely important
1 2 3 4 5 6 7 8 9 10
--------------------------------------------------------------------------------------------------------
How important to you is the fact that the Library provides comprehensive business support in one place?
Not important at all Extremely important
1 2 3 4 5 6 7 8 9 10
--------------------------------------------------------------------------------------------------------
How important to you is the Library’s role in providing for your own self-fulfilment and general well-being?
Not important at all Extremely important
1 2 3 4 5 6 7 8 9 10
--------------------------------------------------------------------------------------------------------
How important to you is the international stature which the Library gives the UK?
Not important at all Extremely important
1 2 3 4 5 6 7 8 9 10
--------------------------------------------------------------------------------------------------------
How important to you is the role of the Library in preserving the nation’s memory?
Not important at all Extremely important
1 2 3 4 5 6 7 8 9 10
--------------------------------------------------------------------------------------------------------

Value of the British Library January 2013
85
How important to you is the Library’s exhibition programme?
Not important at all Extremely important
1 2 3 4 5 6 7 8 9 10
--------------------------------------------------------------------------------------------------------
How important to you are the Library’s programmes for schools and Learning?
Not important at all Extremely important
1 2 3 4 5 6 7 8 9 10
-----------------------------------------------------------------------------------------------------------------
This section (Questions 17 to 25) is for UK residents only. If you are an Overseas
visitor, please go to Question 26.
Please assist us by completing the following demographic questions if possible. All information will be treated as confidential. The reason we are collecting this information is to try and ascertain where our Reading Room users are from and how they compare to the general profile of the population.
Only answer the questions in this section if you are currently resident in the UK (i.e. you have lived here for at least six months).
17. Where is your permanent residence?
Locations
Central London (Zones 1-3)
Greater London (Zones 4-6)
South East England (excluding Greater
London)
South West England
East Midlands
West Midlands
East of England*
North East England
North West England
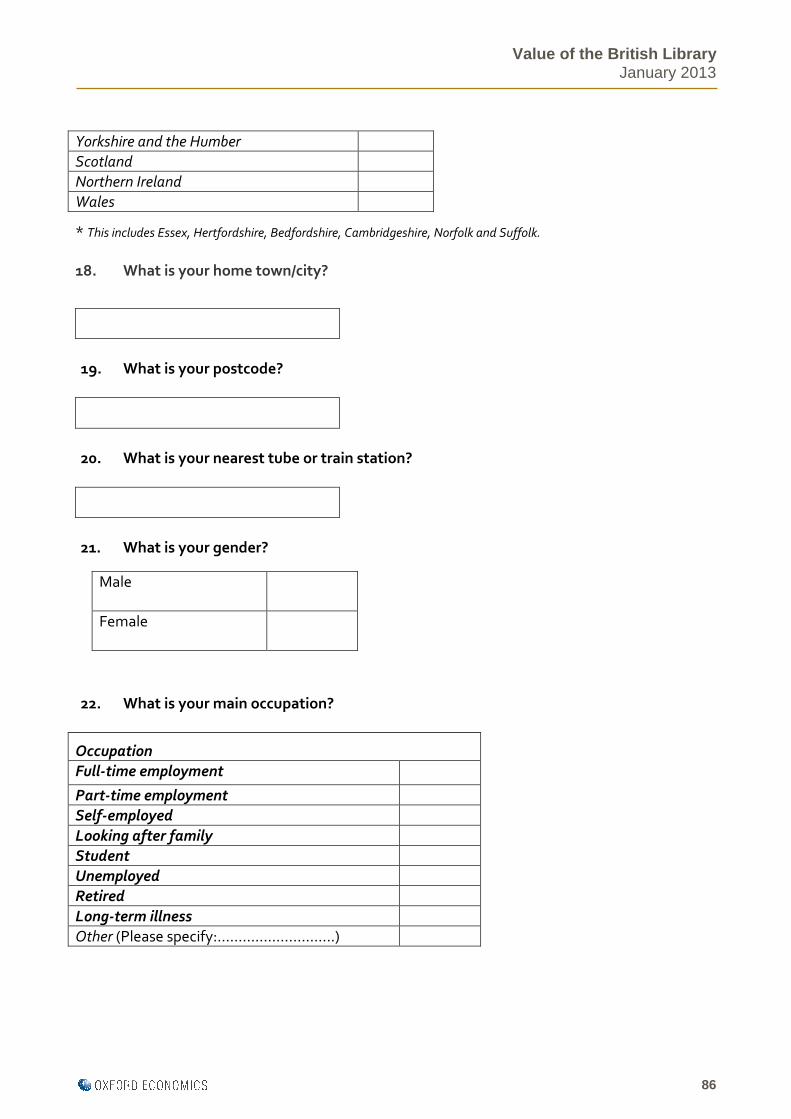
Value of the British Library January 2013
86
Yorkshire and the Humber
Scotland
Northern Ireland
Wales * This includes Essex, Hertfordshire, Bedfordshire, Cambridgeshire, Norfolk and Suffolk.
18. What is your home town/city?
19. What is your postcode?
20. What is your nearest tube or train station?
21. What is your gender?
22. What is your main occupation?
Occupation
Full-time employment
Part-time employment
Self-employed
Looking after family
Student
Unemployed
Retired
Long-term illness
Other (Please specify:……………………….)
Male
Female
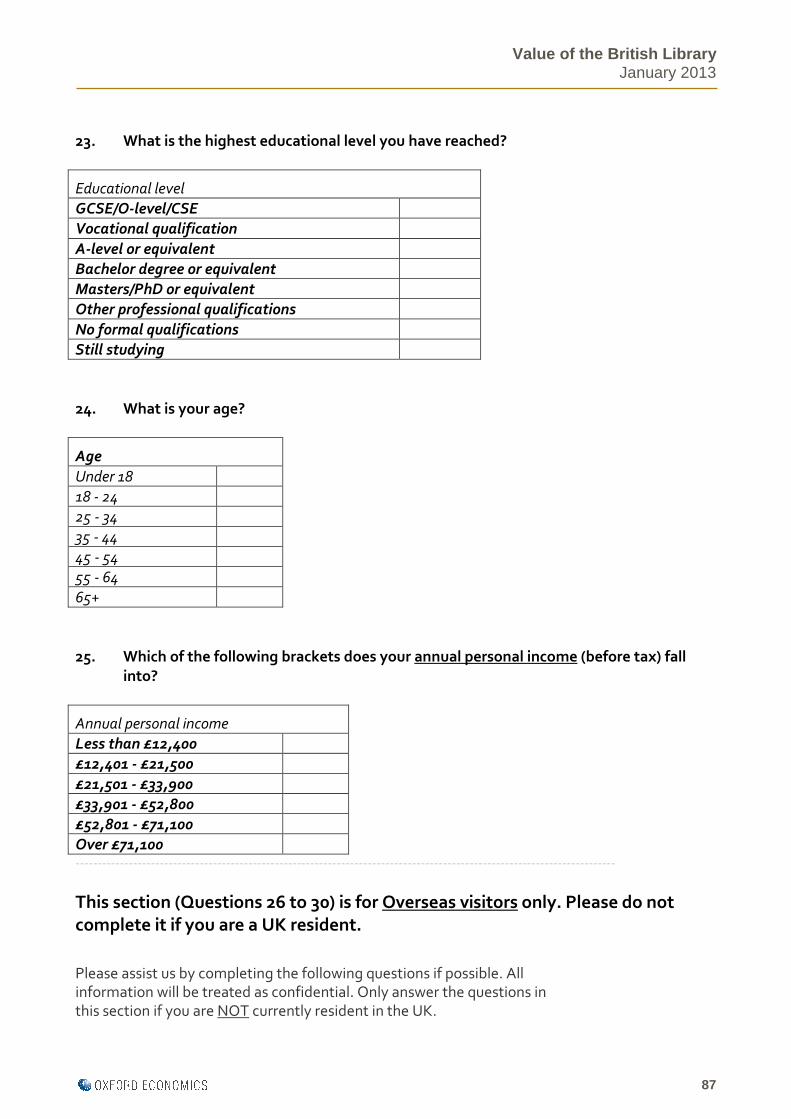
Value of the British Library January 2013
87
23. What is the highest educational level you have reached?
Educational level
GCSE/O-level/CSE
Vocational qualification
A-level or equivalent
Bachelor degree or equivalent
Masters/PhD or equivalent
Other professional qualifications
No formal qualifications
Still studying
24. What is your age?
Age
Under 18
18 - 24
25 - 34
35 - 44
45 - 54
55 - 64
65+
25. Which of the following brackets does your annual personal income (before tax) fall
into?
Annual personal income
Less than £12,400
£12,401 - £21,500
£21,501 - £33,900
£33,901 - £52,800
£52,801 - £71,100
Over £71,100 --------------------------------------------------------------------------------------------------------------------------
This section (Questions 26 to 30) is for Overseas visitors only. Please do not
complete it if you are a UK resident.
Please assist us by completing the following questions if possible. All information will be treated as confidential. Only answer the questions in this section if you are NOT currently resident in the UK.
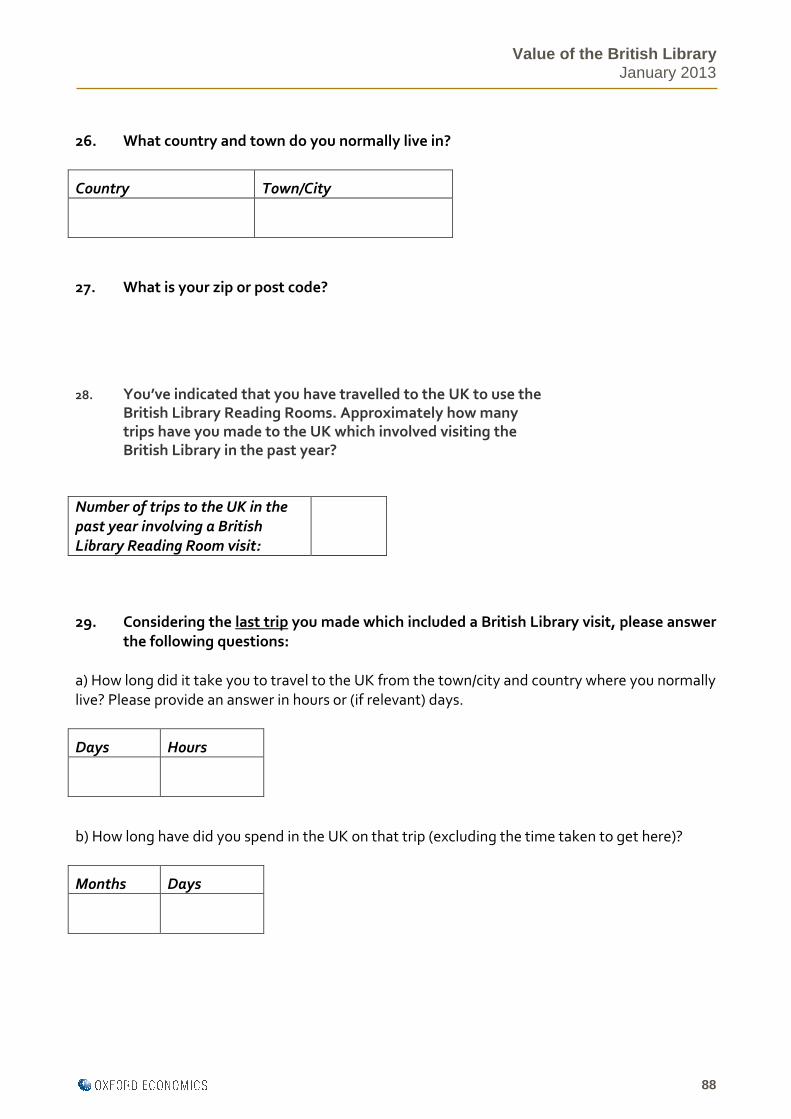
Value of the British Library January 2013
88
26. What country and town do you normally live in?
Country Town/City
27. What is your zip or post code?
28. You’ve indicated that you have travelled to the UK to use the British Library Reading Rooms. Approximately how many trips have you made to the UK which involved visiting the British Library in the past year?
Number of trips to the UK in the
past year involving a British
Library Reading Room visit:
29. Considering the last trip you made which included a British Library visit, please answer
the following questions:
a) How long did it take you to travel to the UK from the town/city and country where you normally
live? Please provide an answer in hours or (if relevant) days.
Days Hours
b) How long have did you spend in the UK on that trip (excluding the time taken to get here)?
Months Days
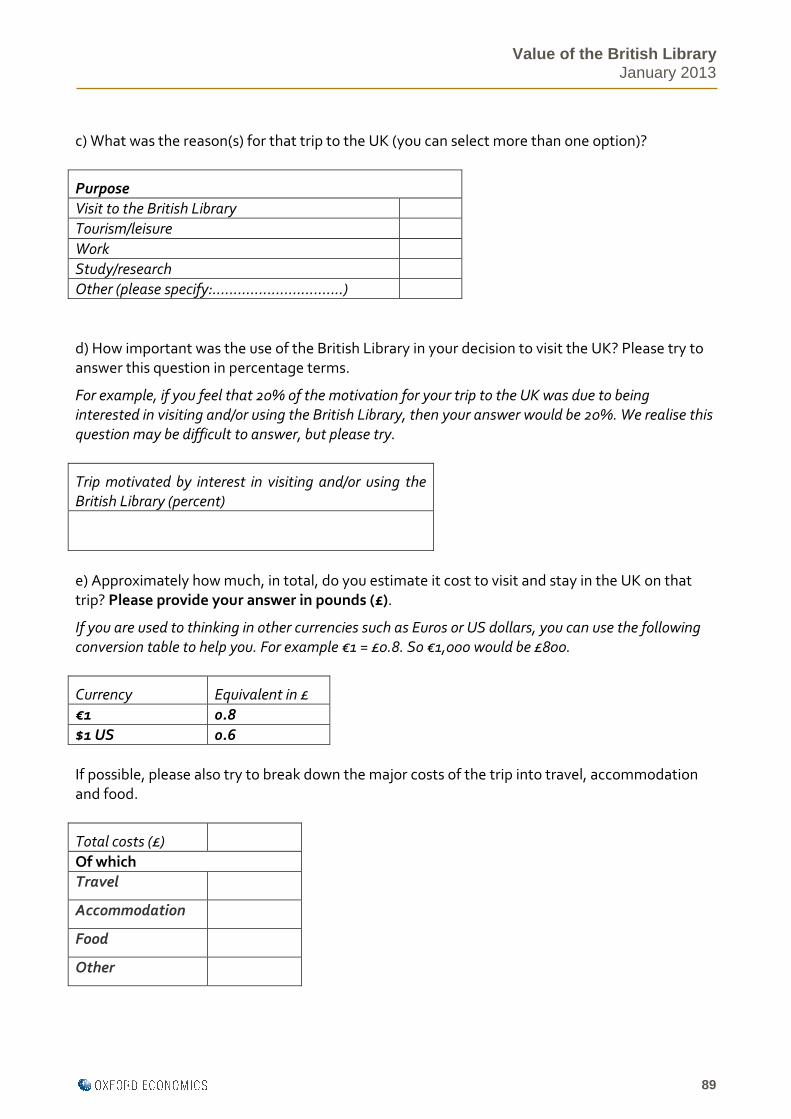
Value of the British Library January 2013
89
c) What was the reason(s) for that trip to the UK (you can select more than one option)?
Purpose
Visit to the British Library
Tourism/leisure
Work
Study/research
Other (please specify:...............................)
d) How important was the use of the British Library in your decision to visit the UK? Please try to
answer this question in percentage terms.
For example, if you feel that 20% of the motivation for your trip to the UK was due to being
interested in visiting and/or using the British Library, then your answer would be 20%. We realise this
question may be difficult to answer, but please try.
Trip motivated by interest in visiting and/or using the
British Library (percent)
e) Approximately how much, in total, do you estimate it cost to visit and stay in the UK on that
trip? Please provide your answer in pounds (£).
If you are used to thinking in other currencies such as Euros or US dollars, you can use the following
conversion table to help you. For example €1 = £0.8. So €1,000 would be £800.
Currency Equivalent in £
€1 0.8
$1 US 0.6
If possible, please also try to break down the major costs of the trip into travel, accommodation
and food.
Total costs (£)
Of which
Travel
Accommodation
Food
Other

Value of the British Library January 2013
90
30. Which of the following brackets does your annual personal income (before tax) fall into?
If you are used to thinking in other currencies such as Euros or US dollars you can use the following
conversion table to help you. For example €1 = £0.8. So €1,000 would be £800.
Currency Equivalent in £
€1 0.8
$1 US 0.6
--------------------------------------------------------------------------------------------------------
Thank you for your participation in this important study.
• Now that the survey is complete we would like to reassure you that the British Library
has no intention of charging for access to its Reading Rooms as a result of this study.
• The questions in this survey are solely intended to help the British Library determine its
economic impact and demonstrate value for money to the nation. The results of this
study will help the British Library to continue providing leading services to researchers.
• If you are at all unclear on the purposes of this survey, please email
Please return your completed questionnaire to the Information Desk in the
Entrance Hall, if you are in the St Pancras building.
Please return it to counter staff if you are in the Newspaper Library at
Colindale or the Reading Room at Boston Spa.
Annual personal income
Less than £12,400
£12,401 - £21,500
£21,501 - £33,900
£33,901 - £52,800
£52,800 - £71,100
Over £71,100

Value of the British Library January 2013
91
3. Document Supply Survey
Document Supply and Bibliographic Services Survey
Covering email
The British Library is working with Oxford Economics to undertake an economic evaluation of the Library. We will use the findings to sustain our great research library and provide world-class services for research and learning, business and the general public. As part of the study we are surveying users of our Document Supply and Bibliographic Services to find out more about how you use our services and what you value most about them. We would be extremely grateful if you would complete the survey. Any information you provide will be treated in the strictest of confidence. It will take approximately 15 minutes to complete and can be accessed at this link: xxxxxxxxxxxxxxxxxxxxxx.
The survey is directed at the individual who would be best placed to put a value on the services the British Library Document Supply and Bibliographic provides to your organisation. Please feel free to forward on this email if a colleague is better placed to respond. Please note that the survey questions are designed to capture the value that you place on the Document Supply and Bibliographic Services and improve their delivery in the future. They are not an indication that the British Library plans to change its services or increase its charges.
If you have any questions or comments about the survey, please email [email protected]. Many thanks, Andrew Appleyard Head of Document Delivery & Customer Services British Library
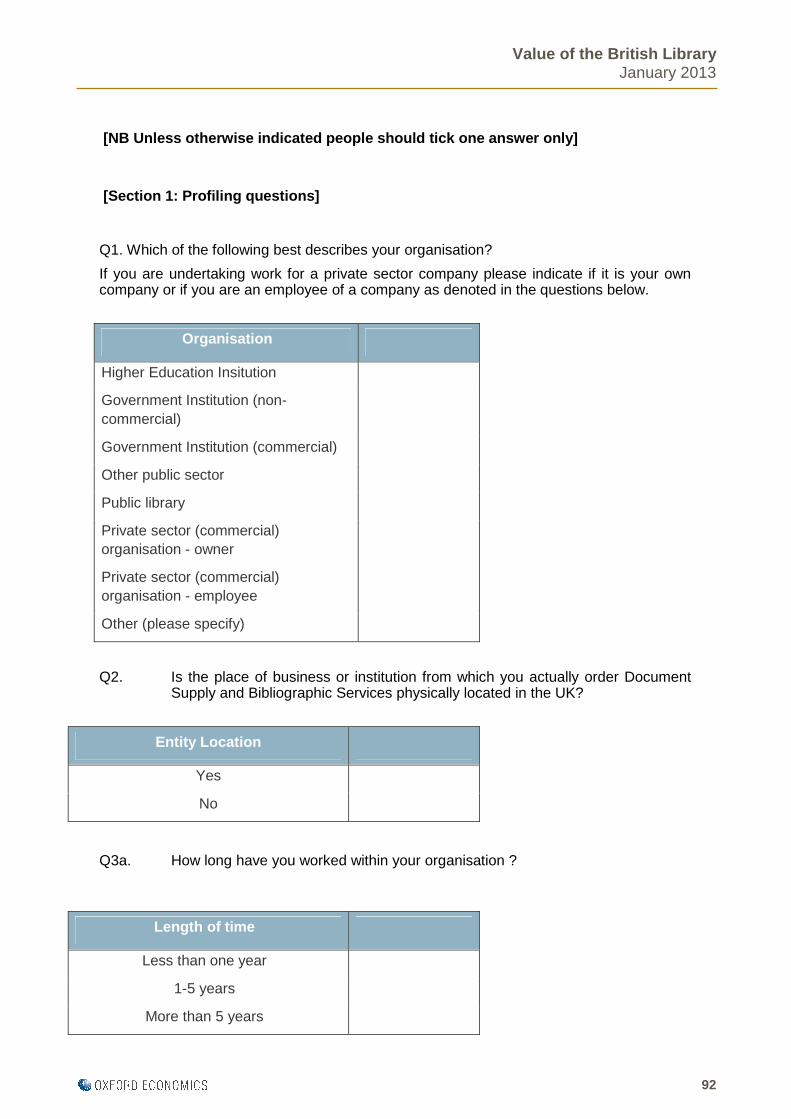
Value of the British Library January 2013
92
[NB Unless otherwise indicated people should tick o ne answer only]
[Section 1: Profiling questions]
Q1. Which of the following best describes your organisation?
If you are undertaking work for a private sector company please indicate if it is your own company or if you are an employee of a company as denoted in the questions below.
Q2. Is the place of business or institution from which you actually order Document Supply and Bibliographic Services physically located in the UK?
Q3a. How long have you worked within your organisation ?
Organisation
Higher Education Insitution
Government Institution (non-commercial)
Government Institution (commercial)
Other public sector
Public library
Private sector (commercial) organisation - owner
Private sector (commercial) organisation - employee
Other (please specify)
Entity Location
Yes
No
Length of time
Less than one year
1-5 years
More than 5 years

Value of the British Library January 2013
93
Q3b. Do you have any responsibilities for managing your organisation’s budget with respect to library and information services?
[Section 2. Service use questions]
Q4. Which of the following British Library services does your organisation use? Please answer all that apply.
Role
Yes – I am the person who is responsible for managing the library and/or information services budget
Yes – I am a decision maker for the library and/or information services budget
No – I have no formal role in library and/or information services budget
Other (please specify)
Service
Basic document supply services (e.g. standard service, loans)
Premium document supply services (e.g. 2hr, 24 hr, Re-Prints)
British Library Direct / BLD+
Inside
Extended search options
Licensing of catalogue records (directly with the British Library) such as the BL MARC, ETOC and AMED
Digitisation
Ethos
UKRR
Other (please specify)

Value of the British Library January 2013
94
[Section 3. Frequency of use questions]
Q5. On average, how many documents do you estimate that your organisation requests from British Library Document Supply and Bibliographic Services per month ? If you don’t request documents each month just provide a monthly average over the past year.
If you are an employee of an organisation please provide an answer for your whole organisation. We realise that this may be difficult, but please try to provide your best estimate.
Q6. Which, if any, of the following British Library Bibliographic Services does your organisation license or subscribe to? Please answer all that apply.
Documents requested per month
Less than 1
1-10
11-50
51-100
101-250
251-500
More than 500
Don’t know
Services subscribed to
Electronic Table of Contents (ETOC)
BL MARC
The Allied and Complementary Medicine Database (AMED)
None
Don’t know

Value of the British Library January 2013
95
Q7. Which, if any, of the following service providers of bibliographic records does your organisation use? Please answer all that apply.
Q8a. In total, how much does your organisation spend per year on Document Supply and Bibliographic services from the British Library?
If you do not know precisely, please provide a rough estimate.
If you have multiple accounts please include the total. We realise that this may be difficult, but please try to provide your best estimate.
Service
Ovid
Silver Platter
BDS
Bowker
RLUK
LIBPAC
Nielsen
OCLC
Other
None
Don’t know
Amount
£0
£1-£1,000
£1,000-£2,500
£2,501-£5,000
£5,001 -£10,000
£10,001 -£15,000
£15,001 - £25,000
£25,001 - £35,000
£35,001 – £50,000
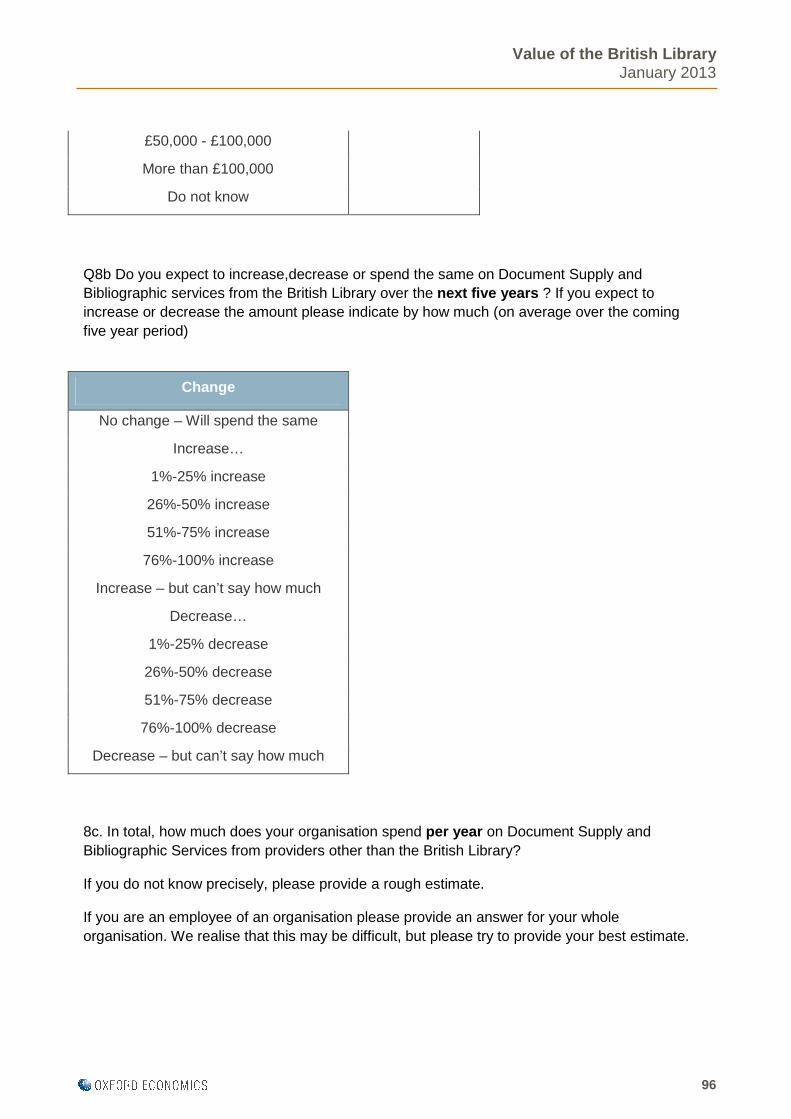
Value of the British Library January 2013
96
Q8b Do you expect to increase,decrease or spend the same on Document Supply and Bibliographic services from the British Library over the next five years ? If you expect to increase or decrease the amount please indicate by how much (on average over the coming five year period)
8c. In total, how much does your organisation spend per year on Document Supply and Bibliographic Services from providers other than the British Library?
If you do not know precisely, please provide a rough estimate.
If you are an employee of an organisation please provide an answer for your whole organisation. We realise that this may be difficult, but please try to provide your best estimate.
£50,000 - £100,000
More than £100,000
Do not know
Change
No change – Will spend the same
Increase…
1%-25% increase
26%-50% increase
51%-75% increase
76%-100% increase
Increase – but can’t say how much
Decrease…
1%-25% decrease
26%-50% decrease
51%-75% decrease
76%-100% decrease
Decrease – but can’t say how much

Value of the British Library January 2013
97
Q8d. Do you expect to increase, decrease or spend the same on Document Supply and Bibliographic services from providers other than the British Library over the next five years ?
If you expect to increase or decrease the amount please indicate by how much (on average over the coming five yeat period).
Amount
£0
£1-£1,000
£1,000-£2,500
£2,501-£5,000
£5,001 -£10,000
£10,001 -£15,000
£15,001 - £25,000
£25,001 - £35,000
£35,001 – £50,000
£50,000 - £100,000
More than £100,000
Do not know
Change
No change – Will spend the same
Increase…
1%-25% increase
26%-50% increase
51%-75% increase
76%-100% increase
Increase – but can’t say how much
Decrease…
1%-25% decrease
26%-50% decrease
51%-75% decrease

Value of the British Library January 2013
98
Q9. On average, how much time do information services staff at your organisation as a whole currently spend using British Library services each week ? For example, putting in Document Supply and Bibliographic requests or carrying out searches. Please provide a collective figure for your entire organisation.
If you don’t request documents each week please estimate time spent based on an weekly average over the past year.
If you are an employee of an organisation please provide an answer for your whole organisation. We realise that this may be difficult, but please try to provide your best estimate.
Q10. How much would your organisation’s usage of the British Library Document Supply and Bibliographic service decrease if the price for such services went up, on average, by 50%?
Just to be clear, this question is designed to capt ure the value that you place on the British Library’s Document Supply and Bibliographic Services and is not an indication that the British Library plans to increase its charges.
If you are an employee of an organisation please provide an answer for your whole organisation. We realise that this may be difficult, but please try to provide your best estimate.
76%-100% decrease
Decrease – but can’t say how much
Time spent per week
0 – no time spent
Less than 1 hour
1 to 5 hours
5-25 hours
26-50 hours
51-75 hours
76-100 hours
101-150 hours
151-250 hours
250 + hours

Value of the British Library January 2013
99
[Section 4. Substitutes questions]
Q11. In the last 12 months which, if any, alternative information sources to the British Library has your organisation used? This may cover Inter Library Loan, Document Supply and Bibliographic or search services. Please answer all that apply.
Q12. Where your organisation used the British Library rather than an alternative service, why did it do this? Please answer all that apply.
Decrease
No change – ie 0% decrease
1%-25% decrease
26%-50% decrease
51%-75% decrease
Greater than 75% decrease
Would stop using services
Alternative sources
None
University Libraries
Other libraries (e.g. public libraries)
Commercial private sector information providers
Publishers direct
Other substitute (please specify)
Reasons for alternatives
Depth and breadth of the collection
Optional support services
Up to date holdings
Customer service

Value of the British Library January 2013
100
Q13. If you could not use the British Library how much additional time do you think your organisation would need to spend searching for documents and using alternative sources to retain your current service levels (as a percentage)?
If you are an employee of an organisation please provide an answer for your whole organisation. We realise that this may be difficult, but please try to provide your best estimate.
Q14. If the British Library ceased to provide services to your organisation and you had to use alternative suppliers (for the same breadth / range of content) what additional costs, excluding additional staff time, would your organisation have to incur?
Please state your answer as a percentage of last year’s spend on British Library Document Supply and Bibliographic services
Please provide a rough estimate based on your current usage levels. We realise that in practice you may choose to not incur these additional expenses.
If you are an employee of an organisation please provide an answer for your whole organisation. We realise that this may be difficult, but please try to provide your best estimate.
Ease of use of British Library services
Efficiency/speed of service
Cheaper to use British Library services than alternatives
Services all under one roof
Trusted, risk averse provider
Varying account / payment options
Other
Additional time
No change – ie 0%
1%-25% increase
26-50% increase
51-100% increase
101-200% increase
201-300% increase
More than 300% increase
Decrease

Value of the British Library January 2013
101
[Section 5. Willngness to Pay//Willingness to Accep t questions]
Q.15. One way economists value the benefits that customers get from services is to understand the maximum that would be paid in return for having access to those services.
You’ve previously indicated how much your organisation curently spends per year on British Library Document Supply and Bbliographic services.
If you were given full budgetary discretion, what would be the maximum additional percentage increase per year that you would be willing to pay to continue to use British Library Document Supply and Bibliographic services?
This is a hypothetical question designed to capture the value that placed on the British Library’s Document Supply and Bibliographic service s and is not an indication that prices will change.
If you are an employee of an organisation please provide an answer for your whole organisation. We realise that this may be difficult, but please try to provide your best estimate.
Additional costs
No change – ie 0%
1%-25% increase
26%-50% increase
51%-100% increase
101%-200% increase
201%-300% increase
More than 300% increase
Decrease
Percentage increase
No increase – ie 0%
1-10% increase
11-25% increase
26-50% increase
51-100% increase
101% -200% increase
Greater than 200% increase

Value of the British Library January 2013
102
Q16 Another way economists value the benefits that customers obtain from services is to understand how much would be accepted in return for no longer having access to those services.
Imagine that you were asked how much your organisation would accept in return for no longer being able to access Document Supply and Bibliographic services. What is the minimum yearly amount you would be willing to accept in return for no longer being able to access British Library Document Supply and Bibliographic services ?
This is a hypothetical question designed to capture the value placed on the British Library’s Docuent Supply and Bibliographic services . It is not an indication that any payments will be made or prices will change.
If you are an employee of an organisation please provide an answer for your whole organisation. We realise that this may be difficult, but please try to provide your best estimate.
If you have any comments about this survey, please leave them here:
• Thank you for your participation in this study.
• The questions in this survey are solely intended to help the British Library determine its economic impact. The results of this study will help the British Library to continue providing leading services to researchers.
• If you are at all unclear on the purposes of this survey, please email
Decrease
Willing to accept per year
Total (£) per year
Unable to answer the question

Value of the British Library January 2013
103
4. Web survey
Web Survey: Your chance to support our future Welcome to the British Library’s survey. We appreciate you taking the time to complete this survey. It will only take a few minutes and all responses will be treated as confidential. The British Library is undertaking work with Oxford Economics to quantify how the British Library supports the UK economy. In order to do thi s it is important for us to understand how the Library’s users value its services. If you require any further information about this s urvey you may wish to contact [email protected]
What services do you use on the British Library’s w ebsite? You may tick more than one option.
Catalogues Online collections Document Supply Business & IP Centre resources Learning resources Information for researchers What’s On Visitor Information
1.
Other Other, please specify:
Are you accessing the website from within the Briti sh Library?
Yes
2.
No
What is the primary purpose of your usage of the Br itish Library’s website?
Undergraduate research* (*i.e. undertaken as staff or student of a university.) Postgraduate research* (*i.e. undertaken as staff or student of a university.) Academic staff research* (*i.e. undertaken as staff or student of a university.) Other academic research* (*i.e. undertaken as staff or student of a university.) Private sector business/work related research as a company employee Private sector business/work related research for your own company Non-governmental agency (NGO) / charity research
3.
Public sector related research
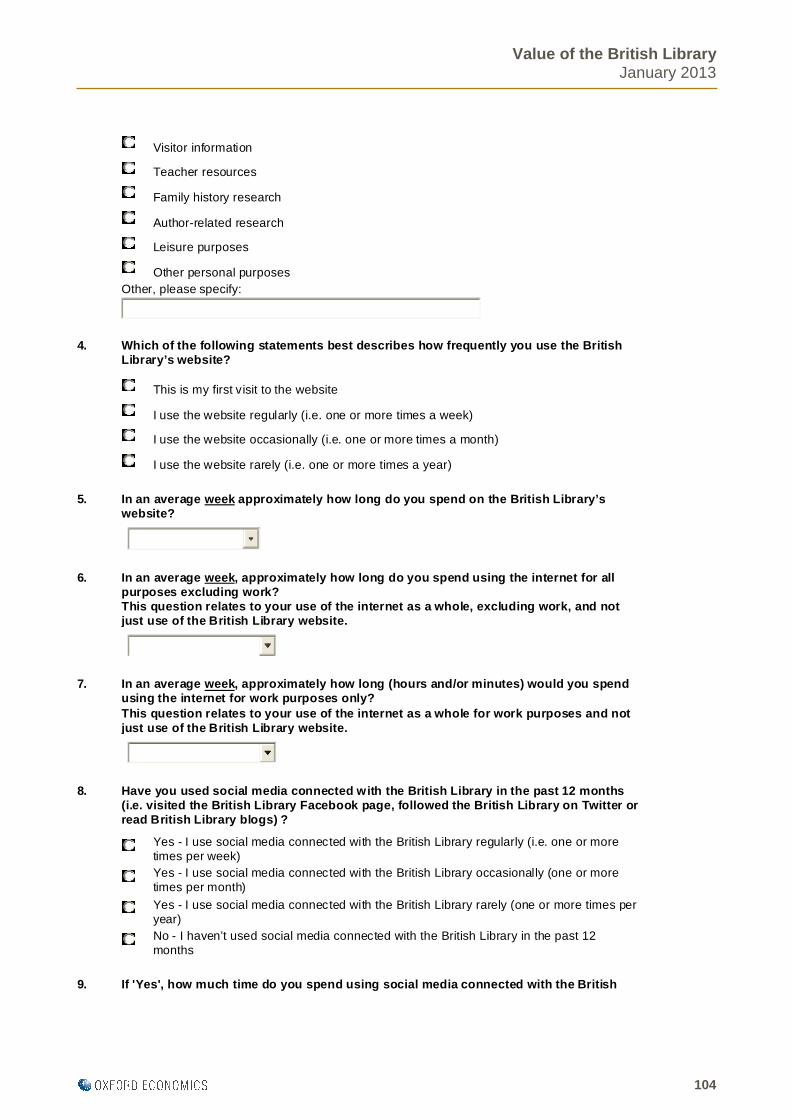
Value of the British Library January 2013
104
Visitor information Teacher resources Family history research Author-related research Leisure purposes Other personal purposes
Other, please specify:
Which of the following statements best describes ho w frequently you use the British Library’s website?
This is my first visit to the website I use the website regularly (i.e. one or more times a week) I use the website occasionally (i.e. one or more times a month)
4.
I use the website rarely (i.e. one or more times a year)
In an average week approximately how long do you spend on the British Library’s website?
5.
In an average week , approximately how long do you spend using the int ernet for all purposes excluding work? This question relates to your use of the internet a s a whole, excluding work, and not just use of the British Library website.
6.
In an average week , approximately how long (hours and/or minutes) wou ld you spend using the internet for work purposes only? This question relates to your use of the internet a s a whole for work purposes and not just use of the British Library website.
7.
Have you used social media connected with the Briti sh Library in the past 12 months (i.e. visited the British Library Facebook page, fo llowed the British Library on Twitter or read British Library blogs) ?
Yes - I use social media connected with the British Library regularly (i.e. one or more times per week) Yes - I use social media connected with the British Library occasionally (one or more times per month) Yes - I use social media connected with the British Library rarely (one or more times per year)
8.
No - I haven’t used social media connected with the British Library in the past 12 months
9. If 'Yes', how much time do you spend using social m edia connected with the British

Value of the British Library January 2013
105
If 'Yes', how much time do you spend using social m edia connected with the British Library in an average week .
9.
Visiting British
Library Facebook
Following on Twitter
Reading British Library Blogs
0 - 3 minutes
3 - 7 minutes
7 - 11 minutes
11 - 15 minutes
16 - 20 minutes
21 - 40 minutes
41 minutes - 1 hour
1 - 5 hours
5 - 10 hours
10 - 15 hours
15 - 20 hours
20 - 25 hours
25 - 30 hours
Over 30 hours
Does not apply
Are you permanently resident in the UK (i.e. have y ou lived in the UK for at least the last 6 months)?
Yes
10.
No
Do you ever physically travel to the British Librar y itself to make use of its services (e.g. Reading Rooms, exhibitions, etc?)
Yes
11.
No
On average, how many visits did you make in the las t 12 months to the British Library? (A visit is a single trip to the Library on a singl e day, not a visit over a period of several days)
12.
Main British Library site at
St Pancras (London)
Newspaper Reading Room
(Colindale, North London)
Boston Spa Reading Room
(Yorkshire)
1 - 2 visits each year
3 - 5 visits each year
6 - 12 visits each year

Value of the British Library January 2013
106
25 - 52 visits each year
53 - 100 visits each year
101 - 200 visits each year
201 - 300 visits each year
Over 300 visits each year
Please indicate which British Library sites you hav e used in the last 12 months and which you have mainly used in the last 12 months :
13.
Have used in the last 12 months (select all that
apply) Mainly used in the last 12
months (select one only)
Main British Library site at St Pancras
Newspaper Reading Room (Colindale)
Boston Spa reading room
Please answer the remaining questions in this surve y based on the British Library site (i.e. St Pancras, Colindale or Boston Spa) that you mainly u sed during the last 12 months.
Does using the British Library’s online services en able you to save time when you actually visit the British Library itself and make use of its on-site services? (This may be time saved due to using online service s before visiting the British Library e.g. pre-ordering from the catalogue, pre-registeri ng for a Reader Pass, booking a workshop online and/or time saved due to the use of these services while you are in the Library itself.)
Yes
14.
No
If 'Yes', then how much time would you estimate tha t using online services would save you on a single typical visit to the British Library ? (Please include time saved due to using online serv ices before you actually made the visit and/or time saved while you were actually in the Library.)
15.
Approximately how long does it take you to make a r eturn trip from your home (or place of work) to the British Library and back agai n?
16.
What form of transport do you use to get to the Bri tish Library? If you use more than one type of transport please indicate the type whic h accounts for most of your journey time.
Tube Train
17.
Bus
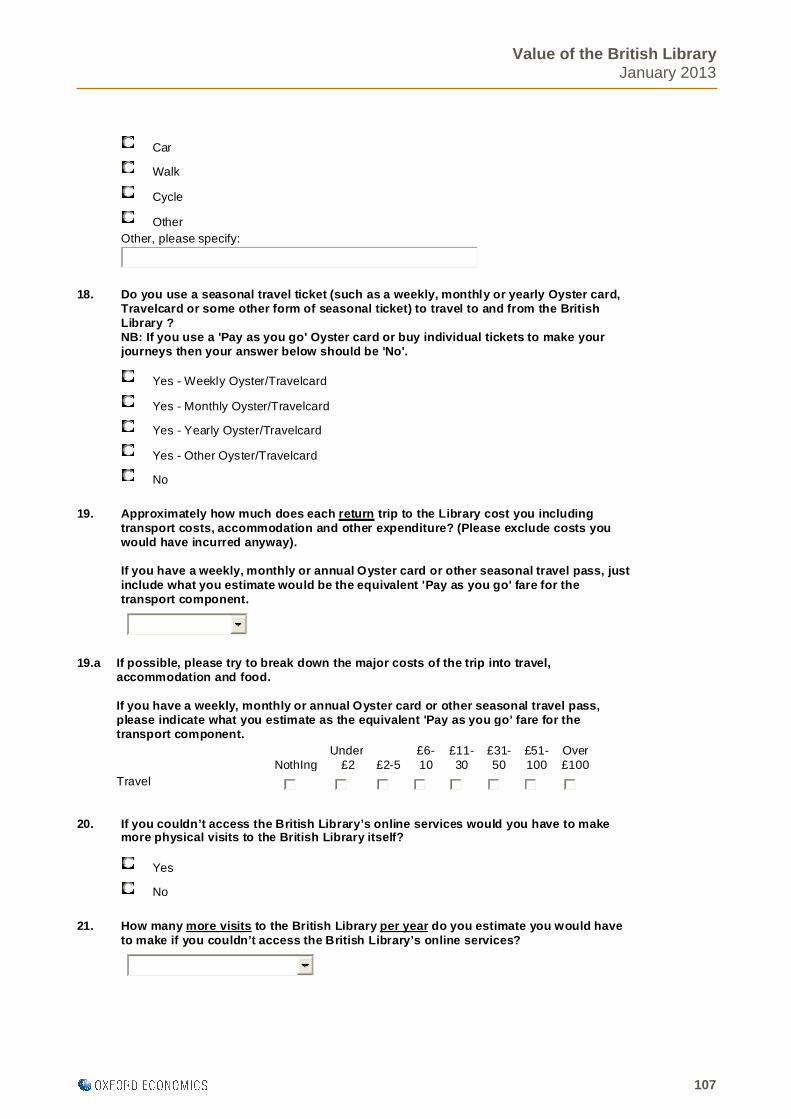
Value of the British Library January 2013
107
Car Walk Cycle Other
Other, please specify:
Do you use a seasonal travel ticket (such as a week ly, monthly or yearly Oyster card, Travelcard or some other form of seasonal ticket) t o travel to and from the British Library ? NB: If you use a 'Pay as you go' Oyster card or buy individual tickets to make your journeys then your answer below should be 'No'.
Yes - Weekly Oyster/Travelcard Yes - Monthly Oyster/Travelcard Yes - Yearly Oyster/Travelcard Yes - Other Oyster/Travelcard
18.
No
Approximately how much does each return trip to the Library cost you including transport costs, accommodation and other expenditur e? (Please exclude costs you would have incurred anyway). If you have a weekly, monthly or annual Oyster card or other seasonal travel pass, just include what you estimate would be the equivalent ' Pay as you go' fare for the transport component.
19.
If possible, please try to break down the major cos ts of the trip into travel, accommodation and food. If you have a weekly, monthly or annual Oyster card or other seasonal travel pass, please indicate what you estimate as the equivalent 'Pay as you go' fare for the transport component.
19.a
NothIng Under £2 £2-5 £6-
10 £11-30
£31-50
£51-100
Over £100
Travel
If you couldn’t access the British Library’s online services would you have to make more physical visits to the British Library itself?
Yes
20.
No
How many more visits to the British Library per year do you estimate you would have to make if you couldn’t access the British Library’ s online services?
21.

Value of the British Library January 2013
108
Please assist us by completing the following demogr aphic questions if possible. All information will be treated as confidential. The reason we are collecting this information is to try and ascertain where our website users are from and how they compare to the general profil e of the population. Only answer the questions in this section if you ar e currently resident in the UK (i.e. have lived here for at least six months.)
Where is your permanent residence?
Central London (Zones 1-3) Greater London (Zones 4-6) South East (excluding Greater London) South West England East Midlands West Midlands East of England (* This includes counties of Essex, Hertfordshire, Bedfordshire, Cambridgeshire, Norfolk and Suffolk.) North East England North West England Yorkshire and the Humber Scotland Northern Ireland Wales
22.
Outside UK Please state which country outside the UK you are from:
What is your home town/city? 23.
What is your postcode? 24.
What is your nearest tube or train station? 25.
What is your gender?
Male
26.
Female 27. What is your main occupation?

Value of the British Library January 2013
109
Full-time employment Part-time employment Self-employed Looking after family Student Unemployed Retired Long-term illness Other
Other, please specify:
What is the highest educational level you have reac hed?
GCSE/O level/CSE Vocational qualification A-level or equivalent Bachelor degree or equivalent Masters/Phd or equivalent Other professional qualifications No formal qualifications
28.
Still studying
What is your age?
Under 18 18 - 24 25 - 34 35 - 44 45 - 54 55 - 64
29.
65+
Which of the following brackets does your annual pe rsonal income (before tax) fall into?
Less than £12,400 £12,401 - £21,500 £21,501 - £33,900
30.
£33,901 - £52,800

Value of the British Library January 2013
110
£52,800 - £71,100 Over £71,100
OVERSEAS VISITORS (only). Do not complete if you ar e a UK resident. Please assist us by completing the following questi ons if possible. All information will be treated as confidential. Only answer the questions in this section if you are NOT currently resident in the UK. The reason we are collecting this information is to try and ascertain where our website users are from.
What town do you live in? 32.
What is your zip or post code? 33.
You’ve indicated that you have travelled to the UK to use the British Library. Approximately how many trips have you made to the U K which involved visiting the Library in the past year?
1 2 - 3 4 - 5 6 - 10
34.
Over 10
Considering the last trip you did which included a British Library visit, please answer the following questions:
35.
0-6 hours
6 -12 hours
12-24
hours
1-2 days
3-7 days
1-2 weeks
3-4 weeks
More than
1 month
How long did it actually take you to travel to the UK from the town/city and country where you normally live? Please provide an answer in hours or (if relevant) days.
What was the reason(s) for that trip to the UK. You can select more than one option.
Visit the British Library Tourism/Leisure Work
36.
Study/Research

Value of the British Library January 2013
111
Other Other, please specify:
How important was the use of the British Library in your decision to visit the UK? Please try to answer this question in percentage te rms. For example, if you feel that 20% of the motivation for your trip to the UK was due to being interested in visiting and/or using the Briti sh Library then your answer would be 20%. We realise this question may be difficult to answer but please try.
37.
About how much, in total, do you estimate it cost t o visit and stay in the UK on that trip? Please provide your answer in pounds (£). If you are used to thinking in other currencies suc h as Euros or US dollars you can use the following conversion table to help you. For exa mple €1 = £0.8. So €1,000 would be £800, $1 = £0.6. So $1,000 = £600.
38.
If possible, please also try to break down the majo r costs of the trip into travel, accommodation and food.
39.
£1-£300
£301-400
£401-£500
£501-£1k
£1k-£2.5k £2.5k-
5k £5k-7.5k
Over £7.5k
Travel
Accommodation
Food
Other
Does using the Library’s online services enable you to save time when you actually visit the Library itself and make use of its on-sit e services? This may be time saved due to using online services before visiting the Library e.g. pre -ordering from the catalogue, pre-registering for a Reader Pass, booking a workshop online and/or time saved due to the use of these services while you are in the Library itself.
Yes
40.
No
If 'Yes', then how much time would you estimate tha t using online services would save you on a single typical visit to the Library? (Please include time saved due to using online serv ices before you actually made the visit and/or time saved while you were actually in the Library.)
41.
If you couldn’t access the Library’s online service s would you have made more physical visits to the Library itself?
42.
Yes

Value of the British Library January 2013
112
No
How many more visits per year do you estimate you w ould have to make if you couldn’t access these online services?
43.
Which of the following brackets does your annual pe rsonal income (before tax) fall into? If you are used to thinking in other currencies suc h as Euros or US dollars you can use the following conversion table to help you. For exa mple €1 = £0.8. So €1,000 would be £800.
Less than £12,400 £12,401 - £21,500 £21,501 - £33,900 £33,901 - £52,800 £52,801 - £71,100
44.
Over £71,100 Thank you for agreeing to undertake this survey. On ce again if you have any questions please email [email protected]

Value of the British Library January 2013
113
5. Non-use survey
Non-user survey
The British Library is undertaking work with Oxford Economics to quantify how the Library supports the UK economy. In order to do this it is important for us to understand how the general public view the Library.
We appreciate you taking the time to complete this survey. It will only take a few minutes and all responses will be treated as confidential.
If you require any further information about this survey you may wish to contact [email protected].
D1. Where is your permanent residence?
* This includes counties of Essex, Hertfordshire, Bedfordshire, Cambridgeshire, Norfolk and Suffolk.
Locations
Central London (Zones 1-3)
Greater London (Zones 4-6)
South East (excluding Greater London)
South West England
East Midlands
West Midlands
East of England*
North East England
North West England
Yorkshire and the Humber
Scotland
Northern Ireland
Wales

Value of the British Library January 2013
114
Q1 Which of the following best applies to you prior to taking this survey ?
Background information
The British Library is the national library of the United Kingdom and one of the world’s greatest research libraries. The Library provides world class services to the academic, business, research and scientific communities and is the custodian of many of the nation’s most valuable books and manuscripts, including unique items of historical importance such as the Magna Carta.
The Library provides important on-site and online services to the public, researchers and business (many of which are free), including:
� Support for academic, scientific and industry research through its Reading Rooms and other services.
� A Business and IP Centre for entrepreneurs and small businesses.
� Assisting research into family and local histories, including the British Newspaper Archive.
� A major public exhibitions programme.
� Educational support for nearly 30,000 school children, with additional resources for teachers.
� A developing digital archive including the UK Web Archive and Sound Archive.
Q2: Do you think that the British Library has value for society as a whole, in addition to those who directly use its services?
I was aware of the British Library and I have used it
I was aware of the British Library but I have not used it
I was not aware of the British Library
Yes
No
Don’t know

Value of the British Library January 2013
115
Q3 All UK taxpayers pay towards the upkeep and development of the British Library through taxes. On average, each UK income tax payer pays roughly £3.50 a year towards the British Library through taxes. If you were free to chose how your existing taxes were allocated, what would be the maximum you would be willing to pay, through taxes, each year, to maintain the British Library?
Note: These questions are designed to capture the value that you place on the British Library and are not an indication that tax payers’ contributions will change.
It is important you try to answer this question to enable us to place a value on the British Library and the services it provides.
Q4 What is the basis for your answer to the previous question?
Maximum amount you would be willing to pay per year in taxes to maintain the British Library (£)
Don’t know
Prefer not to say
Response
I value the British Library highly
I think existing funding is insufficient
I have never or I am unlikely to use the British Library
I am happy with the current allocation of my taxes
I do not value the British Library
I cannot or refuse to answer the question
I do not believe you can use surveys to answer this sort of issue
Other (please specify)
Value of the British Library January 2013
116
DEMOGRAPICS
Please assist us by completing the following demographic questions if possible. All information will be treated as confidential. We are collecting this information to try and ascertain how respondents to this survey compare to the general profile of the population.
D2. What is your home town/city?
D3. What is your postcode?
D4. What is your gender?
D5. What is your main occupation?
Male
Female
Occupation
Full-time employment
Part-time employment
Self-employed
Looking after family
Student
Value of the British Library January 2013
117
D6. What is the highest educational level you have reached?
D7. What is your age?
Unemployed
Retired
Long-term illness
Other (please specify)
Educational level
GCSE/O level/CSE
Vocational qualification
A-level or equivalent
Bachelor degree or equivalent
Masters/Phd or equivalent
Other professional qualifications
No formal qualifications
Still studying
Age
16-24
25-34
35-44
45-54
55-64
65 +

Value of the British Library January 2013
118
D8. Which of the following brackets does your annual household income (before tax) fall into? (Note that this relates to the income for your household as a whole and not just yourself).
Annual household income
Less than £12,400
£12,401 - £21,500
£21,501-£33,900
£33,901- £52,800
£52,801 - £71,100
Over £71,100
119
OXFORD Abbey House, 121 St Aldates Oxford, OX1 1HB, UK Tel: +44 1865 268900 LONDON Broadwall House, 21 Broadwall London, SE1 9PL, UK Tel: +44 207 803 1400 BELFAST Lagan House, Sackville Street Lisburn, BT27 4AB, UK Tel: +44 28 9266 0669 NEW YORK 817 Broadway, 10th Floor New York, NY 10003, USA Tel: +1 646 786 1863 PHILADELPHIA 303 Lancaster Avenue, Suite 1b Wayne PA 19087, USA Tel: +1 610 995 9600 SINGAPORE No.1 North Bridge Road High Street Centre #22-07 Singapore 179094 Tel: +65 6338 1235 PARIS 9 rue Huysmans 75006 Paris, France Tel: + 33 6 79 900 846 email: [email protected]
www.oxfordeconomics.com


