Page 1
www.vtpi.org
[email protected]
250-360-1560
Economically Optimal Transport Prices and Markets What Would Happen If Rational Policies Prevailed?
12 March 2014
By Todd Litman Victoria Transport Policy Institute
Email: l [email protected] Phone: 250-360-1560
For presentation at
I-TED 2014 International Transportation Economic Development Conference
Paper 11
Abstract This paper investigates the amount and type of mobility (physical travel) that is economically
optimal overall. It asks, “How would travel activity change if the transportation system reflected
efficient market principles including neutral and responsive planning, and cost-based pricing.” It
discusses these principles, identifies existing transport market distortions and reforms, estimates
how such reforms would likely affect travel activity, and investigates their economic impacts.
This analysis indicates that in a more optimal market, which reflects efficient planning and
pricing principles, consumers would drive less, use alternative modes more, choose more
accessible locations, and benefit overall as a result (increased consumer surplus). Because they
reflect efficiency principles these reforms are also likely to increase economic productivity.
Although previous studies have evaluated these transport market reforms individually, few have
considered their cumulative impacts.
Key Words Transport Planning, Pricing, Optimality
Page 2
Economically Optimal Transport Prices and Markets Victoria Transport Policy Institute
2
I will begin with the proposition that in no other major area are pricing practices so irrational, so out of
date, and so conductive to waste as in urban transportation.
- William Vickrey, “Pricing in Urban Transportation,” American Economic Review, 1963.
Introduction Transportation has tremendous economic, social and environmental impacts. It provides many
benefits, but it also incurs significant costs. As a result, either too little or too much mobility is
economically inefficient.
This paper identifies various transportation planning and market distortions and their impacts on
travel activity. It summarizes a more detailed study (1). Many studies have investigated these
distortions individually but only a few studies have examined multiple distortions, and even
those tend to have a fairly limited scope. (2, 3, 4) Comprehensive analysis is important because
these impacts are cumulative. For example, roadway underpricing not only increases traffic
congestion and roadway costs, by increasing total vehicle travel it also increases parking facility
costs (the total number of parking spaces needed in an area), accidents, and pollution emissions.
Similarly, parking underpricing not only increases parking facility costs, it also increases traffic
congestion and roadway costs.
This report explores these issues. It asks, “What amount and mix of travel would people choose
if transport planning and pricing reflected the principles of market efficiency.” This analysis
defines efficient market principles, identifies transport market distortions and potential reforms,
estimates the changes in mobility these reforms would cause, and discusses implications. This
helps identify the type and amount of mobility that is overall optimal to users and society.
Page 3
Economically Optimal Transport Prices and Markets Victoria Transport Policy Institute
3
Market Principles, Distortions and Reforms Markets are systems through which resources (goods, services, land, labor, etc.) are exchanged.
An efficient market is like a well-tuned machine: consumers can choose the goods and services
that best meets their needs and preferences, with prices maintaining equilibrium between demand
(the amount consumers will purchase under specific circumstances) and supply (the type and
quantity of goods producers will provide at a particular price). This tends to efficiently allocate
resources, maximizing benefits. But love of markets must not be blind. Optimal markets must
reflect certain principles, including adequate consumer options, neutral public policies and
efficient pricing (5, 6) This report evaluates the degree that transportation markets violate these
principles, and the reforms that would be needed to better reflect them.
1. Neutral and Responsive Planning Neutral and responsive planning means that the planning process is unbiased and provides the
transport options users demand, reflecting consumer sovereignty (the principle that consumers
can choose the goods and services they are willing to pay for). Transport options can include:
Modes, such as walking, cycling, public transportation, telework and delivery services.
Vehicles types (cars, trucks, hybrids, alternative fuels, cheap, expensive, new, used) and
ownership options (owned, leased, shared, etc.).
Service qualities, such as being able to pay for uncongested lanes, more convenient parking, and
more comfortable public transit services.
Locations, such as between automobile dependent and more multi-modal neighborhoods.
The key question for this analysis is whether there is latent demand for cost-effective alternatives
(their total cost to society are equal or lower than driving), that are not supplied because the
planning process is biased. Since governments supply and regulate paths, roads, parking
facilities, and development, various planning decisions affect the quality of transport options
(Table 1). For example, if the planning process underestimates walking and cycling demand, or
some benefits of these modes (e.g., health benefits or consumer savings), it will underinvest in
walking and cycling facilities, forcing travelers to drive more and walk or bike less than optimal.
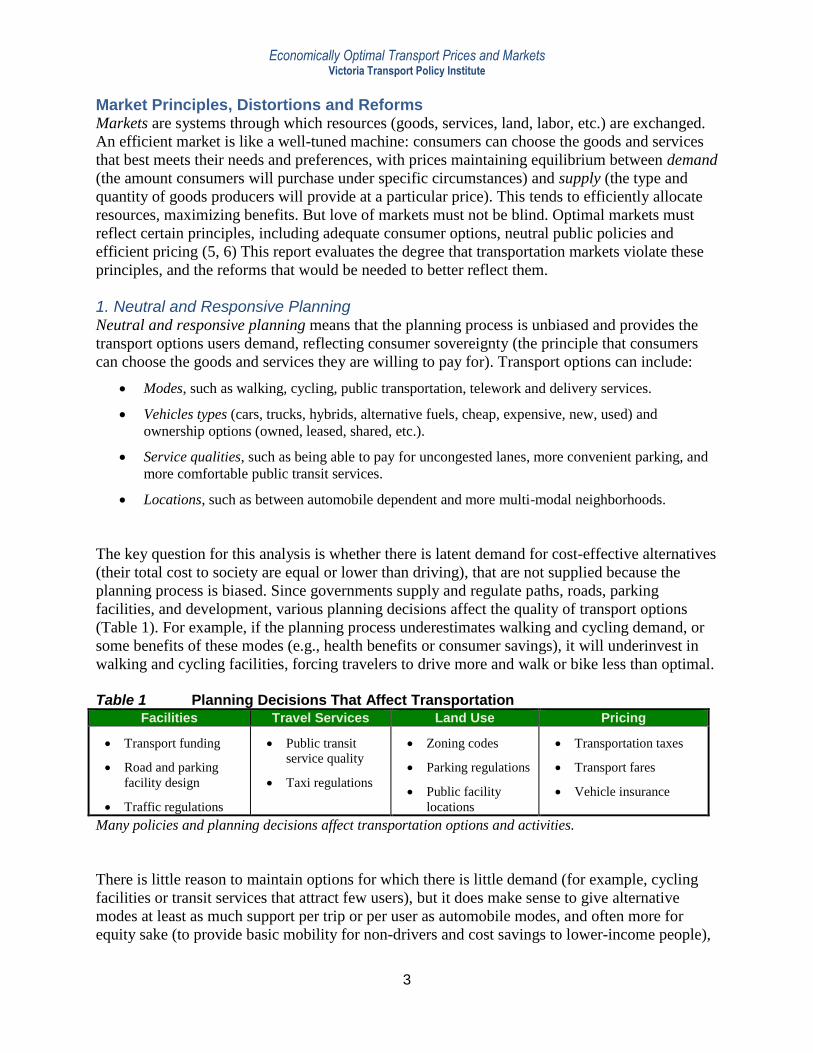
Table 1 Planning Decisions That Affect Transportation
Facilities Travel Services Land Use Pricing
Transport funding
Road and parking
facility design
Traffic regulations
Public transit
service quality
Taxi regulations
Zoning codes
Parking regulations
Public facility
locations
Transportation taxes
Transport fares
Vehicle insurance
Many policies and planning decisions affect transportation options and activities.
There is little reason to maintain options for which there is little demand (for example, cycling
facilities or transit services that attract few users), but it does make sense to give alternative
modes at least as much support per trip or per user as automobile modes, and often more for
equity sake (to provide basic mobility for non-drivers and cost savings to lower-income people),
Page 4
Economically Optimal Transport Prices and Markets Victoria Transport Policy Institute
4
for external benefits (such as traffic and parking congestion reductions) and to help achieve
strategic objectives (such as preserving openspace and increasing public fitness and health). For
example, if society spends $5.00 on roads and parking facilities to accommodate an automobile
commute trip, it should be willing to devote at least that much to accommodate other modes, and
possibly more for equity sake and to achieve other benefits.
Because transport demand is not generally tested by price (users do not generally pay marginal
costs for paths, roads, parking, and public transit, including external costs such as accident risk
and pollution emissions), it is difficult to determine which transport options should be provided
in a particular situation.
Responsive Planning Principles
To respond to consumer demands, planning must reflect the following principles (7):
Comprehensive analysis that considers all significant options (including alternative modes and
demand management strategies), impacts (benefits and costs) and objectives (including
efficiency, equity and resilience objectives).
Unbiased decision-making, which does not arbitrarily favor certain modes, groups or activities.
This is sometimes called least-cost planning, since it allows the most cost-effective solution to
be applied to transportation problems.
Evaluation based on accessibility rather than mobility, so land use accessibility and mobility
substitutes (such as delivery services and telecommunications that substitutes for physical
travel) can be considered equally with mobility improvements.
Planning Distortions
Current planning tends to be biased in various ways that favor mobility over accessibility and
automobile travel over other modes. For example (8, 9, 10, 11,12):
Transport system performance is often evaluated based primarily on motor vehicle traffic speed,
using indicators such as roadway level-of-service and the Travel Time Index. This overlooks and
undervalues other objectives (such as affordability, mobility for non-drivers, public health and
environmental protection), and impacts on other modes (such as the delay that wider roads and
heavier traffic have on walking and cycling).
Transportation project economic evaluation tends to consider some impacts (travel time and
vehicle operating costs) but ignores others (travel comfort, vehicle ownership costs, parking
facility costs, travel demands by non-drivers, health impacts, land use impacts, etc.). These
omissions tend to favor automobile-oriented improvements and undervalue improvements to
alternative modes, transportation pricing reforms, smart growth development policies, and
transportation demand management programs.
A major portion of transport funding is dedicated to roads and parking facilities and cannot be
used for alternative modes or demand management programs even if they are more cost effective
overall (13). Non-motorized modes in particular are underfunded: although walking and cycling
represent 10-15% of all trips, and increased walking and cycling can provide many economic,
social and environmental benefits, a much smaller portion of surface transportation expenditures
are spend on these modes.
Page 5
Economically Optimal Transport Prices and Markets Victoria Transport Policy Institute
5
Traffic models and parking generation manuals predict demand based on unpriced roads and
parking facilities. This creates a self-fulfilling prophecy as planning decisions are made to satisfy
unpriced demand, and demand grows to fill expanded supply.
Zoning codes and development policies often require generous parking supply and limit
development density and mix, subsidizes automobile travel and creates more dispersed,
automobile-dependent communities.
Development fee, tax or utility rate structures seldom reflect the higher costs of providing public
services in more dispersed locations, and so underprice urban-fringe development.
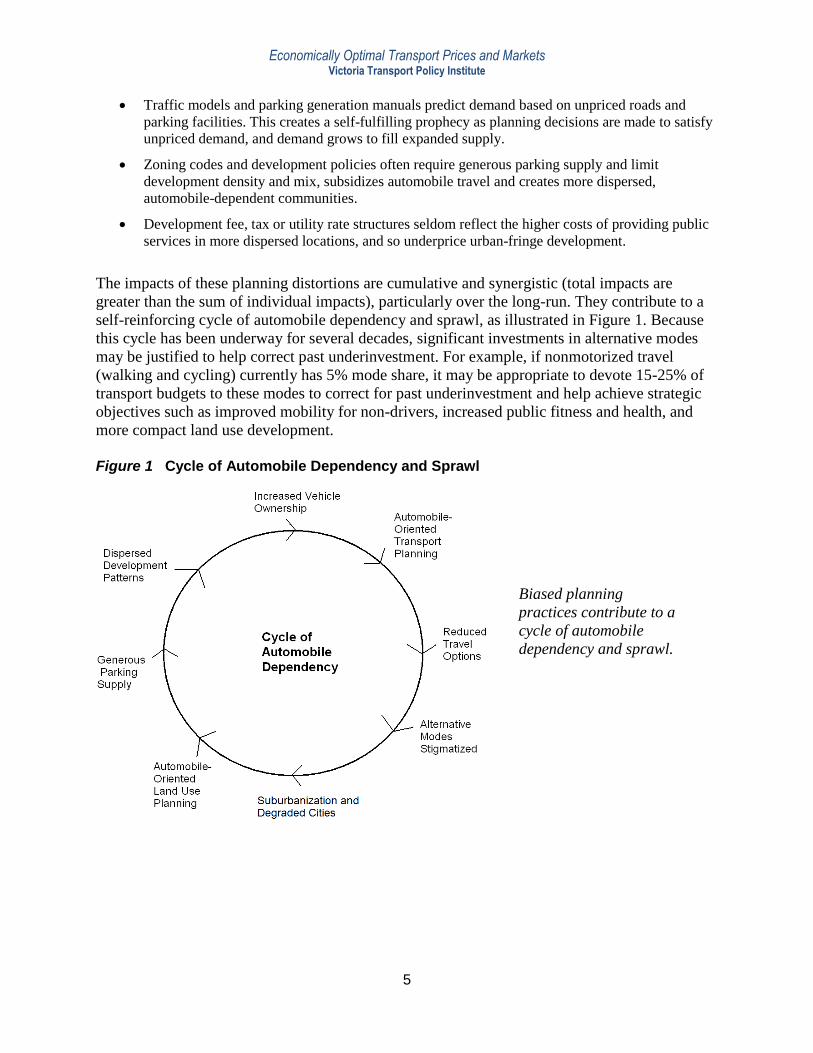
The impacts of these planning distortions are cumulative and synergistic (total impacts are
greater than the sum of individual impacts), particularly over the long-run. They contribute to a
self-reinforcing cycle of automobile dependency and sprawl, as illustrated in Figure 1. Because
this cycle has been underway for several decades, significant investments in alternative modes
may be justified to help correct past underinvestment. For example, if nonmotorized travel
(walking and cycling) currently has 5% mode share, it may be appropriate to devote 15-25% of
transport budgets to these modes to correct for past underinvestment and help achieve strategic
objectives such as improved mobility for non-drivers, increased public fitness and health, and
more compact land use development.
Figure 1 Cycle of Automobile Dependency and Sprawl
Biased planning
practices contribute to a
cycle of automobile
dependency and sprawl.
Page 6
Economically Optimal Transport Prices and Markets Victoria Transport Policy Institute
6
Planning Reforms
Various reforms can result in more neutral and responsive planning (7, 14, 15):
Evaluate transport system performance based on accessibility rather than mobility, taking into
account various modes, transport network connectivity, land use accessibility, and mobility
substitutes, and recognize the trade-offs that often occur between these factors.
Apply comprehensive evaluation of potential transportation improvement options, including
improvements to alternative modes, pricing reforms and other demand management strategies.
Apply comprehensive evaluation of all impacts (benefits and costs), including travel speed, travel
comfort (particularly for public transit passengers), vehicle ownership and operating costs,
parking costs, accident risk, pollution emissions, public fitness and health, and land use impacts.
Apply least cost planning, which implements the most cost-effective solution, including demand
management strategies and alternative modes.
Improve transport modeling to more accurately predict how planning decisions affect access by
various modes, and their overall economic, social and environmental impacts.
Integrate transport and land use planning, including better coordination among various levels of
government, to create more accessible, multi-modal communities.
Locate public facilities (schools, government offices, etc.) for multi-modal accessibility.
Change zoning laws to allow higher densities, more land use mix, and more flexible parking
requirements.
Travel Impacts
There is evidence of significant latent demand for alternative modes. In many situations, cost
effective (i.e., cheaper than automobile travel, considering all costs) walking, cycling, rideshare
and public transit improvements have resulted in significant mode shifts and reductions in
automobile travel (16, 17, 18). Similarly, many people want to live and work in more accessible,
multi-modal neighborhoods (19, 20), and even accounting for self-selection (the tendency of
households to choose neighborhoods that reflect their transportation preferences), people who
live or work in such areas tend to drive 10-40% less than national averages (21, 22).
Transport modeling in various U.S. metropolitan regions summarized indicates that more
optimal regional transport planning and investment practices, selected to maximize cost
efficiency and consumer surplus, would reduce VMT by 10% to 20% compared to trend
scenarios, while supporting the same level of job and housing growth, and providing comparable
or better highway levels-of-service (23). The optimized plans include increased investment in
alternative modes (such as busways and rail transit services), land use policies that improve
accessibility (such as more compact and transit-oriented development), and pricing reforms (such
as road and parking pricing). Since that modeling only applied to regional facilities, additional
VMT reductions could be expected if such reforms were also applied to local planning.
Page 7
Economically Optimal Transport Prices and Markets Victoria Transport Policy Institute
7
2. Efficient Pricing This analysis investigates whether motor vehicle travel is currently underpriced, and how travel
patterns would change with more efficient pricing.
Efficient Pricing Principles
Market efficiency requires that prices reflect marginal costs (the incremental cost of producing a
good) unless a subsidy is specifically justified. This tests consumer willingness-to-pay, so society
avoids devoting $2.00 worth of resources to produce goods users only value at $1.00. Thus,
goods that cost $1.00 to produce should be priced at $1.00, not 50¢ (underpricing, which
encourages excessive consumption) or $2.00 (overpricing, which limits consumption and so
reduces consumer benefits).
There is some debate among economists as to how to determine optimal prices. Some
recommend short run marginal cost (SRMC) pricing, ignoring sunk (unrecoverable) costs.
Others recommend long-run average costs (LRAC, also called cost recovery or full cost) pricing,
because over the long-run most costs become marginal, long-run pricing tests user demand for
capital investments, and this is the price structure for most other consumer goods (24).
As one leading economist explains,
“From a short-run perspective, FCP (Full Cost Pricing) is primarily an equity issue, but in the long run
it has consequences for efficiency. First, agencies forced to recover all costs from their consumers will
seek and find ways to reduce costs for each level of output...FCP is aimed at efficiency through the
concept of economic neutrality. Unless there is a particular reason to favor one activity or enterprise
over another, then the government should attempt to make all decisionmaking in the private sector
neutral with respect to economic choices of pricing, investment, and whether to stay in business.” (25)
Price Distortions
Several specific market distortions contribute to transportation underpricing:
A portion of roadway costs (about half in the U.S.) are funded by general taxes (which people pay
regardless of how much they travel) rather than user fees (26).
User fees and taxes often fail to accurately reflect factors such as the type of vehicle, driver
ability, time and location. This creates cross-subsidies among vehicle users, and fails to
encourage the most efficient vehicle and travel behavior.
Most parking is provided free, significantly subsidized, and when priced, fees seldom reflect
marginal costs.
Roadway land is treated as a sunk cost. User fees seldom include the equivalent of rent or taxes
on transport facility land. This underprices transport relative to other land uses, and space-
intensive modes relative to space-efficient modes.
Insurance and registration fees are fixed, and so fail to reflect the degree to which crash and
roadway costs increase with mileage. Fixed fees encourage motorists to maximize their mileage
in order to “get their money’s worth” from their fixed investments.
Tax policies stimulate automobile travel by making subsidized parking and company cars
attractive employee benefits. A typical employee would need to earn about $2,000 in pretax
income to pay for a parking space that costs their employer $1,000 as a business expense.
Page 8
Economically Optimal Transport Prices and Markets Victoria Transport Policy Institute
8
Several studies have investigated the full costs of various forms of transport (27, 28). Figure 2
illustrates an estimate of these costs.
Figure 2 Estimated Automobile Transport Costs (29)
This figure illustrates the estimated costs of motor vehicle ownership and use.
This indicates that more than half of vehicle costs are either external or internal-fixed. Both
external and internal-fixed costs are forms of underpricing that tend to be inefficient and
inequitable. For example, parking subsidies are unfair because they force households that own
fewer than average vehicles to subsidize others that own more than average vehicles, and fixed
automobile insurance premiums are inefficient because the costs they represent (accidents and
therefore insurance claim) increase with annual vehicle travel. Such pricing encourages motorists
to maximize their driving in order to get their money’s worth, and so increases external costs.
Optimal Prices
Efficient transportation pricing should reflect the following practices (30).
Congestion Pricing Congestion pricing (also called value pricing) consists of tolls structured to reduce traffic
volumes to optimal levels, based on users willingness-to-pay for increased travel speeds. This
typically requires fees that average 5-15¢ per urban-peak mile, which represents about 10% of
total vehicle travel.
Table 2 Congestion Pricing (Average Per Urban-Peak Vehicle-Mile))
Current Lower Bound Middle Upper Bound
Congestion Fees 0.0¢ 0.5¢ 10¢ 15¢
This table summarizes optimal congestion pricing fees, which would only be applied under urban-peak
conditions. Such fees are currently only applied in a few cities (London, Stockholm, Singapore).
Page 9
Economically Optimal Transport Prices and Markets Victoria Transport Policy Institute
9
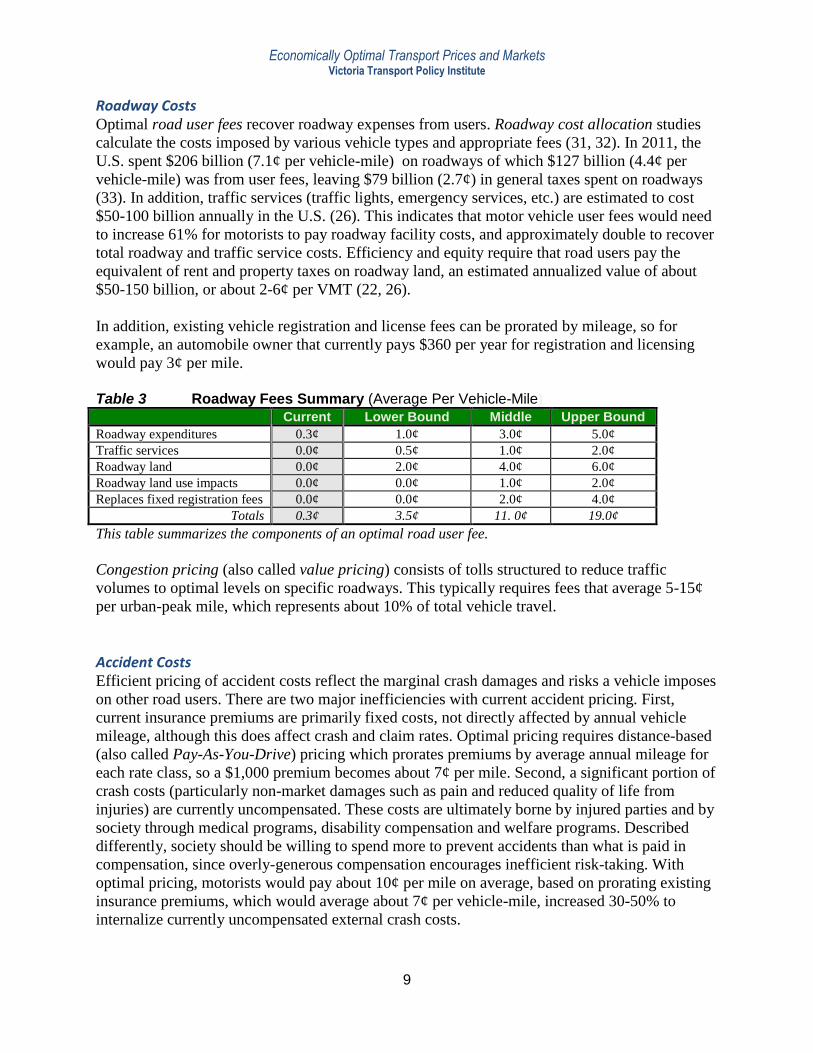
Roadway Costs Optimal road user fees recover roadway expenses from users. Roadway cost allocation studies
calculate the costs imposed by various vehicle types and appropriate fees (31, 32). In 2011, the
U.S. spent $206 billion (7.1¢ per vehicle-mile) on roadways of which $127 billion (4.4¢ per
vehicle-mile) was from user fees, leaving $79 billion (2.7¢) in general taxes spent on roadways
(33). In addition, traffic services (traffic lights, emergency services, etc.) are estimated to cost
$50-100 billion annually in the U.S. (26). This indicates that motor vehicle user fees would need
to increase 61% for motorists to pay roadway facility costs, and approximately double to recover
total roadway and traffic service costs. Efficiency and equity require that road users pay the
equivalent of rent and property taxes on roadway land, an estimated annualized value of about
$50-150 billion, or about 2-6¢ per VMT (22, 26).
In addition, existing vehicle registration and license fees can be prorated by mileage, so for
example, an automobile owner that currently pays $360 per year for registration and licensing
would pay 3¢ per mile.
Table 3 Roadway Fees Summary (Average Per Vehicle-Mile)
Current Lower Bound Middle Upper Bound
Roadway expenditures 0.3¢ 1.0¢ 3.0¢ 5.0¢
Traffic services 0.0¢ 0.5¢ 1.0¢ 2.0¢
Roadway land 0.0¢ 2.0¢ 4.0¢ 6.0¢
Roadway land use impacts 0.0¢ 0.0¢ 1.0¢ 2.0¢
Replaces fixed registration fees 0.0¢ 0.0¢ 2.0¢ 4.0¢
Totals 0.3¢ 3.5¢ 11. 0¢ 19.0¢
This table summarizes the components of an optimal road user fee.
Congestion pricing (also called value pricing) consists of tolls structured to reduce traffic
volumes to optimal levels on specific roadways. This typically requires fees that average 5-15¢
per urban-peak mile, which represents about 10% of total vehicle travel.
Accident Costs Efficient pricing of accident costs reflect the marginal crash damages and risks a vehicle imposes
on other road users. There are two major inefficiencies with current accident pricing. First,
current insurance premiums are primarily fixed costs, not directly affected by annual vehicle
mileage, although this does affect crash and claim rates. Optimal pricing requires distance-based
(also called Pay-As-You-Drive) pricing which prorates premiums by average annual mileage for
each rate class, so a $1,000 premium becomes about 7¢ per mile. Second, a significant portion of
crash costs (particularly non-market damages such as pain and reduced quality of life from
injuries) are currently uncompensated. These costs are ultimately borne by injured parties and by
society through medical programs, disability compensation and welfare programs. Described
differently, society should be willing to spend more to prevent accidents than what is paid in
compensation, since overly-generous compensation encourages inefficient risk-taking. With
optimal pricing, motorists would pay about 10¢ per mile on average, based on prorating existing
insurance premiums, which would average about 7¢ per vehicle-mile, increased 30-50% to
internalize currently uncompensated external crash costs.
Page 10
Economically Optimal Transport Prices and Markets Victoria Transport Policy Institute
10
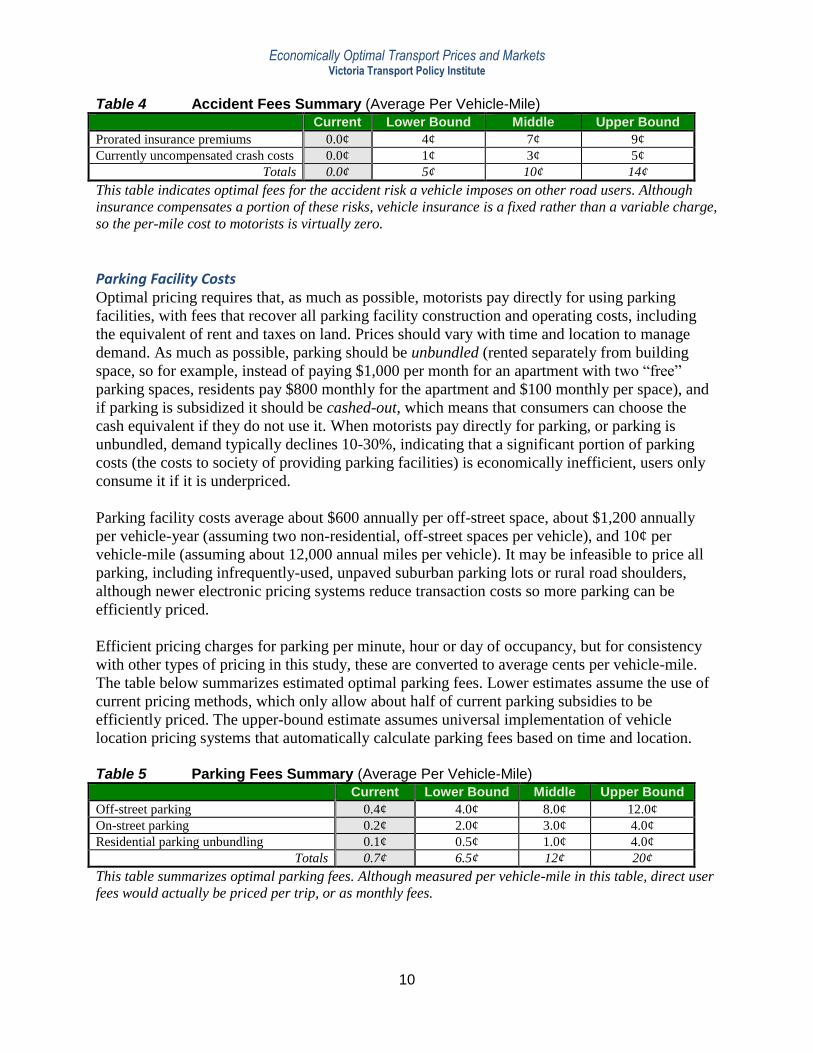
Table 4 Accident Fees Summary (Average Per Vehicle-Mile)
Current Lower Bound Middle Upper Bound
Prorated insurance premiums 0.0¢ 4¢ 7¢ 9¢
Currently uncompensated crash costs 0.0¢ 1¢ 3¢ 5¢
Totals 0.0¢ 5¢ 10¢ 14¢
This table indicates optimal fees for the accident risk a vehicle imposes on other road users. Although
insurance compensates a portion of these risks, vehicle insurance is a fixed rather than a variable charge,
so the per-mile cost to motorists is virtually zero.
Parking Facility Costs Optimal pricing requires that, as much as possible, motorists pay directly for using parking
facilities, with fees that recover all parking facility construction and operating costs, including
the equivalent of rent and taxes on land. Prices should vary with time and location to manage
demand. As much as possible, parking should be unbundled (rented separately from building
space, so for example, instead of paying $1,000 per month for an apartment with two “free”
parking spaces, residents pay $800 monthly for the apartment and $100 monthly per space), and
if parking is subsidized it should be cashed-out, which means that consumers can choose the
cash equivalent if they do not use it. When motorists pay directly for parking, or parking is
unbundled, demand typically declines 10-30%, indicating that a significant portion of parking
costs (the costs to society of providing parking facilities) is economically inefficient, users only
consume it if it is underpriced.
Parking facility costs average about $600 annually per off-street space, about $1,200 annually
per vehicle-year (assuming two non-residential, off-street spaces per vehicle), and 10¢ per
vehicle-mile (assuming about 12,000 annual miles per vehicle). It may be infeasible to price all
parking, including infrequently-used, unpaved suburban parking lots or rural road shoulders,
although newer electronic pricing systems reduce transaction costs so more parking can be
efficiently priced.
Efficient pricing charges for parking per minute, hour or day of occupancy, but for consistency
with other types of pricing in this study, these are converted to average cents per vehicle-mile.
The table below summarizes estimated optimal parking fees. Lower estimates assume the use of
current pricing methods, which only allow about half of current parking subsidies to be
efficiently priced. The upper-bound estimate assumes universal implementation of vehicle
location pricing systems that automatically calculate parking fees based on time and location.
Table 5 Parking Fees Summary (Average Per Vehicle-Mile)
Current Lower Bound Middle Upper Bound
Off-street parking 0.4¢ 4.0¢ 8.0¢ 12.0¢
On-street parking 0.2¢ 2.0¢ 3.0¢ 4.0¢
Residential parking unbundling 0.1¢ 0.5¢ 1.0¢ 4.0¢
Totals 0.7¢ 6.5¢ 12¢ 20¢
This table summarizes optimal parking fees. Although measured per vehicle-mile in this table, direct user
fees would actually be priced per trip, or as monthly fees.
Page 11
Economically Optimal Transport Prices and Markets Victoria Transport Policy Institute
11
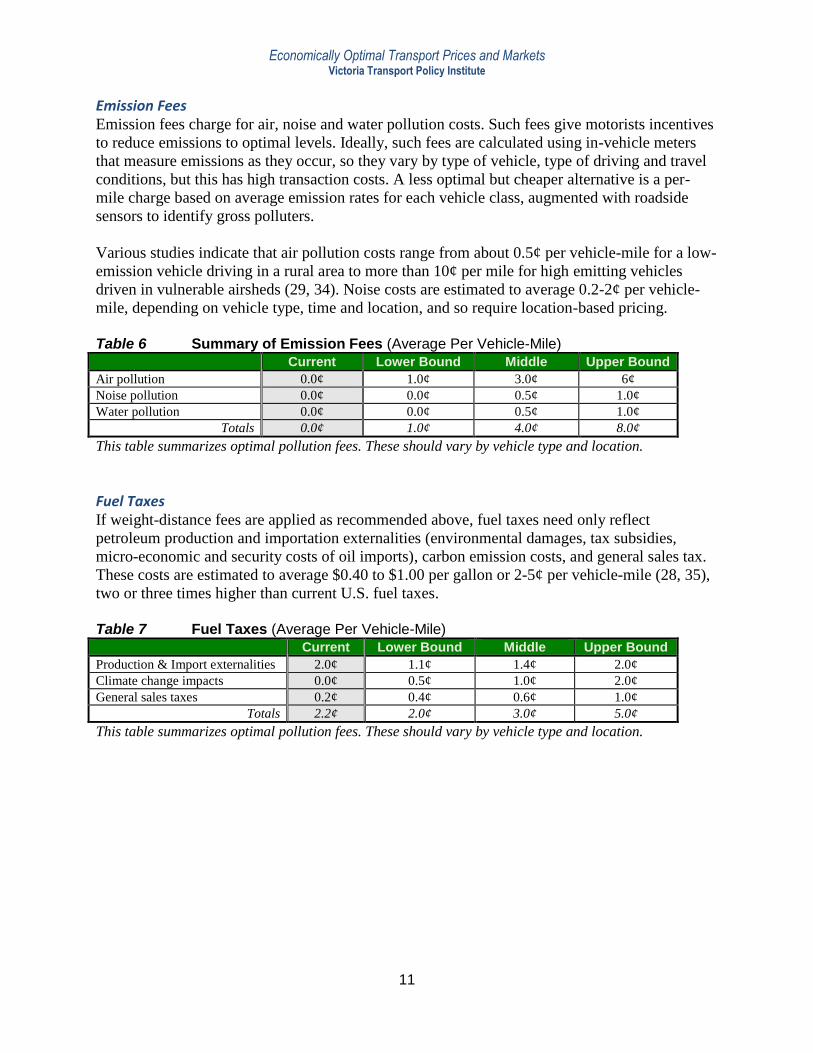
Emission Fees Emission fees charge for air, noise and water pollution costs. Such fees give motorists incentives
to reduce emissions to optimal levels. Ideally, such fees are calculated using in-vehicle meters
that measure emissions as they occur, so they vary by type of vehicle, type of driving and travel
conditions, but this has high transaction costs. A less optimal but cheaper alternative is a per-
mile charge based on average emission rates for each vehicle class, augmented with roadside
sensors to identify gross polluters.
Various studies indicate that air pollution costs range from about 0.5¢ per vehicle-mile for a low-
emission vehicle driving in a rural area to more than 10¢ per mile for high emitting vehicles
driven in vulnerable airsheds (29, 34). Noise costs are estimated to average 0.2-2¢ per vehicle-
mile, depending on vehicle type, time and location, and so require location-based pricing.
Table 6 Summary of Emission Fees (Average Per Vehicle-Mile)
Current Lower Bound Middle Upper Bound
Air pollution 0.0¢ 1.0¢ 3.0¢ 6¢
Noise pollution 0.0¢ 0.0¢ 0.5¢ 1.0¢
Water pollution 0.0¢ 0.0¢ 0.5¢ 1.0¢
Totals 0.0¢ 1.0¢ 4.0¢ 8.0¢
This table summarizes optimal pollution fees. These should vary by vehicle type and location.
Fuel Taxes If weight-distance fees are applied as recommended above, fuel taxes need only reflect
petroleum production and importation externalities (environmental damages, tax subsidies,
micro-economic and security costs of oil imports), carbon emission costs, and general sales tax.
These costs are estimated to average $0.40 to $1.00 per gallon or 2-5¢ per vehicle-mile (28, 35),
two or three times higher than current U.S. fuel taxes.
Table 7 Fuel Taxes (Average Per Vehicle-Mile)
Current Lower Bound Middle Upper Bound
Production & Import externalities 2.0¢ 1.1¢ 1.4¢ 2.0¢
Climate change impacts 0.0¢ 0.5¢ 1.0¢ 2.0¢
General sales taxes 0.2¢ 0.4¢ 0.6¢ 1.0¢
Totals 2.2¢ 2.0¢ 3.0¢ 5.0¢
This table summarizes optimal pollution fees. These should vary by vehicle type and location.
Page 12
Economically Optimal Transport Prices and Markets Victoria Transport Policy Institute
12
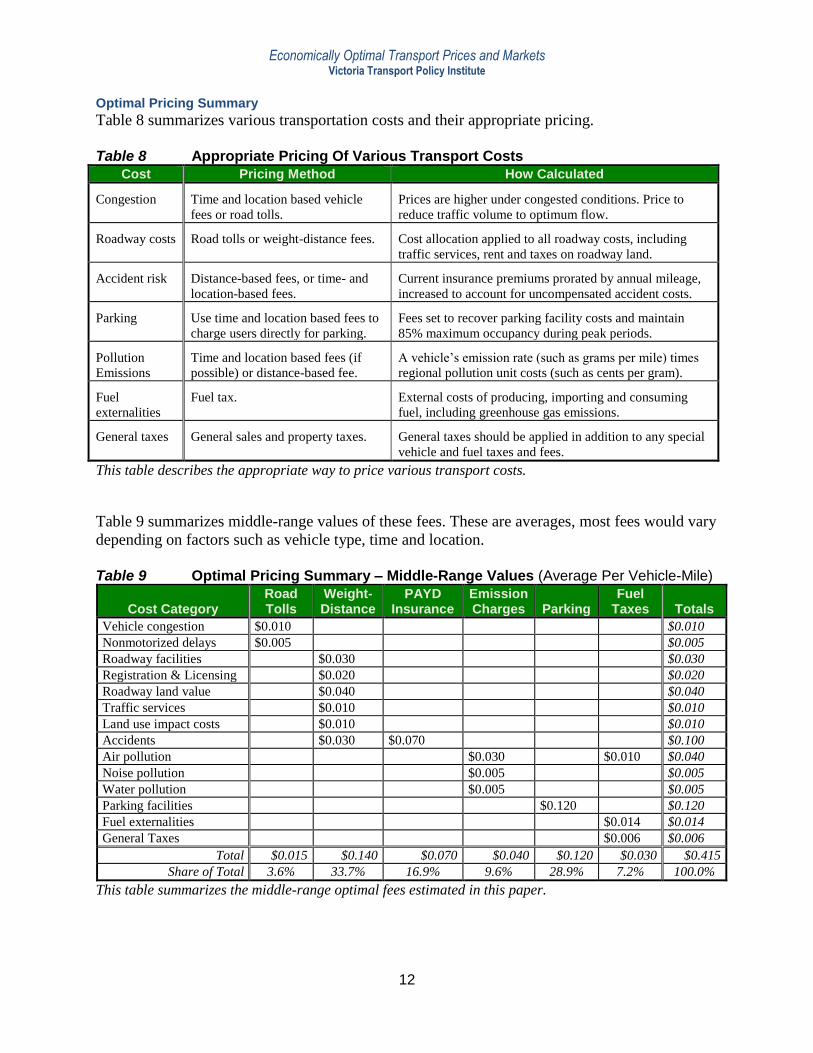
Optimal Pricing Summary
Table 8 summarizes various transportation costs and their appropriate pricing.
Table 8 Appropriate Pricing Of Various Transport Costs
Cost Pricing Method How Calculated
Congestion Time and location based vehicle
fees or road tolls.
Prices are higher under congested conditions. Price to
reduce traffic volume to optimum flow.
Roadway costs Road tolls or weight-distance fees. Cost allocation applied to all roadway costs, including
traffic services, rent and taxes on roadway land.
Accident risk Distance-based fees, or time- and
location-based fees.
Current insurance premiums prorated by annual mileage,
increased to account for uncompensated accident costs.
Parking Use time and location based fees to
charge users directly for parking.
Fees set to recover parking facility costs and maintain
85% maximum occupancy during peak periods.
Pollution
Emissions
Time and location based fees (if
possible) or distance-based fee.
A vehicle’s emission rate (such as grams per mile) times
regional pollution unit costs (such as cents per gram).
Fuel
externalities
Fuel tax. External costs of producing, importing and consuming
fuel, including greenhouse gas emissions.
General taxes General sales and property taxes. General taxes should be applied in addition to any special
vehicle and fuel taxes and fees.
This table describes the appropriate way to price various transport costs.
Table 9 summarizes middle-range values of these fees. These are averages, most fees would vary
depending on factors such as vehicle type, time and location.
Table 9 Optimal Pricing Summary – Middle-Range Values (Average Per Vehicle-Mile)
Cost Category Road Tolls
Weight-Distance
PAYD Insurance
Emission Charges Parking
Fuel Taxes Totals
Vehicle congestion $0.010 $0.010
Nonmotorized delays $0.005 $0.005
Roadway facilities $0.030 $0.030
Registration & Licensing $0.020 $0.020
Roadway land value $0.040 $0.040
Traffic services $0.010 $0.010
Land use impact costs $0.010 $0.010
Accidents $0.030 $0.070 $0.100
Air pollution $0.030 $0.010 $0.040
Noise pollution $0.005 $0.005
Water pollution $0.005 $0.005
Parking facilities $0.120 $0.120
Fuel externalities $0.014 $0.014
General Taxes $0.006 $0.006
Total $0.015 $0.140 $0.070 $0.040 $0.120 $0.030 $0.415
Share of Total 3.6% 33.7% 16.9% 9.6% 28.9% 7.2% 100.0%
This table summarizes the middle-range optimal fees estimated in this paper.
Page 13
Economically Optimal Transport Prices and Markets Victoria Transport Policy Institute
13
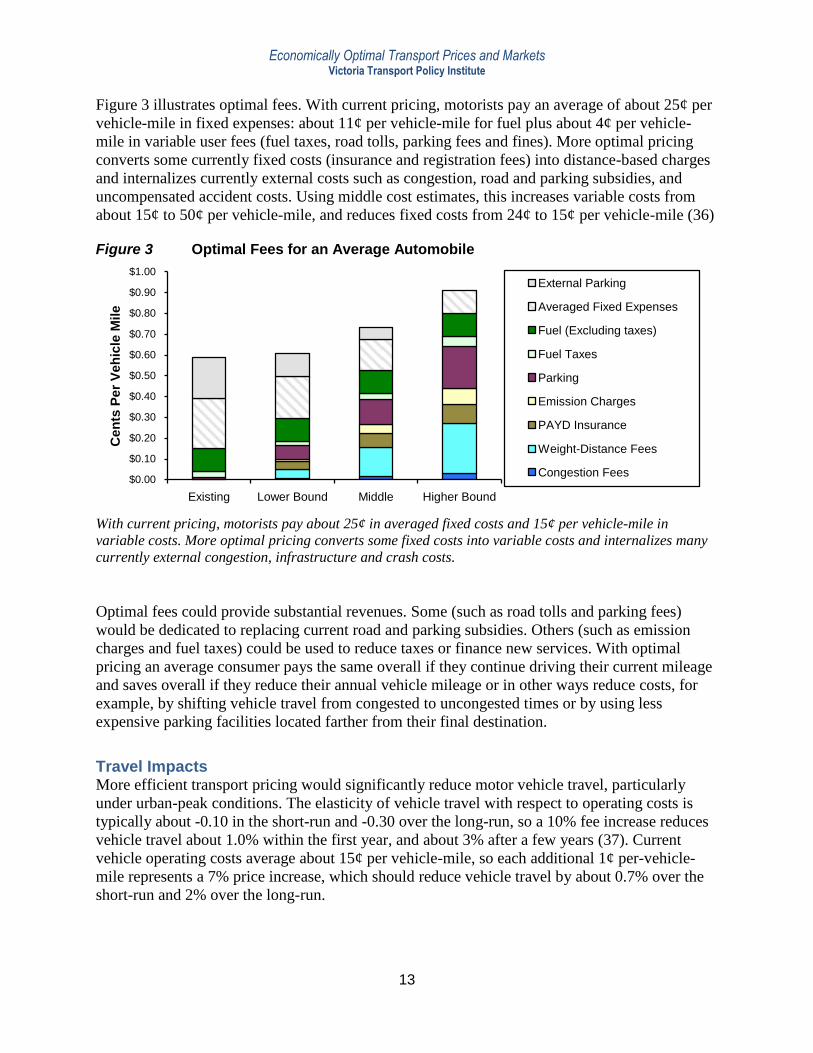
Figure 3 illustrates optimal fees. With current pricing, motorists pay an average of about 25¢ per
vehicle-mile in fixed expenses: about 11¢ per vehicle-mile for fuel plus about 4¢ per vehicle-
mile in variable user fees (fuel taxes, road tolls, parking fees and fines). More optimal pricing
converts some currently fixed costs (insurance and registration fees) into distance-based charges
and internalizes currently external costs such as congestion, road and parking subsidies, and
uncompensated accident costs. Using middle cost estimates, this increases variable costs from
about 15¢ to 50¢ per vehicle-mile, and reduces fixed costs from 24¢ to 15¢ per vehicle-mile (36) Figure 3 Optimal Fees for an Average Automobile
$0.00
$0.10
$0.20
$0.30
$0.40
$0.50
$0.60
$0.70
$0.80
$0.90
$1.00
Existing Lower Bound Middle Higher Bound
Cen
ts P
er
Veh
icle
Mile
External Parking
Averaged Fixed Expenses
Fuel (Excluding taxes)
Fuel Taxes
Parking
Emission Charges
PAYD Insurance
Weight-Distance Fees
Congestion Fees
With current pricing, motorists pay about 25¢ in averaged fixed costs and 15¢ per vehicle-mile in
variable costs. More optimal pricing converts some fixed costs into variable costs and internalizes many
currently external congestion, infrastructure and crash costs.
Optimal fees could provide substantial revenues. Some (such as road tolls and parking fees)
would be dedicated to replacing current road and parking subsidies. Others (such as emission
charges and fuel taxes) could be used to reduce taxes or finance new services. With optimal
pricing an average consumer pays the same overall if they continue driving their current mileage
and saves overall if they reduce their annual vehicle mileage or in other ways reduce costs, for
example, by shifting vehicle travel from congested to uncongested times or by using less
expensive parking facilities located farther from their final destination.
Travel Impacts More efficient transport pricing would significantly reduce motor vehicle travel, particularly
under urban-peak conditions. The elasticity of vehicle travel with respect to operating costs is
typically about -0.10 in the short-run and -0.30 over the long-run, so a 10% fee increase reduces
vehicle travel about 1.0% within the first year, and about 3% after a few years (37). Current
vehicle operating costs average about 15¢ per vehicle-mile, so each additional 1¢ per-vehicle-
mile represents a 7% price increase, which should reduce vehicle travel by about 0.7% over the
short-run and 2% over the long-run.
Page 14
Economically Optimal Transport Prices and Markets Victoria Transport Policy Institute
14
These reforms have interactive effects, so their impacts cannot simply be added. On one hand, by
themselves, large price increases tend to have diminishing marginal effects. On the other hand,
many reforms have synergistic effects (total impacts are greater than the sum of individual
impacts). For example, individually, improving public transit and efficient parking pricing might
each reduce automobile commuting 10%, but implemented together cause a 30% reduction.
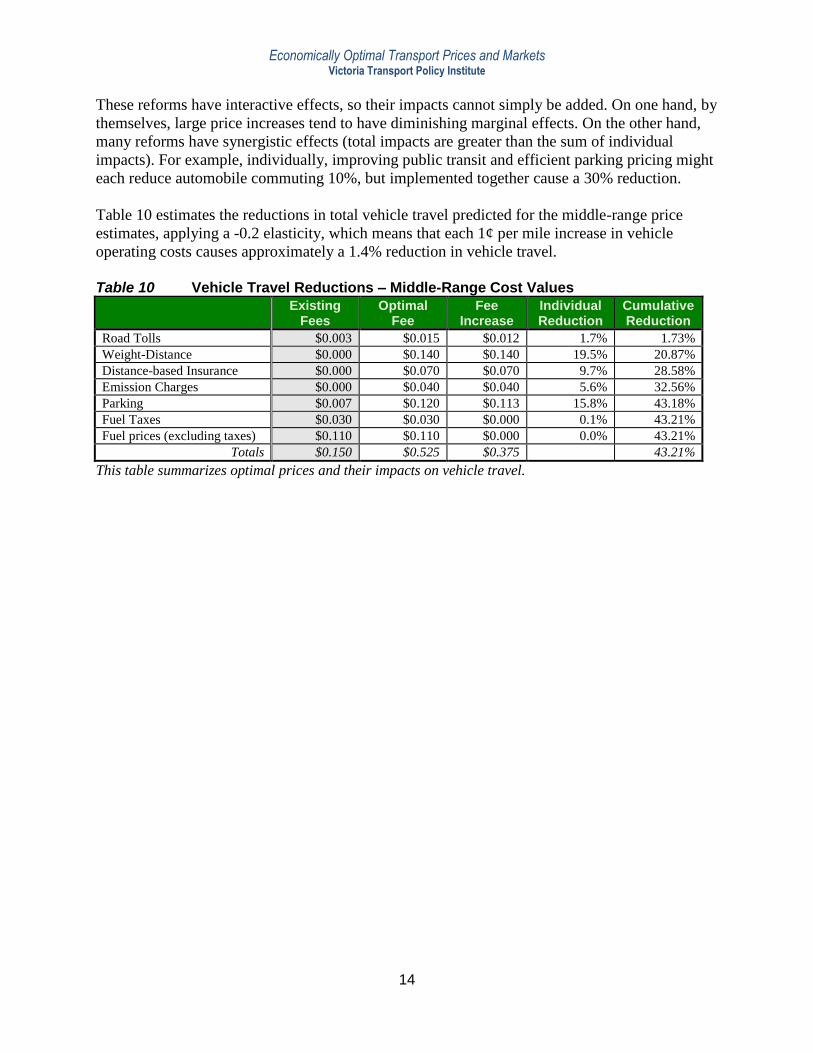
Table 10 estimates the reductions in total vehicle travel predicted for the middle-range price
estimates, applying a -0.2 elasticity, which means that each 1¢ per mile increase in vehicle
operating costs causes approximately a 1.4% reduction in vehicle travel.
Table 10 Vehicle Travel Reductions – Middle-Range Cost Values
Existing
Fees Optimal
Fee Fee
Increase Individual Reduction
Cumulative Reduction
Road Tolls $0.003 $0.015 $0.012 1.7% 1.73%
Weight-Distance $0.000 $0.140 $0.140 19.5% 20.87%
Distance-based Insurance $0.000 $0.070 $0.070 9.7% 28.58%
Emission Charges $0.000 $0.040 $0.040 5.6% 32.56%
Parking $0.007 $0.120 $0.113 15.8% 43.18%
Fuel Taxes $0.030 $0.030 $0.000 0.1% 43.21%
Fuel prices (excluding taxes) $0.110 $0.110 $0.000 0.0% 43.21%
Totals $0.150 $0.525 $0.375 43.21%
This table summarizes optimal prices and their impacts on vehicle travel.
Page 15
Economically Optimal Transport Prices and Markets Victoria Transport Policy Institute
15
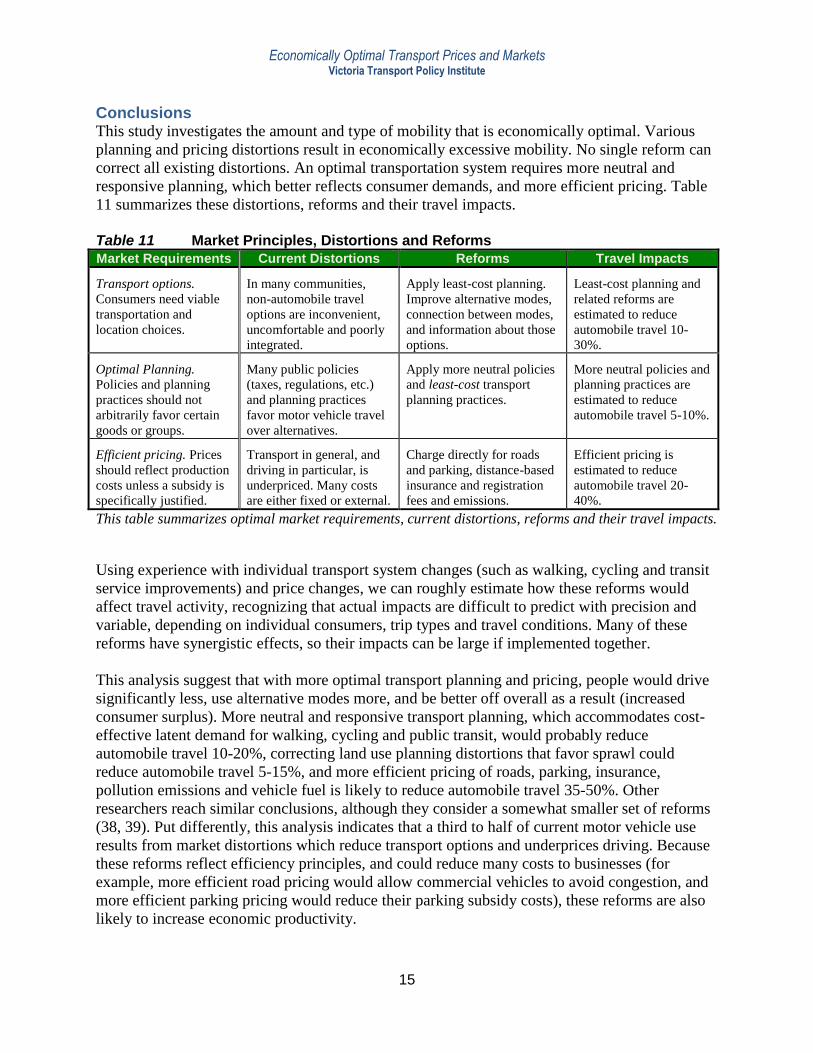
Conclusions This study investigates the amount and type of mobility that is economically optimal. Various
planning and pricing distortions result in economically excessive mobility. No single reform can
correct all existing distortions. An optimal transportation system requires more neutral and
responsive planning, which better reflects consumer demands, and more efficient pricing. Table
11 summarizes these distortions, reforms and their travel impacts.
Table 11 Market Principles, Distortions and Reforms
Market Requirements Current Distortions Reforms Travel Impacts
Transport options.
Consumers need viable
transportation and
location choices.
In many communities,
non-automobile travel
options are inconvenient,
uncomfortable and poorly
integrated.
Apply least-cost planning.
Improve alternative modes,
connection between modes,
and information about those
options.
Least-cost planning and
related reforms are
estimated to reduce
automobile travel 10-
30%.
Optimal Planning.
Policies and planning
practices should not
arbitrarily favor certain
goods or groups.
Many public policies
(taxes, regulations, etc.)
and planning practices
favor motor vehicle travel
over alternatives.
Apply more neutral policies
and least-cost transport
planning practices.
More neutral policies and
planning practices are
estimated to reduce
automobile travel 5-10%.
Efficient pricing. Prices
should reflect production
costs unless a subsidy is
specifically justified.
Transport in general, and
driving in particular, is
underpriced. Many costs
are either fixed or external.
Charge directly for roads
and parking, distance-based
insurance and registration
fees and emissions.
Efficient pricing is
estimated to reduce
automobile travel 20-
40%.
This table summarizes optimal market requirements, current distortions, reforms and their travel impacts.
Using experience with individual transport system changes (such as walking, cycling and transit
service improvements) and price changes, we can roughly estimate how these reforms would
affect travel activity, recognizing that actual impacts are difficult to predict with precision and
variable, depending on individual consumers, trip types and travel conditions. Many of these
reforms have synergistic effects, so their impacts can be large if implemented together.
This analysis suggest that with more optimal transport planning and pricing, people would drive
significantly less, use alternative modes more, and be better off overall as a result (increased
consumer surplus). More neutral and responsive transport planning, which accommodates cost-
effective latent demand for walking, cycling and public transit, would probably reduce
automobile travel 10-20%, correcting land use planning distortions that favor sprawl could
reduce automobile travel 5-15%, and more efficient pricing of roads, parking, insurance,
pollution emissions and vehicle fuel is likely to reduce automobile travel 35-50%. Other
researchers reach similar conclusions, although they consider a somewhat smaller set of reforms
(38, 39). Put differently, this analysis indicates that a third to half of current motor vehicle use
results from market distortions which reduce transport options and underprices driving. Because
these reforms reflect efficiency principles, and could reduce many costs to businesses (for
example, more efficient road pricing would allow commercial vehicles to avoid congestion, and
more efficient parking pricing would reduce their parking subsidy costs), these reforms are also
likely to increase economic productivity.
Page 16
Economically Optimal Transport Prices and Markets Victoria Transport Policy Institute
16
Endnotes
1 Todd Litman (2007), Socially Optimal Transport Prices and Markets, VTPI (www.vtpi.org); at
www.vtpi.org/sotpm.pdf.
2 Stephen Proost and Kurt Van Dender (2008), “Optimal Urban Transport Pricing In The Presence Of
Congestion, Economies Of Density and Costly Public Funds,” Transportation Research A, Vol. 42. Issue
9 (www.elsevier.com/locate/tra), pp. 1220-1230.
3 Elena Safirova, Sebastien Houde and Winston Harrington (2007), Marginal Social Cost Pricing on a
Transportation Network: Comparison of Second-Best Policies, Resources for the Future (www.rff.org); at
www.rff.org/documents/RFF-DP-07-52.pdf.
4 Jos Dings, et al. (2002), Returns on Roads: Optimising Road Investments and Usage With 'The User
Pays Principle', CE Delft (www.ce.nl).
5 Andrea Ricci, et al (2006), Pricing For (Sustainable) Transport Policies – A State Of The Art, Deliverable
1, Project contract no. 006293, IMPRINT-NET: Implementing pricing reforms in Transport – Networking
(http://vplno1.vkw.tu-dresden.de/psycho/download/imprint-net_d1.pdf).
6 Todd Litman (2006), “Transportation Market Distortions,” Berkeley Planning Journal; issue theme
Sustainable Transport in the United States: From Rhetoric to Reality? (www-dcrp.ced.berkeley.edu/bpj),
Volume 19, 2006, pp. 19-36; at www.vtpi.org/distortions_BPJ.pdf.
7 Todd Litman (2012), Toward More Comprehensive and Multi-modal Transport Evaluation, VTPI
(www.vtpi.org); at www.vtpi.org/comp_evaluation.pdf; summarized in JOURNEYS, September 2013, pp. 50-58 (www.ltaacademy.gov.sg/journeys.htm).
8 Jeffrey R. Brown, Eric A. Morris and Brian D. Taylor (2009), “Paved With Good Intentions: Fiscal
Politics, Freeways, and the 20th Century American City,” Access 35 (www.uctc.net), Fall, pp. 30-37; at
www.uctc.net/access/35/access35.shtml.
9 Keith Bartholomew (2007), “The Machine, The Garden, and The City: Toward An Access-Efficient
Transportation Planning System,” The Environmental Law Reporter News & Analysis, Vol XXXVII, No. 8
(www.elr.info), August, pp. 10593-10614.
10 Mark E. Hallenbeck, et al (2006), Options for Making Concurrency More Multimodal, Washington State
Transportation Research Center (TRAC-UW), University of Washington, for the Puget Sound Regional
Council; at http://depts.washington.edu/trac/bulkdisk/pdf/ConcurrencyOptions.pdf.
11 Jonathan Levine (2006), Zoned Out: Regulation, Markets, and Choices in Transportation and
Metropolitan Land-Use, Resources for the Future (www.rff.org).
12 Michael Lewyn (2005), “How Overregulation Creates Sprawl (Even in a City without Zoning),” Wayne
Law Review, Vol. 50, p. 1171; at http://ssrn.com/abstract=837244.
13 Edward Beimborn and Robert Puentes (2003), Highways and Transit: Leveling the Playing Field in
Federal Transportation Policy, Brookings Institution (www.brookings.edu).
14 DfT (2006), Transport Analysis Guidance, Integrated Transport Economics and Appraisal, Department
for Transport (www.dft.gov.uk/webtag).
Page 17
Economically Optimal Transport Prices and Markets Victoria Transport Policy Institute
17
15 Gary Binger, Richard Lee, Charles Rivasplata, Alexis Lynch and Marlene Subhashini (2008),
Connecting Transportation Decision Making with Responsible Land Use: State and Regional Policies,
Programs, and Incentives, Mineta Transportation Institute (http://transweb.sjsu.edu); at
http://transweb.sjsu.edu/mtiportal/research/publications/summary/0703.html.
16 FHWA (2012), Report to the U.S. Congress on the Outcomes of the Nonmotorized Transportation Pilot
Program, Federal Highway Administration (www.fhwa.dot.gov); at
www.fhwa.dot.gov/environment/bicycle_pedestrian/ntpp/2012_report/final_report_april_2012.pdf.
17 Thomas Gotschi (2011), “Costs and Benefits of Bicycling Investments in Portland, Oregon,” Journal of
Physical Activity and Health, Vol. 8, Supplement 1, pp. S49-S58; at
http://journals.humankinetics.com/jpah-supplements-special-issues/jpah-volume-8-supplement-
january/costs-and-benefits-of-bicycling-investments-in-portland-oregon.
18 FHWA (2012), Integrating Demand Management Into The Transportation Planning Process: A Desk
Reference, FHWA-HOP-12-035, Office of Operations (www.ops.fhwa.dot.gov), Federal Highway
Administration; at www.ops.fhwa.dot.gov/publications/fhwahop12035/index.htm.
19 Todd Litman (2009), Where We Want To Be: Home Location Preferences And Their Implications For
Smart Growth, Victoria Transport Policy Institute (www.vtpi.org); at www.vtpi.org/sgcp.pdf.
20 NAR (2011), 2011 Community Preference Survey: What Americans Are Looking For When Deciding
Where To Live, National Association of Realtors (www.realtor.org); at
www.realtor.org/press_room/news_releases/2011/04/smart_growth.
21 Reid Ewing and Robert Cervero (2010), “Travel and the Built Environment: A Meta-Analysis,” Journal of
the American Planning Association, Vol. 76, No. 3, Summer, pp. 265-294; at
http://pdfserve.informaworld.com/287357__922131982.pdf.
22 Lei Zhang, et al. (2012), How Built-Environment Affect Travel Behavior: A Comparative Analysis of
Travel Behavior and Land Use in U.S. Cities, Journal of Transport and Land Use (http://jtlu.org), Vol. 5,
No. 3, pp. 40-52; at www.jtlu.org/index.php/jtlu/article/view/266/268.
23 Robert Johnston (2006), Review of U.S. and European Regional Modeling Studies of Policies Intended
to Reduce Motorized Travel, Fuel Use, and Emissions, Environmental Science & Policy, University of
California, Davis; at www.vtpi.org/johnston.pdf.
24 van Essen, et al (2004), Marginal Costs of Infrastructure Use – Towards a Simplified Approach, CE
Delft (www.ce.nl); at
www.ce.nl/publicatie/marginal_costs_of_infrastructure_use_%96_towards_a_simplified_approach/455.
25 Douglass Lee (1995), Full Cost Pricing of Highways, Volpe Transportation Systems Center
(www.volpe.dot.gov).
26 Subsidy Scope (2009), Analysis Finds Shifting Trends in Highway Funding: User Fees Make Up
Decreasing Share, Subsidy Scope (www.subsidyscope.com); at
www.subsidyscope.com/transportation/highways/funding.
Page 18
Economically Optimal Transport Prices and Markets Victoria Transport Policy Institute
18
27 CE, INFRAS, ISI (2011), External Costs of Transport in Europe – Update Study for 2008, Studie im
Auftrag des Internationalen Eisenbahnverbandes (UIC), CE Delft, INFRAS AG, Zürich, Fraunhofer-ISI,
Karlsruhe, External Transport Cost Study (http://ecocalc-test.ecotransit.org); at http://ecocalc-
test.ecotransit.org/CE_Delft_4215_External_Costs_of_Transport_in_Europe_def.pdf.
28 TC (2005-08), The Full Cost Investigation of Transportation in Canada, Transport Canada
(www.tc.gc.ca/eng/policy/aca-fci-menu.htm); at www.tc.gc.ca/media/documents/policy/report-final.pdf.
29 Todd Litman (2009), Transportation Cost and Benefit Analysis; Techniques, Estimates and
Implications, Victoria Transport Policy Institute (www.vtpi.org/tca).
30 Lei Zhang and Yijing Lu (2012), “Marginal Cost Vehicle Mileage Fee,” Transportation Research Record
2297, Transportation Research Board (www.trb.org), pp. 10-10; at
http://trb.metapress.com/content/q050l35u7r726813.
31 Joseph Jones and Fred Nix (1995), Survey of the Use of Highway Cost Allocation in Road Pricing
Decisions, Transportation Association of Canada (www.tac-atc.org).
32 FHWA (1997), 1997 Federal Highway Cost Allocation Study, Federal Highway Administration, USDOT
(www.fhwa.dot.gov/policy/hcas/summary/index.htm).
33 FHWA (2012), (Table HF-10,” Highway Statistics Series, Federal Highway Administration
(www.fhwa.dot.gov/policyinformation/statistics/2011/hf10.cfm)
34 Vermeulen, et al (2004), The Price of Transport: Overview of the Social Costs of Transport, CE Delft
(www.ce.nl); at www.rapportsysteem.nl/artikel/index.php?id=181&action=read.
35 IMF (2010), Petroleum Product Subsidies: Costly, Inequitable, and Rising, International Monetary Fund
(www.imf.org); at www.imf.org/external/pubs/ft/spn/2010/spn1005.pdf.
36 Zhang and Lu (2012) estimate that optimal vehicle fees would average 7.7¢ to 9.1¢ per vehicle mile,
including congestion, infrastructure deterioration and pollution emissions, but not including roadway
capital costs, parking subsidies, accident externalities or noise pollution.
37 Todd Litman (2013), Transport Elasticities: Impacts on Travel Behaviour: Understanding Transport
Demand To Support Sustainable Travel Behavior, Technical Document #11, Sustainable Urban Transport
Project (www.sutp.org) and GIZ (www.giz.de); at www.sutp.org/index.php/en-dn-tp.
38 Elena Safirova, Sebastien Houde and Winston Harrington (2007), Marginal Social Cost Pricing on a
Transportation Network: Comparison of Second-Best Policies, Resources for the Future (www.rff.org); at
www.rff.org/documents/RFF-DP-07-52.pdf.
39 Lei Zhang and Yijing Lu (2012), “Marginal Cost Vehicle Mileage Fee,” Transportation Research Record
2297, Transportation Research Board (www.trb.org), pp. 10-10; at
http://trb.metapress.com/content/q050l35u7r726813.
www.vtpi.org/ITED_optimal.pdf