economics@ 1 Tasmania’s economic recovery: Tasmania’s economic recovery: is it the ‘Real McCoy?’ is it the ‘Real McCoy?’ Saul Eslake Saul Eslake Chief Economist Chief Economist ANZ Bank ANZ Bank Elizabeth Pier Elizabeth Pier Hobart Hobart 10 December 2004 10 December 2004 Presentation to Presentation to Tasmanian Economic Forum Tasmanian Economic Forum [email protected][email protected](03) 9273 6251 (03) 9273 6251
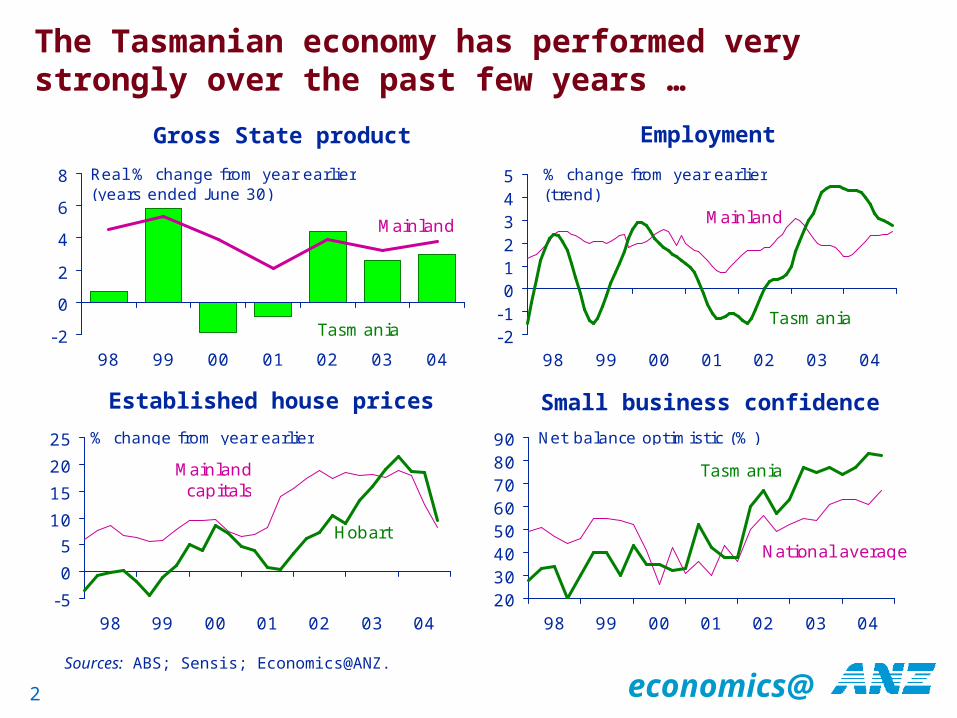
The Tasmanian economy has performed very strongly over the past few years …
Gross State product
-2
0
2
4
6
8
98 99 00 01 02 03 04
Real % change from year earlier(years ended June 30)
Tasmania
Mainland
Established house prices
-5
0
5
10
15
20
25
98 99 00 01 02 03 04
% change from year earlier
Hobart
Mainland capitals
Employment
-2-1012345
98 99 00 01 02 03 04
% change from year earlier(trend)
Tasmania
Mainland
Sources: ABS; Sensis; Economics@ANZ.
Small business confidence
2030405060708090
98 99 00 01 02 03 04
Net balance optimistic (%)
Tasmania
National average
economics@
3
… resulting in a number of improvements in Tasmania’s standing relative to the mainland
Per capita State product
70
75
80
85
90
80 85 90 95 00 05
Tasmania as a % of national average
Seriesbreak
Unemployment rate
0
1
2
3
4
80 85 90 95 00 05
% points (trend)
Gap betweenTasmania &mainland
80
85
90
95
80 85 90 95 00 05
Tasmania as a % of national per capita average
Series break
Household disposable income
Sources: ABS; Economics@ANZ.
Net interstate migration
-75
-50
-25
0
25
50
75
80 85 90 95 00 05
No. per week (4-qtr moving average)
economics@
The housing boom has made an above-average The housing boom has made an above-average contribution to Tasmania’s recent economic contribution to Tasmania’s recent economic upturnupturn
Sources: ABS; Economics@ANZ
P.c. point contributions to real GSP growth, 2000-01 to 2003-04
0
1
2
3
4
NSW Vic Qld SA WA Tas NT ACT
% pts p.a.
Consumer spending
0.0
0.5
1.0
1.5
2.0
NSW Vic Qld SA WA Tas NT ACT
% pts p.a.
Dwelling investment
0
1
2
3
4
5
NSW Vic Qld SA WA Tas NT ACT
% pts p.a.
Business investment
0
1
2
3
NSW Vic Qld SA WA Tas NT ACT
% pts p.a.
Public spending
economics@
Good economic policy at the State level has Good economic policy at the State level has played an important role in these resultsplayed an important role in these results
State budget balance*
0
1
2
3
98 99 00 01 02 03 04 05
% of gross State product
(f)
State public sector net debt
05
101520253035
98 99 00 01 02 03 04 05
% of gross State product
(f)
90
95
100
105
96 97 98 99 00 01 02 03
All-state average = 100
Series break
Relative severity of State taxation†
Severity of State taxation, 2002-03
85
90
95
100
105
110
115
NSW Vic Qld SA WA Tas ACT NT
All-State average = 100
*General government sector. †“Revenue-raising effort ratio”. Sources: ABS; Tasmanian Department of Treasury & Finance; Commonwealth Grants Commission.
economics@
The tourist industry provides a specific example of The tourist industry provides a specific example of the benefits of good policy at the industry levelthe benefits of good policy at the industry level
Visitors to Tasmania*
500
550
600
650
700
750
800
99 00 01 02 03 04
'000s (years ended 30 June)
Average spend per visitor
Accommodation occupancy rates
Takings per available room night
* by scheduled sea and air services. Sources: Tourism Tasmania; ABS; Economics@ANZ.
0.80.91.01.11.21.31.41.5
99 00 01 02 03 04
$'000 (years ended 30 June)
50
52
54
56
58
60
98 99 00 01 02 03 04
% (4-qtr moving average)
40
45
50
55
60
65
98 99 00 01 02 03 04
$ (4-qtr moving average)
economics@
The Commonwealth government’s contribution to The Commonwealth government’s contribution to Tasmania’s recovery has been fairly smallTasmania’s recovery has been fairly small
Commonwealth direct expenditure in Tasmania
Contribution of C’wlth direct expenditure to real GSP growth
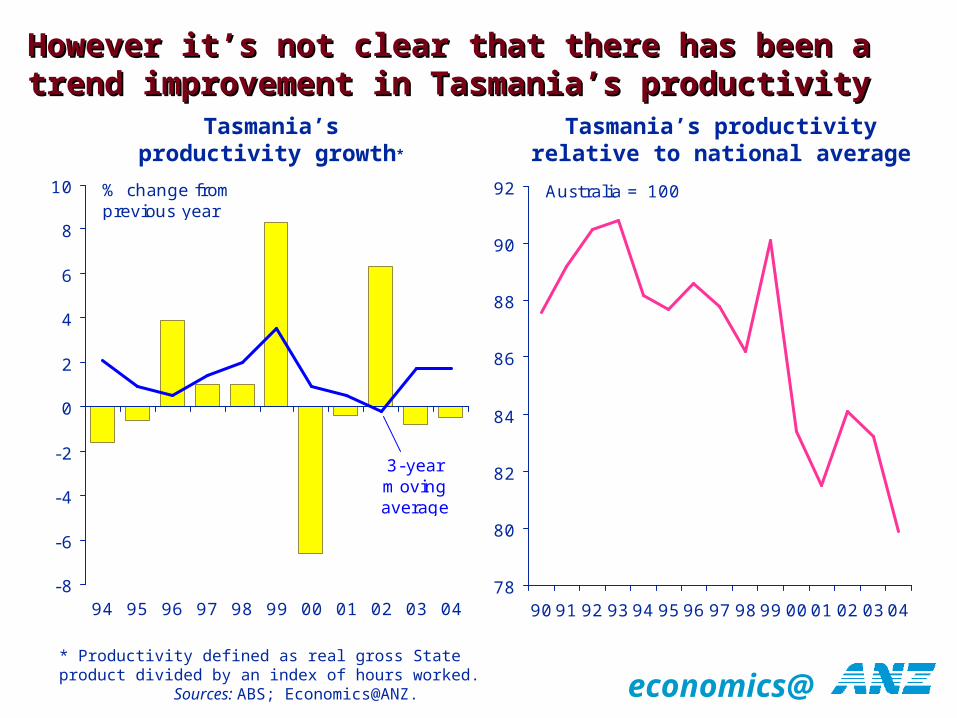
However it’s not clear that there has been a trend However it’s not clear that there has been a trend improvement in Tasmania’s productivity improvement in Tasmania’s productivity
Tasmania’s productivity growth*
-8
-6
-4
-2
0
2
4
6
8
10
94 95 96 97 98 99 00 01 02 03 04
% change fromprevious year
3-yearmovingaverage
Tasmania’s productivityrelative to national average
78
80
82
84
86
88
90
92
90 91 92 93 94 95 96 97 98 99 00 01 02 03 04
Australia = 100
* Productivity defined as real gross State product divided by an index of hours worked. Sources: ABS; Economics@ANZ.
economics@
9
Productivity is ‘what you get out for what you Productivity is ‘what you get out for what you put in’ - and it mattersput in’ - and it matters
“Productivity is the prime determinant in the long run of a nation’s standard of living, for it is the root cause of per capita national income
High productivity not only supports high levels of income but allows citizens the option of choosing more leisure instead of working longer hours.
It also creates the national income that is taxed to pay for public services which again boosts the standard of living
The capacity to be highly productive also allows a nation’s firms to meet stringent social standards which improve the standard of living, such as in health and safety, equal opportunity and environmental impact”
– Michael E. Porter, The Competitive Advantage of Nations (1991), page 6
economics@
10
Note: Growth rates are measured from 1990-91 (the trough of the last recession) to 2003-04. Sources: ABS; Economics@ANZ.
Productivity and real per capita household income
growth
0
1
2
3
4
0 1 2 3
Growth in real GSP per hour worked (% pa)
SATas
Qld
NSW
Vic
NT
WA
Gro
wth
in r
eal in
com
e p
er
head (
% p
a)
ACT
Tas 2000-01to 2003-04
Productivity growth is a key driver of both Productivity growth is a key driver of both household income and employment growthhousehold income and employment growth
Productivity and employment growth
0
1
2
3
0 1 2 3Growth in real GSP per hour worked (% pa)
SA
Tas
Qld
NSW Vic
NT
WA
Gro
wth
in e
mplo
ym
ent
(% p
a)
ACT
Tas 2000-01to 2003-04
economics@
11
Note: Investment shares and productivity growth are averages over the period 1990-91 to 2003-04.Sources: ABS; Economics@ANZ.
Investmentas a share of GSP
Investment as a share of GSP and productivity growth
Investment in physical capital is an important Investment in physical capital is an important driver of productivity growth …driver of productivity growth …
0
1
2
3
0 10 20 30I nvestment as a % of GSP
SA
Tas
Qld
NSW
Vic
NT
WA
Gro
wth
in r
eal G
SP p
er
hour
work
ed
(% p
a)
ACT
Tas 2000-01to 2003-04
0
5
10
15
20
25
NSW Vic Qld SA WA Tas NT ACT
Public
Business
% of GSP Tas2000-01
to2003-04
economics@
12
Sources: ABS; Economics@ANZ.
% of 15-64 year olds withpost-school qualifications
‘Human capital’ and productivity growth
… … and so is investment in human capitaland so is investment in human capital
0
1
2
3
35 40 45 50 55% of 15-64 year olds with post-secondary
qualifications, 1993-2003
SA
Tas
Qld
NSW
Vic
NT
WA
Pro
duct
ivity g
row
th,
1990-9
1 t
o 2
003-0
4 (
%
pa)
ACT
Tas 2000-01to 2003-04
0
10
20
30
40
50
60
NSW Vic Qld SA WA Tas NT ACT
Average, 1993-2003Tas
2001-03
economics@
13
Tasmania is starting to do better on some human capital indicators, but results take time
Source: ABS.
% of 15-64 year olds not finishing year 12
School retention rates to year 12
20
30
40
50
60
70
80
82 87 93 94 95 96 97 98 99 00 01 02 03
% National average
Tasmania
25
30
35
40
45
50
93 94 95 96 97 98 99 00 01 02 03
%
National average
Tasmania
School retention rates to year 12
20
30
40
50
60
70
80
82 87 93 94 95 96 97 98 99 00 01 02 03
% National average
Tasmania
% of 15-64 year olds withpost-secondary qualifications
35
40
45
50
93 94 95 96 97 98 99 00 01 02 03
%
National average
Tasmania
% of 15-24 year olds in higher education
5
10
15
20
25
93 94 95 96 97 98 99 00 01 02 03
%
National average
Tasmania
economics@
But it’s also important to monitor quality of But it’s also important to monitor quality of outcomes – where Tasmania isn’t doing so welloutcomes – where Tasmania isn’t doing so well
Reading literacy
Mathematical literacy
0
20
40
60
80
100
NSW Vic Qld SA WA Tas NT ACT
Source: Australian Council for Educational Research; Program for International Student Assessment (PISA).
0
20
40
60
80
100
NSW Vic Qld SA WA Tas NT ACT
Problem solving ability
0
20
40
60
80
100
NSW Vic Qld SA WA Tas NT ACT
Below Level 1 (‘likely to be seriouslydisadvantaged in life beyond school’)
Level 1(lowest)
Level 2 Level 3
Level 4 Level 5 Level 6(highest)
Results based on testing of 12,500 students from 321 schools randomly selected from across Australia in 2003 as part of an OECD-sponsored assessment involving 41 countries.
economics@
Tasmania still ranks poorly on a range of other Tasmania still ranks poorly on a range of other indicators of social well-beingindicators of social well-being
Dependency on social security payments (excl. age
pension)
0
4
8
12
16
NSW Vic Qld SA WA Tas NT ACT
% of population(2003)
Sources: ABS; Economics@ANZ.
Children under 15 living in homes with no employed adult
0
5
10
15
20
25
NSW Vic Qld SA WA Tas NT ACT
% of children under15 (2001)
Births outside marriage not acknowledged by father
0
4
8
12
NSW Vic Qld SA WA Tas NT ACT
% of total births(2002)
(22%)
Household access tothe internet
010203040506070
NSW Vic Qld SA WA Tas NT ACT
% of households (2002)
(na)
economics@
Tasmania also ranks poorly on a range of Tasmania also ranks poorly on a range of ‘diversity’ indicators‘diversity’ indicators
Asian-born population
0
2
4
6
8
NSW Vic Qld SA WA Tas NT ACT
% of population (2003)
Languages other thanEnglish spoken at home
0
5
10
15
20
25
30
NSW Vic Qld SA WA Tas NT ACT
% of households(2001 Census)
Female labour force participation
70
75
80
85
90
95
NSW Vic Qld SA WA Tas NT ACT
Female as a % of maleparticipation rate (2003-04)
* Non-traditional households are groupings of 2 or more related persons (incl. defactos) resident in the same household, excl. couples with or without children and one-parent families. Source: ABS.
‘Non-traditional’ households*
0.0
0.5
1.0
1.5
2.0
2.5
NSW Vic Qld SA WA Tas NT ACT
% of households (2001 Census)
economics@
17
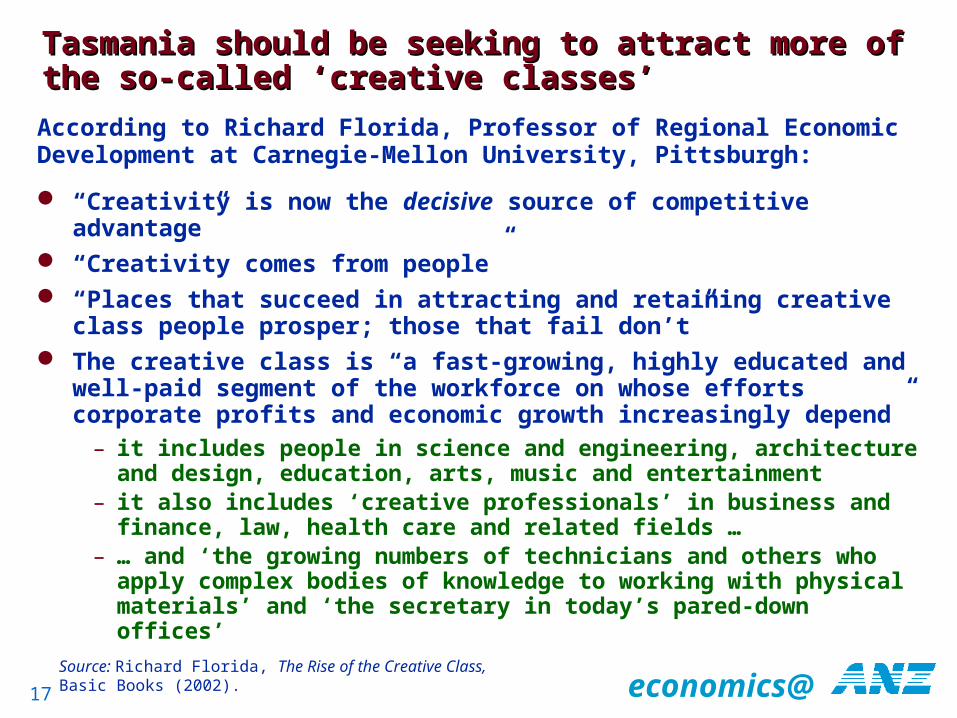
Tasmania should be seeking to attract more of Tasmania should be seeking to attract more of the so-called ‘creative classes’the so-called ‘creative classes’
“Creativity is now the decisive source of competitive advantage”
“Creativity comes from people” “Places that succeed in attracting and retaining creative class
people prosper; those that fail don’t” The creative class is “a fast-growing, highly educated and
well-paid segment of the workforce on whose efforts corporate profits and economic growth increasingly depend”
– it includes people in science and engineering, architecture and design, education, arts, music and entertainment
– it also includes ‘creative professionals’ in business and finance, law, health care and related fields …
– … and ‘the growing numbers of technicians and others who apply complex bodies of knowledge to working with physical materials’ and ‘the secretary in today’s pared-down offices’
According to Richard Florida, Professor of Regional Economic Development at Carnegie-Mellon University, Pittsburgh:
Source: Richard Florida, The Rise of the Creative Class, Basic Books (2002).
economics@
18
What attracts the ‘creative class’?What attracts the ‘creative class’?
“The location choices of the creative class are based to a large degree on their lifestyle interests [which] go well beyond standard ‘quality of life’ amenities”
“They gravitate to stimulating creative environments – to places that offer not only opportunity and amenities, but openness to diversity, where they feel they can express themselves, and validate their identities”
“They favour active, participatory recreation over passive, institutionalized forms … not once did they mention professional sports as playing a role of any sort in in their choice of where to live or work”
“Places are also valued for authenticity and uniqueness - [which come] from … historic buildings, established neighbourhoods, a unique music scene or specific cultural attributes”
“Openness to immigration is particularly important for small cities and regions … it’s important for a place to have low barriers to entry for people - to be a place where newcomers are accepted quickly into all sorts of social and economic arrangements”
Source: Florida.
economics@
Tasmania now Tasmania now
Is still a long way behind the rest of Australia on most measures of material living standards and market-based economic activity
Nonetheless appears to be better positioned for sustained economic growth than at any time during the past two decades
Is less likely to continue falling behind the mainland on a broad range of economic indicators over the next ten years than it has done over the past twenty
And indeed has begun to narrow at least some of the gaps with the mainland on some, though not all, important economic indicators
economics@
20
Tasmania’s future ...Tasmania’s future ...
… cannot possibly lie predominantly in the volume production of essentially unprocessed commodities at lower prices than competitors with better access
– to larger and cheaper resources of labour and capital– and to markets (by virtue of proximity of membership of trade
blocs)
… but instead depends on its capacity to produce and market – highly differentiated goods and services– embodying a relatively high intellectual content– for which customers are willing to pay premium prices
Tasmania does have the potential to be a magnet for the ‘creative class’ - many of the key ingredients are already here
But Tasmania and Tasmanians also need– to be less resistant to social and economic change– to be more conscious and supportive of the value of education– to be more willing to embrace scientific and technological
change– to be more tolerant of diversity and the ‘clash of ideas’
economics@
21
Three things Tasmania must now avoidThree things Tasmania must now avoid
Putting all its economic eggs in one basket (or a small number of them)
– this is effectively what Tasmania did from the 1950s through the late 1980s
– and it left – and would again leave – Tasmania vulnerable to economic, technological and political shifts beyond its control
– in a brand or image-conscious world, perception is as important as reality in this context
Monopoly or excessive concentrations of economic power – always a greater risk in a small economy– potentially exposes Tasmania to greater risk of individual
management failures, shifting corporate strategies and unhealthy influences over public policy
Complacency or hubris– Tasmania’s economy has performed better than expected
over the past two years– some of that reflects temporary influences which are passing– reversing the cumulative effects of 20 years of bad policy and