33
8/3/2009 1 Lecture 4: Preferences: Utility Utility Utility functions and indifference curves Examples of utility functions Marginal utility Marginal utility and MRS
| Date post: | 03-Apr-2018 |
| Category: |
Documents |
| Upload: | noiraddict |
| View: | 217 times |
| Download: | 0 times |

7/28/2019 Economics 102 Lecture 4 Utility Rev
http://slidepdf.com/reader/full/economics-102-lecture-4-utility-rev 1/33
8/3/200
Lecture 4: Preferences: Utility
Utility
Utility functions and indifference
curves
Examples of utility functions
Marginal utility
Marginal utility and MRS

7/28/2019 Economics 102 Lecture 4 Utility Rev
http://slidepdf.com/reader/full/economics-102-lecture-4-utility-rev 2/33
8/3/200
Utility- a way to describe preferences
Originally, preferences were defined in terms of utility: tosay a bundle X was preferred to a bundle Y meant that the X bundle had a higher utility than the Y bundle.
Things are now the other way around, if we say that X ispreferred to Y, then we can represent these preferencesby utility where X was higher than that of Y.
Utility function – is a way of assigning a number to every
possible consumption bundle such that more preferredbundles get assigned larger numbers than less preferredbundles.
A utility function U(x) represents a
preference relation if and only if:
x’ x” U(x’) > U(x”)
x’ x” U(x’) < U(x”)
x’ ~ x” U(x’) = U(x”).
~f p
p

7/28/2019 Economics 102 Lecture 4 Utility Rev
http://slidepdf.com/reader/full/economics-102-lecture-4-utility-rev 3/33
8/3/200
Ordinal utility vs. Cardinal utility
Ordinal utility: The magnitude of the utility function isonly important insofar as it ranks the different consumption bundles; the size of the utility differencebetween any two consumption bundles doesn’t matter.
The only property that is important is how it ordersthe bundles.
Cardinal utility theory states that the size of the utilitydifference between two bundles of goods matters.
If all you need to make choices are rankings, thenordinal rankings are all that are necessary
There can be no unique way to assign utilitiesto bundles of goods. As long as it preserves thepreferences of the consumer, then any functioncan be a utility function.
A Monotonic transformation of a utilityfunction is a utility function that representsthe same preferences as the original utilityfunction.

7/28/2019 Economics 102 Lecture 4 Utility Rev
http://slidepdf.com/reader/full/economics-102-lecture-4-utility-rev 4/33
8/3/200
Monotonic transformation – a way of
transforming one set of numbers into
another set of numbers in a way that
preserves the order of the numbers
)()(implies
if ation,transformmonotonic)(
2121 u f u f uu
u f
Examples: multiplying by a number
adding any number
raising to an odd power
A monotonic function has a positive rate of change or a positive slope. Rate of change as u changes:
In a monotonic transformation, the numeratoralways has the same sign as the denominator.
12
12 )()(
uu
u f u f
u
f

7/28/2019 Economics 102 Lecture 4 Utility Rev
http://slidepdf.com/reader/full/economics-102-lecture-4-utility-rev 5/33
8/3/200
If f(u) is a monotonic transformation of a utilityfunction that represents some preferences, thenf(u(x1,x2)) is also a utility function that represents the same preferences.
Argument: To say that u(x1,x2) represents some particular preferences
means that u(x1,x2) >u(y1,y2) iff (x1,x2) is strictly preferredto (y1,y2)
If f(u) is a monotonic transformation then u(x1,x2) >u(y1,y2) iif f(u(x1,x2))> f(u(y1,y2)).
Therefore, f(u(x1,x2))> f(u(y1,y2)) iff (x1,x2) is strictlypreferred to (y1,y2), so the function f(u) represents thepreferences in the same way as the original utility functionu(x1,x2).
U(x1,x2) = x1x2 (2,3) (4,1) ~ (2,2).
Define V = U2.
Then V(x1,x2) = x12x2
2 and
V(2,3) = 36 > V(4,1) = V(2,2) = 16so again
(2,3) (4,1) ~ (2,2).
V preserves the same order as U and so
represents the same preferences.
p
p

7/28/2019 Economics 102 Lecture 4 Utility Rev
http://slidepdf.com/reader/full/economics-102-lecture-4-utility-rev 6/33
8/3/200
U(x1,x2) = x1x2 (2,3) (4,1) ~ (2,2).
Define W = 2U + 10.
Then W(x1,x2) = 2x1x2+10 so
W(2,3) = 22 > W(4,1) = W(2,2) = 18. Again,
(2,3) (4,1) ~ (2,2).
W preserves the same order as U and V andso represents the same preferences.
p
p
Utility function – can be seen as a way tolabel indifference curves
a utility function is a way of assigningnumbers to different indifference curves in away that higher indifference curves get assigned larger numbers.
a monotonic transformation is just arelabeling of indifference curves

7/28/2019 Economics 102 Lecture 4 Utility Rev
http://slidepdf.com/reader/full/economics-102-lecture-4-utility-rev 7/33
8/3/200
An indifference curve contains equally
preferred bundles.
Equal preference same utility level.
Therefore, all bundles in an indifference
curve have the same utility level.
Level set – the set of all (x1,x2) such that
u(x1,x2) is a constant. Indifference
curves are level sets of utility functions.
Indifference curves from utility:
To derive an indifference curve from a
utility function, just equate the utility
function to a constant, and then solve the
equation for one of the terms.

7/28/2019 Economics 102 Lecture 4 Utility Rev
http://slidepdf.com/reader/full/economics-102-lecture-4-utility-rev 8/33
8/3/200
For instance:
1
2
12
21
2121
,of functionaasfor solving
),(
x
k x
x x
x xk
x x x xu
For a monotonic transformation of the utility curve above,
the indifference curves would have exactly the same shape,
except that the labels would be different.
The function v describes the same preferences as u since
it orders all of the bundles the same way.
2
21
2
21
2
2
2
121
2
2
2
121
),(),(),(
),(
x xu x x x x x xv
x x x xv

7/28/2019 Economics 102 Lecture 4 Utility Rev
http://slidepdf.com/reader/full/economics-102-lecture-4-utility-rev 9/33
8/3/200
U 6U 4
(2,3) (2,2) ~ (4,1)
x1
x2 p
U(2,3) = 6
U(2,2) = 4U(4,1) = 4
3D plot of consumption & utility levels for 3 bundles
x1
x2
Utility

7/28/2019 Economics 102 Lecture 4 Utility Rev
http://slidepdf.com/reader/full/economics-102-lecture-4-utility-rev 10/33
8/3/200
1
U
U
Higher indifferencecurves contain
more preferred
bundles.
Utility
x2
x1
U 6
U 4
U 2x1
x2

7/28/2019 Economics 102 Lecture 4 Utility Rev
http://slidepdf.com/reader/full/economics-102-lecture-4-utility-rev 11/33
8/3/200
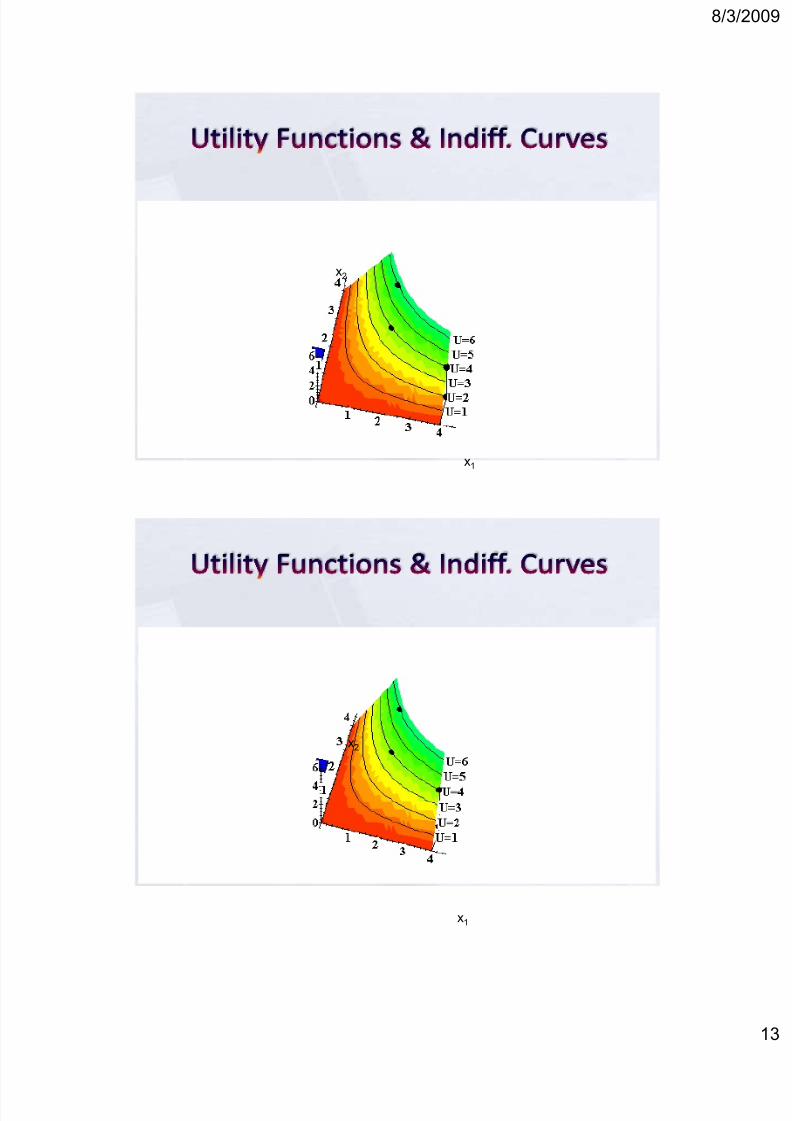
U 6
U 5
U 4
U 3U 2
U 1
x1
x2
Utility
x1
x2

7/28/2019 Economics 102 Lecture 4 Utility Rev
http://slidepdf.com/reader/full/economics-102-lecture-4-utility-rev 12/33
8/3/200
1
x1
x2
x1
x2
7/28/2019 Economics 102 Lecture 4 Utility Rev
http://slidepdf.com/reader/full/economics-102-lecture-4-utility-rev 13/33
8/3/200
1
x1
x2
x1
x2

7/28/2019 Economics 102 Lecture 4 Utility Rev
http://slidepdf.com/reader/full/economics-102-lecture-4-utility-rev 14/33
8/3/200
1
x1
x2
x1

7/28/2019 Economics 102 Lecture 4 Utility Rev
http://slidepdf.com/reader/full/economics-102-lecture-4-utility-rev 15/33
8/3/200
1
x1
x1

7/28/2019 Economics 102 Lecture 4 Utility Rev
http://slidepdf.com/reader/full/economics-102-lecture-4-utility-rev 16/33
8/3/200
1
x1
x1

7/28/2019 Economics 102 Lecture 4 Utility Rev
http://slidepdf.com/reader/full/economics-102-lecture-4-utility-rev 17/33
8/3/200
1
x1
x1

7/28/2019 Economics 102 Lecture 4 Utility Rev
http://slidepdf.com/reader/full/economics-102-lecture-4-utility-rev 18/33
8/3/200
1
x1
x1

7/28/2019 Economics 102 Lecture 4 Utility Rev
http://slidepdf.com/reader/full/economics-102-lecture-4-utility-rev 19/33
8/3/200
1
x1
Existence of utility functions- Given a preferenceordering, can we always find a utility functionthat will order bundles of goods in the same wayas those preferences?
Ans: If we rule out perverse cases such asintransitive preferences, we will typically be ableto find a utility function to represent preferences.Nearly any kind of “reasonable” preferences canbe represented by a utility function

7/28/2019 Economics 102 Lecture 4 Utility Rev
http://slidepdf.com/reader/full/economics-102-lecture-4-utility-rev 20/33
8/3/200
2
How to construct indifference curves from utility
functions : two ways can be thought of:
Mathematical: Given indifference curves, we want to
find a function that is constant along each
indifference curve and that assigns higher values to
higher indifference curves.
Intuitive: given preferences, we try to think about
what the consumer is trying to maximize.
Perfect Substitutes:
Preferences for perfect substitutes can be represented by autility function of the form:
a and b are some positive numbers that measure the “value” of goods 1 and 2 to the consumer.
This is a utility function because (a) it is constant along anindifference curve and (b) it assigns a higher label to morepreferred bundles.
Any monotonic transformation of this function would also work.
b
a
ba
bxax x xu
-: bygivenisslope
0,
),( 2121

7/28/2019 Economics 102 Lecture 4 Utility Rev
http://slidepdf.com/reader/full/economics-102-lecture-4-utility-rev 21/33
8/3/200
2
Consider
V(x1,x2) = x1 + x2.
What do the indifference curves for this
“perfect substitution” utility function look like?
5
5
9
9
13
13
x1
x2
x1 + x2 = 5
x1 + x2 = 9
x1 + x2 = 13
All are linear and parallel.
V(x1,x2) = x1 + x2.

7/28/2019 Economics 102 Lecture 4 Utility Rev
http://slidepdf.com/reader/full/economics-102-lecture-4-utility-rev 22/33
8/3/200
2
Perfect Complements
In general a perfect complements utility functionis given by:
The minimum number of the good dictates orserves as a constraint to the consumption of theother.
For goods that are complementary on a one toone basis, a and b are equal to 1.
For goods that are consumed in a proportion that is different from one, then a and b are unequal.
consumedisgoodhein which ts proportiontheindicateand ,0,
},min{),( 2121
ba
bxax x xu
Consider
W(x1,x2) = min{x1,x2}.
What do the indifference curves for this“perfect complementarity” utility function
look like?

7/28/2019 Economics 102 Lecture 4 Utility Rev
http://slidepdf.com/reader/full/economics-102-lecture-4-utility-rev 23/33
8/3/200
2
x2
x1
45o
min{x1,x2} = 8
3 5 8
3
5
8
min{x1,x2} = 5
min{x1,x2} = 3
All are right-angled with vertices on a ray
from the origin.
W(x1,x2) = min{x1,x2}
Quasilinear utility- or partly linear utility. The utility functionis linear in good 2 but possibly non-linear in good 1
U(x1,x2) = f(x1) + x2
E.g. U(x1,x2) = 2x11/2 + x2.
Equation for such indifference curves takes the form:
k is a different constant for each curve
To label the indifference curve, k could be used. Solving for k andsetting it equal to utility, we have:
Indifference curves are vertical translates of one another
)( 12 xvk x
2121 )(),( x xvk x xu

7/28/2019 Economics 102 Lecture 4 Utility Rev
http://slidepdf.com/reader/full/economics-102-lecture-4-utility-rev 24/33
8/3/200
2
x2
x1
Each curve is a vertically shifted copy of the others.
Cobb-Douglas preferences
Cobb-Douglas utility function takes the form:
E.g. U(x1,x2) = x11/2 x21/2 (a = b = 1/2)V(x1,x2) = x1 x2
3 (a = 1, b = 3)
C-D indifference curves look just like the nice convexindifference curves that were referred to as “well-behaved indifference curves”
C-D indifference curves are the standard examplesused of well behaved indifference curves.
0,
),( 2121
d c
x x x xud c

7/28/2019 Economics 102 Lecture 4 Utility Rev
http://slidepdf.com/reader/full/economics-102-lecture-4-utility-rev 25/33
8/3/200
2
x2
x1
All curves are hyperbolic,
asymptoting to, but never
touching any axis.
Some monotonic transformations of the
Cobb-Douglas utility function:
natural log transformation:
transform that makes the sum of the
exponents =1
212121 lnln)ln(),( xd xc x x x xvd c
aa
d c
d
d c
c
d c
x x x xv
x x
x x x xv
12121
21
2121
),(
,dc
c anumber newadefine
.
: power d)1/(ctheutility toraising
),(

7/28/2019 Economics 102 Lecture 4 Utility Rev
http://slidepdf.com/reader/full/economics-102-lecture-4-utility-rev 26/33
8/3/200
2
Marginal utility= rate of change in utility as onegood is increased. It measures the rate of change inutility associated with a small change in the amount of good 1, holding the amount of good 2 constant.
The marginal utility with respect to good 2 isdefined in a similar way
The change in utility given a change in good 1 istherefore, and is of the same form for good 2:
1
21211
1
1
),(),(
x
x xu x x xu
x
U MU
11 x MU U
Marginal means “incremental”.
The marginal utility of commodity i is the rate-of-
change of total utility as the quantity of
commodity i consumed changes; i.e.
MUU
xi
i
7/28/2019 Economics 102 Lecture 4 Utility Rev
http://slidepdf.com/reader/full/economics-102-lecture-4-utility-rev 27/33
8/3/200
2
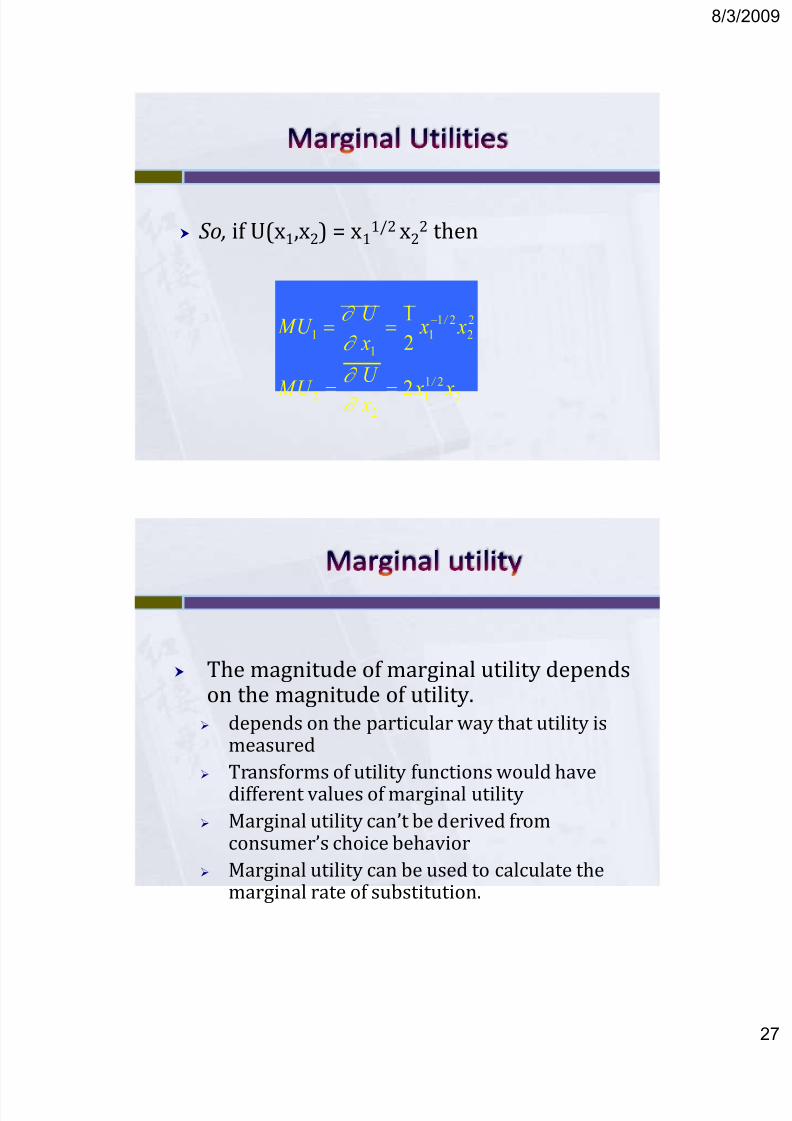
So, if U(x1,x2) = x11/2 x2
2 then
2
21
1
2
2
2
2
21
1
1
1
2
2
1
x x x
U
MU
x x x
U MU
/
/
The magnitude of marginal utility dependson the magnitude of utility.
depends on the particular way that utility ismeasured
Transforms of utility functions would havedifferent values of marginal utility
Marginal utility can’t be derived fromconsumer’s choice behavior
Marginal utility can be used to calculate themarginal rate of substitution.

7/28/2019 Economics 102 Lecture 4 Utility Rev
http://slidepdf.com/reader/full/economics-102-lecture-4-utility-rev 28/33
8/3/200
2
A utility function can be used to measure the marginal
rate of substitution, MRS (the slope of the indifference
curve at a given bundle of goods, the rate at which a
consumer is just willing to substitute a small amount of
good 2 for good 1.)
To derive, consider a small change in goods 1 and 2 that
keeps utility constant (i.e., we stay at the same
indifference curve): Then we must have:
2
1
1
2
2211
MRS
:curveceindifferentheof slopefor thesolving0
MU
MU
x
x
x MU x MU U
The sign of the MRS is negative, meaning we have to give upone good for more of the other in order to keep the samelevel of utility.
While the magnitude of marginal utility depends on theparticular transform of the utility function that you choose,
the ratio of marginal utilities is independent of theparticular transformation of the utility function.
transforms just relabel indifference curves and we areconcerned with moving along an indifference curve when wederive the MRS.

7/28/2019 Economics 102 Lecture 4 Utility Rev
http://slidepdf.com/reader/full/economics-102-lecture-4-utility-rev 29/33
8/3/200
2
MRSx
x 2
1
MRS(1,8) = - 8/1 = -8
MRS(6,6) = - 6/6 = -1.
x1
x2
8
6
1 6
U = 8
U = 36
U(x1,x2) = x1x2;
A quasi-linear utility function is of the form U(x1,x2) = f(x1)+ x2.
MRS = - f (x1) does not depend upon x2 so the slope of indifference curves for a quasi-linear utility function is constant along any line for which x1 is constant. What does that make theindifference map for a quasi-linear utility function look like?
so
U
xf x
11( )
U
x2
1
MRSdx
dx
U x
U xf x 2
1
1
21
/
/( ).

7/28/2019 Economics 102 Lecture 4 Utility Rev
http://slidepdf.com/reader/full/economics-102-lecture-4-utility-rev 30/33
8/3/200
3
x2
x1
Each curve is a vertically shifted copy of the
others.
MRS is a constant
along any line for which x1
is
constant.
MRS =
- f(x1’)
MRS = -f(x1”)
x1’ x1”
Applying a monotonic transformation to a utility
function representing a preference relation simply
creates another utility function representing the
same preference relation.
What happens to marginal rates-of-substitution
when a monotonic transformation is applied?

7/28/2019 Economics 102 Lecture 4 Utility Rev
http://slidepdf.com/reader/full/economics-102-lecture-4-utility-rev 31/33
8/3/200
3
For U(x1,x2) = x1x2 the MRS = - x2/x1.
Create V = U2; i.e. V(x1,x2) = x12x2
2. What is the
MRS for V?
which is the same as the MRS for U.
MRSV x
V x
x x
x x
x
x
/
/
1
2
1 22
12
2
2
1
2
2
More generally, if V = f(U) where f is a strictly
increasing function, then
MRSV x
V x
f U U x
f U U x
/
/
( ) /
' ( ) /1
2
1
2
U x
U x
/
/.1
2
So MRS is unchanged by a positive monotonic
transformation.

7/28/2019 Economics 102 Lecture 4 Utility Rev
http://slidepdf.com/reader/full/economics-102-lecture-4-utility-rev 32/33
8/3/200
3
This gives a useful way to recognize
preferences that are represented by
different utility functions:
Given two utility functions, just compute MRS
If the same, then the two utility function has the
same indifference curves
If the direction of increasing preference is thesame for each utility function, then the
underlying preferences must be the same.
Mathematical derivation of the MRS
Marginal, a small change, means derivative. We use partialderivatives because marginal utility of a good is computedholding the other good constant.
Differentials
Consider a change (dx1, dx2) that keeps utility constant
First term measures the increase in utility from a small change dx1
the second term measures the increase in utility from a smallchange dx2. Solving for dx2/dx1:
0),(),(
2
2
211
1
21
dx x
x xudx x
x xudu
2
21
1
21
1
2
),(
),(
x
x xu
x
x xu
dx
dx

7/28/2019 Economics 102 Lecture 4 Utility Rev
http://slidepdf.com/reader/full/economics-102-lecture-4-utility-rev 33/33
8/3/200
Implicit function: Indifference curve as a function x2(x1), indicates the value of x2 that
for each value of x1 keeps us on a specific indifference curve. Thisfunction has to satisfy the identity:
Differentiating both sides of the identity with respect to x1 to get:
Solving for , to find:
k x x xu ))(,( 121
0)(),(),(
1
12
2
21
1
21
x
x x
x
x xu
x
x xu
1
12 )(
x
x x
2
21
1
21
1
12
),(
),(
)(
x
x xu
x
x xu
x
x x


