24
Economics 105: Statistics • Any questions? • Go over GH2 • Student Information Sheet
| Date post: | 16-Dec-2015 |
| Category: |
Documents |
| Upload: | ashley-ford |
| View: | 223 times |
| Download: | 0 times |

Economics 105: Statistics• Any questions?• Go over GH2• Student Information Sheet

Intro to Probability:Basic Definitions
• Random trials– multiple outcomes & uncertainty
• Basic outcome• Sample space• Event• Examples: coin toss, die roll, dice roll, deck of cards, etc.• Deck of cards will be defined as 52 cards, 13 of each suit (♠♣♥♦), 2, 3, ..., 10, J, K, Q, A

Set Theory• Venn diagrams• Union
A B
• Intersection A B

Set Theory• A′ is the complement of A
• A and B are mutually exclusive• A B =

Set Theory• set of events A1, A2, A3 … AN partitions the sample space

Rules for Set Operations• A B = B A Commutative• A B = B A • A A = A Idempotency• A A = A• A A′ = S, A A′ = Complementation• (A B)′ = A′ B′
• (A B)′ = A′ B′

Rules for Set Operations• Associative •A (B C) = (A B) C• A (B C) = (A B) C• Distributive• A (B C) = (A B) (A C)• A (B C) = (A B) (A C)
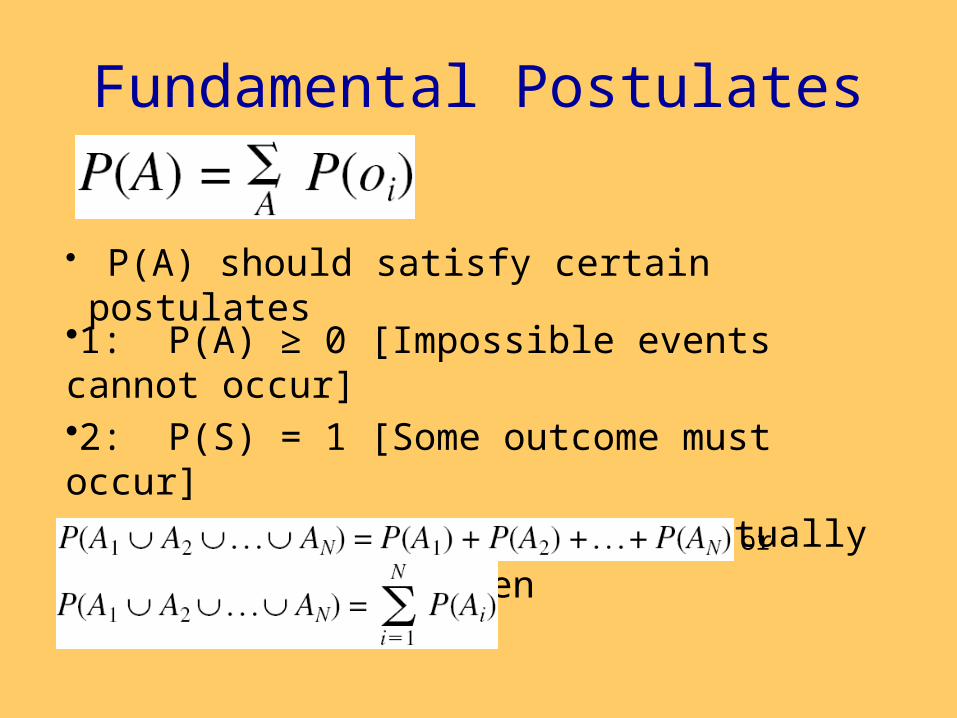
Fundamental Postulates
•1: P(A) ≥ 0 [Impossible events cannot occur]•2: P(S) = 1 [Some outcome must occur]•3: If A1, A2, A3 … AN are N mutually exclusive events then
or
• P(A) should satisfy certain postulates

Useful Results• P(A′) = 1 – P(A)• P() = 0• If A B, then P(A) ≤ P(B)• 0 ≤ P(A) ≤ 1• P(A B) = P(A) + P(B) – P(A B)
– avoid double counting
• P(A B) = 1 - P(A B)′ = 1 - P(A′ B′)

Useful Results (cont’d)• If A1, A2, A3 … AN partition S, then

Example Problem• Example (Problem 4.8, p. 134, BLK 10e)
– 824 Homeowners, of 1000 asked, drive to work– 681 Renters, of 1000 asked, drive to work
1. Make a contingency (cross-classification) table
2. If a respondent is selected at random, what is the probability that they drive to work?
3. … that they drive and are a homeowner?
4. … that they drive or are a homeowner?

Statistical Independence• Events A and B are statistically independent when P(A|B) = P(A)
• (Multiplication Rule): Events A and B are statistically independent when
P(A B) = P(A)*P(B)
•If A1, A2, A3 … AN are independent events then P(A1 A2 A3 … AN) = P(A1)P(A2)P(A3)… P(AN)

Example• Suppose you apply to 3 schools: A, B, and C• P(accepted @ A) = .20• P(accepted @ B) = .40• P(accepted @ C) = .60• What is the probability of being rejected at all 3?• What is the probability of being accepted somewhere?

Conditional Probability• The conditional probability that A occurs given that B is known to have occurred is

Conditional Probability• Probability a beginning golfer makes a good shot if she selects the correct club is 1/3. The probability of a good shot with the wrong club is 1/5. There are 4 clubs in her golf bag, one of which
is the correct club for the next shot. Club selection is random.
•What is the probability of a good shot?•Given that she hit a good shot, what is the probability that she chose the wrong club?
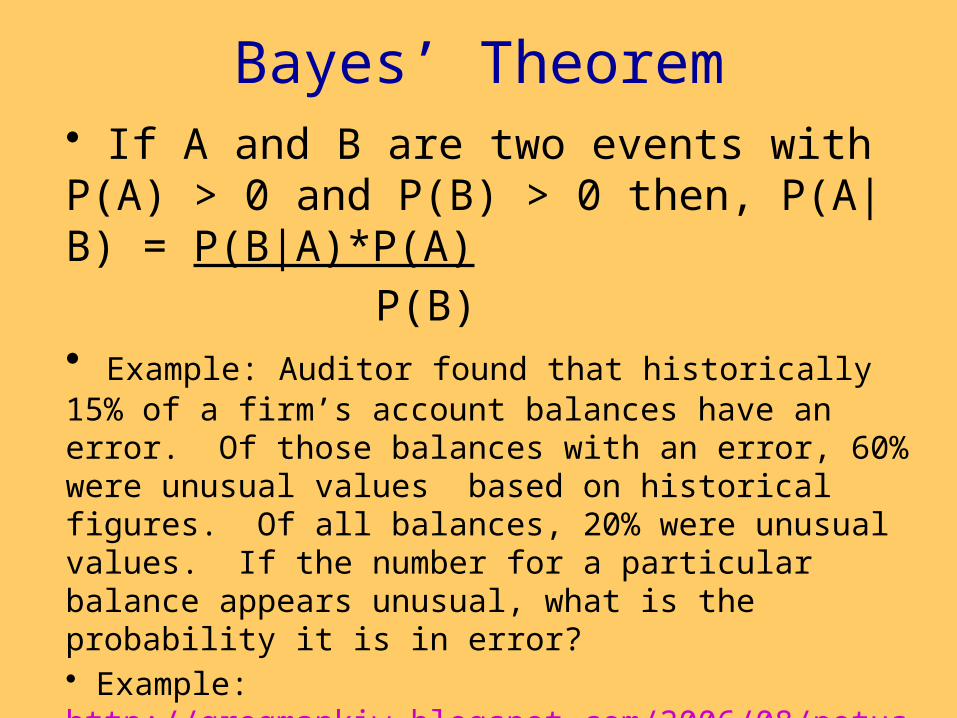
Bayes’ Theorem• If A and B are two events with P(A) > 0 and P(B) > 0 then, P(A|B) = P(B|A)*P(A)
P(B)• Example: Auditor found that historically 15% of a firm’s account balances have an error. Of those balances with an error, 60% were unusual values based on historical figures. Of all balances, 20% were unusual values. If the number for a particular balance appears unusual, what is the probability it is in error? • Example: http://gregmankiw.blogspot.com/2006/08/potus-2008.html

Medical Diagnosis Problem• The following question was asked of 60 students and staff at Harvard Medical School
• Assume that a test to detect a disease, which has prevalence in the population of 1/1000, has a false positive rate of 5%, and a true positive rate of 100%. what is the probability that a person found to have a positive test actually has the disease, assuming you know nothing about the person’s symptoms?

Medical Diagnosis Problem
http://www.decisionsciencenews.com/2010/12/03/some-ideas-on-communicating-risks-to-the-general-public/

Discrete Random Variables• Take on a limited number of distinct values• Each outcome has an associated probability• We can represent the probability distribution function in 3 ways
– function ƒ(xi) = P(X = xi)
– graph– table
• Bernoulli distribution– graph & table ?
• Cumulative distribution function

Discrete Random Variable Summary Measures
• Expected Value (or mean) of a discrete distribution (Weighted Average)
–Example: Toss 2 coins, X = # of heads, compute expected value of X:
E(X) = (0 x 0.25) + (1 x 0.50) + (2 x 0.25) = 1.0
X P(X)
0 0.25
1 0.50
2 0.25

• Variance of a discrete random variable
• Standard Deviation of a discrete random variable
where:E(X) = Expected value of the discrete random variable X
Xi = the ith outcome of XP(Xi) = Probability of the ith occurrence of X
Discrete Random Variable Summary Measures
(continued)

–Example: Toss 2 coins, X = # heads, compute standard deviation (recall E(X) = 1)
Discrete Random Variable Summary Measures
(continued)
Possible number of heads = 0, 1, or 2

Properties of Expected Values• E(a + bX) = a + bE(X), where a and b are constants
• If Y = a + bX, then var(Y) = var(a + bX) = b2var(X)

Example• Let C = total cost of building a pool • Let X = days to finish the project• C = 25,000 + 900X• X P(X = xi)
10 .1 Find the mean, std dev, and
11 .3 variance of the total cost.
12 .3
13 .2
14 .1


