29


ECONOMICS OF GLOBAL GAS-TO-LIQUIDS (GTL)
FUELS TRADING
BASED ON HYBRID PV-WIND POWER PLANTS
Mahdi Fasihi, Dmitrii Bogdanov and Christian BreyerNeo-Carbon Energy 5th Researchers’ SeminarFebruary 15-16, 2016

Economics of global gas-to-liquids (GtL) fuels trading based on hybrid PV-Wind power plantsMahdi Fasihi [email protected]
Agenda
MotivationMethodology and DataResultsSummary

Economics of global gas-to-liquids (GtL) fuels trading based on hybrid PV-Wind power plantsMahdi Fasihi [email protected]
MotivationFossil fuels
• increasing demand• diminishing resources• emissions
RE available, but energy system transformation is challenging• fluctuating RE and energy storage• 100% electrification impossible for mobility sector
Power-to-Gas & Gas-to-Liquids are technologies introduced to marketsRE-diesel
• a non-diminishing resource• costs stable or declining• no costs for harmful emissions (CO2, etc.)• available infrastructure • energy storage• a step towards fuel security
Cost competitive in 2030?
UBA 2013
Usage almost impossible• aviation• shipping
Usage necessary• electric lighting

Economics of global gas-to-liquids (GtL) fuels trading based on hybrid PV-Wind power plantsMahdi Fasihi [email protected]
Agenda
MotivationMethodology and DataResultsSummary

Economics of global gas-to-liquids (GtL) fuels trading based on hybrid PV-Wind power plantsMahdi Fasihi [email protected]
MethodologyRE-PtG-GtL Value Chain
Key insights:• substitution of the fossil hydrocarbon
value chain by a RE basis• utilization of downstream fossil
infrastructure• integrated heating system• water recycling
Hybrid PV-Wind & Battery Power-to-Gas Gas-to-Liquids Shipping

Economics of global gas-to-liquids (GtL) fuels trading based on hybrid PV-Wind power plantsMahdi Fasihi [email protected]
MethodologyTwo Approaches
Annual Basis Model• Hybrid PV-Wind Plants with a fixed capacity (5 GW each)• Annual output SNG as a function of inputs power (installed capacities and FLh)• Only PV single-axis tracking and Wind are installed
Hourly basis Model• Optimized configuration of PV single-axis tracking, Wind and Battery based on an hourly
potential in a limited area for a fixed annual SNG production for the least cost constraint• Inputs (installed PV, Wind and battery capacity) as a function of FLh and annual output with
least cost
Gas-to-Liquids plant always runs on a base load

Economics of global gas-to-liquids (GtL) fuels trading based on hybrid PV-Wind power plantsMahdi Fasihi [email protected]
DataPlants’ Location (case study)
1) Patagonia, Argentina:• Hybrid PV-Wind Power Plant• PtG Plant• GtL Plant
2) Rotterdam, the Netherlands:
Marine distance• Patagonia – Rotterdam: 13,500 km
Economics of global gas-to-liquids (GtL) fuels trading based on hybrid PV-Wind power plantsMahdi Fasihi [email protected]
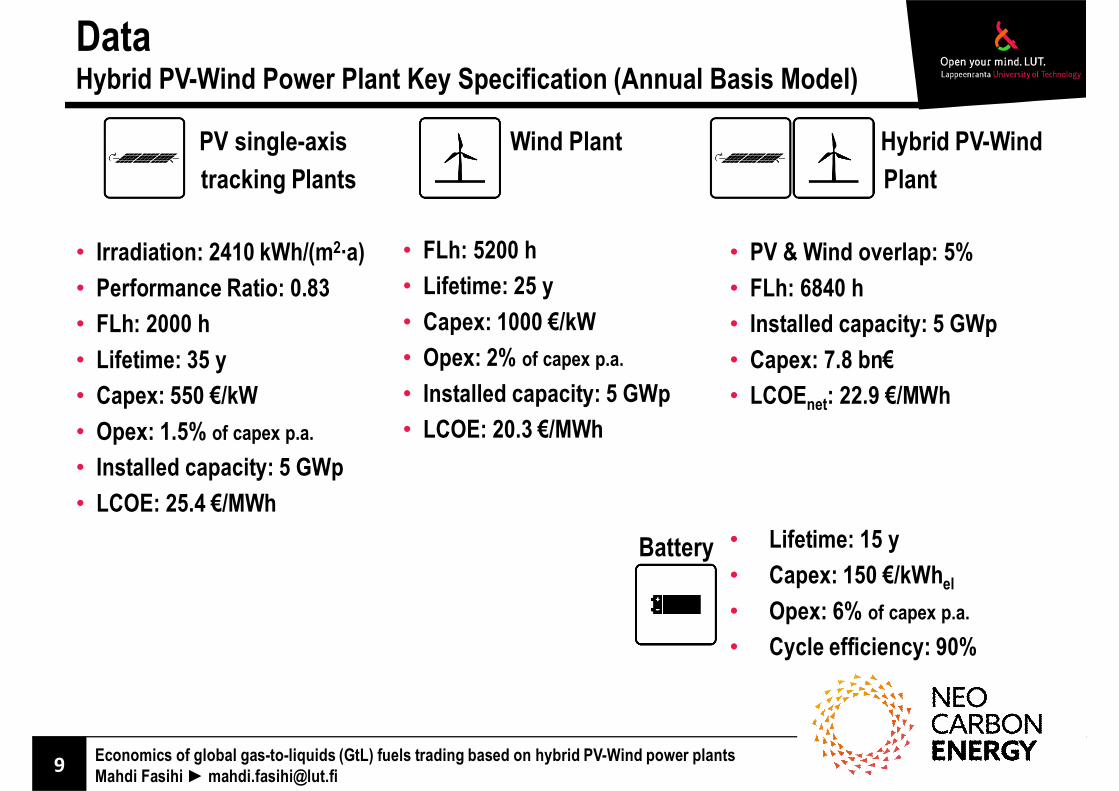
DataHybrid PV-Wind Power Plant Key Specification (Annual Basis Model)
PV single-axistracking Plants
• Irradiation: 2410 kWh/(m2 a)• Performance Ratio: 0.83• FLh: 2000 h• Lifetime: 35 y• Capex: 550 €/kW• Opex: 1.5% of capex p.a.• Installed capacity: 5 GWp• LCOE: 25.4 €/MWh
Wind Plant
• FLh: 5200 h• Lifetime: 25 y• Capex: 1000 €/kW• Opex: 2% of capex p.a.• Installed capacity: 5 GWp• LCOE: 20.3 €/MWh
Hybrid PV-WindPlant
• PV & Wind overlap: 5%• FLh: 6840 h• Installed capacity: 5 GWp• Capex: 7.8 bn€• LCOEnet: 22.9 €/MWh
• Lifetime: 15 y• Capex: 150 €/kWhel
• Opex: 6% of capex p.a.• Cycle efficiency: 90%
Battery

Economics of global gas-to-liquids (GtL) fuels trading based on hybrid PV-Wind power plantsMahdi Fasihi [email protected]
DataPower-to-Gas Key Specification
Electrolysis & Methanation
• AE* PtH2 eff. : 86.3% (HHV)• AE PtQ** eff.: 8%• Methan. H2tSNG eff.: 77.9%• Methan. H2tQ eff.: 14%• Lifetime: 30 y• Capex: 500 €/kWel• Opex: 3% of capex p.a.• Overall eff.: 67.2% (HHV)
CO2 Capture Plant
• Lifetime: 30 y• Electricity dem.: 225 kWhel/tCO2• Heat demand: 1500 kWhth/tCO2• Capex: 228 €/(tCO2 a)• Opex: 4% of capex p.a.
RO Seawater Desalination
• Lifetime: 30 y• Electricity demand: 3 kWh/m3
• Water eff.: 45%• Capex: 2.23 €/(m3 a)• Opex: 1.5% of capex p.a.
Water Storage• Lifetime: 30 y• Capex: 0.0074 €/(m3 a)• Opex: 1.5% of capex p.a.
* Alkaline Electrolyzer** Heat photo: www.climeworks.com

Economics of global gas-to-liquids (GtL) fuels trading based on hybrid PV-Wind power plantsMahdi Fasihi [email protected]
DataGas-to-Liquids: Key Specification
Syngas production• CPO: 2n CH4 + n O2 2n CO + 4n H2
• Side reaction: CH4 + 2 O2 CO2 + 2 H2O
• Carbon efficiency: 94% (Shell technology)• No gas treating (halved opex)• No ASU (up to 8% lower in capital cost)
Fischer-Tropsch Synthesis• FTS: n CO + 2n H2 (-CH2-)n + n H2O• Side reaction: CO + H2O CO2 + H2
• Heat loss: 22% of inlet SNG
Products upgrading• (-CH2-)n + H2 CnH2n+2
GtL overall• Capex: 68 k€/bbl• Opex: 3.5% of capex p.a.• Efficiency: 65%• Lifetime: 30 y
Shipping• Marine distance: 13,500 km• Ship DW: 100,000 ton• Speed: 14 knots
Diesel; 60%
Jet fuel/kerosene; 25%
Naphtha; 15%
1 barrel of GtL products (vol%)

Economics of global gas-to-liquids (GtL) fuels trading based on hybrid PV-Wind power plantsMahdi Fasihi [email protected]
Agenda
MotivationMethodology and DataResultsSummary
Economics of global gas-to-liquids (GtL) fuels trading based on hybrid PV-Wind power plantsMahdi Fasihi [email protected]
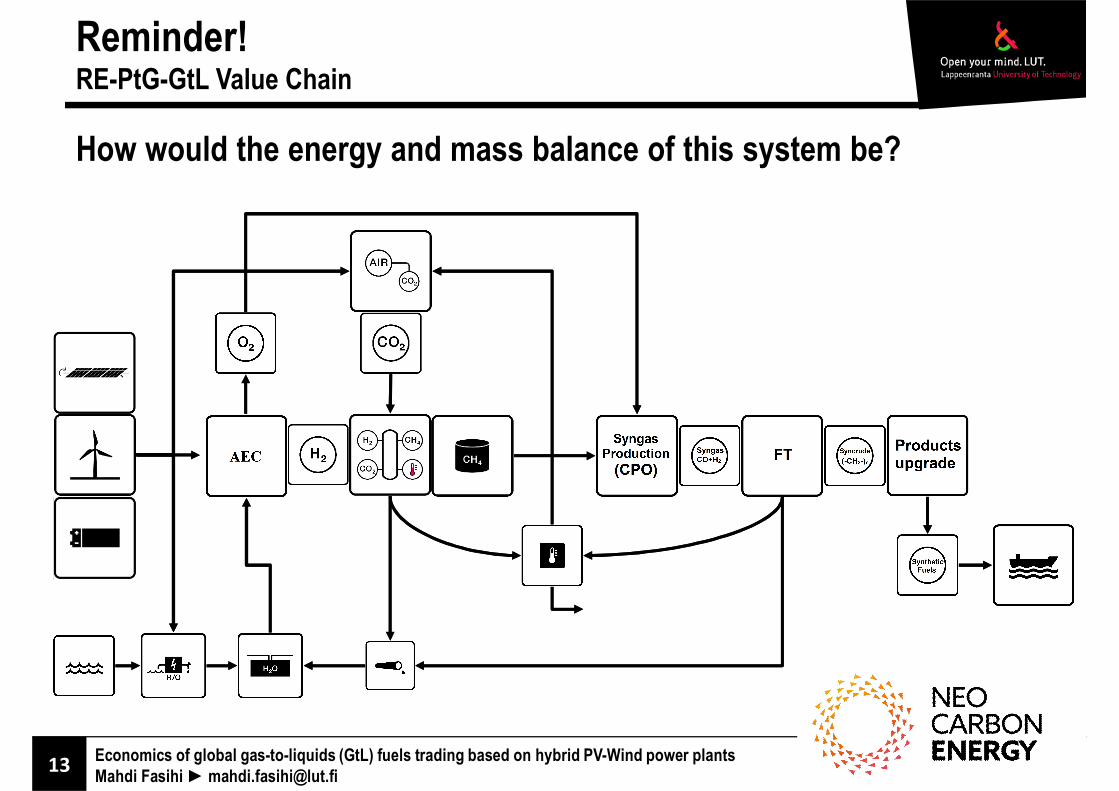
Reminder!RE-PtG-GtL Value Chain
How would the energy and mass balance of this system be?

Economics of global gas-to-liquids (GtL) fuels trading based on hybrid PV-Wind power plantsMahdi Fasihi [email protected]
ResultsRE-PtG-LNG Value Chain Energy & Mass Balance (Sankey Diagram)
System integration benefits:• 100% of oxygen demand supplied by electrolyzer (elimination of Air Separation Unit)• 87% of energy demand for CO2 capture plant supplied by excess heat• 70% of electrolyzer’s water demand supplied by methanation and FT process output
*LT: low temperature**HT: high temperature
Heat exchanger eff.: 90%PtG eff.: 65.4%GtL eff.: 65%Heat loss: 14%
Electrolyzer, the main electricity consumerOxygen available for GtLplant and potential market
Overall efficiency: 42.5%

Economics of global gas-to-liquids (GtL) fuels trading based on hybrid PV-Wind power plantsMahdi Fasihi [email protected]
ResultsCost Distribution in RE-PtG-GtL Value Chain
LCOG (7% WACC):• 53.3 €/MWhth
• 20.9 USD/MMBtu• 121 USD/bbl
LCOG (5% WACC):• 45.5 €/MWhth
• 17.8 USD/MMBtu• 103 USD/bbl
LCOF (7% WACC):• 100 €/MWhth
• 39.1 USD/MMBtu• 227 USD/bbl• 0.97 €/l FT-diesel
LCOF (5% WACC):• 85.9 €/MWhth
• 33.6 USD/MMBtu• 195 USD/bbl• 0.83 €/l FT-diesel
• USD/€ = 1.35

Economics of global gas-to-liquids (GtL) fuels trading based on hybrid PV-Wind power plantsMahdi Fasihi [email protected]
ResultsCapital expenditures for the RE-SNG-LNG value chain
• main capex parts are the hybrid PV-Wind, PtG and the GtL plant• capex of 13.3 bn€, generate annually 9.6 million barrel GtL products available in EU• PtG and GtL stand for only 18 and 14% of capital expenditures, but 30.4 and 45.6% of final
production cost, respectively.
Economics of global gas-to-liquids (GtL) fuels trading based on hybrid PV-Wind power plantsMahdi Fasihi [email protected]
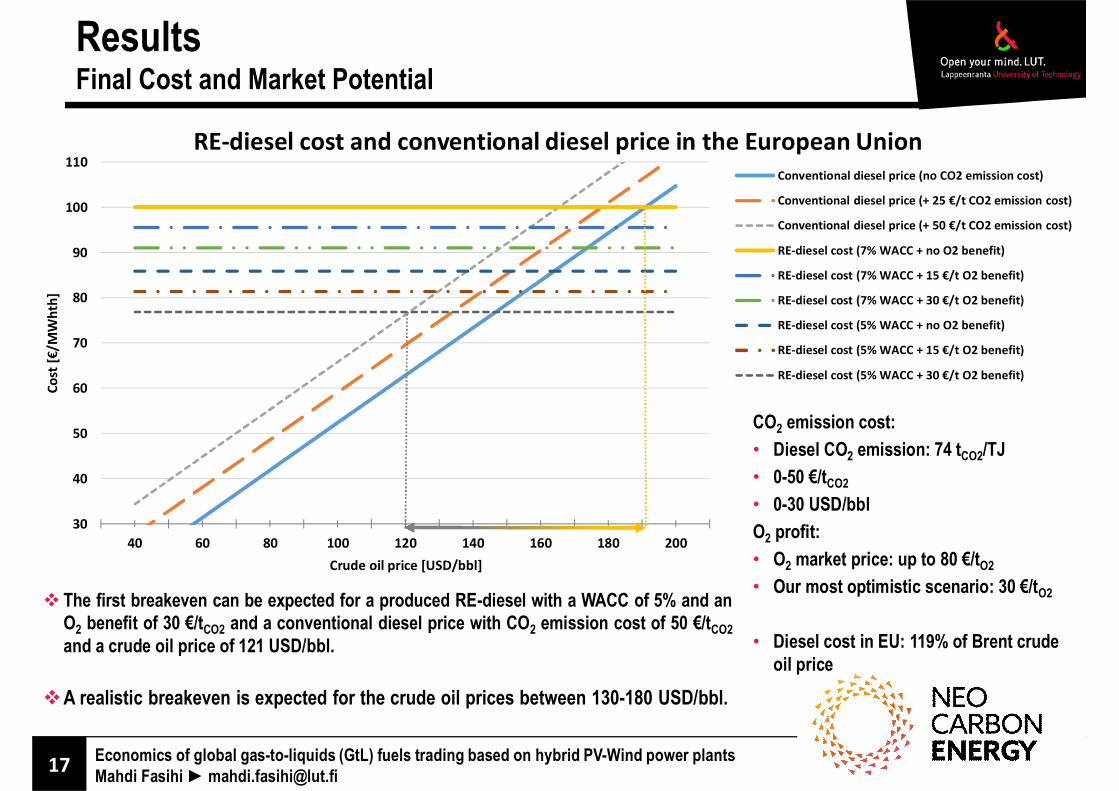
ResultsFinal Cost and Market Potential
30
40
50
60
70
80
90
100
110
40 60 80 100 120 140 160 180 200
Cost
[€/M
Wht
h]
Crude oil price [USD/bbl]
RE-diesel cost and conventional diesel price in the European UnionConventional diesel price (no CO2 emission cost)
Conventional diesel price (+ 25 €/t CO2 emission cost)
Conventional diesel price (+ 50 €/t CO2 emission cost)
RE-diesel cost (7% WACC + no O2 benefit)
RE-diesel cost (7% WACC + 15 €/t O2 benefit)
RE-diesel cost (7% WACC + 30 €/t O2 benefit)
RE-diesel cost (5% WACC + no O2 benefit)
RE-diesel cost (5% WACC + 15 €/t O2 benefit)
RE-diesel cost (5% WACC + 30 €/t O2 benefit)
The first breakeven can be expected for a produced RE-diesel with a WACC of 5% and anO2 benefit of 30 €/tCO2 and a conventional diesel price with CO2 emission cost of 50 €/tCO2and a crude oil price of 121 USD/bbl.
A realistic breakeven is expected for the crude oil prices between 130-180 USD/bbl.
CO2 emission cost:• Diesel CO2 emission: 74 tCO2/TJ• 0-50 €/tCO2
• 0-30 USD/bblO2 profit:• O2 market price: up to 80 €/tO2
• Our most optimistic scenario: 30 €/tO2
• Diesel cost in EU: 119% of Brent crudeoil price

Economics of global gas-to-liquids (GtL) fuels trading based on hybrid PV-Wind power plantsMahdi Fasihi [email protected]
ResultsSensitivity Analysis
The four most relevant RE-diesel LCOF influencing factors are:• Hybrid PV-Wind FLh• Electrolyzer efficiency• WACC• Hybrid PV-Wind capexThe RE-PtG-GtL value chain needs to be located at the bestcomplementary solar and wind sites in the world, combined with ade-risking strategy and a special focus on mid to long termelectrolyzer efficiency improvements.
92
96
100
104
108
112
0.90 1.00 1.10
Rela
tive
cost
of R
E-di
esel
(%)
Change in input
Geographical changes
hyb PV-Wind FLh
overlap
92
96
100
104
108
0.90 1.00 1.10
Rela
tive
cost
of R
E-di
esel
(%)
Change in input
Plants' energy efficiency
GtL eff.
electrolyzer eff.
94
96
98
100
102
104
106
0.90 1.00 1.10
Rela
tive
cost
of R
E-di
esel
(%)
Change in input
Economic changes
hyb PV-Wind capex
elect.+methan capex
CO2 capex
GTL capex
WACC
Lifetime

Economics of global gas-to-liquids (GtL) fuels trading based on hybrid PV-Wind power plantsMahdi Fasihi [email protected]
ResultsHourly Basis Analysis: full load hours
• wind FLh are much higher than PVFLh due to 24h harvesting
• high FLh of hybrid PV-Wind plantsresult in cheaper downstreamprocesses such as PtG
• sites of high hybrid PV-Wind FLhare distributed across the world

Economics of global gas-to-liquids (GtL) fuels trading based on hybrid PV-Wind power plantsMahdi Fasihi [email protected]
ResultsHourly Basis Analysis: LCOE and LCOG
• top sites in the world reach hybridPV-Wind LCOE of 20 – 25 €/MWh
• Patagonia shows one of the bestconfigurations in the world
• SNG cost, as a function of hybridPV-Wind FLh, availability of cleanwater and low overlap

Economics of global gas-to-liquids (GtL) fuels trading based on hybrid PV-Wind power plantsMahdi Fasihi [email protected]
ResultsHourly Basis Analysis: optimized hybrid PV-Wind configuration
• least cost combination of PV andWind for hybrid PV-Wind assumed
• maximum 10% of the land can beused for each PV and Wind
• Wind is the dominating part in mostregions, as it reaches to the 10%limit faster
• cost optimized system generationpotential is 25% of generationpotential
• production sites in most cases nearcoast, thus optimized logistics
• global natural gas production in2014 of 36,000 TWh,gas

Economics of global gas-to-liquids (GtL) fuels trading based on hybrid PV-Wind power plantsMahdi Fasihi [email protected]
ResultsHourly Basis Analysis: RE-SNG industrial cost curves
• about 1,000 TWhgas potential for cost lessthan 65 €/MWhgas (25.4 USD/MMBtu)
• potential of 16,000 TWhgas for cost less then100 €/MWh,gas (39 USD/MMBtu)
• thus, potential of 25,600 TWhel RE generation
• RE-SNG production cost between 50-110 €/MWhgas
• RE-SNG may set an upper limit for fossil fuel prices• WACC 7%

Economics of global gas-to-liquids (GtL) fuels trading based on hybrid PV-Wind power plantsMahdi Fasihi [email protected]
ResultsHourly Basis Analysis: RE-PtG-GtL industrial cost curves
• about 1,000 TWhfuel potential for cost less than 120€/MWhfuel (47 USD/MMBtu, or 1.16 €/l of diesel)
• potential of 10,000 TWhfuel for cost less then 170€/MWhfuel (66.5 USD/MMBtu , or 1.64 €/l of diesel)
• RE-fuels production cost between 100-190 €/MWhfuel
• RE-fuels may set an upper limit for fossil fuel prices
• WACC 7%
Potential of 6,000 TWhdiesel (diesel represents 60% of GtL products),equal to of global diesel demand in 2030

Economics of global gas-to-liquids (GtL) fuels trading based on hybrid PV-Wind power plantsMahdi Fasihi [email protected]
Agenda
MotivationMethodology and DataResultsSummary

Economics of global gas-to-liquids (GtL) fuels trading based on hybrid PV-Wind power plantsMahdi Fasihi [email protected]
Summary• The idea is to use hybrid PV-Wind power plants’ power to produce RE-SNG and then RE-diesel.
• Refinery products downstream value chain can be used.
• RE-diesel is a non-diminishing fossil CO2 free fuel, which will insure both fuel security andenvironmental issues.
• The cost of delivered RE-diesel in Rotterdam is equivalent to 121 to 191 USD/bbl (20.9 – 32.9USD/MMBtu, 0.81 – 1.06 €/l conv. diesel, depending on assumptions for WACC, CO2 cost and O2 benefit.
• For a Brent crude oil price more than 121 USD/bbl and CO2 emission cost of 50 €/tCO2, and O2 benefit of30 €/tO2 RE-diesel is competitive to fossil diesel price in EU.
• This would be an upper limit for the fossil diesel price in the long-term.
• The by-products of the RE-PtG-GtL value chain can play a significant role in some regional cases
• Excess heat utilization can significantly increase the overall efficiency and would decrease the costs
• Substitution of fossil fuels by hybrid PV-Wind power plants could create a PV-wind market potential inthe order of terawatts.
Thank you for your attention!

NEO-CARBON Energy project is one of the Tekes strategy research openingsand the project is carried out in cooperation with Technical Research Centre of Finland VTT Ltd, Lappeenranta University of Technology (LUT) and University
of Turku, Finland Futures Research Centre.
Please check next slides for an overview of all data, assumptions and references.

Economics of global gas-to-liquids (GtL) fuels trading based on hybrid PV-Wind power plantsMahdi Fasihi [email protected]
Supplementary materialBackup: Plants' Annual Production & Consumption
Plants' AnnualProduction & Consumption Unit Amount
Hyb PV-Wind, generation [TWh,el] 36.00Hyb PV-Wind, used [TWh,el] 34.20Clean water production [mio m3] 1.96CO2 production & consumption [mio ton] 3.98SNG production & consumption [GWh,gas] 22 383SNG production & consumption [mio m3] 2 172SNG production & consumption [mio ton] 1.45O2 production [mio ton] 5.79O2 consumption [mio ton] 1.45Diesel production [bbl] 5 722 700Jet fuel/ Kerosene production [bbl] 2 384 500Naphtha production [bbl] 1 430 700

Economics of global gas-to-liquids (GtL) fuels trading based on hybrid PV-Wind power plantsMahdi Fasihi [email protected]
ResultsHourly Basis Analysis: ratio of PV and Wind, excess generation (cost optimized)
• balance between Wind and PV inmost regions
• PV is the dominating part in Atacamadesert and West Tibet
• wind is the dominating part inPatagonia
• very low excess in Patagonia• higher excess in other areas can be
reduced in a full energy systemintegration

Economics of global gas-to-liquids (GtL) fuels trading based on hybrid PV-Wind power plantsMahdi Fasihi [email protected]
ResultsHourly Basis Analysis: generation potential
• hybrid system potential is thesum of wind and PVgeneration potential
• generation potential of about120,000 TWhel indicates ahigh RE-SNG supply potential


