Page 1
Agribusiness & Applied Economics 699 September 2012
Economics of Using Flared vs. Conventional Natural Gas to
Produce Nitrogen Fertilizer: A Feasibility Analysis
Thein Maung
David Ripplinger
Greg McKee
David Saxowsky
Department of Agribusiness and Applied Economics
Agricultural Experiment Station
North Dakota State University
Fargo, ND 58108
Page 2
Acknowledgements
We thank the North Dakota Agricultural Products Utilization Commission and the North Dakota
Corn Council for providing the funding for this research.
We also would like to thank Frayne Olson, Ryan Larsen and Richard Taylor for their
constructive comments and suggestions.
The project was conducted under the original title: “Economics of Collecting Flared Gas to
Produce Nitrogen Fertilizer: A Feasibility Analysis”.
This publication is available electronically at this web site: http://agecon.lib.umn.edu/. Please
address your inquiries regarding this publication to: Department of Agribusiness & Applied
Economics, P.O. Box 6050, Fargo, ND 58108-6050, Phone: 701-231-7441, Fax: 701-231-7400,
Email: [email protected] .
NDSU is an equal opportunity institution.
Copyright © 2012 by Maung, Ripplinger, McKee and Saxowsky. All rights reserved. Readers
may make verbatim copies of this document for non-commercial purposes by any means,
provided that this copyright notice appears on all such copies.
Page 3
i
Table of Contents
1. Introduction ................................................................................................................. 1
2. Availability and Economics of Flared Natural Gas ..................................................... 3
2.1. Economics of Capturing and Collecting Flared Gas ............................................ 3
2.2. Other Factors Influencing the Capture of Flared Gas .......................................... 7
2.3. Summary .............................................................................................................. 7
3. Feasibility of Producing Nitrogen Fertilizers Using Conventional Natural Gas ......... 8
3.1. Geographic Location of Ammonia Production Capacity and Ammonia
Production Process ............................................................................................... 9
3.2. Methodology, Assumptions and Data Need ....................................................... 11
3.3. Ammonia Cost Estimation Results .................................................................... 13
3.4. Ammonia Cost Sensitivity Analysis .................................................................. 13
3.5. Ammonia Cost Estimation Based on Mix Products ........................................... 15
3.6. Summary ............................................................................................................ 16
4. Business Models ........................................................................................................ 17
4.1. The Value Proposition ........................................................................................ 17
4.2. Justification of Capital ....................................................................................... 17
4.3. Path for Scaling Firm Operations ....................................................................... 18
4.4. Ownership and Associated Control Rights ........................................................ 18
5. Cooperatives .............................................................................................................. 18
5.1. Traditional Cooperative...................................................................................... 18
5.2. New Generation or Closed Membership Cooperative ....................................... 19
5.3. Hybrid Cooperative ............................................................................................ 21
6. Limited Liability Company ....................................................................................... 22
7. Income Taxation ........................................................................................................ 23
8. Facility Siting ............................................................................................................ 24
8.1. General Siting Considerations ............................................................................ 24
8.2. Plant-Specific Requirements .............................................................................. 25
8.3. Utilities Infrastructure ........................................................................................ 26
8.4. Transportation Infrastructure .............................................................................. 29
8.5. Preliminary sites ................................................................................................. 30
8.6. Summary of Siting Considerations and Next Steps ........................................... 31
9. Summary of Findings ................................................................................................ 32
Page 4
ii
List of Tables
Table 1. Top 20 Flaring Countries by Volumes (in Billion Cubic Feet), 2007-2011 ......... 2
Table 2. Amount of Gas Flared in North Dakota ................................................................ 3
Table 3. Baseline Assumptions Used in Estimating Ammonia Cost ................................ 12
Table 4. Total Capital Cost for Ammonia Production ...................................................... 12
Table 5. Baseline Levelized Cost for Ammonia Production ............................................ 13
Table 6. Percent of Total Levelized Cost for Baseline Case ............................................ 13
Table 7. Total Capital Cost of Producing Ammonia, Urea, ANS and UAN and
Anhydrous Ammonia Levelized Cost ................................................................ 16
Table 8. Shovel Ready Checklist ..................................................................................... 24
List of Figures
Figure 1. Concentration of Flared Gas in Western North Dakota ...................................... 4
Figure 2. Oil and Flared Gas Production Patterns for Four Sample Wells ......................... 4
Figure 3. Amount of Gas Flared in North Dakota .............................................................. 5
Figure 4. Flare Gas Based on 13 Oil Well Observations .................................................... 5
Figure 5. Average of 13 Well Observations from Figure 4 (Straight line represents
the trend) ............................................................................................................. 6
Figure 6. Optimal Way to Connect and Capture Flared Gas .............................................. 6
Figure 7. Pipeline Connection Cost for Capturing Flared Gas ........................................... 7
Figure 8. Historical and Forecasted Henry Hub Natural Gas Spot Price............................ 8
Figure 9. Total Dry Natural Gas Production in North Dakota ............................................ 8
Figure 10. Historical Natural Gas Price in the United States ............................................. 9
Figure 11. Ammonia Production Capacity in North America .......................................... 10
Figure 12. Ranking of Ammonia Production Capacity in the U.S. .................................. 10
Figure 13. Steam Methane Reforming Ammonia Production Process ............................. 11
Figure 14. Impact of Changes in Natural Gas Price on Ammonia Cost ........................... 14
Figure 15. Impact of Changes in Electricity Price on Ammonia Cost .............................. 14
Figure 16. Impact of Changes in Capital Cost on Ammonia Cost .................................... 15
Figure 17. Impact of Changes in Real Discount Rate on Ammonia Cost ........................ 15
Figure 18. Business Models Mediate between Technical and Economic Domains ......... 17
Figure 19. Traditional Cooperative (CHS, CoBank) ........................................................ 19
Figure 20. New Generation Cooperatives ......................................................................... 20
Figure 21. Hybrid Cooperatives ........................................................................................ 22
Figure 22. Limited Liability Companies ........................................................................... 23
Figure 23. Northern Plains Natural Gas Pipelines (International) .................................... 27
Figure 24. North Dakota Glacial Aquifers ........................................................................ 28
Figure 25. U.S. Power Transmission Network ................................................................. 28
Figure 26. North Dakota State Highway Performance Classification System ................. 29
Figure 27. Burlington Northern Santa Fe and Canadian Pacific Rail Lines ..................... 30
Page 5
iii
Executive Summary
The feasibility analysis begins by examining the economic potential of using flared natural gas as
a feedstock to produce a low-cost, reliable, and sustainable supply of nitrogen fertilizer for North
Dakota farmers. Specific objectives include
Determining the most profitable facility size, location, and configuration for a natural gas
nitrogen fertilizer production facility in North Dakota.
Calculating the financial returns and capital requirements of gas-based nitrogen fertilizer
production.
Identifying possible business structures for the fertilizer production facility.
Project objectives are achieved by evaluating the technological and economic feasibility of
alternative nitrogen fertilizer production and distribution systems.
Flared Gas Collection: the economics of flared gas collection in western North Dakota
analyzes the availability of flared gas supplies.
Ammonia Plant Preliminary Design: several ammonia production plants based on
commercially available technologies are used to estimate capital and operating cost.
Business Structure: the effect of alternative business structures, including new generation
cooperatives, on incorporation, capitalization, taxation, and fertilizer marketing are
investigated.
Facility Siting: factors in determining optimal plant site include fertilizer form (e.g.
ammonia, urea), technological and economies of scale, transportation and utility
infrastructure, and nitrogen fertilizer demand. The use of natural gas in western and eastern
North Dakota and co-location by existing coal-fired power plants or refineries are
considered.
Topics originally intended to study but not yet completed or are no longer relevant include
Preparing a financial pro forma, including pro forma balance sheet, income and cash flow
statements for the nitrogen fertilizer production plant to demonstrate the financial viability
of the enterprise.
Incorporating a supply chain model to estimate storage and transportation costs and
efficiencies, including capturing and retaining value, and reducing cost and risks.
Determining the willingness of food manufacturers, bioenergy producers, and other current
and potential buyers of North Dakota crops to pay the premiums for green inputs.
Estimating the impact of using of green fertilizer on farm profit.
The focus of the study was refined when initial findings revealed that initiating an enterprise to
capture and process flared gas was not economical at this time, but that relying on the energy
industry to supply conventional natural gas for fertilizer manufacturing is more feasible at the
present time. However, a premium for crops produced with green inputs and need for carbon
sequestration in the future should be subsequently studied at appropriate times.
Page 6
1
Economics of Using Flared vs. Conventional Natural Gas to
Produce Nitrogen Fertilizer: A Feasibility Analysis
Thein Maung, David Ripplinger, Greg McKee and David Saxowsky1
1. Introduction
Flared gas (that is, the gas associated with the production of crude oil in western North Dakota)
consists of different types of gases including methane natural gas, propane, butane, ethylene,
propylene and butadiene. On average, methane gas constitutes 55% of total gas composition
(USEPA 1991). The Global Gas Flaring Reduction Public-Private Partnership (GGFR), a World
Bank-led initiative established in 2002, supports governments, development agencies and oil
industries worldwide in their efforts to reduce the flaring and venting of associated or flared gas
during the crude oil extraction. The GGFR’s mission is to promote effective regulatory
frameworks and solve the issues related to gas utilization such as lack of access to energy
infrastructure, markets and services especially in developing countries. According to the data in
Table 1 obtained from the World Bank’s GGFR website, globally Russia is the top gas flaring
country with 1.32 trillion cubic feet (TCF) of gas being flared in 2011. The United States ranks
fifth in 2011 with 0.25 TCF of gas being flared. Gas flaring in the United States has rapidly
increased in recent years partly because of the boom in oil and gas industries in the Bakken and
Three Forks formations in western North Dakota.
In 2007, the GGFR funded the PFC Energy to conduct study on gas flaring in the Russian
Federation. The goal was to promote developing policies and regulations on gas flaring and
utilization in Russia. The study (see PFC Energy 2007) suggests that there are four major factors
that inhibit energy producers from capturing and utilizing flared gas. They are 1) lack of
infrastructure such as gas processing plants and pipelines needed to transport flared gas, 2) lack
of policy frameworks that provide sustained incentives for producers to better utilize flared gas,
3) large volumes of flared gas come from small fields in less populated and remote areas far
from major local energy markets which make pipeline connection costs prohibitively high, and
4) prices of natural gas, propane and butane extracted from flared gas.
In addition to wasting valuable resources, gas flaring also contributes to a significant
anthropogenic source of greenhouse gas (GHG) emissions (GGFR 2005). In North Dakota, most
of the flared gas is wasted due to insufficient infrastructure which has not expanded at the same
pace as rapidly growing oil production (USEIA 2011). The state has lax regulations on gas
flaring. For example under North Dakota regulations (see NDDMR 2011), gas flaring from an oil
well is allowed during the first year of production without paying penalties in the form of taxes
or royalties. After one year, gas flaring is still permissible given that an oil company pays taxes
or royalties on the flared gas. If an oil company can show that connection of a well to a natural
gas gathering line is economically infeasible, it can be exempted from the prohibition against gas
flaring. In recent years because of improvements in natural gas drilling and hydraulic fracturing
technologies, there has been an oversupply of natural gas in the market which brings down gas
1 Maung and Ripplinger are research scientists and McKee and Saxowsky are Associate Professors.
Page 7
2
prices. Low natural gas prices provide little incentives for private investments in flared gas
reduction.
The objective of this study is to investigate the viability of using flared natural gas to produce
nitrogen fertilizer in North Dakota. We begin by looking into the availability and economics of
flared natural gas in Section 2. We found that flared natural gas supply could become unstable
over the long term and that at the current time it is not economically advantageous to use flared
gas to manufacture nitrogen fertilizer. Thus in Section 3, we look into the feasibility of using
conventional natural gas to generate nitrogen fertilizer. Sections 4 and 5 discuss business models
and cooperative structures for a nitrogen fertilizer firm. Sections 6 and 7 illustrate the structure of
limited liability company and income taxation for the firm. Section 8 examines facility siting for
a potential nitrogen fertilizer plant. Finally, Section 9 concludes this study.
Table 1. Top 20 Flaring Countries by Volumes (in Billion Cubic Feet), 2007-2011
2007 2008 2009 2010 2011
Russia 1,846 1,483 1,645 1,257 1,320
Nigeria 575 547 526 530 515
Iran 378 381 385 399 402
Iraq 237 251 286 318 332
USA 78 85 116 162 251
Algeria 198 219 173 187 177
Kazakhstan 194 191 177 134 166
Angola 124 124 120 145 145
Saudi Arabia 138 138 127 127 131
Venezuela 78 95 99 99 124
China 92 88 85 88 92
Canada 71 67 64 88 85
Libya 134 141 124 134 78
Indonesia 92 88 102 78 78
Mexico 95 127 106 99 74
Qatar 85 81 78 64 60
Uzbekistan 74 95 60 67 60
Malaysia 64 67 67 53 56
Oman 71 71 67 56 56
Egypt 53 56 64 56 56
Total (20 nations) 4,660 4,377 4,483 4,165 4,271
Rest of the world 777 777 706 706 671
Global flaring level 5,436 5,154 5,189 4,871 4,942
Source: http://go.worldbank.org/G2OAW2DKZ0
Page 8
3
2. Availability and Economics of Flared Natural Gas
In recent years, gas flaring in the United States has increased rapidly as indicated in Table 1. On
average, North Dakota accounts for as much as 21% (Table 2) of the total gas flared in the
United States. Most of the gas flared in North Dakota is heavily concentrated in the western part
of the state such as Williams, McKenzie, Dunn and Mountrail counties (Figure 1). Flared gas
generally follows oil production pattern (Figure 2). As the production of petroleum crude oil
increases, so does the amount of gas flared (Figure 3). Figures 4 and 5 indicate that usually the
amount of gas flared declines over time as oil production declines. This variation in flared gas
production and the cost of capturing and processing flared gas (discussed below) suggest that
relying on flared gas alone over the long term to produce nitrogen fertilizers may not be
practical.
Table 2. Amount of Gas Flared in North Dakota
Year Billion Cubic Feet (BCF) % of US Total**
2006 6.65 -
2007 13.73 18%
2008 26.83 32%
2009 23.79 21%
2010 30.81 19%
2011 45.98* 18%
Average 28.23 21% *Due to some missing data, the amount of gas flared maybe higher than this in 2011.
**Computed using the total amount of gas flared in the United States (Table 1) and the amount of gas flared in
North Dakota.
Source: NDDMR
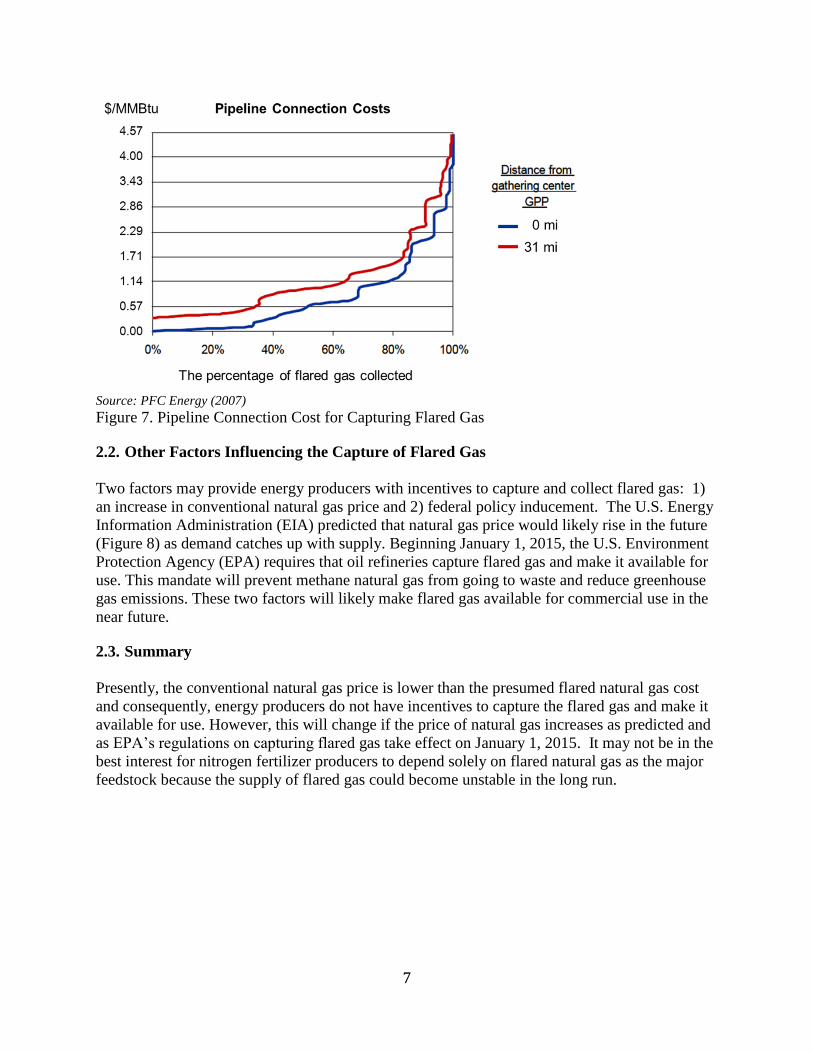
2.1. Economics of Capturing and Collecting Flared Gas
To the best of our knowledge, with the exception of the study by PFC Energy (2007), few or no
studies have examined comprehensively the economics of collecting flared gas. According to
PFC energy (2007), an optimal way to collect flared gas is to connect oil well fields to a
gathering center located in the middle and transport flared gas from the center to a gas processing
plant (GPP) (see Figure 6). Using this optimal approach, PFC energy estimated pipeline
connection costs from fields to a gathering center and then to a GPP. Generally, it would cost as
much as $4/MMBtu (Million Btu) to collect all the flared gas through a pipeline infrastructure
using the aforementioned approach (Figure 7).
Page 9
4
Source: NDDMR
Figure 1. Concentration of Flared Gas in Western North Dakota
Source: NDDMR
Figure 2. Oil and Flared Gas Production Patterns for Four Sample Wells
Page 10
5
Source: NDDMR
Figure 3. Amount of Gas Flared in North Dakota
Source: NDDMR
Figure 4. Flare Gas Based on 13 Oil Well Observations
Page 11
6
Figure 5. Average of 13 Well Observations from Figure 4 (Straight line represents the trend)
The total cost of producing flared natural gas could sum up to at least $7.57/MMBtu2, assuming
that payment to oil producers for capturing flared gas is $0.57/MMBtu (PFC Energy 2007),
pipeline connection cost is $4/MMBtu (PFC Energy 2007) and processing cost is $3/MMBtu
(Blanton 2010). At present, the spot price of conventional natural gas at Henry Hub is about
$2.88/MMBtu. As long as the price of conventional natural gas is lower than the cost of flared
natural gas, energy producers have little incentive to capture and process flared gas for use.
Source: PFC Energy (2007)
Figure 6. Optimal Way to Connect and Capture Flared Gas
2 Storage, transportation and marketing costs are excluded.
Page 12
7
Source: PFC Energy (2007)
Figure 7. Pipeline Connection Cost for Capturing Flared Gas
2.2. Other Factors Influencing the Capture of Flared Gas
Two factors may provide energy producers with incentives to capture and collect flared gas: 1)
an increase in conventional natural gas price and 2) federal policy inducement. The U.S. Energy
Information Administration (EIA) predicted that natural gas price would likely rise in the future
(Figure 8) as demand catches up with supply. Beginning January 1, 2015, the U.S. Environment
Protection Agency (EPA) requires that oil refineries capture flared gas and make it available for
use. This mandate will prevent methane natural gas from going to waste and reduce greenhouse
gas emissions. These two factors will likely make flared gas available for commercial use in the
near future.
2.3. Summary
Presently, the conventional natural gas price is lower than the presumed flared natural gas cost
and consequently, energy producers do not have incentives to capture the flared gas and make it
available for use. However, this will change if the price of natural gas increases as predicted and
as EPA’s regulations on capturing flared gas take effect on January 1, 2015. It may not be in the
best interest for nitrogen fertilizer producers to depend solely on flared natural gas as the major
feedstock because the supply of flared gas could become unstable in the long run.
Page 13
8
Note: This is based on the reference case.
Source: http://www.eia.gov/oiaf/aeo/tablebrowser/
Figure 8. Historical and Forecasted Henry Hub Natural Gas Spot Price
3. Feasibility of Producing Nitrogen Fertilizers Using Conventional Natural Gas
Since early 2005, natural gas production has been on the rise in North Dakota due to improved
horizontal drilling and hydraulic fracturing technologies. In 2011, total natural gas production in
North Dakota reached 160 trillion Btu (Figure 9) which is enough to generate approximately 4.8
million tons of anhydrous ammonia. In recent years because of advancement in natural gas
production technology, there has been a national surplus of gas supply and the price has declined
sharply (Figure 10). At present, both spot and future prices of natural gas at Henry Hub are close
to $3 per MMBtu. Low natural gas prices are driving interest in nitrogen fertilizer production
investment.
Source: NDDMR
Figure 9. Total Dry Natural Gas Production in North Dakota
Page 14
9
Source: http://205.254.135.7/dnav/ng/ng_pri_sum_dcu_nus_m.htm
Figure 10. Historical Natural Gas Price in the United States
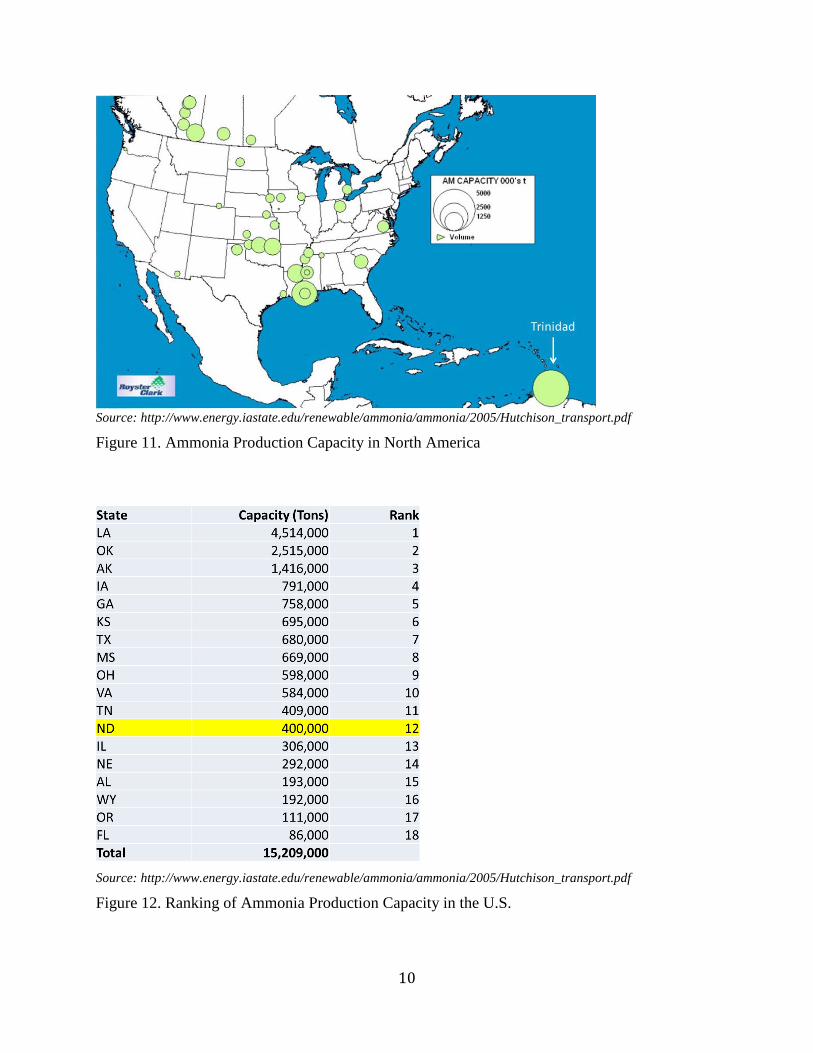
3.1. Geographic Location of Ammonia Production Capacity and Ammonia Production
Process
In North America, most ammonia production takes place in Louisiana, Oklahoma, and Alberta
(Canada) (Figure 11). Trinidad and Tobago in the southern Caribbean also have a large ammonia
production capacity. In the United States, North Dakota ranks twelve in terms of production
capacity (Figure 12). The state has the capacity to produce 400,000 tons of ammonia each year.
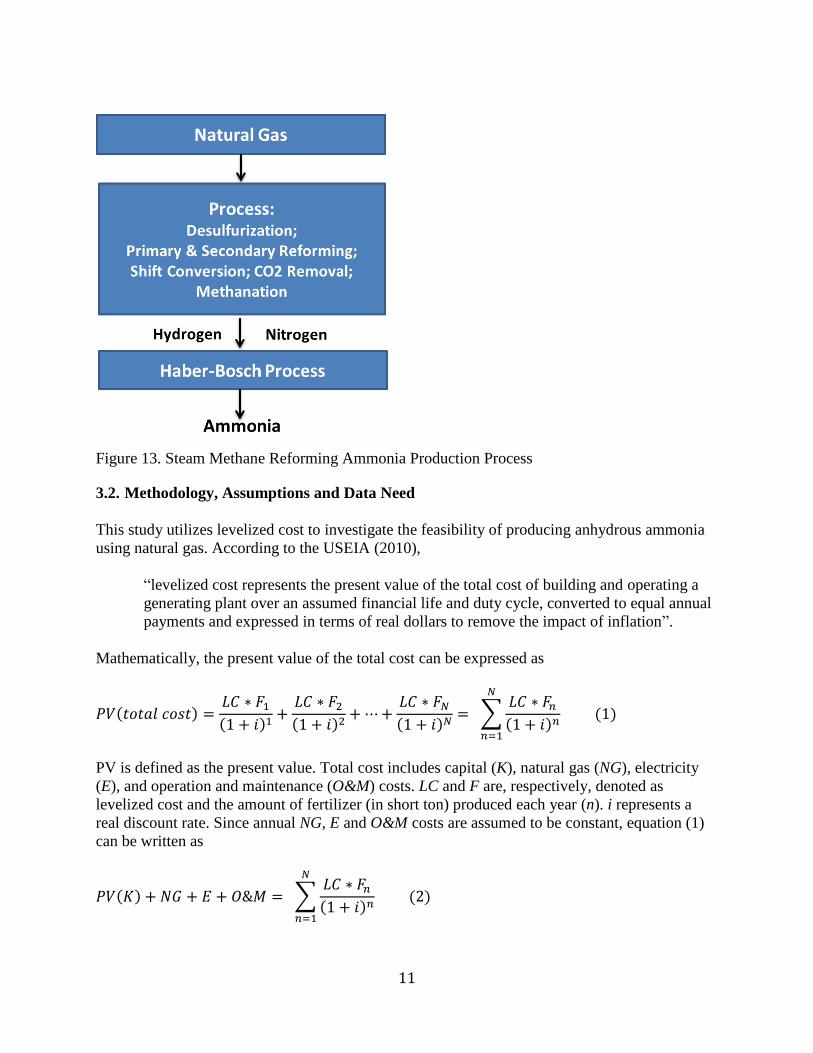
Globally, about 75% to 80% of ammonia is produced using Steam Methane Reforming process
(Kramer 2004). The ammonia production process illustrated in Figure 13 includes the following
steps: 1) desulfurization of natural gas, 2) primary reforming, 3) secondary reforming, 4) shift
conversion, 5) CO2 removal, 6) methanation, and 7) ammonia synthesis through the Haber-
Bosch process.
In the first step, sulfur content in natural gas is removed to prevent damaging the catalysts in the
primary reformer. In the second step, sulfur-free natural gas is mixed with process steam and
reformed to convert methane into hydrogen, CO2 and CO (carbon monoxide). Then the gas
mixture is sent to the secondary reformer where it is combined with compressed air that has been
preheated. Air is added to generate a synthesis gas having a hydrogen-to-nitrogen mole ratio of
three to one. The gas leaving the secondary reformer is then cooled in a waste heat boiler
(USEPA 1996). In the fourth step, the cooled gas mixture enters a CO shift converter where CO
is converted into CO2. The CO2 is removed in the fifth step. The remaining trace amounts of CO
and CO2 are removed during the methanation process step. What remains is a mixture of nearly
pure hydrogen and nitrogen which is then converted to anhydrous ammonia in the final step
using the Haber-Bosch process.
Page 15
10
Source: http://www.energy.iastate.edu/renewable/ammonia/ammonia/2005/Hutchison_transport.pdf
Figure 11. Ammonia Production Capacity in North America
Source: http://www.energy.iastate.edu/renewable/ammonia/ammonia/2005/Hutchison_transport.pdf
Figure 12. Ranking of Ammonia Production Capacity in the U.S.
Page 16
11
Figure 13. Steam Methane Reforming Ammonia Production Process
3.2. Methodology, Assumptions and Data Need
This study utilizes levelized cost to investigate the feasibility of producing anhydrous ammonia
using natural gas. According to the USEIA (2010),
“levelized cost represents the present value of the total cost of building and operating a
generating plant over an assumed financial life and duty cycle, converted to equal annual
payments and expressed in terms of real dollars to remove the impact of inflation”.
Mathematically, the present value of the total cost can be expressed as
( )
( )
( )
( ) ∑
( )
( )
PV is defined as the present value. Total cost includes capital (K), natural gas (NG), electricity
(E), and operation and maintenance (O&M) costs. LC and F are, respectively, denoted as
levelized cost and the amount of fertilizer (in short ton) produced each year (n). i represents a
real discount rate. Since annual NG, E and O&M costs are assumed to be constant, equation (1)
can be written as
( ) ∑
( )
( )
Page 17
12
Because LC and F are fixed, the levelized cost in equation (2) can be expressed as
( )
∑
( )
⁄ ( )
Baseline assumptions used to estimate the levelized cost of anhydrous ammonia production are
shown in Table 3. We investigate the levelized cost of anhydrous ammonia production for five
different plant sizes. The plant sizes along with their capital costs are described in Table 4.
Operation and maintenance (O&M), electricity and capital costs were obtained from our industry
source3. Capital costs include both ISBL (Inside Battery Limits) and OSBL (Outside Battery
Limits) costs4.
Table 3. Baseline Assumptions Used in Estimating Ammonia Cost
Natural Gas Cost ($/MMBtu) 5
Plant Efficiency Rate (%) 100
Electricity Cost ($/kWh) 0.06
Electricity Requirement for Small Plant (kWh/ton) 950
Electricity Requirement for Large Plant (kWh/ton) 100
O&M Cost for Small Plant ($/ton) 40
O&M Cost for Large Plant ($/ton) 30
Natural Gas Requirement (MMBtu/ton) 33
Real Discount Rate (i) (%) 8
Lifetime Financing (n) (years) 20
Number of Operating Days 340
Table 4. Total Capital Cost for Ammonia Production
Plant Size (tons/year) Total Capital Cost (Million $)
3,400 24
50,000 138
516,000 630
1 Million 968
1.5 Million 1,261
3 The source cannot be revealed due to non-disclosure agreement. 4 ISBL costs include the costs of main process units such as compressors, heat exchangers, electrical wires and
hardware, computer control systems, drainage and sewers, and foundations and structural supports etc. OSBL costs
include the costs outside of the main process units such as steam generation, water treatment systems, water cooling
and piping systems, electrical supply, general utilities, site development etc. (Netzer 2006).
Page 18
13
3.3. Ammonia Cost Estimation Results
Levelized cost for ammonia production is estimated by plant size and reported in Table 5. The
table shows that as the plant size increases the cost declines due to economies of scale. The rate
of cost decline is steeper when the plants are smaller, but as the plant size increases, the rate of
cost decline gradually flattens. It would cost $325/ton to generate ammonia using a 516,000
tons/year plant. Storage and transportation costs were not considered in estimating this cost. The
share of capital cost as percent of total cost declines as the plant size increases (Table 6). But, the
share of natural gas cost as percent of total increases significantly as the size of plant increases.
The natural gas cost accounts for more than 50% of total cost as the plant size reaches or
surpasses 516,000 tons/year production capacity.
Table 5. Baseline Levelized Cost for Ammonia Production
Ammonia Plant Size (tons per year)
3,400 50,000 516,000 1 Million 1.5 Million
$/ton of Ammonia
Capital Cost 721 281 124 99 86
Natural Gas Cost 165 165 165 165 165
Electricity Cost 57 57 6 6 6
O&M Cost 40 40 30 30 30
Total Ammonia Cost 983 543 325 300 287
Table 6. Percent of Total Levelized Cost for Baseline Case
Ammonia Plant Size (tons per year)
3,400 50,000 516,000 1 Million 1.5 Million
Percent of Total Cost
Capital Cost 73% 52% 38% 33% 30%
Natural Gas Cost 17% 30% 51% 55% 58%
Electricity Cost 6% 10% 2% 2% 2%
O&M Cost 4% 7% 9% 10% 10%
Total Ammonia Cost 100% 100% 100% 100% 100%
3.4. Ammonia Cost Sensitivity Analysis
Because natural gas cost accounts for more than 50% of total cost, changes in natural gas prices
will impact the cost of ammonia production. Figure 14 shows that as the natural gas price
increases from $5/MMBtu to $12/MMBtu, the cost of ammonia production increases
substantially (for example from $325/ton to $556/ton for a 516,000 tons/year plant). Other
factors, such as changes in electricity price, capital cost, and real discount rate have relatively
Page 19
14
smaller impact on ammonia cost (see Figures 15, 16 & 17). The figures show that changes in
electricity price, capital cost and real discount rate have a much larger impact on small plants
than large plants.
Figure 14. Impact of Changes in Natural Gas Price on Ammonia Cost
Figure 15. Impact of Changes in Electricity Price on Ammonia Cost
-
200
400
600
800
1,000
1,200
1,400
3,400(t) 50,000(t) 516,000(t) OneMillion(t) 1.5Million(t)
To
tal
Am
mo
nia
Co
st (
$/
ton
)
Plant Size (tons/year)
$5/MMBtu (Baseline) $8/MMBtu $12/MMBtu
-
200
400
600
800
1,000
1,200
3,400(t) 50,000(t) 516,000(t) OneMillion(t) 1.5Million(t)
To
tal
Am
mo
nia
Co
st (
$/
ton
)
Plant Size (tons/year)
$0.06/kWh (Baseline) $0.12/kWh $0.20/kWh
Page 20
15
Figure 16. Impact of Changes in Capital Cost on Ammonia Cost
Figure 17. Impact of Changes in Real Discount Rate on Ammonia Cost
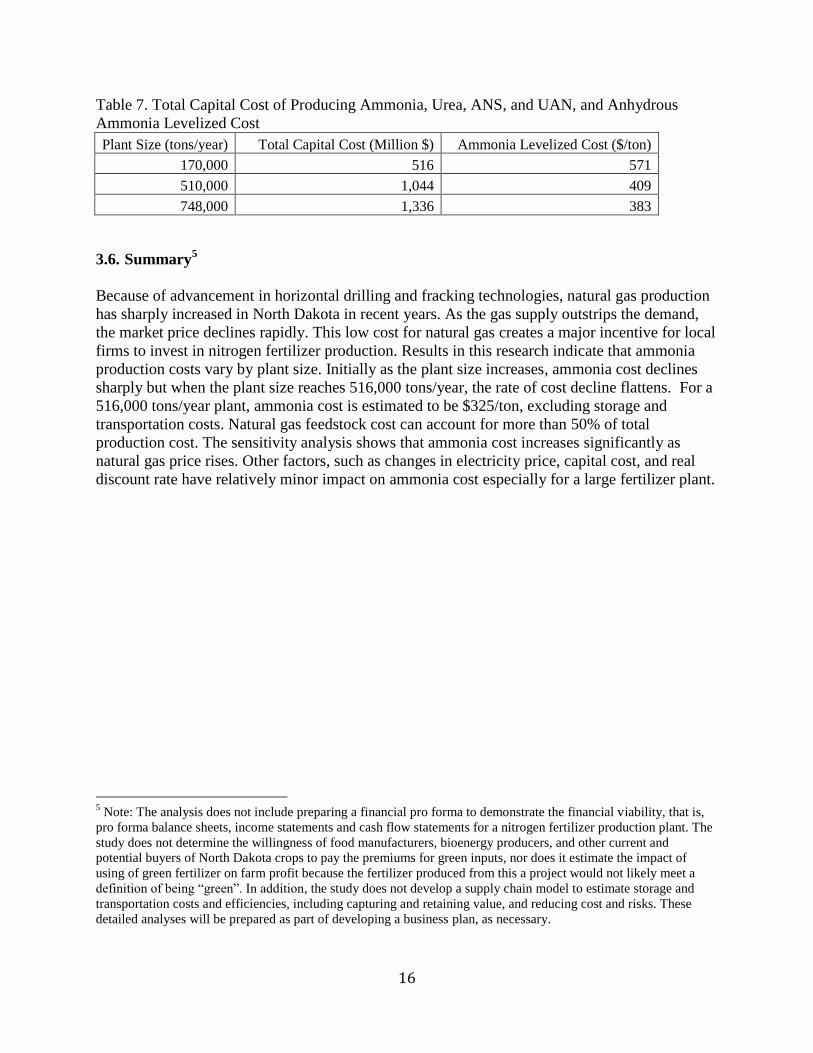
3.5. Ammonia Cost Estimation Based on Mix Products
The estimated ammonia costs do not include costs of producing other fertilizer products such as
Urea, ANS and UAN. According to our industry source, the total capital cost of producing
ammonia, Urea, ANS and UAN varies from $516 million to $1.34 billion for the plant sizes
shown in Table 7. Using our baseline assumptions, we estimated anhydrous ammonia levelized
cost associated with this product mix. Results reported in Table 7 show that the ammonia cost
ranges from $383/ton to $571/ton for this mix-product case.
-
200
400
600
800
1,000
1,200
3,400(t) 50,000(t) 516,000(t) OneMillion(t) 1.5Million(t)
To
tal
Am
mo
nia
Co
st (
$/
ton
)
Plant Size (tons/year)
Baseline 10%Increase 20%Increase
0
200
400
600
800
1000
1200
3,400(t) 50,000(t) 516,000(t) OneMillion(t) 1.5Million(t)
To
tal
Am
mo
nia
Co
st (
$/
ton
)
Plant Size (tons/year)
5% 8%(Baseline) 11%
Page 21
16
Table 7. Total Capital Cost of Producing Ammonia, Urea, ANS, and UAN, and Anhydrous
Ammonia Levelized Cost
Plant Size (tons/year) Total Capital Cost (Million $) Ammonia Levelized Cost ($/ton)
170,000 516 571
510,000 1,044 409
748,000 1,336 383
3.6. Summary5
Because of advancement in horizontal drilling and fracking technologies, natural gas production
has sharply increased in North Dakota in recent years. As the gas supply outstrips the demand,
the market price declines rapidly. This low cost for natural gas creates a major incentive for local
firms to invest in nitrogen fertilizer production. Results in this research indicate that ammonia
production costs vary by plant size. Initially as the plant size increases, ammonia cost declines
sharply but when the plant size reaches 516,000 tons/year, the rate of cost decline flattens. For a
516,000 tons/year plant, ammonia cost is estimated to be $325/ton, excluding storage and
transportation costs. Natural gas feedstock cost can account for more than 50% of total
production cost. The sensitivity analysis shows that ammonia cost increases significantly as
natural gas price rises. Other factors, such as changes in electricity price, capital cost, and real
discount rate have relatively minor impact on ammonia cost especially for a large fertilizer plant.
5 Note: The analysis does not include preparing a financial pro forma to demonstrate the financial viability, that is,
pro forma balance sheets, income statements and cash flow statements for a nitrogen fertilizer production plant. The
study does not determine the willingness of food manufacturers, bioenergy producers, and other current and
potential buyers of North Dakota crops to pay the premiums for green inputs, nor does it estimate the impact of
using of green fertilizer on farm profit because the fertilizer produced from this a project would not likely meet a
definition of being “green”. In addition, the study does not develop a supply chain model to estimate storage and
transportation costs and efficiencies, including capturing and retaining value, and reducing cost and risks. These
detailed analyses will be prepared as part of developing a business plan, as necessary.
Page 22
17
4. Business Models
A business model is a tool that describes how physical and technical inputs interact with a
marketplace and investors to generate economic output. Understanding the functions of a
business model may aid the selection process of the legal structure of the business model for this
project. The functions of a business model are summarized in four ways, described below. The
relationship among these functions is illustrated in Figure 18.
Figure 18. Business Models Mediate between Technical and Economic Domains
4.1. The Value Proposition
The first function of a business model is to articulate the value created for the corporation’s
users. The value proposition is targeted at users for which the firm’s technology achieves a
purpose. A firm’s decision makers identify sources of inputs for creating and distributing output.
Users then exchange money for the output, generating revenue for the firm. The difference
between expected revenues and expected costs of using the selected inputs determines the firm’s
profit potential.
4.2. Justification of Capital
In order for the firm to obtain the assets necessary to produce output, it requires financial capital.
Equity capital comes from investors who perceive the firm’s profit potential. Debt capital comes
from lenders who also perceive this potential. The firm justifies capital investment when it
demonstrates that the probability of achieving the value proposition, during the life of the
investment, is greater than the risks of failure.
Page 23
18
4.3. Path for Scaling Firm Operations
The relationship between investors and the firm determines how the firm obtains capital for
changing the scale of output over time. Income generated by the firm can be reinvested into
itself or investors may contribute equity directly. Alternatively, the firm may obtain additional
capital through borrowing.
4.4. Ownership and Associated Control Rights
Given that income provides investment incentives, business models also describe the nature of
income distribution and the process by which distribution decisions are made. Investors in the
company, both equity and debt, make their investment contingent on having rights to the firm’s
value. Since the likelihood of generating that value is subject to risk, investors require control
over the firm’s decision making process so as to increase the likelihood the firm will survive.
Investors of equity and debt have rights to different sources of the firm’s value. Lenders provide
capital in exchange for rights to the firm’s assets. Should the firm fail, lenders will be the first to
be repaid on their investment. In contrast, equity investors provide capital in exchange for rights
to the net income of the firm. Since lenders will be paid regardless of the profitability of the
firm, equity investors bear relatively more risk of not being repaid than lenders. In exchange for
this increased level of risk, equity holders are granted the greatest right to control the decisions
of the firm.
5. Cooperatives
Cooperative corporations are a type of business model. They are unique relative to other business
models in terms of control, ownership, and distribution of income. The unique aspects of
control, ownership, and income distribution are 1) democratic control by the users of the
company, 2) ownership by the users, and 3) net income distribution to company users in
proportion to patronage. A user who both patronizes the firm and has made an equity investment
in it is said to be a member. Note that the connection between the rights of control and ownership
are placed in the hands of members. There are three principal types of cooperatives. They differ
based on the composition of the membership.
5.1. Traditional Cooperative
The value proposition and justification of capital. A traditional cooperative contains a value
proposition and justification for capital similar to any other type of corporation. The equity
holders can be comprised of common and preferred stockholders. All common stockholders must
be users of the cooperative. Subject to bylaws, a person can become a member of a cooperative
at any time when they both use its services and make an equity investment. A person ceases to
be an active member by no longer patronizing the firm. Lenders also play an active role in
financing cooperative businesses.
Path for scaling firm operations related to ownership and control rights. Since a person can
become a member of a traditional cooperative at any point in time, the path for scaling up the
Page 24
19
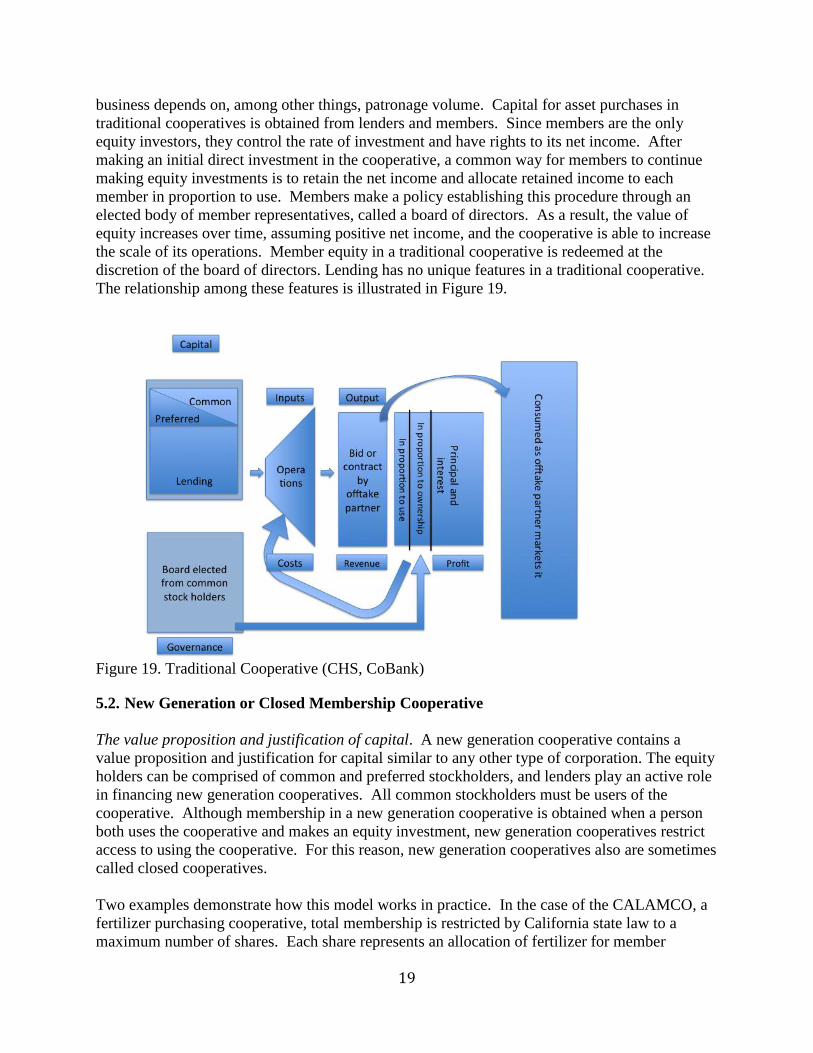
business depends on, among other things, patronage volume. Capital for asset purchases in
traditional cooperatives is obtained from lenders and members. Since members are the only
equity investors, they control the rate of investment and have rights to its net income. After
making an initial direct investment in the cooperative, a common way for members to continue
making equity investments is to retain the net income and allocate retained income to each
member in proportion to use. Members make a policy establishing this procedure through an
elected body of member representatives, called a board of directors. As a result, the value of
equity increases over time, assuming positive net income, and the cooperative is able to increase
the scale of its operations. Member equity in a traditional cooperative is redeemed at the
discretion of the board of directors. Lending has no unique features in a traditional cooperative.
The relationship among these features is illustrated in Figure 19.
Figure 19. Traditional Cooperative (CHS, CoBank)
5.2. New Generation or Closed Membership Cooperative
The value proposition and justification of capital. A new generation cooperative contains a
value proposition and justification for capital similar to any other type of corporation. The equity
holders can be comprised of common and preferred stockholders, and lenders play an active role
in financing new generation cooperatives. All common stockholders must be users of the
cooperative. Although membership in a new generation cooperative is obtained when a person
both uses the cooperative and makes an equity investment, new generation cooperatives restrict
access to using the cooperative. For this reason, new generation cooperatives also are sometimes
called closed cooperatives.
Two examples demonstrate how this model works in practice. In the case of the CALAMCO, a
fertilizer purchasing cooperative, total membership is restricted by California state law to a
maximum number of shares. Each share represents an allocation of fertilizer for member
Page 25
20
purchase. Since statewide fertilizer requirements exceed the fertilizer volume provided by the
shares, the maximum membership size is less than the total farmer population in California. In
the case of a marketing cooperative, like American Crystal Sugar Company, each share
represents a right to market a fixed area of harvested acreage through the cooperative. Since the
physical capacity of the cooperative is less than the capacity of the cooperative’s service territory
to produce sugar beets, membership in this cooperative is restricted. In both cases, a person
ceases to be an active member by no longer patronizing the firm.
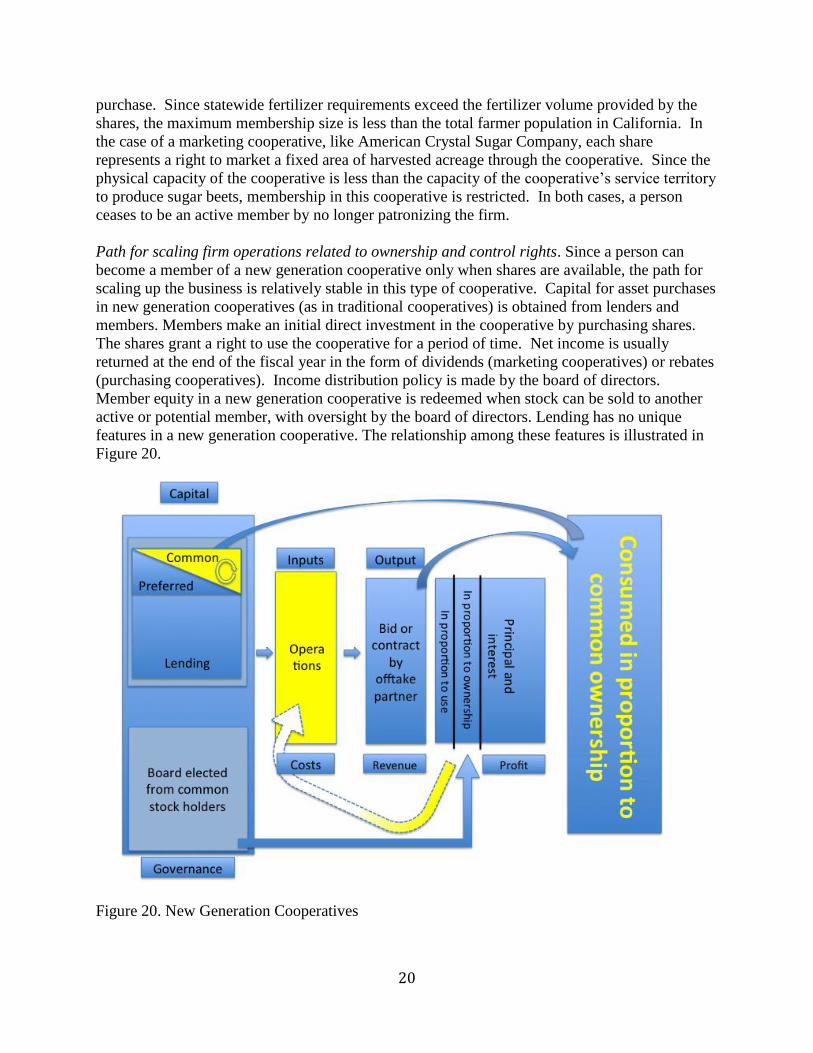
Path for scaling firm operations related to ownership and control rights. Since a person can
become a member of a new generation cooperative only when shares are available, the path for
scaling up the business is relatively stable in this type of cooperative. Capital for asset purchases
in new generation cooperatives (as in traditional cooperatives) is obtained from lenders and
members. Members make an initial direct investment in the cooperative by purchasing shares.
The shares grant a right to use the cooperative for a period of time. Net income is usually
returned at the end of the fiscal year in the form of dividends (marketing cooperatives) or rebates
(purchasing cooperatives). Income distribution policy is made by the board of directors.
Member equity in a new generation cooperative is redeemed when stock can be sold to another
active or potential member, with oversight by the board of directors. Lending has no unique
features in a new generation cooperative. The relationship among these features is illustrated in
Figure 20.
Figure 20. New Generation Cooperatives
Page 26
21
5.3. Hybrid Cooperative
The value proposition and justification of capital. A hybrid cooperative contains a value
proposition and justification for capital similar to any other type of corporation. In 2003,
Minnesota amended its cooperative business incorporation statute, affecting sources of equity
capital. Wyoming and Iowa have adopted similar statues. The central feature of this amendment
is to allow equity investment in a cooperative by non-users. Hence, the equity holders can be
comprised of common and preferred stockholders, but common stockholders are NOT required
to be users of the cooperative. Membership in a cooperative is obtained EITHER when a person
uses the cooperative and makes an equity investment in it, OR simply when they make an equity
investment in it. This kind of cooperative takes advantage of features of traditional investor-
owned corporations as well as traditional cooperatives. For this reason these are called hybrid
cooperatives.
Path for scaling firm operations related to ownership and control rights. Since a person can
becomes a member of a hybrid cooperative through investment and/or use, the path for scaling
up the business may be relatively stable in this type of cooperative when compared with
traditional cooperatives. Capital for asset purchases in traditional cooperatives is obtained from
lenders and members. Members make an initial direct investment in the cooperative by
purchasing common shares. Since investors comprise the board of directors, distribution of net
income is subject to the preferences of the board, subject to certain constraints. Non-members
may contribute as much as 99.99% of the equity, but cannot receive more than 85% of the
income. Also, patrons must comprise at least 50% of the voting power of “general matters of the
cooperative.” Lending has no unique features in a hybrid. The relationship among these features
is illustrated in Figure 21.
Page 27
22
Figure 21. Hybrid Cooperatives
6. Limited Liability Company
A limited liability company (LLC) decouples the relationships between use, control, ownership,
and income distribution, as in a cooperative. A limited liability company contains a value
proposition and justification for capital similar to any other type of corporation. One or more
owners, also termed “members”, may contribute equity to the company. The board of directors
is comprised of members. The bylaws of the corporation establish the relationship between
ownership and voting rights. Member equity in a limited liability company is redeemed when
stock can be sold to another active or potential member. The relationship among these features is
illustrated in Figure 22.
Page 28
23
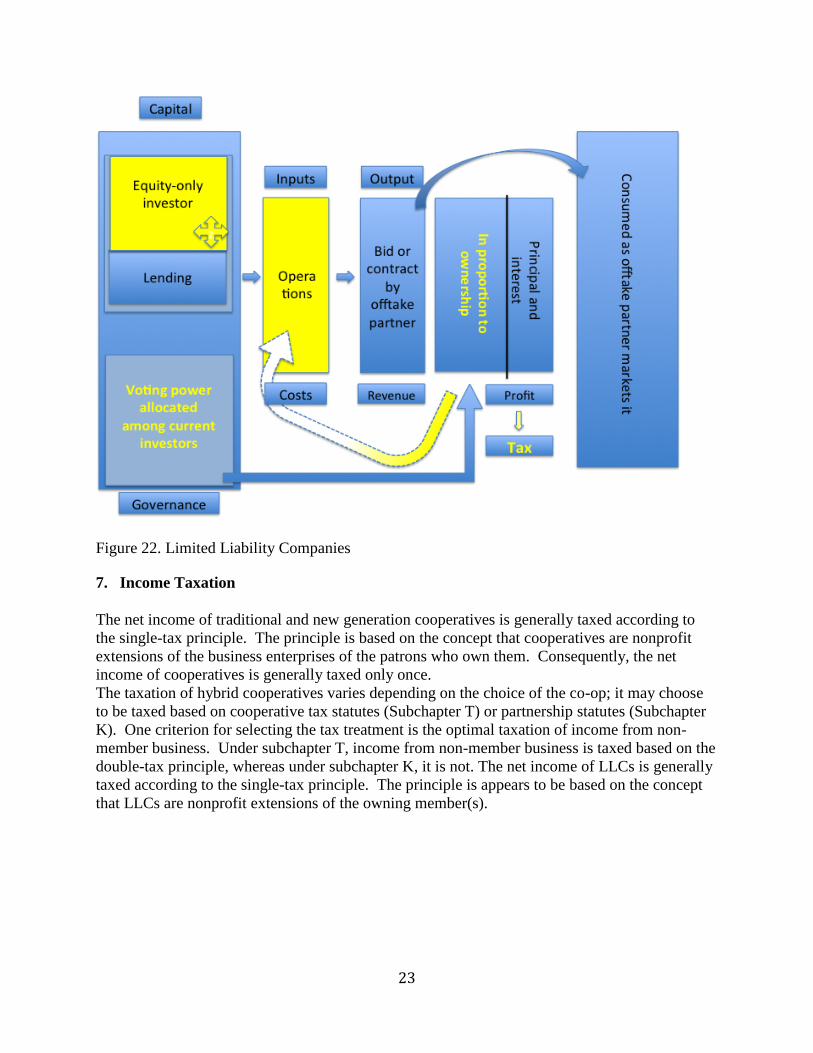
Figure 22. Limited Liability Companies
7. Income Taxation
The net income of traditional and new generation cooperatives is generally taxed according to
the single-tax principle. The principle is based on the concept that cooperatives are nonprofit
extensions of the business enterprises of the patrons who own them. Consequently, the net
income of cooperatives is generally taxed only once.
The taxation of hybrid cooperatives varies depending on the choice of the co-op; it may choose
to be taxed based on cooperative tax statutes (Subchapter T) or partnership statutes (Subchapter
K). One criterion for selecting the tax treatment is the optimal taxation of income from non-
member business. Under subchapter T, income from non-member business is taxed based on the
double-tax principle, whereas under subchapter K, it is not. The net income of LLCs is generally
taxed according to the single-tax principle. The principle is appears to be based on the concept
that LLCs are nonprofit extensions of the owning member(s).
Page 29
24
8. Facility Siting
The site of a manufacturing facility gives shape to the entire supply chain. It impacts capital and
operating costs and the ultimate success of a business. Siting is sometimes determined by a
single dominant factor while in other cases, a number of alternatives are weighed (Ballou 2002).
The goal of the nitrogen fertilizer production facility siting task is to identify siting criteria and
determine, at a high level, the existence of at least one suitable site in the northern plains, the
absence of which would raise questions about the feasibility of the entire project. The study
identified and evaluated four preliminary sites. Although no location was found to be the
obvious site for the facility, sites that meet required and preferred criteria are expected to be
readily identified during the business planning process based on the preliminary review. This
section describes general siting considerations, plant-specific requirements, a review of North
Dakota utilities and transportation infrastructure, and preliminary sites.
8.1. General Siting Considerations
The North Dakota Department of Commerce’s Shovel Ready Checklist is used to provide a
general overview of siting considerations. It includes an outline of site characteristics developers
should consider as well as activities or documents that may need to be conducted or prepared in
conjunction with site selection and development. The Checklist was developed to assist
businesses and site selectors make their decisions more quickly, correctly, and with fewer
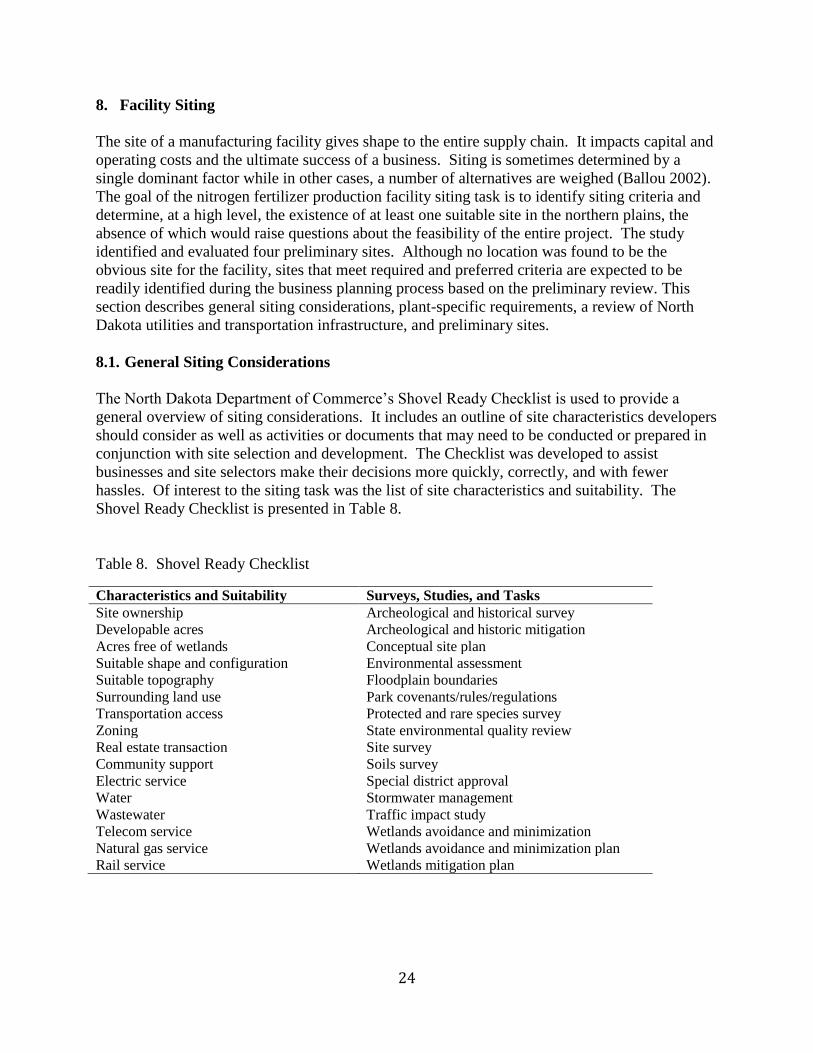
hassles. Of interest to the siting task was the list of site characteristics and suitability. The
Shovel Ready Checklist is presented in Table 8.
Table 8. Shovel Ready Checklist
Characteristics and Suitability Surveys, Studies, and Tasks
Site ownership Archeological and historical survey
Developable acres Archeological and historic mitigation
Acres free of wetlands Conceptual site plan
Suitable shape and configuration Environmental assessment
Suitable topography Floodplain boundaries
Surrounding land use Park covenants/rules/regulations
Transportation access Protected and rare species survey
Zoning State environmental quality review
Real estate transaction Site survey
Community support Soils survey
Electric service Special district approval
Water Stormwater management
Wastewater Traffic impact study
Telecom service Wetlands avoidance and minimization
Natural gas service Wetlands avoidance and minimization plan
Rail service Wetlands mitigation plan
Page 30
25
8.2. Plant-Specific Requirements
Plant-specific requirements for the nitrogen production fertilizer plant were identified
independent of the Shovel Ready Checklist. However, they align and include many of the
characteristics identified. Before discussing site selection criteria, the geographic area
considered for the siting of the plant bares mention. The northern plains nitrogen fertilizer
market targeted to be served by the facility includes North Dakota, South Dakota, western
Minnesota, eastern Montana, Manitoba, and Saskatchewan. Most nitrogen is expected to be
consumed in this region; however, unique market conditions may lead to export at times.
Consequently, siting was focused on North Dakota due to its central location in this market. In
addition, North Dakota has abundant, low-cost, and in some cases stranded natural gas (the
original motivation for the study); and significant acreage planted to nitrogen-demanding crops.
These latter two considerations provide a significant strategic advantage to locating another
nitrogen fertilizer plant in the state.
Nitrogen production plant-specific siting criteria identified include land, transportation and
utility infrastructure, and labor.
Land - The desired site is expected to as much as 160 acres (one-quarter section) in size.
This provides adequate space for construction of the initial plant and expansion that may
occur. Isolation from residential and commercial areas is preferred. Nitrogen production is
an industrial process which makes it a poor fit for non-industrial or non-agricultural areas. A
one to two-mile buffer is preferred. Flat land is desired to minimize site preparation costs.
Utility Infrastructure - Natural gas and water availability are paramount. Natural gas is the
primary feedstock for nitrogen fertilizer production and also is used as fuel for the plant. The
amount of natural gas needed is dependent on the plant’s output. A world-scale 2000 metric
ton/2200 short ton plant requires approximately 80,000 MMBTU’s daily. This is a
significant amount of feedstock that weighs siting a location in proximity to a natural gas
plant or large interstate natural gas pipeline.
Water is need as part of the fertilizer production process as well as for cooling. Water
requirements for processing and cooling vary. High-end estimates of water needs are 5,000
gallons per minute. In the absence of sufficient water supplies, electrical-powered cooling
can be utilized. Waste water disposal (up to 1,500 gallons per minute) and power line
transmission (up to 15 MVA) access also are necessary.
Transportation Infrastructure - Markets will be accessed by shipping product by highway
and rail. Rail access also is needed to move building supplies during construction.
Labor - A large workforce of up to 2,000 people will be needed to construct the plant.
Proximity to a community of 20,000 or more will aid in housing during construction and
avoidance of costly man camps.
Page 31
26
8.3. Utilities Infrastructure
Two large international natural gas pipelines -- Alliance and Northern Border -- transect North
Dakota. These pipelines historically moved natural gas from Alberta to the Chicago market.
The Viking Pipeline follows North Dakota’s eastern boundary a few miles into Minnesota. The
Williston Basin Interstate Pipeline serves much of the state of North Dakota, western South
Dakota, as well as eastern Montana and Wyoming, but ships much smaller quantities than the
Alliance, Northern Border, or Viking. Recent development of the Bakken formation in western
North Dakota has led to the release or collection of large amounts of associated gas. This has led
to the expansion or construction of natural gas plants in the area which use the Alliance and
Northern Border to reach market. A map of major international natural gas pipelines is presented
in Figure 23.
Ground and surface water is available in many areas of the state. However, few locations have
adequate supplies available to meet the process and cooling requirements of a world-scale
nitrogen fertilizer production plant. Even if water is available, use is permitted by the State
Water Commission and much of the water has already been secured for various municipal,
agricultural, and industrial purposes. A map of North Dakota glacial aquifers is presented in
Figure 24. Also shown on the map is the location of the Missouri River which is home to more
than 80 percent of the state’s surface flow. The Red River, which forms the eastern border of
much of the state, also is sizable, although much of its available water is already spoken for by
municipalities and industry.
As a major power generation state, North Dakota is transected by a number of major and minor
power transmission lines some of which correspond to highway and rail corridors. This
alleviates concern for power availability, somewhat. Figure 25 shows the location of major
power transmission lines in the state and nation.
Page 32
27
Figure 23. Northern Plains Natural Gas Pipelines (International)
Page 33
28
Source: North Dakota Water Commission
Figure 24. North Dakota Glacial Aquifers
Source: Energy Information Administration
Figure 25. U.S. Power Transmission Network
Page 34
29
8.4. Transportation Infrastructure
Highway and rail infrastructure is needed to deliver building materials to the site and to transport
nitrogen products to market. As most fertilizer is expected to be sold within the region, highway
access is critical. While location on an interstate or interregional highway is not mandatory, it
would reduce concerns about road conditions and maintenance. North Dakota’s State Highway
Performance Classification System is presented in Figure 26. Interstate highways appear in red
and interregional highways in blue. Double lines indicate four-lane highways.
Many North Dakota locations are served by the Burlington Northern Santa Fe (BNSF) or
the Canadian Pacific (CP) railroad. These railroads align with many of the state’s highway
corridors. A map of these systems is presented in Figure 27 with the Canadian Pacific being the
lighter shaded line.
Source: North Dakota Department of Transportation
Figure 26. North Dakota State Highway Performance Classification System
Page 35
30
Figure 27. Burlington Northern Santa Fe and Canadian Pacific Rail Lines
8.5. Preliminary sites
Four preliminary sites were identified as part of the feasibility analysis prior to and during the
application of siting criteria.
Dakota Gasification, Beulah, North Dakota – is the location of the state’s only existing
nitrogen fertilizer plant. The coal gasification complex has a 400,000 ton per year ammonia
production capacity. The complex also captures and ships CO2. The site is located adjacent to
the Bakken play making construction costs and labor availability a major concern while
providing immediate access to natural gas. There is limited room for adjacent to the site for
development. The site is served by the Burlington Northern Santa Fe Railroad and is located on
North Dakota Highway 49 and just south of North Dakota Highway 200. The Missouri River is
located 20 miles to the east.
Spiritwood Energy Park, Stutsman County, North Dakota – is the location of Great River
Energy’s new 99 MW coal-powered plant just south of the Burlington Northern Santa Fe
mainline and 10 miles east of Jamestown on Interstate 94. The Alliance natural gas pipeline
comes closest to the site near Wimbledon 15 miles northeast. The location is above the
Spiritwood aquifer which currently supplies the nearby Cargill malting facility.
Hankinson, North Dakota – was initially identified because of its location on the Alliance
Pipeline, the only delivery point in North Dakota. The city is located on the Canadian Pacific
mainline and just a few miles west of Interstate 29. Wahpeton is 25 miles northwest and Fargo is
Page 36
31
60 miles north. Water may be available from the Hankinson Aquifer, Milnor Channel, or
Brightwood Aquifer.
Nashua, Minnesota – was identified because of its location near an intersection of the
Burlington Northern Santa Fe and Canadian Pacific railroads which coincides with Minnesota
Highways 9 and 55. The undeveloped location is approximately 70 miles southeast of the Fargo-
Moorhead Metropolitan Area and 25 miles away from the nearest cities of Wahpeton, North
Dakota, and Fergus Falls, Minnesota. The area is 50 miles south of the Viking pipeline and 30
miles northeast of the Alliance pipeline.
8.6. Summary of Siting Considerations and Next Steps
While no site was officially identified, a number of prospective spots were reviewed. Water
availability may play a key role in finding the ultimate location. The next step will be to work
with the North Dakota Department of Commerce, other state agencies, and local economic
development agencies to review sites in greater detail.
Page 37
32
9. Summary of Findings
The crop mix of the northern plains is not likely to change dramatically in the next several
decades and the associated use of nitrogen fertilizer is more likely to increase than it is to remain
stable or decrease. Nitrogen is being used to meet increased food, feed, and energy demand.
Nitrogen wholesalers expect an ongoing transition away from anhydrous ammonia use due to
issues of safety and environmental impact. Natural gas is a key component in the manufacture of
nitrogen fertilizer and it is currently the lowest cost source of hydrogen for ammonia production.
Since oil and gas drilling in North Dakota is expected to continue for years with production
lasting decades, the availability of natural gas in the northern plains will be stable into the future.
Few studies have conducted research on the economics of flared gas collection. The market price
of capturing and processing flared gas is not yet established but there is opportunity to work, and
possibly partner with natural gas companies to predict long-term prices and lay-in a long-term
supply to manufacture fertilizer. Despite the significant capital and expertise required, oil and
gas companies are finding a way to collect and clean the gas associated with oil production.
They are planning to build gas gathering pipelines and processing plants in western North
Dakota (Bentek Energy, 2012).
A fertilizer production facility located near an area where the fertilizer is consumed creates a
competitive advantage in transportation cost. The technology to manufacture fertilizer is proven
and commercially available. There may be an opportunity to manufacture several related
industrial products. The northern plains offers necessary infrastructure and business resources,
such as natural gas pipelines, rail, interstate highways, brown field and green field industrial
sites, off-take partners, manufacturing partners, natural gas supply partners, lenders who are
willing to consider providing debt capital, and agricultural producers throughout the region who
may be willing to invest equity as well as purchase the final fertilizer product.
Our feasibility study shows that a start-up business can manufacture fertilizer at a competitive
cost. The technological economies of scale suggest a relatively large scale facility. Due to the
surplus of natural gas supply and low natural gas prices in the United States, it is highly likely
that additional fertilizer manufacturing capacity will be built in North Dakota and other states.
Expansion of existing facilities in other states and provinces has already been announced.
A fertilizer manufacturing business needs to develop a long-term vision and prepare for times
when fertilizer prices decline and natural gas prices increase. Supply and price risks are of
concern to nitrogen marketers and farmers. Long-term supply (natural gas) contract and off-take
partners will reduce the risks. It may take four years of construction time to begin manufacturing
nitrogen fertilizer. A new generation cooperative as well as a hybrid cooperative may offer tax
advantages over other business models. For example, CALAMCO, a California-based ammonia
production and marketing new generation cooperative, has been successful. There is a need to
work closely with producers to understand their willingness to invest equity as well as commit to
the purchase of the final fertilizer products. Prioritization of goals, including profitability,
governance, and consumption, can be used to identify the appropriate business model.
Subsequent business planning with accountants, attorneys and other professionals will test each
of these points.
Page 38
33
References
Ballou. R. 2003. Business Logistics Management. Prentice Hall, New York City.
Bentek Energy. 2012. The Williston Basin: Greasing the Gears for Growth in North Dakota.
Available at:
http://ndpipelines.files.wordpress.com/2012/07/bentek-nat-gas-study-july-25-2012.pdf
Blanton, R.E. 2010. Environmentally and Economically Beneficial Flare Gas Recovery Projects
in Petrochemical Facilities. Available at: http://www.johnzink.com/wp-content/uploads/NPRA-
2010-Environmental-Conference-Paper.pdf
Kramer, D. A. 2004. Mineral Commodity Profiles: Nitrogen. US Department of Interior and
Geological Survey. Available at: http://pubs.usgs.gov/of/2004/1290/2004-1290.pdf
Global Gas Flaring Reduction Public-Private Partnership (GGFR). 2005. Gas Flaring Reduction
Projects Framework for Clean Development: Mechanism (CDM) Baseline Methodologies.
Available at:
http://siteresources.worldbank.org/INTGGFR/Resources/gfrmethodologyno6revised.pdf
Netzer, D. 2006. Alberta Bitumen Processing Integration Study. Available at:
http://www.assembly.ab.ca/lao/library/egovdocs/2006/alet/158261.pdf
North Dakota Department of Mineral Resources (NDDMR). 2011. Rules and Regulations.
Available at: https://www.dmr.nd.gov/oilgas/rules/rulebook.pdf
PFC Energy. 2007. Using Russia’s Associated Gas. Available at:
http://siteresources.worldbank.org/INTGGFR/Resources/pfc_energy_report_appendices.pdf
United States Energy Information Administration (USEIA). 2010. Levelized Cost of New
Generation Resources in the Annual Energy Outlook 2011.
Available at: http://www.eia.gov/oiaf/aeo/electricity_generation.html
United States Energy Information Administration (USEIA). 2011. Today in Energy. Available
at: http://www.eia.gov/todayinenergy/detail.cfm?id=4030
United States Environmental Protection Agency (USEPA). 1991. Industrial Flares. Available at:
http://www.epa.gov/ttnchie1/ap42/ch13/final/c13s05.pdf
United States Environmental Protection Agency (USEPA). 1996. Background Report.
Available at: http://www.epa.gov/ttn/chief/ap42/ch08/bgdocs/b08s01.pdf