Page 1
Inland Empire Forecast for SCAG Page 1
Economics & Politics, Inc. 961 Creek View Lane
Redlands, CA 92373
(909) 307-9444 Phone
(909) 748-0620 FAX
[email protected]
www.johnhusing.com
SCAG Economic Conference Preparation Report
Inland Empire
John E. Husing, Ph.D.
I. Economic Recovery
A. Forecast & Justification
It is unlikely that the Inland Empire will return to normal until at least the 2016-2017
period that has been previously estimated as part of the SCAG economic forecasting
process. During the Great Recession from 2008-2010, the inland area lost 146,425 jobs.
In 2011, a slight recovery occurred with 4,663 jobs added back. In 2012, another 23,026
were added, bringing the total to 27,489. As a result, this year began with only 18.8% of
the jobs lost in the deep recession having been recovered.
This economist’s forecast for 2013 was that the economy would add 28,300 jobs taking
the recovery to 38.1% of the lost jobs. From January-August of this year, the California
Employment Development Department (EDD) has estimated that an average of just
15,363 jobs have been recovered. However, their estimate appears to be wildly
inaccurate. There are three reasons for saying this:
Throughout this year, EDD has estimated that construction employment is in
decline with the average drop for the last three months averaging -4,900 jobs.
That is highly unlikely given that the number of permits for new homes was up
55.5% in the first six months of this year versus last, and the total value of all
construction permits was up 27.6%. Also, 2013 began with a very low new home
inventory, yet through the first three quarters of the year, sales were up 33.9%. It
is likely that the revisions will show growing, not shrinking, construction
employment.
To date in 2013, EDD has also estimated that employment agency job levels have
fallen. This includes the last three months with the agency indicating the sector
was off -3,267 jobs from last year. Again, it would be unprecedented for these
agencies to see their activity shrinking when the economy is at the beginning of
its turnaround phase. Again, it is likely the revisions will show employment
agency jobs have been growing not shrinking.
Importantly, the U.S. Bureau of Labor Statistics (BLS) indicates that as of March
2013, the Inland Empire’s wage and salary employment was up 33,673 jobs or
2.9% over that period of 2011. At that time, EDD showed the area up 21,513 jobs
or 1.9%. Since EDD must ultimately revise their job levels to meet the BLS
figures, this underscores the likelihood that EDD’s methodology is severely
underestimating the behavior of the inland economy.
Page 2
Inland Empire Forecast for SCAG Page 2
As a result, this analyst’s instinct is that the forecasted 28,300 job gain is probable. This
is the case due to the apparent inaccuracy of EDD’s monthly estimates, the very high
estimates for early 2013 from BLS and the fact that job growth has probably slowed from
BLS’s early figures as the year has progressed.
If this scenario occurs, it would take the addition of an average of 30,212 jobs per year in
2014, 2015 and 2016 for the area to gain back the full 146,425 jobs lost to the Great
Recession. That appears quite possible. It would take 22,659 a year in 2014-2017 to
have it regain the lost jobs by 2017. At the moment, that would appear to be an awfully
weak performance.
If the return to normalcy is defined to include the need to make up for the fact that the
Inland Empire’s labor force and thus its need for jobs has grown since 2010, the 2017
date appears to represent a realistic recovery date.
B. Economic Challenges To Full Recovery
For the Inland Empire, the key to a recovery will be the continued expansion of its
traditional economic base. Here, the sectors that must grow include logistics, health care
and construction. It would be helpful if manufacturing could join this group, but that is
less likely due the high energy costs and heavy regulatory burden faced by that sector in
California and Southern California.
These sectors are crucial as each one brings money from the outside world into the local
market. The logistics and manufacturing sectors do so because their customers are largely
located throughout the state, the country and the world. Health care brings in funds
because the sector is largely funded through federal or state programs or by medical
insurance companies. Construction does to because projects are funded either by
governmental grants or loanable funds flowing to local contractors and workers from the
national mortgage market.
Each of these four sectors faces issues:
1. Logistics has been the Inland Empire’s fastest growing sector and has strong
basics. However, the South Coast Air Quality Management District together with
local activists wants to stop its growth. A major fight is therefore brewing that
could halt the sector’s continued expansion.
2. Health Care is the one sector that grew throughout the recession. There is a huge
need in the inland area given that each local health care worker handles 35% more
people than the state average. Also, the sector could see a major need to expand
given the 20.5% of the local population without health insurance. The opening of
the UCR Medical School will help. That said, the major issue facing the sector is
the lack of local training capacity for the host of skilled and semi-skilled workers
who would constitute the sector’s new hires.
Page 3
Inland Empire Forecast for SCAG Page 3
3. Construction is the sector that must return to something near to normal for the
Inland Empire’s economy to regain its past vigor. There are host of reasons why
this should happen, beginning with the lack of housing affordability in the coastal
counties that is already pricing thousands of families out of those markets. As in
the past, this will ultimately send people inland to find homes they can afford.
The speed at which this will occur however could be blunted by lack of available
financing, an anticipated increase in interest rates and the low level of consumer
confidence that continues to plague markets.
4. Manufacturing should be a major growing sector in the Inland Empire as both
space and labor costs in the market are below other Southern California areas.
This is particularly true given the recent resurgence in manufacturing employment
nationally. However, local firms are tending to increase efficiency rather than to
hire workers because California’s regulatory policies have pushed energy levels
far beyond what competitors pay in other states. That fact, plus regulatory costs
and delays means firms must save on labor to maintain their profitability.
These challenges will make a return to normal more difficult than it otherwise should be.
However, this economist believes enough of them will be overcome to allow the region
to regain the jobs lost to the recession by 2016, and allow sufficient expansion to make
up for its growing labor force by 2017.
II. Key Growth Industries More Thoroughly Discussed
A. Key Existing Industries
1. Logistics. The Inland Empire’s logistics industry is driven by two major factors:
International Trade. The volume of international trade moving through the
ports of Los Angeles and Long Beach has been the traditional driver of the sector
(Exhibit 1). On the import side, loaded containers entering the U.S. soared to 8.2
million twenty foot container units (teus) in 2006. The volume declined roughly
25% to 6.0 million teus in 2009 due to the Great Recession. It has subsequently
recovered and is on track as of September 2013 to reach 7.4 million teus for the
year. That would be the third highest volume.
Page 4
Inland Empire Forecast for SCAG Page 4
Exported load containers are less of a driver for the Inland Empire. However,
they reached a record 3.6 million teus in 2012 and are on track to be just below
that level at 3.5 million in 2013. This activity could represent a future role for the
region as immigrant manufacturers choose to locate near the ports and because of
the importance of the Coachella Valley’s farmers to exports.
The facilities for handling this type of activity for international supply chain work
are getting larger and larger due to the technology. The number of square feet per
job is thus running between 3,000 and 3,500 square feet.
Fulfillment Centers. The newest phenomenon impacting the Inland Empire’s
logistics sector is the entry into California of fulfillment centers. Seven of 17
firms looking for inland space in first quarter 2013 were for this use. These
facilities are being developed for retailers so they can respond to the increasing
use of the internet by consumers. The goal is 24-hour delivery. They are
generally 500,000 to over 1,000,000 square feet in size and use from 1,000 to
1,250 square feet per job as the work is labor intensive. That is close to the land
use ratios found with manufacturing.
Another aspect of fulfillment centers is their retail sales tax potential for the cities
where they locate. A one million square foot facility, conservatively assuming
50% of sales are to non-Californians, will generate about $5 million a year to a
municipal government. That assumes the firm’s sales per square foot are 75% of
the Amazon.com average.
Forecast. Based upon growth through the first eight months of 2013 (4.3%), the
logistics sector will add 5,000 for the full year. However, this is a conservative
figure as it does not include the holiday rush when both trade and fulfillment
employment tends to accelerate. There is good reason to believe that the
combination of these two activities will cause the sector to add 5,000-7,500 jobs
per year for the next several years.
Page 5
Inland Empire Forecast for SCAG Page 5
Cautions. This forecast could be hurt since the South Coast Air Quality
Management District has targeted logistics to slow its growth. Also, the opening
of the Panama Canal will impact volumes to an indeterminate degree.
2. Health Care. Three factors will drive the demand for health care in the Inland
Empire and the resulting employment level:
Population Growth. For the past few years, the recession has restrained
residential development and therefore population growth in the inland area
(Exhibit 3). From 2000-2001 through 2005-2006, the inland counties added over
100,000 people a year with domestic in-migration responsible for over 60,000
new residents. First soaring home prices and then the Great Recession changed
this picture dramatically. Annual growth fell to an average of around 40,000,
with domestic net migration essentially at zero. This is poised to change with the
slow recovery of Southern California’s economy, and the fact that the share of
families in Orange (32%), San Diego (32%) and Los Angeles (37%) counties who
can afford a local home has already fallen to 32% to 37% in contrast to 56% in
the Inland Empire.
As more aggressive population in the Inland Empire resumes, the demand for
health professionals will rise.
Obamacare. In 2012, the American Community Survey found that 20.5% of the
Inland Empire’s residents had no health insurance. If the program is successful,
this fact means there will be a significant increase in the demand for health care
professionals and semi-professionals. Interviews with executives at local clinics
and hospitals indicates that they are gearing up for this to occur. In particular,
they anticipate that ambulatory care facilities (out-patient) will see the bulk of the
increased demand.
Health Care Workers Per Capita. While demand for health care will
undoubtedly rise in the inland counties, it is a fact that the region is already
Page 6
Inland Empire Forecast for SCAG Page 6
underserved. In 2012, there were 28.6 people for each health care worker in
California (Exhibit 4). In the Inland Empire, it was 38.5. The region thus had
34.5% more people for each health care worker. Even without population growth
or Obamacare, the area already has more potential demand for care than workers
supplying it. That alone will be a source of increase demand for workers going
forward as seen in that the ratio has been slowly declining.
Forecast. Starting in 2007, the Inland Empire’s health care sector has grown at
an average of roughly 3,000 jobs per year except in 2009 in reaction to the severe
downturn and in 2013 as the sector has been thinking through how to respond to
the Affordable Health Care Act. Given the discussion above, that could well be a
lower estimate of its near term growth.
Caution. The key worry for health care providers is the lack of training
infrastructure to give them the semi-professionals they will need to keep up with
the potential for rocketing demand. UCR Medical School will help with doctors,
but it is the need for all levels of nurses and technicians that will inhibit the ability
of the sector to expand its employment to meet demand.
Page 7
Inland Empire Forecast for SCAG Page 7
3. Construction. For the Inland Empire, the missing link in the recovery to date has
been its construction sector. Including the job growth in 2011 and 2012, the wage
and salary economy was down by -118,200 jobs. Alone, the construction sector was
off by -66,300 jobs by then or 56.1% of the difficulty facing the market:
Permits. The difficulty shows up in looking at the decline the value of
construction permits applied for by all types of developers (Exhibit 6). These
peaked at $12.5 billion in 2005 and were down to $2.1 billion in 2011, off
-82.8%. Permit requests have subsequently begun growing. Based upon the first
six months of 2013, they should reach $3.5 billion this year. However, that is still
off by-71.8%.
Housing. The major problem for the construction sector has been the decline in
residential activity (Exhibit 7). The value of single family permits fell from $9.2
billion in 2005 to $0.9 billion in 2011. That was a -90.5% decline. It is only back
to an estimated $2.0 billion for 2013, still off -77.9%. Other metrics for this
sector are shown in the review of the housing market below.
Page 8
Inland Empire Forecast for SCAG Page 8
Non-Residential Construction. Non-residential activity (including multitenant)
has been an issue but less than for single family housing. Permit volume fell from
a peak of $3.5 billion in 2006 to a low of $1.0 billion in 2009, down -72.3%. In
2013, it is estimated at $1.4 billion, still down -62.3%. Here, the issues are seen
in the metrics for some of the non-residential sectors:
o Industrial vacancy of 5.6% v. the historical average of 7.9%. This segment
has the highest construction level in the U.S.
o Office vacancy of 19.4% v. a low of 7.0% in 2003. This segment is showing a
little activity but generally is in the doldrums.
o Retail vacancy of 10.4% v. 8.8% in 2009. This segment is not yet ready for
expansion though retail activity has begun to come back.
o Apartment vacancy rate 5.9% v. 4.3% in 2004. This segment is building
again in response to a lack of available homes for sale.
Forecast. Employment data shows the extreme difficulty that the construction
sector has endured since 2007 when high prices first began to shut it down. In
2012, the first signs of growth appeared. If EDD is to be believed, it is shrinking
again this year. However, given the permit data outlined above, as well as
stronger metrics for housing that are shown below plus interviews with executives
in the field, the agency’s data cannot be accurate.
It is this economist’s view that this sector is likely to increase as much as 3,500
jobs this year. That is based upon the 2,200 job growth in 2012 when the sector
was in much weaker shape than it is in 2013. Looking ahead, it is very likely that
growth will reach as much as 5,000 jobs a year in the near term as the markets
begin to recover.
Page 9
Inland Empire Forecast for SCAG Page 9
Two additional facts that run counter to popular wisdom among planners, will
also likely drive the Inland Empire’s housing markets in years to come. Over a
five year period, the Western Riverside Council of Governments twice
interviewed commuters driving from that county to Los Angeles, Orange and San
Diego. The responses to two questions were quite revealing:
1. As a homeowner, would you prefer to move closer to work if it
involved a townhouse or condo? Answer: 87.5% said NO.
2. As a renter would you prefer to move closer to work if it involved a
townhouse or condo? Answer: 72.3% said NO.
Like it or not, when asked, the kind of people who have moved to the Inland
Empire have revealed a strong preference for single family detached homes.
Caution. There continues to be a host of issues facing the rejuvenation of the
Inland Empire’s construction sector. In the residential market, people continue to
face difficulties in obtaining financing whether due to higher credit standards,
previous foreclosure or short sale issues or low appraisals. They will also hesitate
buying homes until convinced that a sustained Southern California recovery is
underway. Recovery has started but remains muted. The multitenant market is
growing as many families cannot obtain financing for single family homes.
Industrial construction will remain a force given the demand for facilities because
of rising international trade and e-commerce/fulfillment needs. Public
construction should remain constant because both inland counties are have passed
local sales tax measures for street and road construction.
Office construction will lag until a resurgence in demand occurs. That will
require office based operations that retrenched in the Great Recession are willing
to return to the inland area. Retail construction will not start again until inflation
adjusted taxable sales volume gets back to its peak. Currently, sales are 12.7%
below that level.
4. Manufacturing. For the Inland Empire, the manufacturing sector represents a
missed opportunity. There are three reasons for this:
National v. State Manufacturing Growth. While international competition and
lower costs in countries like China and India have generally hurt the
manufacturing in the U.S., some resurgence is underway. This is occurring as
some firms have been hurt because they lost control of the quality of production.
Meanwhile, Chinese labor in particular has become more expensive, reducing the
incentive to maintain production there.
Here, the data show that U.S. seasonally adjusted manufacturing employment rose
by 503,000 jobs from January 2010 to September 2013 (Exhibit 9). That
represented a 4.4% growth rate over that period of time. However in that period,
Page 10
Inland Empire Forecast for SCAG Page 10
California added just 10,800 jobs, a 0.9% growth rate. When asked about these
data, the state’s economic development group (Go-Biz) responded that despite the
lack of job growth, the state’s manufacturing output grew rapidly. However, this
begs the question of why it is good to see output up with minimal benefit to the
state’s workers.
Energy Costs. There is no question that California has put in place strong
policies aimed at increasing the state’s use of renewable energy. For
manufacturers, the problem is that this has sent electrical costs soaring, making
them uncompetitive versus nearby states (Exhibit 10). Thus, Southern California
Edison charged 9.01¢ per kilowatt hour to meet industrial electricity demand in
the Inland Empire in 2011. That ranged from 15.1% higher than Phoenix (7.83¢)
to 83.1% higher than Salt Lake City (4.92¢).
Regulatory Climate. Meanwhile, Southern California’s regulatory climate has
negatively impacted its manufacturing sector in several ways. First, because the
Page 11
Inland Empire Forecast for SCAG Page 11
South Coast Air Quality Management District (AQMD) rule making is a non-stop
affair. It has made it very difficult for companies in places like the Inland Empire
to understand their cost structures in any realistic time horizon. As firms typically
invest with looking at least five years ahead, this inhibits local expansions.
Second, firms find they are often layered with regulatory costs because they must
install new pollution control technologies as soon as the agency requires them to
do so. Often, this before they have paid for the last round of required technology.
An example of the uncertainty that AQMD injects into the manufacturing process
is seen in the agency’s contention that it must “electrify” the basin to meet its air
quality mandates. To manufacturers, this means having to consider having to use
electricity even when natural gas, for which Southern California has a competitive
advantage, is available. In 2011, Southern California Gas was offering natural
gas to industrial users at an average of 6.55¢ per 1,000 cubic feet (Exhibit 11).
That ranged from 35.8% cheaper than Seattle (10.21¢) to 1.8% below Portland
(6.67¢). Only Denver (6.54¢) and Salt Lake City (5.47¢) were more competitive.
Forecast. Given these facts, the prognosis for manufacturing job growth in the
Inland Empire is unfortunately very weak. Since 2000, the sector has had a net
loss of -30,200 jobs. With the Great Recession over, the sector has essentially
been flat, adding no jobs in 2011, 1,400 in 2012 and losing -1,500 in 2013
(Exhibit 12). In talks with manufacturing executives, it is difficult to find a
scenario that will improve what should be a strong sector for the Inland Empire.
Here, a typical response came from a heavy aerospace manufacturer. Their
processes require precision work by machine shops that should be located nearby.
Instead, they remain scatter throughout Southern California because the owners
are unwilling to move because it would invoke dealing with AQMD.
Page 12
Inland Empire Forecast for SCAG Page 12
Caution. There is a remote scenario under which the manufacturing sector could
expand. This is because of the competitive advantages the sector does have vis-à-
vis the balance of Southern California. Two factors illustrate this:
1. Lower Pay. For occupations paying under $70,000 a year, inland firms are
able to find workers willing to work from 2.55% to 5.81% less than in Los
Angeles and Orange counties respectively (Exhibit 13). This is logical in that
20.6% of the workforce commutes to the coastal counties and will work for a
little less to avoiding having to do so.
2. Low Space Cost. Industrial facilities in the coastal counties ranging from
84.2% to 156.6% more expensive than in the Inland Empire (Exhibit 14).
Page 13
Inland Empire Forecast for SCAG Page 13
That is the case because the $0.38 per square foot a month in the inland area acts
like $0.30 because the facilities are newer and taller. There is thus a cubic space
premium when compared to the more expensive and older space in the coastal
counties: Los Angeles ($0.56), Orange ($0.63) and San Diego ($0.78).
These competitive advantages may still cause some manufacturing growth in the
Inland Empire. In any case, it will be subdued.
5. Other Sectors. It is difficult to see any other sectors driving the Inland Empire’s
economic base in a major way because of the educational level of the great mass of the
area’s labor force. There will ultimately be significant growth in population-serving
sectors like retailing and eating and drinking, but that will be a reaction to the funds
flowing inland because of the expansion of the sectors discussed above. Also, there will
be growth in sectors related to construction once that sector reemerges. That is the case
because its growth will impact finance, insurance and real estate activity as well as civil
engineering. But again, these are not the portions of the region’s economy that are
driving its base. They are a reaction growth within it.
III. Occupational & Industry Pay
A. Occupations
1. From 2010-2020, EDD forecasts that 31 Inland Empire occupations will each add
1,500 or more jobs (Exhibit 15, next page). To summarize the forecasts for them:
Together, they will go from 507,690 jobs in 2010 to 617,900 in 2020, a gain of
110,210 positions or 21.7%.
The jobs in these sectors will represent 52.9% of the forecasted total employment
gain in the Inland Empire from 2010-2020.
The bulk of the jobs in these sectors will pay from $30,000 to $39,999.
The largest share of jobs will require less than a high school education.
The largest share of occupations will require only short term on-the-job training.
While the main sectors responsible for these 31 occupations are quite diverse, the
largest group are most often associated with logistics (7 of 31) and eating &
drinking (6 of 31).
2. With the exception of 31st ranked laborers, construction occupations are missing
from EDD’s prediction of major growing occupations from 2010-2020. This
economist believes that is over-predicting the existing economy and that the sector
will be a major force for employment in the decade to come.
3. It is not a surprise that manufacturing occupations are completely absent from the list.
This is an important negative factor for the Inland Empire’s economic future.
Page 14
Inland Empire Forecast for SCAG Page 14
Exhibit 15.-Occupations with 1,500 or More Job Growth, Inland Empire, 2010-2020 SOC
Code Occupational Title 2010 2020 Growth
Median
Annual
Entry Level
Education
Work
Experience
On-the-Job
Training Main Sector
412031 Retail Salespersons 42,760 53,630 10,870 $21,003 Less Than HS None ST OJT Retail
399021 Personal Care Aides 22,760 31,530 8,770 $19,379 Less Than HS None ST OJT Other Service
537062 Laborers and Freight, Stock, and Material
Movers, Hand 31,230 39,620 8,390 $24,727 Less Than HS None ST OJT Logistics
353021 Combined Food Preparation and Serving
Workers, Including Fast Food 27,850 34,750 6,900 $18,863 Less Than HS None ST OJT Eating & Drinking
412011 Cashiers 32,250 38,770 6,520 $20,134 Less Than HS None ST OJT Retail
533032 Heavy and Tractor-Trailer Truck Drivers 22,530 28,960 6,430 $40,243 High School 1-5 years ST OJT Logistics
291141 Registered Nurses 22,160 27,100 4,940 $81,242 Associates None None Health Care
353031 Waiters and Waitresses 18,400 22,390 3,990 $18,623 Less Than HS None ST OJT Eating & Drinking
435081 Stock Clerks and Order Fillers 22,090 25,720 3,630 $22,892 Less Than HS None ST OJT Logistics
439061 Office Clerks, General 24,090 27,700 3,610 $30,368 High School None ST OJT Office Work
373011 Landscaping and Groundskeeping Workers 16,440 19,840 3,400 $23,443 Less Than HS None ST OJT Other Service
352011 Cooks, Fast Food 11,610 14,610 3,000 $18,663 Less Than HS None ST OJT Eating & Drinking
252021 Elementary School Teachers, Except Special
Education 21,010 23,890 2,880 $70,241 Bachelors None Internship Education
434051 Customer Service Representatives 15,230 17,930 2,700 $33,569 High School None ST OJT Sales
311011 Home Health Aides 5,000 7,690 2,690 $20,204 Less Than HS None ST OJT Health Care
411011 First-Line Supervisors of Retail Sales
Workers 16,780 19,350 2,570 $39,434 High School 1-5 years None Retail
339032 Security Guards 12,280 14,740 2,460 $21,754 High School None ST OJT Other Service
431011 First-Line Supervisors of Office and
Administrative Support Workers 14,010 16,310 2,300 $50,283 High School 1-5 years None Office Work
436013 Medical Secretaries 6,780 8,930 2,150 $29,463 High School None MT OJT Health Care
414012
Sales Representatives, Wholesale and
Manufacturing, Except Technical and
Scientific Products 9,230 11,310 2,080 $53,024 High School None MT OJT Logistics
351012 First-Line Supervisors of Food Preparation
and Serving Workers 8,820 10,840 2,020 $25,629 High School 1-5 years None Eating & Drinking
352014 Cooks, Restaurant 9,050 11,060 2,010 $23,325 Less Than HS <1 year MT OJT Eating & Drinking
372011 Janitors and Cleaners, Except Maids and
Housekeeping Cleaners 17,120 19,110 1,990 $23,831 Less Than HS None ST OJT Other Service
433031 Bookkeeping, Accounting, and Auditing
Clerks 13,430 15,360 1,930 $36,933 High School None MT OJT Office Work
537064 Packers and Packagers, Hand 9,970 11,880 1,910 $19,966 Less Than HS None ST OJT Logistics
537051 Industrial Truck and Tractor Operators 7,810 9,660 1,850 $31,269 Less Than HS <1 year ST OJT Logistics
533033 Light Truck or Delivery Services Drivers 9,880 11,670 1,790 $29,961 High School None ST OJT Logistics
311014 Nursing Aides, Orderlies, and Attendants 9,250 10,970 1,720 $24,718 Post Secondary None None Health Care
352021 Food Preparation Workers 9,060 10,660 1,600 $19,226 Less Than HS None ST OJT Eating & Drinking
319092 Medical Assistants 6,940 8,540 1,600 $27,168 High School None MT OJT Health Care
472061 Construction Laborers 11,870 13,380 1,510 $37,239 Less Than HS None ST OJT Construction
SUMMARY 507,690 617,900 110,210 $30K<$40K Less Than HS None ST OJT Logistics
Source: Standard Occupational Code descriptions and forecasts,, CA Employment Development Department
Page 15
Inland Empire Forecast for SCAG Page 15
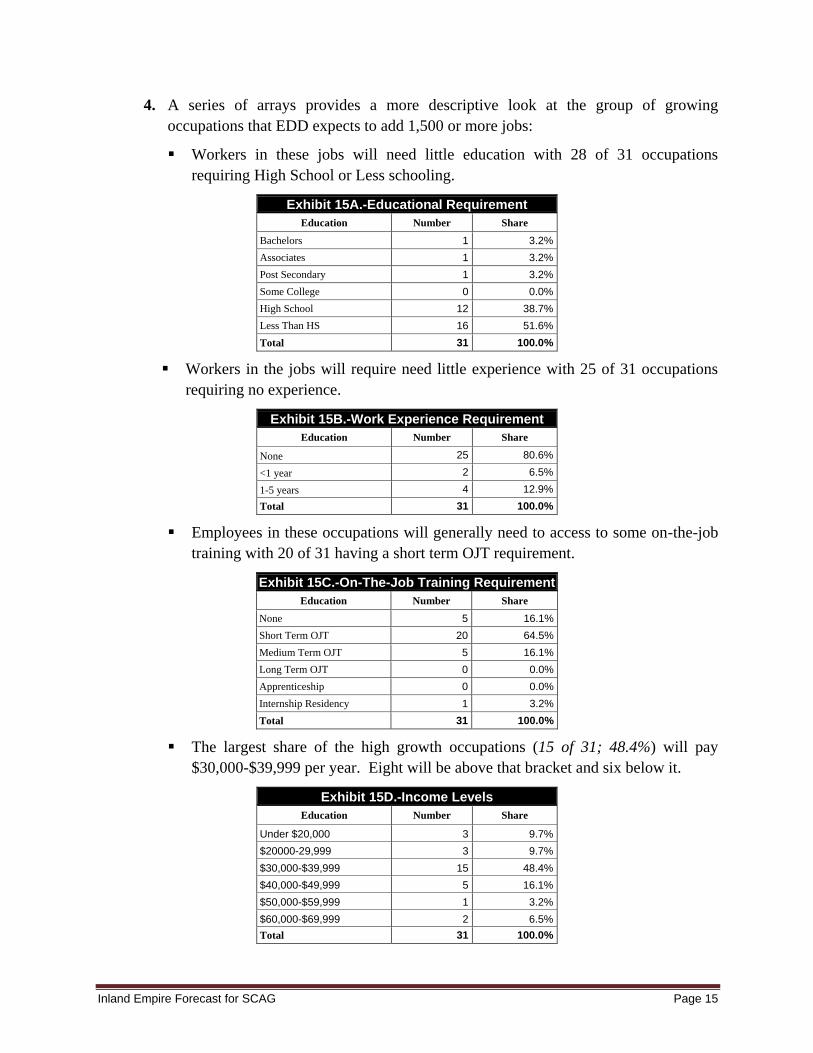
4. A series of arrays provides a more descriptive look at the group of growing
occupations that EDD expects to add 1,500 or more jobs:
Workers in these jobs will need little education with 28 of 31 occupations
requiring High School or Less schooling.
Exhibit 15A.-Educational Requirement
Education Number Share
Bachelors 1 3.2%
Associates 1 3.2%
Post Secondary 1 3.2%
Some College 0 0.0%
High School 12 38.7%
Less Than HS 16 51.6%
Total 31 100.0%
Workers in the jobs will require need little experience with 25 of 31 occupations
requiring no experience.
Exhibit 15B.-Work Experience Requirement
Education Number Share
None 25 80.6%
<1 year 2 6.5%
1-5 years 4 12.9%
Total 31 100.0%
Employees in these occupations will generally need to access to some on-the-job
training with 20 of 31 having a short term OJT requirement.
Exhibit 15C.-On-The-Job Training Requirement
Education Number Share
None 5 16.1%
Short Term OJT 20 64.5%
Medium Term OJT 5 16.1%
Long Term OJT 0 0.0%
Apprenticeship 0 0.0%
Internship Residency 1 3.2%
Total 31 100.0%
The largest share of the high growth occupations (15 of 31; 48.4%) will pay
$30,000-$39,999 per year. Eight will be above that bracket and six below it.
Exhibit 15D.-Income Levels
Education Number Share
Under $20,000 3 9.7%
$20000-29,999 3 9.7%
$30,000-$39,999 15 48.4%
$40,000-$49,999 5 16.1%
$50,000-$59,999 1 3.2%
$60,000-$69,999 2 6.5%
Total 31 100.0%
Page 16
Inland Empire Forecast for SCAG Page 16
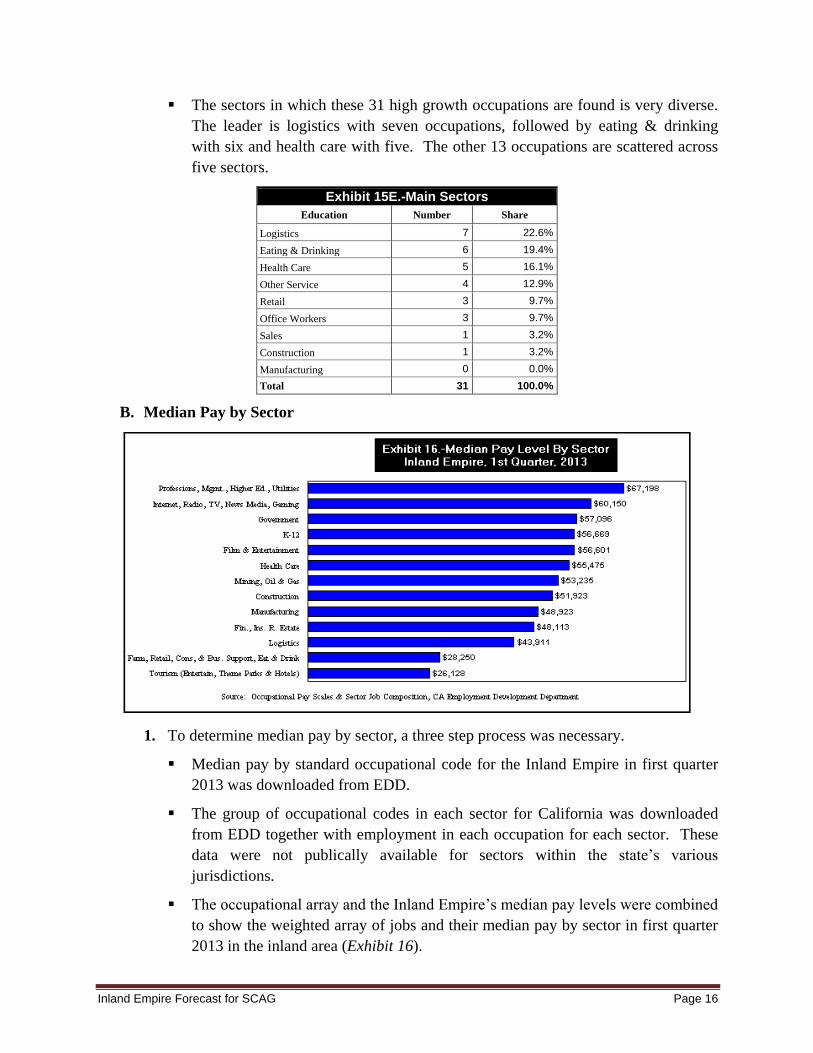
The sectors in which these 31 high growth occupations are found is very diverse.
The leader is logistics with seven occupations, followed by eating & drinking
with six and health care with five. The other 13 occupations are scattered across
five sectors.
Exhibit 15E.-Main Sectors
Education Number Share
Logistics 7 22.6%
Eating & Drinking 6 19.4%
Health Care 5 16.1%
Other Service 4 12.9%
Retail 3 9.7%
Office Workers 3 9.7%
Sales 1 3.2%
Construction 1 3.2%
Manufacturing 0 0.0%
Total 31 100.0%
B. Median Pay by Sector
1. To determine median pay by sector, a three step process was necessary.
Median pay by standard occupational code for the Inland Empire in first quarter
2013 was downloaded from EDD.
The group of occupational codes in each sector for California was downloaded
from EDD together with employment in each occupation for each sector. These
data were not publically available for sectors within the state’s various
jurisdictions.
The occupational array and the Inland Empire’s median pay levels were combined
to show the weighted array of jobs and their median pay by sector in first quarter
2013 in the inland area (Exhibit 16).
Page 17
Inland Empire Forecast for SCAG Page 17
2. The results from this array are as follows:
High Paying Sectors (27.1% of jobs). The five highest paying categories had
median pay levels from $56,669 to $67,199. These included three private sector
groups with a combined share of Inland Empire jobs in 2012 of 86,370 or 7.4%.
It also included government and education which combined for 229,713 jobs or
19.7%.
Median Paying Sectors (41.2% of jobs). The six sectors in the mid-range had
median pay levels from $43,911 to $55,475. They included the four essentially
blue collar sector with 326,257 jobs in 2012 or 28.0% of the Inland Empire total.
There was also two office based groups (health care; finance, insurance & real
estate). They were responsible for 154,986 jobs or 13.3% of the total.
Lower Paying Sectors (37.5% of jobs). The lower paying sectors had median
pay levels ranging from $26,128 to $28,250 They included those in tourism
(29,770 jobs; 2.6%) plus a variety of lower paying groups in such sectors as
agriculture, retail, food & drink and consumer services (408,110 jobs; 35.0%).
IV. Income & Poverty Trends
A. Median Income. Using 1989 household median incomes as a base ($57,942), inflation
adjusted to 2012 levels, the trend for the Inland Empire has not been a good one. By
1999 and 2005, median income was essentially stationary. During the boom in 2007,
median income ($62,387) did rise to 7.7% over the 1989 level. However, the Great
Recession and its aftermath have seen median income fall to -10.7% below the 1989 level
by 2012 ($51,756).
Page 18
Inland Empire Forecast for SCAG Page 18
B. Per Capita Income. The trend for the Inland Empire’s inflation adjusted per capita
income showed declining significantly during the early 1990s due to the severe aerospace
defense recession. Adjusted to 2012 price levels, the level dropped from $12,999 to
$12,009, off -7.6% (Exhibit 17A). From there, per capita income rose to dual highs of
$13,945 in 2001 and $13,940 in 2006. However, the Great Recession sent the level down
to $12,886 in 2010, off -7.6% from the peak. A small gain to $12,919 in 2011 left the
inland area -0.6% its 1990 level.
C. Over & Share Under $35,000. In the Inland Empire, roughly one-third the households
in both counties earned under $35,000 in 2012. That left two-thirds of the households
earning over that level (Exhibit 18).
D. Poverty Rate. Between 1990 and 2012, poverty has soared in the Inland Empire. The
number of people living below poverty level incomes has increased from 306,417 to
813,251, a 165.4% increase. That occurred in a period when the population grew by
Page 19
Inland Empire Forecast for SCAG Page 19
65.9%. As a result, a much larger slice of a much bigger population is now poor. The
share has gone from 11.8% in 1990 to 19.0% in 2012 (Exhibit 19).
Exhibit 19.-Residents Below Poverty Level, Inland Empire, 1990-2012
Census Bureau Year People In Poverty Share of Population
in Poverty Population
1990 306,417 11.8% 2,588,793
2000 477,496 14.7% 3,255,526
2012 813,251 19.0% 4,293,892
Changes +165.4% +7.2% +65.9%
Source: 1990 & 2000 Census; 2012 American Community Survey
In 2012, the levels of poverty in various groups were quite different:
o African American (27.2%)
o Hispanic (23.9%)
o White (12.1%)
o Asian (10.4%)
o Children under 18 (26.5%)
V. Educational Attainment in 2012
A. Adult Educational Levels. One of the most difficult issues facing the Inland Empire is
the relatively low educational level of its adult population 25 & over (Exhibit 20). In
2012, 46.7% had stopped their educations with high school or less schooling. In the
economy, that is the equivalent of having no real educational training. Over time, the
changes in technology are going to make this worse, not better. At the other end of the
spectrum, just 19.6% of adults have a bachelor’s or higher degree. This makes it very
difficult for the region to compete for the highest paying sectors/
Exhibit 20.-High School or Less Education, Adults 25 & Over, Inland Empire, 2012
Educational Level Number of Adults Share
Less High School 568,347 21.4%
High school graduate (includes GED) 673,540 25.3%
Some college, no degree 686,858 25.8%
Associate's degree 211,147 7.9%
Bachelor's degree 340,001 12.8%
Graduate or professional degree 179,679 6.8%
Total 2,659,572 100.0%
High School or Less 1,241,887 46.7%
Source: 2012 American Community Survey
B. Unemployment, Poverty & Median Income by Educational Level. There is no
question that educational attainment correlates with unemployment rates and shares of
adults living in poverty.
Page 20
Inland Empire Forecast for SCAG Page 20
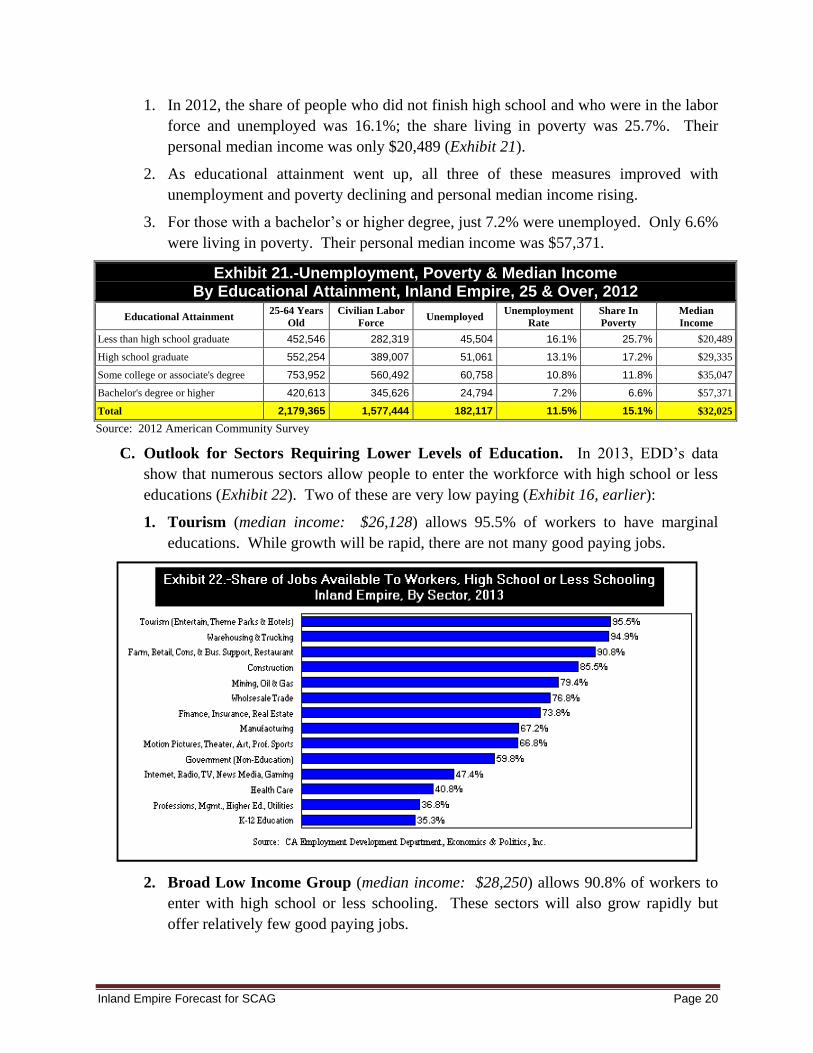
1. In 2012, the share of people who did not finish high school and who were in the labor
force and unemployed was 16.1%; the share living in poverty was 25.7%. Their
personal median income was only $20,489 (Exhibit 21).
2. As educational attainment went up, all three of these measures improved with
unemployment and poverty declining and personal median income rising.
3. For those with a bachelor’s or higher degree, just 7.2% were unemployed. Only 6.6%
were living in poverty. Their personal median income was $57,371.
Exhibit 21.-Unemployment, Poverty & Median Income By Educational Attainment, Inland Empire, 25 & Over, 2012
Educational Attainment 25-64 Years
Old
Civilian Labor
Force Unemployed
Unemployment
Rate
Share In
Poverty
Median
Income
Less than high school graduate 452,546 282,319 45,504 16.1% 25.7% $20,489
High school graduate 552,254 389,007 51,061 13.1% 17.2% $29,335
Some college or associate's degree 753,952 560,492 60,758 10.8% 11.8% $35,047
Bachelor's degree or higher 420,613 345,626 24,794 7.2% 6.6% $57,371
Total 2,179,365 1,577,444 182,117 11.5% 15.1% $32,025
Source: 2012 American Community Survey
C. Outlook for Sectors Requiring Lower Levels of Education. In 2013, EDD’s data
show that numerous sectors allow people to enter the workforce with high school or less
educations (Exhibit 22). Two of these are very low paying (Exhibit 16, earlier):
1. Tourism (median income: $26,128) allows 95.5% of workers to have marginal
educations. While growth will be rapid, there are not many good paying jobs.
2. Broad Low Income Group (median income: $28,250) allows 90.8% of workers to
enter with high school or less schooling. These sectors will also grow rapidly but
offer relatively few good paying jobs.
Page 21
Inland Empire Forecast for SCAG Page 21
Of the others, several offer significant opportunities for workers to start their careers:
3. Warehousing & Trucking (median pay: $43,911) has jobs where 94.9% require
high school or less school. This is one of two sectors that constitute the logistics
group. The group has been one of the fastest growing in the Inland Empire.
4. Construction (median pay: $51,923) has 85.5% of its jobs requiring minimal levels
of formal education, though apprenticeship is necessary for some types of work. The
current median pay is skewed because so few field workers are currently employed.
However, this analyst sees the number of such jobs gradually improving for several
years.
5. Wholesale Trade (median pay: $43,911) has 76.8% of its positions in which
minimal educational levels are needed. It is the other sector that constitutes the
logistics group. The group has been one of the fastest growing in the Inland Empire.
6. Finance, Insurance & Real Estate (median pay: $48,113) will grow as the real
estate market recovers. In this sector 73.8% of jobs require minimal entry level
educations though many require specific state certifications.
7. Health Care (median pay: $55,475) offers fewer jobs with minimal educational
requirements (40.8%). However, the sector is expected to grow rapidly, and those
getting certification to work within it will often find themselves interested in moving
up within the sector.
VI. Housing Market. As indicated earlier, much of the economic pain facing the Inland
Empire’s economy has come about because of the extreme difficulties in its housing and
related construction market.
A. Permits. Earlier (Exhibit 6), it was shown that total Inland Empire building permits
valuation fell -82.8% from the peak in 2005 to the trough in 2011. Permit requests have
subsequently been growing. Based upon six months of 2013, they should reach $3.5
billion this year. However, that will still be off -71.8%. Looking ahead, it is likely the
bottom has been reached and valuation will rise for the foreseeable future.
B. Residential Construction. It has also been shown (Exhibit 7) that single family building
permit valuation fell -90.5% from the peak in 2005 to the bottom in 2011. Valuation did
grow in 2012 and six month’s data in 2013 see that accelerating a little this year. Still,
the value of residential permits is anticipated to end the year -77.9% below its peak. That
said, a variety of data indicates that this situation should be slowly repaired in the coming
three or four years.
C. Median New and Existing Home Prices. A hopeful sign for a residential recovery in
the Inland Empire is found in looking at the pattern of home prices.
Page 22
Inland Empire Forecast for SCAG Page 22
1. Existing home median prices peaked at $389,924 in first quarter 2007. From there
they plunged -60.2% to $155,319 in second quarter 2009. That decline left 54.9% of
all home owners underwater on their mortgages by year end.
At first, the recovery from that point was slow. However, the entry of investors
buying homes has caused the pace to quicken. By third quarter 2013, the median
price was back to $237,257, up 52.8% from the trough. In the past twelve months
alone, the median price rose 26.3%. However, the current price remains 39.2% below
the peak. Today, 24.8% of those with mortgages are underwater. The decline in that
metric is one reason more voluntary sellers are now seen in the inland home market.
Existing home volume for 2013 is forecasted at 57,717 based on nine months of data.
That is down from a peak of 73,026 in 2009 when foreclosure activity was clearing
out the market. Otherwise, the peak was 71,488 sales in 2005.
2. New home median prices peaked at $437,200 in third quarter 2006. From there they
plunged -38.7% to $268,155 in third quarter 2009. The drop occurred as builders
were forced to sell off homes in a market that was disappearing. Since then, prices
have started up and have recently been accelerating. By third quarter 2013, the
median new home was selling for $354,702. That is 50.6% above the 2009 low,
though it remains 18.9% below the historic high.
In 2013, the volume of new homes sales remains at a low level with a forecasted
volume of 6,201 sales based on nine months of activity. This contrasts with 37,226 at
the peak in 2005. As sales are tending to come from more upscale markets, this has
placed an upward bias into recent median home price levels.
Page 23
Inland Empire Forecast for SCAG Page 23
D. Affordability. Finally, the future success of the Inland Empire’s economy and its
housing and residential construction markets continues to rest on the fact that Southern
Californians of modest means who wish to own detached single family homes are almost
forced to migrate inland.
1. Inland Empire Affordability. Today, 56% of the Inland Empire’s families can
afford the area’s median priced home. That is the case with incomes similar to those
in Los Angeles County but well below Orange and San Diego Counties. Though that
is down from 71% at the beginning of 2012, it is consistent with the period after the
last major recession in the 1990s (59%). The 56% figure is far above the 32% to 37%
affordability found in the coastal counties.
2. Inland Empire’s Modest Prices. As families find themselves unable to afford
homes in Southern California’s coastal counties, the Inland Empire will again emerge
as the alternative for them. Thus in third quarter 2013, the area’s median new and
existing home sold for $249,000. That was $202,000 less that in Los Angeles County
($451,000). It was $213,000 below San Diego County ($462,000) and $381,000
cheaper than Orange County ($630,000). It is these price differentials that have
historically caused homebuyers to migrate inland and they will again.