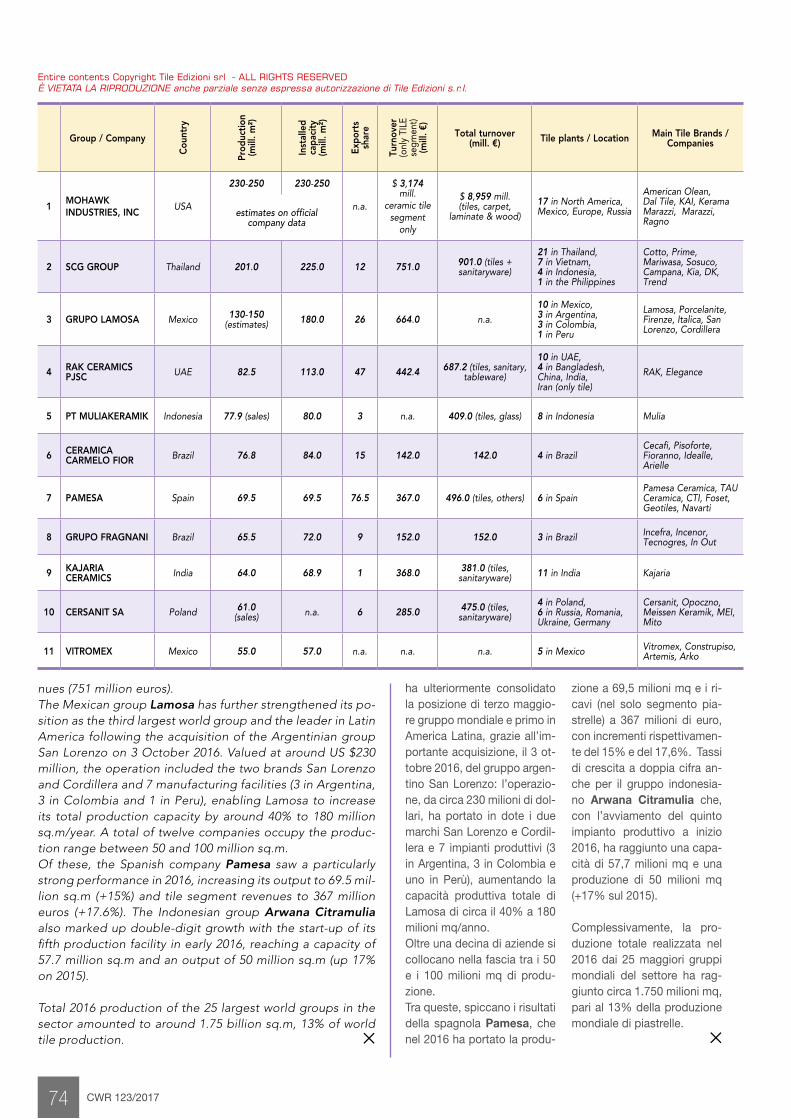
CWR 123/2017 72 In the 2016 rankings of the top 25 world groups, the posi- tions of the four largest tile producers remain unchanged. The American giant Mohawk Industries, Inc. remains firmly at the top of the rankings with an estimated 2016 output of between 230 and 250 million sq.m. The US multinational is well ahead of all its competitors, es- pecially in terms of revenues. As of 31/12/2016, it reported sales of US $3.174 billion in the tile segment alone, equivalent to 35% of the group’s to- tal revenues. The Thai group SCG is in second place in terms of output volumes (201 million sq.m), but well behind in sales reve- Luca Baraldi - Acimac Research Dept. ([email protected] - www.mec-studies.com) I 25 maggiori produttori mondiali di piastrelle The world’s top 25 ceramic tile manufacturers economics La graduatoria 2016 dei 25 maggiori gruppi mondiali vede invariate le posizioni dei pri- mi quattro grandi produttori di piastrelle. Il colosso americano Mohawk Industries si conferma ben saldo al vertice della gradua- toria, con una produzione 2016 stimata tra i 230 e i 250 milioni mq. La multinazionale americana distanzia tutti i competitor so- prattutto in termini di fattura- to: al 31/12/2016, 3.174 milioni di dollari generati nel solo seg- mento piastrelle, pari al 35% dei ricavi complessivi del grup- po. Al secondo posto per vo- lumi prodotti (201 milioni mq), ma distaccato per valore del- le vendite (751 milioni di eu- ro), il gruppo tailandese SCG. Il gruppo messicano Lamosa To supplement the world tile production and consumption figures, Ceramic World Review is publishing key data on the sec- tor’s leading groups and companies, ranked by output volumes and updated to 31/12/2016. Along with the main data for installed capacity, real production, export share and number and locations of facilities (in the tile segment), we also report turnover generated purely from the sale of ceramic tiles. This allows a more accurate comparison to be made between large groups which often operate across multiple segments of the ceramic industry (sanitaryware, tableware, heavy clay) and the supply chain (raw materials, adhesives, distribution), as well as other sectors (bathroom and kitchen furnishings, non-ceramic surface coverings, building materials, chemicals, etc.). To provide a more complete picture of group size, we also include total or consolidated turnover and the segments that generated it. The figures were supplied directly by the companies themselves or obtained from public sources, and in some cases are based on estimates. However, the rankings are not exhaus- tive. A number of groups have been omit- ted due to the lack of sufficient data, in- cluding the largest Italian manufacturer, Concorde Group, which would certain- ly have ranked amongst the top three in terms of turnover (see page 76). Other players that would have entered the rankings include the largest Egyp- tian group, Cleopatra (it has a produc- tion capacity of around 100 million sq.m/ year) and a number of Chinese manufac- turers. A completamento dei dati di produzione e consumo mondiale di piastrelle, Ceramic World Review presenta l’aggiornamento al 31/12/2016 dei maggiori player del setto- re, ordinati per volumi prodotti. Oltre ai dati principali relativi a capacità installata, produzione effettiva, quota export e numero e sede degli stabilimenti (nel segmento piastrelle), si riporta anche il fat- turato generato dalla sola vendita di piastrelle ceramiche; questo per consentire un confronto più omogeneo tra grandi gruppi, spesso operanti in più comparti dell’in- dustria ceramica (sanitari, stoviglieria, laterizi), della filiera (materie prime, adesivi, di- stribuzione) o addirittura in altri settori (arredobagno e cucine, rivestimenti non cera- mici, materiali per edilizia, chimica, ecc..). Per fornire un quadro più completo della dimensione di gruppo viene indicato anche il fatturato totale o il consolidato e i comparti che lo hanno generato. I dati sono stati forniti direttamente dalle aziende o, in alcuni casi, stimati o recu- perati da fonti pubbliche. La graduatoria non è tuttavia esaustiva: l’indisponibilità di un numero sufficiente di dati fa sì che siano omessi alcuni gruppi, tra cui il maggio- re italiano, Concorde Group, che salirebbe sul podio per giro d’affari (vedi pag. 76). Analogamente, rientrerebbero nel ranking anche il maggiore gruppo egiziano, Cleo- patra (dispone di una capacità produttiva di circa 100 milioni mq/anno) e alcuni pro- duttori cinesi.
Transcript
CWR 123/2017 72
In the 2016 rankings of the top 25 world groups, the posi-tions of the four largest tile producers remain unchanged. The American giant Mohawk Industries, Inc. remains firmly at the top of the rankings with an estimated 2016 output of between 230 and 250 million sq.m. The US multinational is well ahead of all its competitors, es-pecially in terms of revenues. As of 31/12/2016, it reported sales of US $3.174 billion in the tile segment alone, equivalent to 35% of the group’s to-tal revenues. The Thai group SCG is in second place in terms of output volumes (201 million sq.m), but well behind in sales reve-
Luca Baraldi - Acimac Research Dept. ([email protected] - www.mec-studies.com)
I 25 maggiori produttori mondiali di piastrelle
The world’s top 25 ceramic tile manufacturers
economics
La graduatoria 2016 dei 25 maggiori gruppi mondiali vede invariate le posizioni dei pri-mi quattro grandi produttori di piastrelle. Il colosso americano Mohawk Industries si conferma ben saldo al vertice della gradua-toria, con una produzione 2016 stimata tra i 230 e i 250 milioni mq. La multinazionale americana
distanzia tutti i competitor so-prattutto in termini di fattura-to: al 31/12/2016, 3.174 milioni di dollari generati nel solo seg-mento piastrelle, pari al 35% dei ricavi complessivi del grup-po. Al secondo posto per vo-lumi prodotti (201 milioni mq), ma distaccato per valore del-le vendite (751 milioni di eu-ro), il gruppo tailandese SCG. Il gruppo messicano Lamosa
To supplement the world tile production and consumption figures, Ceramic World Review is publishing key data on the sec-tor’s leading groups and companies, ranked by output volumes and updated to 31/12/2016. Along with the main data for installed capacity, real production, export share and number and locations of facilities (in the tile segment), we also report turnover generated purely from the sale of ceramic tiles. This allows a more accurate comparison to be made between large groups which often operate across multiple segments of the ceramic industry (sanitaryware, tableware, heavy clay) and the supply chain (raw materials, adhesives, distribution), as well as other sectors (bathroom and kitchen furnishings, non-ceramic surface coverings, building materials, chemicals, etc.). To provide a more complete picture of group size, we also include total or consolidated turnover and the segments that generated it. The figures were supplied directly by the companies themselves or obtained from public sources, and in some cases are based on estimates. However, the rankings are not exhaus-tive. A number of groups have been omit-ted due to the lack of sufficient data, in-cluding the largest Italian manufacturer, Concorde Group, which would certain-ly have ranked amongst the top three in terms of turnover (see page 76). Other players that would have entered the rankings include the largest Egyp-tian group, Cleopatra (it has a produc-tion capacity of around 100 million sq.m/year) and a number of Chinese manufac-turers.
A completamento dei dati di produzione e consumo mondiale di piastrelle, Ceramic World Review presenta l’aggiornamento al 31/12/2016 dei maggiori player del setto-re, ordinati per volumi prodotti. Oltre ai dati principali relativi a capacità installata, produzione effettiva, quota export e numero e sede degli stabilimenti (nel segmento piastrelle), si riporta anche il fat-turato generato dalla sola vendita di piastrelle ceramiche; questo per consentire un confronto più omogeneo tra grandi gruppi, spesso operanti in più comparti dell’in-dustria ceramica (sanitari, stoviglieria, laterizi), della filiera (materie prime, adesivi, di-stribuzione) o addirittura in altri settori (arredobagno e cucine, rivestimenti non cera-mici, materiali per edilizia, chimica, ecc..). Per fornire un quadro più completo della dimensione di gruppo viene indicato anche il fatturato totale o il consolidato e i comparti che lo hanno generato. I dati sono stati forniti direttamente dalle aziende o, in alcuni casi, stimati o recu-perati da fonti pubbliche. La graduatoria non è tuttavia esaustiva: l’indisponibilità di un numero sufficiente di dati fa sì che siano omessi alcuni gruppi, tra cui il maggio-re italiano, Concorde Group, che salirebbe sul podio per giro d’affari (vedi pag. 76). Analogamente, rientrerebbero nel ranking anche il maggiore gruppo egiziano, Cleo-patra (dispone di una capacità produttiva di circa 100 milioni mq/anno) e alcuni pro-duttori cinesi.
RAKCERAMICS.COM
“This is the room where I think, the room where I dream, the room where I design. Now, this room is limitless.”Erich, Architect
L O N D O N
CWR 123/2017 74
Group / Company
Cou
ntry
Prod
uctio
n(m
ill. m
²)
Inst
alle
d ca
paci
ty(m
ill. m
²)
Expo
rts
shar
e
Turn
over
(onl
y TI
LE
segm
ent)
(m
ill. €
)
Total turnover(mill. €) Tile plants / Location Main Tile Brands /
Companies
1MOHAWK INDUSTRIES, INC
USA
230-250 230-250
n.a.
$ 3,174 mill.
ceramic tile segment
only
$ 8,959 mill.(tiles, carpet,
laminate & wood)17 in North America, Mexico, Europe, Russia
American Olean, Dal Tile, KAI, Kerama Marazzi, Marazzi, Ragno
Entire contents Copyright Tile Edizioni srl - ALL RIGHTS RESERVEDÈ VIETATA LA RIPRODUZIONE anche parziale senza espressa autorizzazione di Tile Edizioni s.r.l.
ha ulteriormente consolidato la posizione di terzo maggio-re gruppo mondiale e primo in America Latina, grazie all’im-portante acquisizione, il 3 ot-tobre 2016, del gruppo argen-tino San Lorenzo: l’operazio-ne, da circa 230 milioni di dol-lari, ha portato in dote i due marchi San Lorenzo e Cordil-lera e 7 impianti produttivi (3 in Argentina, 3 in Colombia e uno in Perù), aumentando la capacità produttiva totale di Lamosa di circa il 40% a 180 milioni mq/anno. Oltre una decina di aziende si collocano nella fascia tra i 50 e i 100 milioni mq di produ-zione. Tra queste, spiccano i risultati della spagnola Pamesa, che nel 2016 ha portato la produ-
zione a 69,5 milioni mq e i ri-cavi (nel solo segmento pia-strelle) a 367 milioni di euro, con incrementi rispettivamen-te del 15% e del 17,6%. Tassi di crescita a doppia cifra an-che per il gruppo indonesia-no Arwana Citramulia che, con l’avviamento del quinto impianto produttivo a inizio 2016, ha raggiunto una capa-cità di 57,7 milioni mq e una produzione di 50 milioni mq (+17% sul 2015).
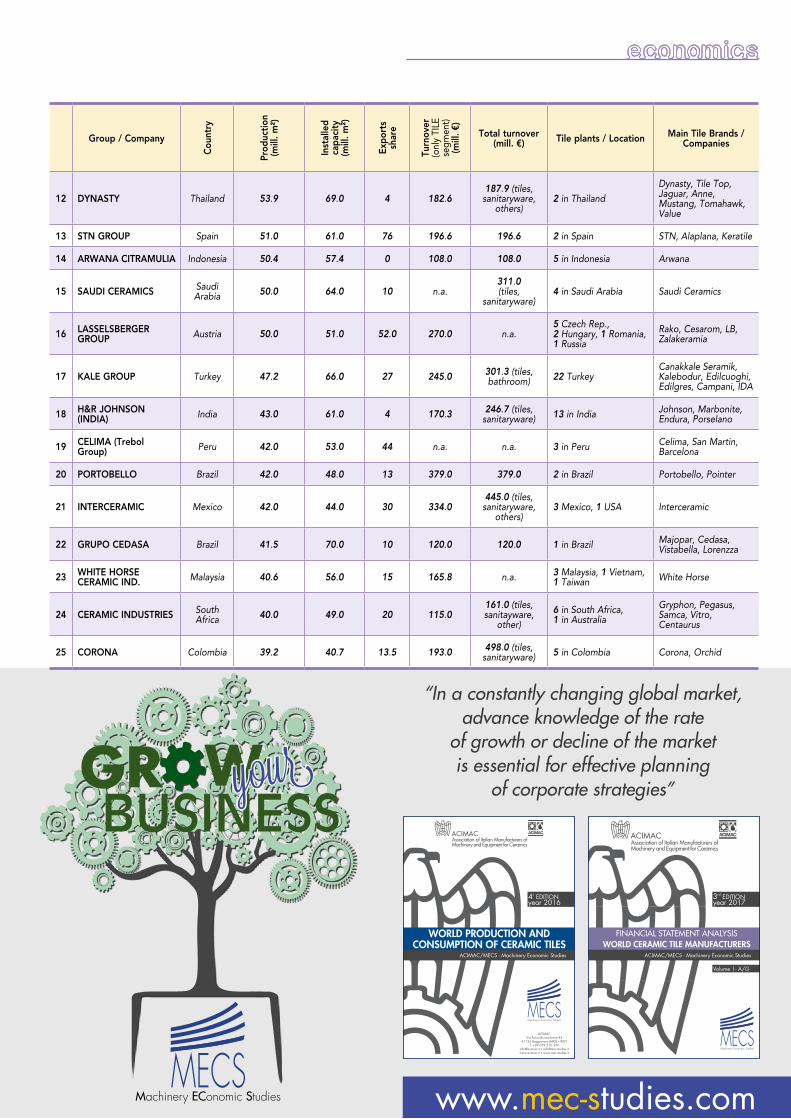
Complessivamente, la pro-duzione totale realizzata nel 2016 dai 25 maggiori gruppi mondiali del settore ha rag-giunto circa 1.750 milioni mq, pari al 13% della produzione mondiale di piastrelle.
5
nues (751 million euros). The Mexican group Lamosa has further strengthened its po-sition as the third largest world group and the leader in Latin America following the acquisition of the Argentinian group San Lorenzo on 3 October 2016. Valued at around US $230 million, the operation included the two brands San Lorenzo and Cordillera and 7 manufacturing facilities (3 in Argentina, 3 in Colombia and 1 in Peru), enabling Lamosa to increase its total production capacity by around 40% to 180 million sq.m/year. A total of twelve companies occupy the produc-tion range between 50 and 100 million sq.m. Of these, the Spanish company Pamesa saw a particularly strong performance in 2016, increasing its output to 69.5 mil-lion sq.m (+15%) and tile segment revenues to 367 million euros (+17.6%). The Indonesian group Arwana Citramulia also marked up double-digit growth with the start-up of its fifth production facility in early 2016, reaching a capacity of 57.7 million sq.m and an output of 50 million sq.m (up 17% on 2015).
Total 2016 production of the 25 largest world groups in the sector amounted to around 1.75 billion sq.m, 13% of world tile production. 5
economics
Group / Company
Cou
ntry
Prod
uctio
n(m
ill. m
²)
Inst
alle
d ca
paci
ty(m
ill. m
²)
Expo
rts
shar
e
Turn
over
(onl
y TI
LE
segm
ent)
(m
ill. €
)
Total turnover(mill. €) Tile plants / Location Main Tile Brands /