140
CARIBBEAN EXAMINATIONS COUNCIL Caribbean Advanced Proficiency Examination CAPE ® ECONOMICS SYLLABUS Effective for examinations from May/June 2010
| Date post: | 23-Apr-2018 |
| Category: |
Documents |
| Upload: | duongtuyen |
| View: | 226 times |
| Download: | 3 times |
CXC A20/U2/09
CARIBBEAN EXAMINATIONS COUNCIL
Caribbean Advanced Proficiency Examination CAPE
®
ECONOMICS SYLLABUS
Effective for examinations from May/June 2010
Published by the Caribbean Examinations Council
All rights reserved. No part of this publication may be reproduced, stored in a retrieval system, or transmitted in any form, or by any means electronic, photocopying, recording or otherwise without prior permission of the author or publisher.
Correspondence related to the syllabus should be addressed to:
The Pro-Registrar Caribbean Examinations Council Caenwood Centre 37 Arnold Road, Kingston 5, Jamaica, W.I.
Telephone: (876) 630-5200 Facsimile Number: (876) 967- 4972 E-mail address: [email protected] Website: www.cxc.org
Copyright © 2009 by Caribbean Examinations Council The Garrison, St Michael BB14038, Barbados
CXC A20/U2/09
Contents RATIONALE ........................................................................................................................................... 1
AIMS ........................................................................................................................................................ 2
SKILLS AND ABILITIES TO BE ASSESSED ...................................................................................... 2
PRE-REQUISITES OF THE SYLLABUS.............................................................................................. 3
STRUCTURE OF THE SYLLABUS ..................................................................................................... 3
UNIT 1: MICROECONOMICS
MODULE 1: METHODOLOGY: DEMAND AND SUPPLY ......................................................... 4 MODULE 2: MARKET STRUCTURE, MARKET FAILURE AND INTERVENTION……. ........ 12 MODULE 3: DISTRIBUTION THEORY ........................................................................................ 17
UNIT 2: MACROECONOMICS
MODULE 1: MODELS OF THE MACROECONOMY ........................................................... 22 MODULE 2: MACROECONOMIC PROBLEMS AND POLICIES ............................................... 28 MODULE 3: GROWTH, SUSTAINABLE DEVELOPMENT AND
GLOBAL RELATIONS………..……………………………………………………….…….……….36
OUTLINE OF ASSESSMENT .......................................................................................................... 44
REGULATIONS FOR PRIVATE CANDIDATES .............................................................................. 55
REGULATIONS FOR RESIT CANDIDATES .................................................................................... 56
ASSESSMENT GRID ............................................................................................................................. 57
RESOURCES .......................................................................................................................................... 58
GLOSSARY ............................................................................................................................................. 59
CXC A20/U2/09

This document CXC A20/U2/09 replaces CXC A20/U2/03 issued in 2003.
Please note that the syllabus was revised and amendments are indicated by italics.
First Issued 2003 Revised 2009
Please check the website www.cxc.org for updates on CXC’s syllabuses.
CXC A20/U2/09

T
T
Introduction
he Caribbean Advanced Proficiency Examination (CAPE) is designed to provide certification of the academic, vocational and technical achievement of students in the Caribbean who, having completed a minimum of five years of secondary education, wish to further their studies. The examinations address the skills and knowledge acquired by students under a flexible and articulated system where subjects are organised in 1-Unit or 2-Unit courses with each Unit containing three Modules. Subjects examined under CAPE may be studied concurrently or singly.
The Caribbean Examinations Council offers three types of certification. The first is the award of a certificate showing each CAPE Unit completed. The second is the CAPE diploma, awarded to candidates who have satisfactorily completed at least six Units, including Caribbean Studies. The third is the CAPE Associate Degree, awarded for the satisfactory completion of a prescribed cluster of seven CAPE Units including Caribbean Studies and Communication Studies. For the CAPE diploma and the CAPE Associate Degree, candidates must complete the cluster of required Units within a maximum period of five years.
Recognised educational institutions presenting candidates for CAPE Associate Degree in one of the nine categories must, on registering these candidates at the start of the qualifying year, have them confirm in the required form, the Associate Degree they wish to be awarded. Candidates will not be awarded any possible alternatives for which they did not apply.
CXC A20/U2/09
T
Economics Syllabus
◆ RATIONALE
Economics is the study of how society provides for itself by making the most efficient use of scarce resources so that both private and social welfare may be improved. The subject, therefore, covers the study of individuals, households, firms, government and international economic institutions as they attempt to make better use of scarce resources.
The study of Economics enables individuals to develop a better understanding of the economic issues which affect them and the world in which they live. It will also enable students to offer informed comments on economic matters. The knowledge gained from this course in Economics will be of lifelong value to the student. The influence of the subject on all areas of activity should stimulate the individual to continue reading and conducting research in Economics. It is recognised that persons doing this course may be drawn from different backgrounds and may possess different interests. Some may wish to study Economics as preparation for further specialisation in the subject. Others may study the subject to complement other subject disciplines, such as, careers in finance, accounting or law. Some students may see the subject as one worthy of study in its own right. Students of Economics will be able to contribute, significantly, to economic and social development in the Caribbean and the wider world by acting as catalysts for wider awareness of social and economic issues.
A study of Economics at the CAPE level will be of benefit to all students by introducing them to the philosophy which underlies everyday economic interactions. The study will also train the student to think logically, critically and impartially on a variety of contentious issues.
1 CXC A20/U2/09

◆ AIMS
The syllabus aims to:
1. promote understanding of the basic principles and concepts of economics which are accepted in large measure by economists while recognising that the field is changing continuously;
2. develop an appreciation of the various methods used by economists in analysing economic problems;
3. develop an understanding of the global economy and of the relationships between rich and poor
nations with respect to international trade and finance and the most important international financial institutions;
4. encourage students to apply economic principles, theories and tools to everyday economic problems,
for example, inflation, unemployment, environmental degradation, sustainable development and exchange rate instability and to contribute meaningfully to any dialogue on these issues;
5. encourage students to apply economic theory to the critical issues which affect the small open
Caribbean-type economy;
6. encourage students to evaluate contentious economic issues so that decision-making may be informed by logical and critical thinking;
7. sensitise students to the need for ethical behaviour in the conduct of economic transactions.
◆ SKILLS AND ABILITIES TO BE ASSESSED
The assessment will test candidates’ skills and abilities to:
1. identify and explain economic theories, principles, concepts and methods;
2. interpret, analyse and solve economic problems using economic models and concepts;
3. develop structural and reasoned expositions and evaluate economic theories and policies.
2 CXC A20/U2/09

◆ PRE-REQUISITES OF THE SYLLABUS
Successful participation in this course of study will be enhanced by the possession of good verbal and written communications skills. A good foundation in Mathematics would be an asset to students doing this course.
◆ STRUCTURE OF THE SYLLABUS
The Syllabus is arranged into two Units. Each Unit consists of three Modules, each Module requiring 50 hours.
UNIT 1: MICROECONOMICS
Module 1 - Methodology: Demand and Supply Module 2 - Market Structure, Market Failure and Intervention Module 3 - Distribution Theory
UNIT 2: MACROECONOMICS
Module 1 - Models of the Macroeconomy Module 2 - Macroeconomic Problems and Policies Module 3 - Growth, Sustainable Development and Global Relations
Lists of resources are provided in the syllabus. The lists provide information that may be helpful for the study of each Module.
It is advised that the topics listed in the sections do not necessarily follow sequentially. Teachers may thus introduce certain concepts before others.
It is recognised that Economics may be taught using a strictly qualitative approach or a strictly quantitative approach. However, a proper mix of the two approaches is critical to the understanding of the subject at this level. Teachers are advised, therefore, that proper delivery of the subject would involve the integration of the two approaches.
3 CXC A20/U2/09
◆ UNIT 1: MICROECONOMICS MODULE 1: METHODOLOGY: DEMAND AND SUPPLY
GENERAL OBJECTIVES
On completion of this Module, students should:
1. appreciate the main problem of economics namely, the allocation of scarce resources and the inevitability of choice;
2. understand the laws, principles and theories governing demand and supply;
3. understand the basic tools of economic analysis.
SPECIFIC OBJECTIVES
TOPIC 1: Central Problem of Economics
Students should be able to:
1. explain the concept of scarcity;
2. apply the concept of opportunity cost in a variety of real-life situations;
3. explain the concept of production possibilities frontier (PPF);
4. use the production possibilities frontier to indicate constant returns, diminishing returns and increasing returns;
5. account for shifts in the production possibilities frontier (PPF);
6. differentiate between positive and normative economics;
7. outline the advantages and disadvantages of the alternative mechanisms by which resources are
allocated.
CONTENT
1. The meaning of scarcity, free goods and economic goods.
2. (a) Definition of opportunity cost.
(b)
Choice: what, how and for whom to produce.
4 CXC A20/U2/09

UNIT 1 MODULE 1: METHODOLOGY: DEMAND AND SUPPLY (cont’d)
(c) The concept of opportunity cost applied to economic agents (individuals, households, firms and governments).
3. (a) Assumptions: maximum output attainable, given full employment and constant state of
technology.
(b) Regions: attainable, unattainable, efficient and inefficient levels of production. 4. Production possibilities frontier: slopes and shapes.
5. Use of production possibilities frontier to show growth and technological change.
6. Examples of positive and normative statements.
7. Different types of economic systems: traditional, market, planned and mixed.
SPECIFIC OBJECTIVES
TOPIC 2: Theory of Consumer Demand
Students should be able to:
1. explain the concept of utility;
2. explain the law of diminishing marginal utility and the limitation of marginal utility theory;
3. explain the meaning of indifference curves and budget lines;
4. explain consumer equilibrium using the marginal utility approach;
5. explain consumer equilibrium using the indifference curve approach;
6. isolate the income and substitution effects of a price change;
7. explain effective demand;
8. derive the demand curve using both the marginal utility and indifference curve approaches;
9. differentiate among normal, inferior and Giffen goods;
10. distinguish between shifts of the demand curve and movements along the curve;
5 CXC A20/U2/09
UNIT 1 MODULE 1: METHODOLOGY: DEMAND AND SUPPLY (cont’d)
11. identify the factors that affect demand; 12. explain the meaning of consumer surplus;
13. explain price elasticity, income elasticity and cross elasticity of demand;
14. calculate numerical values of elasticity;
15. interpret numerical values of elasticity;
16. assess the implications of price elasticity of demand for total spending and revenue;
17. state the factors that determine the price elasticity of demand.
CONTENT
1. Utility: total, marginal, cardinal (marginalist approach), ordinal (indifference curve approach).
2. (a) Explanation of diminishing marginal utility.
(b) The main assumptions and limitations of Marginal Utility Theory. 3. Indifference curves and the budget constraint (budget lines).
4. The law of equi-marginal returns.
5. The point of tangency of the budget line to the indifference curve.
6. Income and substitution effects of a price change.
7. Effective demand.
8. Deriving the demand curve using the marginal utility as well as the indifference curve approach.
9. Normal, inferior and Giffen goods using the indifference curve approach.
10. Shift versus movements along demand curves.
11. Price and the conditions of demand.
12. Consumer surplus including graphical representations.
6 CXC A20/U2/09
UNIT 1 MODULE 1: METHODOLOGY: DEMAND AND SUPPLY (cont’d)
13. Price, income, and cross elasticities. 14. Calculation of values of elasticity.
15. Classification and interpretations (sign and size); including the drawings and interpretations of
graphs. 16. The implications of price elasticity of demand for total spending and revenue.
17. Factors that determine the price elasticity of demand.
SPECIFIC OBJECTIVES
TOPIC 3: Theory of Supply
Students should be able to:
1. identify the factors of production;
2. explain the term production function;
3. differentiate between the short run and long run;
4. explain the law of diminishing returns;
5. calculate total, average and marginal physical product;
6. explain the relationships among total, average and marginal physical product;
7. identify the stages of production as they relate to total, average and marginal product;
8. calculate total, average, marginal and other costs;
9. explain the relationship among total, average and marginal costs;
10. explain why supply curves are usually positively sloped;
11. explain the concept of producer surplus;
12. explain the shape of the short run and long run supply curves;
7 CXC A20/U2/09
UNIT 1 MODULE 1: METHODOLOGY: DEMAND AND SUPPLY (cont’d)
13. explain returns to scale and the concepts of economies and diseconomies of scale;
14. distinguish between a movement along the supply curve and a shift in the supply curve;
15. explain the concept of elasticity of supply;
16. calculate elasticity of supply;
17. interpret elasticity of supply.
CONTENT
1. Factors of production: land, labour, capital and entrepreneurship.
2. Relationship between output and input.
3. Fixed and variable factors.
4. The law of diminishing returns.
5. Calculation of total average and marginal physical product. (See suggested teaching and
learning activities). 6. Change in the relationship as input increases.
7. Production and its stages, as they relate to the total, average and marginal product including
the use of graphs. 8. (a) Fixed cost, variable cost, total cost, marginal cost, average fixed cost, average
variable cost, average total cost, sunk costs.
(b) The shape of the long run average total cost curve.
(c) Productive optimum. 9. The relationship between total, average and marginal cost including the use of graphs.
10. Relationship between quantity supplied and price.
11. Producer surplus including graphical representations.
8 CXC A20/U2/09

UNIT 1 MODULE 1: METHODOLOGY: DEMAND AND SUPPLY (cont’d)
12. Relationship between marginal cost and the average cost in the short run and long run. Explanation
of why the supply curve is the section of the marginal cost curve above the average variable cost and average total cost.
13. (a) Long run and economies of scale.
(b) Factors determining economies of scale.
(c) Internal and external economies of scale.
(d) Diseconomies of scale.
14. Price and the conditions of supply.
15. Concept of elasticity of supply.
16. Calculation of elasticity of supply.
17. Classification and interpretation (size of coefficient) including the drawing and interpretation of
graphs.
SPECIFIC OBJECTIVES
TOPIC 4: Ma r k e t E q u i l i b r i u m
Students should be able to:
1. explain the concept of the market;
2. explain market equilibrium;
3. calculate equilibrium price and quantity;
4. outline factors that cause changes in equilibrium;
5. evaluate the impact of price controls on market equilibrium;
6. analyse the effects of taxation and subsidies on market equilibrium.
9 CXC A20/U2/09

UNIT 1 MODULE 1: METHODOLOGY: DEMAND AND SUPPLY (cont’d)
CONTENT
1. The concept of the market.
2. Equilibrium price, equilibrium quantity.
3. Use of demand and supply data to calculate equilibrium price and quantity.
4. Changes in conditions of supply and demand.
5. The effects of price ceilings and price floors on equilibrium.
6. (a) The effects of taxation and subsidies on market equilibrium.
(b) The incidence of an indirect tax.
Suggested Teaching and Learning Activities
To facilitate students’ attainment of the objectives of this Module, teachers are advised to engage students in the teaching and learning activities listed below.
1. For topic 1, Central Problem of Economics, let students provide examples from personal life, the home,
firms and government to demonstrate opportunity cost and the production possibilities frontier (PPF). 2. For topic 2, Theory of Consumer Demand, let students derive their own schedule and plot the demand
curve for commodities which they use in their everyday lives. 3. For utility, use water or any other drink to show the different levels of satisfaction (utility). Use the data
to derive total and marginal utility curves. 4. For the concept of elasticity, teachers may use two types of materials, one that could change in varying
degrees and the other which remains the same regardless of circumstances. Teachers should then apply this concept to market conditions illustrating the concepts of elasticity and inelasticity.
5. For deadweight loss, teachers may use the graphs for consumer and producer surplus to show how market
intervention may lead to loss welfare (deadweight loss). 6. For stages of production, allow students to derive the total average and marginal product curves using
simulated data. Use the results of the graphs to point out the different stages of production. An example is given below.
10 CXC A20/U2/09

UNIT 1 MODULE 1: METHODOLOGY: DEMAND AND SUPPLY (cont’d)
GRAPH SHOWING THE STAGES OF PRODUCTION
(i) Stage 1 occurs up to the point where APPL is at its maximum.
(ii) Stage 2 occurs from the point where APPL is at a maximum up to the point where MPPL is zero. In
this stage new workers add to total physical output. (iii) Stage 3 occurs when MPPL is negative.
The producer will operate in stage 2. In stage 1 there is insufficient labour being used (up to the point where MPPL is at its maximum) and the output per worker is increasing. In stage 3 the producer gets no addition to total physical output from additional workers. It would be possible to have more total physical product with less labour applied to a fixed factor (say machinery).
11 CXC A20/U2/09
UNIT 1 MODULE 2: MARKET STRUCTURE, MARKET FAILURE AND INTERVENTION
GENERAL OBJECTIVES
On completion of this Module, students should:
1. appreciate the distinction between the different types of market structures;
2. develop awareness of the causes of market failure;
3. appreciate the measures that can be adopted to reduce or eliminate market failure;
4. appreciate the arguments which suggest that government intervention may not necessarily improve
economic performance. SPECIFIC OBJECTIVES
TOPIC 1: Market Structure
Students should be able to:
1. outline the goals of the firm;
2. explain how firms measure profits;
3. explain the concepts of average, marginal and total revenue;
4. explain the concept of market structure;
5. outline the characteristics of the different market structures;
6. distinguish among the different market structures;
7. explain the factors that influence the pricing and output decisions of the firm;
8. calculate measures of industrial concentration;
9. interpret measures of industrial concentration.
12 CXC A20/U2/09
UNIT 1 MODULE 2: MARKET STRUCTURE, MARKET FAILURE AND INTERVENTION (cont’d)
CONTENT
1. Profit maximization, growth, satisficing, sales and revenue maximization, market dominance.
2. Total revenue, total cost, normal and economic (abnormal) profit.
3. Relationship between average, marginal and total revenue.
4. Types of market structures: perfect competition, monopoly including price discrimination, monopolistic competition, oligopoly and cartels.
5. Characteristics of the different market structures.
(a) barriers to entry;
(b) control over market and price;
(c) nature of the good;
(d) numbers of buyers and sellers;
(e) competitive behaviour and performance.
6. Focus on all characteristics of the different markets in addition to profit maximization.
(a) Examples of close approximations of market structures in the Caribbean.
7. Marginal cost and marginal revenue, total cost and total revenue, marginal cost pricing and average
cost pricing.
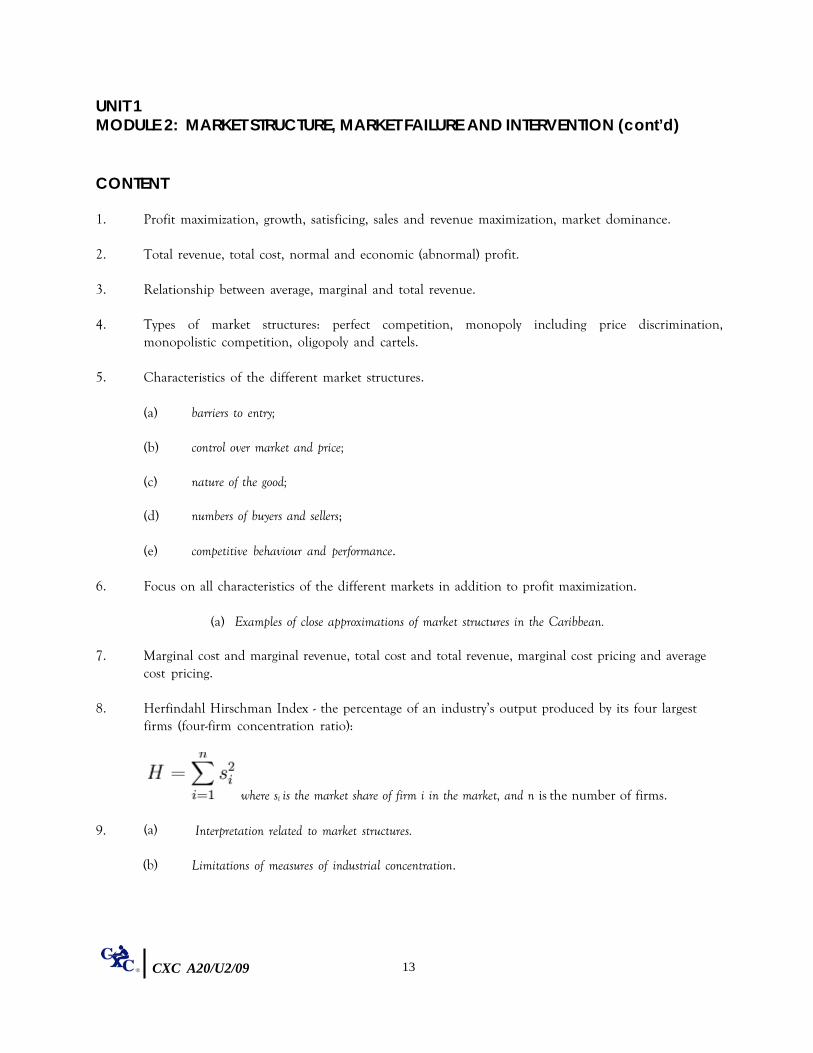
8. Herfindahl Hirschman Index - the percentage of an industry’s output produced by its four largest firms (four-firm concentration ratio):
where si is the market share of firm i in the market, and n is the number of firms.
9. (a) Interpretation related to market structures.
(b)
Limitations of measures of industrial concentration.
13 CXC A20/U2/09
UNIT 1 MODULE 2: MARKET STRUCTURE, MARKET FAILURE AND INTERVENTION (cont’d)
SPECIFIC OBJECTIVES TOPIC 2: Market Failure
Students should be able to:
1. explain the concept of economic efficiency;
2. distinguish among private goods, public goods and merit goods;
3. distinguish between social costs and private costs and social benefits and private benefits;
4. explain the concept of market failure;
5. explain what is meant by deadweight loss;
6. outline the causes of market failure.
CONTENT
1. Inclusion of discussion of Pareto efficiency.
2. (a) Examples of private goods, public goods and merit goods.
(b) Discussion of issues of rivalry and exclusion.
3. Social costs, private costs, social benefits, private benefits, external costs, external benefits. Use of
graphical representations. 4. Divergence of social costs and social benefits and efficiency. Use of graphical representations.
5. Deadweight loss including verbal and graphical representations.
6. Causes of market failure:
(a) monopoly;
(b) public goods and merit goods;
(c) externalities: positive and negative;
14 CXC A20/U2/09
UNIT 1 MODULE 2: MARKET STRUCTURE, MARKET FAILURE AND INTERVENTION (cont’d)
(d) divergence between social and private costs and social and private benefits;
(e) imperfect information;
(f) asymmetric information: adverse selection and moral hazard;
(g) open access to resources;
(h) lack of property rights (squatting, streams, ocean);
(i) non-existence of markets (for trading). SPECIFIC OBJECTIVES
TOPIC 3: Intervention
Students should be able to:
1. evaluate the measures used by government to correct market failure;
2. evaluate the measures used by the private sector to correct market failure.
CONTENT
1. Measures used by government to control market failure:
(a) - regulation;
- anti-trust policy; - taxation; - privatisation and deregulation; - state ownership; - subsidies; - legislation; - market creation (tradable permits);
(b) pros and cons of government intervention;
(c) - merits and demerits;
- effectiveness of intervention in Caribbean societies (effect of small size in relation to policy making).
15 CXC A20/U2/09

UNIT 1 MODULE 2: MARKET STRUCTURE, MARKET FAILURE AND INTERVENTION (cont’d)
2. Private Sector Intervention:
(a) corporate code of conduct;
(b) corporate social responsibility;
(c) voluntary agreements;
(d) corporate ethics.
Suggested Teaching and Learning Activities
To facilitate students’ attainment of the objectives of this Module, teachers are advised to engage students in the teaching and learning activities listed below.
1. For price discrimination, teachers could identify the first, second and third degree price
discrimination using different examples from students’ experiences. Teachers should then illustrate by use of diagrams.
2. For the kinked demand curve model, teachers may use the daily newspaper or mobile phone industry
as examples.
16 CXC A20/U2/09

UNIT 1 MODULE 3: DISTRIBUTION THEORY
GENERAL OBJECTIVES
On completion of this Module, students should:
1. understand what accounts for the returns that accrue to the owners of the factors of production;
2. appreciate the issues surrounding poverty and the measures used to alleviate poverty;
3. develop skills in applying microeconomic analysis to critical social issues involving income inequality.
SPECIFIC OBJECTIVES
TOPIC 1: The Demand for and Supply of Factors
Students should be able to:
1. explain the rewards of the factors of production;
2. explain the concept of derived demand;
3. outline the marginal productivity theory;
4. apply the marginal productivity theory to the demand for land, capital and labour;
5. analyse the factors affecting the supply of land, capital and labour;
6. analyse the factors determining rent, interest and wages;
7. distinguish between transfer earnings and economic rent.
CONTENT
1. Rent, interest, wages and profits.
2. Derived demand.
3. (a) The assumptions and limitations of Marginal Productivity Theory.
(b) Marginal Physical Product, Marginal Revenue Product and their relationship.
17 CXC A20/U2/09
UNIT 1 MODULE 3: DISTRIBUTION THEORY (cont’d)
4. The value of the Marginal Product:
(a) land;
(b) labour;
(c) capital - using present value (use of graphical representation required).
5. The fixity of land, the supply of loanable funds and the labour supply.
6. The demand for and supply of factors.
7. Numerical, graphical and verbal explanations of transfer earnings and economic rent.
SPECIFIC OBJECTIVES
TOPIC 2: Wa g e D i f f e r e n t i a l s
Students should be able to:
1. explain the concept of wage differentials;
2. analyse imperfections in the labour market;
3. analyse the effect of labour mobility on wages;
4. explain the concept of compensating wage differentials;
5. explain the role of Government, Trade Unions and Employers’ Associations in the pricing of labour.
CONTENT
1. Differences in wages within industries and among industries.
2. Imperfections on the demand side (for example, differences in marginal productivity) and on the
supply side (for example, geographical immobility). 3. The mobility and immobility of labour; geographical (migration of workers), occupational.
4. Compensating (equalizing) differentials.
18 CXC A20/U2/09

UNIT 1 MODULE 3: DISTRIBUTION THEORY (cont’d)
5. The minimum wage rate; monopsonies; migration of workers; collective bargaining; trade union
strategies, the role of employers’ associations; efficiency wage. SPECIFIC OBJECTIVES
TOPIC 3: In co m e i n eq u a l i ty , P o v erty a n d P o ve r t y A l l e vi a t i o n
Students should be able to:
1. differentiate between size and functional distribution of income;
2. explain the concept of income inequality;
3. explain the measures of income inequality;
4. explain the measures used to reduce income inequality;
5. distinguish between absolute and relative poverty;
6. outline factors that contribute to poverty;
7. explain why certain categories of people are more susceptible to poverty than others;
8. evaluate the different ways used to measure poverty;
9. outline strategies used by Governments to alleviate poverty;
10. analyse the economic costs of poverty;
11. assess the economic benefits of government intervention to alleviate poverty.
CONTENT
1. Size and functional distribution of income.
2. How income is distributed.
3. Lorenz curve measurement of income inequality; and Gini coefficient (interpretation only).
4. Measures to reduce inequality: taxes, subsidies, transfers.
19 CXC A20/U2/09

UNIT 1 MODULE 3: DISTRIBUTION THEORY (cont’d)
5. Absolute versus relative poverty.
6. Factors that contribute to poverty including:
(a) social and physical environment;
(b) discrimination – gender, race;
(c) restrictions on certain economic activities;
(d) non-ownership of resources;
(e) family size;
(f) single parent; female- headed families.
7. Persons who are most susceptible to poverty:
(a) people with special needs;
(i) physically challenged;
(ii) elderly;
(iii) youth;
(iv) single parent families;
(v) indigenous people;
(b) reasons – Limited access to employment, level of training, legislation, availability of income to share
among family.
8. Ways used to measure poverty:
(a) basic needs;
(b) poverty line;
(c) head count;
(d) UNDP Human Development Index (HDI).
20 CXC A20/U2/09

UNIT 1 MODULE 3: DISTRIBUTION THEORY (cont’d)
9. Strategies to alleviate poverty:
(a) transfer payments;
(b) free education and health care;
(c) housing;
(d) minimum wage legislation;
(e) equal employment opportunities;
(f) Government employment creation (special works programmes).
10. The cost of poverty, including:
(a) unemployed human resources;
(b) lower potential output;
(c) inefficient allocation of Government expenditure;
(d) social and environmental costs.
11. Economic benefits including:
(a) provision of education and health leading to development of human capital;
(b) improvement in well-being as measured by the UNDP (HDI);
(c) more equitable distribution of income.
Suggested Teaching and Learning Activities
To facilitate students’ attainment of the objectives of this Module, teachers are advised to engage students in the teaching and learning activities listed below.
1. Use knowledge from topic 3, unit 1, Theory of Supply, to derive the demand curve for factors of
production. 2. Teachers may use graphical representation of the Lorenz Curve to illustrate unequal distribution of
income. Teachers should also relate the Lorenz Curve to the GINI coefficient. Also show the effect of taxes on the Lorenz Curve and the GINI coefficient.
21 CXC A20/U2/09
◆ UNIT 2: MACROECONOMICS MODULE 1: MODELS OF THE MACROECONOMY
GENERAL OBJECTIVES
On completion of this Module, students should:
1. appreciate the notion of National Income accounting and the importance of these accounts for macroeconomic theory and policy;
2. understand the views of the classical keynesian and monetarists schools;
3. understand the factors that influence the level of investment in an economy.
SPECIFIC OBJECTIVES
TOPIC 1: National Income Ac c o u n t i n g
Students should be able to:
1. explain the circular flow of income;
2. explain the concept of National Income Accounting;
3. explain the different ways of deriving National Income Accounts;
4. interpret National Income statistics;
5. use National Income accounts to analyze the performance on an economy as a whole;
6. derive real GDP from nominal GDP;
7. explain the limitations of GDP.
CONTENT
1. Economic agents.
2. Gross Domestic Product (GDP), Gross National Product (GNP) and other measures.
3. Calculation of GDP, GNP and their components (personal income, disposable income), Net National Income (NNI), and per capita income; avoidance of double counting.
22 CXC A20/U2/09

UNIT 2 MODULE 1: MODELS OF THE MACROECONOMY (cont’d)
4. Total measures:
(a) GDP at market prices;
(b) GDP at factor costs.
5. Use of National income accounts to measure economic performance over time and to make inter-
country comparisons. 6. Calculation of real and nominal GDP using the price deflator.
7. Limits of National Income Accounts as a measure of well-being:
(a) non-inclusion of the informal sector (the underground economy, illegal activities);
(b) non-payment for do-it-yourself activities;
(c) non-accounting for externalities, environmental degradation (Green GDP);
(d) the fact that it measures changes in the value of output but not changes in the quality of life.
SPECIFIC OBJECTIVES
TOPIC 2: Classical models of the Macroeconomy
Students should be able to:
1. explain why within the classical model, all employment is voluntary;
2. explain how full employment is restored in the classical model;
3. explain the factors that influence aggregate demand;
4. explain the factors that influence aggregate supply;
5. interpret the classical long run supply curve;
6. explain price level determination within the classical model;
7. use the classical aggregate demand and supply model to show changes in the price level and
employment.
23 CXC A20/U2/09
UNIT 2 MODULE 1: MODELS OF THE MACROECONOMY (cont’d)
CONTENT
1. Flexibility of wages and prices.
2. The role of wage price and interest rate flexibility.
3. The factors that influence aggregate demand:
(a) consumer spending;
(b) investment spending;
(c) Government spending;
(d) net export spending.
4. Factors that influence aggregate supply including changes in input prices and incomes.
5. The assumptions of the vertical aggregate supply curve.
6. The interaction of the classical aggregate demand and supply curves.
7. Shifts in the aggregate demand and aggregate supply curves.
SPECIFIC OBJECTIVES
TOPIC 3: Basic Keynesian Models
Students should be able to:
1. explain the consumption function;
2. explain the relationship between saving and consumption;
3. calculate the simple multiplier;
4. explain the effect of changes in investment on national income;
5. explain the effect of government spending on national income;
6. describe the effect of withdrawals and injections on national income;
24 CXC A20/U2/09

UNIT 2 MODULE 1: MODELS OF THE MACROECONOMY (cont’d)
7. explain the relationship between net exports and national income;
8. determine the equilibrium level of national income;
9. explain inflationary and deflationary gaps.
CONTENT
1. Autonomous and induced consumption.
2. (a) Income = consumption plus saving.
(b) marginal propensity to consume and save.
(c) average propensity to consume and save.
3. Simple multiplier . 4. Relationship between changes in investments and national income.
5. Government’s expenditure and its effects on national income.
6. (a) Concepts of injections and withdrawals in an economy.
(b) The effect of injections and withdrawals on national income.
(c) Small multipliers in the Caribbean context due to leakages.
7. (a) Relationship between net exports (x – m) and national income.
(b) Exports as an injection and imports as a withdrawal.
8. Determination of equilibrium income using:
(a) 45 o line or E=Y;
(b) withdrawals and injections approach;
(c) the Keynesian aggregate demand and supply curves (long run and short run).
25 CXC A20/U2/09
UNIT 2 MODULE 1: MODELS OF THE MACROECONOMY (cont’d)
9. (a) Full employment level of output.
(b) Actual level of output.
(c) Equilibrium level of national income could be either below, at or above potential level of
output. SPECIFIC OBJECTIVES
TOPIC 4: Investment
Students should be able to:
1. explain the concept of investment;
2. differentiate between the investment demand curve and the investment curve;
3. explain the accelerator theory;
4. outline the factors that account for the volatility of investment.
CONTENT
1. Investment (induced and autonomous).
2. (a) Marginal efficiency of capital (investment demand as a function of expected rate of return).
(b) Marginal efficiency of investment (non-interest rates as determinants of investment demand,
taxes, costs, stock of capital goods on hand expectations). 3. Accelerator theory of investment.
4. Determinants of investment:
(a) The accelerator;
(b) Durability;
(c) Irregularity of innovation;
(d) Variability of profits, expectations and interest rates.
26 CXC A20/U2/09
UNIT 2 MODULE 1: MODELS OF THE MACROECONOMY (cont’d)
Suggested Teaching and Learning Activities
To facilitate students’ attainment of the objectives of this Module, teachers are advised to engage students in the teaching and learning activities listed below.
1. For topic 1, teachers should pay special attention to the rules of accounting working from the GDP
down to consumption and savings. Teachers should also deal with the concepts such as market price and factor costs, as well as real GDP and normal GDP. Make use of the circular flow diagram from the closed economy to the open economy.
2. For topic 2, Classical Models of the Macroeconomy, teachers should use graphs to emphas i s e
flexibility and the automatic return to equilibrium. 3. For topic 3, teachers could demonstrate the operation of the multiplier by using data to show the
successive rounds of spending. Calculations and graphical representations of the multiplier are required.
4. Use the 45° line and average demand and average supply to show inflationary and deflationary gaps.
5. For topic 4, Investment, teachers may use tables to illustrate and explain the accelerator, that is, the
necessity to increase expenditure, constantly, for investment.
27 CXC A20/U2/09

UNIT 2 MODULE 2: MACROECONOMIC PROBLEMS AND POLICIES
GENERAL OBJECTIVES On completion of this Module, students should:
1. understand the reasons why an economy may be characterised by unemployment and how
intervention may be used to improve economic performance; 2. appreciate the role of the Central Bank in the economy;
3. understand monetary and fiscal policy and their applications;
4. understand the nature and burden of the national debt.
SPECIFIC OBJECTIVES
TOPIC 1: Unemployment and Inflation
Students should be able to:
1. explain what is meant by the labour force;
2. explain the unemployment rate;
3. distinguish between unemployment and underemployment;
4. evaluate the costs of unemployment;
5. explain the causes of unemployment;
6. evaluate the policies used to reduce unemployment;
7. explain the causes of inflation;
8. distinguish between real and nominal variables;
9. explain how inflation is measured;
10. explain the causes of inflation;
11. evaluate the effects of inflation;
28 CXC A20/U2/09
UNIT 2 MODULE 2: MACROECONOMIC PROBLEMS AND POLICIES (cont’d)
12. evaluate the policies used to combat inflation;
13. explain the relationship between the unemployment rate and inflation.
CONTENT
1. Employed and unemployed.
2. The unemployment rate.
3. Unemployment and underemployment.
4. The effect on output, income and growth: additional financial burden on the state; social costs.
5. Labour immobility, other market imperfections, structural changes in the economy, inadequate
aggregate demand, increase in labour force participation rate, seasonality, intervention. 6. Fiscal policy, monetary policy, wage subsidies, retraining programmes, investment tax credit,
employment tax credit, government employment programmes, reducing market imperfections. 7. Inflation: general price level.
8. Real and money wages:
(a) real and nominal GDP;
(b) real and nominal interest rate.
9. The GDP deflator; the retail price index; the producer price index. Calculations and limitations of
the indices. 10. Demand shocks, supply shocks, increase in the money supply growth rate.
11. The costs and benefits of inflation: the impact of redistribution of wealth; impact of business activity
and growth, impact on the balance of payments. 12. Income policy, monetary policy, fiscal policy and supply side measures.
13. Trade-off between inflation and the rate of unemployment: Phillips curve – stagflation.
29 CXC A20/U2/09

UNIT 2 MODULE 2: MACROECONOMIC PROBLEMS AND POLICIES (cont’d)
SPECIFIC OBJECTIVES
TOPIC 2: Mo n e t a r y T h e o r y a n d P o l i c y
Students should be able to:
1. explain the concept of money;
2. outline the functions of money;
3. explain the demand for money;
4. explain the supply of money;
5. explain monetary policy;
6. explain how the money supply is controlled;
7. explain how money is created in the banking system;
8. explain why residents substitute foreign for domestic currency;
9. explain the Quantity Theory of Money;
10. outline the types of monetary policy;
11. describe the effects of monetary policy on national income;
12. evaluate the limitations of monetary policy.
CONTENT
1. (a) The meaning of money.
(b)
Types of money: token and commodity.
2. Functions of money.
3. (a) Liquidity Preference Theory.
(b)
Motives for holding money (transactions, precautionary, speculative).
30 CXC A20/U2/09

UNIT 2 MODULE 2: MACROECONOMIC PROBLEMS AND POLICIES (cont’d)
4. The money supply (M1, M2).
5. Monetary policy – expansionary and contractionary policies.
6. (a) The role of the central bank in creating high-powered money (monetary base).
(b) Instruments of monetary control:
(i) open market operations;
(ii) discount rates;
(iii) financing fiscal deficits;
(iv) reserve requirements;
(v) moral suasion;
(vi) interest rates.
7. (a) Excess reserves.
(b)
Credit creation.
(c)
The money multiplier.
8. The nature of currency substitution and hoarding.
9. The Quantity Theory of money.
10. (a) Tight monetary policy (inflation).
(b) Easy monetary policy (unemployment).
(c) Balance of payments.
11. How monetary policy affects national income.
12. Limitations of monetary policy including the fact that it is:
(a) permissive, not compelling and only creates the environment;
31 CXC A20/U2/09
UNIT 2 MODULE 2: MACROECONOMIC PROBLEMS AND POLICIES (cont’d)
(b) difficult to control the money supply of foreign-owned commercial banks;
(c) difficult to eliminate lags in monetary policy;
(d) weakened by fiscal indiscipline. SPECIFIC OBJECTIVES
TOPIC 3: Fiscal Policy
Students should be able to:
1. explain the concept of fiscal policy;
2. outline the goals of fiscal policy;
3. explain the nature of the budget;
4. explain the balanced budget multiplier;
5. outline methods of financing budget deficits;
6. evaluate the limitations of fiscal policy;
7. distinguish between discretionary and non-discretionary fiscal policy.
CONTENT
1. The meaning of fiscal policy.
2. Fiscal policy as a means of addressing:
(a) aggregate demand;
(b) unemployment;
(c) inflation;
(d) balance of payments.
32 CXC A20/U2/09
UNIT 2 MODULE 2: MACROECONOMIC PROBLEMS AND POLICIES (cont’d)
3. The nature of the budget:
(a) taxation, revenue, transfer, expenditure;
(b) budget surplus and budget deficit;
(c) balanced budget.
4. Explanation of the balanced budget multiplier.
5. Methods of financing budget deficits including external and domestic borrowing.
6. Lags and potency of fiscal policy.
7. (a) Expansionary and contractionary.
(b) Automatic stabilisers.
SPECIFIC OBJECTIVES
TOPIC 4: Public Debt
Students should be able to:
1. explain the national debt;
2. explain the cause of the national debt;
3. evaluate the effects of the national debt on the economy;
4. explain the burden of the national debt;
5. evaluate ways of reducing the debt burden;
6. interpret the debt service ratio;
7. calculate the debt service ratio.
33 CXC A20/U2/09
UNIT 2 MODULE 2: MACROECONOMIC PROBLEMS AND POLICIES (cont’d)
CONTENT 1. The national debt:
(a) stock/flow;
(b) fiscal indiscipline;
(c) domestic and foreign debt.
2. The causes of the national debt.
3. The effects of the national debt on the economy:
(a) output and investment decisions;
(b) exchange rate pressures;
(c) inflation;
(d) crowding out and crowding in.
4. The responsibility for debt repayment.
5. Management of the national debt:
(a) internal and external borrowing;
(b) taxation;
(c) debt rescheduling;
(d) debt forgiveness.
6. Interpretation of the debt service ratio.
7. Calculation of the debt service ratio (principal plus interest as a percentage of export).
34 CXC A20/U2/09

UNIT 2 MODULE 2: MACROECONOMIC PROBLEMS AND POLICIES (cont’d)
Suggested Teaching and Learning Activities
To facilitate students’ attainment of the objectives of this Module, teachers are advised to engage students in the teaching and learning activities listed below.
1. For topic 1, Unemployment and Inflation, teachers should use the Phillips Curve to show the
relationship between the unemployment rate and inflation rate. 2. For topic 2 (money multiplier), show the various rounds in the money expansion process as done in
the multiplier. Use Central Bank Acts and Reports for data gathering. 3. For fiscal policy, there is no need for students to derive the balanced budget multiplier. This should
only be explained. 4. Teachers should emphasise the causes of the national debt and the burden it places on future
generations.
35 CXC A20/U2/09
UNIT 2 MODULE 3: GROWTH, SUSTAINABLE DEVELOPMENT AND GLOBAL RELATIONS
GENERAL OBJECTIVES On completion of this Module, students should:
1. understand the basic concepts of growth and development;
2. understand the impact of imports and exports on the macroeconomy;
3. understand the balance of payments accounts and appreciate the causes and consequences of balance
of payments crises; 4. become aware of the benefits and costs derived from current integration arrangements, such as
CARICOM, FTAA and the EU; 5. understand the role and functions of international economic institutions.
SPECIFIC OBJECTIVES
TOPIC 1: Growth and Sus t a i na b l e Development
Students should be able to:
1. distinguish between growth and development;
2. explain the concept of sustainable development;
3. outline the factors that determine growth;
4. outline the factors that contribute to sustainable development;
5. explain the concept of human development;
6. analyse the structural characteristics of Caribbean economies;
7. analyse the impact of the region’s structural characteristics on sustainable economic development.
36 CXC A20/U2/09
UNIT 2 MODULE 3: GROWTH, SUSTAINABLE DEVELOPMENT AND GLOBAL RELATIONS (cont’d)
CONTENT 1. Differences between growth and development.
2. Current growth versus the well-being of future generations.
3. Differences between exogenous (technical change) and endogenous growth (capital accumulation,
human capital). 4. Economic, social and environmental factors.
5. Indices of human development including mortality rates, literacy, per capita income, life expectancy.
6. Structural characteristics of Caribbean economies including:
(a) small size;
(b) openness;
(c) composition of exports;
(d) resource base;
(e) poverty;
(f) economic dependence.
7. Implications for regional economies:
(a) dependence on aid;
(b) preferential trade agreements;
(c) foreign direct investment (FDI);
(d) vulnerability to natural and man-made change;
(e) changes in world prices.
37 CXC A20/U2/09
UNIT 2 MODULE 3: GROWTH, SUSTAINABLE DEVELOPMENT AND GLOBAL RELATIONS (cont’d)
SPECIFIC OBJECTIVES
TOPIC 2: International Trade
Students should be able to:
1. analyse the role of imports and exports in a small open economy;
2. outline the factors that influence exports and imports;
3. explain the effects of foreign exchange earnings on a small open economy;
4. explain the theory of comparative advantage;
5. evaluate the arguments for protection;
6. evaluate the arguments for Trade Liberalisation;
7. outline methods of trade protection;
8. explain the commodity, terms of trade;
9. interpret changes in the commodity terms of trade;
10. calculate the commodity, terms.
CONTENT
1. The role of exports in creating domestic income and the role of imports in generating income for
foreigners. 2. The factors which determine exports and imports including:
(a) international price;
(b) domestic production;
(c) domestic prices and exchange rates;
(d) international economic activity as it affects the tourism market in the Caribbean;
38 CXC A20/U2/09
UNIT 2 MODULE 3: GROWTH, SUSTAINABLE DEVELOPMENT AND GLOBAL RELATIONS (cont’d)
(e) shifts in international demand and the emergence of substitutes;
(f) changes in International Income. 3. Foreign exchange earnings from exports:
(a) access to capital goods;
(b) the export multiplier;
(c) access to consumer goods;
(d) increased domestic production.
4. The theory of comparative advantage.
5. Arguments for protection including:
(a) infant industries;
(b) employment;
(c) food security.
6. Arguments for Trade Liberalisation including access to technology, availability of cheaper goods and
services. Application of the theory of comparative advantage. 7. Methods of protection including: tariffs, quotas and other non-tariff methods.
8. Explanation of the commodity terms of trade.
9. Interpretation of changes in the commodity terms of trade.
10. Export price index divided by import price index multiplied by 100.
39 CXC A20/U2/09

UNIT 2 MODULE 3: GROWTH, SUSTAINABLE DEVELOPMENT AND GLOBAL RELATIONS (cont’d)
SPECIFIC OBJECTIVES TOPIC 3: Balance of Payments and Exchange Rates
Students should be able to:
1. explain the balance of payments;
2. distinguish between the current account and capital account;
3. analyze the causes and consequences of balance of payments disequilibria;
4. outline the policy measures for correcting balance of payments disequilibria;
5. explain exchange rates;
6. explain exchange rates determination;
7. distinguish between fixed and floating exchange rate regimes;
8. describe the effects of the exchange rate changes.
CONTENT
1. Explanation of the balance of payments.
2. Capital items and current items.
3. The causes and consequences of balance of payments - disequilibria.
4. Policy responses to balance of payments crises including:
(a) devaluation;
(b) expenditure switching;
(c) expenditure reducing measures.
5. Explanation of exchange rates.
6. Determination of exchange rates.
40 CXC A20/U2/09
UNIT 2 MODULE 3: GROWTH, SUSTAINABLE DEVELOPMENT AND GLOBAL RELATIONS (cont’d)
7. Fixed and floating exchange rate systems (fixed, free floating and managed float).
8. The effects of exchange rate changes.
SPECIFIC OBJECTIVES
TOPIC 4: Economic Integration
Students should be able to:
1. explain the main forms of economic integration;
2. evaluate the costs and benefits of economic integration;
3. evaluate the objectives of Caribbean integration;
4. analyse the implications of international integration arrangements for Caribbean economies.
CONTENT
1. Main forms of economic integration, including:
(a) free trade area;
(b) customs union;
(c) common market;
(d) economic union.
2. The costs and benefits of economic integration including trade creation and trade diversion.
3. The objectives of CARICOM and the rationale for the CARICOM Single Market and Economy
(CSME). 4. The significance of integration movements, for example European Union (EU) and the North
American Free Trade Agreement (NAFTA) for Caribbean Economies.
41 CXC A20/U2/09
UNIT 2 MODULE 3: GROWTH, SUSTAINABLE DEVELOPMENT AND GLOBAL RELATIONS (cont’d)
SPECIFIC OBJECTIVES TOPIC 5: International Ec o n o m i c R e l a t i o n s
Students should be able to:
1. explain the role and functions of the World Trade Organisation (WTO);
2. explain the role of international financial institutions (IFI’s);
3. explain the term multinational (transnational) corporation;
4. explain the nature of foreign direct investment;
5. outline the potential benefits and disadvantages of foreign direct investment;
6. explain the term globalisation;
7. describe the factors responsible for globalisation;
8. evaluate the effects of globalisation on developing countries.
CONTENT
1. The role and functions of the WTO.
2. The role of the IMF and World Bank in the International Financial System.
3. Explanation of multinational (transnational) corporation.
4. The nature of foreign direct investment.
5. Potential benefits and disadvantages, including:
(a) access to technology and capital;
(b) access to markets;
(c) access to management skills;
(d) repatriation of profits;
42 CXC A20/U2/09
UNIT 2 MODULE 3: GROWTH, SUSTAINABLE DEVELOPMENT AND GLOBAL RELATIONS (cont’d)
(e) transfer pricing;
(f) crowding out of domestic businesses. 6. The concept of globalisation.
7. Forces driving globalisation, for example, technological innovation, trade liberalisation, and
liberalisation of capital markets. 8. Implications of globalisation for developing countries with particular reference to the greater
Caribbean (greater competition, access to markets, access to technology, cheaper prices and greater variety of goods, loss of preferential markets).
Suggested Teaching and Learning Activities
To facilitate students’ attainment of the objectives of this Module, teachers are advised to engage students in examining the structure of the economies of the Caribbean and the problems of imports and exports using international partnership agreements and policies. Teacher should ensure that students could distinguish among;
(a) Terms of Trade; (b) Balance of Trade; and (c) Balance of Payments.
43 CXC A20/U2/09
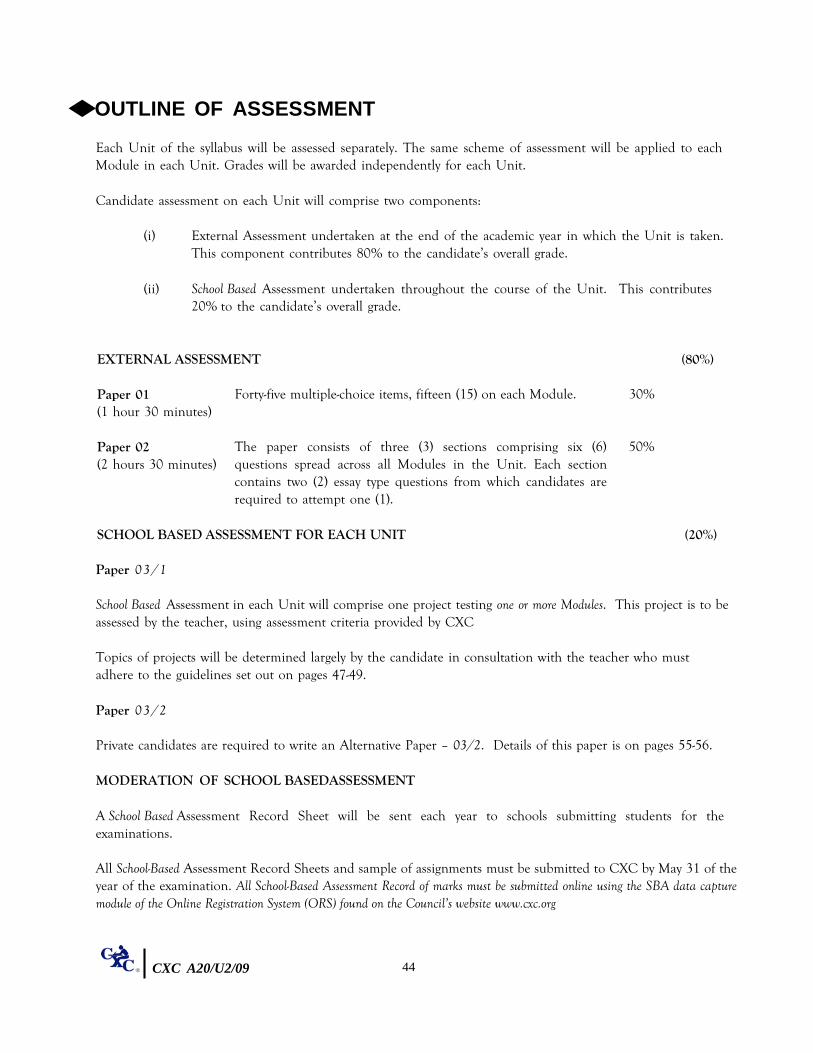
◆ OUTLINE OF ASSESSMENT
Each Unit of the syllabus will be assessed separately. The same scheme of assessment will be applied to each Module in each Unit. Grades will be awarded independently for each Unit.
Candidate assessment on each Unit will comprise two components:
(i) External Assessment undertaken at the end of the academic year in which the Unit is taken.
This component contributes 80% to the candidate’s overall grade.
(ii) School Based Assessment undertaken throughout the course of the Unit. This contributes 20% to the candidate’s overall grade.
EXTERNAL ASSESSMENT (80%)
Paper 01 (1 hour 30 minutes)
Forty-five multiple-choice items, fifteen (15) on each Module. 30%
Paper 02 (2 hours 30 minutes)
The paper consists of three (3) sections comprising six (6) questions spread across all Modules in the Unit. Each section contains two (2) essay type questions from which candidates are required to attempt one (1).
50%
SCHOOL BASED ASSESSMENT FOR EACH UNIT (20%)
Paper 03/1
School Based Assessment in each Unit will comprise one project testing one or more Modules. This project is to be assessed by the teacher, using assessment criteria provided by CXC
Topics of projects will be determined largely by the candidate in consultation with the teacher who must adhere to the guidelines set out on pages 47-49.
Paper 03/2
Private candidates are required to write an Alternative Paper – 03/2. Details of this paper is on pages 55-56.
MODERATION OF SCHOOL BASEDASSESSMENT
A School Based Assessment Record Sheet will be sent each year to schools submitting students for the examinations.
All School-Based Assessment Record Sheets and sample of assignments must be submitted to CXC by May 31 of the year of the examination. All School-Based Assessment Record of marks must be submitted online using the SBA data capture module of the Online Registration System (ORS) found on the Council’s website www.cxc.org
44 CXC A20/U2/09

A sample of assignments will be requested by CXC for moderation purposes. These samples will be re-assessed by CXC Examiners who moderate the Internal Assessment. Teachers’ marks may be adjusted as a result of moderation. The Examiners’ comments will be sent to schools.
Copies of the students’ assignments that are not submitted must be retained by the school until three months after publication by CXC of the examination results.
ASSESSMENT DETAILS
EXTERNAL ASSESSMENT
External Assessment by written papers (80% of Total Assessment)
Paper 01 – (1 hour 30 minutes - 30% of Total Assessment)
1. Composition of Paper
(i) This paper consists of forty-five multiple choice items, fifteen on each module.
(ii) Paper 01 will assess the candidate’s mastery of skills outlined on page 2, but will focus primarily on the candidate’s ability to interpret basic economic data and to solve quantitative problems in economics.
2. Mark Allocation
(i) This paper is worth 90 marks, each question being allocated 2 marks.
(ii) Paper 01 contributes 30% to the candidate’s final grade.
3. Question Type
(i) Paper 01 comprises forty-five multiple choice items.
(ii) Some of the questions will be based on sets of economic data which will be provided with the relevant questions.
4. Use of Calculators
Candidates may use silent non-programmable calculators.
45 CXC A20/U2/09

Paper 02 – (2 hours 30 minutes - 50% of Total Assessment) 1. Composition of Paper
(i) This paper comprises three sections: Section 1, Section 2, and Section 3. For each Unit,
Section 1 tests objectives in Module 1, Section 2 tests objectives in Module 2 and Section 3 tests objectives in Module 3.
(ii) Each section comprises two questions, for a total of six questions. Candidates must answer
three questions, one from each section. 2. Mark Allocation
(i) This paper is worth 150 marks, each essay question will be being marked out of 25 then
weighted to 50.
(ii) This paper tests candidates’ understanding of basic economic concepts and their ability to apply these concepts to everyday situations. It will also test candidates’ ability to recognise the limitations of economic theory and to present their ideas in a clear, logical and coherent manner.
(iii) Paper 02 contributes 50% to the candidate’s final grade.
3. Question Type
(i) Paper 02 comprises 6 essay-type questions which require candidates to provide extended responses.
(ii) Questions may use stimulus material, for example, tables, graphs, reports, diagrams or prose.
Paper 01, Paper 02 and the internal assessment will test the candidate’s ability to demonstrate the following SKILLS critical to the study of Economics:
(a) Knowledge and Understanding;
(b) Application and Analysis;
(c) Evaluation and Synthesis.
46 CXC A20/U2/09

GUIDELINES FOR THE CONDUCT OF INTERNAL ASSESSMENT Internal Assessment is an integral part of student assessment in the course covered by this syllabus. It is intended to assist students in acquiring certain knowledge, skills and attitudes that are critical to the subject. The activities for the Internal Assessment are linked to the Modules and should form part of the learning activities to enable the student to achieve the objectives of the syllabus.
During the course of study of the subject students obtain marks for the competence they develop and demonstrate in undertaking their Internal Assessment assignment. These marks contribute to the final marks and grades that are awarded to students for their performance in the examination.
The guidelines provided in this syllabus for selecting appropriate tasks are intended to assist teachers and students in selecting assignments that are valid for the purpose of Internal Assessment. These guidelines are also intended to assist teachers in awarding marks according to the degree of achievement in the Internal Assessment component of the course. In order to ensure that the scores awarded by teachers are in line with the CXC standards, the council undertakes the moderation of a sample of the Internal Assessment assignments marked by each centre.
Internal Assessment provides an opportunity to individualise a part of the curriculum to meet the needs of students. It facilitates feedback to the students at various stages of the experience. This helps to build the self confidence of the students as they proceed with their studies. Internal Assessment further facilitates the development of essential research skills that allow the student to function more effectively in his or her chosen vocation. Internal Assessment, therefore, makes a significant and unique contribution to the development of relevant skills of the students. It also provides an instrument for testing them and rewarding them for their achievements.
Internal Assessment
The Project-Paper 03/1
Presentation of Project
In this subject, the Internal Assessment for each Unit will be a project.
(i) The Aims of the Project are to:
(a) promote self-learning; (b) promote investigative skills; (c) enable the teacher to contribute to the evaluation; (d) develop in students improved attitudes and skills; (e) develop in students an ability to identify suitable resource material on their own and to develop a disposition for independent research.
47 CXC A20/U2/09

Sources of Data and Information
The primary and secondary sources of data listed below, can be used by candidates in their research activities.
(a) International news magazines such as Fortune, Business Week, Newsweek and Forbes. (b) The business section of local newspapers. (c) Statistical reports such as national income statistics, balance of payments statistics, survey of
living conditions, household budgetary surveys, annual economic reports of Central Banks, Ministries of Finance and Planning units.
(d) Annual reports of firms in the region. (e) The economic information available on the internet. (f) Budget speeches of Ministers of Finance. (g) Reviews of estimates of income and expenditure from Ministries of Finance.
(ii) Management of the Project
(a) An early start to planning project work is highly recommended. Each candidate should know
the requirements of the project and its assessment procedures as part of the orientation to the Unit.
(b) Teachers should guide the candidates in choosing appropriate projects that relate to the candidates’ interest and the specific objectives identified.
(c) Candidates are required to prepare an outline of the project for approval by the teacher. (d) A schedule of the dates for submitting project work (agreed to by teachers and candidates)
should be firmly established. (e) The teacher should offer guidance in the data collection process and the preparation of the
report. (iii) Project Reports
A candidate's report should be presented in a soft folder bearing the candidate's number, name of subject and the date submitted. The project document should comprise:
(a) title; (b) table of contents; (c) aims and objectives; (d) methodology employed; (e) report (between 2000 - 2500 words); (f) references.
The report should include the following:
(a) description; (b) analysis; (c) evaluation; (d) recommendations.
48 CXC A20/U2/09
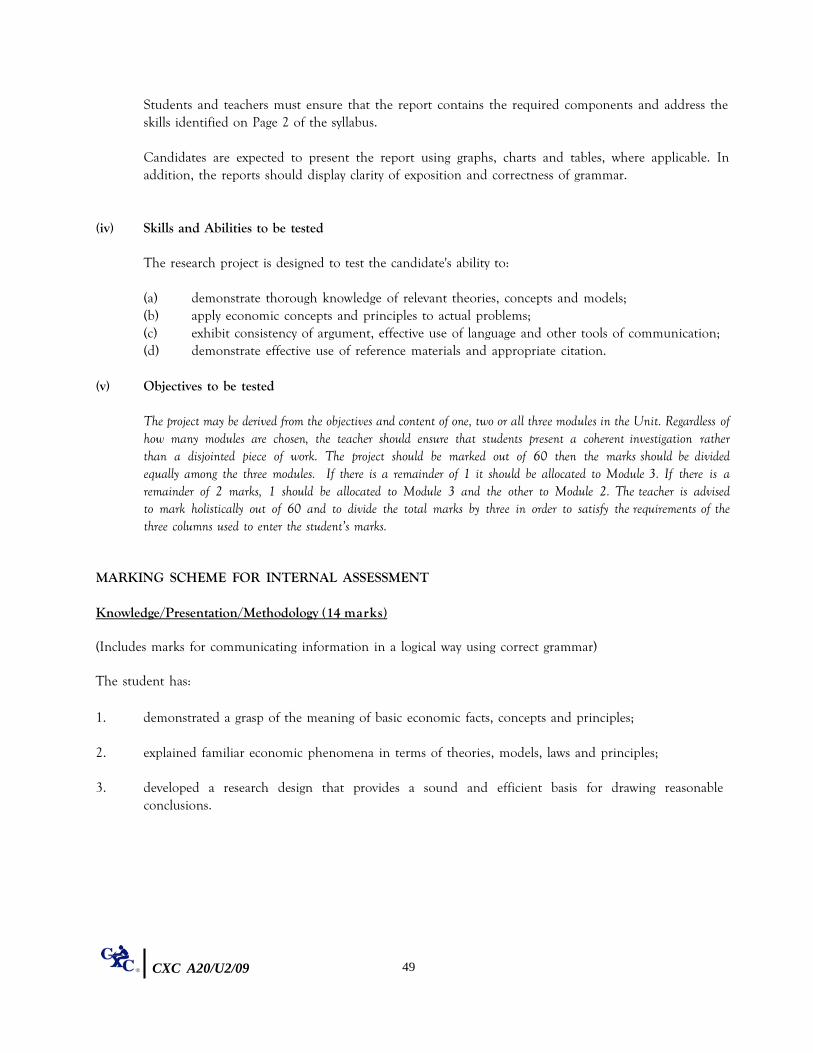
Students and teachers must ensure that the report contains the required components and address the skills identified on Page 2 of the syllabus.
Candidates are expected to present the report using graphs, charts and tables, where applicable. In addition, the reports should display clarity of exposition and correctness of grammar.
(iv) Skills and Abilities to be tested
The research project is designed to test the candidate's ability to:
(a) demonstrate thorough knowledge of relevant theories, concepts and models; (b) apply economic concepts and principles to actual problems; (c) exhibit consistency of argument, effective use of language and other tools of communication; (d) demonstrate effective use of reference materials and appropriate citation.
(v) Objectives to be tested
The project may be derived from the objectives and content of one, two or all three modules in the Unit. Regardless of how many modules are chosen, the teacher should ensure that students present a coherent investigation rather than a disjointed piece of work. The project should be marked out of 60 then the marks should be divided equally among the three modules. If there is a remainder of 1 it should be allocated to Module 3. If there is a remainder of 2 marks, 1 should be allocated to Module 3 and the other to Module 2. The teacher is advised to mark holistically out of 60 and to divide the total marks by three in order to satisfy the requirements of the three columns used to enter the student’s marks.
MARKING SCHEME FOR INTERNAL ASSESSMENT
Knowledge/Presentation/Methodology (14 marks)
(Includes marks for communicating information in a logical way using correct grammar)
The student has:
1. demonstrated a grasp of the meaning of basic economic facts, concepts and principles; 2. explained familiar economic phenomena in terms of theories, models, laws and principles;
3. developed a research design that provides a sound and efficient basis for drawing reasonable
conclusions.
49 CXC A20/U2/09

Application/Analysis (20 marks) (Includes marks for communicating information in a logical way using correct grammar)
The student has:
1. used the major economic concepts, principles and procedures in unfamiliar situations, transformed economic data accurately and appropriately, used common characteristics as a basis for classification;
2. identified and recognised the component parts of an economic theory or concept and interpreted the
relationships between these parts; 3. inferred, predicted and drawn conclusions using relevant economic data;
4. made relevant and accurate calculations and recognised the limitations of economic data;
5. selected appropriate economic theories – matched, compared and cited appropriate examples in
familiar situations. Evaluation Synthesis (17 marks)
(Includes marks for communicating information in a logical way using correct grammar)
The student has:
1. combined component parts to form a new meaningful whole, made predictions and solved problems; 2. made reasoned judgements and recommendations based on the value of ideas and information.
Communication (9 marks)
Candidates will be awarded 9 marks, for communicating information in a logical way using correct grammar.
The student has:
1. presented arguments in a clear, concise, reasoned and objective manner using correct grammar;
2. used presentation aids such as graphs, charts and tables to communicate information in a logical way;
3. displayed logic and coherence in expressing economic arguments;
4. used proper referencing and citations of source materials. Using the example of the standard
Chicago manual style is recommended. (See page 58 for example).
50 CXC A20/U2/09

DETAILED CRITERIA AND MARK SCHEME
CRITERIA 1 Knowledge/Presentation/Methodology
Total 14 marks
The candidate should be able to select and present an investigation into a specific economic problem using appropriate e c o n o m ic concepts, principles, theories and m e t h o d s . Further, t h e methodology employed should be appropriate for the study.
Abilities Descriptors Marks
The candidate has: (a) Presentation (4 marks) 1. selected a relevant economic
problem within the scope of the syllabus (maximum 2 marks)
Title of project is related to the objectives in the syllabus and to the investigation and is clearly stated
Title of project is outside the scope of the
syllabus or not clearly stated
2
0-1
2. listed at least TWO aims of the project (maximum 2 marks)
Aims of the project are relevant, unambiguous and clearly stated
Aims of the project are irrelevant, ambiguous
or not clearly stated
2
0-1
(b) Methodology (6 marks) 3. described the methodology and
procedures employed in conducting the investigation (maximum 6 marks)
The research design is realistic in its scope, in that, the samples, measures and data work together to address the problem being investigated, so as to provide a sound and efficient basis for drawing reasonable conclusions
The research design is limited in its scope,
inappropriate for the study and provides an efficient basis for drawing reasonable conclusions
4-6
0-3
(c) Presentation of data (4 marks) 4. presented economic data in an
acceptable manner using tables, graphs and charts (maximum 4 marks)
Data presented are relevant to the aims of the project, clear, unambiguous and meaningful
Data presented are relevant to the aims of the
project, but lack clarity and efficiency
Data presented are not quite relevant to the aims of the project and lack clarity
4
2-3
0-1
TOTAL 14 marks
51 CXC A20/U2/09
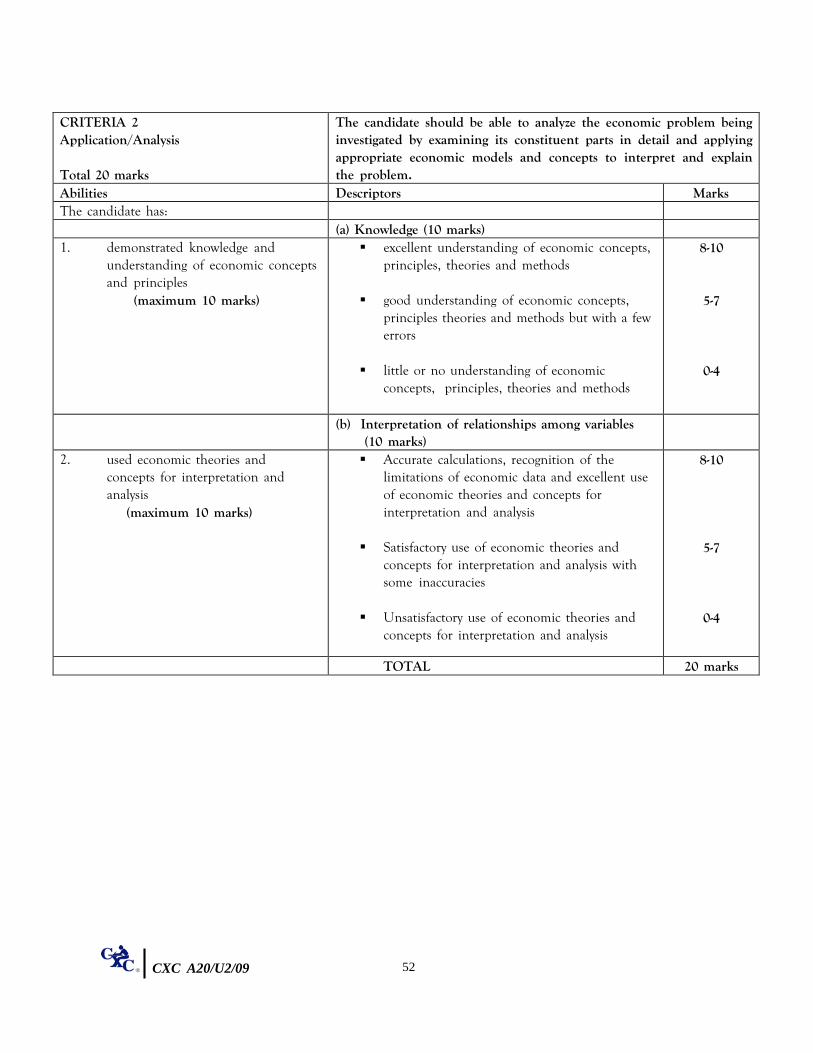
CRITERIA 2 Application/Analysis
Total 20 marks
The candidate should be able to analyze the economic problem being investigated by examining its constituent parts in detail and applying appropriate economic models and concepts to interpret and explain the problem.
Abilities Descriptors Marks The candidate has:
(a) Knowledge (10 marks) 1. demonstrated knowledge and
understanding of economic concepts and principles
(maximum 10 marks)
excellent understanding of economic concepts, principles, theories and methods
good understanding of economic concepts,
principles theories and methods but with a few errors
little or no understanding of economic
concepts, principles, theories and methods
8-10
5-7
0-4
(b) Interpretation of relationships among variables (10 marks)
2. used economic theories and concepts for interpretation and analysis
(maximum 10 marks)
Accurate calculations, recognition of the limitations of economic data and excellent use of economic theories and concepts for interpretation and analysis
Satisfactory use of economic theories and
concepts for interpretation and analysis with some inaccuracies
Unsatisfactory use of economic theories and
concepts for interpretation and analysis
8-10
5-7
0-4
TOTAL 20 marks
52 CXC A20/U2/09

CRITERIA 3 Evaluation/Synthesis
Total 17 Marks
The candidate should be able to develop structured and reasoned expositions on economic policy based on the research and recommend solutions to a specific economic problem based on the findings
Abilities Descriptors Marks
The candidate has: (a) Coherence, Organization and problem solving
capability (10 marks)
1. presented a written report of 1500 - 2000 words (excluding appendices) required for the assignment
(maximum 10 marks)
Report shows coherence, arguments are logically presented and there is evidence of the use or problem solving strategies
The candidate’s major accomplishments or
findings (related to the project) are given The candidate’s findings are the result of sound
interpretation of the evidence derived from the research
3
3
4
(b) Judgments and Recommendations (7 marks) 2. presented theoretically correct
judgments based on the findings of the research
(maximum 7 marks)
Judgments are theoretically sound, plausible and based on the findings of the research
Judgments are theoretically sound but are not
entirely supported by the findings of the research Judgments are theoretically flawed and not based
on the findings of the research
5-7
2-4
0-1
TOTAL 17 marks
53 CXC A20/U2/09
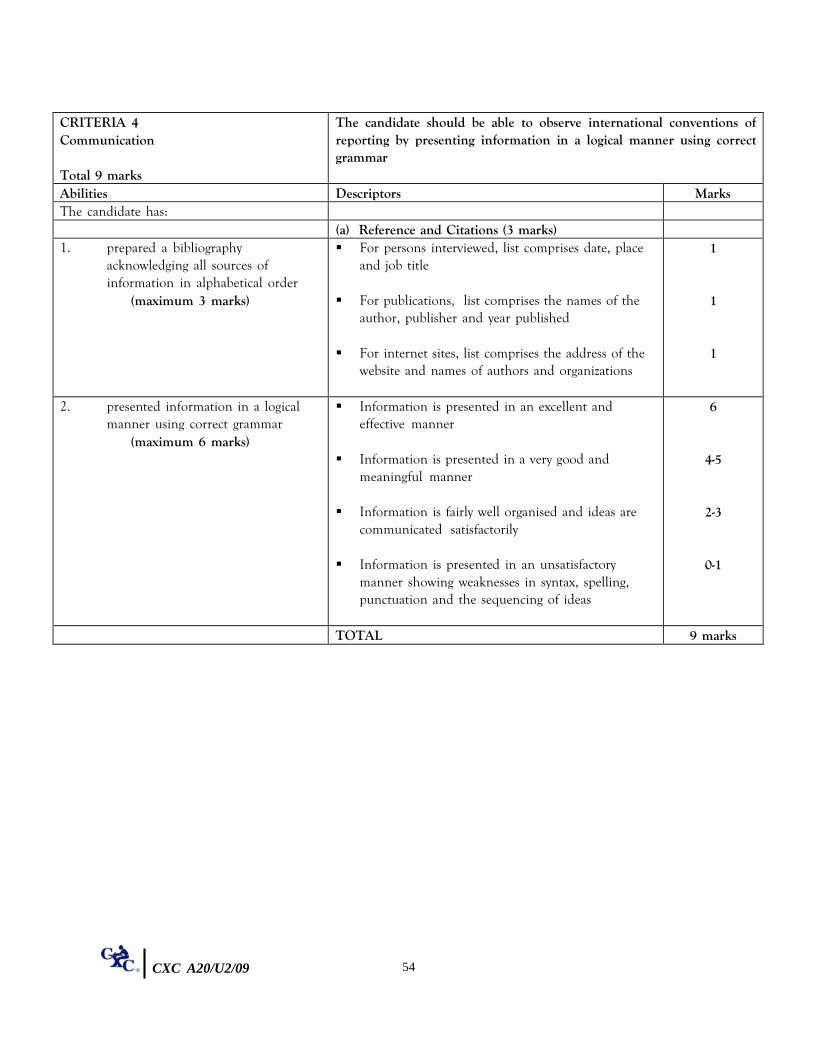
CRITERIA 4 Communication
Total 9 marks
The candidate should be able to observe international conventions of reporting by presenting information in a logical manner using correct grammar
Abilities Descriptors Marks The candidate has:
(a) Reference and Citations (3 marks) 1. prepared a bibliography
acknowledging all sources of information in alphabetical order
(maximum 3 marks)
For persons interviewed, list comprises date, place and job title
For publications, list comprises the names of the
author, publisher and year published For internet sites, list comprises the address of the
website and names of authors and organizations
1
1
1
2. presented information in a logical manner using correct grammar
(maximum 6 marks)
Information is presented in an excellent and effective manner
Information is presented in a very good and
meaningful manner Information is fairly well organised and ideas are
communicated satisfactorily Information is presented in an unsatisfactory
manner showing weaknesses in syntax, spelling, punctuation and the sequencing of ideas
6
4-5
2-3
0-1
TOTAL 9 marks
54 CXC A20/U2/09
Paper 03/2 (1 hour 30 minutes)
1. Number of Questions
This Paper consists of THREE questions, on each Module. The questions will be based on the topic identified for the examination year. These are listed below. The questions may be divided into sub- parts. The Paper tests skills similar to those listed in the Internal Assessment (Paper 03/1).
2. Question Type
Each question requires candidates to respond either in the form of an extended essay or a short paragraph.
3. Mark Allocation
The Paper is worth 60 marks (20 marks per question) and constitutes 20% towards the final assessment.
4. Award of Marks
Marks are awarded for expression, organisation and content.
◆ REGULATIONS FOR PRIVATE CANDIDATES
Private candidates will be required to write Papers 01, 02 and 03/1. Paper 03/2 takes the form of a written examination taken at the end of the academic year. The details of the examination are given below.
UNIT 1 Paper 03/2 ( 1 hour 30 minutes)
This paper consists of three questions; one on each Module. Each question will be worth 20 marks and candidates will be required to attempt all three questions. The topics for the examination years, 2010-2014 are listed below. In investigating a topic, candidates should focus on the relevant specific objectives for each of the three Modules in the Unit.
Unit 1 Topics:
1. Topic for 2010 - Evaluate the role of education as a means of poverty alleviation in
your country.
2.
Topic for 2011
- Investigate the impact of the mobile services operations in your country.
3.
Topic for 2012
- Investigate the operations of a monopoly in your country.
4.
Topic for 2013
- Examine poverty and the distribution of income in your country.
55 CXC A20/U2/09
5. Topic for 2014 - Examine the level of earnings of different categories of workers in your country. Comment on the wage differentials that exist among them.
Unit 2 Topics:
6. Topic for 2010 - Examine fiscal and monetary policy used in your country. Evaluate
their relative effectiveness on employment, income and output.
7.
Topic for 2011
- Investigate the effectiveness of the transportation system in your country and comment on the implications for the rest of the economy.
8.
Topic for 2012
- Investigate the impact of rising oil prices on the economy of your country.
9.
Topic for 2013
- Investigate the unemployment rate existing in your country. Indicate the strategies which your government might adopt to deal with unemployment.
10.
Topic for 2014
- Examine the impact on the environment as a result of increasing levels of housing and other developmental projects.
◆ REGULATIONS FOR RE-SIT CANDIDATES
Re-sit candidates must rewrite Papers 01 and 02 of the examination for the year for which they re-register. Re- sit candidates may elect not to repeat the Internal Assessment component provided they rewrite the examination no later than two years following their first attempt.
Re-sit candidates must be entered through a school or approved educational institution.
56 CXC A20/U2/09
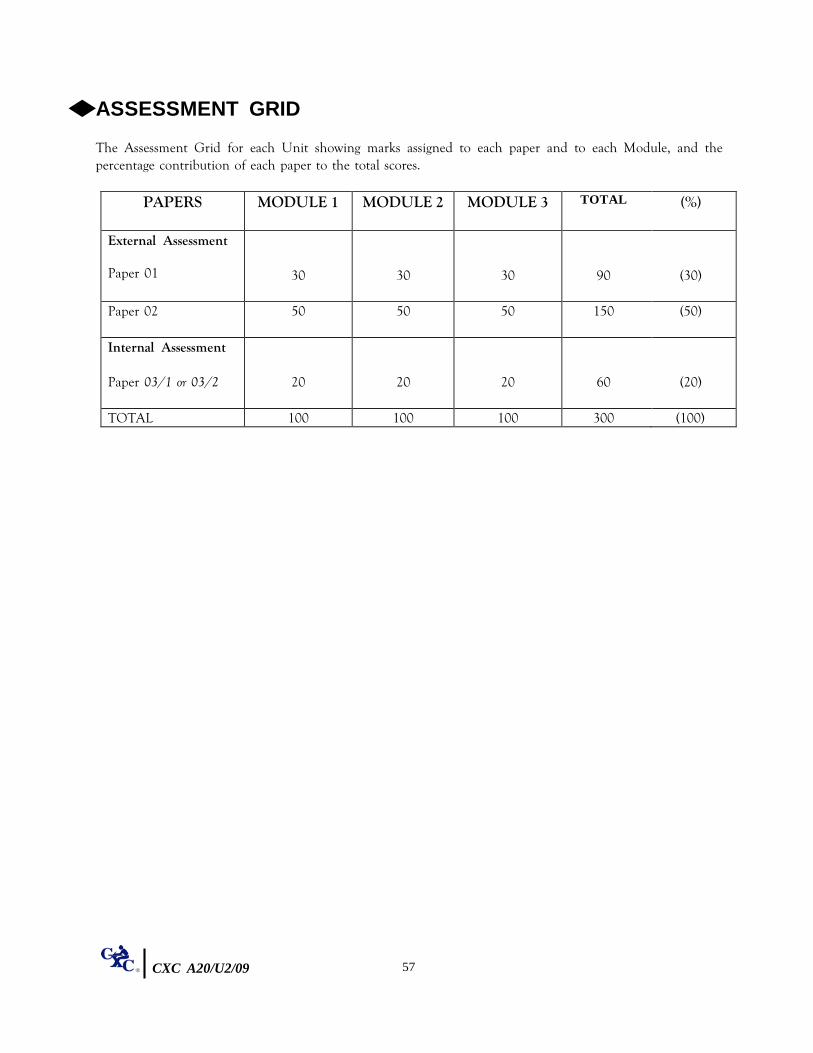
◆ ASSESSMENT GRID
The Assessment Grid for each Unit showing marks assigned to each paper and to each Module, and the percentage contribution of each paper to the total scores.
PAPERS MODULE 1 MODULE 2 MODULE 3 TOTAL (%)
External Assessment Paper 01
30
30
30
90
(30)
Paper 02 50 50 50 150 (50)
Internal Assessment Paper 03/1 or 03/2
20
20
20
60
(20)
TOTAL 100 100 100 300 (100)
57 CXC A20/U2/09

◆ RESOURCES
Anderton, A. Economics, 4th Edition, Causeway Press, 2006.
Baumol, W. and Blinder, A. Economic Principles and Policy, Florida: Harcourt Brace and Company, 1998.
Begg, D., Fisher, S. and Economics, 8th Edition, London: McGraw-Hill International (UK) Limited, Dornbusch, R. 2005.
Hosein, R., and Gookool, R. Cape Economics Study Guide Unit 1, Caribbean Examinations Council, 2007.
Lipsey, R. and Chrystal, K. Principles of Economics, 13th Edition, New York: Oxford University Press Inc., 2006.
McConnell, C. and Brue, S. Economics: Principles, Problems and Policies, New York: McGraw-Hill Inc.,
1992.
Sloman, J. Economics, 6th Edition, Prentice Hall, 2006.
Todaro, M. Economics for a Developing World, New York: Longman, 1986.
REPORTS AND BULLETINS
Central Bank Economic Reports, Annual Economic Reports, Quarterly Economic Bulletins, Statistical Digest from Central Banks such as ECCB, CBTT, BOJ, CBB, CBG.
Central Statistical Services. Balance of Payments, and National Income Accounts, Survey of Living Conditions, Household Budgetary Surveys.
Economic Planning Units Economic Reviews, Sectoral Reports from Planning Units such as PIOJ, and Ministries of Planning across the region.
UNDP Human Development Reports.
World Bank Reports, such as World Development Reports.
Periodicals such as Businessweek, Newsweek, Fortune, Economist, Forbes and the business pages of news papers such as Jamaica Gleaner, Trinidad Guardian or Express, Barbados Advocate.
Budget Speeches, Public Sector Investment Programmes, Ministry of Finance Review of the Economy, and estimates of Revenue and expenditures for various territories.
58 CXC A20/U2/09
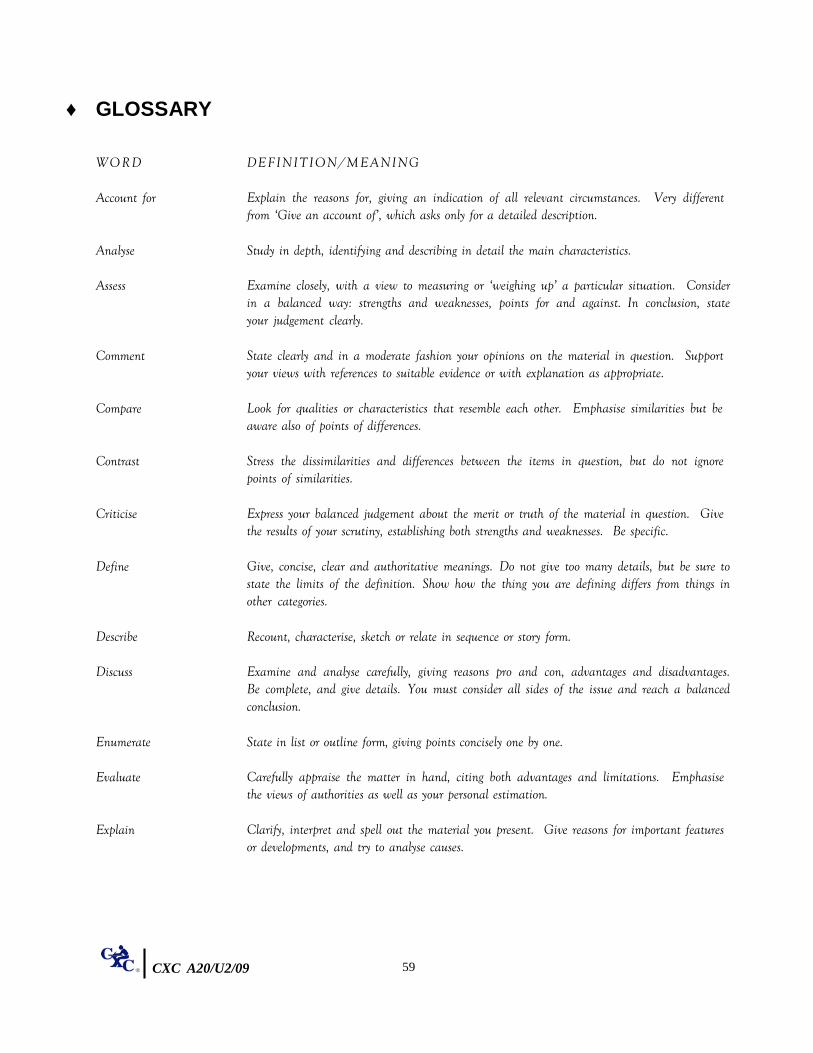
♦ GLOSSARY WO R D
DE F I NI T I O N/ M E A NI NG
Account for
Explain the reasons for, giving an indication of all relevant circumstances. Very different from ‘Give an account of’, which asks only for a detailed description.
Analyse
Study in depth, identifying and describing in detail the main characteristics.
Assess
Examine closely, with a view to measuring or ‘weighing up’ a particular situation. Consider in a balanced way: strengths and weaknesses, points for and against. In conclusion, state your judgement clearly.
Comment
State clearly and in a moderate fashion your opinions on the material in question. Support your views with references to suitable evidence or with explanation as appropriate.
Compare
Look for qualities or characteristics that resemble each other. Emphasise similarities but be aware also of points of differences.
Contrast
Stress the dissimilarities and differences between the items in question, but do not ignore points of similarities.
Criticise
Express your balanced judgement about the merit or truth of the material in question. Give the results of your scrutiny, establishing both strengths and weaknesses. Be specific.
Define
Give, concise, clear and authoritative meanings. Do not give too many details, but be sure to state the limits of the definition. Show how the thing you are defining differs from things in other categories.
Describe
Recount, characterise, sketch or relate in sequence or story form.
Discuss
Examine and analyse carefully, giving reasons pro and con, advantages and disadvantages. Be complete, and give details. You must consider all sides of the issue and reach a balanced conclusion.
Enumerate
State in list or outline form, giving points concisely one by one.
Evaluate
Carefully appraise the matter in hand, citing both advantages and limitations. Emphasise the views of authorities as well as your personal estimation.
Explain
Clarify, interpret and spell out the material you present. Give reasons for important features or developments, and try to analyse causes.
59 CXC A20/U2/09

WO R D DE F I NI T I O N/ M E A NI NG How far… Similar to questions based on the “To what extent…” approach. Here you are expected to
make your case or present your material in the usual way. Illustrate Use specific examples, allusions, figures or diagrams to explain, demonstrate or clarify a
problem, situation or view. Interpret Translate, give examples of, express in simple terms or comment on a subject, usually giving
your judgement about it. Justify Prove, make out a case or give reasons for decisions or conclusions, taking pains to be
convincing. List As in ‘enumerate’, write an itemised series of concise statements.
Outline Provide a framework describing under main point and subordinate points, omitting minor
details and stressing the arrangement or classification of the material. Prove Establish that something is true by citing factual evidence or giving clear reasons.
Relate Show how things are related to or connected with each other, or how one causes another,
correlates with another, or is like another. Review Examine a subject critically, analyzing and commenting on the important points and stages
of development. State Present the main points in brief, clear sequences.
Summarise Give the main points or facts in condensed form, omitting details and illustrations.
Trace Describe in narrative form, progress, development or sequence of events from some point of
origin. Wes t e r n Z o n e O f f i c e 13 March 2009
60 CXC A20/U2/09

C A R I B B E A N E X A M I N A T I O N S C O U N C I L
ADVANCED PROFICIENCY EXAMINATION
SPECIMEN PAPERMULTIPLE CHOICE QUESTIONS
FOR
ECONOMICS
UNIT 1
90 minutes
READ THE FOLLOWING INSTRUCTIONS CAREFULLY.
Each item in this test has four suggested answers lettered (A), (B), (C), (D). Read each item you are
about to answer and decide which choice is best.
Sample Item
Prime cost is calculated by adding direct factory expenses to the
Sample Answer
(A) cost of goods sold
(B) sale of fixed assets A B C D
(C) sale of finished goods
(D) cost of materials used
The best answer to this item is “cost of materials used”, so answer space (D) has been shaded.
Copyright © 2008 Caribbean Examinations Council ®.
All rights reserved.
02116010/SPEC 2008
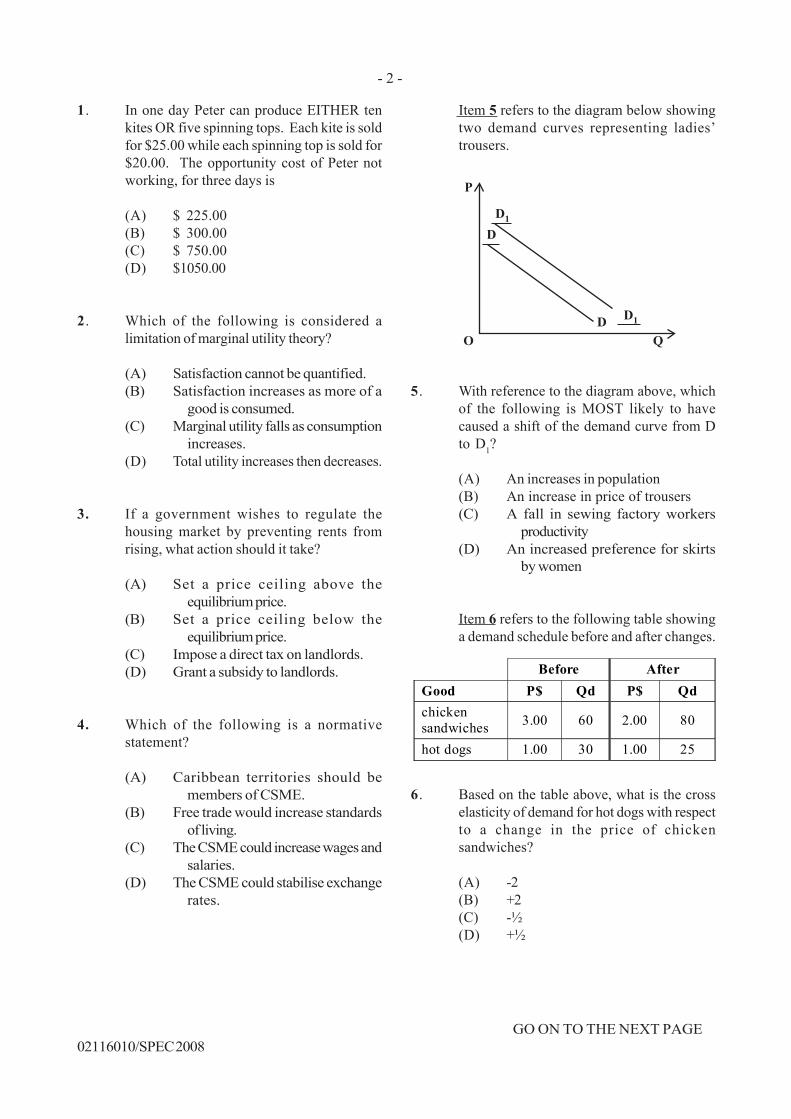
- 2 -
GO ON TO THE NEXT PAGE
02116010/SPEC 2008
P
O Q
D
D
D1
D1
1. In one day Peter can produce EITHER ten
kites OR five spinning tops. Each kite is sold
for $25.00 while each spinning top is sold for
$20.00. The opportunity cost of Peter not
working, for three days is
(A) $ 225.00
(B) $ 300.00
(C) $ 750.00
(D) $1050.00
2. Which of the following is considered a
limitation of marginal utility theory?
(A) Satisfaction cannot be quantified.
(B) Satisfaction increases as more of a
good is consumed.
(C) Marginal utility falls as consumption
increases.
(D) Total utility increases then decreases.
3. If a government wishes to regulate the
housing market by preventing rents from
rising, what action should it take?
(A) Set a price ceiling above the
equilibrium price.
(B) Set a price ceiling below the
equilibrium price.
(C) Impose a direct tax on landlords.
(D) Grant a subsidy to landlords.
4. Which of the following is a normative
statement?
(A) Caribbean territories should be
members of CSME.
(B) Free trade would increase standards
of living.
(C) The CSME could increase wages and
salaries.
(D) The CSME could stabilise exchange
rates.
Item 5 refers to the diagram below showing
two demand curves representing ladies’
trousers.
5. With reference to the diagram above, which
of the following is MOST likely to have
caused a shift of the demand curve from D
to D1?
(A) An increases in population
(B) An increase in price of trousers
(C) A fall in sewing factory workers
productivity
(D) An increased preference for skirts
by women
Item 6 refers to the following table showing
a demand schedule before and after changes.
6. Based on the table above, what is the cross
elasticity of demand for hot dogs with respect
to a change in the price of chicken
sandwiches?
(A) -2
(B) +2
(C) -½
(D) +½
Before After
Good P$ Qd P$ Qd
chicken sandwiches
3.00 60 2.00 80
hot dogs 1.00 30 1.00 25

- 3 -
GO ON TO THE NEXT PAGE
02116010/SPEC 2008
7. The BEST factor combination for a firm
operating at least cost would be
(A)a
b
b
a
P
MPP
P
MPP=
(B)a
b
b
a
MRP
P
MRP
P=
(C)b
b
a
a
P
MPP
P
MPP=
(D)b
b
a
a
P
MRP
P
MRP=
Item 8 refers to the diagram below which
represents a firm operating under perfect
competition.
8. Which of the following segments represents
the short run supply of the firm?
(A) DE
(B) CE
(C) BE
(D) AE
C
B
A
D
D
E
F
S
QQ1
S1
0
Items 9 - 10 refer to the following diagram
showing a change in supply after a fixed tax
was imposed.
9. The portion of the tax paid by the seller of
the commodity is given as
(A) ABEF
(B) ACDE
(C) ACDF
(D) BCDE
10. The portion of the tax paid by the buyer of
the commodity is given as
(A) BCDE
(B) ACDF
(C) ACDE
(D) ABEF
MC
ATC
AVC
A
B
C
D
E
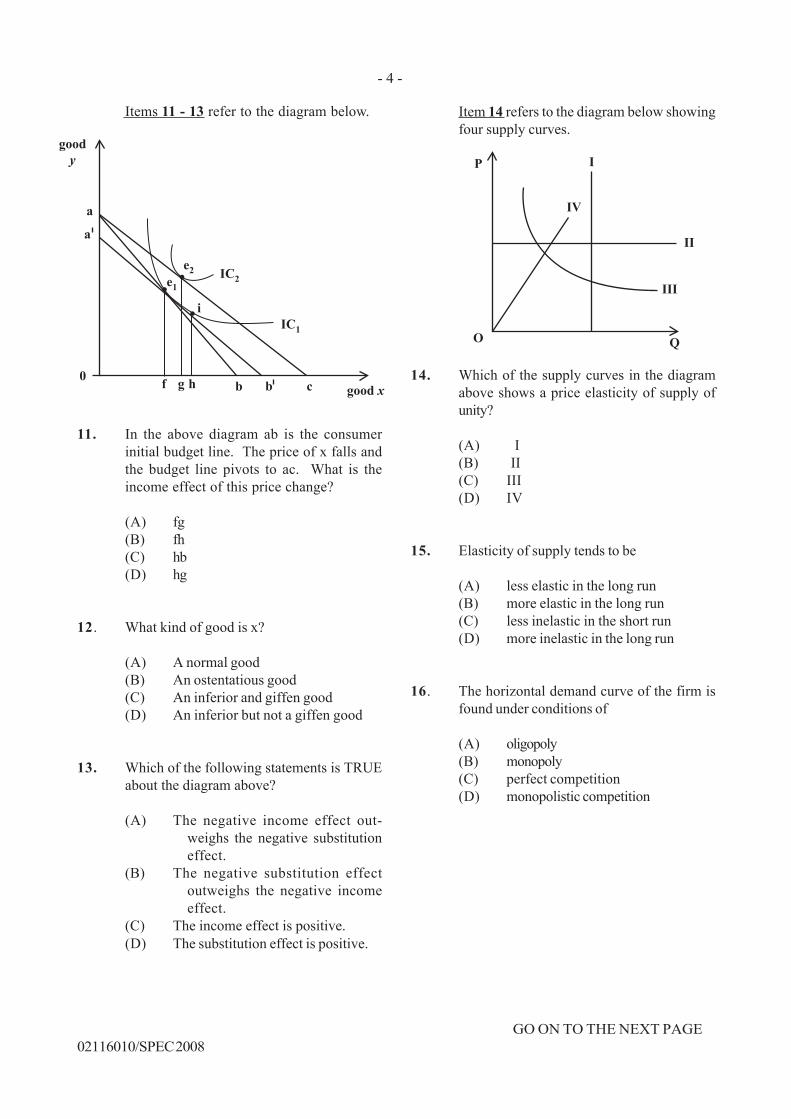
- 4 -
GO ON TO THE NEXT PAGE
02116010/SPEC 2008
f g h
a
b c good x
good
y
IC2
IC1
e2
e1
i
a
b0
Items 11 - 13 refer to the diagram below.
11. In the above diagram ab is the consumer
initial budget line. The price of x falls and
the budget line pivots to ac. What is the
income effect of this price change?
(A) fg
(B) fh
(C) hb
(D) hg
12. What kind of good is x?
(A) A normal good
(B) An ostentatious good
(C) An inferior and giffen good
(D) An inferior but not a giffen good
13. Which of the following statements is TRUE
about the diagram above?
(A) The negative income effect out-
weighs the negative substitution
effect.
(B) The negative substitution effect
outweighs the negative income
effect.
(C) The income effect is positive.
(D) The substitution effect is positive.
Item 14 refers to the diagram below showing
four supply curves.
14. Which of the supply curves in the diagram
above shows a price elasticity of supply of
unity?
(A) I
(B) II
(C) III
(D) IV
15. Elasticity of supply tends to be
(A) less elastic in the long run
(B) more elastic in the long run
(C) less inelastic in the short run
(D) more inelastic in the long run
16. The horizontal demand curve of the firm is
found under conditions of
(A) oligopoly
(B) monopoly
(C) perfect competition
(D) monopolistic competition
I
II
III
IV
P
O Q
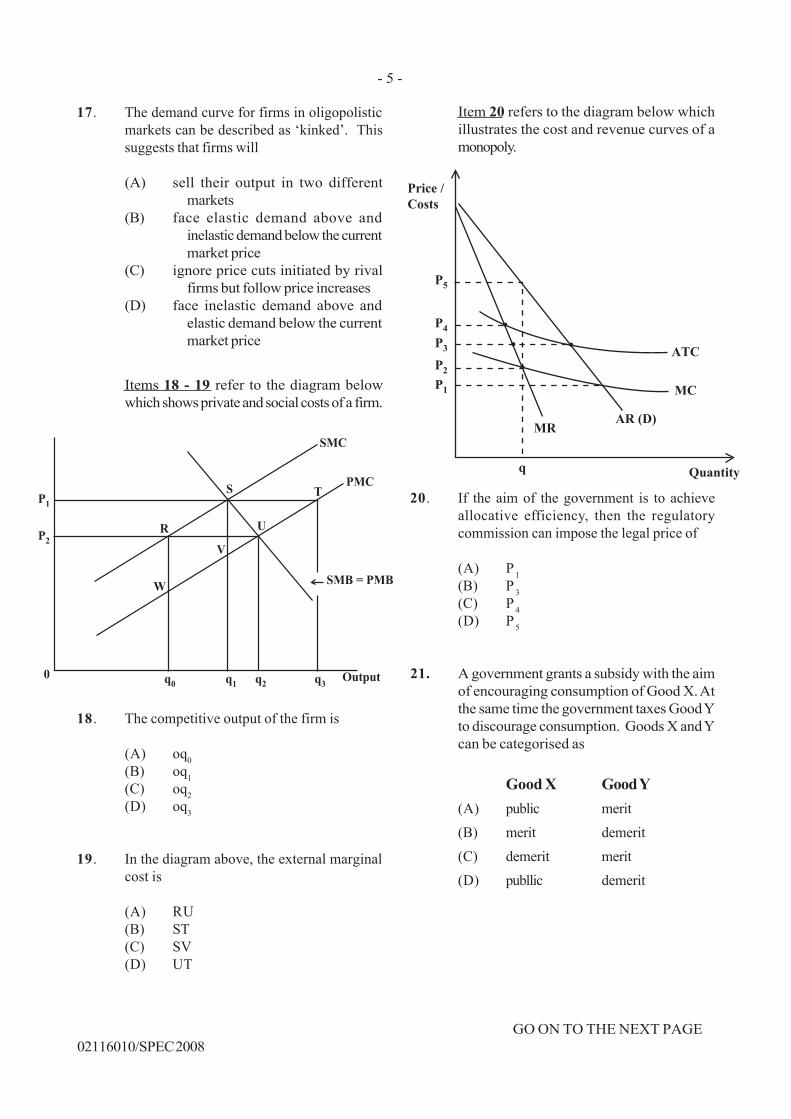
- 5 -
GO ON TO THE NEXT PAGE
02116010/SPEC 2008
SMC
SMB = PMB
PMCS T
U
V
R
W
Output
P1
q0 q1 q2 q3
P2
0
17. The demand curve for firms in oligopolistic
markets can be described as ‘kinked’. This
suggests that firms will
(A) sell their output in two different
markets
(B) face elastic demand above and
inelastic demand below the current
market price
(C) ignore price cuts initiated by rival
firms but follow price increases
(D) face inelastic demand above and
elastic demand below the current
market price
Items 18 - 19 refer to the diagram below
which shows private and social costs of a firm.
18. The competitive output of the firm is
(A) oq0
(B) oq1
(C) oq2
(D) oq3
19. In the diagram above, the external marginal
cost is
(A) RU
(B) ST
(C) SV
(D) UT
Price /
Costs
P5
P4
P3
P2
P1
q
MRAR (D)
ATC
MC
Quantity
Item 20 refers to the diagram below which
illustrates the cost and revenue curves of a
monopoly.
20. If the aim of the government is to achieve
allocative efficiency, then the regulatory
commission can impose the legal price of
(A) P1
(B) P3
(C) P4
(D) P5
21. A government grants a subsidy with the aim
of encouraging consumption of Good X. At
the same time the government taxes Good Y
to discourage consumption. Goods X and Y
can be categorised as
Good X Good Y
(A) public merit
(B) merit demerit
(C) demerit merit
(D) publlic demerit
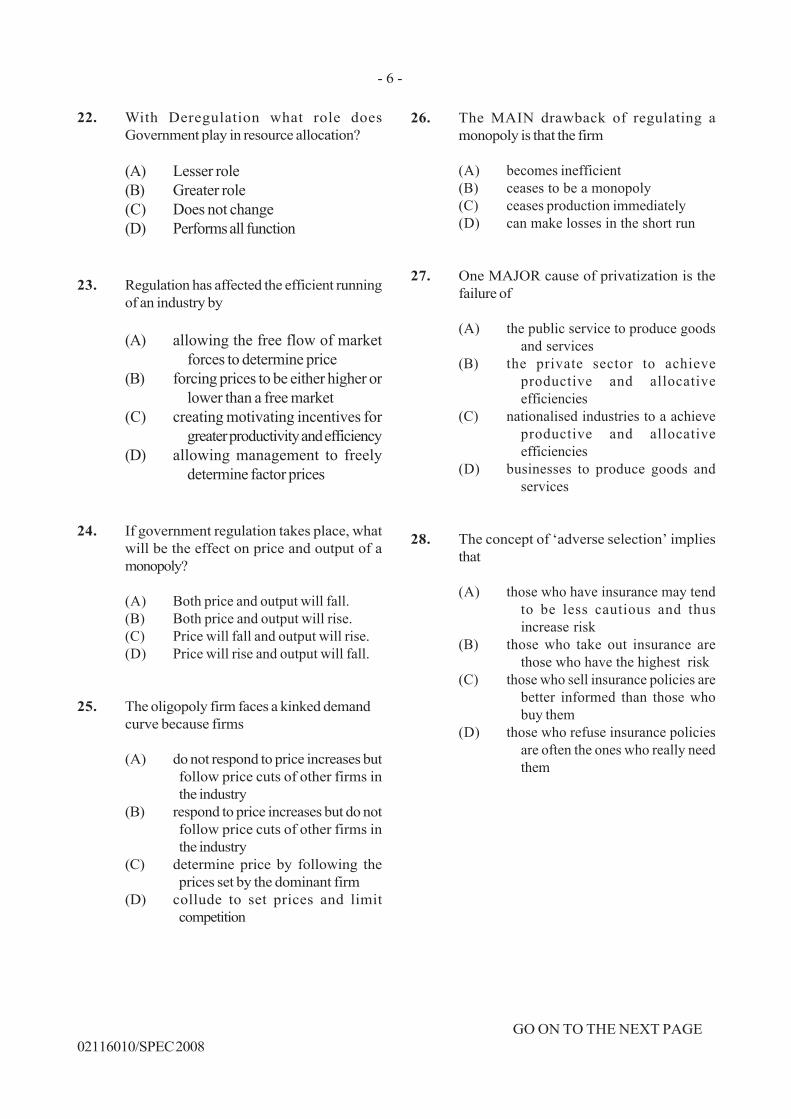
- 6 -
GO ON TO THE NEXT PAGE
02116010/SPEC 2008
22. With Deregulation what role does
Government play in resource allocation?
(A) Lesser role
(B) Greater role
(C) Does not change
(D) Performs all function
23. Regulation has affected the efficient running
of an industry by
(A) allowing the free flow of market
forces to determine price
(B) forcing prices to be either higher or
lower than a free market
(C) creating motivating incentives for
greater productivity and efficiency
(D) allowing management to freely
determine factor prices
24. If government regulation takes place, what
will be the effect on price and output of a
monopoly?
(A) Both price and output will fall.
(B) Both price and output will rise.
(C) Price will fall and output will rise.
(D) Price will rise and output will fall.
25. The oligopoly firm faces a kinked demand
curve because firms
(A) do not respond to price increases but
follow price cuts of other firms in
the industry
(B) respond to price increases but do not
follow price cuts of other firms in
the industry
(C) determine price by following the
prices set by the dominant firm
(D) collude to set prices and limit
competition
26. The MAIN drawback of regulating a
monopoly is that the firm
(A) becomes inefficient
(B) ceases to be a monopoly
(C) ceases production immediately
(D) can make losses in the short run
27. One MAJOR cause of privatization is the
failure of
(A) the public service to produce goods
and services
(B) the private sector to achieve
productive and allocative
efficiencies
(C) nationalised industries to a achieve
productive and allocative
efficiencies
(D) businesses to produce goods and
services
28. The concept of ‘adverse selection’ implies
that
(A) those who have insurance may tend
to be less cautious and thus
increase risk
(B) those who take out insurance are
those who have the highest risk
(C) those who sell insurance policies are
better informed than those who
buy them
(D) those who refuse insurance policies
are often the ones who really need
them

- 7 -
GO ON TO THE NEXT PAGE
02116010/SPEC 2008
29. Harry drives to and from work daily. He is
usually a very safe driver. Because of his
accident free record, he was offered a life
insurance policy with a reputable insurance
company, which he accepted. Subsequently,
Harry began to drive recklessly. What
problem did the insurance company
encounter?
(A) Moral hazard
(B) Market failure
(C) Adverse selection
(D) Asymetric information
30. The current output of a perfectly competitive
firm is where marginal cost is less than
marginal revenue. In order to maximize profit
this firm must
(A) increase output and price
(B) decrease output and increase price
(C) decrease output and maintain price
(D) increase output and maintain price
31. Which of the following is explained by the
Theory of Income Distribution?
(A) How wages and salaries are
distributed among income earners
(B) How factor rewards are allocated to
the factors of production
(C) Government’s attempt to address the
problem of income inequalities
(D) Income earner’s efforts to increase
their incomes
Item 32 refers to the following graph which
depicts the demand for and supply of labour.
32. The shaded area in the graph above
represents
(A) economic rent
(B) transfer earnings
(C) producers’ surplus
(D) marginal revenue product
33. A country’s labour supply can be measured
by the number of
(A) hours workers work at a given wage
(B) workers willing and able to work at
a given wage
(C) workers entering the potential labour
force at a given wage
(D) workers employed at a given wage
34. The ‘minimum level of income required to
satisfy basic needs’ refers to
(A) general poverty
(B) relative poverty
(C) the poverty line
(D) absolute poverty
No. of hours worked
MRP
SL
E
Wa
ges
W0
Q0
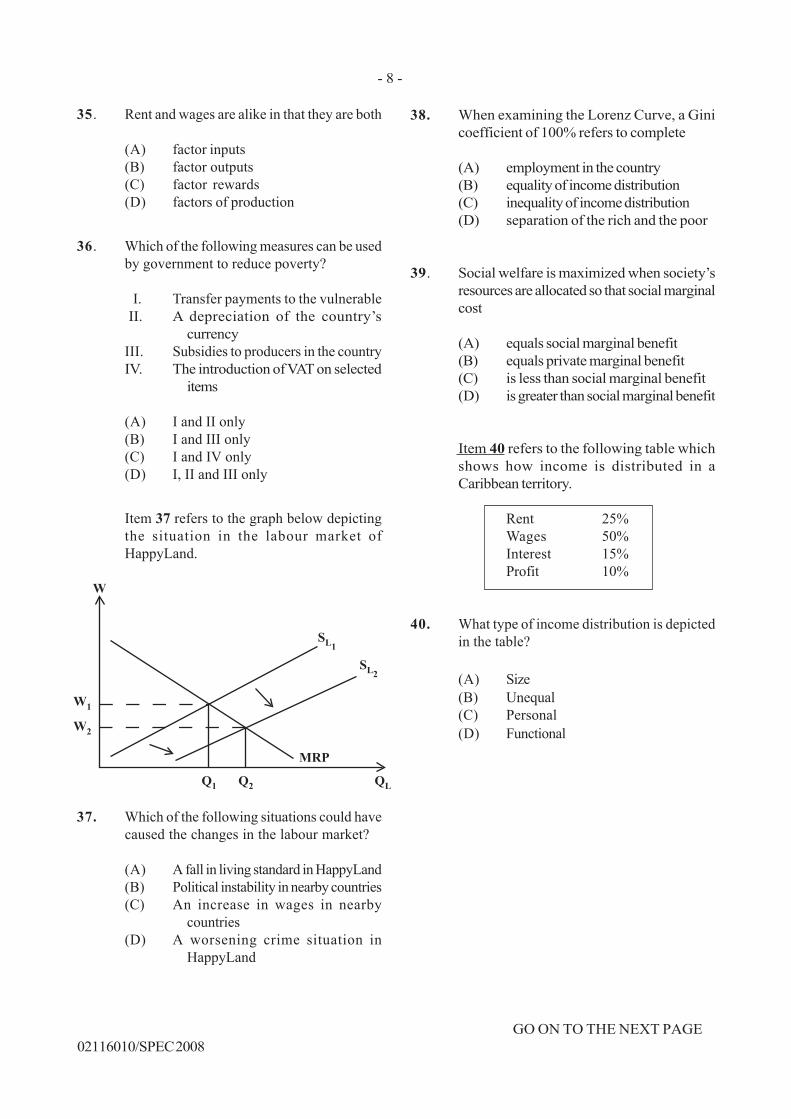
- 8 -
GO ON TO THE NEXT PAGE
02116010/SPEC 2008
35. Rent and wages are alike in that they are both
(A) factor inputs
(B) factor outputs
(C) factor rewards
(D) factors of production
36. Which of the following measures can be used
by government to reduce poverty?
I. Transfer payments to the vulnerable
II. A depreciation of the country’s
currency
III. Subsidies to producers in the country
IV. The introduction of VAT on selected
items
(A) I and II only
(B) I and III only
(C) I and IV only
(D) I, II and III only
Item 37 refers to the graph below depicting
the situation in the labour market of
HappyLand.
37. Which of the following situations could have
caused the changes in the labour market?
(A) A fall in living standard in HappyLand
(B) Political instability in nearby countries
(C) An increase in wages in nearby
countries
(D) A worsening crime situation in
HappyLand
W1
W
W2
Q1 Q2
MRP
QL
SL1
SL2
38. When examining the Lorenz Curve, a Gini
coefficient of 100% refers to complete
(A) employment in the country
(B) equality of income distribution
(C) inequality of income distribution
(D) separation of the rich and the poor
39. Social welfare is maximized when society’s
resources are allocated so that social marginal
cost
(A) equals social marginal benefit
(B) equals private marginal benefit
(C) is less than social marginal benefit
(D) is greater than social marginal benefit
Item 40 refers to the following table which
shows how income is distributed in a
Caribbean territory.
Rent 25%
Wages 50%
Interest 15%
Profit 10%
40. What type of income distribution is depicted
in the table?
(A) Size
(B) Unequal
(C) Personal
(D) Functional
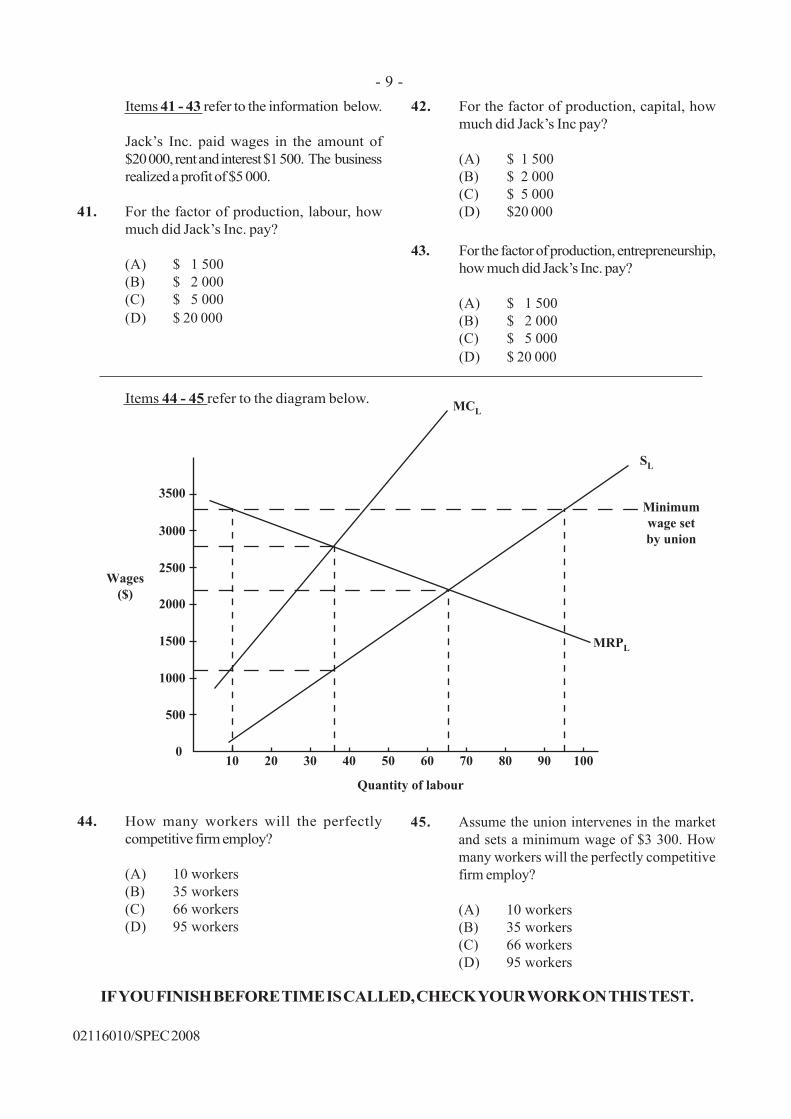
0
500
1000
1500
2000
2500
3000
3500
10 20 30 40 50 60 70 80 90 100
Quantity of labour
Wages
($)
MCL
MRPL
SL
Minimum
wage set
by union
Items 44 - 45 refer to the diagram below.
44. How many workers will the perfectly
competitive firm employ?
(A) 10 workers
(B) 35 workers
(C) 66 workers
(D) 95 workers
45. Assume the union intervenes in the market
and sets a minimum wage of $3 300. How
many workers will the perfectly competitive
firm employ?
(A) 10 workers
(B) 35 workers
(C) 66 workers
(D) 95 workers
- 9 -
02116010/SPEC 2008
IF YOU FINISH BEFORE TIME IS CALLED, CHECK YOUR WORK ON THIS TEST.
Items 41 - 43 refer to the information below.
Jack’s Inc. paid wages in the amount of
$20 000, rent and interest $1 500. The business
realized a profit of $5 000.
41. For the factor of production, labour, how
much did Jack’s Inc. pay?
(A) $ 1 500
(B) $ 2 000
(C) $ 5 000
(D) $ 20 000
42. For the factor of production, capital, how
much did Jack’s Inc pay?
(A) $ 1 500
(B) $ 2 000
(C) $ 5 000
(D) $20 000
43. For the factor of production, entrepreneurship,
how much did Jack’s Inc. pay?
(A) $ 1 500
(B) $ 2 000
(C) $ 5 000
(D) $ 20 000

/CAPE/SPEC/MS/2010
C A R I B B E A N E X A M I N A T I O N S C O U N C I L
ADVANCED PROFICIENCY EXAMINATION
ECONOMICS
SPECIMEN PAPER
UNIT 1 - PAPER 1
MARK SCHEME

C A R I B B E A N E X A M I N A T I O N S C O U N C I L
SECONDARY EDUCATION CERTIFICATE
EXAMINATION
ECONOMICS - UNIT 1
SPECIMEN PAPER 2008
Item �o. Key
1 C
2 A
3 B
4 A
5 A
6 D
7 C
8 B
9 A
10 A
11 D
12 D
13 B
14 D
15 B
16 C
17 B
18 C
19 C
20 A
21 B
22 A
23 B
Item �o. Key
24 C
25 A
26 D
27 C
28 B
29 A
30 D
31 B
32 B
33 B
34 C
35 C
36 B
37 B
38 C
39 A
40 D
41 D
42 A
43 C
44 C
45 A

TEST CODE: 021160
FORM TP 02116020/SPEC /2010
CARIBBEA� EXAMI�ATIO�S COU�CIL
ADVA�CED PROFICIE�CY EXAMI�ATIO�
ECO�OMICS
SPECIME� PAPER
U�IT 1
PAPER 02
2 ½ hours
I�STRUCTIO�S TO CA�DIDATES
1. This paper consists of THREE sections. 2. Each section consists of TWO questions. Candidates MUST answer THREE questions, O�E from EACH section. 3. Answers for ALL questions must be written in the answer booklet provided. 4 . Candidates may use si lent non-programmable calculators.
Examination Materials
Mathematical formulae and tables Electronic calculator Ruler and graph paper
Copyright © 2008 Caribbean Examinations Council ®ll rights reserved
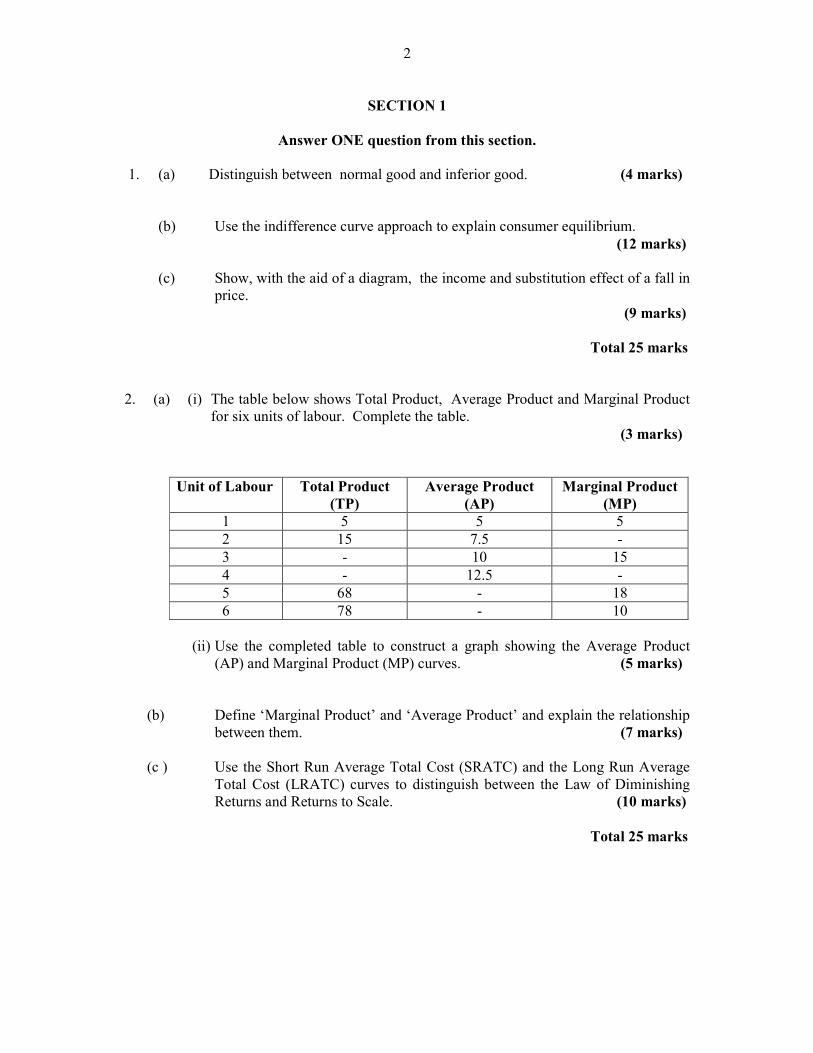
2
SECTIO� 1
Answer O�E question from this section.
1. (a) Distinguish between normal good and inferior good. (4 marks)
(b) Use the indifference curve approach to explain consumer equilibrium.
(12 marks)
(c) Show, with the aid of a diagram, the income and substitution effect of a fall in
price.
(9 marks)
Total 25 marks
2. (a) (i) The table below shows Total Product, Average Product and Marginal Product for six units of labour. Complete the table.
(3 marks)
Unit of Labour Total Product
(TP)
Average Product
(AP)
Marginal Product
(MP)
1 5 5 5
2 15 7.5 -
3 - 10 15
4 - 12.5 -
5 68 - 18
6 78 - 10
(ii) Use the completed table to construct a graph showing the Average Product
(AP) and Marginal Product (MP) curves. (5 marks)
(b) Define ‘Marginal Product’ and ‘Average Product’ and explain the relationship
between them. (7 marks)
(c ) Use the Short Run Average Total Cost (SRATC) and the Long Run Average Total Cost (LRATC) curves to distinguish between the Law of Diminishing Returns and Returns to Scale. (10 marks)
Total 25 marks

3
SECTIO� 1I
Answer O�E question from this section 3. (a) (i) Define the term ‘externality’. (2 marks)
(ii) Give ONE example of a positive externality and ONE example of a
negative externality. (2 marks)
(b) (i) Explain what is meant by the term ‘market failure’. (2 marks)
(ii) Show graphically how a monopoly and merit goods contribute to
market failure. (10 marks)
(c ) Evaluate THREE measure that the government can use to correct market failure caused by monopoly. (9 marks)
4. (a) Distinguish between ‘normal profit’ and ‘abnormal profit’.
(4 marks)
(b) (i) State TWO characteristics of the monopolistic competitive market structure. (2 marks)
(ii) Draw a diagram of a firm in monopolistic competition earning abnormal profits in the short run. Shade the area that represents the abnormal profit earned. (6 marks)
(iii) Explain what will happen to the abnormal profit of the firm in monopolistic competition in the long run. Give ONE reason to justify your answer. (5 marks)
(c) Compare the long run situation of a firm in a monopolistic competition with that of a firm in perfect competition by referring to the type of profits earned, the entry and the productive efficiency of firms. (8 marks)
Total 25 marks

4
SECTIO� III
Answer O�E question from this section
5. (a) Explain, using a suitable example, the ‘least cost rule’ in the marginal productivity theory of demand for labour and capital. (6 marks)
(b) (i) Explain how Marginal Revenue Product is calculated. (2 marks)
(ii) Given that labour and capital are hired in a purely competitive market and the price of labour is $16, the price of capital is $8, and the product is sold for $2, complete the table below.
Quantity of
Labour
Total
Product
of
Labour
Marginal
Revenue
Product
of Labour
Quantity
of
Capital
Total
Product of
Capital
Marginal
Revenue
Product of
Capital
0 0 0 0
1 10 1 12
2 24 2 20
3 38 3 27
4 46 4 32
5 49 5 36
(6 marks)
(iii) State the rule for profit maximizing for the employment of factors of production. (2 marks)
(iv) Use the information in the completed table to identify the profit
maximizing quantity of labour and capital that will be employed. Explain your answer. (4 marks)
(c) Discuss ONE limitation of the Marginal Productivity Theory. (5 marks)
Total 25 marks
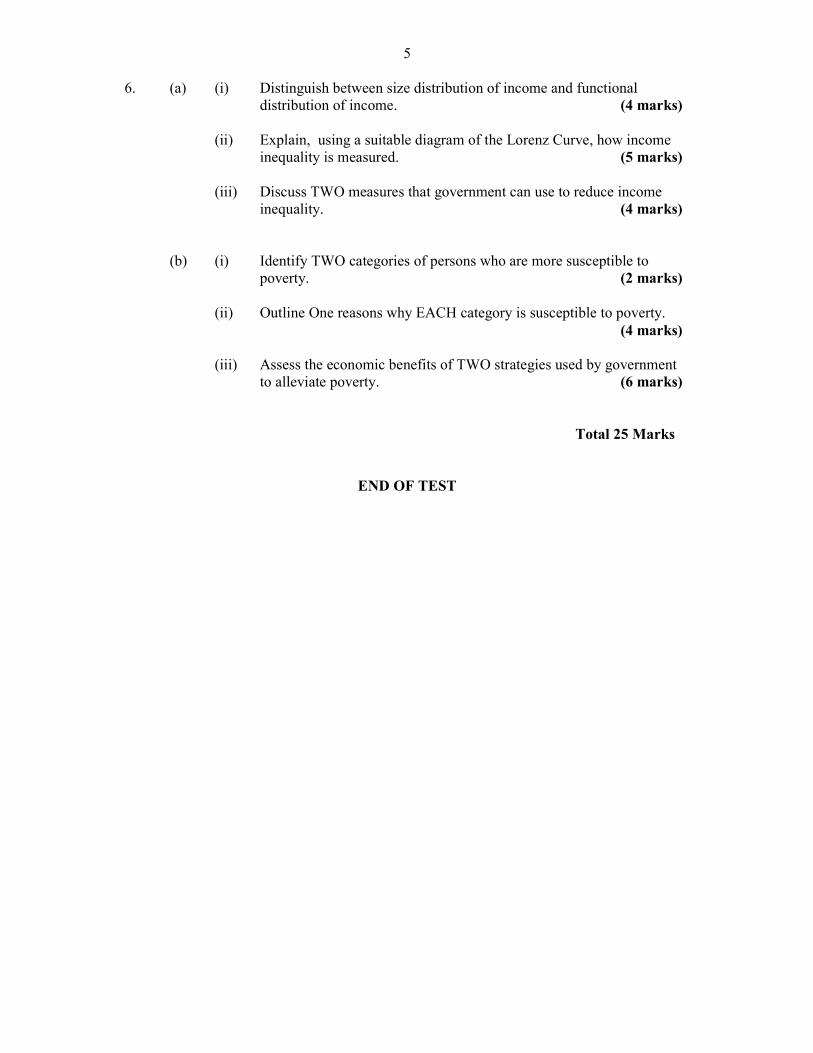
5 6. (a) (i) Distinguish between size distribution of income and functional
distribution of income. (4 marks)
(ii) Explain, using a suitable diagram of the Lorenz Curve, how income inequality is measured. (5 marks)
(iii) Discuss TWO measures that government can use to reduce income
inequality. (4 marks)
(b) (i) Identify TWO categories of persons who are more susceptible to
poverty. (2 marks)
(ii) Outline One reasons why EACH category is susceptible to poverty.
(4 marks)
(iii) Assess the economic benefits of TWO strategies used by government to alleviate poverty. (6 marks)
Total 25 Marks
E�D OF TEST
/CAPE/SPEC/MS/2010
C A R I B B E A N E X A M I N A T I O N S C O U N C I L
ADVANCED PROFICIENCY EXAMINATION
ECONOMICS
SPECIMEN PAPER
UNIT 1 - PAPER 02
ANSWER KEY AND
MARK SCHEME
2
ECONOMICS
UNIT 1
Key/Mark Scheme
QUESTION 1
(a) Differentiate between normal good and inferior good. (4 marks)
Indicating that a normal good has:
OR
• A positive relationship between income and quantity demanded.
K/C (1 mark)
Indicating that interior good has:
OR
• A negative relationship between income and quantity demanded.
K/C (1 mark)
Indicating that the differences are:
• For inferior good relationship between price and quantity
demanded can be positive or negative while for normal goods it
is only negative.
OR
• Relationship between income and quantity demanded is positive
for normal and negative for inferior goods.
K/C (2 mark)
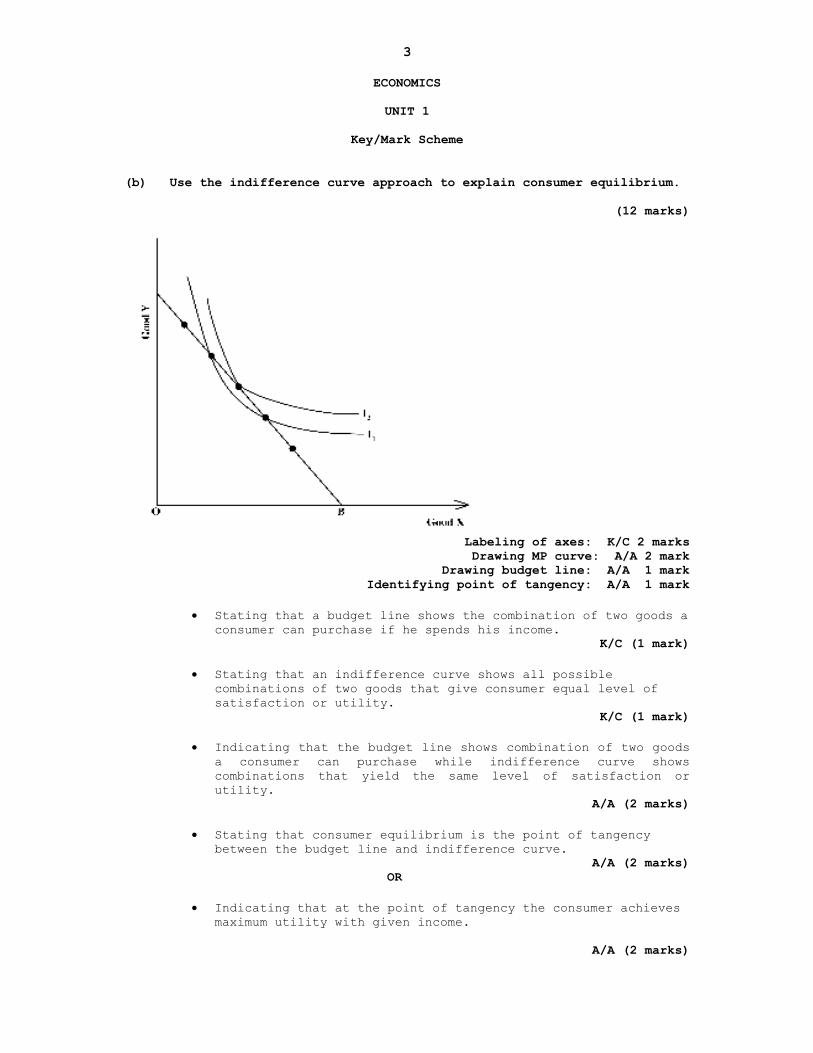
3
ECONOMICS
UNIT 1
Key/Mark Scheme
(b) Use the indifference curve approach to explain consumer equilibrium.
(12 marks)
Labeling of axes: K/C 2 marks Drawing MP curve: A/A 2 mark
Drawing budget line: A/A 1 mark
Identifying point of tangency: A/A 1 mark
• Stating that a budget line shows the combination of two goods a
consumer can purchase if he spends his income.
K/C (1 mark)
• Stating that an indifference curve shows all possible
combinations of two goods that give consumer equal level of
satisfaction or utility.
K/C (1 mark)
• Indicating that the budget line shows combination of two goods
a consumer can purchase while indifference curve shows
combinations that yield the same level of satisfaction or
utility.
A/A (2 marks)
• Stating that consumer equilibrium is the point of tangency
between the budget line and indifference curve.
A/A (2 marks) OR
• Indicating that at the point of tangency the consumer achieves
maximum utility with given income.
A/A (2 marks)

4
ECONOMICS
UNIT 1
Key/Mark Scheme
(c) With the aid of a diagram, show, the income and substitution of a fall in price
(9 marks)
• Showing original equal (point E) A/A (1 mark)
• Showing equilibrium because of price change (point C) A/A (1 mark)
• Pivoting of the budget line (B to B1) A/A (1 mark)
• Showing parallel downward shift from B1 to B2) A/A (1 mark)
• Isolating and explaining the income and substitution effects.
X2 to X3 is the substitution effect as good is relatively cheaper,
therefore increasing the quality demanded.
X3 to X1 is the income effect as a fall in price increases real
income resulting in a reduction in quantity demanded.
E/S (3 marks)
Is the substitution effect as good is relatively cheaper,
therefore increasing quantity demanded.
Is the income effect as a fall in price increased real income
resulting in a reduction in quantity demanded.
• Categorizing the good as Giffen based on the negative income
outweighing the negative substitution effect. S/E(2 marks)
Total 25 marks
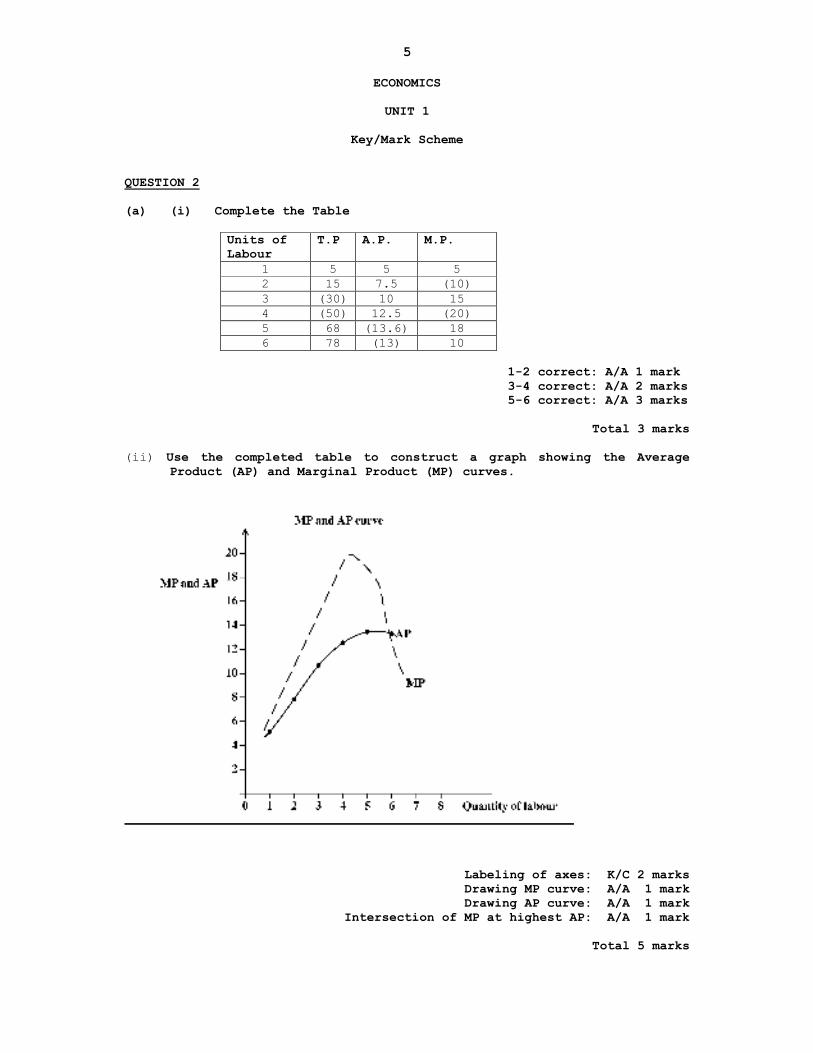
5
ECONOMICS
UNIT 1
Key/Mark Scheme
QUESTION 2
(a) (i) Complete the Table
Units of Labour
T.P A.P. M.P.
1 5 5 5
2 15 7.5 (10)
3 (30) 10 15
4 (50) 12.5 (20)
5 68 (13.6) 18
6 78 (13) 10
1-2 correct: A/A 1 mark
3-4 correct: A/A 2 marks 5-6 correct: A/A 3 marks
Total 3 marks
(ii) Use the completed table to construct a graph showing the Average
Product (AP) and Marginal Product (MP) curves.
Labeling of axes: K/C 2 marks Drawing MP curve: A/A 1 mark Drawing AP curve: A/A 1 mark
Intersection of MP at highest AP: A/A 1 mark
Total 5 marks
6
ECONOMICS
UNIT 1
Key/Mark Scheme
(b) For indicating that:
Marginal Product is the change in Total Output as a result of
employment of an additional unit of Variable factor.
OR
MP = Change in Total Product
Change in Quantity of valuable factor
(K/C 2 marks)
For indicating that Average Product is the output per unit of the
variable factor
OR
Average Product = Total Product
Quantity of Variable factor
K/C (2 Marks)
For establishing that:
Once MP > AP, AP is rising A/A 1 mark Once MP < AP, AP is falling A/A 1 mark MP=AP when AP is at its maximum A/A 1 mark
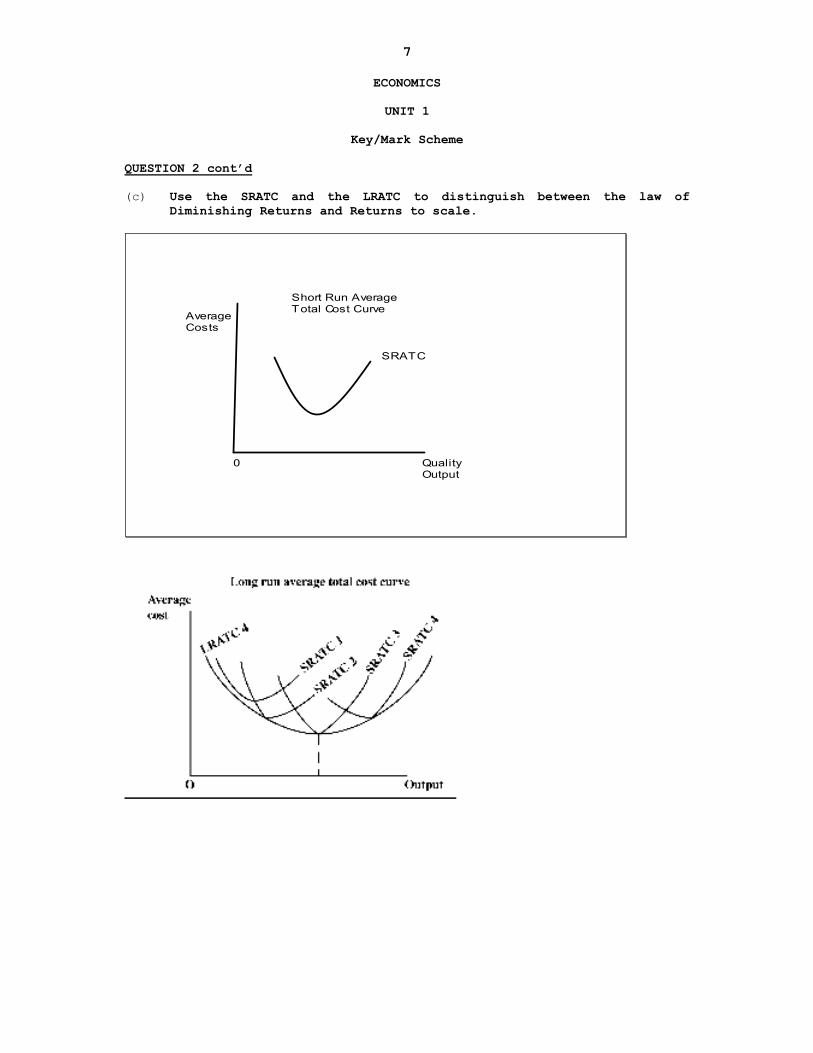
7
ECONOMICS
UNIT 1
Key/Mark Scheme
QUESTION 2 cont’d
(c) Use the SRATC and the LRATC to distinguish between the law of
Diminishing Returns and Returns to scale.
AverageCosts
SRATC
0 Quality Output
Short Run AverageTotal Cost Curve
8
ECONOMICS
UNIT 1
Key/Mark Scheme
QUESTION 2 cont’d
For labeling axes of each graph correctly K/C 2 marks
For drawing U-shaped SRATC curve A/A 1 mark
For drawing at least 3 SRATC curves A/A 1 mark
For drawing the LRATC Curve that envelopes the SRATC curves
A/A 1 mark
For establishing that Law of Diminishing Returns is reflected on
SRATC curve while the Returns to scale is reflected on LRATC curve
S/E 2 marks
For indicating that the output levels above minimum SRATC curve are
showing diminishing returns
S/E 1 mark
For indicating that output levels below minimum LRATC curve, are
showing increasing returns to scale
S/E 1 mark
For indicating that output levels above minimum LRATC curve are
showing decreasing returns to scale
S/E 1 mark
(10 marks)
Total 25 marks

9
ECONOMICS
UNIT 1
Key/Mark Scheme
QUESTION 3
(a) (i) Define the term externality.
Externality refers to spillover effects of an economic activity
on third parties.
K/C (2 marks)
(ii) Example of a positive externality
Immunization for a contagious disease - if one occupant
installs a smoke detector in an apartment complex
K/C (1 mark)
(iii) Example of a negative externality
pollution, traffic congestion.
K/C (1 mark) (b) (i) What is meant by market failure?
Market failure refers to the output where Social Marginal
Benefit (SMB) is not equal to Social Marginal Cost (SMC)
OR
There is underproduction or over production of a good and/or a
service.
K/C (2 marks)
(ii) How a monopoly and merit goods contribute to market failure.
For drawing the following diagram
Revenue curves: A/A (1 mark) Cost curve: A/A (1 mark)
0 Output
Costs and
Revenue
MR
AR-SMB
Qm Qs
MC=SMC

10
ECONOMICS
UNIT 1
Key/Mark Scheme
QUESTION 3 cont’d
• For indicating that monopoly profit maximizing output is
where MR=MC at Qm.
A/A (1 mark)
• For indicating that socially efficient output is where
SMC=SMB at Qs. A/A (1 mark)
• For stating that monopoly output is less than socially
efficient level of output. A/A (1 mark)
Total 5 marks
0 Output
Costs and
Benefits
Qm Qs
SMC=PMC
SMB
PMB
• For Cost curves A/A (1 mark)
• For benefit curves A/A (1 mark)
• For indicating that production of merit goods will be where
PMB=PMC at output QM A/A (1 mark)
• For indicating that socially efficient output is where
SMC=SMB at output Qs A/A (1 mark)
• For stating that merit good is under-produced by OQs–OQm.
A/A (1 mark)
Total 10 marks

11
ECONOMICS
UNIT 1
Key/Mark Scheme
QUESTION 3 cont’d
(c) Measures that the government can use to correct market failure caused by monopoly
• Substitution
• Legislation
• Regulation
• Identifying the effect of the measure on monopoly output
K/C(2 marks)
Discussion
Subsidy will cause marginal cost to fall and shift downwards
A/A 2 marks)
Legislation and regulation such as marginal cost pricing would also
cause the marginal cost curve to shift downwards
Fall in marginal cost should result in profit maximizing output
coinciding with the socially efficient output but it is difficult to
determine the amount of subsidy for eliminating welfare loss
S/E (5 marks)
N.B. Same analysis can be used for merit goods.
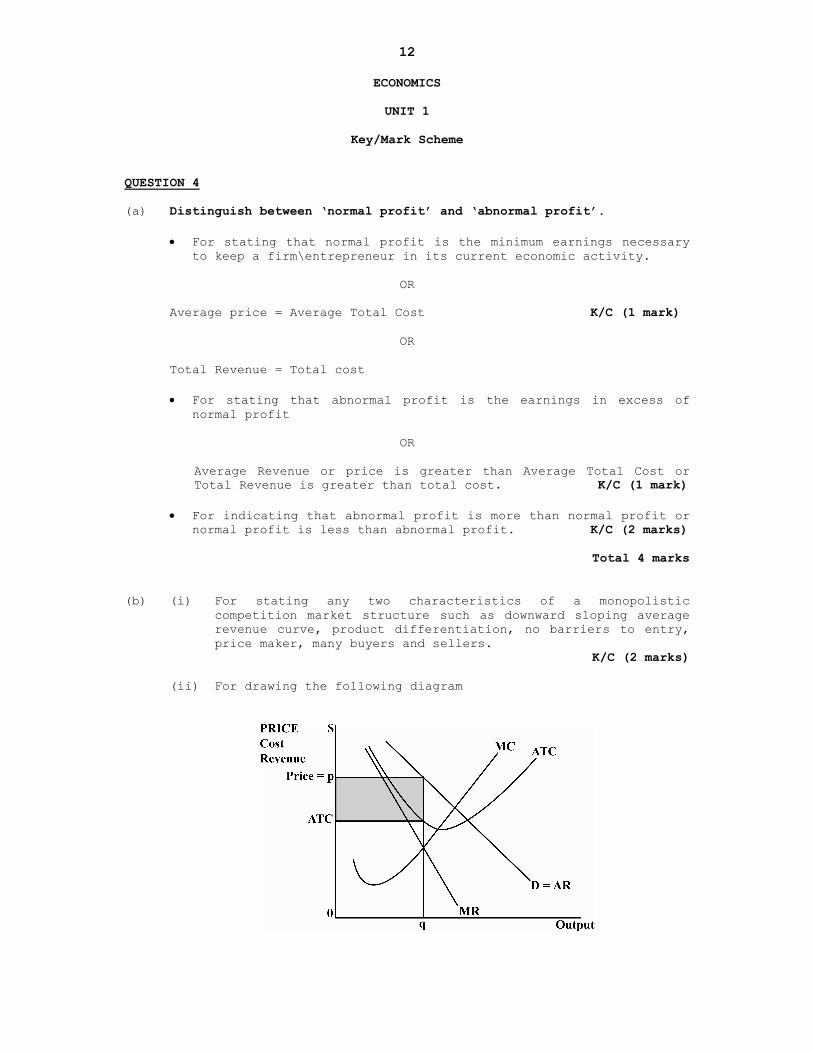
12
ECONOMICS
UNIT 1
Key/Mark Scheme
QUESTION 4
(a) Distinguish between ‘normal profit’ and ‘abnormal profit’.
• For stating that normal profit is the minimum earnings necessary
to keep a firm\entrepreneur in its current economic activity.
OR
Average price = Average Total Cost K/C (1 mark)
OR
Total Revenue = Total cost
• For stating that abnormal profit is the earnings in excess of
normal profit
OR
Average Revenue or price is greater than Average Total Cost or
Total Revenue is greater than total cost. K/C (1 mark)
• For indicating that abnormal profit is more than normal profit or
normal profit is less than abnormal profit. K/C (2 marks)
Total 4 marks
(b) (i) For stating any two characteristics of a monopolistic
competition market structure such as downward sloping average
revenue curve, product differentiation, no barriers to entry,
price maker, many buyers and sellers.
K/C (2 marks)
(ii) For drawing the following diagram
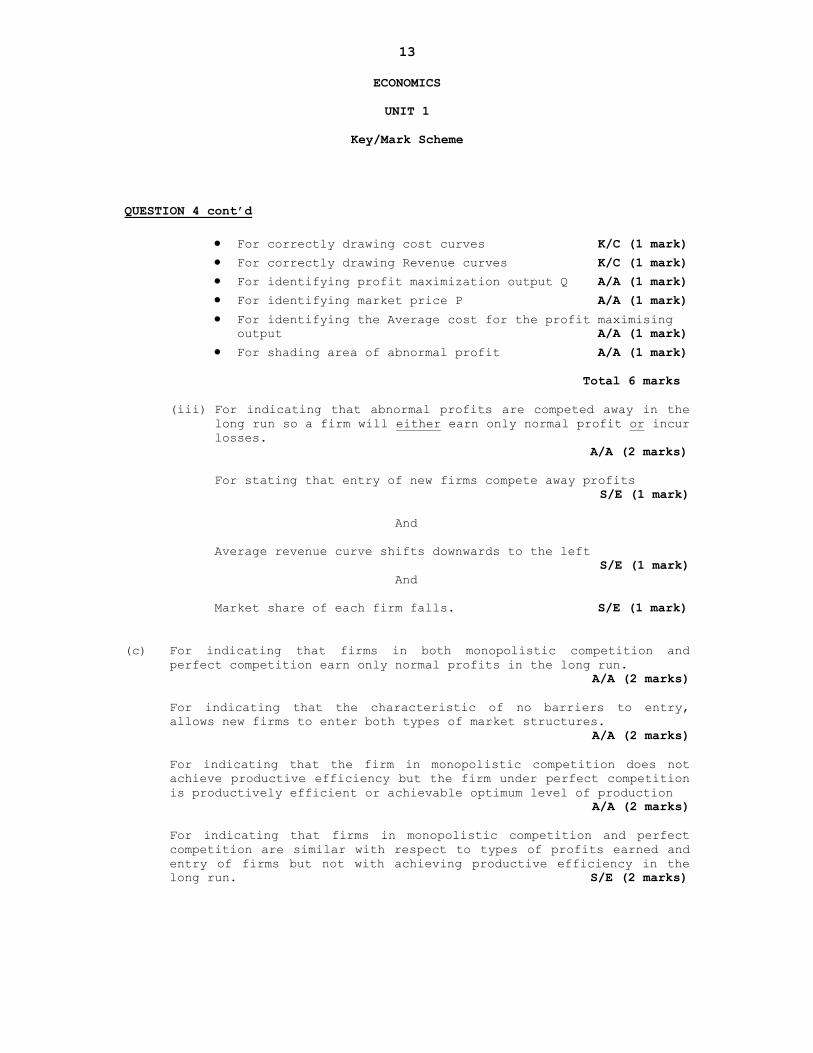
13
ECONOMICS
UNIT 1
Key/Mark Scheme
QUESTION 4 cont’d
• For correctly drawing cost curves K/C (1 mark)
• For correctly drawing Revenue curves K/C (1 mark)
• For identifying profit maximization output Q A/A (1 mark)
• For identifying market price P A/A (1 mark)
• For identifying the Average cost for the profit maximising
output A/A (1 mark)
• For shading area of abnormal profit A/A (1 mark)
Total 6 marks
(iii) For indicating that abnormal profits are competed away in the
long run so a firm will either earn only normal profit or incur
losses.
A/A (2 marks)
For stating that entry of new firms compete away profits
S/E (1 mark)
And
Average revenue curve shifts downwards to the left
S/E (1 mark)
And
Market share of each firm falls. S/E (1 mark)
(c) For indicating that firms in both monopolistic competition and
perfect competition earn only normal profits in the long run.
A/A (2 marks)
For indicating that the characteristic of no barriers to entry,
allows new firms to enter both types of market structures.
A/A (2 marks)
For indicating that the firm in monopolistic competition does not
achieve productive efficiency but the firm under perfect competition
is productively efficient or achievable optimum level of production
A/A (2 marks)
For indicating that firms in monopolistic competition and perfect
competition are similar with respect to types of profits earned and
entry of firms but not with achieving productive efficiency in the
long run. S/E (2 marks)
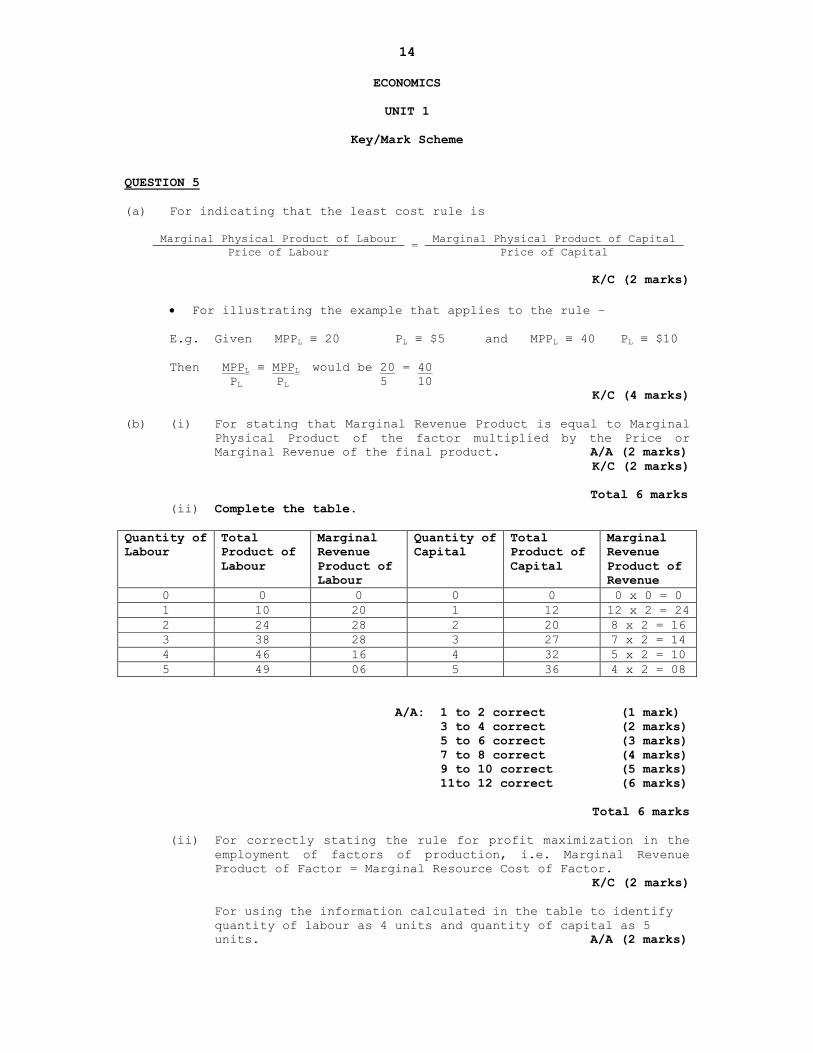
14
ECONOMICS
UNIT 1
Key/Mark Scheme
QUESTION 5
(a) For indicating that the least cost rule is
Marginal Physical Product of Labour
= Marginal Physical Product of Capital
Price of Labour Price of Capital
K/C (2 marks)
• For illustrating the example that applies to the rule –
E.g. Given MPPL ≡ 20 PL ≡ $5 and MPPL ≡ 40 PL ≡ $10
Then MPPL ≡ MPPL would be 20 = 40
PL PL 5 10
K/C (4 marks)
(b) (i) For stating that Marginal Revenue Product is equal to Marginal
Physical Product of the factor multiplied by the Price or
Marginal Revenue of the final product. A/A (2 marks)
K/C (2 marks)
Total 6 marks (ii) Complete the table.
Quantity of Labour
Total Product of
Labour
Marginal Revenue
Product of Labour
Quantity of Capital
Total Product of
Capital
Marginal Revenue
Product of Revenue
0 0 0 0 0 0 x 0 = 0
1 10 20 1 12 12 x 2 = 24
2 24 28 2 20 8 x 2 = 16
3 38 28 3 27 7 x 2 = 14
4 46 16 4 32 5 x 2 = 10
5 49 06 5 36 4 x 2 = 08
A/A: 1 to 2 correct (1 mark)
3 to 4 correct (2 marks) 5 to 6 correct (3 marks) 7 to 8 correct (4 marks) 9 to 10 correct (5 marks) 11to 12 correct (6 marks)
Total 6 marks
(ii) For correctly stating the rule for profit maximization in the
employment of factors of production, i.e. Marginal Revenue
Product of Factor = Marginal Resource Cost of Factor.
K/C (2 marks)
For using the information calculated in the table to identify
quantity of labour as 4 units and quantity of capital as 5
units. A/A (2 marks)
15
ECONOMICS
UNIT 1
Key/Mark Scheme
QUESTION 5 cont’d
By explaining that each quality above equates MRP with MRC.
A/A (2 marks)
Total 4 marks
(c) Discuss one limitation of the Marginal Productivity Theory to
maximize profit.
• In real world producers do not always aim to maximize profit, may
have other objectives such as sales maximization, increased market
share, etc. as a result the theory is not applicable.
OR
• Producers may have other objectives such as sales maximization,
increased market share, etc. as a result the theory is applicable.
S/E (5 marks)
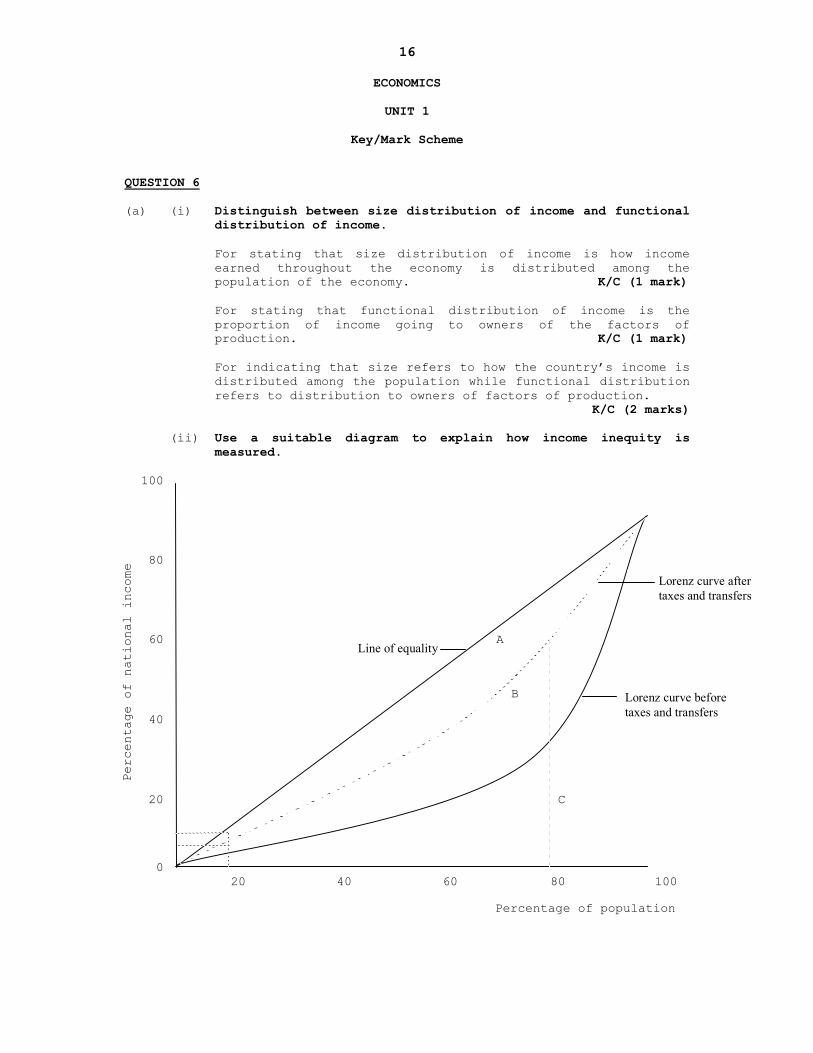
16
ECONOMICS
UNIT 1
Key/Mark Scheme
QUESTION 6
(a) (i) Distinguish between size distribution of income and functional distribution of income.
For stating that size distribution of income is how income
earned throughout the economy is distributed among the
population of the economy. K/C (1 mark)
For stating that functional distribution of income is the
proportion of income going to owners of the factors of
production. K/C (1 mark)
For indicating that size refers to how the country’s income is
distributed among the population while functional distribution
refers to distribution to owners of factors of production.
K/C (2 marks)
(ii) Use a suitable diagram to explain how income inequity is measured.
100
Percentage of national income
80
60 A
B
40
20
C
0
20 40 60 80 100
Percentage of population
Lorenz curve after
taxes and transfers
Lorenz curve before
taxes and transfers
Line of equality
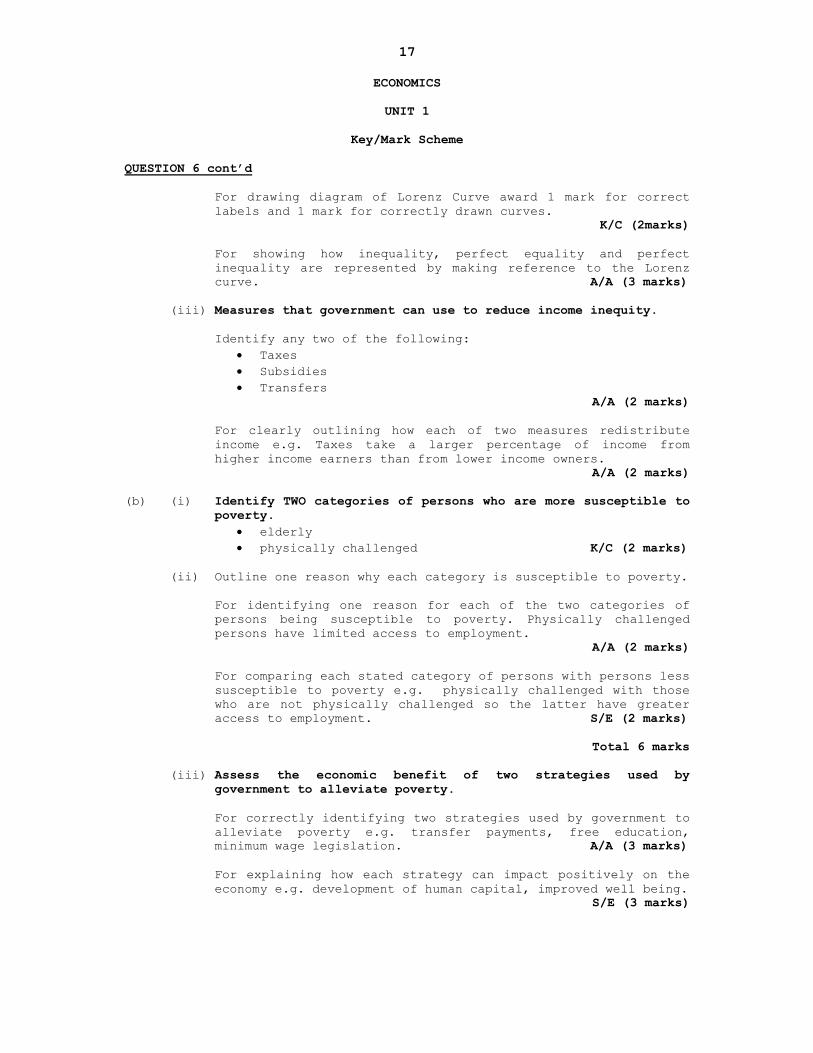
17
ECONOMICS
UNIT 1
Key/Mark Scheme
QUESTION 6 cont’d
For drawing diagram of Lorenz Curve award 1 mark for correct
labels and 1 mark for correctly drawn curves.
K/C (2marks)
For showing how inequality, perfect equality and perfect
inequality are represented by making reference to the Lorenz
curve. A/A (3 marks)
(iii) Measures that government can use to reduce income inequity.
Identify any two of the following:
• Taxes
• Subsidies
• Transfers
A/A (2 marks)
For clearly outlining how each of two measures redistribute
income e.g. Taxes take a larger percentage of income from
higher income earners than from lower income owners.
A/A (2 marks)
(b) (i) Identify TWO categories of persons who are more susceptible to poverty.
• elderly
• physically challenged K/C (2 marks)
(ii) Outline one reason why each category is susceptible to poverty.
For identifying one reason for each of the two categories of
persons being susceptible to poverty. Physically challenged
persons have limited access to employment.
A/A (2 marks)
For comparing each stated category of persons with persons less
susceptible to poverty e.g. physically challenged with those
who are not physically challenged so the latter have greater
access to employment. S/E (2 marks)
Total 6 marks
(iii) Assess the economic benefit of two strategies used by government to alleviate poverty.
For correctly identifying two strategies used by government to
alleviate poverty e.g. transfer payments, free education,
minimum wage legislation. A/A (3 marks)
For explaining how each strategy can impact positively on the
economy e.g. development of human capital, improved well being.
S/E (3 marks)
TEST CODE: 004075/CAPE/SPEC2010
FORM TP 004075/SPEC
CARIBBEA� EXAMI�ATIO�S COU�CIL
ADVA�CED PROFICIE�CY EXAMI�ATIO�
ECO�OMICS
SPECIME� PAPER
U�IT 1
PAPER 03/2
2 hours
I�STRUCTIO�S TO CA�DIDATES
1. This paper consists of THREE questions.
2. Candidates MUST answer the THREE questions.
3. Answers for ALL questions must be written in the answer booklet
provided.
4 . Candidates may use silent non-programmable calculators.
Examination Materials
Mathematical formulae and tables
Electronic calculator
Ruler and graph paper
Copyright © 2008 Caribbean Examinations Council ®
All rights reserved
004075/CAPE/SPEC/ 2010
Answer ALL questions
1. The agricultural industry plays an important role in many CARICOM member states.
It provides food, employment, inputs for industries and foreign exchange. The
demand for food is not fully met by domestic production and the domestic supply is
augmented by food imports, the bill for which is steadily rising. Agriculture is
conducted by small-scale and large-scale producers. The farmer produces the bulk of
the ground provisions, a staple in many diets.
(a) State how small-scale and large-scale farmers differ in terms of TWO of the
major factors of production.
(4 marks)
(b) Outline THREE factors that influence the demand for ground provisions.
(6 marks)
(c) Ground provision farmers are often poor and in an attempt to increase their
income the government enforces an effective price floor.
Discuss, with the use of a diagram, the likely effects of this policy on the
quantity of ground provisions demanded and supplied.
(10 marks)
Total 20 marks
2. The market for eggs is sometimes said to be a good approximation of perfect
competition.
Using your knowledge of perfect competition and monopolistic competition, give a
critical analysis of this viewpoint.
Total 20 marks
3. The derived demand for agricultural workers is low relative to the supply. Hence, the
wage rates and incomes are low, resulting in poverty among farmers and agricultural
workers.
(a) Explain, with the use of an example, why the demand for agricultural workers
is considered to be a derived demand.
(4 marks)
(b) Analyze TWO factors that account for the low wage rates in the market for
agricultural workers.
(8 marks)
(c) Identify the type of poverty that agricultural workers experience and discuss
TWO costs of this poverty. (8 marks)
Total 20 marks
E�D OF TEST

/CAPE/SPEC/K/MS/2010
C A R I B B E A N E X A M I N A T I O N S C O U N C I L
ADVANCED PROFICIENCY EXAMINATION
ECONOMICS
SPECIMEN PAPER
UNIT 1 - PAPER 03/2
KEYS AND MARK SCHEMES
2
ECONOMICS
UNIT 1
Key/Mark Scheme
QUESTION 1
(a) State how small-scale and large-scale farmers differ. (4 marks)
Identifying factor- 1 mark Stating difference- 1 mark
Farmers, like other producers, use four major factors of production;
land, labour, capital and entrepreneurship. Small farmers encounter
greater restrictions in accessing resources than large farmers.
Land
Large farmers do not only have more land, but they have more fertile
lands than small farmers. K/C (1 mark) A/A (1 mark)
Capital
Large farmers also have more capital and more modern capital than
smaller farmers. This also results in large farmers using more
advanced and modern technology than small farmers.
K/C (1 mark) A/A (1 mark)
Labour
Large farmers can afford to hire more skilled labour than small
farmers who, if assisted, use unpaid family labour. K/C (1 mark) A/A (1 mark)
Entrepreneurship
The entrepreneurial skills of large farmers are usually greater than
those of small farmers.
The combined advantage of large farmers makes them more productive
than small farmers. K/C (1 mark) A/A (1 mark)
(b) Factors that influence the demand for ground provisions. (6 marks) Identifying factor -1 mark
Outlining - 1 mark
• The price of ground provision
The higher (lower) the price of ground provisions the lower
(higher) the quantity that will be demanded. An inverse
relationship exists between the price of ground provisions and the
quantity bought. K/C (1 mark) A/A (1 mark)
• The price of other goods
There is an inverse (direct) relationship between the price of a
complement (substitute) of ground provision and the demand for
ground provision. K/C (1 mark) A/A (1 mark)
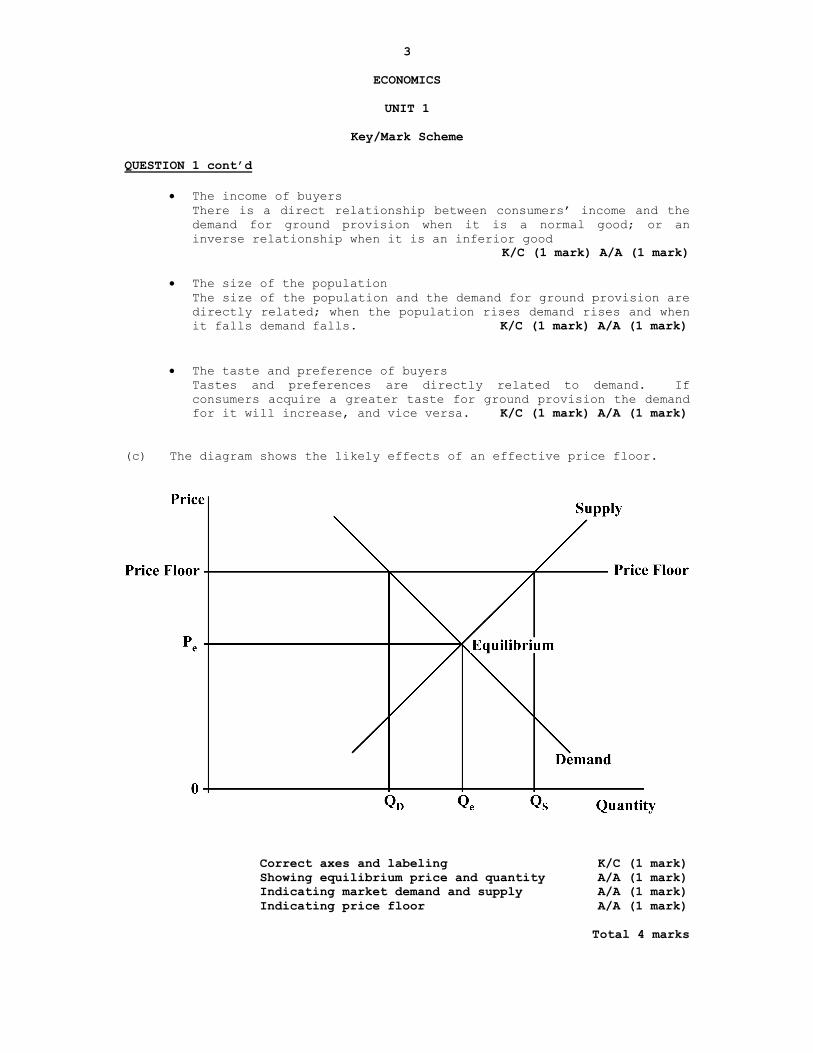
3
ECONOMICS
UNIT 1
Key/Mark Scheme
QUESTION 1 cont’d
• The income of buyers
There is a direct relationship between consumers’ income and the
demand for ground provision when it is a normal good; or an
inverse relationship when it is an inferior good
K/C (1 mark) A/A (1 mark)
• The size of the population
The size of the population and the demand for ground provision are
directly related; when the population rises demand rises and when
it falls demand falls. K/C (1 mark) A/A (1 mark)
• The taste and preference of buyers
Tastes and preferences are directly related to demand. If
consumers acquire a greater taste for ground provision the demand
for it will increase, and vice versa. K/C (1 mark) A/A (1 mark)
(c) The diagram shows the likely effects of an effective price floor.
Correct axes and labeling K/C (1 mark) Showing equilibrium price and quantity A/A (1 mark) Indicating market demand and supply A/A (1 mark)
Indicating price floor A/A (1 mark)
Total 4 marks
4
ECONOMICS
UNIT 1
Key/Mark Scheme
QUESTION 1 cont’d
Before the price floor is imposed the price of ground provision is Pe
and the quantity sold is Qe. After the imposition of a price floor
the quantity demanded is less than that supplied. Buyers are now
willing to buy a smaller quantity than the former equilibrium
quantity while sellers are willing to sell a larger quantity than the
former equilibrium quantity. There is therefore a glut on the
market.
If the government buys the excess supply, the quantity traded will be
QS, otherwise it will be QD.
S/E [6 marks]
Total 20 marks

5
ECONOMICS
UNIT 1
Key/Mark Scheme
QUESTION 2
Stating any three characteristics of Perfect competition. K/C (3 marks)
Perfect Competition is characterized by the following:
● Many buyers and sellers
● The goods are homogeneous
● There is perfect knowledge
● There is free entry and exit
● There is no transportation cost
The good is therefore sold at the same price throughout the market.
Stating any three characteristics of Monopolistic competition. K/C (3 marks)
Monopolistic Competition is characterized by the following:
● A large number of firms
● Each firms has a different product
● There is freedom of movement into and exit from the industry
Relating characteristics identified to the market for eggs. A/A (8 marks)
The market for eggs may approach this ideal. There are usually many buyers
and sellers of eggs. [2] There is also free entry and exit since the cost
of entering is low. Knowledge is near perfect if not perfect. Eggs are
usually similar but not necessarily identical. They vary in shape, size
and colour. [2]
Transportation costs are usually similar. The market structure therefore
more closely approximates perfect competition.
Monopolistic competition approaches perfect competition with many buyers
and sellers and no barriers to entry and exit. There are however similar
but non-identical products. [2] This corresponds somewhat to the market
for eggs, since in monopolistic competition the goods are differentiated
even if similar. Buyers and sellers make a distinction between small and
large eggs, brown and white eggs. There is therefore some power over price as sorting is practised. The market for eggs may therefore be closer to monopolistic competition. [2]
Making conclusion on which market structure better describes the market for
eggs compared with others and using supporting arguments S/E (6 marks)
Candidates must draw their conclusion based on their argument put forward.
This must be supported by well reasoned examples and illustrations. This
may be influenced by candidates’ experiential background as well as
research.
Total 20 marks
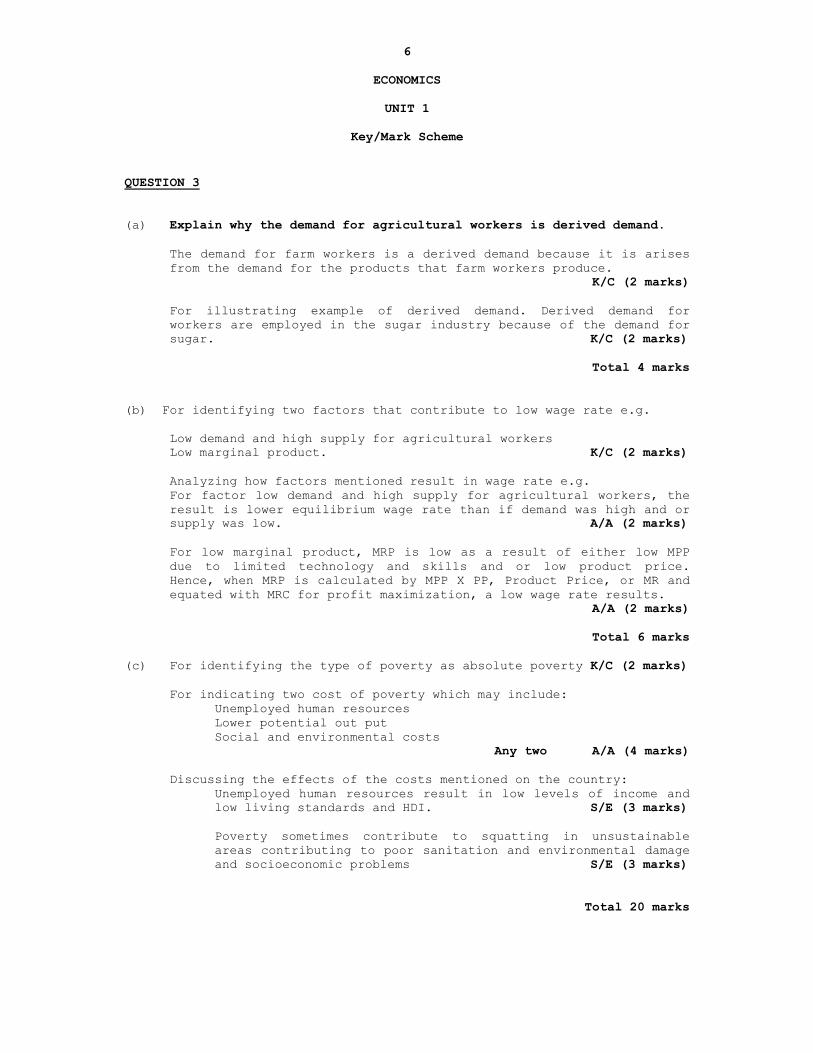
6
ECONOMICS
UNIT 1
Key/Mark Scheme
QUESTION 3
(a) Explain why the demand for agricultural workers is derived demand.
The demand for farm workers is a derived demand because it is arises
from the demand for the products that farm workers produce.
K/C (2 marks)
For illustrating example of derived demand. Derived demand for
workers are employed in the sugar industry because of the demand for
sugar. K/C (2 marks)
Total 4 marks
(b) For identifying two factors that contribute to low wage rate e.g.
Low demand and high supply for agricultural workers
Low marginal product. K/C (2 marks)
Analyzing how factors mentioned result in wage rate e.g.
For factor low demand and high supply for agricultural workers, the
result is lower equilibrium wage rate than if demand was high and or
supply was low. A/A (2 marks)
For low marginal product, MRP is low as a result of either low MPP
due to limited technology and skills and or low product price.
Hence, when MRP is calculated by MPP X PP, Product Price, or MR and
equated with MRC for profit maximization, a low wage rate results. A/A (2 marks)
Total 6 marks
(c) For identifying the type of poverty as absolute poverty K/C (2 marks)
For indicating two cost of poverty which may include:
Unemployed human resources
Lower potential out put
Social and environmental costs
Any two A/A (4 marks)
Discussing the effects of the costs mentioned on the country:
Unemployed human resources result in low levels of income and
low living standards and HDI. S/E (3 marks)
Poverty sometimes contribute to squatting in unsustainable
areas contributing to poor sanitation and environmental damage
and socioeconomic problems S/E (3 marks)
Total 20 marks
C A R I B B E A N E X A M I N A T I O N S C O U N C I L
ADVANCED PROFICIENCY EXAMINATION
SPECIMEN PAPERMULTIPLE CHOICE QUESTIONS
FOR
ECONOMICS
UNIT 2
90 minutes
READ THE FOLLOWING INSTRUCTIONS CAREFULLY.
Each item in this test has four suggested answers lettered (A), (B), (C), (D). Read each item you are
about to answer and decide which choice is best.
Sample Item
Prime cost is calculated by adding direct factory expenses to the
Sample Answer
(A) cost of goods sold
(B) sale of fixed assets A B C D
(C) sale of finished goods
(D) cost of materials used
The best answer to this item is “cost of materials used”, so answer space (D) has been shaded.
Copyright © 2008 Caribbean Examinations Council ®.
All rights reserved.
02216010/SPEC 2008

- 2 -
GO ON TO THE NEXT PAGE
02216010/SPEC 2008
30, 000 36, 000 N.I.
S.I.
0
10, 600
10, 000
S
I
I1
0 Q2 Q1Q
Income
Co
nsu
mp
tio
n
d
1
2
1. In Keynesian analysis, if the economy is at
full employment then an increase in aggregate
expenditure will lead to
(A) a fall in economic growth
(B) an increase in the price level
(C) a fall in government spending
(D) an increase in the exchange rate
Items 2 - 3 refer to the following diagram
showing consumption and income.
2. What function does line 2 represents?
(A) Savings
(B) Investment
(C) Consumption
(D) Government expenditure
3. What does line 1 represent?
(A) The 45o line
(B) National income
(C) Investment spending
(D) Autonomous savings
Item 4 refers to the following diagram
showing the relationship between National
Income (NI) and Saving/Investment (SI).
4. The diagram shows that national income has
increased from $30 000 million to $36 000
million. What is the marginal propensity to
consume?
(A) 0.1
(B) 0.9
(C) 0.29
(D) 10
5. If consumption increases by 0.6% of the
change in national income, then the multiplier
is
(A) 0.4
(B) 0.6
(C) 1.6
(D) 2.5

- 3 -
GO ON TO THE NEXT PAGE
02216010/SPEC 2008
Ex
pen
dit
ure
0
E = Y
C + I
National
income
R
S
Y1 Y2
Item 6 refers to the following diagram of a
two-sector closed economy.
6. In the diagram, R S represents
(A) an inflationary gap
(B) a deflationary gap
(C) money saved by firms in the banks
(D) interest payments on investment
loans
Item 7 refers to the following demand and
supply curve.
7. Which of the following factors may cause AD
to shift to AD1?
(A) Government imposing taxes on
citizens
(B) The Central Bank increasing interest
rates
(C) An increase in government expendi-
ture
(D) Increased speculation in the stock
market
Item 8 - 9 refer to the diagram below
showsing a consumption function AC1.
8. What does BF
DFrepresent?
(A) Autonomous consumption
(B) Total induced consumption
(C) Marginal propenstity to consume
(D) Average propensity to consumers
9. When national income is at OF, what does
DE represent?
(A) Induced consumption
(B) Autonomous consumption
(C) Consumption minus savings
(D) Average propenstity to consumer
A
0 F
E
D
B
E =
National Income
C1
Exp
end
itu
re
P
AD
AD/AS
AD1
AS

- 4 -
GO ON TO THE NEXT PAGE
02216010/SPEC 2008
Item 10 refers to the diagram below showing
a consumption function.
10. Which of the following represents the
marginal propensity to consume?
(A)AB
FE
(B)AB
FE
(C) OB - AB
(D) DE + EF
F
ED
BA0
C
Ex
pen
dit
ure
National Income
Item 11 refers to the following diagram
showing the consumption function C1 in
country X.
11. What causes the consumption function to shift
upwards from C1 to C
2?
(A) An increase in direct taxation
(B) An increase in interest rates
(C) The anticipated increase in the
proportion of income saved by
households
(D) The expectation of an increase in the
rate of value added tax
C
($bn)
Y ($bn)
C2
C1
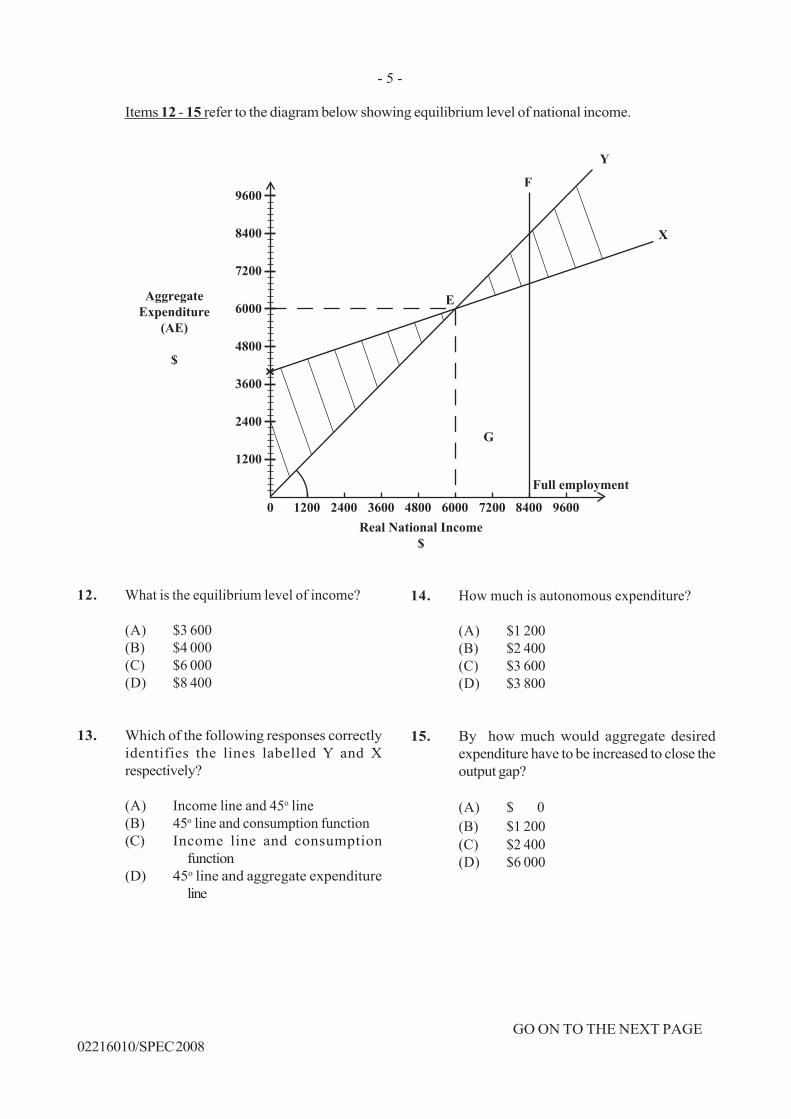
- 5 -
GO ON TO THE NEXT PAGE
02216010/SPEC 2008
Items 12 - 15 refer to the diagram below showing equilibrium level of national income.
12. What is the equilibrium level of income?
(A) $3 600
(B) $4 000
(C) $6 000
(D) $8 400
13. Which of the following responses correctly
identifies the lines labelled Y and X
respectively?
(A) Income line and 45o line
(B) 45o line and consumption function
(C) Income line and consumption
function
(D) 45o line and aggregate expenditure
line
14. How much is autonomous expenditure?
(A) $1 200
(B) $2 400
(C) $3 600
(D) $3 800
15. By how much would aggregate desired
expenditure have to be increased to close the
output gap?
(A) $ 0
(B) $1 200
(C) $2 400
(D) $6 000
F
E
G
Y
X
9600
9600
8400
8400
7200
7200
6000
6000
4800
4800
3600
3600
2400
2400
1200
12000
Full employment
Aggregate
Expenditure
(AE)
$
Real National Income
$
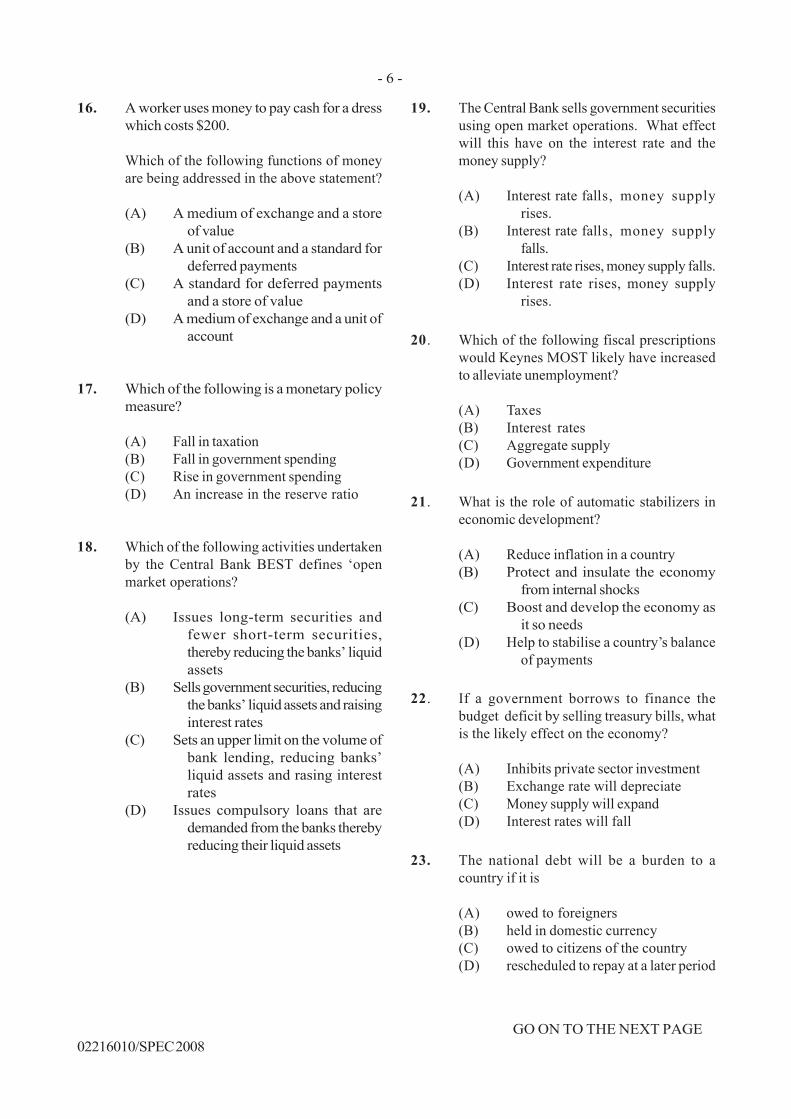
- 6 -
GO ON TO THE NEXT PAGE
02216010/SPEC 2008
16. A worker uses money to pay cash for a dress
which costs $200.
Which of the following functions of money
are being addressed in the above statement?
(A) A medium of exchange and a store
of value
(B) A unit of account and a standard for
deferred payments
(C) A standard for deferred payments
and a store of value
(D) A medium of exchange and a unit of
account
17. Which of the following is a monetary policy
measure?
(A) Fall in taxation
(B) Fall in government spending
(C) Rise in government spending
(D) An increase in the reserve ratio
18. Which of the following activities undertaken
by the Central Bank BEST defines ‘open
market operations?
(A) Issues long-term securities and
fewer short-term securities,
thereby reducing the banks’ liquid
assets
(B) Sells government securities, reducing
the banks’ liquid assets and raising
interest rates
(C) Sets an upper limit on the volume of
bank lending, reducing banks’
liquid assets and rasing interest
rates
(D) Issues compulsory loans that are
demanded from the banks thereby
reducing their liquid assets
19. The Central Bank sells government securities
using open market operations. What effect
will this have on the interest rate and the
money supply?
(A) Interest rate falls, money supply
rises.
(B) Interest rate falls, money supply
falls.
(C) Interest rate rises, money supply falls.
(D) Interest rate rises, money supply
rises.
20. Which of the following fiscal prescriptions
would Keynes MOST likely have increased
to alleviate unemployment?
(A) Taxes
(B) Interest rates
(C) Aggregate supply
(D) Government expenditure
21. What is the role of automatic stabilizers in
economic development?
(A) Reduce inflation in a country
(B) Protect and insulate the economy
from internal shocks
(C) Boost and develop the economy as
it so needs
(D) Help to stabilise a country’s balance
of payments
22. If a government borrows to finance the
budget deficit by selling treasury bills, what
is the likely effect on the economy?
(A) Inhibits private sector investment
(B) Exchange rate will depreciate
(C) Money supply will expand
(D) Interest rates will fall
23. The national debt will be a burden to a
country if it is
(A) owed to foreigners
(B) held in domestic currency
(C) owed to citizens of the country
(D) rescheduled to repay at a later period

- 7 -
GO ON TO THE NEXT PAGE
02216010/SPEC 2008
24. According to the monetarists, inflation is
caused by an increase in
(A) taxes
(B) the money supply
(C) aggregate demand
(D) the cost of production
25. If there is a positive change in real GDP
ceterus paribus, what would be the effect
on money demand, interest rates and money
supply?
(A) The demand for money falls, interest
rates fall, money supply falls.
(B) The demand for money remain the
same, interest rates fall, money
supply rises.
(C) The demand for money rises, interest
rates rise, money supply remains
the same.
(D) The demand for money rises, interest
rates remain the same, money
supply remains the same.
26. Using the quatity theory of money, what is
the velocity of circulation if the money supply
is $50 000, the average price is $200 and the
number of transactions in the economy for a
given year is 10 000?
(A) 25
(B) 40
(C) 50
(D) 100
27. Which of the following is an example of
qualitative controls that a Central Bank may
use in executing its monetary policy?
(A) Moral suasion
(B) Adjusting the bank rate
(C) Open market operations
(D) Variation of the liquidity ratio
28. If a government wishes to reduce
unemployment by increasing demand, what
type of monetary policy should it adopt?
(A) Lower the interest rate
(B) Sell fewer treasury bills
(C) Increase the interest rate
(D) Sell more government securties
29. The money multiplier is the
(A) number of times money changes
hands in an economy
(B) change in money supply multiplied by
the change in deposit that brought it
about
(C) change in money supply divided by
the change in deposit that brought it
about
(D) amount by which a currency has to
be multiplied to find the value of
another currency
30. Which of the following BEST defines the
government’s budget?
(A) The spending plans of government in
an economy in a year
(B) The annual report of the allocation
of government spending among
sectors
(C) A yearly statement of government’s
plans for spending and tax
revenues
(D) The amount of income government
has to spend in a year
31. Which of the following changes is the BEST
indicator of sustained economic growth in a
developing country?
(A) A decrease in unemployment
(B) An increase in the use of capital
(C) A movement within the production
possibility frontier
(D) An outward shift in the production
possibility frontier

- 8 -
GO ON TO THE NEXT PAGE
02216010/SPEC 2008
32. The table below shows the ability of two
countries to produce two commodities.
Which of the following statements correctly
represents the information in the table?
(A) Barbados has a comparative
advantage in drums and Trinidad
has an absolute advantage in tiles.
(B) Barbados has an absolute advantage
in drums and Trinidad has an
absolute advantage in tiles.
(C) Barbados has an absolute advantage
in drums and Trinidad has a
comparative advantage in tiles.
(D) Barbados has a comparative
advantage in tiles and Trinidad has
an absolute advantage in drums.
33. Which of the following are structural
characteristics of Caribbean economies?
I. Economic independence
II. The chronic shortage of capital
III. The lack of a diversified production
base
IV. The lack of openness in the economy
(A) I and II only
(B) I and IV only
(C) II and III only
(D) III and IV only
Country
Production
of tiles per
person
Production of
drums per
person
Barbados 500 1000
Trinidad 750 1000
34. Developing countries may attempt to increase
their levels of exports by setting up
I. Trade Barriers
II. Custom Unions
III. Common Markets
IV. Free Trade Areas
(A) I, II and III only
(B) I, II and IV only
(C) I, III and IV only
(D) II, III and IV only
35. The data in the table below refer to the
balance of payments of a country.
What is the Current Account Balance?
(A) $2 700 m
(B) $2 600 m
(C) -$1 400 m
(D) -$1 300 m
36. Which of the following measures would
BEST rectify a deficit on a country’s
Balance of Payments Account?
(A) Revaluing the currency
(B) Lowering tariff barriers
(C) Deflationary fiscal policy
(D) Relaxing exchange controls
Item $
Millions
Import of goods 10,000
Export of goods 8,000
Invisible balance +600
Investment and other
capital flows +100

- 9 -
GO ON TO THE NEXT PAGE
02216010/SPEC 2008
37. One MAJOR advantage of a floating
exchange rate over a fixed exchange system
is that it
(A) is determined by the Central Bank
(B) helps to reduce inflation in a country
(C) can lead to unstable currency value
(D) provides certainty in international
trade
38. What is the MAIN function of the World
Trade Organisation?
(A) To promote trade with the large
countries of the world
(B) To set maritime boundaries for
member countries
(C) To settle disputes amongst members
(D) To set rules for the global trading
system
39. Which of the following policies may frustrate
a government’s attempt to stimulate growth
in an economy?
(A) Increasing Government spending
(B) Reducing direct and indirect taxes
(C) Increasing the rate of interest
(D) Increasing the money supply
Item 40 refers to the following diagram
representing the demand for imports of Good
A into Country B.
40. Assuming a perfectly elastic world supply.
What are the effects on price and quantity
imported should government impose a quota
at S1?
(A) Price decreases; quantity demanded
decreases.
(B) Price decreases; quantity demanded
increases.
(C) Price increases; quantity demanded
increases.
(D) Price increases; quantity demanded
decreases.
41. Which of the following BEST describes a
Customs Union?
(A) Member countries act as a single
market with free movement of
labour and capital.
(B) Member countries face no trade
barriers between themselves while
external tariffs and quotas are
common.
(C) Member countries face no trade
barriers between themselves and
try to implement a common
language.
(D) Member countries have similar
trading patterns and attempts are
made to have similar trade unions.
D
P
Q
DPrice
P1
Q1
S1
0 Quantity
WS World Supply
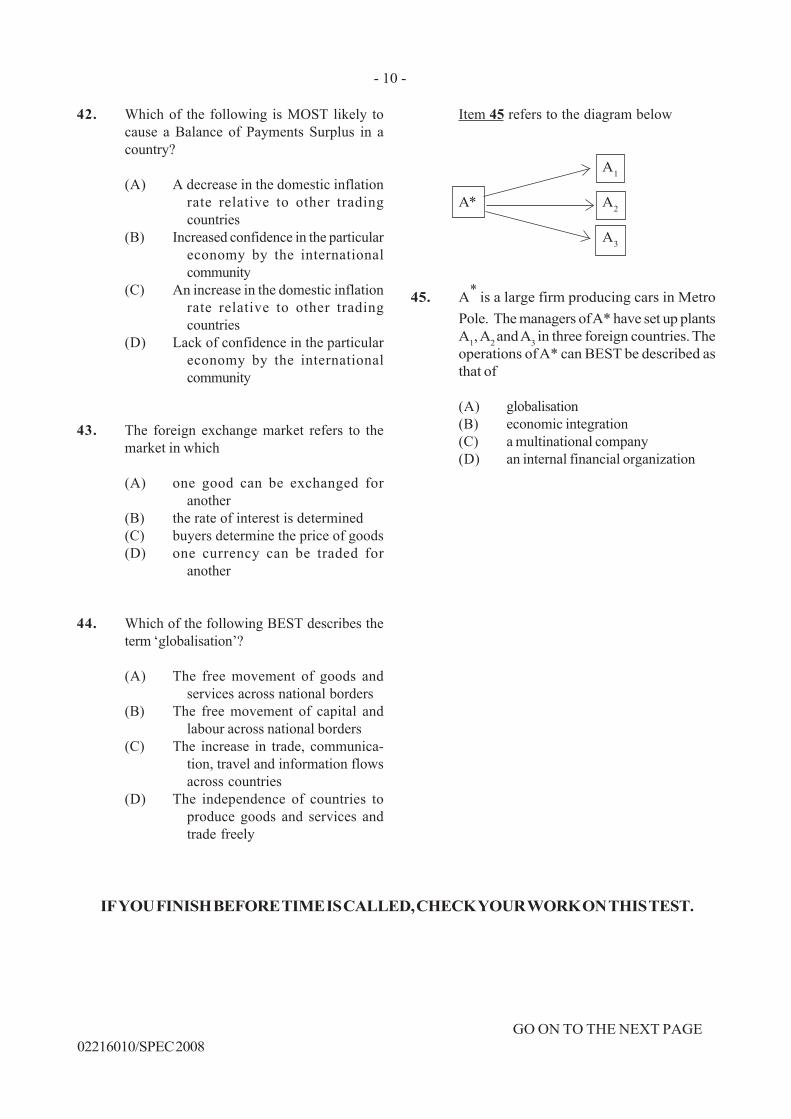
- 10 -
GO ON TO THE NEXT PAGE
02216010/SPEC 2008
42. Which of the following is MOST likely to
cause a Balance of Payments Surplus in a
country?
(A) A decrease in the domestic inflation
rate relative to other trading
countries
(B) Increased confidence in the particular
economy by the international
community
(C) An increase in the domestic inflation
rate relative to other trading
countries
(D) Lack of confidence in the particular
economy by the international
community
43. The foreign exchange market refers to the
market in which
(A) one good can be exchanged for
another
(B) the rate of interest is determined
(C) buyers determine the price of goods
(D) one currency can be traded for
another
44. Which of the following BEST describes the
term ‘globalisation’?
(A) The free movement of goods and
services across national borders
(B) The free movement of capital and
labour across national borders
(C) The increase in trade, communica-
tion, travel and information flows
across countries
(D) The independence of countries to
produce goods and services and
trade freely
Item 45 refers to the diagram below
A1
A* A2
A3
45. A* is a large firm producing cars in Metro
Pole. The managers of A* have set up plants
A1, A
2 and A
3 in three foreign countries. The
operations of A* can BEST be described as
that of
(A) globalisation
(B) economic integration
(C) a multinational company
(D) an internal financial organization
IF YOU FINISH BEFORE TIME IS CALLED, CHECK YOUR WORK ON THIS TEST.
/CAPE/SPEC/MS/2010
C A R I B B E A N E X A M I N A T I O N S C O U N C I L
ADVANCED PROFICIENCY EXAMINATION
ECONOMICS
SPECIMEN PAPER
UNIT 2 - PAPER 1
MARK SCHEME

C A R I B B E A N E X A M I N A T I O N S C O U N C I L
SECONDARY EDUCATION CERTIFICATE
EXAMINATION
ECONOMICS - UNIT 2
SPECIMEN PAPER 2008
Item �o. Key
1 B
2 C
3 A
4 A
5 D
6 C
7 C
8 D
9 A
10 B
11 D
12 C
13 D
14 D
15 C
16 D
17 D
18 B
19 C
20 D
21 B
22 A
23 A
Item �o. Key
24 B
25 C
26 B
27 A
28 A
29 C
30 C
31 D
32 A
33 C
34 D
35 C
36 C
37 B
38 D
39 C
40 D
41 B
42 A
43 D
44 C
45 C
TEST CODE: 2010
FORM TP 02216020/SPEC/2010
CARIBBEA� EXAMI�ATIO�S COU�CIL
ADVA�CED PROFICIE�CY EXAMI�ATIO�
ECO�OMICS
SPECIME� PAPER
U�IT 2
PAPER 02
2½ hours
I�STRUCTIO�S TO CA�DIDATES
1. This paper consists of THREE sections.
2. Each section consists of TWO questions. Candidates MUST answer
THREE questions O�E from EACH section.
3. Answers for ALL questions must be written in the answer booklet provided.
4 . Candidates may use si lent non-programmable calculators.
Examination Materials
Mathematical formulae and tables
Electronic calculator
Ruler and graph paper
Copyright © 2008 Caribbean Examinations Council ®
All rights reserved

2
SECTIO� I
A�SWER O�E question from this section.
1. (a) Distinguish between EACH of the following:
(i) Gross Domestic Product (GDP) and Gross National Product. (GNP)
(4 marks)
(ii) Nominal GDP and Real GDP (4 marks)
(b) A Caribbean territory has experienced a 4% growth in its Gross Domestic
Product. Evaluate FOUR ways in which growth in the GDP may impact
negatively on the standard of living of a country. (12 marks)
(c) Justify whether GDP is an adequate measure of the standard of living of a
country. (5 marks)
Total 25 marks
2. (a) Define the term ‘injections’ as it relates to an economy. (2 marks)
(b) Outline THREE reasons why injections will exceed withdrawals. (6 marks)
(c) Discuss FOUR factors that would restore equilibrium. (12 marks)
(d) The diagram below shows an economy operating in a situation where
injections exceed withdrawals. (5 marks)
(d) Explain, using the graph, what happens when equilibrium is restored. (5 marks)
Total 25 marks
3
SECTIO� II
A�SWER O�E question from this section.
3. (a) Explain the Phillips curve, with the aid of a diagram. (8 marks)
(b) Explain why EACH of the following is likely to be of concern to a
government:
(i) Rising unemployment
(ii) High and rising rates of inflation (12 marks)
(c) Justify whether the Phillips Curve is applicable to your country’s economy.
(5 marks)
Total 25 marks
4. (a) (i) Distinguish between monetary policy and fiscal policy. (4 Marks)
(ii) Distinguish between expansionary and contractionary monetary policy.
(4 marks)
(b) The Central Bank of a Caribbean territory is about to take measures to control
the rate of inflation. Explain, using FOUR measures of monetary policy,
how this objective might be achieved. (12 marks)
(c) Discuss ONE limitation of using monetary policy to control inflation rates in
your country. (5 marks)
Total 25 marks
SECTIO� III
A�SWER O�E question from this section.
5. (a) Outline TWO main components of sustainable development. (4 marks)
(b) Identify FOUR structural characteristics of the Caribbean region. (4 marks)
(c) Evaluate the impact of the region’s structural characteristics on sustainable
economic development. (17 marks)
Total 25 marks
6. (a) Outline the FOUR main forms of economic integration. (8 marks)
(b) Evaluate the costs and benefits of economic integration for the Caribbean.
(17 marks)
Total 25 marks
E�D OF TEST

/CAPE/SPEC/MS/2010
C A R I B B E A N E X A M I N A T I O N S C O U N C I L
ADVANCED PROFICIENCY EXAMINATION
ECONOMICS
SPECIMEN PAPER
UNIT 2 - PAPER 02
ANSWER KEY AND
MARK SCHEME
ECONOMICS
UNIT 2
Key/Mark Scheme
2
QUESTION 1
(a) (i) Distinguish between GDP and GNP
Indicating that GDP is the total market value of all final
goods and services produced annually within the boundaries of a
country. K/C (1 mark)
Indicating that GNP is the total market value of final output
produced by the citizens of a country. K/C (1 mark)
Indicating that GNP is GDP plus net factor income from abroad.
OR
GDP is domestically produced output, while GNP is output
produced both domestically and internationally but owned by
locals. K/C (2 marks)
(ii) Distinguishing between Nominal GDP and Real GDP
Indicating that nominal GDP is the total output produced
measured at current prices. K/C (1 mark)
Indicating that real GDP is the total output produced measured
at constant price. K/C (1 mark)
Indicating that nominal GDP is not adjusted for inflation while
Real GDP is adjusted for inflation. K/C (2 marks) (b) Evaluate the negative effects of a growth in GDP standard of living.
(12 marks)
• Sectoral growth can be caused by an increase in the production
of military goods (Government spending) which leads to an
increase in GDP. However, citizens do not benefit from these
goods. A/A (3 marks)
• Increases in output can lead to externalities. (Dirty air,
polluted water, destruction of forest, gullies and natural
water ways). The standard of living on citizens is negatively
impacted because of health problems (asthma) and other problems
like flooding and reduced water supply. A/A (3 marks)
• Growth in GDP can be caused by productivity and longer working
hours. Longer working hours lead to reduced leisure time.
Persons may have stress related illnesses and divorce rates go
up. The standard of living is reduced. A/A (3 marks)
• Growth realized does not impact positively on all citizens.
Those citizens who are unable to work may not experience an
improved standard of living, while their neighbours may. To
address this situation, some persons may resort to crime.
A/A (3 marks)

ECONOMICS
UNIT 2
Key/Mark Scheme
3
QUESTION 1 cont’d
(c) Justify whether GDP is an adequate measure of the standard of living of a country. S/E (5 marks)
Response must include the following:
• The fact that GDP as a measure of standard of living is
questionable.
• Standard of living is a broad concept and cannot be measured
strictly in terms of output increases.
Clearly stated conclusion, good supportive examples. (4-5 marks)
Conclusion stated, satisfactory argument, reasonable support.
(2-3 marks) Weak conclusion (0-1 mark)

ECONOMICS
UNIT 2
Key/Mark Scheme
4
QUESTION 2
(a) Define the term ‘injections’.
An injection represents payments received by
Firms or households that are not passed on through their spending.
K/C (2 marks)
(b) Outline THREE reasons why injections would exceed withdrawals. (6 marks)
Candidates must develop the following points
• There has been an increase in exports. K/C (2 marks)
• There has been a rise in business confidence so investment has
risen. K/C (2 marks)
• There has been a reduction in taxes. K/C (2 marks)
(c) Four factors that would restore equilibrium (12 marks)
Household would not spend more on domestic goods. A/A (3 marks)
They would save more A/A (3 marks)
They would pay more taxes A/A (3 marks)
They would buy more imports A/A (3 marks)
This combination would continue raising withdrawals until they
restore National Income Level.
(d) Explain what happens when equilibrium is restored S/E (5 marks)
Indicate that withdrawals would have to increase (increase in saving,
taxes and imports). More income would be circulating in the economy
and aggregate expenditure would increase. S/E (2 marks)
Identifying the increase in aggregate expenditure on the diagram.
S/E (1 mark)
Showing inverse relationship between rate of inflation and the rate
of unemployment.
OR
Indicating how lower unemployment rates are associated with higher
rates of inflation. S/E (2 marks)
Total 25 marks
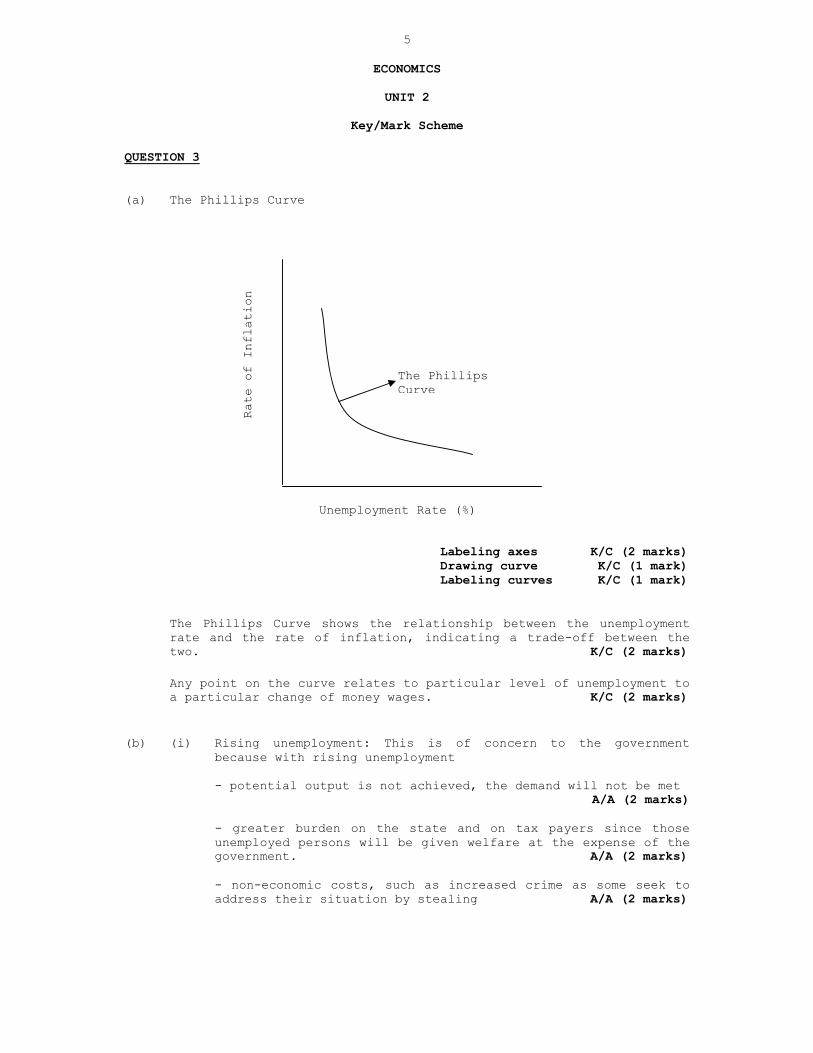
ECONOMICS
UNIT 2
Key/Mark Scheme
5
QUESTION 3
(a) The Phillips Curve
Labeling axes K/C (2 marks) Drawing curve K/C (1 mark) Labeling curves K/C (1 mark)
The Phillips Curve shows the relationship between the unemployment
rate and the rate of inflation, indicating a trade-off between the
two. K/C (2 marks)
Any point on the curve relates to particular level of unemployment to
a particular change of money wages. K/C (2 marks)
(b) (i) Rising unemployment: This is of concern to the government
because with rising unemployment
- potential output is not achieved, the demand will not be met
A/A (2 marks)
- greater burden on the state and on tax payers since those
unemployed persons will be given welfare at the expense of the
government. A/A (2 marks)
- non-economic costs, such as increased crime as some seek to
address their situation by stealing A/A (2 marks)
Rate of Inflation
Unemployment Rate (%)
The Phillips
Curve

ECONOMICS
UNIT 2
Key/Mark Scheme
6
QUESTION 3 cont’d
(ii) High and rising inflation is of concern to the government
because
- domestically this would lead to citizens increasing their
demand for imports and foreign consumers of locally produced
gods reducing demand for local exports which leads to balance
of payment deficit A/A (2 marks)
- the increased price of commodities would result in
decreased demand with citizens’ standard of living being
affected. A/A (2 marks)
- rising price levels might increase production cost which
might cause firms to retrench workers resulting in
unemployment and cut back aggregate supply.
A/A (2 marks)
(c) Justify whether Phillips curve is applicable to your country S/E (5 marks)
Discussion must include the fact that Phillips curve can assist
government in selecting the preferred combination of unemployment and
inflation.
It can also assist in making decisions regarding the reduction of
unemployment if the country is prepared to pay the price for higher
inflation
Discussion well developed and include appropriate illustration/
examples. S/E (4-5 marks)
Discussion fairly well developed and include illustrations / examples
(2-3 marks)
Weak conclusion (0-1 mark)
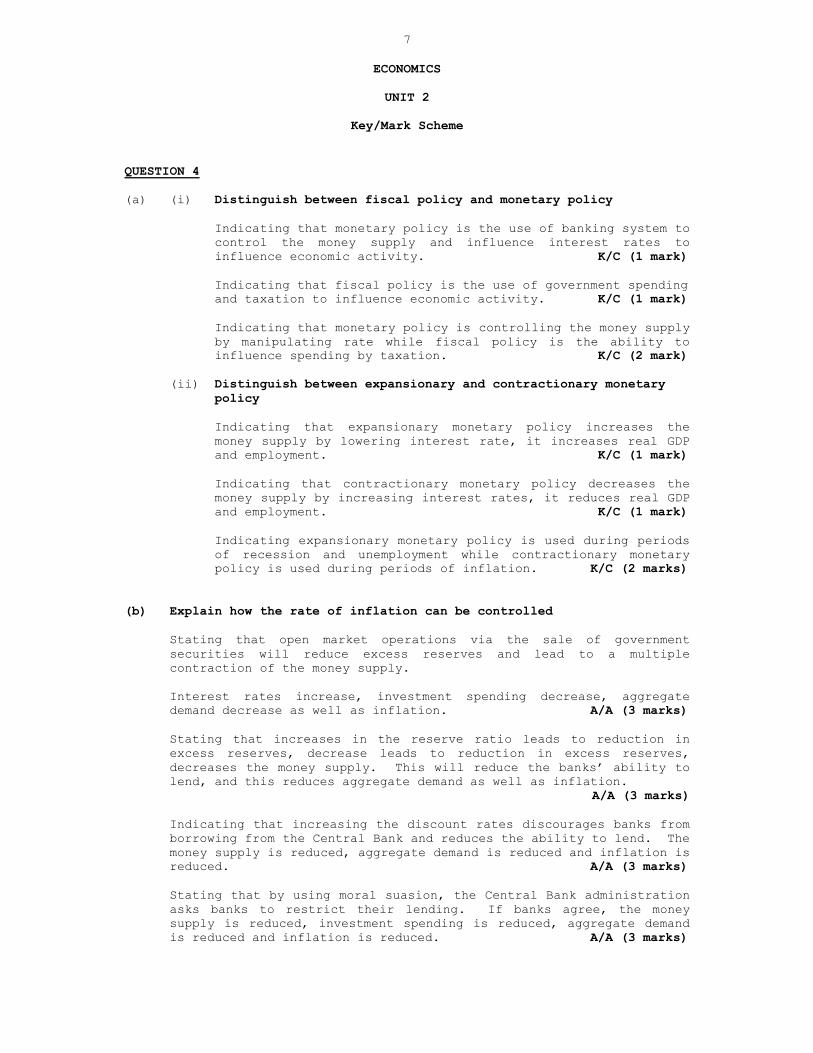
ECONOMICS
UNIT 2
Key/Mark Scheme
7
QUESTION 4
(a) (i) Distinguish between fiscal policy and monetary policy
Indicating that monetary policy is the use of banking system to
control the money supply and influence interest rates to
influence economic activity. K/C (1 mark)
Indicating that fiscal policy is the use of government spending
and taxation to influence economic activity. K/C (1 mark)
Indicating that monetary policy is controlling the money supply
by manipulating rate while fiscal policy is the ability to
influence spending by taxation. K/C (2 mark)
(ii) Distinguish between expansionary and contractionary monetary
policy
Indicating that expansionary monetary policy increases the
money supply by lowering interest rate, it increases real GDP
and employment. K/C (1 mark)
Indicating that contractionary monetary policy decreases the
money supply by increasing interest rates, it reduces real GDP
and employment. K/C (1 mark)
Indicating expansionary monetary policy is used during periods
of recession and unemployment while contractionary monetary
policy is used during periods of inflation. K/C (2 marks) (b) Explain how the rate of inflation can be controlled
Stating that open market operations via the sale of government
securities will reduce excess reserves and lead to a multiple
contraction of the money supply.
Interest rates increase, investment spending decrease, aggregate
demand decrease as well as inflation. A/A (3 marks)
Stating that increases in the reserve ratio leads to reduction in
excess reserves, decrease leads to reduction in excess reserves,
decreases the money supply. This will reduce the banks’ ability to
lend, and this reduces aggregate demand as well as inflation.
A/A (3 marks)
Indicating that increasing the discount rates discourages banks from
borrowing from the Central Bank and reduces the ability to lend. The
money supply is reduced, aggregate demand is reduced and inflation is
reduced. A/A (3 marks)
Stating that by using moral suasion, the Central Bank administration
asks banks to restrict their lending. If banks agree, the money
supply is reduced, investment spending is reduced, aggregate demand
is reduced and inflation is reduced. A/A (3 marks)
ECONOMICS
UNIT 2
Key/Mark Scheme
8
QUESTION 4 cont’d
(c) Discuss the effectiveness of using monetary policy to control inflation S/E (5 marks)
Discussion should be developed on ONE of the following:
• Moral suasion is not compelling
• The money supply of foreign-owned commercial banks is difficult
to control
• Difficulty in eliminating lags in monetary policy
• Monetary policy is weakened by fiscal indiscipline
• Excess liquidity makes monetary policy ineffective
Discussion is coherent and generally well supported by a coherent
example S/E (4-5 marks)
Discussion is satisfactory and partially supported by an example
S/E (2-3 marks)
Discussion is weak and without a supportive example S/E (0-1 mark)

ECONOMICS
UNIT 2
Key/Mark Scheme
9
QUESTION 5
(a) Outline TWO main components of sustainable development. (4 marks)
Sustainable development refers to economic development that takes
into consideration the well-being of the present as well as future
generations, thus ensuring that adequate resources are made available
including a safe environment and natural wealth. K/C (2 marks)
(b) Identify FOUR structural characteristics of the Caribbean K/C (4 marks)
Smallness
Openness
Composition of exports
Resource base
Poverty
Economic dependence
(c) Evaluate the impact of the region’s structural characteristics on sustainable economic development (17 marks)
Candidates should develop the points identified in (b) above
Smallness
Being small means that government is in a weak negotiating position.
This is usually the case with small states, and its firms need
foreign sources of supply and foreign exchange, more than they
themselves are needed. A/A (3 marks)
Openness
The open nature of most small states has resulted in the presence of
multinationals relocating to them This sometimes results in these
states experiencing an injection of foreign direct investment.
A/A (3 marks)
Narrow export base
Most of the exports of small states are usually primarily
agricultural products. This makes the export base narrow. That is,
the export is made up of a small range of goods and services.
A/A (3 marks)
Narrow resource base
Low levels of labour productivity may be experienced because of lack
of capital due to inefficient savings to finance investment and as a
result production is highly labour intensive. There is inefficient
technology and poor quality labour due to low skill and educational
levels. A/A (3 marks)
Conclusion
Candidates should discuss the pros and cons of the aforementioned
factors.
Clear and coherent, well reasoned conclusion (4-5 marks) Reasonable but inconclusive discussion (2-3 marks) Weak discussion (0-1 marks)

ECONOMICS
UNIT 2
Key/Mark Scheme
10
QUESTION 6
(a) Four forms of economic integration (8 marks)
Economic integration refers to economic cooperation among economies
and harmonization of their economic policies.
Free trade area – a trading arrangement where member countries remove
tariffs and quotas between themselves but retain restriction with
non-member countries. K/C (2 marks)
Customs Union – a free trade area within member countries adopting
common external tariffs and quotas with non-member countries.
K/C (2 marks)
Common Market - a customs union with free movement of the factors of
production between countries. K/C (2 marks)
Economic Union – a common market with convergence of macro-economies
among members as well as a single currency. K/C (2 marks)
(b) Evaluate the costs and benefits of economic integration
Candidates should discuss the four forms of integration attained by
the Caribbean in a coherent manner.
The process of integration in the Caribbean has gone from a free
trade area, CARIFTA, to a Customs Union, CARICOM. There is currently
a Common External Tariff (CET) on export from non-members. The final
stage of integration will be seen with the CARICOM Single Market and
Economy. There will be free movement of labour and resources
throughout the CSME. A/A (6 marks)
Candidates should discuss the costs and benefits of economic
integration in the Caribbean. That is, Trade creation – countries
switch trade from high cost to low cost producers. There will be
greater specialization because of comparative advantage. Lower cost
leads to greater surplus.
Trade diversion – Most countries trade with non-members (US, UK,
Europe)whose cost of production would be cheaper than those countries
inside the Caribbean region. Trade diversion may be limited since
trade among CARICOM members states is limited in volume and value.
A/A (6 marks)
Candidates should conclude that economic integration movement in the
Caribbean has challenges but there was movement from the lower form
(Free Trade Area) to a high form (Economic Union). Here, the
benefits exceed the costs. S/E (5 marks)
Clear and coherent, well reasoned conclusion (4-5 marks) Reasonable but inconclusive discussion (2-3 marks) Weak discussion (0-1 marks)
Copyright © 2006 Caribbean Examinations Council ®.
All rights reserved.
004075/CAPE/SPEC 2010
TEST CODE :022160
FORM TP 02216030/SPEC 2010
C A R I B B E A N E X A M I N A T I O N S C O U N C I L
ADVA�CED PROFICIE�CY EXAMI�ATIO�
ECO�OMICS
U�IT 2
PAPER 03/2
SPECIME� PAPER
2 hours
Answer ALL questions
Examination Materials
Mathematical formulae and tables
Electronic calculator
Ruler and graph paper
Answer ALL questions
INSTRUCTIONS TO CANDIDATES
1. This paper consists of THREE questions.
2. Candidates must answer ALL questions.
3. Answers for ALL questions must be written in the answer booklet provided.
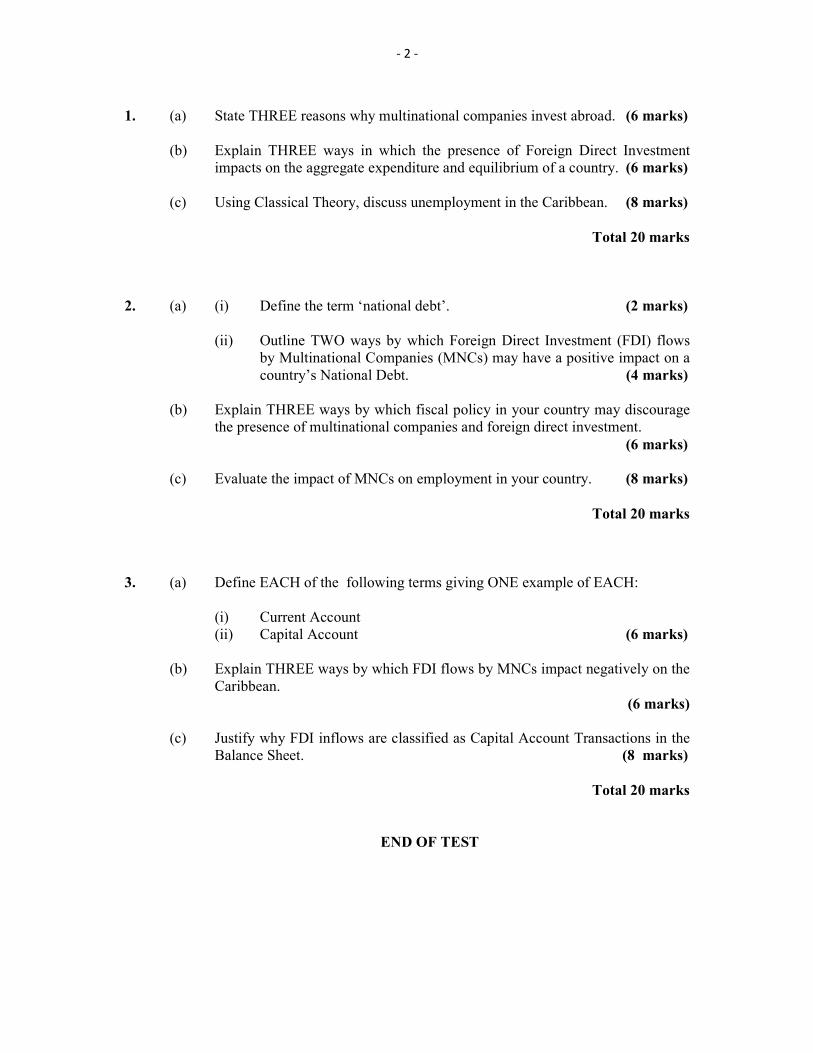
- 2 -
1. (a) State THREE reasons why multinational companies invest abroad. (6 marks)
(b) Explain THREE ways in which the presence of Foreign Direct Investment
impacts on the aggregate expenditure and equilibrium of a country. (6 marks)
(c) Using Classical Theory, discuss unemployment in the Caribbean. (8 marks)
Total 20 marks
2. (a) (i) Define the term ‘national debt’. (2 marks)
(ii) Outline TWO ways by which Foreign Direct Investment (FDI) flows
by Multinational Companies (MNCs) may have a positive impact on a
country’s National Debt. (4 marks)
(b) Explain THREE ways by which fiscal policy in your country may discourage
the presence of multinational companies and foreign direct investment.
(6 marks)
(c) Evaluate the impact of MNCs on employment in your country. (8 marks)
Total 20 marks
3. (a) Define EACH of the following terms giving ONE example of EACH:
(i) Current Account
(ii) Capital Account (6 marks)
(b) Explain THREE ways by which FDI flows by MNCs impact negatively on the
Caribbean.
(6 marks)
(c) Justify why FDI inflows are classified as Capital Account Transactions in the
Balance Sheet. (8 marks)
Total 20 marks
E�D OF TEST

CAPE/K/MS/2010
C A R I B B E A N E X A M I N A T I O N S C O U N C I L
HEADQUARTERS
ECONOMICS
UNIT 2 – PAPER 03/2
KEYS AND MARK SCHEME
/CAPE/K/MS/2010
ECONOMICS
UNIT 2 – PAPER 03/2
KEYS AND MARK SCHEME
2
QUESTION 1
(a) State THREE reasons why Foreign Direct Investment companies invest abroad. Any three of the following
• To gain access to raw materials and market K/C (2 marks)
• To avoid trade barriers K/C (2 marks)
• To take advantage of lower labour costs K/C (2 marks)
• to exploit their technological and organizational
advantages(such as superior managerial skills) over local
firms K/C (2 marks)
• because their main domestic rivals have already undertaken
overseas investment or about to do so K/C (2 marks)
Total 6 marks
(b) Explain THREE ways in which the presence of Foreign Direct Investment impacts on the aggregate expenditure and equilibrium of a country.
Foreign direct investment is considered as gross private domestic
investment. An increase in foreign direct investment will lead to
an increase in aggregate expenditure A/A (2 marks)
since AE = C + Ig + G + Xn) of the same amount. A/A (2 marks)
The equilibrium level or national income/GDP will increase by an
amount that is greater than the initial increase in foreign
direct invest because of the multiplier effect. A/A (2 marks)
Total 6 marks
(c) Discuss, using Classical theory, unemployment in the Caribbean.
Classical theory view all unemployment as being voluntary. They
assumes that prices and wages are flexible and that they adjust
quickly so the market will always be in equilibrium. Anyone who
is without employment chooses to be unemployed. If unemployment
exist for a brief moment, the forces of supply and demand will
adjust quickly to bring the labour market back into equilibrium,
therefore anyone who wants to work will find work.

/CAPE/K/MS/2010
ECONOMICS
UNIT 2 – PAPER 03/2
KEYS AND MARK SCHEME
3
QUESTION 1 cont’d
In the Caribbean there are persons who have graduated from
schools and colleges and are unemployed because they refuse to
take a job at a lower level than what they think they qualify
for. For instance, an individual who graduates with 6 CXC
subjects may refuse to take a job as a store clerk, hence,
according to the theory of unemployment, that person may choose
to be unemployed.
Outlining theory A/A (2 marks) Applying theory to the Caribbean S/E (4 marks) Use of appropriate examples S/E (2 marks)
Total 20 marks
/CAPE/K/MS/2010
ECONOMICS
UNIT 2 – PAPER 03/2
KEYS AND MARK SCHEME
4
QUESTION 2 (a) (i) Definition of National Debt
National Debt refers to the total of all past borrowings by
the state. K/C (2 marks)
(ii) Outline TWO ways by which FDI flows by MNCs may have a positive impact on a country’s National Debt.
• The government can utilize its ability to give tax breaks
and incentives to firms that may wish to invest locally
hence foreign exchange is provided K/C (2 marks)
• More employment is provided and this generates more tax
revenue K/C (2 marks)
Total 6 marks
(b) Explain THREE ways in which fiscal policy in your country may discourage the presence of multinational companies (MNCs) and foreign direct investment (FDI).
• If taxes to the firms are too high. A/A (2 marks)
• If insufficient expenditure is spent on the country’s
infrastructure such as roads, water and electricity. A/A (2 marks)
• If there is no incentive to MNC in the form of tax holidays. A/A (2 marks)
Total 6 marks
(c) Evaluate the impact of MNCs on employment in your country.
Candidates’ discussion should include at least TWO of the
following points
• the training of employees
• the hiring of citizens
• the technological experience gained by workers

/CAPE/K/MS/2010
ECONOMICS
UNIT 2 – PAPER 03/2
KEYS AND MARK SCHEME
5
QUESTION 2 cont’d
While MNCs provide employment for citizens, more often than not
employment is at the lower level. [2] Most of the executive positions are held by foreign individuals. [1] There is usually
little opportunity for training as the skills required is usually
at the lower level. [2] This is quite evident in the
construction industry [1] where locals are usually masons,
carpenters and labourers while positions such as architect and
engineer are held by foreign persons. [2] Outline benefits and drawbacks A/A (2 marks) Discussion focuses on benefits and drawbacks and uses illustrative examples S/E (5-6 marks) Discussion focuses on benefits and drawbacks S/E (3-4 marks) Discussion focus on one side of the argument S/E (1-2 marks)
(8 marks)
Total 20 marks

/CAPE/K/MS/2010
ECONOMICS
UNIT 2 – PAPER 03/2
KEYS AND MARK SCHEME
6
QUESTION 3 (a) (i) Define ‘Current Account’
Current Account are records of exports and imports of goods
and services, net investments and net transfers.
K/C (2 marks)
Examples of Current Account Transaction K/C (1 mark)
Merchandise Trade Balance
Services Balance
Net Property Income Balance
Current Transfers Balance
Define ‘Capital Account’
Capital Account are records of the transfers of capital to
and from abroad. They are addition to the capital stock of
a country. K/C (2 marks)
Examples of Capital Account Transactions K/C (1 mark)
Official Capital flows
Private Capital flows
Errors and Omissions
Total 6 marks
(b) Explain THREE ways in which FDI flows by MNCs impact negatively on the Caribbean.
Candidates must elaborate on Any three for 2 marks each
• Profit may be repatriated – Multinationals can deprive
Caribbean countries of foreign exchange. They have the
ability to move capital and profits around the world and
avoid tax and exchange control regulations through policy
or inter-company pricing. Also, while goods produced by
these companies are sold abroad thus creating exports for
Caribbean countries, much of the equipment, parts etc,
which goes into the finished goods have to be imported.
/CAPE/K/MS/2010
ECONOMICS
UNIT 2 – PAPER 03/2
KEYS AND MARK SCHEME
7
• Cultural penetration may influence the citizens –
Multinationals may change the culture of Caribbean
countries in such a way that people’s priorities change and
they become more selfish, greedy and rapacious and less
concerned with their fellow human beings in pursuit of
wealth.
• There may be transfer pricing
• Tax holidays may result in country’s losing out on valuable
revenue
(c) Justify why FDI inflows are classified as Capital Account Transactions in the Balance Sheet.
FDI inflows are classified as Capital Account transactions since
they represent additions to the stock of capital. It is recorded
under Private Capital flows. The income earned on such
investment by a MNC is however classified as a Capital Account
Transaction.
For example, if funds From Barbados are exported to purchase
Unites States bonds, the capital transaction involves the
purchase and hence the import of the United States bonds and this
has the same effect on the balance of payment as the purchase
and hence the import of a united States Good. Both items involve
payment to foreigners and both use foreign exchange. They are
thus debit items in the Barbados balance of payment.
Show a clear understanding of the transaction A/A (2 marks) Discuss concept with the use of valid illustrative examples
S/E (6 marks)
(8 marks)
Total 20 marks


![Why economics? p 17 Task IV check Paragraphs 1 – 8 Pg 2: economic, economics, economics Pg 3: scarce Attn: [ skeәs ] Pg 4: economy, economic, economize,](https://static.documents.pub/doc/80x56/56649d975503460f94a80350/why-economics-p-17-task-iv-check-paragraphs-1-8-pg-2-economic-economics.jpg)


