___________________________________________________________________________ 2014/AD1/053 Agenda Item: 3 Economy Presentation - Malaysia Purpose: Information Submitted by: Malaysia 20 th Automotive Dialogue Beijing, China 22-25 April 2014
ECONOMY: MALAYSIA APEC AUTO DIALOGUE 23-25 APRIL 2014
BEIJING
1. Malaysia - domestic auto taxation
2. Market situation - Production & Sales
3. Market Access - Updates on trade liberalization
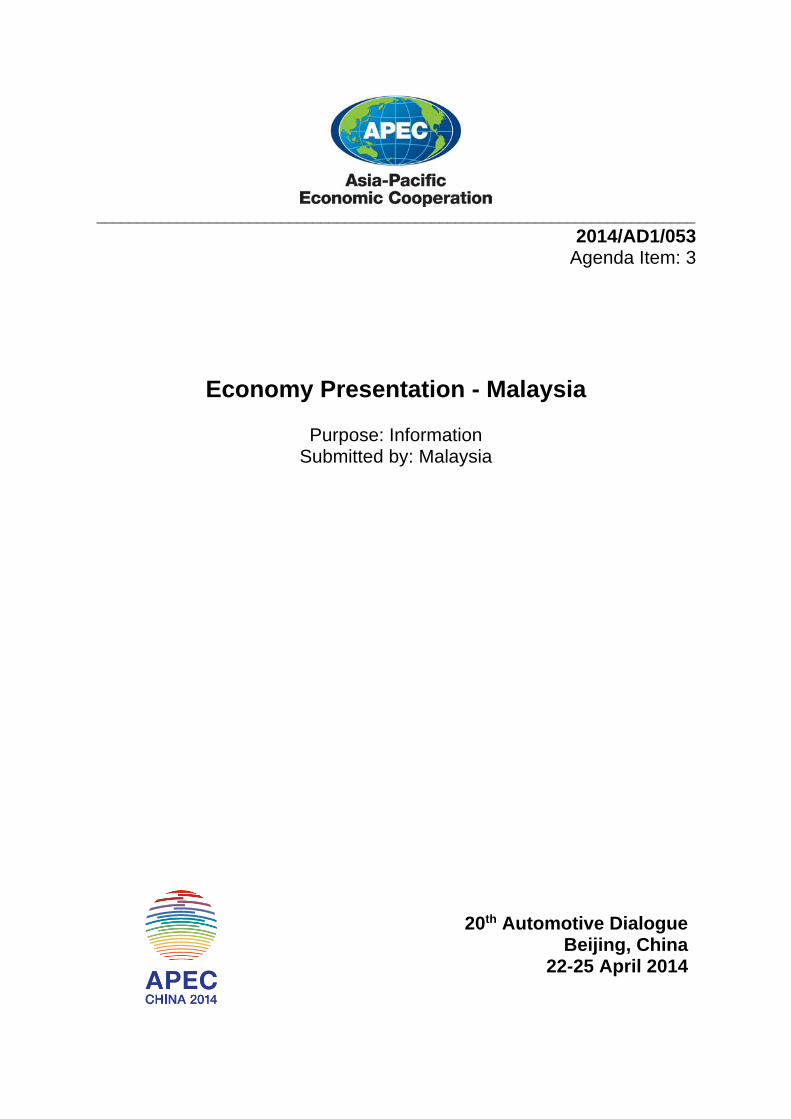
4. Updates on Regulations and Standards
5. Updates on Automotive policy
6. Challenges & Opportunities
CONTENTS
5/21/2014
2
1. Malaysia - domestic auto taxation
CONTENTS
MALAYSIA: TARIFFS Motor Cars (including Station Wagons, Sports Cars
and Racing Cars)
IMPORT DUTY LOCAL TAXES
CBU CKD CBU & CKD
Engine Capacity (cc) MFN ATIGA MFN ATIGA Excise
Duties SalesTax
< 1,800 30% 0% 10% 0% 75% 10%
1,800 - 1,999 30% 0% 10% 0% 80% 10%
2,000 – 2499 30% 0% 10% 0% 90% 10%
Above 2,500 30% 0% 10% 0% 105% 10%
5/21/2014
3
MALAYSIA: TARIFFS Four Wheel Drive Vehicles
IMPORT DUTY LOCAL TAXES
CBU CKD CBU & CKD
Engine Capacity (cc) MFN ATIGA MFN ATIGA Excise
Duties SalesTax
< 1,800 30% 0% 10% 0% 65% 10%
1,800 - 1,999 30% 0% 10% 0% 75% 10%
2,000 – 2499 30% 0% 10% 0% 90% 10%
Above 2,500 30% 0% 10% 0% 105% 10%
MALAYSIA: TARIFFS Other Types Of Vehicles (MPVs, Vans)
IMPORT DUTY LOCAL TAXES
CBU CKD CBU & CKD
Engine Capacity (cc) MFN ATIGA MFN ATIGA Excise
Duties SalesTax
< 1,500 30% 0% NIL 0% 60% 10%
1,500 - 1,799 30% 0% 10% 0% 65% 10%
1,800 - 1,999 30% 0% 10% 0% 75% 10%
2,000 – 2499 30% 0% 10% 0% 90% 10%
Above 2,500 30% 0% 10% 0% 105% 10%
5/21/2014
4
MALAYSIA: TARIFFS Commercial Vehicles
IMPORT DUTY LOCAL TAXES
CBU CKD CBU & CKD
Class MFN ATIGA MFN ATIGA Excise Duties
SalesTax
All 30% 0% NIL 0% NIL 10%
2. MARKET SITUATION -PRODUCTION & SALES
5/21/2014
5
MALAYSIA ~ PRODUCTION DATA
Notes:Passenger Vehicles include all passenger carrying vehicles i.e. Passenger Cars, 4WD/SUV, Window Vans and MPVs.Commercial Vehicles include Trucks, Prime Movers, Pick-ups, Panel Vans & Buses.
MALAYSIA: PRODUCTION BY TYPES OF VEHICLE
SEGMENTYEAR-TO-DATE DECEMBER
2013 2012VARIANCE
UNITS %Total Industry Volume (TIV) 601,407 569,620 31,787 5.6 PV (Passenger Vehicles) 543,892 509,621 34,271 6.7
Jan Feb MarTIV 2014 50,273 50,718 58,919TIV 2013 55,066 45,046 57,622
50,273
50,718
58,919 55,066
45,046
57,622
-
10,000
20,000
30,000
40,000
50,000
60,000
70,000Unit
Malaysia’s GDP Growth
2013 : 4.7%
2014 (forecast) : 5.0% to 5.5%
MARKET OUTLOOK 2014
5/21/2014
9
MARKET OUTLOOK 2014
VARIANCE
2014FORECAST
2013ACTUAL UNITS %
PASSENGERVEHICLES 589,600 576,657 12,943 2%
COMMERCIAL VEHICLES 80,400 79,136 1,264 2%
TOTAL VEHICLES 670,000 655,793 14,207 2%
3. Market Access - Updates on trade liberalization
CONTENTS
5/21/2014
10
International trade is an important contributor to Malaysia'seconomic growth and development. Malaysia is pursuing regionaland bilateral trading arrangements to complement the multilateralapproach to trade liberalisation. Details of FTAs concluded andunder negotiations are summarized as below:
Regional (ASEAN): AFTA, China,Japan, Korea, India and Australia-New Zealand
Under negotiation: EU, Trans-PacificPartnership (TPP), and Turkey
Bilateral: Japan, Pakistan, Chile,India, New Zealand, Australia
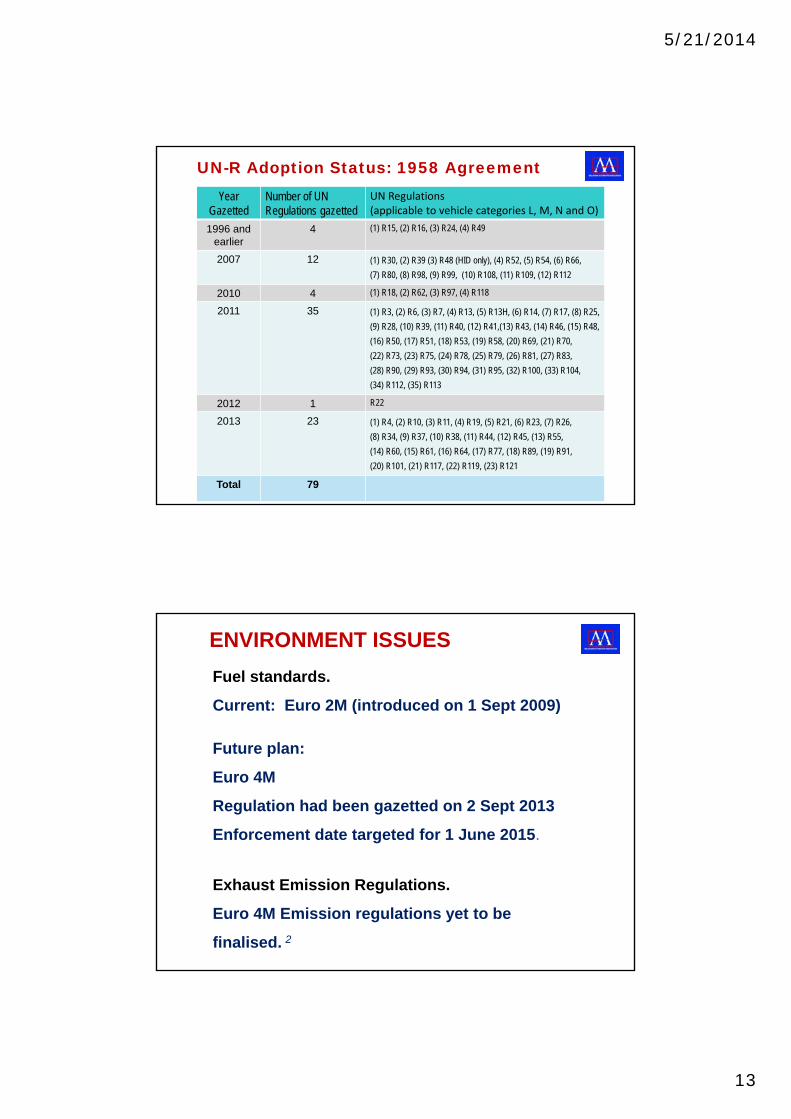
Export of Recycled Materials & Remanufactured Components
RM 2 Billion 0
5/21/2014
18
TARGETS OF NAP 2014 TOWARDS 2020
ITEM 2020 2013Passenger CarTotal Production Vol. 1.25 mil units 601,407 unitsTotal Industry Vol. 1.0 mil units 655,793 unitsExports 250,000 units ~20,000 units
Commercial VehiclesTotal Production Vol. 100,000 units 57,515 units
MotorcycleTotal Production Vol. 800,000 units ~430,000 units
FIRST COMPANY GRANTED AN EEV LICENSE UNDER NAP 2014
5/21/2014
19
6. Challenges
CONTENTS
CHALLENGES
1. Internal Factors
a) Domestic oriented
b) Saturated local market
c) High excise duties for motor vehicles
d) Lack of economies of scale
e) Shortage of qualified skilled workers.
f) Lack of R&D core competency & high cost to acquire technology
5/21/2014
20
CHALLENGES (cont..)
2. External Factors
a)Export activity of local assemblers constrained by foreign principals.
b)Export market highly competitivec)Intense competition among ASEAN nations
for foreign investment. d)Faster pace of liberalization of markets
among competing nations coupled with offering of attractive investment packages.
e)Excess production capacity
CHALLENGES (cont..)
3. Government Policies
a) Local industry operating under a protected environment in the last three decades.
b) Sometimes policies introduced were not consistent, short-term oriented and not in tandem with industry’s proposals.
c) Trade agreements signed tend to exclude automotive sector.
5/21/2014
21
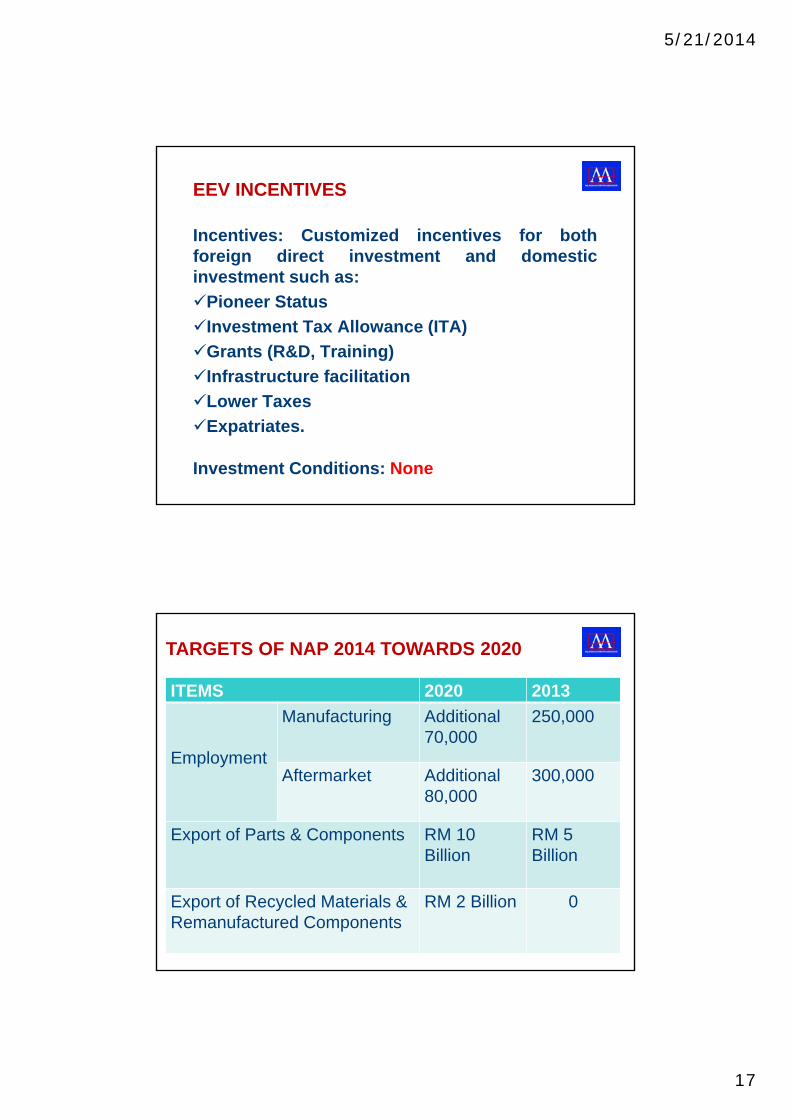
OPPORTUNITIES
Prospects for the automotive industry remain positive.
Automotive sector is one of the core industries in MalaysiaStrong backing and Government’s commitment towards further development of the industryDedicated agency for automotive sector (i.e. MAI) and policy clarity post announcement of the NAP 2014 Political and economic stabilityWell developed infrastructureRising income level of consumers3
The various Government projects under the ETP will generate investment and boost growth4
OPPORTUNITIES (cont..)
Localization of production and manufacturing activities
Collaboration with local vendors to supply the ASEAN and global markets
Increasing demand for fuel efficient and environment -friendly cars. e.g. strong growth in hybrid vehiclessales from 2010 to2013