14


2009 World Development Indicators 1
The world seems to be entering an economic crisis unlike any seen since the founding of the Bretton Woods institutions. Indeed, simultaneous crises. The bursting of a real estate bubble. The liquidity and solvency problems for major banks. The liquidity trap as consumers and businesses prefer holding cash to spending on consumption or investment. The disrup-tions in international capital flows. And for some countries a currency crisis.
Plummeting global output and trade in the last quarter of 2008 brought the global economy to a standstill after years of remarkable growth, throwing millions out of work. The United States, as the epicenter, has seen unemployment rising to more than 11 million, an unem-ployment rate of 7.2 percent. Most forecasts show world GDP growth slowing to near zero or negative values, after a 3.4 percent increase in 2008.
What brought about the crisis? Why is it so severe? How quickly has it spread? In this intro-duction, and in the introductions to sections four (Economy) and six (Global links), the data describe the events that have brought us to this point. Could the crisis have been anticipated by looking more closely at the same data? Perhaps. Perhaps not. But there is still much we can learn about how these events unfolded.
The crisis must be seen in the context of dramatic changes in the global economy. First, record export-led economic growth in emerging market economies shifted the balance of global economic power, evidenced by their growing share in world output, trade, and international reserves. High savings rates outstripped their capacity to invest in their own economies while policies to sterilize large inflows and protect against financial shocks led to a large build up in international reserves. So poorer economies were financing the current account deficits of high-income economies. Second, financial integration has accompanied expanding trade, spurred by remarkable developments in information technology and financial innovation. This extended the reach of global markets, lowering costs and increasing their efficiency, but also spreading systemic shocks farther and faster.
The financial crisis had its origins in a U.S. real estate asset bubble fed by a boom in sub-prime mortgage lending. The availability of cheap credit fed asset bubbles in other developed economies and among major emerging market economies. The rapid and massive growth of long-term, illiquid, and risky assets financed by short-term liabilities contributed to the speed with which the crisis spread across the world economy and to its severity.
Global growth will be negative in 2009, and growth in developing economies will fall sharply from the 6 percent or higher rates of 2008. This reflects both a sharp decline in export demand from high-income economies and a major reduction in access to commercial finance and an increase in its cost. Slower growth will inevitably affect the ability of low-income economies to reach the Millennium Development Goals. How far the global recession extends and how long it lasts will depend on the effectiveness of policies adopted by rich and poor economies alike in the months ahead.
Introduction

2009 World Development Indicators2
Contributions to GDP growth (%)
–2
0
2
4
6
8
10
20072005200019951990
Net exports Investment Consumption
Increased investment led to faster growth
in low- and middle-income economies 1d
Source: World Development Indicators data files.
–6
–4
–2
0
2
4
6
8
20072000199519901985198019751970
Annual growth in GDP per capita, 10-year moving average (%)
East Asia & Pacific
Europe & Central Asia
South Asia
Latin America & Caribbean
High-income OECD
Middle East & North AfricaSub-Saharan Africa
Long-term trends
reached new heights 1b
Source: World Development Indicators data files.
Merchandise exports from developing economies, by destination ($ trillions)
0
1
2
3
4
5
20072005200019951990
To high-income economies
To middle-income economies
To low-income economies
Most developing economy exports
go to high-income economies 1c
Source: International Monetary Fund’s Direction of Trade database.
Average annual growth in purchasing power parity GDP (%)
0
2
4
6
8
2000–071990–20001980–901970–80
Low income Middle income High income
Developing economies had their
best decade of growth in 2000–07 1a
Note: Data for 1970–80 are based on GDP in constant 2000 U.S. dollars converted using market exchange rates.Source: World Development Indicators data files.
Exports led growth
Integration of the global economy was marked by a rapid in-
crease in trade. Growth in low- and middle-income economies
was led by exports, which grew at an average annual rate of
12 percent over 2000–07. China and India were among the
fastest- growing exporters. Export growth was led by manu-
factures in China and by services in India. Some smaller
economies with exports of oil, gas, metals, minerals, or manu-
factures were also among the fastest growing. Exports from
low- and middle-income economies in 2007 made up 29 per-
cent of the world total, up from 21 percent in 2000. Although
trade between low- and middle-income economies has been
growing, 70 percent of low- and middle-income economies’ ex-
ports still went to high-income economies in 2007 (figure 1c).
Fast-growing, export-oriented economies attracted new
investment (figure 1d). Some of it came from domestic sav-
ing. In low- and middle-income economies savings rose from
25 percent of GDP in 2000 to 32 percent in 2007. But growth
also attracted foreign direct investment. The contribution of
investment to GDP growth in these economies averaged less
than 1 percentage point before 2000 but rose to 2.4 percent-
age points over 2000–07.
Growth accelerated in the 2000s
The years preceding the 2008 global crisis saw the strongest
economic growth in decades (figure 1a). Global economic
output grew 4 percent a year from 2000 to 2007, led by re-
cord growth in low- and middle-income economies. Develop-
ing economies averaged 6.5 percent annual growth of GDP
from 2000 to 2007, and growth in every region was the high-
est in three decades (figure 1b). Europe and Central Asia and
South Asia had their best decade in the most recent period
(2000–07). East Asia and Pacific almost equaled its previous
peak, reached before the 1997 crisis. For others the peak
was in 1976— before the oil price shocks of the late 1970s
and the debt crisis of the 1980s. But growth rates in high-
income economies have been on a downward path since the
1970s.
China and India have emerged in recent years as drivers of
global economic growth, accounting for 2.9 percentage points
of the 5 percent growth in global output in 2007. Low- and
middle-income economies now contribute 43 percent of
global output, up from 36 percent in 2000. China and India
account for 5 percentage points of that increased share.

2009 World Development Indicators 3
Net flows of portfolio debt and equity securities ($ billions)
–250
0
250
500
750
1,000
UnitedStates
UnitedKingdom
Euroarea
JapanBrazil
2000 2007
Trade deficits were
financed by foreign investors 1h
Source: International Monetary Fund balance of payments data files.
Reserves ($ billions)
0
400
800
1,200
1,600
ChinaJapanEurozone
RussianFederation
Taiwan,China
2000 2007
Trade surpluses led to
large build-ups in reserves 1g
Source: International Monetary Fund balance of payments data files.
Economy
2005–07 average
($ billions)
Share of all deficit/surplus economies (%)
Percent of GDP
All deficit economies –1,303 United States –749 57 –6Spain –113 9 –9United Kingdom –74 6 –3Australia –47 4 –6Italy –43 3 –2
All surplus economies 1,428 China 372 26 10Germany 256 18 6Japan 210 15 4Saudi Arabia 95 7 27Russian Federation 76 5 8
Source: International Monetary Fund balance of payments data files and World Development Indicators data files.
Large current account surpluses and deficits were
concentrated in a few economies during 2005–07 1e
Countries became more interdependent
As the global imbalance between savings and investment
grew, countries with large deficits borrowed from countries
with surpluses, while fast-growing exporters depended on ex-
panding markets in deficit countries. China and other surplus
economies accumulated record reserves (figure 1g) and sent
capital overseas. The United States and other deficit coun-
tries consumed more and financed their deficits by issuing
more debt and equity (figure 1h).
Savings and investment trends for China, the largest sur-
plus country, and the United States, the largest deficit coun-
try, illustrate the growing imbalances. China’s savings rate
increased, exceeding investment by 11.5 percent of GDP in
2007. In the United States private savings almost disappeared,
and investment exceeded savings by 4.6 percent of GDP.
Countries with large reserves invested large portions of
their holdings in U.S. Treasury securities, widely regarded as
very low risk. At the end of 2008 China was the largest foreign
holder of U.S. Treasury securities, at $696 billion, followed by
Japan, at $578 billion. Total foreign holdings of U.S. Treasury
securities were $3.1 trillion, up from $2.4 trillion in 2007.
Structural imbalances emerged
Countries with trade surpluses accumulated capital beyond their capacity to absorb it. Many ran large current account surpluses and accumulated record reserves. Countries with trade deficits financed their current account by increased bor-rowing abroad. From 2005 to 2007 the five largest surplus economies accounted for 71 percent of total current account surpluses, and the five largest deficit economies, for 79 per-cent of total current account deficits (table 1e).
China’s current account surplus rose from 2 percent of GDP in 2000 to an average of 10 percent during 2005–07 (figure 1f). Oil and gas exporters such as the Russian Fed-eration and Saudi Arabia also saw surpluses balloon. Unlike many high-income economies, Germany went from a deficit of 1.5 percent of GDP in 2000 to a surplus of 6 percent over 2000–07. But some countries with strong export growth had equally strong import growth, with India and Mexico maintain-ing small current account deficits.
The largest deficits were in high-income economies, with the United States accounting for more than half the world’s current account deficits. The U.S. current account deficit increased from 4.3 percent of GDP in 2000 to an average of 6 percent in 2005–07. Spain’s rose from 4 percent to 9 percent of GDP.
–10
0
10
20
30
20072006200520042003200220012000
Current account balance (% of GDP)
China
United Kingdom
United StatesSpain
Russian Federation
Saudi Arabia
Current account surpluses
and deficits increased 1f
Source: World Development Indicators data files.
2009 World Development Indicators4
0
10
20
30
40
50
20072006200520042003200220012000
Price-earnings ratio (Standard & Poor’s IFCG index)
Brazil
China
India
Russian Federation
. . . And so were
equity asset valuations 1l
Source: Standard & Poor’s 2008.
0
300
600
900
1,200
1,500
1,800
Jan-07Jan-06Jan-05Jan-04Jan-03Jan-02Jan-01Jan-00Jan-99Jan-98
Spread on emerging market sovereign bonds against 10-year U.S. Treasury notes (basis points)
. . . And investors
perceived less risk 1j
Source: JPMorgan-Chase.
100
200
300
400
500
2008200720062005200420032002
House price indices (2002 = 100)
Taiwan, China: Sinyi Purchase Price Index
Malaysia: house prices
South Africa:ABSA House Price Index
Russian Federation: average housing prices
Indonesia: residential propertyprice index (14-city composite)
Singapore: propertyprice index
Prices of assets, especially in real estate,
were rising rapidly in some countries . . . 1k
Source: Haver Analytics.
0
2
4
6
8
20072005200019951990
Private financial flows (% of GDP)
Private capital flows to developing
economies took off in 2002 . . . 1i
Source: Global Development Finance data files and World Development Indicators data files.
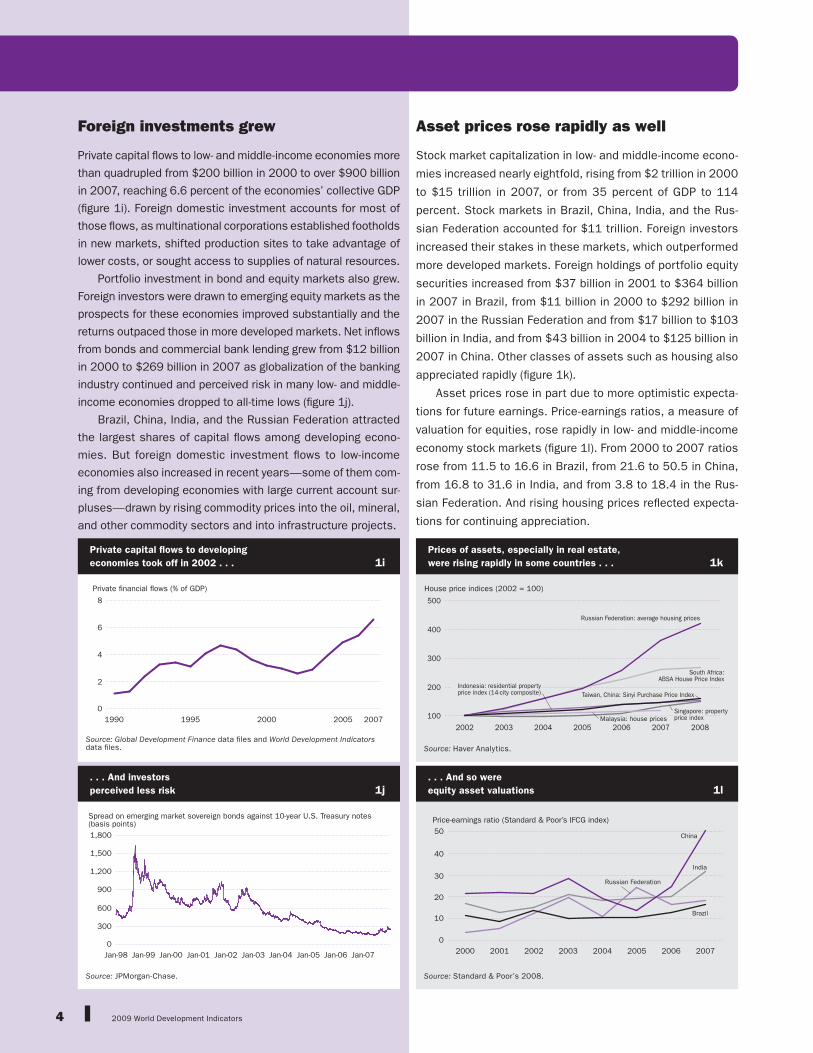
Asset prices rose rapidly as well
Stock market capitalization in low- and middle-income econo-
mies increased nearly eightfold, rising from $2 trillion in 2000
to $15 trillion in 2007, or from 35 percent of GDP to 114
percent. Stock markets in Brazil, China, India, and the Rus-
sian Federation accounted for $11 trillion. Foreign investors
increased their stakes in these markets, which outperformed
more developed markets. Foreign holdings of portfolio equity
securities increased from $37 billion in 2001 to $364 billion
in 2007 in Brazil, from $11 billion in 2000 to $292 billion in
2007 in the Russian Federation and from $17 billion to $103
billion in India, and from $43 billion in 2004 to $125 billion in
2007 in China. Other classes of assets such as housing also
appreciated rapidly (figure 1k).
Asset prices rose in part due to more optimistic expecta-
tions for future earnings. Price-earnings ratios, a measure of
valuation for equities, rose rapidly in low- and middle-income
economy stock markets (figure 1l). From 2000 to 2007 ratios
rose from 11.5 to 16.6 in Brazil, from 21.6 to 50.5 in China,
from 16.8 to 31.6 in India, and from 3.8 to 18.4 in the Rus-
sian Federation. And rising housing prices reflected expecta-
tions for continuing appreciation.
Foreign investments grew
Private capital flows to low- and middle-income economies more
than quadrupled from $200 billion in 2000 to over $900 billion
in 2007, reaching 6.6 percent of the economies’ collective GDP
(figure 1i). Foreign domestic investment accounts for most of
those flows, as multinational corporations established footholds
in new markets, shifted production sites to take advantage of
lower costs, or sought access to supplies of natural resources.
Portfolio investment in bond and equity markets also grew.
Foreign investors were drawn to emerging equity markets as the
prospects for these economies improved substantially and the
returns outpaced those in more developed markets. Net inflows
from bonds and commercial bank lending grew from $12 billion
in 2000 to $269 billion in 2007 as globalization of the banking
industry continued and perceived risk in many low- and middle-
income economies dropped to all-time lows (figure 1j).
Brazil, China, India, and the Russian Federation attracted
the largest shares of capital flows among developing econo-
mies. But foreign domestic investment flows to low-income
economies also increased in recent years—some of them com-
ing from developing economies with large current account sur-
pluses—drawn by rising commodity prices into the oil, mineral,
and other commodity sectors and into infrastructure projects.

2009 World Development Indicators 5
0
25
50
75
100
20072005200019951990
External debt to GNI ratio, by region (%)
East Asia & PacificEurope & Central AsiaSouth Asia
Latin America & CaribbeanMiddle East & North Africa
Sub-Saharan Africa
Indebtedness ratios have
improved for most economies 1m
Source: Global Development Finance data files and World Development Indicators data files.
Short-term debt, by region (% of total reserves)
0
25
50
75
100
Sub-SaharanAfrica
SouthAsia
Middle East &North Africa
LatinAmerica &Caribbean
Europe &Central Asia
East Asia& Pacific
2000 2007
Growing reserves comfortably
covered short-term debt liabilities 1n
Source: World Development Indicators data files.
Demand for primary commodities increased
Rapid global economic growth drove demand for commodi-ties, boosting prices, especially for oil, metals, and minerals used as inputs to manufacturing. After increasing gradually from 2000 to 2006, prices rose more rapidly in 2007 and into 2008. Food prices also rose, due in part to the production of ethanol from corn and other food crops (figure 1o).
Rising commodity prices benefited exporters, especially in Latin America and the Caribbean and Sub-Saharan Africa. Aside from the terms of trade gains, the higher commodity prices increased government revenues from taxes on com-modity exports and attracted foreign domestic investment into commodity exports and supporting infrastructure projects.
But for food and fuel importers the spike in prices has been costly. Current account balances of most oil-importing low- and middle-income economies worsened (figure 1p). Price increases have also pushed up inflation and interest rates, with the impacts especially severe for poor people. In eight countries higher food prices between 2005 and 2007 increased poverty rates by 3 percentage points on average (Ivanic and Martin 2008). Globally, the number of people living on less than $1.25 a day may have risen by more than 100 million before commod-ity prices began to fall in the latter half of 2008.
External debt declined and changed composition
The Debt Initiative for Heavily Indebted Poor Countries and
the Multilateral Debt Relief Initiative have helped some of
the poorest and most indebted countries, especially in Sub-
Saharan Africa, significantly reduce their outstanding debt.
External debt to GNI ratios for Sub-Saharan Africa went from
more than 80 percent in the mid-1990s to less than 30 per-
cent today (figure 1m). Elsewhere, especially in Europe and
Central Asia, debt increased in recent years. For Croatia, Ka-
zakhstan, Latvia, Romania, and a few small island economies
external debt to GNI ratios reached all-time highs in 2007.
As debt ratios fell, many countries gained access to pri-
vate financing. Private nonguaranteed debt of low- and middle-
income economies rose from 24 percent of total debt in 2000
to 37 percent in 2007. In Europe and Central Asia private non-
guaranteed debt made up 55 percent of total external debt in
2007. Short-term debt in low- and middle-income economies
rose from 13 percent of total debt in 2000 to 24 percent in
2007. In 2007 in East Asia and Pacific short-term debt made
up 39 percent of total debt and 55 percent in China. But grow-
ing international reserves helped offset the risk of short-term
financing in foreign currencies (figure 1n).
Current account balance of low- and middle-income economies, excluding China and oil exporters (% of GDP)
–3
–2
–1
0
20072006200520042003200220012000
Food and fuel importers
were hurt by rising prices 1p
Source: World Development Indicators data files.
0
100
200
300
400
Dec-07Jan-07Jan-06Jan-05Jan-04Jan-03Jan-02Jan-01Jan-00
Commodity prices (index, 2000 = 100)
Energy
Food
Metals and minerals
Commodity price rises
accelerated in recent years 1o
Source: World Development Indicators data files.

2009 World Development Indicators6
0
40
80
120
160
200720062004200220001998
Household debt as share of disposable personal income (%)
Consumer credit
Total household debt
Home mortgages outstanding
U.S. household debt
rose rapidly after 2000 1r
Source: Board of Governors of the Federal Reserve System data files.
0
20
40
60
80
Jan-09Jun-08Jan-08Jun-07Jan-07
Stock market capitalization ($ trillions)
As housing bubbles burst,
investors lost confidence 1t
Source: World Federation of Exchanges data files.
GDP (% change from previous year)
–15
–10
–5
0
5
10
15
ChinaEuro areaJapanUnited States
2008 Q1 2008 Q22008 Q3 2008 Q4
Output in the largest economies slowed
or declined in the 4th quarter of 2008 1q
Source: U.S. Department of Commerce, Japan Cabinet Office, Eurostat, China National Bureau of Statistics, Haver Analytics, and World Bank staff calculations.
0
100
200
300
400
2008 Q42006 Q12004 Q12002 Q12000 Q1
U.S. house price index (1980 = 100)
U.S. house prices
peaked in 2006 1s
Source: U.S. Office of Federal Housing Enterprise Oversight.
the subprime mortgage crisis became a fully fledged financial
crisis (Lin 2009).
The impacts were felt throughout the increasingly inte-
grated global financial markets, attacking stock markets
globally and reducing credit availability. Global stock markets
lost an estimated $30 trillion in market capitalization in 2008
over their inflated 2007 levels. Rising unemployment and the
wealth effects of falling asset prices contributed to a sharp
decline in consumer spending. Developing countries sud-
denly faced a sharp decline in demand for their exports and a
drop in commodity prices. As recessionary trends developed,
remittances from migrant workers declined, and migrants
began returning home.
Three major factors account for the scale of the crisis.
Underlying the bubbles in global real estate and stock mar-
kets were growing macroeconomic imbalances that fed liquid-
ity into the system, lowering real interest rates and fueling the
asset price bubbles. Financial innovations pioneered by major
global investment banks turned out to be transmission mech-
anisms for instability (Lin 2009). And the failure of national
financial regulators to effectively regulate global financial mar-
kets encouraged investors to take exorbitant risk.
A perfect storm?
The current global financial and economic crisis is unlike any-
thing the world has seen since the Great Depression nearly
eight decades ago. It embraces simultaneous crises in the
housing, equity, and financial markets, triggering what could
become a global recession. Output and trade declined sharp-
ly in the last quarter of 2008 (figure 1q). Projections for 2009
suggest global growth close to zero percent, with strong down-
side risks. Unemployment is rising sharply in both developed
and emerging market economies. The International Labour
Organization estimates job losses of up to 50 million in 2009.
The United States lost as many as 3.6 million jobs in 2008.
The crisis had its superficial roots in the rise in U.S.
household debt (figure 1r), financed largely by home mort-
gages, many of which did not meet prime underwriting guide-
lines. When home prices began to fall from their peak in
2006 (figure 1s), mortgage default rates rose sharply and
triggered a collapse in mortgage-backed securities. Sub-
prime lending came to an abrupt halt, further driving down
the prices of U.S. homes. Investors, their confidence under-
mined, withdrew funds from other illiquid markets (figure 1t),
and investment banks had to liquidate assets or withdraw
financing from customers, forcing further deleveraging. Thus,
2009 World Development Indicators 7
Current account balance, 2005–07 average ($ billions)
–800
–600
–400
–200
0
200
400
UnitedStates
SpainUnitedKingdom
AustraliaItalyRussianFederation
SaudiArabia
JapanGermanyChina
The five largest current
account surpluses and deficits 1w
Source: International Monetary Fund balance of payments data files.
0
10
20
30
200620001995199019851980
Gross savings and investment (% of GDP)
Gross savings (% of GDP)
Gross capital formation (% of GDP)
. . . And the
United States 1v
Source: World Development Indicators data files.
0
40
80
120
160
20072006200520042003200220012000
U.S. international investment position (% of GDP)
Foreign-owned assets in the United States (% of GDP)
U.S.-owned assets abroad (% of GDP)
U.S. foreign assets
and liabilities doubled 1x
Source: Department of Commerce, Bureau of Economic Analysis data files.
30
40
50
60
200720001995199019851980
Gross savings and investment (% of GDP)
Gross savings (% of GDP)
Gross capital formation (% of GDP)
Savings and investment
in China . . . 1u
Source: World Development Indicators data files.
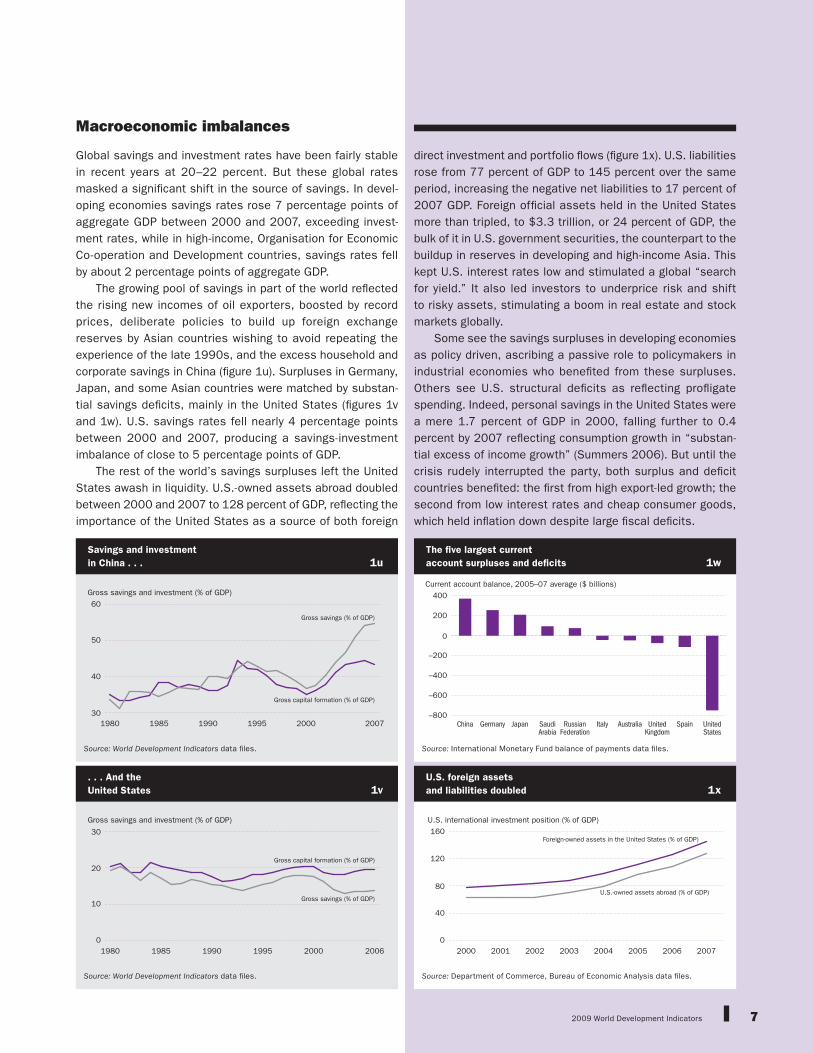
direct investment and portfolio flows (figure 1x). U.S. liabilities rose from 77 percent of GDP to 145 percent over the same period, increasing the negative net liabilities to 17 percent of 2007 GDP. Foreign official assets held in the United States more than tripled, to $3.3 trillion, or 24 percent of GDP, the bulk of it in U.S. government securities, the counterpart to the buildup in reserves in developing and high-income Asia. This kept U.S. interest rates low and stimulated a global “search for yield.” It also led investors to underprice risk and shift to risky assets, stimulating a boom in real estate and stock markets globally.
Some see the savings surpluses in developing economies as policy driven, ascribing a passive role to policymakers in industrial economies who benefited from these surpluses. Others see U.S. structural deficits as reflecting profligate spending. Indeed, personal savings in the United States were a mere 1.7 percent of GDP in 2000, falling further to 0.4 percent by 2007 reflecting consumption growth in “substan-tial excess of income growth” (Summers 2006). But until the crisis rudely interrupted the party, both surplus and deficit countries benefited: the first from high export-led growth; the second from low interest rates and cheap consumer goods, which held inflation down despite large fiscal deficits.
Macroeconomic imbalances
Global savings and investment rates have been fairly stable in recent years at 20–22 percent. But these global rates masked a significant shift in the source of savings. In devel-oping economies savings rates rose 7 percentage points of aggregate GDP between 2000 and 2007, exceeding invest-ment rates, while in high-income, Organisation for Economic Co-operation and Development countries, savings rates fell by about 2 percentage points of aggregate GDP.
The growing pool of savings in part of the world reflected the rising new incomes of oil exporters, boosted by record prices, deliberate policies to build up foreign exchange reserves by Asian countries wishing to avoid repeating the experience of the late 1990s, and the excess household and corporate savings in China (figure 1u). Surpluses in Germany, Japan, and some Asian countries were matched by substan-tial savings deficits, mainly in the United States (figures 1v and 1w). U.S. savings rates fell nearly 4 percentage points between 2000 and 2007, producing a savings-investment imbalance of close to 5 percentage points of GDP.
The rest of the world’s savings surpluses left the United States awash in liquidity. U.S.-owned assets abroad doubled between 2000 and 2007 to 128 percent of GDP, reflecting the importance of the United States as a source of both foreign

2009 World Development Indicators8
Market average daily turnover in over the counter derivatives, 2007 ($ billions)
0
100
200
300
400
500
TurkeySouthAfrica
RussianFeder-ation
CentralEurope
MexicoBrazilLatinAmerica
Korea,Rep.
IndiaChinaEmergingAsia
Total Foreign exchangeInterest rate
Derivatives can undermine capital controls, leading to
linkages that make market dynamics difficult to predict 1bb
Source: Bank for International Settlements 2007.
Share of before-tax profits (%)
0
10
20
30
40
2007200520032001199919971995
U.S. domestic financial sector profits averaged almost
30 percent of before-tax profits during 2000–06 1aa
Source: Department of Commerce, Bureau of Economic Analysis data files.
Gross market values ($ trillions)
Jun-08Jun-07Jun-06Jun-05Jun-04Jun-03Jun-02Jun-01Jun-00
Foreign exchange contracts
Interest rate contracts
Commodity contracts
Unallocateda
Credit default swaps
Equity linked contracts
0
5
10
15
20
25
. . . While the market value
of derivatives rose ninefold 1z
a. Includes over the counter derivatives of nonreporting institutions, based on the latest Triennial Central Bank Survey of Foreign Exchange and Derivatives Market Activity in 2007.Source: Bank for International Settlements data files.
Notional amounts oustanding ($ trillions)
Jun-08Jun-07Jun-06Jun-05Jun-04Jun-03Jun-02Jun-01Jun-00
Foreign exchange contracts
Interest rate contracts
Commodity contracts
Unallocateda
Credit default swaps
Equity linked contracts
0
200
400
600
800
Assets underlying over the counter
derivatives rose sevenfold . . . 1y
a. Includes over the counter derivatives of nonreporting institutions, based on the latest Triennial Central Bank Survey of Foreign Exchange and Derivatives Market Activity in 2007.Source: Bank for International Settlements data files.
Derivatives were pioneered globally by investment banks, stimulated by high fees. Financial sector profits in the U.S. averaged 29 percent of before-tax profits between 2000 and 2006 (figure 1aa). U.S investment banks quickly grew to rival commercial banks but were not subject to the same regulation. “The scale of long-term risky and illiquid assets financed by very short-term liabilities made many of the vehicles and institutions in this parallel financial system vul-nerable to a classic type of run, but without the protections, such as deposit insurance, that the banking system has in place to reduce such risks” (Geithner 2008). Following the collapse of the real estate market and the loss of confidence in mortgage- backed securities, investors began pulling out of these markets, creating liquidity and solvency crises for investment banks.
Underlying these developments lay the failure to prop-erly regulate financial institutions, weaknesses in internal risk management systems, and the failure of credit rating agencies to correctly rate risk. At the end of 2007, there were reportedly 12 triple-A rated companies in the world, but as many as 64,000 structured finance instruments were rated triple-A (Blankfein 2009). Given the size of the market in these new instruments, it is questionable whether any single national authority can regulate cross-border transac-tions (figure 1bb).
The role of financial innovation
What distinguishes this crisis from previous crises is the speed and depth of the transmission channels, as a U.S.-based crisis turned global in a matter of months. This reflects the transformation of the financial system during this boom period by the dramatic growth in the share of assets held outside the traditional banking system. The mortgage market, for example, was transformed by an “originate and distribute” model. Mortgage loans, made by loan originators, were re-sold to financial institutions, which “sliced and diced” pools of mortgages and aggregated them into collateralized debt obligations resold in turn to investors all over the world.
Derivatives, or financial instruments whose value is derived from the value of an underlying asset (commodities, equities, stocks, mortgages, real estate, loans, bonds) or an index (of interest rates, stock prices, or consumer prices), enable those who trade in them to mitigate risk through hedging or to speculate. Derivatives can be bought and sold through over the counter trades between two parties, or they can be exchange traded. Over the counter derivatives had a notional value of some $684 trillion in June 2008 (figure 1y), representing the value of the underlying assets against which the derivatives were issued. But the risk is better measured by the cost of replacing all such contracts at the prevailing market price: their gross global market value rose from $2.5 trillion in June 2000 to a still astronomical $20.4 trillion in June 2008 (figure 1z).


2009 World Development Indicators 11
Protecting the vulnerable
Poor people in developing economies are highly exposed to the global crisis. World Bank estimates for 2009 suggest that lower growth rates will trap 46 million more people be-low the $1.25 a day poverty line than expected before the crisis. An extra 53 million people will be living on less than $2 a day, and child mortality rates could soar. It is esti-mated that 200,000–400,000 more children a year, a total of 1.4–2.8 million from 2009 to 2015, may die if the crisis persists.
Poor consumers are the first to be hurt by lower demand for labor and falling remittances. In addition, shrinking fis-cal revenues and potential decreases in official aid flows threaten to reduce access to social safety nets and to such social services as health care and education. Households may have to sell productive assets, pull children out of school, and reduce calorie intake, which can lead to acute malnutrition. The long-term consequences can be severe and in some cases irreversible, especially for women and children.
Almost 40 percent of low- and middle-income economies are highly exposed to the poverty effects of the crisis. Yet three-quarters of them cannot raise funds domestically or internationally to finance programs to curb the effects of the downturn.
Coping with the crisis
In November 2008 China introduced a $585 billion eco-nomic stimulus package to counter the global crisis. Other middle-income economies also have stimulus plans. Fiscal re-sponses to the crisis must address short-term risks to macro-economic stability and long-term fiscal sustainability—while protecting the vulnerable segments of society and the longer term investments that sustain economic growth and human development. About 40 percent of low- and middle-income economies have good fiscal and current account positions, including many larger economies, and may be able to expand fiscal policy without jeopardizing solvency (table 1jj).
In addition to strong fiscal and external positions, a suc-cessful fiscal stimulus requires administrative capability to design and implement new programs, or expand existing ones (box 1kk). Getting the timing and size right for a discretionary fiscal stimulus is not easy. Packages often cannot be delivered quickly enough, and expenditures may go to wasteful projects, especially when subject to political pressure. Where administra-tive capacity is weak, easier to implement options are boosting existing safety net programs, supplementing or replacing falter-ing foreign financing of infrastructure projects already under way with domestic financing, creating jobs through public works proj-ects, increasing fiscal transfers to subnational governments, and facilitating central bank support of trade financing.
Low-income economies can allow fiscal deficits to temporarily increase if they can access financing, but this generally has not been the case in past downturns. Median public debt among low-income economies was 41 percent of GDP in 2007. A quarter of developing economies had public debt of less than 21 percent. Among larger Sub-Saharan African economies median debt was 28 percent.
The ability to borrow depends on the size of the fiscal deficit, the level of government debt, the country’s growth prospects, the gov-ernment’s reputation for fiscal management, the structure of debt (maturity, currency), and recent debt history.
Financing a larger fiscal deficit is generally easier if the country’s starting external balance and reserve position are strong. A fiscal stimulus package tends to increase the external deficit by bolster-ing domestic demand. For commodity-exporting countries current account and fiscal deficits tend to rise when commodity prices fall, as at present. Thus a large imbalance or a low level of reserves will tend to limit the size of the fiscal stimulus that is possible.
Finding fiscal space in
low-income economies 1kk
Establish a vulnerability fund. The World Bank has proposed a vulnera-bility fund financed by high-income economies to assist countries that cannot afford to protect the vulnerable. The fund’s priorities would be to invest in safety net programs and infrastructure and to finance small and medium-size enterprises and microfinance institutions.
Substantially increase lending by the International Bank for Recon-struction and Development (IBRD). IBRD could make new commit-ments of up to $100 billion over the next three years.
Fast track funds from the International Development Association (IDA). A facility is now in place to speed $2 billion to help the poorest countries deal with the effects of the crisis.
Respond to the food crisis. Nearly $900 million is approved or in the pipeline to help developing countries cope with the impact of high food prices through a $1.2 billion food facility.
Ensure trade flows. The International Finance Corporation (IFC), a member of the World Bank Group that focuses on the private sector, plans to double its existing Global Trade Finance Program to $3 bil-lion over three years and to mobilize funds from other sources.
Bolster distressed banking systems. IFC is putting in place a global equity fund to recapitalize distressed banks. IFC expects to invest $1 billion over three years, and Japan plans to invest $2 billion.
Keep infrastructure projects on track. IFC expects to invest at least $300 million over three years and mobilize $1.5 billion to provide rollover financing and recapitalize viable infrastructure projects in distress.
Support microfinance. IFC and Germany have launched a $500 mil-lion facility to support microfinance institutions facing difficulties as a result of the crisis.
Shift advisory support to help companies weather the crisis. IFC is refo-cusing advisory services to help clients cope with the crisis. It esti-mates a financing need of at least $40 million over three years.
Recent World Bank
Group initiatives 1ll
Fiscal position (% of GDP; median)
Country groupPublic debt
2007
Maximum debt
2002–07
Fiscal balance 2007a
Low-income economiesb 40.5 87.9 –2.4Large economies 36.7 87.9 –1.9
East Asia and Pacific 40.6 70.1 –2.5Europe and Central Asia 31.7 77.5 –2.6Latin America and Caribbean 37.6 55.0 –0.4Middle East and North Africa 41.2 57.8 –4.8South Asia 57.1 66.4 –3.4Sub-Saharan Africa 28.0 93.9 –1.7
Small economies 61.0 87.1 –3.6Middle-income economies 34.1 51.1 –0.6
a. After official grants. b. IDA-eligible economies. Source: IMF 2008b; World Development Indicators data files.
Fiscal positions have generally improved but
remain weak for some developing economies 1jj
2009 World Development Indicators12
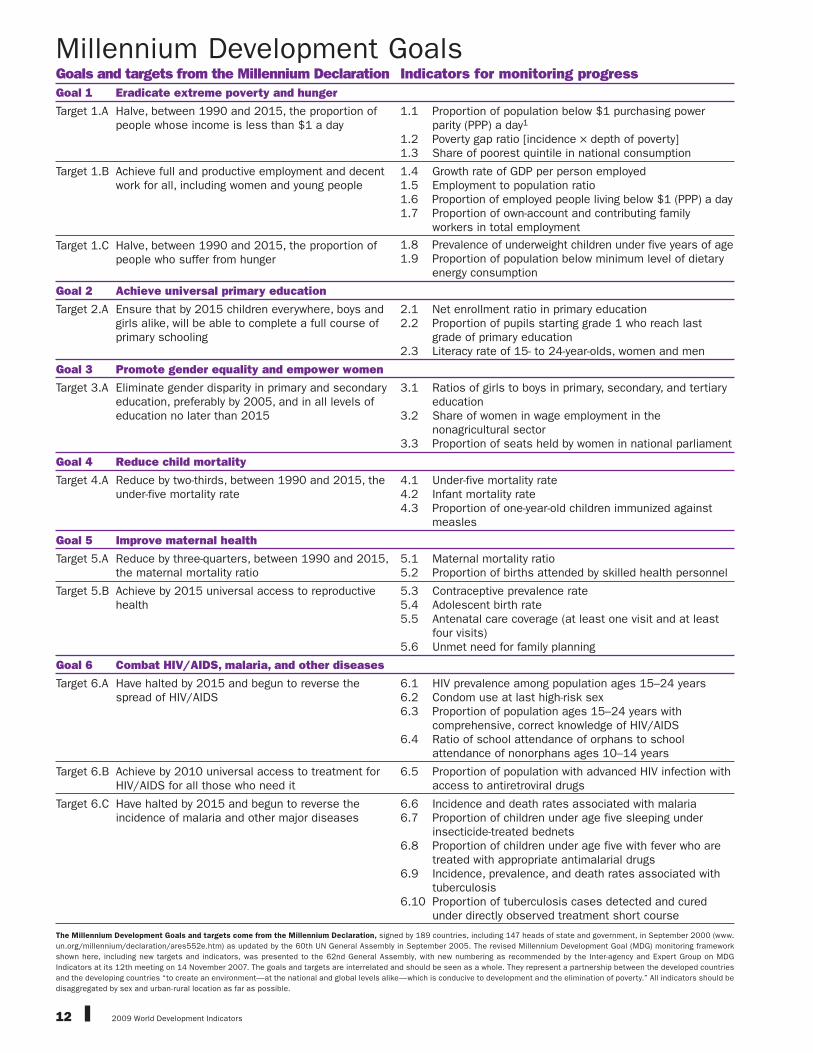
Millennium Development GoalsGoals and targets from the Millennium Declaration Indicators for monitoring progressGoal 1 Eradicate extreme poverty and hunger
Target 1.A Halve, between 1990 and 2015, the proportion of people whose income is less than $1 a day
1.1 Proportion of population below $1 purchasing power parity (PPP) a day1
1.2 Poverty gap ratio [incidence × depth of poverty]1.3 Share of poorest quintile in national consumption
Target 1.B Achieve full and productive employment and decent work for all, including women and young people
1.4 Growth rate of GDP per person employed1.5 Employment to population ratio1.6 Proportion of employed people living below $1 (PPP) a day1.7 Proportion of own-account and contributing family
workers in total employment
Target 1.C Halve, between 1990 and 2015, the proportion of people who suffer from hunger
1.8 Prevalence of underweight children under five years of age1.9 Proportion of population below minimum level of dietary
energy consumption
Goal 2 Achieve universal primary education
Target 2.A Ensure that by 2015 children everywhere, boys and girls alike, will be able to complete a full course of primary schooling
2.1 Net enrollment ratio in primary education2.2 Proportion of pupils starting grade 1 who reach last
grade of primary education2.3 Literacy rate of 15- to 24-year-olds, women and men
Goal 3 Promote gender equality and empower women
Target 3.A Eliminate gender disparity in primary and secondary education, preferably by 2005, and in all levels of education no later than 2015
3.1 Ratios of girls to boys in primary, secondary, and tertiary education
3.2 Share of women in wage employment in the nonagricultural sector
3.3 Proportion of seats held by women in national parliament
Goal 4 Reduce child mortality
Target 4.A Reduce by two-thirds, between 1990 and 2015, the under-five mortality rate
4.1 Under-five mortality rate4.2 Infant mortality rate4.3 Proportion of one-year-old children immunized against
measles
Goal 5 Improve maternal health
Target 5.A Reduce by three-quarters, between 1990 and 2015, the maternal mortality ratio
5.1 Maternal mortality ratio5.2 Proportion of births attended by skilled health personnel
Target 5.B Achieve by 2015 universal access to reproductive health
5.3 Contraceptive prevalence rate5.4 Adolescent birth rate5.5 Antenatal care coverage (at least one visit and at least
four visits)5.6 Unmet need for family planning
Goal 6 Combat HIV/AIDS, malaria, and other diseases
Target 6.A Have halted by 2015 and begun to reverse the spread of HIV/AIDS
6.1 HIV prevalence among population ages 15–24 years6.2 Condom use at last high-risk sex6.3 Proportion of population ages 15–24 years with
comprehensive, correct knowledge of HIV/AIDS6.4 Ratio of school attendance of orphans to school
attendance of nonorphans ages 10–14 years
Target 6.B Achieve by 2010 universal access to treatment for HIV/AIDS for all those who need it
6.5 Proportion of population with advanced HIV infection with access to antiretroviral drugs
Target 6.C Have halted by 2015 and begun to reverse the incidence of malaria and other major diseases
6.6 Incidence and death rates associated with malaria6.7 Proportion of children under age five sleeping under
insecticide-treated bednets 6.8 Proportion of children under age five with fever who are
treated with appropriate antimalarial drugs6.9 Incidence, prevalence, and death rates associated with
tuberculosis6.10 Proportion of tuberculosis cases detected and cured
under directly observed treatment short course
The Millennium Development Goals and targets come from the Millennium Declaration, signed by 189 countries, including 147 heads of state and government, in September 2000 (www.un.org/millennium/declaration/ares552e.htm) as updated by the 60th UN General Assembly in September 2005. The revised Millennium Development Goal (MDG) monitoring framework shown here, including new targets and indicators, was presented to the 62nd General Assembly, with new numbering as recommended by the Inter-agency and Expert Group on MDG Indicators at its 12th meeting on 14 November 2007. The goals and targets are interrelated and should be seen as a whole. They represent a partnership between the developed countries and the developing countries “to create an environment—at the national and global levels alike—which is conducive to development and the elimination of poverty.” All indicators should be disaggregated by sex and urban-rural location as far as possible.

2009 World Development Indicators 13
Goals and targets from the Millennium Declaration Indicators for monitoring progressGoal 7 Ensure environmental sustainability
Target 7.A Integrate the principles of sustainable development into country policies and programs and reverse the loss of environmental resources
7.1 Proportion of land area covered by forest7.2 Carbon dioxide emissions, total, per capita and
per $1 GDP (PPP)7.3 Consumption of ozone-depleting substances7.4 Proportion of fish stocks within safe biological limits7.5 Proportion of total water resources used7.6 Proportion of terrestrial and marine areas protected7.7 Proportion of species threatened with extinction
Target 7.B Reduce biodiversity loss, achieving, by 2010, a significant reduction in the rate of loss
Target 7.C Halve by 2015 the proportion of people without sustainable access to safe drinking water and basic sanitation
7.8 Proportion of population using an improved drinking water source
7.9 Proportion of population using an improved sanitation facility
Target 7.D Achieve by 2020 a significant improvement in the lives of at least 100 million slum dwellers
7.10 Proportion of urban population living in slums2
Goal 8 Develop a global partnership for development
Target 8.A Develop further an open, rule-based, predictable, nondiscriminatory trading and financial system (Includes a commitment to good governance, development, and poverty reduction—both nationally and internationally.)
Some of the indicators listed below are monitored separately for the least developed countries (LDCs), Africa, landlocked developing countries, and small island developing states.
Official development assistance (ODA)8.1 Net ODA, total and to the least developed countries, as
percentage of OECD/DAC donors’ gross national income8.2 Proportion of total bilateral, sector-allocable ODA of
OECD/DAC donors to basic social services (basic education, primary health care, nutrition, safe water, and sanitation)
8.3 Proportion of bilateral official development assistance of OECD/DAC donors that is untied
8.4 ODA received in landlocked developing countries as a proportion of their gross national incomes
8.5 ODA received in small island developing states as a proportion of their gross national incomes
Market access8.6 Proportion of total developed country imports (by value
and excluding arms) from developing countries and least developed countries, admitted free of duty
8.7 Average tariffs imposed by developed countries on agricultural products and textiles and clothing from developing countries
8.8 Agricultural support estimate for OECD countries as a percentage of their GDP
8.9 Proportion of ODA provided to help build trade capacity
Debt sustainability8.10 Total number of countries that have reached their HIPC
decision points and number that have reached their HIPC completion points (cumulative)
8.11 Debt relief committed under HIPC Initiative and Multilateral Debt Relief Initiative (MDRI)
8.12 Debt service as a percentage of exports of goods and services
Target 8.B Address the special needs of the least developed countries (Includes tariff and quota-free access for the least developed countries’ exports; enhanced program of debt relief for heavily indebted poor countries (HIPC) and cancellation of official bilateral debt; and more generous ODA for countries committed to poverty reduction.)
Target 8.C Address the special needs of landlocked developing countries and small island developing states (through the Programme of Action for the Sustainable Development of Small Island Developing States and the outcome of the 22nd special session of the General Assembly)
Target 8.D Deal comprehensively with the debt problems of developing countries through national and international measures in order to make debt sustainable in the long term
Target 8.E In cooperation with pharmaceutical companies, provide access to affordable essential drugs in developing countries
8.13 Proportion of population with access to affordable essential drugs on a sustainable basis
Target 8.F In cooperation with the private sector, make available the benefits of new technologies, especially information and communications
8.14 Telephone lines per 100 population8.15 Cellular subscribers per 100 population8.16 Internet users per 100 population
1. Where available, indicators based on national poverty lines should be used for monitoring country poverty trends.
2. The proportion of people living in slums is measured by a proxy, represented by the urban population living in households with at least one of these characteristics: lack of access to improved water supply, lack of access to improved sanitation, overcrowding (3 or more persons per room), and dwellings made of nondurable material.


![[XLS]siteresources.worldbank.orgsiteresources.worldbank.org/INTPROCUREMENT/Resources/... · Web viewSIGNAL SPORTS PROCUREMENT OF LCD PROJECTOR AND SLIDE PROJECTORS (SCHEDULE MICRO](https://static.documents.pub/doc/80x56/5ac377997f8b9aae1b8c68e9/xls-viewsignal-sports-procurement-of-lcd-projector-and-slide-projectors-schedule.jpg)