63
Ecosystem Considerations in Fisheries Management Linking Ecosystem-Based Management Goals with Ecosystem Research
| Date post: | 21-Jan-2016 |
| Category: |
Documents |
| Upload: | jasper-henry |
| View: | 221 times |
| Download: | 1 times |

Ecosystem Considerations in Fisheries Management
Linking Ecosystem-Based Management Goals with
Ecosystem Research

New Since September– Updated 27 contributions– Noted last update on all contributions– Website:
• Will be updated• Will be on internet by the end of Nov.• Full report and • Individual contributions• Data
http://access.afsc.noaa.gov/REFM/REEM/index.cfm

Organization
• Ecosystem Assessment
• Ecosystem Status Indicators
• Ecosystem-Based Mngt Indices
http://access.afsc.noaa.gov/REFM/REEM/index.cfm

198
41
987
199
01
993
199
61
999
200
12
003
200
5-2
-1
0
1
Mea
n R
esid
ual
Depth <50
OCEAN - GOA Bottom Temperatures (Martin)
-1
-0.5
0
0.5
1Depth 51-100
-1
-0.5
0
0.5
1Depth 101-150
-1
-0.5
0
0.5
1Depth 151-200
-1
-0.5
0
0.5
1Depth 201-300
-1
-0.5
0
0.5
1Depth 301-400
-1
-0.5
0
0.5
1Depth 401-500
-1
-0.5
0
0.5
1Depth 501-700
-1
-0.5
0
0.5
1Depth 701-1000

0
1
2
3
4
5
6
1980 1982 1984 1986 1988 1990 1992 1994 1996 1998 2000 2002 2004 2006
Year
Mea
n B
ott
om
Tem
per
atu
re (
°OCEAN -Bering Sea Temperature (Lauth)

HABITAT- Effects of fishing on seafloor habitat (Heifetz et al.)
Project Title
Project Description
Location Species Investigated
Habitat Investigated
Application to Mngt
Field/Lab Study
Contact
Submer-sible
eval. of E. GOA corals
Determine distribution of Primnoa coral at pending and potential HAPC sites and study coral habitat ecology.
Eastern Gulf of Alaska
Corals, sponges, associated FMP species
Hard-bottom coral
HAPC delineation, defining EFH, evaluation of gear impacts
Field Bob Stone (ABL)

GOAWestern Central Eastern
EBS
CP
UE
(k
g/k
m2 ) 0
400
800
1984
1989
1994
1999
2004
0
400
800
1984
1989
1994
1999
2004
0
400
800
1984
1989
1994
1999
2004
0
10
20
30
1982
1984
1986
1988
1990
1992
1994
1996
1998
2000
2002
2004
2006
FORAGE- Eulachon (Martin, Lauth)

0
200
400
600
800
1,000
1,200
1,400
1,600
1,800
1980
1982
1984
1986
1988
1990
1992
1994
1996
1998
2000
2002
2004
Nr.
of
fish
(m
illio
ns)
Total abundance
Age-3 recruitment
HERRING- PWS (Moffitt)

GROUNDFISH-EBS Winter spawning flatfish (Ingraham and Wilderbuer )

Kiliuda and Ugak Bays
0.0
0.2
0.4
0.6
0.8
1.0
1.2
1987 1989 1991 1993 1995 1997 1999 2001 2003 2005
Year
StarfishTanner crabgadidsother flatsflatheadarrowtoothother
Barnabas Gully
0.0
0.2
0.4
0.6
0.8
1.0
1.2
1.4
1.6
1987 1989 1991 1993 1995 1997 1999 2001 2003 2005
Year
StarfishTanner crabgadidsother flatsflatheadarrowtoothother
BENTHIC- ADFG GOA
Large-mesh survey (Urban)

E. Bering Sea Crab
0
200
400
600
800
1000
12001
98
0
19
82
19
84
19
86
19
88
19
90
19
92
19
94
19
96
19
98
20
00
20
02
20
04
Year
To
tal m
atu
re b
iom
ass
(1
,00
0 to
ns)
Snow crab C. opilioTanner crab C. bairdiBristol Bay Red King CrabPribilof Is. Red King Crab
Pribilof Is. Blue King CrabSt. Matthew Blue King Crab
BENTHIC- EBS Crabs (Otto)

GOAWestern Central Eastern
EBS
CP
UE
(k
g/k
m2 )
MISCELLANEOUS Jellyfish (Martin, Lauth)
0
100
200
300
400
500
1984
1989
1994
1999
2004
0
100
200
300
400
500
1984
1989
1994
1999
2004
0
100
200
300
400
500
1984
1989
1994
1999
2004
0
100,000
200,000
300,000
400,000
1982
1984
1986
1988
1990
1992
1994
1996
1998
2000
2002
2004
2006
Bio
mas
s (t
)

Biomass (1,000's of metric tons)
0 50 100 150 200 250
1000-1200
800-1000
600-800
400-600
200-400
GiantPacificPopeye
2004 Bering Sea Trawl Survey
0 50 100 150 200 250
700-1000
500-700
300-500
200-300
100-200
Dep
th s
trat
um (
m)
2005 Gulf of Alaska Trawl SurveyHighest catch weight for GOA non-target species
Potentially sensitive life history (live 50-75 yrs)
Small exploratory giant grenadier fishery effort in 2005
Potential fishery value for less common, deeper sp.
Important component of deep sea ecosystem (?)
MISCELLANEOUS -Grenadiers (Clausen and Gaichas)

Per
cen
t
Pre-anal Fin Length (cm)
0
5
10
15
10 20 30 40 50
1997
mean=31.7
0
5
10
15
10 20 30 40 50
1999
mean=31.0
0
5
10
15
10 20 30 40 50
2001
mean=33.1
0
5
10
15
10 20 30 40 50
2003
mean=32.4
0
5
10
15
10 20 30 40 50
2005
mean=30.6
EBS Grenadier population size composition (longline surveys)

Ecosystem Mngt Info. –Area closures (Coon)

0
50000
100000
150000
200000
250000
300000
1990 1992 1994 1996 1998 2000 2002 2004
Ob
serv
ed H
oo
k an
d L
ine
du
rati
on
(h
ou
rs)
AIGOABS
Ecosystem Mngt Info. –Hook and Line effort (Coon)

0
500
1000
1500
2000
2500
3000
3500
1990 1992 1994 1996 1998 2000 2002 2004Ob
serv
ed B
ott
om
Tra
wl d
ura
tio
n (
24 h
ou
r d
ays)
GOAAI
BS
Ecosystem Mngt Info. –Bottom trawl effort (Coon)

Ecosystem Mngt Info. –Bottom trawl effort (Coon)

Ecosystem Mngt Info. –Bottom trawl effort anomalies (Coon)

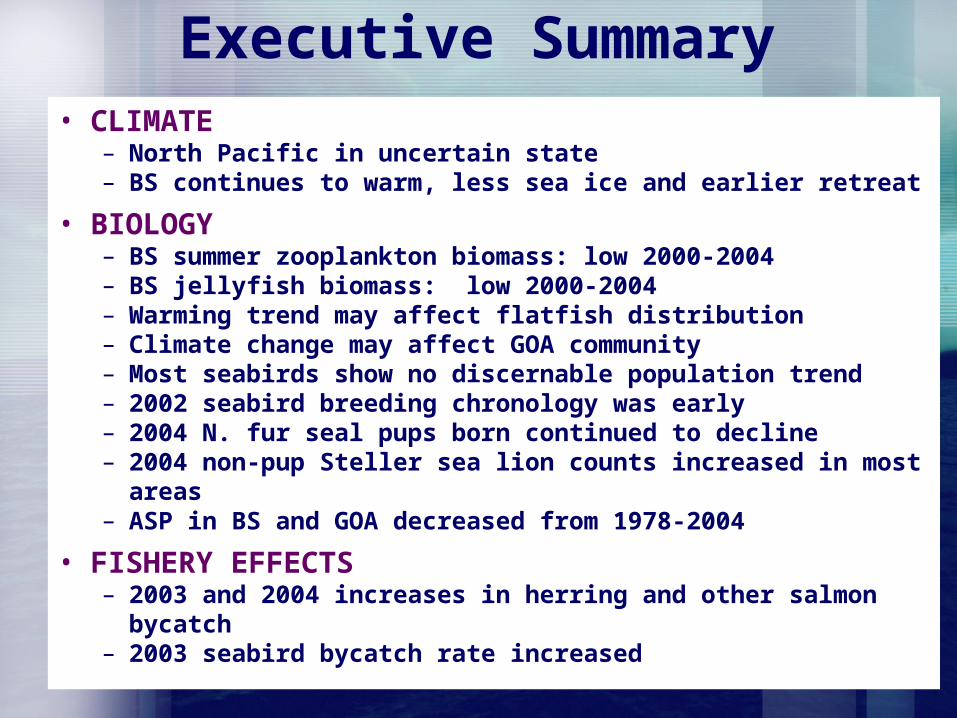
Executive Summary• CLIMATE
– North Pacific in uncertain state – BS continues to warm, less sea ice and earlier retreat– GOA bottom temps in shallow areas continue to increase
• BIOLOGY– BS summer zooplankton biomass: low 2000-2004– BS jellyfish biomass: low 2000-2004– Warming trend may affect flatfish distribution– Climate change may affect GOA community– Most seabirds show no discernable population trend– 2002 seabird breeding chronology was early– 2004 N. fur seal pups born continued to decline– 2004 non-pup Steller sea lion counts increased in most areas– ASP in BS and GOA decreased from 1978-2004
• FISHERY EFFECTS– 2003 and 2004 increases in herring and other salmon bycatch– 2003 seabird bycatch rate increased
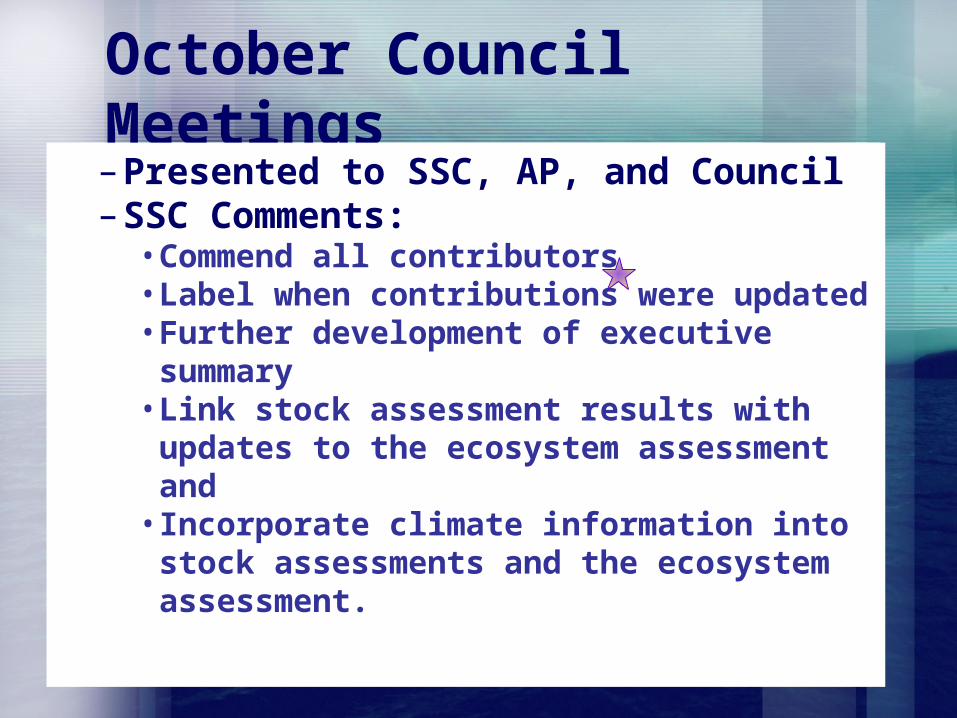
October Council Meetings– Presented to SSC, AP, and Council– SSC Comments:
• Commend all contributors• Label when contributions were updated• Further development of executive summary• Link stock assessment results with updates
to the ecosystem assessment and • Incorporate climate information into stock
assessments and the ecosystem assessment.

Next Year– One full update; one partial update– Update website
http://access.afsc.noaa.gov/REFM/REEM/index.cfm

Slides from Sept 2005 presentations

http://intra.afsc.noaa.gov/reem/index.cfm
Website: Geoff Lang


Website Updates• Data and contributions last updated in
spring• Next update: late fall, after final draft• Internet in fall
http://intra.afsc.noaa.gov/reem/index.cfm

Organization
• Ecosystem Assessment
• Ecosystem Status Indicators
• Ecosystem-Based Mngt Indices
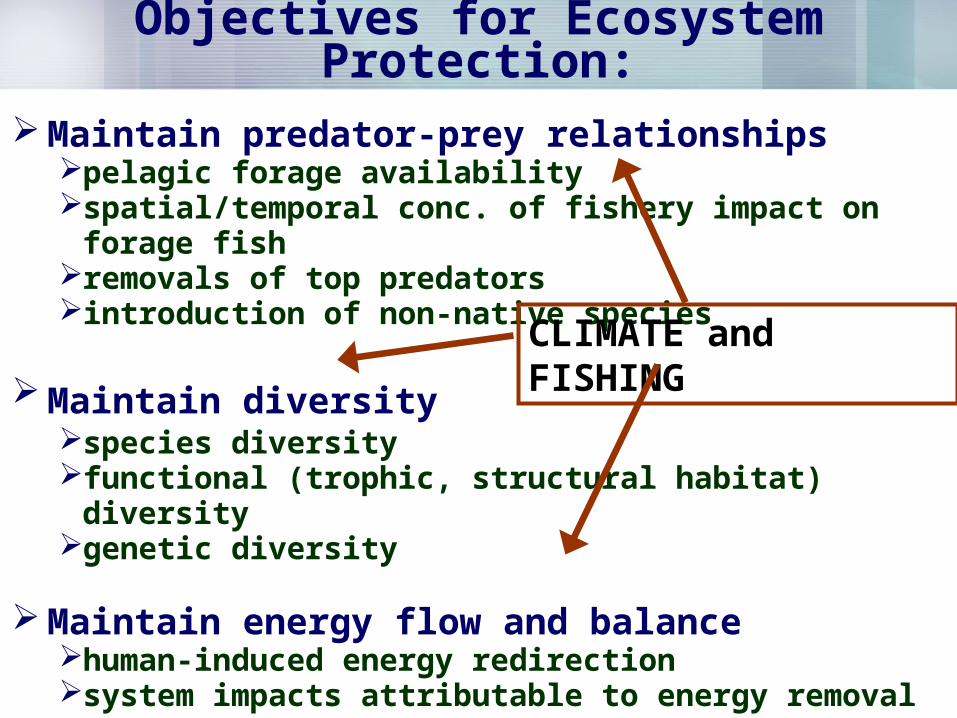
Objectives for Ecosystem Protection:
Maintain predator-prey relationships pelagic forage availabilityspatial/temporal conc. of fishery impact on forage fishremovals of top predatorsintroduction of non-native species
Maintain diversity species diversityfunctional (trophic, structural habitat) diversitygenetic diversity
Maintain energy flow and balancehuman-induced energy redirectionsystem impacts attributable to energy removal
CLIMATE and FISHING

CLIMATE (Rodionov et al.) 1977
1946
a) PDO, winter (DJF)
-3
-2
-1
0
1
2
3
1900 1910 1920 1930 1940 1950 1960 1970 1980 1990 2000
-2
-1
0
1
2
3
-3
-2
-1
0
1
2
1989
1994
c) AO, winter (DJF)
b) PDO, winter (DJF)1958
1962
1977
1989
2003
1972
1950 1960 1970 1980 1990 2000
-4
-2
0
2
4
-2
-1
0
1
2
3
1998
1960
1977
2000f) ECNP (Jan-Feb)
e) Vic z500, winter (Nov-Mar)
2003
1968

1972-76
1977-81
SLP SST
SLP SST
SLP (Rodionov et al.)
1989-97
1998-04
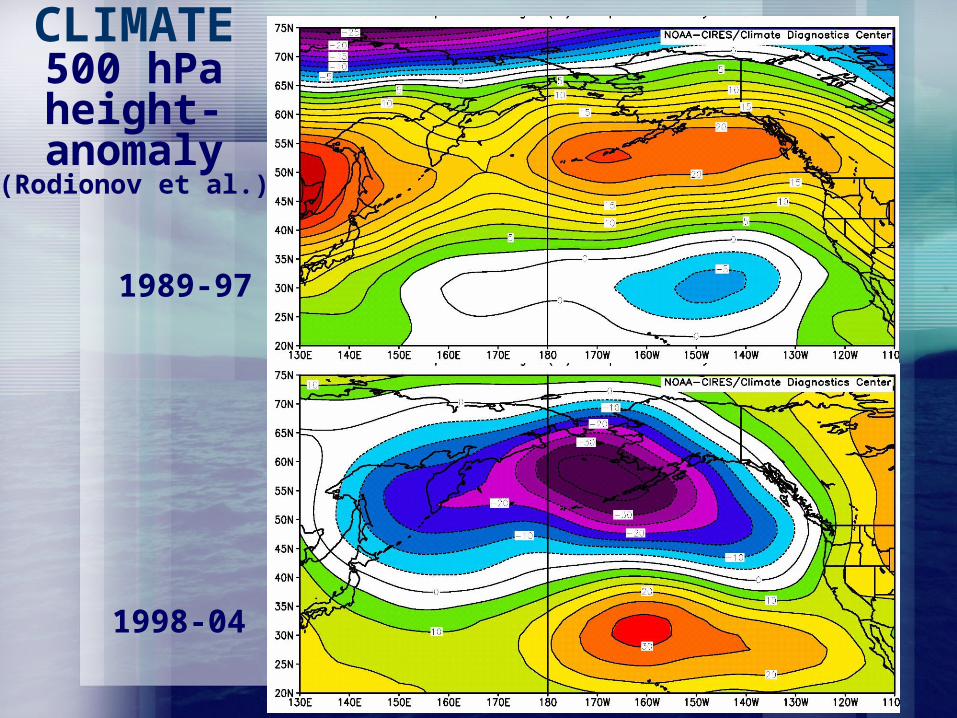
CLIMATE 500 hPa height-
anomaly (Rodionov et al.)

OCEAN –North Pacific (Rodionov et al.)

OCEAN –North Pacific (Rodionov et al.)

OCEAN -Bering Sea Temperature (Rodionov et al.)
1980 1985 1990 1995 2000 2005
-3
-2
-1
0
1
2
Sta
nd
ard
de
via
tion
M ean M ay SST
Sum m er bottom tem perature

1980 1990 2000
1-D ec
1-Jan
1-Feb
1-M ar
1-Apr
1-M ay
1-Jun
1-D ec
1-Jan
1-Feb
1-M ar
1-Apr
1-M ay
1-JunThe first and the last days o f the ice season, 1973-2005
OCEAN -Bering Sea Ice (Rodionov et al.)
1955 1960 1965 1970 1975 1980 1985 1990 1995 2000 2005
-2
-1
0
1
2
Std
0
20
40
60
80
Days aft er M
arc h 15
a) Ice cover index
b) Ice retreat index

2000 2001 2002 2003
Temp
Salinity
2004
Sigma-t
OCEAN -Bering Sea (Eisner et al.)

5 m Total Chl a
(µg L-1)
5 m Chl a >10 µm
(µg L-1)
5 m Nitrate (µM)
2004 2003 OCEAN -Bering Sea (Eisner et al.)

BIOLOGY -Bering Sea (Napp and Shiga)

0
50,000
100,000
150,000
200,000
250,000
300,000
350,000
400,000
1980
1982
1984
1986
1988
1990
1992
1994
1996
1998
2000
2002
2004
Bio
mas
s (t
)
BIOLOGY -Bering Sea Jellyfish (Walters)
1985 1990 1995 2000-2
-1
0
1
2
3
4Arrowtooth flounder
1985 1990 1995 2000-2
-1
0
1
2
3
4Pacific halibut
1985 1990 1995 2000-2
-1
0
1
2
3
4Southern rocksole
1985 1990 1995 2000
-2
-1
0
1
2
3
4Northern rocksole
1985 1990 1995 2000-2
-1
0
1
2
3
4Northern lampfish
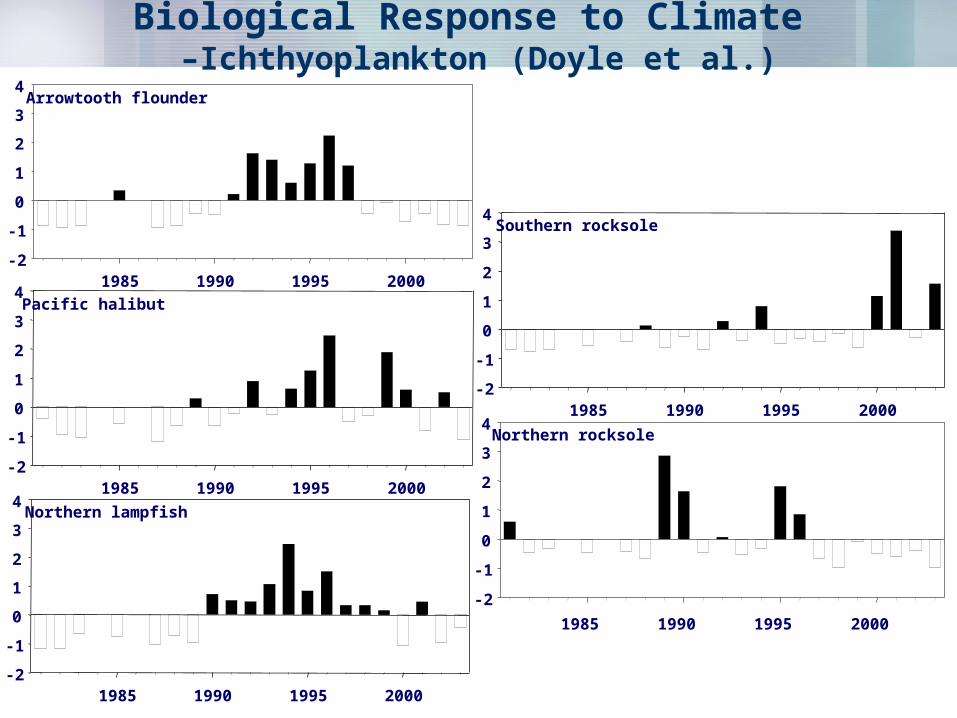
Biological Response to Climate –Ichthyoplankton (Doyle et al.)
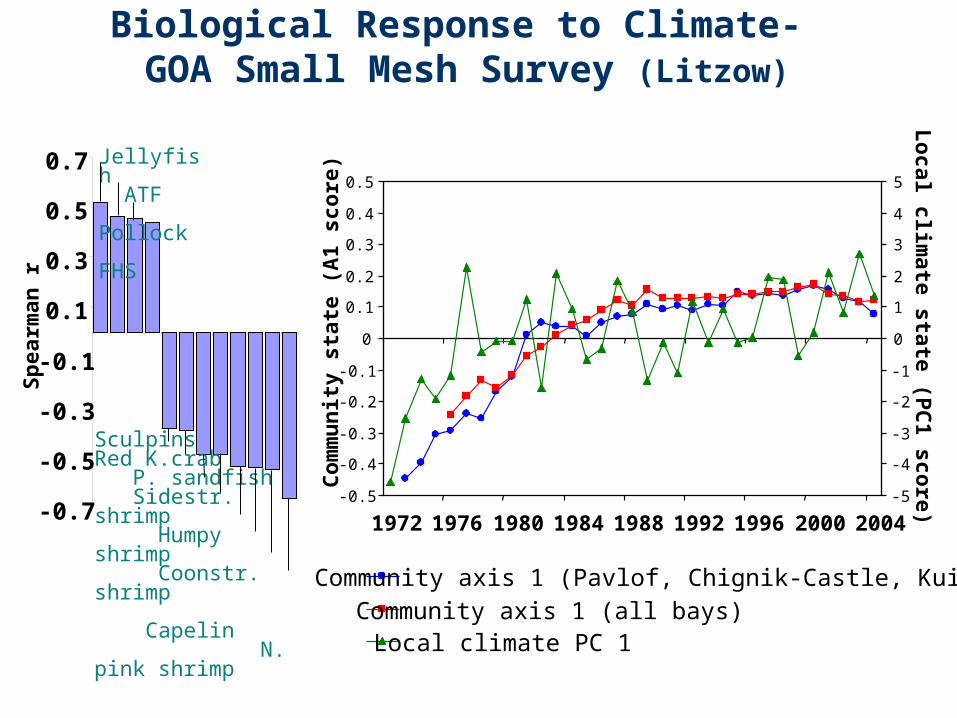
-0.7
-0.5
-0.3
-0.1
0.1
0.3
0.5
0.7 Jellyfish ATF Pollock FHS
SculpinsRed K.crab P. sandfish Sidestr. shrimp Humpy shrimp Coonstr. shrimp Capelin N. pink shrimp
Sp
earm
an r
-0.5
-0.4
-0.3
-0.2
-0.1
0
0.1
0.2
0.3
0.4
0.5
1972 1976 1980 1984 1988 1992 1996 2000 2004
Co
mm
un
ity
stat
e (A
1 sc
ore
)
-5
-4
-3
-2
-1
0
1
2
3
4
5
Lo
cal climate state (P
C1 sco
re)
Community axis 1 (Pavlof, Chignik-Castle, Kuiukta)Community axis 1 (all bays)Local climate PC 1
Biological Response to Climate- GOA Small Mesh Survey (Litzow)
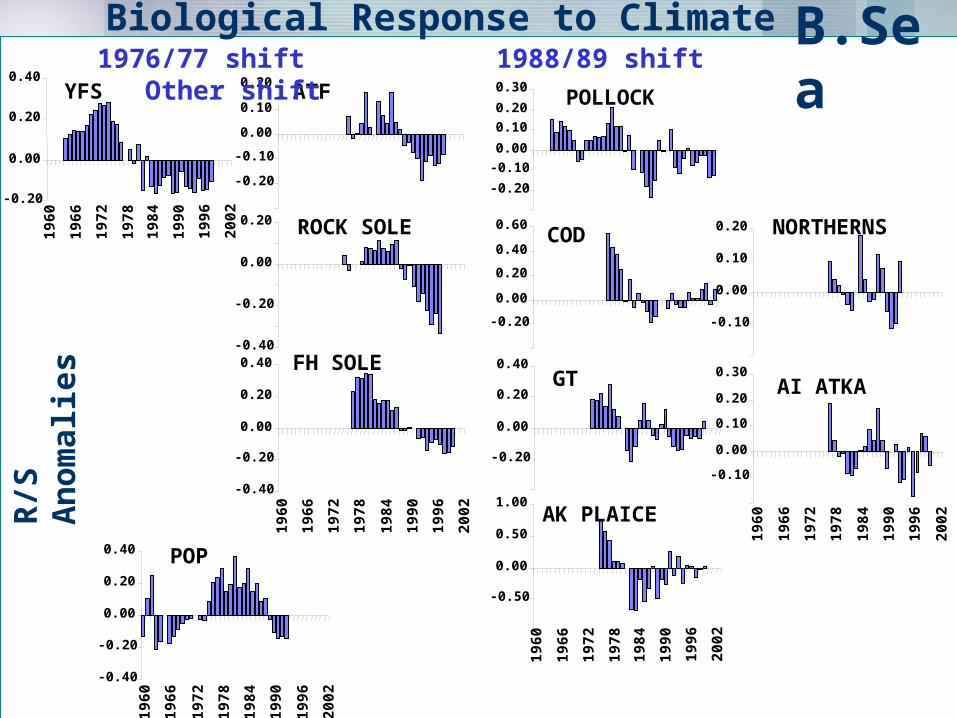
POLLOCK
-0.20
-0.10
0.00
0.10
0.20
0.30
COD
-0.20
0.00
0.20
0.40
0.60
GT
-0.20
0.00
0.20
0.40
ATF
-0.20
-0.10
0.00
0.10
0.20
ROCK SOLE
-0.40
-0.20
0.00
0.20 NORTHERNS
-0.10
0.00
0.10
0.20
YFS
-0.20
0.00
0.20
0.40
1960
1966
1972
1978
1984
1990
1996
2002
FH SOLE
-0.40
-0.20
0.00
0.20
0.40
1960
1966
1972
1978
1984
1990
1996
2002
POP
-0.40
-0.20
0.00
0.20
0.40
1960
1966
1972
1978
1984
1990
1996
2002
AI ATKA
-0.10
0.00
0.10
0.20
0.30
1960
1966
1972
1978
1984
1990
1996
2002
1976/77 shift 1988/89 shift Other shift
AK PLAICE
-0.50
0.00
0.50
1.00
1960
1966
1972
1978
1984
1990
1996
2002
R/S
A
nom
alies
B.Sea
Biological Response to Climate

Biological Response to Climate Flatfish Distribution-(Spencer)
-0.5
0.0
0.5
1.0
19
70
19
72
19
74
19
76
19
78
19
80
19
82
19
84
19
86
19
88
19
90
19
92
19
94
19
96
19
98
20
00
20
02 -1
.0-0
.50
.00
.51
.0
19
70
19
72
19
74
19
76
19
78
19
80
19
82
19
84
19
86
19
88
19
90
19
92
19
94
19
96
19
98
20
00
20
02
-0.5
0.0
0.5
19
70
19
72
19
74
19
76
19
78
19
80
19
82
19
84
19
86
19
88
19
90
19
92
19
94
19
96
19
98
20
00
20
02
-1.0
-0.5
0.0
0.5
1.0
19
70
19
72
19
74
19
76
19
78
19
80
19
82
19
84
19
86
19
88
19
90
19
92
19
94
19
96
19
98
20
00
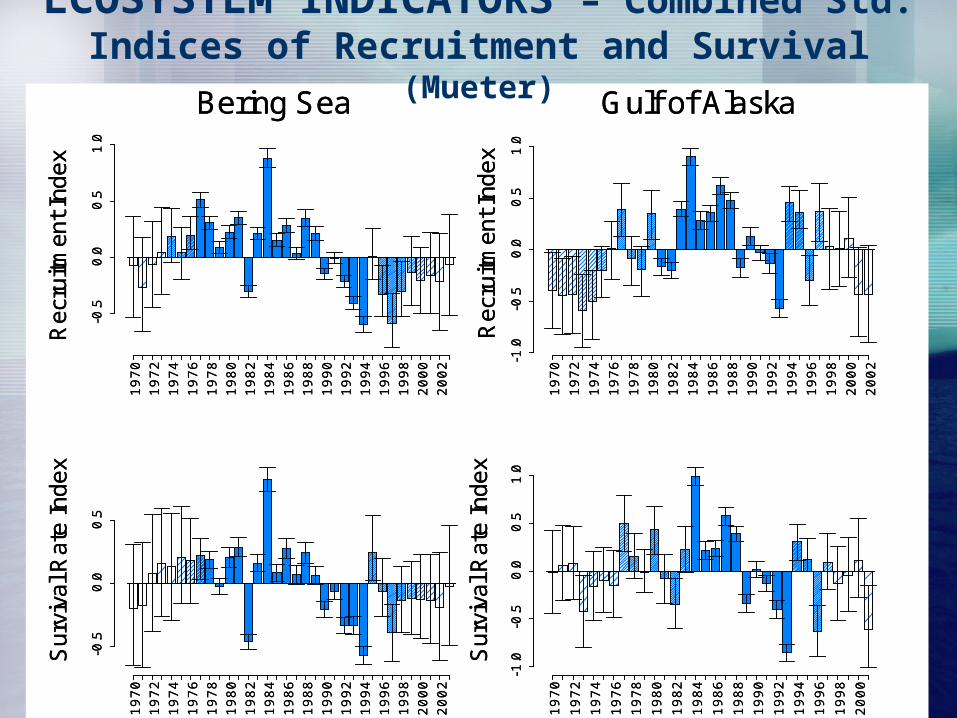
Bering Sea Gulf of Alaska
Su
rviv
al R
ate
Ind
ex
Re
cru
itmen
t In
de
xS
urv
iva
l Ra
te In
de
x
Re
cru
itmen
t In
de
x
-0.5
0.0
0.5
1.0
19
70
19
72
19
74
19
76
19
78
19
80
19
82
19
84
19
86
19
88
19
90
19
92
19
94
19
96
19
98
20
00
20
02 -1
.0-0
.50
.00
.51
.0
19
70
19
72
19
74
19
76
19
78
19
80
19
82
19
84
19
86
19
88
19
90
19
92
19
94
19
96
19
98
20
00
20
02
-0.5
0.0
0.5
19
70
19
72
19
74
19
76
19
78
19
80
19
82
19
84
19
86
19
88
19
90
19
92
19
94
19
96
19
98
20
00
20
02
-1.0
-0.5
0.0
0.5
1.0
19
70
19
72
19
74
19
76
19
78
19
80
19
82
19
84
19
86
19
88
19
90
19
92
19
94
19
96
19
98
20
00
Bering Sea Gulf of Alaska
Su
rviv
al R
ate
Ind
ex
Re
cru
itmen
t In
de
xS
urv
iva
l Ra
te In
de
x
Re
cru
itmen
t In
de
x
ECOSYSTEM INDICATORS – Combined Std. Indices of Recruitment and Survival (Mueter)

Sp
eci
es
pe
r h
aul
1990 1993 1996 1999 2001 2003
910
11
1.8
1.9
2.0
2.1
2.2
Sha
nnon
-Wie
ner
inde
x
1990 1993 1996 1999 2001 2003
Sp
eci
es
pe
r h
aul
1990 1993 1996 1999 2001 2003
910
11S
pe
cie
s p
er
ha
ul
1990 1993 1996 1999 2001 2003
910
11
1.8
1.9
2.0
2.1
2.2
Sha
nnon
-Wie
ner
inde
x
1990 1993 1996 1999 2001 2003
1.8
1.9
2.0
2.1
2.2
Sha
nnon
-Wie
ner
inde
x
1990 1993 1996 1999 2001 2003
Spe
cies
per
hau
l
1985 1990 1995 2000
1213
1415
Spe
cies
per
hau
l
1985 1990 1995 2000
1.6
1.8
2.0
ECOSYSTEM INDICATORS –
Species richness and diversity (Mueter)
GOA
BSAI

0
200
400
600
800
1000
1200
1400
1978
1980
1982
1984
1986
1988
1990
1992
1994
1996
1998
2000
2002
2004
BS
AS
P (
1000
mt)
0
50
100
150
200
250
300
GO
A A
SP
(10
00 m
t)
Bering SeaGulf of Alaska
-10000
1000200030004000500060007000
AS
P (
1000
mt)
ECOSYSTEM-BASED MNGT – ASP (Mueter)

0
2,500
5,000
7,500
10,0008
9
90
91
92
93 94
95
96
97
98
99
00
01 02 03
04
Su
b-A
reas
0
8,000
16,000
24,000
32,000
Wes
tern
Sto
ck
Eastern GOA Eastern AICentral GOA Central AIWestern GOA Western AITOTAL
BIOLOGY – Marine Mammals (Sinclair and Testa)Steller Sea Lions – Non-pup counts

BIOLOGY – Seabirds (Fitzgerald et al.)
Seabird Breeding Chronology
0
2
4
6
8
10
12>3days earlier than average
=within 3days of average
>3 days later than average
Fre
qu
ency
N.BS/Chuk. SE BS SW BS GOA SEAK
Seabird Population Trends
024681012141618 Negative trend
No discernable trend
Positive trend
Fre
qu
ency
N.BS/Chuk. SE BS SW BS GOA SEAK
Seabird Productivity Levels
0
2
4
6
8
10
12
14
16>20% below average
Within 20% of average
>20% above average
Fre
qu
ency
N.BS/Chuk. SE BS SW BS GOA SEAK

BSAI
Fis
hin
g E
ffo
rt (
in 1
,000
's o
f h
oo
ks)
GOA
0
10,000
20,000
30,000
40,000
50,000
60,000
1993
1994
1995
1996
1997
1998
1999
2000
2001
2002
2003
0
0.02
0.04
0.06
0.08
0.1
Byc
atch
Rat
e (p
er 1
,000
ho
oks
)
0
50,000
100,000
150,000
200,000
250,000
300,000
0
0.04
0.08
0.12
0.16
0.2
Effort Bycatch Rate
ECOSYSTEM-BASED MNGTSeabird Bycatch (Fitzgerald et al.)

ECOSYSTEM-BASED MNGTProhibited Catch (Hiatt and Terry)
0
5000
10000
15000
No.
of
crab
(10
00s) BAIRDI CRAB
OTHER TANNER CRAB
0
100
200
300
400
No.
fis
h (1
000s
)
CHINOOK SALMONOTHER SALMON
0
100
200
300
1994
1995
1996
1997
1998
1999
2000
2001
2002
2003
2004
No.
of
crab
(10
00s)
RED KING CRABOTHER KING CRAB
0
2000
4000
6000
8000
1994
1995
1996
1997
1998
1999
2000
2001
2002
2003
2004
Met
ric
tons
HALIBUT MORTALITYHERRING BYCATCH

ECOSYSTEM-BASED MNGTDiscards (Hiatt and Terry)
Bering Sea/Aleutian Islands
0
100
200
300
1994 1995 1996 1997 1998 1999 2000 2001 2002 2003 20040%
4%
8%
12%
16%
Gulf of Alaska
0
10
20
30
40
50
Dis
card
s (1
000
t)
0%
5%
10%
15%
20%
25%
Dis
card
rat
e
Tonnage discardedPercent discarded

ECOSYSTEM-BASED MNGTFleet Composition (Felthoven and Gharrett)
0
100
200
300
1994
1995
1996
1997
1998
1999
2000
2001
2002
2003
2004
Trawl Pot
0
500
1000
1500
Nu
mbe
r of
ves
sels
Hook and Line All Vessels
Executive Summary• CLIMATE
– North Pacific in uncertain state – BS continues to warm, less sea ice and earlier retreat
• BIOLOGY– BS summer zooplankton biomass: low 2000-2004– BS jellyfish biomass: low 2000-2004– Warming trend may affect flatfish distribution– Climate change may affect GOA community– Most seabirds show no discernable population trend– 2002 seabird breeding chronology was early– 2004 N. fur seal pups born continued to decline– 2004 non-pup Steller sea lion counts increased in most areas– ASP in BS and GOA decreased from 1978-2004
• FISHERY EFFECTS– 2003 and 2004 increases in herring and other salmon bycatch– 2003 seabird bycatch rate increased

DATA GAPS & RESEARCH NEEDS
• Lower trophic levels – indicators of bottom-up effects of climate
• Introduction of non-native species
• Spatial and temporal concentration of fishing removals
• Species-level catch estimates for some nontarget species (eg. eelpouts)

FUTURE
• Timing of Ecosystem Considerations
• Include model projections in assessment including climate scenarios and suites mngt. alternatives
• Bring lower trophic level models into assessment
ContributorsPaul J. Anderson, Kerim Aydin, Shannon Bartkiw, Harold P. Batchelder, Jennifer Boldt, N. Bond, Eric Brown, Alexander S. Bychkov, David Carlile, Amy R. Childers, David M. Clausen, Cathy Coon, Dean Courtney, William R. Crawford, C. Braxton Dew, Miriam Doyle, Don Dragoo, Sherri Dressel, Doug Eggers, Lisa Eisner, Lowell Fair, Ed Farley, Ron Felthoven, Shannon Fitzgerald, Jeffrey Fujioka, Sarah Gaichas, Jessica Gharrett, John J. Goering, Gary Greene, C.E. Grosch, Steven Hare, Patricia Harris, Kyle Hebert, Jon Heifetz, Jack Helle, Terry Hiatt, Nicola Hillgruber, Gerald R. Hoff, Anne B. Hollowed, James Ianelli, Jim Ingraham, Jesús Jurado-Molina, Suam Kim, Jacquelynne R. King, Tom Kline, K V. Koski, Kathy Kuletz, Carol Ladd, Victor Lapko, Bob Lauth, Heather Lazrus, Mike Litzow, Patricia Livingston, Mitch Lorenz, Alec D. MacCall, David L. Mackas, S. Allen Macklin, Nathan Mantua, Michael Martin, Robert A. McConnaughey, Scott McEntire, Gordon A. McFarlane, Skip McKinnel, Angela Middleton, Kathryn Mier, Steve Moffitt, Franz Mueter, Jim Murphy, Jeff Napp, Ivonne Ortiz, Bob Otto, James E. Overland, Julie Pearce, Mike Perez, R. Ian Perry, Susan Picquelle, Jeffery J. Polovina, Marc Pritchett, Jennifer Reynolds, TaeKeun Rho, D. Righi, Kim Rivera, S. Rodionov, Chris Rooper, T.C. Royer, S. Salo, N. Sarkar, Jake Schweigert, Franklin B. Schwing, Naonobu Shiga, Kalei Shotwell, E. Sinclair, Paul Spencer, Mick Spillane, Phyllis Stabeno, Dean A. Stockwell, Robert Stone, Allan W. Stoner, Stephen Syrjala, Qi-Sheng Tang, Joe Terry, J.W. Testa, Jack Turnock, Dan Urban,Gary Walters, Fred West, Terry E. Whitledge, Tom Wilderbuer, Doug Woodby, Akihiko Yatsu, Cynthia Yeung, Harold Zenger, Jin-Ping Zhao, Jie Zheng, and Mark Zimmermann.


