403
1 Ecosystem Profile Guinean Forests of West Africa Biodiversity Hotspot FINAL VERSION DECEMBER 31, 2015

1
Ecosystem Profile
Guinean Forests of West Africa Biodiversity Hotspot
FINAL VERSION
DECEMBER 31, 2015

2
Prepared by:
International Union for Conservation of Nature
in collaboration with:
United Nations Environment Programme - World Conservation Monitoring Centre
on behalf of:
Critical Ecosystem Partnership Fund
Drafted by the ecosystem profiling team:
Jamie Carr
Adewale Adeleke
Kenneth Angu Angu
Elise Belle
Neil Burgess
Savrina Carrizo
Argyrios Choimes
Nonie Coulthard
William Darwall
Wendy Foden
Jean-Marc Garreau
Wenceslas Gatarabirwa
Charlotte Hicks
Daniel Ramløse Kapijimpanga
Emily King
Kellee Koenig
Santiago Martinez
Han Meng
Samuel Kofi Nyame
Beth Polidoro
Sébastien Regnaut
Yara Shennan-Farpon
Gill Shepherd
Kevin Smith
Arnout van Soesbergen
Jacques Somda
Gretchen Walters

3
Assisted by the following experts and contributors: BENIN
Ferdinand Claude Kidjo National Center for Management of Reserves and Fauna
Josea Dossou-Bodjrenou Nature Tropicale
Georges Hedegbetan Le Centre Régional de Recherche et d’Education pour un
Développement Intégré
Martial Kouderin Le Centre Régional de Recherche et d’Education pour un
Développement Intégré
Philippe Lalaye University of Abomey-Calavi
Stefanie Preuss GIZ Benin
CAMEROON
Gordon Ajonina Cameroon Wildlife Conservation Society
Jean Pierre Amayene IUCN West and Central Africa Programme
Stella Asaha Forests, Resources and People
Richard Eba’a Atiyi Center for International Forestry Research
Anny Bandoma IUCN West and Central Africa Programme
Martha Bechem CITES Monitoring of Illegal Killing of Elephants
Ferdinand Bengyella Cameroon Biodiversity Conservation Society
Gerard Beyiye Ministry of Environment, Protection of Nature and Sustainable
Development
Martin Etone Community Action for Development
Philip Forboseh World Wide Fund for Nature Central Africa Programme
Mary Fosi Myrianthus Fosi Foundation for Biodiversity Protection and
Environmental Protection
Roger Fotso Cameroon Biodiversity Conservation Society
Andrew Fowler Wildlife Conservation Society-Cameroon Program
Prudence Galega Ministry of Environment, Protection of Nature and Sustainable
Development
Jean-Paul Ghogue National Herbarium
Marcel Talla Kouete California Academy of Sciences
Ibrahim Linjouom Ministry of Forestry and Wildlife
Peter Mbile Independent
Sama Raphael Ndaghu Operation Total Impact
Godden Zama Ndenge African Center for Research, Development and Climate Change
Jules Gauthier Ngbapo Global Water Partnership-Central Africa
Paulinus Ngeh TRAFFIC Central Africa
Roger Ngoufo Cameroon Environmental Watch
Louis Nkembii Environment and Rural Development Foundation
Stephen Aset Nken Focal Intergrity Team Cameroon
Maxime Nzita World Wide Fund for Nature Central Africa Programme
Zacharie Nzooh World Wide Fund for Nature Central Africa Programme
David Okon World Wide Fund for Nature Central Africa Programme
Moses Ncho Tabe Food and Rural Development Foundation
Chiambeng George Yongbi National Institute of Agricultural Development

4
CÔTE D’IVOIRE
Zoro Bertin Gone Bi Action pour la Conservation de la Biodiversité en Côte d'Ivoire
Yves Adou Yao Constant SOS-Forêts
Mathieu Wadja Egnankou SOS-Forêts
Elvire-Joelle Mailly Ministry of Water and Forests
Fanny N’Golo Fondation Parcs et Réserves
Moïse Gbedjegbedji Zannou Ivorian Office of Parks and Reserves
EQUATORIAL GUINEA
Rigoberto Esono Anvene National University of Equatorial Guinea
Gabriel Ngua Ayecaba Amigos de la Naturaleza y del Desarrollo de Guinea Ecuatorial
Obiang Diosdado Institute for Forest Development and Protected Areas
Pablo Esono Esono Institute for Forest Development and Protected Areas
Fidel Essono Mba Institute for Forest Development and Protected Areas
Santiago Biyang Mba Ministry of Fisheries and Environment
Victor Luis Engono Ndong Central Africa Forests Commission
Domingo Mbonio Ngono Amigos de la Naturaleza y del Desarrollo de Guinea Ecuatorial
GHANA
Daniel Acquah-Lamptey University of Ghana
Saadia Bobtoya Owusu
Amofah
IUCN West and Central Africa Programme
Wellington Baiden Portal Ltd.
Kingsley Kobina Ghartey Samartex
Chris Gordon Institute for Environment and Sanitation Studies, University of Ghana
Ken Kinney Development Institute
David Kpelle Forestry Commission
Christian Mensah Rainforest Alliance
Yaa Ntiamoah-Baidu Center for African Wetlands, University of Ghana
Reuben Ottou Ghana Wildlife Society
Dorcas Gyimah Owusu IUCN West and Central Africa Programme
Atse Yapi United Nations Food and Agriculture Association
GUINEA
Maadjou Bah Ministry of the Environment, Water and Forests
Mamady Kobélé Keita Guinée Ecologie
Vincent Lapeyre Wild Chimpanzee Foundation
Mamadou Bhoye Sow Office of Parks and Reserves
LIBERIA
William Boeh Ministry of Agriculture
Dickson Chowolo Forest Cry
Spencer Darbney Skills and Agricultural Development Services

5
Jonathan Davis Environmental Protection Agency
Jessica Donovan-Allen Conservation International
Benedictus Freeman Fauna & Flora International
Theo Freeman Forestry Development Authority
Michael Garbo Society for the Conservation of Nature of Liberia
Jerry Garteh Society for the Conservation of Nature of Liberia
Forkepayea Gbelee ArcelorMittal Liberia
Jerry Gensee Society for the Conservation of Nature of Liberia
Renee Gibson Rural Integrated Center for Community Empowerment
Joel Gmys World Resources Institute
Salome Gofan Rural Integrated Center for Community Empowerment
Blamah Goll Forestry Development Authority
Ignitias Jaye Forestry Development Authority
Jallah Kennedy Ministry of Agriculture
Alexander Kingston USAID
Sam Koffa Tetra Tech
Cecelia Kollie Environmental Protection Agency
Sachiko Kondo World Bank
Augustin Lekpayee Save My Future Foundation
Roger Luke Forestry Development Authority
Mary Molokwu Fauna & Flora International
Peter Mulbah Skills and Agricultural Development Services
Abraham Paasewe Consultant
Benetta Roberts Rural Integrated Center for Community Empowerment
Borwen Sayon Conservation International
Richard Sambola Farmers Associated to Conserve Nature
Hanla Sekebah FFE
Henry Smith Society for Environmental Conservation
Michael Taire Society for the Conservation of Nature of Liberia
Jennifer Talbot USAID
Augustine Teddah University of Liberia
Darlington Tuagben Forestry Development Authority
Jaco Venter Conservation International
Anyaa Vohiri Environmental Protection Agency
John Wilson Forestry Development Authority
Dervla Dowd Wild Chimpanzee Foundation
NIGERIA
Ruth Akagu Nigeria Conservation Foundation
Arikpo Arikpo Cross River State Forestry Commission
Andrew Dunn Wildlife Conservation Society-Nigeria Program
Ntufam Richard Effa Cross River National Park
Festus Eguaoje Federal Ministry of Environment

6
Liza Gadsby Pandrillus
Inaoyom Imong Wildlife Conservation Society-Nigeria Program
Ibrahim Inahoro Nigeria Conservation Foundation
Peter Jenkins Pandrillus
Yakubu Mohammed Kolo National Park Service Cross River National Park
Halima Kolo Mohammed Federal Ministry of Environment
Odigha Odigha Cross River State Forestry Commission
Babatunde Olaosebikan Federal College of Freshwater Fisheries Technology
Joseph Onoja Nigeria Conservation Foundation
Adedoyin Simon Federal Department of Forestry
Edwin Usang NGO Coalition for the Environment
SÃO TOMÉ AND PRÍNCIPE
José Antonio Bandeiro
Vera Cruz
Association des Biologiste de Sao Tomé
Luis Ceríaco California Academy of Sciences
Horacio Cravid Ministry of Agriculture and Rural Development
Wilson Ryland Dos Ramos
Pires
CLUB NAPAD
Robert Drewes California Academy of Sciences
Lourenço Monteiro De
Jesus
Ministry of Social Equipment and Environment
Albertino Pires Dos Santos Sea, Environment and Small-scale Fisheries (MARAPA)
Salvador Valerio Sousa
Pontes
Directorate General for the Environment
SIERRA LEONE
Papanie Bai-Sesay Conservation Society of Sierra Leone
Tommy Garnett Environmental Foundation for Africa
Yatta Kamara National Protected Area Authority
Aiah Randolph Lebbie Environmental Foundation for Africa
Salieu Sankoh West Africa Regional Fisheries Program
Charles Showers Conservation Society of Sierra Leone
Alhadji Siaka Sierra Leone Biodiversity Conservation Project
Ansumana Swarray Environmental Forum for Action
TOGO
Mensa Aboudou Ministry of Environment and Forest Resource
Amah Akodewou Agbo Zegue
Comlan Awougnon Ministry of Environment and Forest Resource
Aku Eyram Dakpui Friends of the Earth Togo
Oyétoundé Djiwa Ministry of Environment and Forest Resource
Kudzo Atsu Guelly University of Lomé
Komlan Kpotor Agbo Zegue

7
Seyram Nutsudzie Jeunes Volontaires pour l'Environnement
Gabriel Segniagbeto University of Lomé
Musah Todzro Friends of the Earth Togo
INTERNATIONAL
Ademola Ajagbe BirdLife International
Julius Arinaitwe BirdLife International
Christopher Boesch Max-Planck Institute for Evolutionary Anthropology
Thadiwe Chikomo BirdLife International
Neil Cumberlidge Northern Michigan University
Joseph Cutler University of California, Santa Cruz
Dervla Dowd Max-Planck Institute for Evolutionary Anthropology
Ian Gordon BirdLife International
Richard Grimmett BirdLife International
Jessica Junker Max-Planck Institute for Evolutionary Anthropology
Jan Kamstra IUCN Netherlands
Jordan Kimball United States Forest Service
Hjalmar Kuhl Max-Planck Institute for Evolutionary Anthropology
Philip Platts University of York
Mary Seddon IUCN/SSC Mollusc Specialist Group
Katharyn Shutt Fauna & Flora International
Hazell Thompson BirdLife International
Nicolas Tubbs Royal Society for the Protection of Birds
Dirk Van Damme University of Gent

8
CONTENTS
1. INTRODUCTION ......................................................................................................... 1
1.1 The Critical Ecosystem Partnership Fund .............................................................. 1
1.2 The Guinean Forests of West Africa Biodiversity Hotspot ..................................... 1
1.3 Previous CEPF Investment in the Hotspot ............................................................. 2
1.4 Development of the Ecosystem Profile .................................................................. 5
2. BACKGROUND .......................................................................................................... 6
2.1 Consultation Process ............................................................................................. 7
3. BIOLOGICAL AND ECOLOGICAL IMPORTANCE OF THE GUINEAN FORESTS HOTSPOT ................................................................................................................. 11
3.1 Introduction .......................................................................................................... 11
3.2 Geography and Geology ...................................................................................... 11
3.3 Climate ................................................................................................................ 13
3.4 Biological History ................................................................................................. 14
3.5 Biogeographical Zonation .................................................................................... 15
3.6 The Importance of Ecosystem Services in the Hotspot ....................................... 27
3.7 Species Diversity and Endemism ........................................................................ 31
4. CONSERVATION OUTCOMES DEFINED FOR THE HOTSPOT ............................ 36
5. SOCIOECONOMIC CONTEXT OF THE HOTSPOT ................................................. 87
6. POLICY CONTEXT OF THE HOTSPOT ................................................................ 114
7. CIVIL SOCIETY CONTEXT IN THE GUINEAN FORESTS HOTSPOT .................. 138
7.1 General Overview .............................................................................................. 138
7.2 Categories of CSO............................................................................................. 142
7.3 Operating Context and Political Space .............................................................. 143
7.4 Capacity Needs ................................................................................................. 146
7.5 Funding Context ................................................................................................ 149
7.6 Major Areas of Civil Society Engagement in the Hotspot................................... 150
7.7 Involvement of the Private Sector in the Hotspot ............................................... 154
7.8 Partnerships and Networks ................................................................................ 157
7.9 Conclusion ......................................................................................................... 160
8. THREATS TO BIODIVERSITY IN THE HOTSPOT ................................................ 161
8.1 Key Threats and Baselines ................................................................................ 161
8.2 Drivers and Root Causes ................................................................................... 179
8.3 Barriers to Action ............................................................................................... 184
8.4 Solutions: Approaches to Address Threats, Drivers and Barriers ...................... 189
9. CLIMATE CHANGE ................................................................................................ 196
9.1 Climates of the Guinean Forests Hotspot .......................................................... 196
9.2 Impacts of Climate Change ............................................................................... 202
9.3 Responses to Climate Change .......................................................................... 207
9.4 The Role of Civil Society .................................................................................... 214
9.5 Conclusions ....................................................................................................... 215

9
10. ASSESSMENT OF CURRENT CONSERVATION INVESTMENT ....................... 216
10.1 Introduction ...................................................................................................... 216
10.2 Major Sources of Conservation Investment in the Hotspot .............................. 218
10.3 Distribution of Conservation Investment by Country ........................................ 218
10.4 Distribution of Conservation Investment by Individual Donor ........................... 219
10.5 Trends and Gaps in Investment in the Hotspot ................................................ 235
10.6 Conclusion ....................................................................................................... 242
11. CEPF’S NICHE FOR INVESTMENT ..................................................................... 242
11.1 Key Findings .................................................................................................... 243
11.2 CEPF Niche ..................................................................................................... 246
11.3 Theory of Change ............................................................................................ 248
12. CEPF INVESTMENT STRATEGY ........................................................................ 249
12.1 Geographic Priorities ....................................................................................... 249
12.2 Strategic Directions and Investment Priorities ................................................. 257
13. SUSTAINABILITY ................................................................................................. 270
13.1 Building Strategic Partnerships ........................................................................ 270
13.2 Institutionalization through Improved Policy and Legislative Frameworks ....... 272
13.3 Sustainable Financing ..................................................................................... 273
13.4 Capacity Building ............................................................................................. 273
GUINEAN FORESTS OF WEST AFRICA LOGICAL FRAMEWORK: 2016-2020 ..... 275
REFERENCES ............................................................................................................ 279
APPENDIX 1: OVERVIEW OF TERRESTRIAL ECOREGIONS WITHIN THE GUINEAN FORESTS OF WEST AFRICA HOTSPOT ............................................ 305
APPENDIX 2: FRESHWATER ECOREGIONS WITHIN THE GUINEAN FORESTS OF WEST AFRICA HOTSPOT ............................................................................... 307
APPENDIX 3: MARINE ECOREGIONS ADJACENT TO THE GUINEAN FORESTS OF WEST AFRICA HOTSPOT ............................................................................... 311
APPENDIX 4: SPECIES OUTCOMES FOR THE GUINEAN FORESTS OF WEST AFRICA BIODIVERSITY HOTSPOT ...................................................................... 312
APPENDIX 5: SITE OUTCOMES FOR THE GUINEAN FORESTS OF WEST AFRICA HOTSPOT ................................................................................................ 349
APPENDIX 6: ADDITIONAL SOCIO-ECONOMIC DATA .......................................... 357
APPENDIX 7: DETAILS OF GOVERNANCE STRUCTURES IN EACH HOTSPOT COUNTRY .............................................................................................................. 362
APPENDIX 8: DETAILS OF THE NBSAP PROCESS IN EACH HOTSPOT COUNTRY .............................................................................................................. 367
APPENDIX 9: OVERVIEW OF CONSERVATION APPROACHES LINKED TO THREATS IN THE GUINEAN FORESTS OF WEST AFRICA HOTSPOT ............. 370
APPENDIX 10: ADDITIONAL DETAILS ON CLIMATE-CHANGE-RELATED PROJECTS IN THE HOTSPOT .............................................................................. 375
APPENDIX 11: MEDIUM- AND FULL-SIZED GEF PROJECTS WITHIN THE HOTSPOT ............................................................................................................... 382

10
APPENDIX 12: EXPECTED CONTRIBUTIONS OF THE CEPF INVESTMENT PORTFOLIO IN THE HOTSPOT TO THE SUSTAINABLE DEVELOPMENT GOALS AND THE AICHI TARGETS ...................................................................... 385

1
1. INTRODUCTION 1.1 The Critical Ecosystem Partnership Fund The Critical Ecosystem Partnership Fund (CEPF) is a collaborative funding initiative of the
l’Agence Française de Développement (AFD), Conservation International (CI), the European
Union (EU), the Global Environment Facility (GEF), the Government of Japan, the John D. and
Catherine T. MacArthur Foundation, and the World Bank. Their shared interest and objective is
the conservation of biodiversity hotspots – Earth’s most biologically rich yet threatened areas.
CEPF differs from most other funding agencies in two main ways. Firstly, its focus is on
biological, rather than political, boundaries and units. This allows CEPF to support strategies that
are expected to be more effective with a regional, rather than national, approach, including
actions and alliances that span the boundaries of one or more countries or territories. Secondly,
CEPF’s focus is on civil society organizations (CSOs), including community-based
organizations, academic and research institutions, non-governmental organizations (NGOs), and
private sector bodies and companies. Specifically, by encouraging and facilitating civil society
participation in nature conservation, and by aiding collaborations and alliances among groups, it
is envisaged that a more participatory approach to solving local challenges will emerge. By
engaging and supporting such groups, it is hoped that new and innovative ideas and solutions to
local challenges will be developed and applied, for the benefit of stakeholders, both locally and
elsewhere.
1.2 The Guinean Forests of West Africa Biodiversity Hotspot The Guinean Forests of West Africa Biodiversity Hotspot (hereafter, for brevity, the Guinean
Forests Hotspot), as defined by Mittermeier et al. (2004), extends across the southern part of
West Africa and into Central Africa north of the Congo Wilderness Area (Figure 1.1). The
hotspot covers 621,705 km2, and can be divided into two subregions. The first subregion,
referred to as the ‘Upper Guinean Forests’, stretches from Guinea in the west, through Sierra
Leone, Liberia, Côte d’Ivoire, Ghana, Togo and, marginally, into Benin. The second subregion,
the ‘Lower Guinean Forests’, covers much of southern Nigeria, extends into southwestern
Cameroon, and also includes São Tomé and Príncipe and the offshore islands of Equatorial
Guinea. The Guinean Forests are one of eight biodiversity hotspots in Africa and Madagascar.
The Guinean Forests support impressive levels of biodiversity, having high levels of species
richness and endemism. In terms of plants, approximately 9,000 species of vascular plant are
believed to occur in the hotspot, including 1,800 endemic species (Mittermeier et al. 1998,
2004). The hotspot also supports an exceptional diversity of other terrestrial species. There are
416 mammal species (representing nearly a quarter of the mammals native to continental Africa),
917 bird species, 107 reptile species and 269 amphibian species within the hotspot boundary
(Mittermeier et al. 2004; updated through analysis of Red List data). Of these species, 65
mammals, 48 birds, 20 reptiles and 118 amphibians are thought to be endemic to the hotspot.
The hotspot is among the world’s top priorities for primate conservation, with five Critically
Endangered and 21 Endangered species (Oates et al. 2011, IUCN 2015a).

2
Figure 1.1 Boundary of the Guinean Forests Hotspot
Ninety-two percent of the hotspot’s primates are endemic (Mittermeier et al. 2004). Freshwater
habitats of the hotspot are equally rich, and the diversity and endemism of freshwater taxa such
as crabs, fish, mollusks, odonates, plants and shrimps is believed to be particularly high. For
example, around one-third of the freshwater fishes found in the hotspot are considered endemic
(Paugy et al. 2003).
In addition to their biological richness, a number of ongoing threats to biodiversity in the
Guinean Forests have resulted in the loss of more than 85 percent of the native vegetation cover,
and qualify the region as a hotspot (Mittermeier et al. 2004). Major threats include agricultural
expansion to provide for the needs of an expanding population in rural and urban areas,
unsustainable logging and fishing, hunting and trade of bushmeat, industrial and artisanal
mining, industrial development, climate change and pollution, among numerous others. Many of
the threats to biodiversity occurring in the region are linked, either directly or indirectly, to a
high incidence of poverty, political instability and/or civil conflict.
1.3 Previous CEPF Investment in the Hotspot In September 2012, the CEPF Donor Council selected the Guinean Forests Hotspot for profiling
and future investment. This was intended to be a full reinvestment, following an initial
investment and subsequent consolidation phase between 2001 and 2011, during which CEPF

3
provided a total of USD 8.3 million in support to conservation projects in the Upper Guinean
Forests subregion. The current ecosystem profile builds on the results achieved and lessons
learned from these earlier investments, as outlined below.
During the first full investment period, from 2001 to 2006, CEPF’s investment niche focused on
promoting connectivity in a broad sense, seeking not only to promote ecological connectivity but
also to promote improved coordination from a political, social, and administrative perspective.
CEPF adopted this niche in response to the region’s emergence from years of civil war, which
created a great deal of political and administrative fragmentation in the governance of its natural
resources. Civil conflict continued to challenge conservation efforts, even during CEPF grant
making. CEPF recognized that a successful conservation program required skilled civil society
groups, which were lacking at the time. In response, the initial five-year investment phase
focused on several priorities: providing NGOs and private organizations with the capacity to
manage biodiversity conservation; strategic funding for strengthening institutional capacity,
biodiversity monitoring and public awareness building; and the launch of a small grants fund.
Over the first five-year investment period, grantees achieved several important milestones:
Twenty-five national and international NGOs and private sector partners built their
capacities in a variety of technical and geographic areas, from organizational
administration and project management, to the generation and use of biological
information and data for decision making.
Networks, such as the Environmental Forum for Action in Sierra Leone and the BirdLife
West Africa partnership, were established and/or strengthened to foster cooperation and
coordination. These networks served as avenues for communication, collaboration, and
learning, and generated the desire for a regional conservation vision.
A total of 186,268 hectares was afforded improved protection, including Liberia’s Nimba
Nature Reserve, which is contiguous with a World Heritage site in Guinea and Côte
d’Ivoire. Sapo National Park in Liberia was expanded, while the government of Ghana
upgraded protection of a 100,000 hectare forest reserve. Furthermore, grantees helped
establish a new, coherent legal framework for forest conservation in Liberia.
Management of priority sites improved in Liberia, Sierra Leone, Ghana, Togo, and Côte
d’Ivoire.
Baseline biological data collection led to a consensus-based prioritization of conservation
outcomes that continues to be used to this day, and which forms the basis for the
conservation outcomes defined in the current ecosystem profile. CEPF-supported rapid
biological assessments in Guinea, Liberia, Côte d’Ivoire and Ghana stimulated interest
from civil society and governments in new sites critical for conservation.
More than 140 communities were exposed to conservation projects at multiple levels,
from project design, implementation, and results monitoring. CEPF projects involved
local communities in all focal countries targeted in the first phase.
At the end of the first funding phase, CEPF’s donors and Secretariat, as well as stakeholders in
the Upper Guinean Forests recognized that further CEPF investment was warranted due to
several factors: the sustainability of CEPF-funded initiatives remained fragile; communities still
needed support to strengthen the linkages between livelihoods generation and conservation; and

4
capacity limitations within government agencies and civil society groups continued to stymie the
achievement of conservation outcomes. As a result of these factors, CEPF donors approved a
three-year consolidation phase from 2008 to 2011. Three investment priorities were targeted over
this period: (i) support to promote financial sustainability of CEPF initiatives; (ii) strengthening
of the linkages between livelihoods generation and community participation in the conservation
agenda through a small-grants program; and (iii) building capacity of local actors for
conservation. The consolidation phase limited site-based investment to priority areas in Liberia
and Sierra Leone, while continuing to foster capacity building across the subregion.
During the consolidation phase, CEPF grantees achieved several important results:
Capacity-building activities bore fruit for community and local civil society groups
across a variety of sites. For example, Sierra Leone’s Environmental Foundation for
Africa (EFA) emerged as a conservation leader in West Africa, growing with more staff,
programs, and donors. EFA founded and chaired the Environmental Forum for Action, a
network of 14 ‘green actors’ across Sierra Leone, which was launched with a CEPF small
grant. EFA also opened the Biodiversity and Renewable Energy Learning Center in a
forest preserve near Freetown, which serves as a place for learning exchange for
practitioners from throughout the region.
CEPF grantees helped to lay the foundation for long-term funding through several pilot
projects. For example, the government of Sierra Leone declared Gola Forest Reserve a
national park in preparation for what subsequently became West Africa’s first Reduction
of Emissions from Deforestation and Forest Degradation (REDD+) project.
In Liberia, Arcelor Mittal, an iron ore mining company, entered into West Africa’s first
mining offset project to provide sustainable conservation funding and generate income
for local communities. The initiative funded conservation agreements developed by
CI’s Conservation Stewards Program, whereby local communities agreed to a five-year
benefit package to offset foregone access to resources within East Nimba Nature Reserve.
The benefit packaged included job training to convert hunters into ecoguards, funding to
establish household piggeries, technical support to improve rice production and skills
training for community health workers.
CEPF’s earlier investments provided an important foundation and important lessons upon which
to launch a new investment phase in the hotspot. The main lessons learned are summarized
below:
Emerging NGOs need to start small. They require oversight and capacity building in
addition to just money, and they benefit from sharing experience with others.
Some capacity building approaches appear to work better than others. For instance,
mentoring of a small organization by a larger, longer established one seems to be more
effective than professional training courses. Nevertheless, retaining trained staff is a
major challenge for smaller CSOs, as they tend to leave to take up jobs that offer higher
or more reliable salaries.
Local groups have taken the initiative to form partnerships and networks, for example the
Environmental Forum for Action in Sierra Leone. Such collaborations are integral to
avoiding duplication of effort and maximizing conservation results.

5
CEPF investments in environmental education and outreach have been innovative and
unusual, in an effort to get beyond conventional efforts, which have not proven
successful (but continue to be used). More innovative communication strategies,
featuring the use of film, drama, music and hands-on experience appear to have been
more effective at generating enthusiasm and awareness.
Community participation needs to be encouraged at all stages of the design and
implementation of conservation interventions, to ensure they are locally owned.
Sustaining community motivation to support conservation goals beyond the end of
projects was identified as a challenge by several grantees, especially where financial
incentives are used.
Although CEPF investments have been instrumental in generating biodiversity data, they
fell short of setting up a region-wide biodiversity monitoring system, as originally
planned. One lesson that can be drawn from this is the importance of setting feasible
objectives that are well founded in an analysis of the capacity of civil society in the
region.
Corridor creation in West Africa is complex and challenging, and requires substantial
incorporation of livelihood components. Poverty is a constant obstacle to conservation
success, and CEPF’s projects that have included alternative income generation
components have often yielded significant results.
There is a great need for a range of grant sizes, to engage partners of differing capacities.
Small grants can be particularly useful for engaging the many smaller CSOs in the
hotspot that lack the capacity to handle larger amounts of funding.
Above all, the earlier investments by CEPF in the Upper Guinean Forests demonstrated that,
with appropriate support and guided by a common plan of action, civil society groups are able to
contribute meaningfully to conservation efforts in West Africa. Many of the CSOs in the Upper
Guinean Forests that actively participated in the ecosystem profiling process were very small
organizations at the start of the first investment phase, suggesting that investing in small local
NGOs has results, at least in a significant proportion of cases. There is, nevertheless, a need for a
longer-term engagement by CEPF and other funders, because increases in capacity and on-the-
ground conservation results require considerable time to be achieved and secured.
In light of this, CEPF’s Donor Council directed the CEPF Secretariat to develop a shared
strategy for a new phase of investment in the Guinean Forests through empowering and engaging
civil society organizations active in conservation. Although the primary purpose of this
document - the ecosystem profile - is to provide a strategy for CEPF investment in the hotspot, it
is also designed for use by other donors, government agencies, civil society organizations and
private sector groups. Coordinated efforts among multiple institutions are required to confront
the challenges facing biodiversity, ecosystem services and communities in the region today.
1.4 Development of the Ecosystem Profile
CEPF commissioned the preparation of this ecosystem profile to guide its planned reinvestment
in the hotspot. The profile provides an analysis of the current situation across the hotspot, and
which frames a detailed strategy for CEPF investment over a five-year period, between 2016 and
2021. The profile presents an overview of the hotspot, dealing with, in turn, biological and

6
ecological importance (Chapter 3), targets for conservation (Chapter 4), socioeconomic, policy
and civil society contexts (Chapters 5, 6 and 7), threats to biodiversity (Chapter 8) including
climate change (Chapter 9), and patterns in conservation investment (Chapter 10). This
situational analysis informs the definition of a niche for CEPF investment (Chapter 11), an
investment strategy (Chapter 12) and a plan for sustaining results beyond the end of the
investment phase (Chapter 13).
In addition to using existing datasets and reports, including from the earlier ecosystem profile for
the Upper Guinean Forests subregion (CEPF 2000), the information contained in this profile has
been gathered through a participatory process, involving consultations with a range of
governmental and non-governmental stakeholders in the region (see Chapter 2). The reasoning
behind such a participatory approach is the desire to develop a shared strategy from the outset;
one that accounts for the needs and ongoing activities of the region’s stakeholders, and allows
other donors and programs to complement CEPF investments.
The release of this profile will be followed by a multi-year period of implementation through
grant-making to CSOs, which will be guided by a CEPF Regional Implementation Team (RIT).
CSOs will be asked to submit proposals for activities that are in line with the strategic directions
and investment priorities identified through the profiling process (Table 12.3).
2. BACKGROUND
This chapter describes the process used to prepare this ecosystem profile, including summary
information on all partners involved. The profiling process entailed a rapid assessment and
evaluation of the biodiversity values of the hotspot (at species, site and corridor scales) and the
causes of biodiversity loss and their root causes, coupled with the compilation of an inventory of
current conservation and development investments in the region. The ecosystem profile was
prepared by a consortium consisting of the West and Central Africa Programme of the
International Union for Conservation of Nature (IUCN-PACO), the Global Species Programme
of the International Union for Conservation of Nature (IUCN-GSP) and the United Nations
Environment Programme-World Conservation Monitoring Centre (UNEP-WCMC), with
technical contributions from BirdLife International, CI and other partners, including independent
consultants with extensive expertise in the region.
The profiling process began with the organization of an advisory group meeting in Accra, Ghana
(December 10-12, 2013), followed by stakeholder consultation meetings in Lomé, Togo
(February 17-18, 2014) and Douala, Cameroon (February 24-25, 2014). However, the outbreak
of the Ebola virus in March 2014, which affected four of the 11 countries in the hotspot (Guinea,
Liberia, Nigeria and Sierra Leone) meant that travel and meetings around the region were
severely restricted, requiring the postponement of some the planned consultation activities, and
replacement of others by remote consultations. Following the lifting of travel restrictions
introduced during the Ebola outbreak, the stakeholder consultation process was concluded with
two final stakeholder workshops, in Monrovia, Liberia (August 27-28, 2015) and Limbé,
Cameroon (September 2-3, 2015), and a consultation with members of the BirdLife International
Africa Partnership in Akosombo, Ghana (October 11-13, 2015).

7
The main activities of the profiling process were:
i. Defining the conservation outcomes for the Guinean Forests Hotspot at species, site and
corridor scales;
ii. Analyzing the socioeconomic, policy and civil society context, and assessing the relevant
pressures and threats to the biological values of the region;
iii. Identifying current conservation investments in the hotspot by donors, NGOs and
governments;
iv. Consulting a wide range of national and international stakeholders with knowledge of the
hotspot in order to gather and validate information and to assist with analysis; and
v. Defining CEPF’s niche and investment strategy for the hotspot.
The combined expertise found within IUCN-PACO, IUCN-GSP and UNEP-WCMC provided
the consortium with an in-depth understanding of the methodology for identification of Key
Biodiversity Areas (KBAs; which provide the main geographical lens for CEPF investment),
including firsthand experience of its application in other CEPF hotspot profiling exercises.
As CI had already completed much work on defining terrestrial KBA and conservation corridors
in the Upper Guinean Forests subregion during the previous investment phase (see Chapter 4),
much of the focus of the current profiling process was on:
i. Refining existing terrestrial KBAs;
ii. Identifying terrestrial KBAs in the Lower Guinean Forests subregion; and
iii. Identifying freshwater KBAs across the whole hotspot, as these were not explicitly
considered during the profiling process for the first phase of CEPF investment.
The process involved synthesizing and analyzing existing biological and thematic information, as
well as undertaking a participatory approach to verifying the profile structure, contents and
overall strategy. This verification involved major stakeholders in the region, and especially
representatives from NGOs, research institutions, the private sector and governments. The aim
was to gather relevant current information on context and threats, to reach consensus on
conservation priorities, and to ensure that stakeholders were part of the process and that they had
ownership of the strategy.
The profiling process also capitalized on priority-setting work that has already taken place in a
number of the countries covered by the hotspot, including the development of National
Biodiversity Strategies and Action Plans (all hotspot countries), national biodiversity strategies
gap analyses (Cameroon, Ghana, and Nigeria) and National Adaptation Programmes of Action
(Benin, Guinea, Liberia, São Tomé and Príncipe, Sierra Leone and Togo).
2.1 Consultation Process The profile development process began with an electronic review of literature related to the
Guinean Forests, in particular the earlier work carried out by CEPF in the Upper Guinean Forests
subregion. This was followed by the invitation of representatives of major stakeholder groups to

8
participate at consultation workshops, with the intension of gathering inputs for the development
of the profile. Four different processes were employed:
i. Meeting of an Advisory Group at the onset of the prioritization process;
ii. Three subregional stakeholders consultation workshops for initial data collection and
agreement on criteria for analysis;
iii. Remote, questionnaire-based consultations; and
iv. Final stakeholder consultation workshops at the end of the process.
Other methods included review of electronic documents collated from online sources, and
outreach to key stakeholders by telephone, Skype and emails. These methods were very
important, especially to fill gaps in information obtained from the stakeholder consultations.
2.1.1 Advisory Group
A 23-member Advisory Group comprising of representatives of leading civil society groups,
GEF focal points, international and regionally-based individuals well versed in conservation
issues of the region, and donors from the 11 countries was established. This group had the
mandate to advise on the profiling process, as well as to contribute to the final profile, depending
on individual expertise. The Advisory Group members were selected based on their past and
ongoing experiences, with a view to achieving a balance of interest across countries, taxonomic
groups, etc. This group met in Accra, Ghana in December, 2013, and this meeting was also used
as an opportunity to officially launch the profiling exercise. Although 50 individuals were invited
to serve on the Advisory Group, only 23 were able to make it to the meeting due to other
engagements. They discussed and validated plans for elaborating the ecosystem profile, notably
the plans for in-country consultations, and agreed to: raise awareness about the process in their
respective countries and networks; provide data or suggestions of experts for definition of
conservation outcomes; advise the profiling team on policies and legislation related to
conservation; and review drafts of the profile. The Advisory Group formulated the following
recommendations: facilitate capacity-building, notably on how to showcase results of the project
and what needs to be done; build the capacity of NGOs, communities and government to
contribute to the profiling process and implement of the investment strategy that emerges; ensure
that that the strategy is holistic and not just focused on the forestry sector but also on other
sectors, including agriculture, tourism and mining.
2.1.2 Initial Consultation Workshops
The participatory consultation and verification process, which is important for ensuring
consensus and buy-in to the profiling exercise, was carried out through three separate stakeholder
consultations, with the overall objective of developing a strategic investment program for the
conservation and sustainable management of the Guinean Forests ecosystems. These workshops
gave the profiling team opportunities to gather inputs on draft outcomes and to obtain additional
baseline data, useful in defining the investment strategy for the hotspot, as well as information on
current investments in the hotspot.

9
The three initial consultation workshops were as follows:
i. Accra, Ghana (December 11-12, 2013). This workshop targeted the hotspot’s
Anglophone countries (Ghana, Liberia, Nigeria and Sierra Leone). It was immediately
preceded by the Advisory Group meeting, some of whose members participated in this
workshop.
ii. Lomé, Togo (February 17-18, 2014). This workshop was aimed at Francophone
countries in the Upper Guinean Forests subregion (Benin, Guinea, Côte d’Ivoire and
Togo).
iii. Douala, Cameroon (February 24-25, 2014). This workshop was aimed at the countries
of the Lower Guinean Forests subregion (Cameroon, Equatorial Guinea and São Tomé
and Príncipe) except for Nigeria, which was covered by the Accra workshop.
At each of the stakeholder consultation workshops, the profiling team explained the process and
invited the assistance of stakeholders for identifying conservation outcomes. Participants were
invited to provide contextual information on biodiversity, threats, current investments, civil
society and policies in their countries, through completion of a questionnaire. Participants’ views
were sought on thematic priorities for CEPF investments, which later informed the scope of the
investment strategy.
2.1.3 Remote Stakeholder Consultations
A second series of workshops were planned for September 2014, with a view to collating specific
information on conservation outcomes. Unfortunately, the outbreak of the Ebola virus across
many of the hotspot’s countries, and the subsequent international flight restrictions, rendered
these workshops logistically impossible. It was, therefore, decided to undertake this stage of the
consultation through a remote, questionnaire-based process. More than 90 experts from across
the 11 hotspot countries and beyond completed questionnaires with information on individual
sites and corridors, related to management capacity, funding status, provision of ecosystem
services, and recommendations for thematic investment priorities. Of these 67 completed and
returned the questionnaires, providing a rich source of information to inform the identification
and prioritization of KBAs. To facilitate this process, three small meetings were held, with the
aim of completing these questionnaires in a group environment. The first was held in Calabar,
Nigeria (September 19, 2014) by Wildlife Conservation Society (WCS)-Nigeria Program, The
second was held in Monrovia, Liberia (September 30 and October 1, 2014) by the Rural
Integrated Centre for Community Empowerment (RICCE) and Farmers Associated to Conserve
the Environment (FACE). The third was held in Freetown, Sierra Leone by the Conservation
Society of Sierra Leone (October 3, 2014).
2.1.4 Final Consultation Workshops
To conclude the consultation process, two final stakeholder workshops were held as follows:
i. Monrovia, Liberia (August 27-28, 2015) with 20 senior stakeholders representing
Guinea, Sierra-Leone, Liberia, Côte d’Ivoire and Ghana.
ii. Limbe, Cameroon (September 2-3, 2015) with 31 senior stakeholders representing
Nigeria, Cameroon, São Tomé and Princípe and Equatorial Guinea.

10
Each workshop had the following objectives:
i. Address information gaps in relation to the civil society context (Chapter 7) and analysis
of conservation funding (Chapter 10).
ii. Collect stakeholders’ inputs and comments on the other chapters making up the
situational analysis.
iii. Reach consensus on the CEPF investment niche (Chapter 11) and strategy (Chapter 12).
iv. Reach a consensus on priority sites for CEPF investment.
The two workshops were successful at reaching broad consensus among participants regarding
the CEPF investment strategy for the hotspot, and there was remarkable convergence between
the two subregions in this regard. The workshops also enabled a focusing of the georgraphic lens
for CEPF investment, through selection of priority sites from a shortlist prepared through an
analysis conducted earlier in the profiling process.
The final consultation workshops were complemented by consultations with local NGO partners
of BirdLife International in West Africa during October 11-13, 2015. This ensured that inputs
were captured from some of the most well established local conservation groups in the hotspot,
who were unable to participate in the earlier workshops.
Table 2.1 shows the various consultation workshops held and the number of participants at each. Table 2.1 Stakeholder Consultation Workshops Held in the Guinean Hotspot
Workshop Location Held Date of workshop No. of
participants
Advisory Group Meeting Accra, Ghana Dec 10, 2013 28
Initial Consultation Workshop for Anglophone West Africa
Accra, Ghana Dec 11-12, 2013 28
Initial Consultation Workshop for Francophone West Africa
Lomé, Togo Feb 17-18, 2014 25
Initial Consultation Workshop for the Lower Guinea Forests Subregion
Douala, Cameroon Feb 24-25, 2014 23
National Consultation for Nigeria Calabar, Nigeria Sep 19, 2014 12
National Consultation for Liberia Monrovia, Liberia Sep 30 - Oct. 01, 2014 21
National Consultation for Sierra Leone Freetown, Sierra Leone Oct 3, 2014 3
Final Consultation Workshop for the Upper Guinean Forests
Monrovia, Liberia
Aug 27-28, 2015 20
Final Consultation Workshop for the Lower Guinean Forests
Limbé, Cameroon Sep 2-3, 2015 31
Final Consultation with local NGOs from the BirdLife International Africa Partnership
Akosombo, Ghana Oct 11-13, 2015 20

11
3. BIOLOGICAL AND ECOLOGICAL IMPORTANCE OF THE GUINEAN FORESTS HOTSPOT 3.1 Introduction The Guinean Forests Hotspot supports impressive levels of biodiversity, including numerous
endemic species, making it a conservation priority at the global scale. The hotspot is ranked
among the world’s foremost regions for mammalian diversity. Nearly one quarter of the mammal
species native to continental Africa are represented within the hotspot. Notable threatened
species in the Lower Guinean Forests subregion of the hotspot include western gorilla (Gorilla
gorilla) and drill (Mandrillus leucophaeus), while the Upper Guinean Forest subregion supports
notable endemics, such as the pygmy hippopotamus (Choeropsis liberiensis) and several species
of forest duikers, such as Jentink’s Duiker (Cephalophus jentinki). The hotspot is one of the top
global priorities for primate conservation due to both high levels of endemism and threat:
92 percent of the hotspot’s 30 species of primate are endemic, and almost all of these are
assessed as threatened on the IUCN Red List.
The hotspot contains many other ecological features that render it globally unique. The Niger
Delta swamp forests, for instance, are the second largest swamp forest on the continent, while the
Central African Mangroves are the largest mangrove stands in Africa and the third largest in the
world. The hotspot’s offshore volcanic islands support notably high levels of endemism,
particularly for their size. One of the largest rivers in West Africa, the Volta, and the delta of the
longest and largest river in West Africa, the Niger, occur within the hotspot boundary. The
Western Equatorial Crater Lakes ecoregion is among several that are listed as globally
outstanding.
This chapter describes the geographical, geological, climatological, biogeographical, biological
and ecological importance of the Guinean Forests of West Africa Hotspot. It also outlines the
importance of the hotspot in terms of the ecosystem services it provides to its human population.
3.2 Geography and Geology
Situated in West Africa and northwestern Central Africa, and including several oceanic islands,
the Guinean Forests Hotspot is a topographically subdued region with few areas of higher ground
(Figure 3.1). The main mountain ranges are the Fouta Djallon Massif, Nimba Mountains, Jos
Plateau, Mambila Mountains (named here as Cameroon-Nigeria Mountains) and the Adamawa
Plateau. The Cameroon-Nigeria Mountains are particularly noteworthy as they contain Mount
Cameroon, a 4,040 m active volcano, in addition to other tall, dormant volcanoes, such as Mount
Oku (3,011 m) and Mount Kupé (2,064 m). Mount Cameroon is the highest formation in this
chain and is the only active volcano in the hotspot, with seven eruptions since 1990 (Cronin et al.
2014).

12
Figure 3.1 Topographical Map of the Guinean Forests of West Africa Hotspot
Source: ARC GIS standard data layers
The hotspot boundary itself is defined, to a large extent, by the habitats occurring within it, in
particular by the presence of forested or formerly forested areas. As such, while the hotspot is
difficult to characterize through political boundaries, it lends itself more readily to description
through biogeographical delineations. This chapter makes reference to terrestrial ecoregions, as
described by Burgess et al. (2004), which follow the hotspot boundaries, as well as freshwater
and marine ecoregions, as appropriate.
The hotspot is divided unequally among countries, and, similarly, the proportion of each country
within the hotspot boundary varies greatly. For example, Côte d’Ivoire contains the largest
proportion of the hotspot (24.1 percent), while Benin contains the lowest proportion
(0.2 percent). São Tomé and Príncipe, and Liberia are the countries with the greatest proportions
of their total area considered part of the hotspot (100 percent and 98.5 percent, respectively),
while Benin is again the lowest (1.2 percent). These figures are summarized in Table 3.1, and it
is important to be aware of these values when reading the later chapters of this profile,
particularly Chapters 4 and 5, where much of the information is presented at the country level, as
data for the portion of each country within the hotspot was generally not available.

13
Table 3.1 Total Area and Proportion of the Hotspot in Each Country
Country Total area
(km2)
Area of overlap with Guinean Forests
Hotspot (km2)
Percentage of hotspot in
each country
Percentage of country in
hotspot
Benin 117,650 1,462 0.2 1.2
Cameroon 469,784 64,272 10.3 13.7
Côte d’Ivoire 325,990 150,300 24.1 46.1
Equatorial Guinea 28,051 1,965 0.3 7.0
Ghana 242,178 79,902 12.8 33.0
Guinea 249,691 48,488 7.8 19.4
Liberia 96,861 95,376 15.3 98.5
Nigeria 926,744 127,583 20.4 13.8
São Tomé and Príncipe 1,001 1,001 0.2 100.0
Sierra Leone 73,316 47,350 7.6 64.6
Togo 57,637 6,341 1.0 11.0
Geologically, the majority of the hotspot is underlain by ancient Precambrian rocks that have
been eroded over many millions of years. These rocks are typically nutrient poor, making the
soils derived from them similarly poor in nutrients and often challenging to farm on an annual
basis. In many parts of the hotspot, the farming system relies on the clearance of forest and
bushland, cultivating the soil for one to two years, and then leaving the area fallow to recover its
nutrients for a number of years before farming again.
In some areas, the ancient rocks have been uplifted into mountains and hills, for example in the
Fouta Djallon in Guinea, the Loma Hills in Sierra Leone, the Mount Nimba area of northern
Liberia, the Togo Hills in Togo, and the Jos Plateau in Nigeria. Along the border between
Nigeria and Cameroon is another mountain range that contains both ancient and more recent
volcanoes. Historic volcanic activity has led to the formation of the extensive chain of highlands
called the Cameroon Volcanic Line, which includes the volcanic islands of Bioko, Príncipe, São
Tomé, and Annobón in the Gulf of Guinea, and stretches northeast through Cameroon and
beyond the hotspot as far as Lake Chad. Almost all of these are dormant today, although some
are still producing quantities of carbon dioxide and other gases from below their crater lakes.
These volcanic rocks weather to form much more productive soils, for example on Mount
Cameroon.
Within the hotspot, there are also sedimentary deposits associated with river deltas and coastal
shelves. In these areas, there are significant deposits of oil and gas, especially associated with the
ancient delta of the Niger River in Nigeria.
3.3 Climate The prevailing climate in the hotspot is tropical and humid, with annual maximum temperatures
ranging from around 30 to 36°C. The climate has a significant effect on the biodiversity of the
hotspot, permitting a high diversity of species to persist. The cooler end of this temperature range

14
is found near to the coast, and temperatures increase as one moves northwards (Hijmans et al.
2005).
The hotspot shows little seasonality in terms of temperature, with maxima and minima remaining
similar throughout the year at any given location but differing, rather, in terms of level of
precipitation, which is governed by the annual movements of the inter-tropical convergence
zone, and results in monsoon conditions (often referred to as the ‘rainy season’). The onset and
length of the rainy season can be variable but may be broadly described as beginning around
March or April in coastal environments (around 5°N), and expanding its coverage (to approx.
10°N) until around June. From July to September the core of the rain-band shifts to around 10°N,
where higher rainfall is received, and from September to November the rain-band retreats
southward once again (Le Barbé et al. 2002). The result of this phenomenon is that more
southerly locations experience two peaks in rain throughout the year, while those further north
experience only one. As with temperature, the seasonality in rainfall has a major impact on the
biodiversity of the region.
Typical annual rainfall near the coast is around 3,000-3,500 mm, and decreases to around 1,500-
2,000 mm further inland. Many of the forested areas in the hotspot have an average annual
precipitation of around 2,000-2,500 mm inland, rising to nearly 4,000 mm in the coastal areas
(Cole 1968; Barbour et al. 1982). Certain locations, such as the Number Two River on the
Freetown Peninsula in Sierra Leone, receive more than 5,000 mm of precipitation annually. In
the Mount Cameroon area, annual rainfall can reach 10,000 mm locally, and gradually declines
with increasing elevation, to less than 2,000 mm at the summit of Mount Cameroon. The
Guinean Montane Forest ecoregion, the Nigerian Lowland Forest ecoregion and the Cross-Niger
Transition Forests ecoregion are relatively less wet regions, with annual precipitation decreasing
from 2,000-2,500 mm near the coast to 1,500-2,000 mm further inland.
The difference in rainfall between the relatively dry ecoregions and the wetter ones is significant
during the dry season (around December to February). For instance, the Nigerian Lowland
Forests receive less than 50 mm of rain during this time, while the Niger Delta Swamp Forests
still receive an average monthly mean of 150 mm.
3.4 Biological History During wetter climatic periods, such as those of the past few thousand years, the Guinean Forests
Hotspot would have been covered in large part by tropical rainforest formations, perhaps over as
much as 624,000 km2. However, the forest cover has been reduced to a series of fragments of
high forest separated by large areas of agricultural land (often termed farm-bush), and numerous
villages and towns. Overall, the hotspot retains approximately 93,047 km2 of natural vegetation,
or roughly 15 percent of its original cover (Mittermeier et al. 2004).
Over the past million years or more, the vegetation zones of West Africa have migrated north
and south depending on the prevailing climate. Ice ages in the Northern and Southern
Hemispheres caused a general drying across Africa, and at the height of these colder glacial
periods, forest cover shrank and may have become confined to refugia located in the centers of
diversity in the present-day Upper and Lower Guinean Forests subregions. During interglacial

15
periods the forest would have expanded again, as the climate of the region became wetter. This
climatic oscillation over periods of thousands of years and the associated expansion and
contraction of forest cover is probably the most important contributing factor to the diversity and
patterns of the biota seen in the lowland forests.
The mountain chain of Nigeria-Cameroon and the offshore islands, which are all isolated
volcanoes, have a different history. Here, evolution and speciation has depended upon isolation
on oceanic islands or inland montane areas, with both evolutionarily ancient species and more
recently evolved ones found in these islands of habitat. One of the driving forces behind the
diversity patterns observed in the hotspot is the wide variety of habitats found in the highland
areas. Here, patterns of endemism follow an elevation gradient, with highland areas hosting the
largest concentrations of endemics (Cornin et al. 2014).
Threats to the Guinean Forests and their biodiversity are inextricably linked to poverty, rapid
human population growth, unsustainable mining, fishing practices and logging, as well as
political instability and civil conflict (GEF 2010). Studies suggest that around 80 percent of the
original forest area is now an agriculture-forest mosaic (Norris et al. 2010). Much of the
remaining forest is exploited for timber and/or is used for local purposes, such as for construction
materials and fuel. A majority of the hotspot’s forests show evidence of tens of thousands of
years of periodic human habitation, use and re-growth (Lindsell and Klop 2013), meaning that
very little of the remaining forest can be regarded as pristine. Nonetheless, inhabitation of the
forest does not always result in forest cover decline, as communities sometimes also plant
forests, such as in the forest-savanna mosaic at the northern boundary of the hotspot (Fairhead
and Leach 1996).
3.5 Biogeographical Zonation 3.5.1 Larger Scale Bioregions The hotspot represents the Guinean portion of the Guinea-Congolian forests, and comprises two
main subregions: the Upper Guinean Forests; and the Lower Guinean Forests. These two
subregions are separated by the Dahomey Gap, in Benin and Togo, which is a climatically-
induced dry region originating from the late Holocene Epoch. The Dahomey Gap, which
currently supports a mixture of farmland, savanna and dry forest, is not considered part of the
hotspot.
The Upper Guinean Forests subregion extends from southern Guinea eastward through much of
central and southern Sierra Leone, all of Liberia, much of southern Côte d’Ivoire and Ghana.
Isolated patches of habitat associated with the Upper Guinean Forests subregion are found in
central and southeastern Guinea, where they primarily contain submontane and montane forests
(Fouta Djallon and Mount Nimba). Small isolated patches of the hotspot associated with this
subregion also occur in western Togo (the Togo Highlands) and extend northward to terminate at
one isolated patch in northwestern Benin.
The Lower Guinean Forests subregion extends from western Nigeria to the Sanaga River in
southwestern Cameroon. It also includes the islands of Bioko and Annobón (both part of

16
Equatorial Guinea), as well as the islands of São Tomé and Príncipe. The patterns of biodiversity
in the offshore islands are a reflection of the biogeographic history of the region. While Bioko
lies on the continental shelf and has been connected to African mainland, Annobón and São
Tomé and Príncipe are truly oceanic and have never been connected with each other or with the
mainland. Consequently, Bioko supports a much more diverse flora and fauna with relatively
low levels of endemism, whereas the furthermost islands have low species richness due to their
isolation, but contain exceptionally high rates of endemism at the generic, specific, and
subspecific levels. High species richness is also observed in the Cameroon Highlands, and results
from a high diversity of habitats found in a restricted geographic area.
3.5.2 Ecoregions Ecoregions are large units of land or water, which contain distinct assemblages of species,
habitats and ecological processes, and whose boundaries attempt to depict the original extent of
natural communities before major land-use changes (Burgess et al. 2004). They are based mostly
on previously proposed biological divisions. The hotspot contains 12 terrestrial, 15 freshwater
and four marine ecoregions, which are described in detail in Appendices 1 to 3.
Figure 3.2 Terrestrial Ecoregions of the Guinean Forests Hotspot
Data Source: Olson et al. (2001).

17
Terrestrial Ecoregions The Guinean Forests Hotspot supports three main forest types: lowland forest; mangrove and
swamp forest; and submontane to montane forest. All of these fall into the higher hierarchical
grouping of Tropical and Subtropical Moist Broadleaf Forests (Burgess et al. 2004). The 12
major terrestrial ecoregions contained within the hotspot are shown in Figure 3.2.
Of the 12 ecoregions occurring within the hotspot, those comprising the greatest proportions of
the hotspot overall include the Eastern Guinean Forests and the Western Guinean Lowland
Forests, which together comprise the vast majority of the Upper Guinean Forests subregion. In
the Lower Guinean Forests subregion, the Nigerian Lowland Forests ecoregion and the Cross-
Sanaga-Bioko Coastal Forests ecoregion together make up the greater proportion, followed by
the Cameroonian Highland Forests ecoregion. The Guinean Montane Forests, Niger Delta
Swamp Forests and Cross-Niger Transition Forests ecoregions comprise smaller, yet significant,
proportions of the hotspot, while the Guinean Mangroves, Central African Mangroves, Mount
Cameroon and Bioko Montane Forests, and São Tomé, Príncipe and Annobón Moist Lowland
Forest ecoregions all have smaller overall areas within the hotspot. Further information on the biological importance of these ecoregions is presented in Table 3.2,
and further details can be found in Appendix 1. Table 3.2 Biological Importance and Main Threats to the Terrestrial Ecoregions the Hotspot
Ecoregion Notes
Cameroonian Highlands Forests
Classified as Globally Outstanding, this ecoregion is characterized by high endemism, including: at least 50 species and three families of plants; nearly 40 amphibians; numerous birds (e.g. green longtail (Urolais epichlora), white-tailed warbler (Poliolais lopezi), Mount Cameroon francolin (Francolinus camerunensis), Fernando Po batis (Batis poensis) and Bannerman’s Turaco (Tauraco bannermani); reptiles (e.g. Chamaeleo montium, C. quadricornis, Hydraethiops laevis, Leptosiaphosi anthinoxantha); and mammals such as Preuss’s monkey (Cercopithecus preussi), and northern needle-clawed bushbaby (Euoticus pallidus), plus 11 further small mammal species. The ecoregion is also important for primates (e.g., drill, chimpanzee (Pan troglodytes) and western gorilla), and African elephant (Loxodonta africana). The main threats to this ecoregion are unsustainable exploitation of firewood, overgrazing, fire damage, agricultural encroachment and hunting.

18
Ecoregion Notes
Central African Mangroves
Classified as Locally Important, this mangrove ecoregion does not contain any endemic species but it does support several threatened species, and a diverse pelagic fish community. The ecoregion is important for many species that depend on mangroves for parts of their life cycle. The mangroves provide habitat for the soft-skinned turtle (Trionyx triunguis) and host at least five species of Endangered and Critically Endangered marine turtles during the summer (of which at least four are known to occur in the hotspot). These mangrove habitats are important for large concentrations of birds that reside in the areas during migration, and also provide spawning and nursery areas for the fisheries in the Gulf of Guinea. The pelagic fish community found here has a high diversity, with 48 species in 38 families. The main threat to the ecoregion is habitat loss due to urbanization, industrialization, agriculture, and timber exploitation. Petroleum exploitation also affects the mangroves due to infrastructure development and risk of oil spills. This mangroves are also threatened by the invasive nipa palm (Nypa fruticans; an alien species from Southeast Asia), especially in the Niger Delta and the bakassi area of Cameroon.
Cross-Niger Transition Forests
Classified as Locally Important, this ecoregion harbors species typical of the Upper Guinean Forests subregion to the west and the Cross-Sanaga-Bioko Coastal Forests to the east, and can, therefore, be considered as transitional between the two. The ecoregion displays extremely low rates of endemism for a tropical forest ecoregion, with only two near-endemic species, the Vulnerable Scalter’s guenon (Cercopithecus sclateri) and crested chameleon (Chamaeleo cristatus). The main threat to the ecoregion is habitat loss relating to increasing human population densities, the effects of which date as far back as the ninth century AD. No significant sections of forest remain in the ecoregion. Conversion of forest to agriculture and bushmeat hunting constitutes the main pressures on the ecoregion. This is one of the most densely populated ecoregions in Africa.
Cross-Sanaga-Bioko Coastal Forests
Classified as Globally Outstanding, this ecoregion has very high species richness, including among butterflies, plants and all terrestrial vertebrates. This area is thought to contain the highest numbers of forest-restricted birds and mammals in Africa (Burgess et al. 2000). Primates are particularly notable, and include Preuss’s red colobus (Procolobus preussi), red-eared monkey (Cercopithecus erythrotis), crowned guenon (C. pogonias), drill, pallid needle-clawed galago (Euoticus pallidus), Pennant’s red colobus (Procolobus pennantii), the Cross River subspecies of western gorilla, and the Nigeria-Cameroon subspecies of chimpanzee (Pan troglodytes ellioti). Endemic small mammals include Bibundi bat (Chalinolo busegeria) and Cameroonian shrew (Crocidura picea). Endemic amphibians include Schneider’s banana frog (Afrixalus schneideri), Dizangue reed frog (Hyperolius bopeleti) and Werner’s river frog (Phrynobatrachus werneri). Endemic reptiles include forest chameleon (Chamaeleo camerunensis) and a species of worm lizard, Cynisca schaeferi. The greatest threats to the semi-deciduous forests of this ecoregion are hunting and agricultural conversion, as well as fires associated with traditional agricultural practices. In addition to slash-and-burn agriculture, forests have been lost to commercial logging, and fuelwood collection. Forest losses in Côte d’Ivoire and Ghana have also been driven by forest conversion for cacao and coffee production.

19
Ecoregion Notes
Guinean Montane Forests
Classified as Regionally Outstanding. The forests have been classified as the Afromontane archipelago-like regional center of endemism. The diversity and endemism of many parts of this ecoregion are not well known, with the exception of Mount Nimba. Thirty-five endemic plants and 11 paleoendemics have been recorded in the ecoregion. Four mammals found in the ecoregion are either strict endemics or narrowly shared with the surrounding habitats. The Endangered West African subspecies of chimpanzee (Pan troglodytes verus) is found in high densities around Mount Loma (Lebbie 2015). The principal threats to this ecoregion are mining for iron ore, anthropogenic fires and deforestation.
Mount Cameroon and Bioko Montane Forests
Classified as Globally Outstanding, this ecoregion falls into the Afromontane archipelago-like regional center of endemism. Exceptional levels of species diversity and endemism are found in both the flora and fauna of this ecoregion. At least 42 plant species and three genera are strictly endemic to Mount Cameroon, and another 50 species are near endemic. Twenty-nine of these near-endemic species are also found on Bioko. Over 370 bird species have been recorded here, including several endemics and two strictly endemic species. Mammals display moderate levels of diversity and endemism. The demand for new agricultural land by an expanding human population, combined with the lack of protected areas, is the major threat to this ecoregion. Areas with lower rainfall are most likely to be converted to agricultural lands. Hunting pressure, due to the demand for bushmeat, is also a threat to this ecoregion.
Niger Delta Swamp Forests
Classified as Locally Important, very little is known about the species composition of this ecoregion, as the first wildlife surveys were only conducted as recently as the late 1980s. Species that were not known from the delta or even from Nigeria as a whole were still being discovered in the 1990s. A subspecies of the Critically Endangered Pennant’s red colobus (P. p. epieni) is endemic to this ecoregion. The greatest threat to this ecoregion is the growing human population and the associated unsustainable use of natural resources, including the hunting of wild species. The delta lies in between the two most densely populated ecoregions in Africa, both of which now have depleted resources, leading their populations to look to the delta for alternatives. Oil, gas and timber exploration and exploitation also drive habitat destruction in the ecoregion.
Nigerian Lowland Forests
Classified as Bioregionally Outstanding, levels of endemism within this ecoregion are low, despite the biogeographic boundaries created by the Niger River and the Dahomey Gap. The ecoregion contains few strictly endemic plant species, although five strictly endemic animal species are found here. All forests of the ecoregion and the species they support are highly threatened by high and increasing population density in the region. Farming, logging and hunting are the main human activities that threaten the ecoregion.

20
Ecoregion Notes
São Tomé, Príncipe and Annobón Moist Lowland Forests
Classified as Globally Outstanding, this ecoregion supports exceptionally high levels of endemism at the generic, specific and subspecific levels. Around 37 endemic angiosperm plant species are found on Príncipe, 95 on São Tomé, and 20 on Annobón. Also, São Tomé is known to support 13 endemic bryophytes, one endemic gymnosperm and 10 endemic ferns and lycophytes, while Príncipe is known to support two endemic bryophytes and three endemic ferns and lycophytes. Twenty-eight endemic bird species are found on São Tomé and Príncipe, making these islands highly important for bird conservation. There are at least six mammal species endemic to São Tomé and Príncipe: two shrews and four bats. Eighteen of the 24 reptiles found on the islands are endemic, and rates of endemism above 75 percent are found for terrestrial gastropods on all three islands. The main threats to this ecoregion are the large areas of forest that are being cleared for oil palm, horticultural and cacao plantations. Overexploitation of forest resources and introduced mammal species (e.g. Cercopithecus mona, Rattus sp., Mustela nivalis and Sus scrofa) also pose a threat to the natural ecosystems of the islands.
Western Guinean Lowland Forests
Classified as Globally Outstanding, this ecoregion has been classified as part of the Upper-Guinea block of the Guineo-Congollian regional center of endemism. High species richness and endemism are found here. More than 3,000 plant species occur here, of which at least 200 are endemic. There are 15 near endemic mammal species in the ecoregion, as well as larger threatened mammals such as the Endangered West African subspecies chimpanzee. There is high diversity and endemism among herpetofauna of the ecoregion, and the reptile fauna includes three strictly endemic species. The main threats to the ecoregion are the increasing demands for farmland, fuel wood, timber, bushmeat and mineral resources, which all lead to forest loss.
Note: Descriptions of each include indices of biological importance, which use the following categories (ranging
from highest to lowest importance): Globally Outstanding; Continentally Outstanding; Regionally Outstanding;
Bioregionally Outstanding; Nationally Important; and Locally Important (following Burgess et al. 2004).
Freshwater Ecoregions The general distribution and status of freshwater biodiversity across the hotspot has been
described in some detail within the context of the set of freshwater ecoregions delineated for
Africa by Thieme et al. (2005). The 15 freshwater ecoregions overlapping the hotspot are shown
in Figure 3.3. These ecoregions typically fall within the major river basins of the hotspot (shown
in Figure 3.4). Further information on the biological importance of these ecoregions is presented
in Table 3.3, and a more detailed overview of each can be found in Appendix 2.

21
Figure 3.3 Freshwater Ecoregions of the Guinean Forests Hotspot
Source: Abell et al. (2008).
Figure 3.4 illustrates the overlap between the hotspot and the major river basins in West Africa.
The hotspot is drained by three of the 13 major river basins in Africa: the Niger; the Senegal; and
the Volta. The Senegal River basin spans four countries: Guinea; Mali; Mauritania; and Senegal.
Its three main tributaries, the Bafing, Bakoye and Faleme, all originate from the Fouta Djallon
Massif in Guinea within the hotspot. The Niger River is the longest and largest river in West
Africa, and spans 10 countries, including Algeria, Benin, Burkina Faso, Cameroon, Chad, Côte
d’Ivoire, Guinea, Mali, Niger and Nigeria. The Niger River originates in the Loma Mountains of
Sierra Leone, situated within the hotspot in the Guinea Montane Forests ecoregion, and has
numerous tributaries joining it. One of the major tributaries of Niger River is the Benue, which
merges with the Niger at Lokoya in Nigeria. The Volta River basin spans six countries: Benin,
Burkina Faso, Côte d’Ivoire, Ghana, Togo, and Mali. The area of the hotspot directly west of the
Dahomey Gap is constituted by this ecoregion. The three major tributaries of the Volta River are:
the White Volta, the Black Volta (both of which originate in Ghana) and the Oti (originating in
Burkina Faso), which together drain the plateau in the north, the Atakora Mountains in the east,
and several highland areas in the west.

22
Figure 3.4 Major River Basins of the Guinean Forests Hotspot
Source: ArcGIS 10.0 Data Package.
Additional large rivers draining the countries of the hotspot include the Gambia River, which
stems from the Fouta Djallon Massif of Guinea, the Sewa River of Sierra Leone, which has many
of its tributaries arising from the Loma Mountains and Tingi Hills, the Cross River which is the
main river of southeastern Nigeria, and the Sanaga River in Cameroon.
Table 3.3 Biological Importance and Main Threats to the Major Freshwater Ecoregions of the Hotspot
Ecoregion Notes
Ashanti
Classified as Bioregionally Outstanding, this ecoregion has around 10 percent of its fish fauna endemic, including several highly restricted-range species. Fourteen percent of the amphibians in the ecoregion are endemic. The ecoregion is also rich in mollusks, and provides important breeding and resting habitats for aquatic birds (Wetlands International 2002). The major threat to this ecoregion is the increasing human presence, which is resulting in the conversion of lands for agriculture and human settlements.

23
Ecoregion Notes
Bight Drainages
Classified as Continentally Outstanding, this ecoregion is lower in terms of endemism, although it supports locally high species richness. Six endemic amphibians, six endemic fish and three endemic mollusks are found in the ecoregion. It is also important for several non-endemic, yet threatened (IUCN 2015a) species, including the Vulnerable West African manatee (Trichechus senegalensis), the Vulnerable hippopotamus (Hippopotamus amphibius) and the Vulnerable West African dwarf crocodile (Osteolaemus tetraspis), as well as providing important migratory and feeding habitats for aquatic birds. The major threat to this ecoregion is further deforestation, runoff from agricultural lands, and pollution driven by population increases in the ecoregion.
Eburneo
Classified as Nationally Important, this ecoregion has high richness of aquatic mollusks, with 33 known species, the majority of which are snails, of which four are endemic (and many others near endemic). One hundred and thirty fish species, including 10 endemics, have been recorded in this ecoregion. The brackish lagoons found here support the Vulnerable west African manatee, while the Endangered pygmy hippopotamus lives along the forested streams. The major threat to this ecoregion is the ongoing conversion of forests for agricultural use, and the subsequent pollution from agricultural practices. The loss of connectivity caused by dams, and changes in the riverine hydrology also threaten the ecoregion.
Fouta-Djallon
Classified as Bioregionally Outstanding, this ecoregion is characterized by isolated habitats with waterfalls and rapids, which have restricted the colonization of species downstream and encouraged evolution of species that are unique to these rivers. Sixty fish species are described in the ecoregion, with one quarter of these being endemic species adapted to headwater streams. Nearly all endemic species are cyprinids. The major threat to this ecoregion is traditional slash and burn agriculture, which has led to loss of the majority of the forest cover, affecting freshwater systems (e.g. through erosion and sedimentation). Other threats include dam construction and pollution.
Lower Niger-Benue
Classified as Continentally Outstanding, this ecoregion has a biota typical of the Nilo-Sudanian bioregion. Around 202 fish species adapted to seasonal flooding live within the ecoregion. Of these, 17 are endemic, including the Vulnerable freshwater stingray (Dasyatis garouaensis). The west African manatee resides in the Lower Niger and travels upstream in the wet season, as do many fish species. Of the 88 frog species in the ecoregion 16 are likely to be endemic to the surrounding forests, woodlands and wetlands. Many Palearctic migratory birds are hosted by the Niger River, including ducks and geese, storks and herons. The main threats to the ecoregion are dam construction, drought, population growth, habitat conversion for agricultural, and pollution from agriculture and industry.

24
Ecoregion Notes
Mount Nimba
Classified as Bioregionally Outstanding, Mount Nimba’s high elevation, combined with the presence of rapids and waterfalls, has led to isolation, and high endemism of aquatic species, despite only moderate richness. Endemic aquatic fauna include frogs, fish, one freshwater crab, as well as the Endangered Mount Nimba otter shrew (Micropotamogale lamottei). The Near Threatened Cape clawless otter (Aonyx capensis) lives in the mountain streams. Species richness is notably high among aquatic invertebrates. Reophytes (which are plants adapted to living in running water) dominate the riparian vegetation. The main threats to the ecoregion are land conversion human habitation and mining. Following the Ivorian political crisis, the Mount Nimba area was subject to massive infiltration and exploitation.
Niger Delta
A rich freshwater fauna is found in the Niger Delta, including five monotypic fish families, which is the highest concentration in the world. Such higher taxonomic endemism warrants the Niger Delta’s classification as Globally Outstanding. Twenty of the 150 freshwater fish found in the ecoregion are endemic. The Vulnerable freshwater stingray and the Endangered thorny freshwater stingray (Urogymnus ukpam) are found in the delta. Sixty percent of Nigeria’s mangrove forests are situated in the Niger Delta. The mangrove forests and freshwater swamp forests provide habitats for aquatic mammals, mollusks, reptiles and amphibians, and are important for numerous waterbirds. The main threats to the Niger Delta are extensive logging for commercial timber, population growth, and access routes created as part of infrastructure development projects.
Northern Gulf of Guinea Drainages- Bioko
Classified as Globally Outstanding, the coastal rivers and streams that feed into the Gulf of Guinea support a rich aquatic fauna. The extensive mangroves of the ecoregion’s estuaries are highly productive habitats, and provide nurseries and breeding grounds for crustaceans and fish. More than 200 fish species inhabit the waters of the ecoregion, and 40 of these are considered to be near or strict endemics. Around one-quarter of the approximately 130 water-dependent amphibian species found in the ecoregion are endemic. Twelve of the 48 dragonfly species found in the ecoregion are endemic to it, of which four are endemic to the island of Bioko. Aquatic mammals that inhabit the ecoregion include African clawless otter, African water rat (Colomys goslingi), giant otter shrew (Potamogale velox), hippopotamus, spot-necked otter (Lutra maculicollis) and the Vulnerable West African manatee. The main threats to the ecoregion are changes in habitat due to logging and agriculture. The mangroves of the ecoregion have suffered from high levels of deforestation.

25
Ecoregion Notes
Northern Upper Guinea
Classified as Continentally Outstanding, this ecoregion, together with Southern Upper Guinea, Fouta Djallon and Mount Nimba, forms the Upper Guinean bioregion, which has a distinct fish fauna. Around 28 percent of the 160 fish species found in the coastal streams and rivers are endemic. Ten endemic frogs, four endemic freshwater crabs, two endemic dragonflies and five endemic mollusks live within the waters of the ecoregion. Overwintering birds are found on the floodplains. Mangrove forests provide breeding and spawning grounds for many species of fish, insects and shellfish. A large variety of aquatic reptiles and mammals are found within the ecoregion, including all three species of African crocodile, the Vulnerable West African manatee, and the Endangered pygmy hippopotamus. Major threats to the ecoregion are the destruction of mangrove forests, particularly for timber and charcoal, and for oil and gas exploration. This has resulted in the loss of around 50 percent of their area in 40 years. Land-use changes driven by small-scale mining, and rice production also pose a threat.
S. Tomé and Príncipe- Annobón
Classified as Bioregionally Outstanding, this ecoregion has extremely low overall freshwater faunal richness but high levels of endemism among certain taxa. Nine species of amphibian live in the ecoregion, all of which are endemic. Only two species of freshwater fish and three species of freshwater mollusk are found on the islands. The ecoregion also supports the endemic and Critically Endangered Príncipe dropwing dragonfly (Trithemis nigra), an endemic freshwater crab (Potamonautes margaritarius) and four species of endemic freshwater shrimps (Atya intermedia; A. sulcatipes; Macrobrachium zariquieyi and M. chevalieri). The main threat to the ecoregion is the removal of primary forest, which is driven by land privatization.
Southern Upper Guinea
Classified as Bioregionally Outstanding, this ecoregion is characterized by relatively short and partly torrential rivers and streams, which support a highly endemic freshwater fish and crab fauna. Around one fifth of the 151 fish species in the ecoregion are endemic, with particularly high levels of endemism within Cyprinodontidae, Cyprinidae and Cichlidae families. Many of these fish are adapted to life in fast-flowing rivers with rocky bottoms. Rare mammals are also found in the ecoregion, including the Vulnerable West African manatee, the Endangered pygmy hippopotamus and the Endangered and endemic Mount Nimba otter shrew. Eleven of the 52 amphibian species present are endemic. Major threats to the ecoregion include anthropogenic pressures associated with agriculture, timber and fuel wood extraction, bushmeat hunting, and extraction of mineral resources.
Upper Niger
Classified as Nationally Important, this ecoregion is home to a rich fish fauna, with species specialized to live in steep and rapidly flowing waters. This specialization is distinguishing for the ecoregion’s aquatic biodiversity. 150 fish species are found in the ecoregion, eight of which are endemic. Several aquatic mammals, reptiles and waterbirds are found in the ecoregion, including the Vulnerable West African manatee. Major threats to this ecoregion are deforestation and land conversion for agriculture.

26
Ecoregion Notes
Western Equatorial Crater Lakes
This ecoregion is classified as Globally Outstanding, in particular due to its higher-level taxonomic endemism. The western equatorial crater lakes of Cameroon contain a highly endemic aquatic fauna, with as much as 75 percent endemism in fish. In lake Barombi Mbo, 12 of the 15 fish species present are endemic, and four of the five tilapiine genera are endemic. The lakes also support an endemic sponge and an endemic shrimp. The ecoregion also supports a species rich amphibian fauna with high endemism: one-third of nearly 60 species present are endemic to the surrounding forests. The main threat to the ecoregion is deforestation, which threatens the health of many of the lakes through soil erosion and siltation in some lake basins. Water extraction, pollution, and unsustainable fishing are also impacting the lakes of the ecoregion. Dams have compartmentalized the basin, preventing fish migration upstream.
Note: Descriptions of each include indices of biological importance, which use the following categories (ranging
from highest to lowest importance): Globally Outstanding; Continentally Outstanding; Regionally Outstanding;
Bioregionally Outstanding; Nationally Important; and Locally Important (following Thieme et al. 2005).
Marine Ecoregions The hotspot does not extend into the marine realm. Nonetheless, in order to provide context, the
marine biogeography of the West African region is briefly summarized in this section. The
hotspot borders four marine ecoregions, as defined by Spalding et al. (2007) (Figure 3.5 and
Appendix 3). These marine ecoregions all belong to the province of Gulf of Guinea, which is one
of the world’s most productive marine areas, rich in fisheries resources. The dominant feature of
this shallow ocean off the coast of western Africa is the Guinea Current. The Gulf of Guinea is
bordered to the north by the Canary Current and to the south by the Benguela Current coastal
upwelling region. Coastal geology is dominated by the Volta and Niger basins. The continental
shelf is generally narrow, extending 15-90 km offshore, and breaking at depths of approximately
100-120 meters.
There are no coral reefs in this part of Africa. Mangrove forests and swamps are the most
biologically significant coastal ecosystems in the Gulf of Guinea region, as they provide critical
breeding grounds for many fish and shrimp species, and critical habitat for a variety of other
coastal species, including mammals, reptiles, and birds. There are seven species of mangrove
native to the region, though most of the mangrove forests are dominated primarily by stands of
Rhizophora racemosa. Nigeria, Cameroon and Sierra Leone collectively host approximately
nine percent of the world’s mangrove forests by area, which represents about 42 percent of the
mangrove forests in Africa (FAO 2007). The most important mangrove stands in the hotspot are
the Niger Delta communities in Nigeria and those in Yawri Bay in Sierra Leone. The mangroves
of the Niger Delta are considered to be the largest in Africa, and the third largest in the world
(Ukwe et al. 2001). Mangrove forests in many areas of the hotspot are threatened by
unsustainable logging, pollution and Nipa palm invasion, especially in Nigeria and Cameroon.

27
Figure 3.5 Marine Ecoregions of the Guinean Forests Hotspot
Source: Spalding et al. (2007).
3.6 The Importance of Ecosystem Services in the Hotspot
Ecosystem services can be categorized into four broad groups: provisioning, regulating,
supporting and cultural services (Millennium Ecosystem Assessment 2005). A variety of services
are provided by the ecosystems found within the hotspot. These services include those that are
important at a global scale, such as climate mitigation through carbon storage and sequestration,
as well as those benefitting the local communities and individuals, such as those providing
essential products to sustain livelihoods, such as food, fuel, building materials and so on. Table
3.4 provides a broad summary of ecosystem services provided within the hotspot.

28
Table 3.4 Ecosystem Services Provided by the Guinean Forests Hotspot
Type of Service Ecosystem Service and source within
hotspot Beneficiaries
Relative Importance within the hotspot
Provisioning
Water originating from forests and used for drinking, irrigation,
industrial use, energy generation and fishing.
All residents of the hotspot area
Highly important in hotspot and throughout
drainages.
Food and medicine from forest fauna (e.g.
bushmeat) and flora.
Rural communities and some urban areas within
the hotspot. Locally important
Timber for building, firewood and industries
Local communities and national economies
Highly significant in the hotspot and regionally
Fishery in freshwater and marine systems
All residents of the hotspot
Highly important within the hotspot
Regulating
Micro-climate regulation by forests
All residents of the hotspot
Locally important throughout the hotspot
Carbon storage and sequestration leading to
climate change mitigation
All human kind Globally important
Sediment retention Communities within the
hotspot Significant throughout
the hotspot
Forests provide catchment protection, regulating water flows
and water quality
Local communities within the hotspot
Locally important throughout the hotspot
Flood regulation of coastal systems by
buffering rise and fall of flood waters
Local communities within hotspot
Locally Important
Supporting
The forests of the hotspot support high
levels of biodiversity and endemism
All humankind Globally important
Breeding, spawning and nursery habitat for
commercial fish species in the Gulf of Guinea by the mangrove forests
and associated habitats
All residents of the hotspot
Highly important regionally
Cultural
Traditional sacred groves, sometimes
called “fetish groves”.
Local communities within hotspot
Locally important throughout the hotspot
Ecotourism opportunities
Local, national, and international tour
operators and tourism infrastructure support
staff
Locally important throughout the hotspot

29
3.6.1 Carbon Storage and Climate Mitigation The hotspot’s forests contain high amounts of biomass carbon, which contributes to mediating
climate change processes (regulating service) and maintaining biodiversity (supporting service)
at the global scale. These forests play an important role in the global climate balance, by emitting
or sequestering significant amounts of carbon dioxide, depending on their condition and degree
of deforestation or degradation. Undisturbed forests in the hotspot are considered as ‘carbon
sinks’, with uptake of CO2 exceeding emissions. Conversely, when forests are disturbed through
logging, farming, or other utilization activities, they become CO2 emitters. The hotspot currently
contains a mean above-ground biomass carbon content of 160 tonnes per hectare (Lindsell and
Klop 2013), increasing to 300 tonnes per hectare in more intact areas.
3.6.2 Timber and Non-Timber Forest Products At the national and local levels, the hotspot’s forests provide a range of ecosystem services for a
population of around 200 million, generally poor, people. These services include supplying
timber and other building materials, fuel for cooking, in the form of either firewood or charcoal,
food (e.g. fruit, fungi, meat) as well as medicines (Norris et al. 2010).
Forestry as a production sector in the hotspot can be divided into two broad categories; large
scale and smaller-scale exploitation. Large scale includes commercial logging and timber
extraction, and plantation forestry (see Chapter 5 for more details). Smaller scale includes local
or artisanal exploitation for local use and domestic markets.
Hunting traditions are strong in the Guinean Forest countries, and, for rural people in the hotspot,
bushmeat provides a major source of protein for human consumption (see Chapters 5 and 8 for
more detail).
3.6.3 Water Services
The hotspot’s forests also play essential roles in providing various hydrological functions, such
as driving the water cycle itself, protecting water quality, regulating water flows, controlling soil
salinity, controlling erosion and sediment deposition, and maintaining aquatic habitats (Ceperley
et al. 2010; Leh et al. 2013), which are essential to the persistence and wellbeing of local
communities.
Freshwater ecosystems provide immense benefits to local and national economies and provide
the basis for the livelihoods of many of the poorest people within the hotspot (Smith et al. 2009).
Benefits include flood regulation, where functioning wetlands buffer the rise and fall of
floodwaters, provision and purification of water for drinking, and many direct benefits such as
provision of building materials, nutrient rich floodplain pastures, medicines, and food such as
from the inland fisheries.
From a West African perspective, the major ecosystem service values from water are realised
outside the hotspot boundaries, where there is less rainfall and hence water is a more important
service. Within the hotspot itself, water supply is generally not limiting and most major cities are

30
supplied from local rivers or existing large dams. Most agriculture in the hotspot is also rain fed,
including so-called ‘upland rice’, which is sewn directly into the soil during the rainy season.
The most important catchment within the region is the Fouta Djallon Massif (see Figure 3.1),
which serves as the water catchment area for a number of the key rivers that flow outside of the
hotspot, most notably the Niger and Senegal Rivers.
3.6.4 Coastal Services
Of the estimated 85 million people living in the hotspot, more than 40 percent live in coastal
areas and are dependent on lagoons, estuaries, creeks and inshore waters for their sustenance and
socio-economic well-being (IGCC 2010). Many people are also reliant on fish protein, which
constitutes between 40 and 80 percent of total annual protein consumed per capita (IGCC 2006).
Mangrove habitats and coastal lagoons in West Africa are acknowledged as providing protection
against floods, storm surges and erosion (Dahdouh-Guebas et al. 2005, Das and Vincent 2009).
They are also highly important in nutrient and organic matter processing, sediment control and
for the provisioning services (e.g. fisheries) they provide, as well as serving as both a source and
sink for nutrients and sediments for other inshore marine habitats such as seagrass beds (Duke et
al. 2007, Dorenbosch et al. 2004; Walters et al. 2008, Polidoro et al. 2010). Mangroves sequester
up to 25.5 million tons of carbon per year (Ong 1993) and provide more than 10 percent of
essential organic carbon to the global oceans (Dodd and Ong 2008).
Mangrove areas are critical nursing and spawning grounds for many fish and shrimp species
(Mumby et al. 2004; Ellison 2008), with offshore commercial fishing in the hotspot relying on
mangroves functioning as nursery grounds for many fish species (UNEP 2007).
3.6.5 Tourism Services
Ecosystems in the hotspot provide ecotourism opportunities and sites for recreation activities
(cultural). In 2005, West Africa had the strongest tourism performance of the five African
regions (North Africa, West Africa, Central Africa, East Africa and Southern Africa) in terms of
international tourism receipts growth, with a 21 percent increase compared with 2004. This
provided hope that the region would experience a strong growth in tourism. However, this has
not happened with civil disturbance, human disease outbreaks, and a persistent poor governance
opinion in the minds of tourists, all serving to keep international tourist numbers low, especially
in the rainforest regions. By 2012, nine West African countries were among the least globally
competitive in terms of tourism. Nevertheless, the region still attracted over 4.5 million visitors
and generated USD 3.2 billion in revenue from the tourism sector that year (Weigert 2015).
Throughout the hotspot, and especially in Benin, Ghana and Togo, traditional sacred groves
(sometimes called ‘fetish groves’) are designated as areas where resource harvest and, even,
entrance by people are highly restricted. These sacred groves are found in all villages and can
provide valuable, albeit small, areas of protected forest in farmed landscapes.

31
3.7 Species Diversity and Endemism 3.7.1 Terrestrial Species Diversity and Endemism
The impressive levels of biodiversity and endemism contained within the Guinean Forests
Hotspot are summarized by major taxonomic groups in Table 3.5, and described in the following
sections.
Table 3.5 Summary of Species Richness, Endemism and Global Threat Status in the Guinean Forests Hotspot
Taxonomic Group Status of Red List
Assessment
Number of Species in
Hotspot
Species Assessed for
the IUCN Red List
Number of Endemic Species
Assessed
Percentage Endemic
Terrestrial realm
Mammals Complete 416 416 65 16
Birds Complete 917 917 48 5
Reptiles Partial >107 107 20 19
Amphibians Complete 269 269 118 44
Butterflies Partial >1,000 141 1 1
Plants Partial >9,000 1,030 N/A N/A
Freshwater realm
Bony fishes Complete 632 632 N/A N/A
Odonates Complete 316 316 N/A N/A
Crabs and shrimps Complete 72 72 N/A N/A
Mollusks Complete 105 105 N/A N/A
Plants Partial >397 397 N/A N/A
Marine realm
Mammals Complete 28 28 2 7
Reptiles Complete 5 5 0 0
Bony Fishes Partial >650 104 N/A N/A
Sharks and rays Complete 87 87 0 0
Crustaceans Complete 16 16 0 0
Mollusks Partial >38 38 N/A N/A
Echinoderms Partial >6 6 N/A N/A
Stony corals Complete 8 8 0 0
Notes: Species are categorized as being endemic to the hotspot if the following criteria are met: a) for terrestrial
species, they found only within the hotspot boundaries to within a 25 km buffer zone bordering the hotspot; or b) for
freshwater species, they are only known from Level 8 subcatchments entirely within or intercepting the hotspot
boundaries. NA = data not available.

32
Amphibians Amphibians are relatively poorly documented in the hotspot but there are 269 recorded species
and more likely to be discovered in the future (for instance, 11 new species were discovered in
the last decade). Of these speciesmore than 80 are endemic, with particularly large numbers of
endemics in the Cameroon Highlands. Almost one-third of the hotspot’s amphibian species are
considered globally threatened (Mallon et al. 2015); more information on this topic is provided
in Chapter 4.
Birds The bird diversity in the hotspot is impressive. There are thought to be 917 bird species present,
of which 48 are endemic (Mittermeier et al. 2004). BirdLife International has recognized six
Endemic Bird Areas (EBAs) as lying partly or entirely within the hotspot (BirdLife International
2013a). These are: the Upper Guinea Forests (15 endemic bird species); the Cameroon
Mountains (30 endemic bird species); the island of São Tomé (21 endemic bird species); the
island of Príncipe (11 endemic bird species); the island of Annobón (three endemic bird species);
and part of the Cameroon and Gabon lowlands (six endemic bird species).
Butterflies Throughout the hotspot, information on the status of butterflies is still quite limited, with only
141 species currently assessed on the IUCN Red List. Information is better for a few individual
sites. For instance, the Oban Division of Cross River National Park in Nigeria is thought to
support more than 1,000 species of butterfly. Similarly, Gola National Park is another example
of a site with an extremely high diversity of butterflies. It is estimated that the site contains in
excess of 600 species, or 80 percent of all 750 species currently known from Sierra Leone.
Mammals The Guinean Forests are among the world’s foremost hotspots for mammalian diversity. An
estimated 390 terrestrial species are found in the hotspot, representing over one-quarter of the
roughly 1,100 total mammal species found on the continent of Africa. More than 60 mammals
are endemic to the hotspot, and noteworthy endemic species include two of the rarest antelopes
in the world: the Endangered Jentink’s duiker and the Vulnerable zebra duiker (C. zebra). Other
globally threatened species include the Endangered pygmy hippopotamus and the Vulnerable
Liberian mongoose (Liberiictis kuhnii).
The hotspot is renowned for its primate diversity, as it contains 30 species, six of which are
endemic to the Upper Guinean Forests subregion, and nine to the Nigeria Cameroon subregion.
There are also four endemic primate subspecies on Bioko Island. Among the primate species
found in the hotspot, the striking Diana monkey (Cercopithecus diana) is thought to be an
important indicator of forest health because of its dependence on high-canopy forests, while
olive colobus (Procolobus verus) is the world’s smallest colobine monkey. The hotspot is also
home to two endemic subspecies of chimpanzee. West African chimpanzee (Pan troglodytes
verus) occurs in scattered populations, mainly in Côte d’Ivoire and Guinea; it is assessed as
Endangered at the subspecific level, making it one of the most threatened subspecies of
chimpanzee (Humle et al. 2008). The Nigeria-Cameroon chimpanzee (P. t. ellioti) is even more
threatened than its western neighbour, although it is also assessed as Endangered. As the name
suggests, it is found only in Nigeria and Cameroon, where it has a restricted distribution and a

33
population estimated at only 6,500 individuals (Oates et al. 2008b). The forests along the
Nigerian-Cameroonian border are also home to a small population of an endemic subspecies of
western gorilla: Cross River gorilla (Gorilla gorilla diehli). This subspecies has a very restricted
distribution, with a total population of less than 300 individuals, fragmented into 9-11
subpopulations, some of which are in tenuous reproductive contact with each other, meaning that
the subspecies is assessed as Critically Endangered (Oates et al. 2008a).
Plants The hotspot is estimated to contain more than 9,000 vascular plant species, of which around 20
percent are thought to be endemic (Mittermeier et al. 2004). Within the hotspot, high levels of
local endemism at the species level can be found. Taï National Park in Côte d’Ivoire, Mount
Nimba on the Liberia-Guinea-Côte d’Ivoire border, Cross River National Park in Nigeria, and
Mount Cameroon are especially species rich areas in the hotspot in terms of plants. Nearly 2,500
plant species have been recorded on Mount Cameroon alone. Because of their relative isolation
from the rest of the hotspot, the Gulf of Guinea Islands also support a highly endemic flora, and
approximately 185 species are endemic to these islands.
Reptiles The diversity of reptile species is poorly documented in western Africa, although it is suggested
that more than 200 species are found in the region, of which a quarter are likely to be endemic.
Eighteen of the 24 reptiles found on the islands of São Tomé, Príncipe and Annobón are
endemic, and all three species of African crocodiles are found within the hotspot.
3.7.2 Freshwater Species Diversity and Endemism An assessment of freshwater biodiversity across the western Africa region reported a high
diversity of aquatic species with high levels of endemism (Smith et al. 2009). Within the
freshwater realm (as can be seen in Table 3.5), although many freshwater species are restricted
range and endemic to the western Africa region, because the hotspot boundary does not follow
catchment boundaries, these species are also present outside of the hotspot itself so cannot be
classed as hotspot endemics. Lake endemic species have also been mapped to their presence
within subcatchments, and so will also appear to be present outside the hotspot in many cases. It
is, therefore, difficult to determine the exact number of freshwater species endemic to the
hotspot. Around 14 percent of all species assessed are regionally threatened according to IUCN
Red List Categories and Criteria (Smith et al. 2009).
The majority of threatened species are found in the Niger Delta and in southeastern Nigeria,
largely reflecting the greater levels of development and population density in these areas. Five
areas have been identified as key centers of species diversity (Smith et al. 2009):
i. The southern coastal area of Guinea;
ii. The lower River Jong in Sierra Leone;
iii. Ebrié Lagoon in Côte d’Ivoire;
iv. Lower Ogun and Oueme Rivers and their coastal lagoons in Benin, and;
v. Western Nigeria and the Niger Delta to the lower Cross River in southern Nigeria.

34
The combined diversity of fishes, mollusks and odonates (dragonflies and damselflies) is
exceptionally high in these areas. Levels of regional endemism are high, with over a third of the
assessed species found only in western Africa. The majority of these endemic species are found
within the coastal drainages of the Upper Guinean Forests subregion from southern Guinea to
Liberia and in the basins of western Ghana and eastern Côte d’Ivoire.
The hotspot supports a remarkable diversity of freshwater fishes: 1,281 species, of which
35 percent are considered endemic (Paugy et al. 2003). About one-quarter of the world’s 350
species of killifish are found in the hotspot, around half of which are endemic. Cichlids are also
prominent, with more than half of the 60-plus species present endemic to the hotspot. Four of the
five endemic genera of cichlids are found only in Lake BarombiMbo in southwest Cameroon
(Mittermeier et al. 2004). The hotspot also supports a high diversity of many other freshwater
taxa, including freshwater crustaceans, mollusks, odonates and freshwater plants (Smith et al.
2009).
Coastal wetlands provide unique ecological conditions and habitats for Palaearctic migratory
birds that overwinter in West Africa every year. There are approximately 148 species of coastal
and marine seabirds that are reported to occur in the Gulf of Guinea region. A number of seabirds
breed in the area between Sierra Leone and Congo, including several species of tern, white-tailed
tropicbird (Phaethon lepturus), brown booby (Sula leucogaster), and both black and brown
noddies (Anous minutus and A. stolidus).
3.7.3 Species Richness Patterns The distribution ranges of all mapped species known to be present within the hotspot were used
to create maps of species richness for terrestrial and freshwater species (Figures 3.6 and 3.7,
respectively), and these provide a means to broadly identify those areas within the hotspot where
the highest numbers of species are concentrated. Centers of species richness for terrestrial
species include the Cameroon-Highlands-to-lowland-forest transition in Cameroon and Nigeria,
and the Guinean-lowland-to-montane-forest transitions on high altitude peaks and plateaus in
Guinea, Sierra Leone, Liberia and Côte d’Ivoire, including the Mount Nimba area. Centers of
species richness for freshwater species include the Niger Delta, the Cameroon Highlands (which
include the region’s many crater lakes), the lower courses of the many coastal rivers in Sierra
Leone, Liberia, Côte d’Ivoire, western Ghana, and the lower Ogun drainage in western Nigeria.

35
Figure 3.6 Distribution of Terrestrial Species within the Guinean Forests Hotspot
Source: IUCN Red List version 2013.
Note: Species richness is represented as the number of species recorded within each hexagon grid cell.
3.7.4 Marine Species Diversity and Endemism
The highest marine fish diversity in the Eastern Central Atlantic is found in the Gulf of Guinea
and its near-shore marine habitats, including estuaries, deltas and coastal lagoons. More than 650
species of marine bony fish and 87 species of cartilaginous fish (sharks and rays), as well as at
least five species of shrimps, are found in the area between Sierra Leone and Cameroon,
including the offshore islands. More than 54 percent of the region’s sharks and rays with
sufficient data for an assessment are globally threatened (IUCN 2015a). Recently completed
(November 2015) global assessments for all of the deep-water and near-shore marine bony fishes
indicate that approximately five percent of all marine fishes are threatened but with significantly
higher proportions of threatened near-shore fishes compared to deep-water fishes. Near-shore
bony fish families with relatively high species richness in the region include blennies
(Blennidae), gobies (Gobiidae), wrasses (Labridae), groupers (Serranidae), jacks (Carangidae),
seabreams (Sparidae) and croakers (Sciaenidae), with the latter four families being heavily
targeted by coastal fisheries. Shrimp species of the families Penaeidae and Palemonidae are also
targeted by fisheries in the region. Several endemic species of goby (Didogobius amicuscaridis,
Gorogobius stevcici), clingfish (Apletodon wirtzi) and wrasse (Clepticus africanus, Thalasso
manewtoni) are known only from around the offshore islands of São Tomé and Príncipe.

36
Figure 3.7 Distribution of Freshwater Species within the Guinean Forests Hotspot
Notes: Species richness is represented as the number of species recorded within each river/lake subcatchment, where
a subcatchment is mapped according to the HydroBASIN Level 8 catchment GIS layer.
4. CONSERVATION OUTCOMES DEFINED FOR THE HOTSPOT 4.1 Introduction Selection of conservation outcomes relies on the understanding that biodiversity is not measured
in any single unit. Rather, it is distributed across a hierarchical continuum of ecological scales
that can be categorized into three levels: i) species; ii) sites; and iii) broad landscapes (or
ecosystem-level units), termed corridors. These levels interlock geographically through the
occurrence of species at sites and species and sites within corridors. Given the threats to
biodiversity at each of these three levels, targets for conservation can be set in terms of
‘extinctions avoided’ (species outcomes), ‘areas protected’ (site outcomes) and ‘corridors
consolidated’ (corridor outcomes). Species are selected as those classified as threatened
according to the IUCN Red List of Threatened Species (hereafter known as the IUCN Red List).
Sites are identified as KBAs, places that “contribute significantly to the global persistence of
biodiversity”, for example by supporting threatened species and species with severely restricted
global distributions, and are delineated as areas of land and/or water that are actually or

37
potentially manageable as a single unit (e.g. a protected area or other managed conservation
unit). Landscape corridors are delineated to link KBAs (in particular for transfrontier areas),
secure landscape connectivity such as within river catchments, and maintain ecosystem function
and services for long-term species survival. Following this approach, quantifiable measures of
progress in the conservation of threatened biodiversity can be tracked across the Guinean Forests
Hotspot, allowing the limited resources available for conservation to be targeted more
effectively.
Defining conservation outcomes is a bottom-up process that follows a standard methodology
(Langhammer et al. 2007). It starts from the definition of species-level targets, from which the
definition of site-level targets is then developed. The process requires detailed knowledge of the
conservation status of individual species. This information has been accumulating in the IUCN
Red List for more than 50 years. For the Guinean Forests Hotspot, the conservation status of
species has been comprehensively assessed for many taxonomic groups but there are notable
gaps in the assessments of plants and some reptiles. Identification of KBAs is also incomplete for
some taxa and regions of the hotspot with the identification of terrestrial KBAs in the Lower
Guinean Forests subregion, in particular, requiring additional work. Additional information on
the availability of information on species and site outcomes is given in the relevant sections
below.
Conservation outcomes were defined using best-available species distribution data, followed by
expert review and validation procedures involving confirmation of species presence in the
hotspot. KBA information collated for the hotspot comes from three main data sets: i) data on
Important Bird Areas (IBAs) compiled by BirdLife International and stored on the World
Biodiversity Database (WBDB), from where it was extracted and provided to IUCN for use in
the profile in November 2013; ii) data on terrestrial KBAs in the Upper Guinean Forest
subregion compiled by Conservation International between 2008-2010, as extracted from the
WBDB and provided to IUCN in November 2013; and iii) data on the freshwater KBAs
identified by IUCN’s Global Species Programme on the basis of Red List assessments of
freshwater taxa completed in 2009.
Stakeholder input to supplement and verify the information on conservation outcomes was
provided through three workshops, responses to circulated questionnaires, and consultations with
BirdLife International and its partner NGOs in the hotspot countries in October 2015. The
information was also cross-checked with the results of the IUCN/UNEP situation analysis on
large terrestrial and freshwater fauna in west and central Africa (Mallon et al. 2015). It must be
noted, however, that the outbreak of Ebola in the region made it difficult to obtain the desired
level of stakeholder input and, consequently, information on additional outcomes may be
forthcoming at a later date. The number of experts previously consulted in compilation of the
species Red List assessments used to determine conservation outcomes within the hotspot is
estimated to exceed 150 people, including from within the region and from the wider
international community of species experts, while many other experts were involved in the
consultations and research undertaken by the BirdLife Partnership that led to the original
identification of IBAs, which underpin much of the analysis of site outcomes.

38
4.2 Species Outcomes At least 936 species found in the hotspot are globally threatened (Table 4.1). This number is
likely to increase significantly as more species are assessed in the future, particularly in groups
such as plants and reptiles. A significant proportion of the species that have been assessed are not
well-known, with 389 species (8 percent of those assessed to date) being classified as Data
Deficient, meaning that there is insufficient information available to make a reliable assessment
of their current risk of extinction using the IUCN Red List criteria. The globally threatened
species include 135 assessed as Critically Endangered: the highest category of threat.
Table 4.1 Globally Threatened Species in the Guinean Forests Hotspot
Taxonomic Group Global Threat Status
Total CR EN VU
Mammals1 6 29 30 65
Birds1 5 12 31 48
Reptiles2,3,4
2 3 6 11
Amphibians1 13 42 22 77
Bony fishes1 35 59 78 172
Sharks and rays1 4 8 21 33
Butterflies3,4
0 0 2 2
Odonates1 4 4 8 16
Freshwater crabs and shrimps1 2 9 5 16
Mollusks1 2 6 5 13
Plants4,5
62 98 323 483
Total 135 270 531 936
Source: IUCN Red List version 2013; exported in January 2014. 1All known described species.
2Species endemic to the hotspot.
3Random representative sample.
4Ad hoc selection.
5Species within selected families of aquatic plant.
The distribution of the major taxonomic groupings of threatened species, combined across all
three realms, in each of the countries in the hotspot (Table 4.2) shows the highest proportion are
located in Cameroon (61 percent) followed by Nigeria (31 percent), Côte d’Ivoire (22 percent)
and Ghana (22 percent). The full list of species outcomes for each country within the hotspot is
presented in Appendix 4.
The main information source used for identifying species known to occur within the hotspot was
the IUCN Species Information Service (SIS), the database of species information supporting the
IUCN Red List. Where available, the analysis incorporated additional information on more
recently assessed species that became available after the data were exported in January 2014.
Species distribution files (GIS shape files) were obtained for as many of these species as
possible, although not all species, especially plants, had been mapped. Species ranges
intersecting the hotspot were identified to generate a list of all species with distribution ranges
overlapping or contained within the hotspot. This list of species represents the list of species
considered to be present within the hotspot and upon which the hotspot analysis of biodiversity is
based.

39
Table 4.2. Breakdown of Globally Threatened Species by Country and Major Taxonomic Group
Taxonomic Group
Distribution by Country
Ben
in
Cam
ero
on
Cô
te
d’Ivo
ire
Eq
uato
ria
l
Gu
inea
Gh
an
a
Gu
inea
Lib
eri
a
Nig
eri
a
São
To
mé
& P
rín
cip
e
Sie
rra
Leo
ne
To
go
Mammals 10 45 20 19 13 20 18 21 5 14 8
Birds 10 23 20 6 17 18 13 18 13 14 10
Reptiles 4 5 5 6 4 6 5 4 5 5 3
Amphibians 0 61 14 2 11 5 4 13 3 2 1
Bony fishes1 10 82 24 12 21 57 31 31 6 27 7
Sharks and rays 16 20 20 13 20 24 21 24 7 21 15
Butterflies 0 0 0 0 2 0 0 0 0 0 0
Odonates 1 10 1 2 0 0 2 7 1 3 0
Freshwater crabs and shrimps 0 4 0 1 1 3 5 5 1 0 0
Mollusks1 0 6 2 0 0 0 1 0 1 3 0
Plants 14 380 117 63 127 25 51 179 36 60 10
Total 65 636 223 124 216 158 151 302 78 149 54
Percentage of the total2 7 61 22 11 22 15 16 31 8 15 6
Source: IUCN Red List version 2013; exported in January 2014. 1Primarily freshwater species as the majority of marine species were yet to be assessed in January 2014.
2Calculated as a percentage of the 936 globally threatened species found in the hotspot; these figures do not add up
to 100 percent because many species are found in more than one country.
Species with distribution ranges fully enclosed within the hotspot boundaries were considered to
be endemic to the hotspot. A 25 km buffer beyond the hotspot boundary was employed to
account for the lack of precision in mapping species ranges close to the hotspot boundary. For
species with no distribution files available, the narrative description of the species’s geographic
distribution in the species’s account on the IUCN Red List was used to determine if the species
was within the hotspot or not, and (to the extent possible) whether it was endemic to the hotspot
or not.
A number of taxonomic groups are considered to have been comprehensively assessed. For some
taxonomic groups, only a random sample of species has been assessed (e.g. butterflies and
reptiles). In other cases, an ad hoc list of species has been assessed, with a likely bias towards
those expected to be threatened. Although the main focus of this profile is the terrestrial and
freshwater environments, species found in near-shore marine habitats were also included where
information was available.
The following overview of threatened species within the hotspot is compiled separately for each
of the three realms: terrestrial; freshwater; and marine (focusing on near-shore habitats adjacent
to the hotspot boundary). This distinction is made in order to highlight threatened biodiversity
within each of the realms, as some types of threat may be realm specific and might otherwise not
be noted.

40
4.2.1 Terrestrial Realm
Plants Around half of the 1,030 plant species in the hotspot so far assessed for the IUCN Red List are
threatened. For these species, a broad spatial analysis shows a significant gap in coverage by the
protected areas network in the hotspot (Burgess et al. 2005). This gap in spatial cover of
protected areas is somewhat reduced by the inclusion of forest reserves but in reality many of
these reserves may provide little real conservation benefit.
Two species are believed to be extinct but little is known about either. Byttneria ivorensis (EX),
a tree species in the family Sterculiaceae was identified from a single herbarium specimen
collected from Côte d’Ivoire in 1896 and Argocoffeopsis lemblinii (EX) is another tree species
also known only from a single herbarium specimen. Sixty-two species are Critically Endangered,
including many species of orchids, legumes and members of the coffee family (Rubiaceae). The
majority of these species are found in Cameroon, which has to date been the main geographic
focus for assessment of plant species for the IUCN Red List. Seven of the Critically Endangered
orchid species are found in Cameroon, and many additional species assessments are in draft but
not yet published, meaning this number is likely to rise. For example, Bulbophyllum filiforme
(CR), an orchid species known only from Mount Cameroon, Korup National Park and the Niger
Delta is an epiphyte, growing in lowland evergreen forest, where its association with forest tree
species makes it vulnerable to forest clearance. Another species, in the related Burmanniaceae
family, Afrothismia winkleri (CR), is known from just five localities in Cameroon and Uganda
with recent discoveries on Mount Kupe, Korup and Banyang Mbo. As is usual for species in this
family, numbers at each site are very low and it is believed that only 16 individuals have been
seen in total.
Despite this being a forest hotspot, information on the status of trees remains very poor. For
example, six of the eight highly valued mahogany species present in the hotspot were last
assessed for the IUCN Red List in 1998 and are in need of updating. Of these species, the
African mahogany (Khaya ivorensis), which is found in five countries of the hotspot, is listed as
Vulnerable due to very high levels of exploitation, although its status has not been re-assessed
since 1998. Overall, the conservation status of very few of the important timber species has yet
been assessed. Inventories are available for many of these trees for the majority of countries in
the hotspot (see Poorter et al. 2005), so it should be possible to assess their global threat status.
The Nigeria-Cameroon border, and the Cross River National Park in particular, supports the
largest tract of remaining primary rainforest in Nigeria, and is especially rich in endemic plants,
which are thought to be threatened by degazettement of forest reserves leading to increased
urbanization, commercial plantations and logging (Borokini et al. 2014). Such species include,
Synsepalum glycydora (VU), a small tree species apparently restricted to the Oban Hills in Cross
River National Park and Degema in Rivers State, and Talbotiella eketensis (EN), a swamp forest
tree from areas around Eket and Degema, where its habitat has been seriously degraded by oil
exploration and logging activities. The area is also one of the richest in the hotspot for orchids
and commercially important species in the Rubiaceae (Droissart et al. 2011) and has generally
high levels of genetic distinctiveness (Dauby et al. 2014).

41
The endemic flora of São Tomé (Figueiredo et al. 2011) is also highly threatened, with nearly all
areas outside the Obô National Park impacted by urbanization and intensification of agroforestry
and other land-use practices. Development and expansion of oil palm plantations also represents
an increasing threat to the flora in many parts of the hotspot (Mallon et al. 2015), with cases
including São Tomé (Lopes 2012) and northwestern Cameroon (Hoyle and Levang 2012). There
are also three Critically Endangered plant species on Bioko, including a very rare species of
begonia, Begonia pelargoniflora, which is only known from four subpopulations two of which
are on Bioko and one each from the Bakossi Mountains and the adjoining Mount Nlonako in
Cameroon.
Further west in the hotspot, the Mount Nimba area is recognized for its high diversity of plant
species many of which, although not yet assessed for the IUCN Red List, will likely be
threatened, in particular due to mining activities, logging and deforestation. Of the few assessed
plant species in the western parts of the hotspot most, such as Neolemonniera clitandrifolia (EN),
a tree species occurring in low densities in Atewa Range and Cape Three Points Forest Reserves
and Ankasa Resource Reserve, are threatened by habitat loss due to agricultural expansion,
mining and logging.
In summary, the level of threat presented in Table 4.1 is not considered representative of the full
flora of the Guinean Forests, as the limited sample of species currently assessed is likely biased
towards those expected to be threatened a priori. The 1,030 terrestrial plant species from the
hotspot that have been assessed for the IUCN Red List only represent a small fraction of the
more than 9,000 species of vascular plants estimated to occur in the hotspot (see Table 3.5). A
comprehensive assessment of all species within the hotspot is, therefore, needed before the true
level of threat can be determined. It is also clear that the greatest geographic coverage of plant
species assessments is for Cameroon, with the status of species in the rest of the hotspot
remaining rather poorly known. Even within Cameroon, there remain major gaps, although
efforts are underway to expand the coverage of the global Red List, with a particular focus on
those species assessed as threatened on the Cameroon National Red List (C. Hilton-Taylor, pers
comm.).
Mammals Sixty-five of the 416 mammal species occurring in the hotspot (16 percent) are threatened,
including a number of iconic species, such as western gorilla, chimpanzee, lion (Panthera leo),
pygmy hippopotamus (near endemic to the hotspot), African elephant and drill. The primates,
rodents, shrews and bats are however the dominant (in terms of the number of species) and most
threatened groups of mammals, impacted mainly by hunting and deforestation due to agricultural
expansion and logging.
Western gorilla, found in Cameroon and Equatorial Guinea within the hotspot, is Critically
Endangered due to a combination of exceptionally high levels of hunting and disease-induced
mortality. Most protected areas have serious poaching problems and animals in almost half of the
habitat under protected status have been hit hard by Ebola. Both commercial hunting and Ebola-
induced mortality are continuing and even accelerating (Walsh et al., 2008; Ryan and Walsh
2011). Chimpanzee, which has subpopulations across much of the hotspot, is assessed as
Endangered, also due to high levels of hunting, loss of habitat and Ebola.

42
A subspecies of the black rhinoceros (Diceros bicornis longipes) is now thought to have gone
extinct in its last known habitats within the hotspot in northern Cameroon (Emslie 2012), largely
as a result of increased poaching for the international rhino horn trade fueled by civil unrest and
free flow of weapons across the region. Lion (VU), however, remains present but in small
fragmented subpopulations, with an estimated 400+ individuals remaining in western Africa
(Henschel et al. 2014) where it’s regional status is Critically Endangered. The largest numbers
are, however, thought to be in Cameroon just outside the hotspot boundaries (Mallon et al.
2015).
Pygmy hippopotamus (EN), a species near endemic to the hotspot, occurs only in Liberia, Côte
d’Ivoire, Guinea and Sierra Leone, with the majority of the population in Liberia. A suspected
population in the Niger Delta has apparently gone extinct. In 1993, it was estimated that there
were only 2,000-3,000 individuals remaining and subsequent reports of habitat loss and hunting
suggest the population has since decreased (Lewison and Oliver 2008). The species is included
in Appendix II of CITES (as Hexaprotodon liberiensis), which provides some controls on
international trade. Sapo National Park and Taï National Park are two key sites for the species. A
National Action Plan has been developed for its conservation in Liberia and is currently being
implemented (FFI and FDA, 2013).
Of the many antelope species found in the hotspot Jentink’s duiker is possibly the most
threatened, being assessed as Endangered with its population estimated to have declined to only
around 2,000 individuals, mainly as a result of ongoing habitat loss and bushmeat hunting. Being
primarily a forest species, conservation of remaining primary forest, particularly in Taï and Sapo
National Parks, is critical. This species is listed on CITES Appendix I.
Finally, African elephant (VU), Africa’s largest land mammal and an iconic species has, in
recent years, been subject to increased poaching at catastrophic rates across the wider region
suggesting that sustainable thresholds may have been crossed. Population estimates by country
are provided in the 2013 Provisional Elephant Status Report (Elephant Database and IUCN SSC
African Elephant Specialist Group 2013). Preliminary genetic evidence suggests that there may
be at least two species of African elephant, provisionally named savanna elephant and forest
elephant. Both of these postulated species occur in the hotspot, with populations of savanna
elephant being found in Côte d’Ivoire (e.g. Taï National Park), Western Ghana (e.g. Bia National
Park) and Cameroon, and small populations of forest elephant being found in Cameroon
(e.g. Korup National Park), Liberia (e.g. Sapo National Park) and Nigeria (e.g. Okomu National
Park). The current position of the African Elephant Specialist Group is that reclassification into
multiple species would be premature, and more extensive research is required (Blanc 2008).
Birds Forty-eight of the 917 birds recorded in the hotspot (five percent) are threatened. The main
threats are once again agricultural expansion, hunting, and loss of habitat due to logging. Of the
five Critically Endangered species, all appear to have highly restricted ranges within small
remaining forest fragments. São Tomé grosbeak (Neospiza concolor) and São Tomé fiscal
(Lanius newtoni) are both known from a very small area of primary forest on São Tomé (IUCN
2014), which currently remains unprotected. Dwarf olive ibis (Bostrychia bocagei) is also known
only from São Tomé, where it is confined to the catchments of the São Miguel, Xufexufe and

43
possibly the Quija rivers in the southwest, and along the Io Grande and Ana Chaves rivers in the
centre of the island (IUCN 2014). The most recent estimate puts the total population at between
50 and 250 mature individuals. Liberian greenbul (Phyllastrephus leucolepis), is only known
from a few forest fragments in southeastern Liberia but has not been recorded since its original
discovery in 1985 (IUCN 2014). The fifth Critically Endangered bird species is Príncipe thrush
(Turdus xanthorhynchus), which is endemic to the island of Príncipe. It is found only in the
remaining forests in the centre and south of the island, and has a population estimated at fewer
than 250 mature individuals.
A notably high proportion of vultures are threatened with extinction, and four Endangered and
two Vulnerable species are known from the hotspot. The distribution of White-backed vulture
(Gyps africanus) overlaps marginally with the hotspot, particularly in Ghana, Togo, Benin and
Nigeria. It is globally Endangered and has declined by more than 90 percent in western Africa,
having completely disappeared from Ghana with the exception of Mole National Park (which is
outside the hotspot boundary) and is likely extinct in Nigeria (BirdLife International 2013b).
These significant declines are, as is the case for other vulture species present (or marginally
present) in the hotspot, due to overexploitation for food and traditional medicine, lack of food
due to the severe depletion of wild ungulates and changes in methods of carcass disposal, and
secondary poisoning from carburofan and other toxins inserted into animal carcasses to kill
mammalian predators(Mallon et al. 2015 and references therein).
Three species of weavers are also Endangered. Gola malimbe (Malimbus ballmanni) is endemic
to the hotspot where it is confined to parts of the Upper Guinea rainforest in Sierra Leone (Gola
Forest), Liberia (Grande Gedeh/Sinoe County), Côte d’Ivoire (Cavally and Goin Débé Forest
Reserves) and Guinea (BirdLife International 2012). Ibadan malimbe (M. ibadanensis) is another
highly restricted-range species, found in southwestern Nigeria. The population was estimated at
around 2,500 individuals within 112 km2 of remaining forest. This can be considered a
reasonable maximum estimate of the world population since the survey covered almost all
remaining forest fragments within the species’ historical range (Manu et al. 2005, cited in
BirdLife International 2012). Forest clearance and fragmentation are listed as the main reasons
for the suspected ongoing decline in population. Bates’s weaver (Ploceus batesi) is a rare species
from southern and western Cameroon, occurring in a narrow belt from Limbé, at the foot of
Mount Cameroon, east to Moloundou (BirdLife International 2012). Plans for a 70,000 hectare
oil palm plantation threaten to significantly fragment large areas of suitable habitat in
southwestern Cameroon (Linder et al. 2012, cited in BirdLife International 2012).
Reptiles Information on reptiles is rather incomplete for the hotspot. Eleven of the 107 reptile species to
have been assessed are threatened (10 percent). However, this is likely not representative of the
state of reptiles across the hotspot, as few species east of Nigeria have been assessed. Four of the
most severely threatened reptile species in the hotspot are marine turtles (see Section 4.2.3).
Other threatened reptiles include the Critically Endangered Annobón lidless skink
(Afroablepharus annobonensis) is, as the name suggests, endemic to Annobón Island, where it is
threatened by habitat loss and, potentially, predation by introduced species. West African dwarf
crocodile is listed as Vulnerable but the assessment was completed in 1996 and requires

44
updating. Although this species is very important in the bushmeat trade, it is not currently
considered to be under threat (Mallon et al. 2015).
Amphibians Seventy-seven of the 269 amphibian species in the hotspot (29 percent) are globally threatened,
mainly due to the habitat loss/degradation resulting from expanding urban and commercial
developments, agricultural expansion, and logging. Of these species, the majority are
concentrated in Cameroon, which supports 61. Thirteen of the hotspot’s amphibians are
Critically Endangered. It should, however, be noted that the level of threat may be even higher
than currently recognized, as the increased intensity of harvesting in the region has not yet been
factored into many amphibian assessments (Mallon et al. 2015). One notable species is goliath
frog (Conraua goliath), which is the largest frog in the world at up to 3 kilograms. Within the
hotspot, it is found in southeastern Cameroon, where it is threatened by heavy harvesting for
food. This species is also exported for frog racing to countries including the United States.
As shown in Table 3.5, an estimated 44 percent of the amphibian species found in the hotspot are
endemic to it. The Cameroon Highlands, in particular, contain many highly threatened and
restricted-range endemic species and are one of the two areas of mainland Africa with the highest
diversity of amphibians (Hansen et al. 2009, Penner et al. 2011), underlining the exceptionally
high importance of the region for the conservation of amphibian diversity. As an example a
Critically Endangered restricted-range amphibian species in Cameroon, Alexteroon jynx is
known only from two localities 6 km apart on the eastern slopes of the Rumpi Hills in
southwestern Cameroon (IUCN 2014). As another example, Lake Oku clawed frog (Xenopus
longipes) is endemic to Lake Oku on Mount Oku, western Cameroon (IUCN 2014). The species
is unable to move across land effectively and is restricted to this shallow, eutrophic lake where it
fills the ecological niche typical of predatory fishes. The main threat in this case is the risk of
introduction of a predatory fish species. The Endangered Mertens’ egg frog (Leptodactylodon
mertensi) and its Critically Endangered cogener, L. erythrogaster, co-exist on Mount Manenguba
around springs and streams in submontane and lower montane forest. These species are thought
to be fairly resilient to disturbance but the ongoing degradation of habitat due to expansion of
farming activities, coupled with their highly restricted range, puts them at risk. As a final
example, of the highly threatened and restricted-range frogs of the Cameroon Highlands,
Astylosternus nganhanus is only known from Mount Nghanha on the Adamawa Plateau, where it
is at risk from habitat loss due to farming expansion (IUCN 2014).
Although Cameroon is the clear center for threatened amphibians in the hotspot, there are also a
number of threatened species in other countries. In Ghana, the Critically Endangered frog,
Phrynobatrachus intermedius, is known from only two sites in Ankasa Resource Reserve, where
it occurs in swampy areas within primary rainforest. It is threatened by forest degradation, in
particular due to plantations of raffia palm. The Critically Endangered Mount Nimba viviparous
toad (Nimbaphrynoides occidentalis) is only known from the Mount Nimba area in Guinea, Côte
d’Ivoire and Liberia where, although partly located within a World Heritage Site, it is threatened
by a proposed iron ore mining concession and the arrival of large numbers of refugees
(UNESCO 2013). Finally, the Critically Endangered Taï toad (Amietophrynus taiensis) is a very
rare species only known from Taï National Park in Côte d’Ivoire and nearby Gola Forest Reserve
in Sierra Leone. Very little is known about this species which could benefit from additional
survey and research.

45
Butterflies Information on the conservation status of butterflies within the hotspot remains limited with only
141 species so far assessed for the IUCN Red List, of which only two are considered threatened:
Atewa dotted border (Mylothris atewa) and Tiassale liptena (Liptena tiassale). The former
species is only known from a single area of upland evergreen forest of about 17 km2 in Ghana in
the Atewa Range, which was formerly an island within lowland forest, now largely converted to
farm-bush. The main threat is from a planned large-scale bauxite strip-mine in an area covering
almost all of this upland forest (Larsen 2012). The latter species is presently known only from a
single locality: a very vigorous colony in Aburi Botanical Gardens, Ghana. The species was
formerly more widespread and remains vulnerable to stochastic events or potential neglect within
this highly restricted site (Larsen 2011).
Although only a small number of butterfly species in the hotspot have been assessed for the
IUCN Red List, the wider western Africa region is reported to support nearly 1,500 butterfly
species representing more than one-third of all butterflies in the Afrotropical biogeographical
region (Larsen 2005). Within the hotspot, the forests of the Cameroon-Nigeria border are
reported to harbor the highest forest butterfly species richness in Africa (Larsen 2005). Given the
importance of the hotspot for butterflies, it is important to better understand their conservation
status and the potential impacts on them of the many threats across the hotspot.
4.2.2 Freshwater Realm The following overview of threatened species within the freshwater realm is based on the IUCN
assessment of freshwater biodiversity of the western Africa region in 2009 (Smith et al. 2009).
This assessment aimed to include information on all known, described species of freshwater
fishes, odonates (dragonflies and damselflies), mollusks, crabs and selected families of aquatic
plants in the region. Much of the information for the assessments of fishes is based upon the
works of Lévêque et al. (1990, 1992) and Paugy et al. (2003). IUCN Red List assessments of all
25 species of freshwater shrimp were completed more recently (de Grave et al. 2015).
Freshwater Fishes A comprehensive Red List assessment of freshwater fishes has been conducted across the
hotspot, covering 632 species of bony fish (class: Actinopterygii). The highest densities of
freshwater fish species in the hotspot are found within the Niger Delta and the Atlantic river
catchments of Sierra Leone and Liberia. The Niger Delta itself has 180 recorded freshwater fish
species and an additional 19 species are thought likely to be present. More than half of the
freshwater fishes present are endemic to the western Africa region, but only a few species are
thought to be endemic to the hotspot itself, primarily as the hotspot boundaries are largely based
upon forest habitats and not river catchments, and most river systems in the hotspot originate
outside its boundaries. Many species are, however, endemic to catchments crossing the hotspot.
For example, Notoglanidium akiri is endemic to the lower Niger Delta but not to the hotspot
itself, as the hotspot boundary does not include the full extent of the delta. This species, along
with many others in the delta, especially the many regionally endemic killifishes, is highly
threatened by pollution and habitat loss resulting from oil exploration.

46
Myaka myaka is a Critically Endangered fish endemic to the Barombi Mbo Crater Lake in
Cameroon, where, along with 15 other fish species (12 of which are endemic to the lake), it is
threatened by the expansion of palm oil plantations and slash and burn agriculture leading to
sedimentation and pollution of the lake. Another Critically Endangered fish is Barbus boboi, a
cyprinid known only from the Farmington River in Liberia, where its habitat is declining due to
siltation and pollution from deforestation and mining (Entsua-Mensah 2010). In a similar
situation, the Critically Endangered Labeo curriei is restricted to the Via River, and possibly the
Corubal River, in the Saint Paul River catchment in Liberia (IUCN 2014). The threat to
freshwater fishes is not only a concern in terms biodiversity loss but for its impact to local
livelihoods. In western Africa the proportion of total dietary protein from fish can reach
60 percent or more (IGCC 2006), with much of this coming from inland fisheries.
Freshwater Crabs and Shrimps Among the freshwater invertebrates assessed, the crabs and shrimps are the most highly
threatened, with 16 of the 72 species in the hotspot (22 percent) assessed as threatened (IUCN
2015a). Western Africa is a centre of diversity for Africa’s freshwater crabs (Cumberlidge et al.
2009). Two species, Liberonautes grandbassa and L. lugbe, are Critically Endangered. L.
grandbassa is endemic to central Liberia where it is known from a single rainforest locality
(Cumberlidge 2008) which is not protected. L. lugbe is also endemic to Liberia where it is known
from only two specimens collected in Lugbe in Nimba County, where it was found in small
forest streams. The freshwater shrimp, Atya intermedia, is an Endangered species only known
from the islands of São Tomé and Annobón, where increasing tourism development is expected
to result in degradation of the freshwater ecosystems on the islands, unless it is very carefully
managed (de Grave 2013). Crabs and shrimps both play an important role in nutrient cycling in
African freshwater ecosystems (Dobson et al. 2004; Cumberlidge et al. 2009), as they feed on
dead and decaying materials such as leaves, so their ongoing decline could have a significant
impact on ecosystem function.
Odonates Odonates (dragonflies and damselflies) are a diverse group of invertebrates for which we have
good information and which are also useful indicators of water quality, are numerous across the
hotspot with an estimated 316 species recorded (IUCN 2015a). Sixteen species (five percent of
the total) are assessed as globally threatened, of which four species are Critically Endangered.
Additional surveys would surely improve our knowledge of these species and will likely lead to
new discoveries. A short visit to Cameroon in 2008, for example, led to the discovery of five new
species in only a few days of surveying (Kipping, pers. comm.), one of which was discovered in
the building where the Red Listing workshop was being held in Yaoundé. The most important
locations for further study are western Guinea, especially the Fouta Djallon Massif, and
southeastern Nigeria, especially Cross River State and the Niger Delta (Djikstra et al. 2009). The
main threats to these species are habitat loss due to agricultural expansion and deforestation, and
to a lesser degree, expansion of human settlements, tourism and dams (Djikstra et al. 2009).
Freshwater Mollusks Freshwater mollusks in some regions of the world are one of the most threatened groups of
freshwater taxa. They remain fairly unobtrusive and are not normally considered as being
charismatic creatures, so rarely attract the attention of the popular media. This is unfortunate as

47
they are essential to the maintenance of wetland ecosystems, primarily due to their control of
water quality and nutrient balance through filter-feeding and algal-grazing and, to a lesser
degree, as a food source for predators including a number of fish species. Many species are also
restricted to very specific microhabitats, and thus sensitive to the impacts of dams, introduction
of alien species, wetland drainage and river channelization, pollution, sedimentation and
siltation.
Freshwater gastropod mollusks are reasonably well known for much of western Africa. This is
largely because certain species of the genera Lymnaea (Lymnaeidae), Biomphalaria and Bulinus
(Planorbidae) act as intermediate hosts for medically important parasitic flatworms (trematodes)
of humans and domestic animals (Kristensen et al. 2009). National surveys carried out in several
countries over the past century were designed to target these genera but they also recorded other
species. The results of these surveys and of other collections were collated by Brown (1980,
1994). Around 70 species have been recorded in the hotspot, of which 13 are threatened. The
bivalves, with 35 species recorded from the hotspot, are not as well-known as the gastropods.
Most threatened mollusks have highly restricted ranges, and rely on clean, rapidly flowing
waters. Of particular importance is the very rare, relict species Pleiodon (Pleiodon) ovata, which
may be an ancestral species for all western African bivalves. P. ovata is effectively a living fossil,
probably having become restricted to a single river (the Gbangbaia River in Sierra Leone) due to
the disappearance of its host fish (probably a Sindacharax or Alestes species) from most of
Africa (van Damme, pers comm.). From a scientific perspective, this species should be
considered as a priority for further research and conservation.
Freshwater Plants Within the freshwater realm, there is also a high diversity of aquatic plants within the hotspot,
particularly in the lower Niger River, and the Red List status of a number of these species has
been assessed more recently (Niang-Diop and Ouedraogo 2009). Drought and habitat loss due to
expanding agriculture are the main threats identified. The most heavily threatened species is
Eriocaulon stipantepalum, a species of pipewort (family: Eriocaulaceae) growing at the margins
of small pools, which is known from just one locality in the hotspot in northern Cameroon
(IUCN 2014).
4.2.3 Marine Realm The majority of marine organisms in the Gulf of Guinea are not considered endemic to the
region, due to the interconnected currents that link the Gulf of Guinea with the Canary Current to
the north, and the Benguela Current coastal upwelling region to the south. Exceptions include a
small number of marine fishes that are endemic to the offshore islands of São Tomé and
Príncipe, and some fishes and invertebrates that are only known from a very few records in the
area.
Marine Bony Fishes Global Red List assessments have recently been published in November 2015 for all of the 650+
bony fishes (Actinopterygii) that occur in the Gulf of Guinea region as part of a larger project to
assess all 1,400 deep-water and near-shore marine bony fishes in the Eastern Central Atlantic.

48
Based on a subset of previously the published assessments where information was sufficient to
determine extinction risk, just over 11 percent of near-shore marine fishes are threatened,
including several commercially important fish species, such as groupers (Epinephelus spp.),
tunas (Thunnus spp.) and billfishes (Kajikia albida and Makaira nigricans). The main threats to
marine fishes (see Chapter 8) are overharvesting and lack of regulation of fishing practices,
especially with regard to the large offshore trawlers from the EU (Atta-Mills et al. 2004), China
and elsewhere.
Sharks and Rays Of the 87 species of sharks and rays assessed (representing all known described species from the
region) 54 percent are threatened. Three of the five species that enter freshwater are threatened,
one of which, largetooth sawfish (Pristis pristis), is Critically Endangered. Historical records
indicate that the two sawfish species (P. pristis and P. pectinata) were once common in the
estuaries of western Africa (Faria et al. 2013, Burgess et al. 2009). However, there have been
recent confirmed records of these species only from Sierra Leone and only historical records
from the other coastal countries in the region (Burgess et al. 2009). Several threatened species of
guitarfishes (Rhinobatos spp.) inhabit shallow inland coastal waters in the region and are heavily
targeted for their fins. Shark fishing has increased significantly in the past several decades and
has decimated populations of many species in the region (Diop and Dossa 2011). Several rays,
including the Data Deficient rosette torpedo (Torpedo bauchotae) and smalltooth stingray
(Dasyatis rudis), may be endemic to the shallow, near-shore waters in the area, however very
little is known of their populations, ecology or the impacts of threats.
Marine Turtles Four species of marine turtles are present within the hotspot: green turtle (Chelonia mydas);
hawksbill turtle (Eretmochelys imbricate); olive ridley turtle (Lepidochelys olivacea); and
leatherback (Dermochelys coriacea). All four species are threatened by entanglement in fishing
nets and from degradation and loss of nesting beaches, particularly as a consequence of coastal
development (Formia et al. 2003). The top priority for conservation is the Critically Endangered
hawksbill turtle, and action for this species within the hotspot should focus on Bioko Island of
Equatorial Guinea and the islands of São Tomé and Príncipe, where the species nests regularly.
Some estuarine and lagoon areas have also been identified as developmental habitat for juvenile
turtles, including the Cameroon Estuary for olive ridley turtle (Fretey 2001). In areas with large
turtle aggregations (such as green turtle feeding and nesting grounds in Equatorial Guinea and
São Tomé and Príncipe), organized market systems have developed (Formia et al. 2003). Sea
turtles are systematically killed both on land and sea, their nests are looted, and a lively trade in
carapaces exists.
Marine Mammals An estimated 28 species of marine mammal have been reported from the area adjacent to the
hotspot of which five are threatened. Of special importance are Atlantic humpback dolphin
(Sousa teuszii) and West African manatee, both of which inhabit the near shore coastal areas of
the hotspot. The former species is endemic to the eastern tropical Atlantic, and is limited to
estuarine and shallow coastal waters (Ross 202, Van Waerebeek et al. 2004) in depths of less
than 20 meters, and has been observed to travel up the Niger and Bandiala rivers. There is
historical evidence that they may currently be or may have been present in the Cameroon

49
Estuary. Their populations are considered to be highly fragmented, and in low numbers. There is
little information on population size, diet or impact of major threats, as it is one of the least
known dolphin species. As with other cetaceans, Atlantic humpback dolphin is threatened by
incidental mortality in fishing nets, and is also taken directly for food. Habitat destruction, boat
strikes and water pollution are additional potential threats, although little is known about them.
West African manatee is also endemic to the eastern tropical Atlantic, and is the least studied
sirenian in the world. Within the hotspot, although widely distributed throughout estuaries,
mangroves, rivers and inland lakes, and along the marine coastal flats, overall numbers are
declining largely due to hunting and incidental catches with near extirpation in some regions
(Powell and Kouadio 2008). Although hunting is illegal in several countries of the hotspot, and
the species is listed in CITES Appendix II, restrictions are difficult to enforce.
4.3 Site Outcomes 4.3.1 Methodology
Many species are best conserved by protecting their habitats and the biological communities they
are part of, through conservation actions at a network of sites. The method used by CEPF to
identify these sites is that of KBAs, which are explicitly designed to conserve biodiversity at the
greatest risk of extinction (Langhammer et al. 2007). The KBA methodology is data-driven,
although, in data-poor regions, expert opinion also plays a critical role. All KBAs meet one or
more standard criteria (Table 4.3). The KBA methodology is currently undergoing a global
revision to develop a standard which is applicable to all taxonomic groups. Efforts are being
made to ensure that the majority of existing KBAs, as presented here, will meet the new criteria
for selection. Nevertheless, it will be necessary to re-evaluate the KBAs in future, to verify that
all sites qualify under the revised criteria, and to identify additional sites of global importance of
the persistence of biodiversity that are not captured under the current criteria.
Table 4.3 Criteria for Identifying KBAs in the Guinea Forest West Africa Hotspot
Criterion Thresholds for Triggering KBA Status
Extinction Risk Regular occurrence of a globally threatened species at the site.
Inferred regular presence of: a) Critically Endangered (CR) species—presence of a single individual b) Endangered (EN) species—presence of a single individual c) Vulnerable (VU) species—presence of 30 individuals or 10 pairs
Range Restriction Site holds >5% of a species’s global population at any stage of the species’s lifecycle.
Inferred presence and sufficient extent of: a) Restricted-range species—species with a global range less than 50,000 km
2, or 5% of global population at a site
b) Globally significant congregations—1% of global population seasonally at the site
Source: Langhammer et al. (2007).
All terrestrial KBAs analysed in this report were provided by Birdlife International through a
download from the World Biodiversity Database in November 2013. Most of these terrestrial
KBAs in the Guinean Forests Hotspot were originally delineated as Important Bird Areas (IBAs)
by BirdLife International partner NGOs and collaborating organizations in each hotspot country,

50
based upon the application of the KBA criteria to data on birds (Fishpool and Evans 2001). This
analysis was then built upon through the identification of KBAs for multiple taxonomic groups,
especially mammals, reptiles, amphibians and selected plants, by Conservation International
during the first phase of CEPF investment in the Upper Guinean Forests subregion (Kouame et
al. 2012). Finally, data were incorporated on Alliance for Zero Extinction (AZE) sites, defined as
places that encompass the entire ranges of Endangered or Critically Endangered species (Ricketts
et al. 2005).
Freshwater KBAs were determined through a separate process, as there were no data on
freshwater KBAs held in the World Biodiversity Database at the time. Freshwater KBAs were
identified and delineated according to river/lake subcatchments units, as the widely accepted
management unit most applicable to the freshwater realm. At a spatial scale relevant to
management, the hotspot area has 1,295 river/lake subcatchments within it, or straddling its
borders. Almost all (1,256) of these river/lake subcatchments were identified as holding ‘trigger’
species, defined as species that meet at least one of the KBA criteria (Figure 4.1). The very large
number of subcatchments that meet the KBA criteria is a product of the high levels of species
endemism within catchments (a reflection of the limited dispersal options for fish and mollusk
species in particular), and the high levels of threat facing freshwater species. A subset of these
subcatchments (i.e. those holding the highest numbers of trigger species) were subsequently
proposed as KBAs and circulated for stakeholder review. Figure 4.1 Location of River and Lake Subcatchments Holding Species that Trigger KBA Criteria

51
4.3.2 Identification of KBAs A total of 137 KBAs have been identified in the hotspot (Figure 4.2). The total land area covered
by these KBAs, adjusting for overlap between sites, is 109,271 km2, slightly larger than Liberia
and covering 18 percent of the entire hotspot (621,705 km2). The KBAs have an average size of
81,152 hectares, ranging from the 159 hectare Mont Bana (CMR7) to the 586,803 hectare
Gashaka-Gumpti National Park (NGA5). A summary of KBAs by country is given in Table 4.4
and the full list of KBAs is provided in Appendix 5.
Figure 4.2 Location of All KBAs within or Bordering the Hotspot
The distribution of terrestrial and freshwater KBAs is shown in more detail for each country in
the hotspot in Figures 4.3 to 4.13. Terrestrial KBAs are distinguished from freshwater KBAs
because site-level threats and management requirements often differ between the terrestrial and
freshwater realms. In particular, freshwater KBAs need to be managed with consideration for
their associated river and lake subcatchments, such that integrated river basin management
approaches may be most appropriate.
The area of overlap between terrestrial and freshwater KBAs is minimal (approximately
2,000 km2) reflecting the previously recognized spatial mismatch between areas of importance

52
for freshwater biodiversity and the locations of terrestrial protected areas (Darwall et al. 2011).
In most cases the overlap is incidental in that only small parts of river catchments overlap with
terrestrial KBAs. Neverthless, significant areas of overlap between terrestrial and freshwater
KBAs occur on the island of São Tomé, and in Cameroon, where Lake Bermin and surrounding
catchments (fw2) overlaps with Bakossi Mountains (CMR1) and Banyang Mbo Wildlife
Sanctuary (CMR4). In these areas, it will be of particular importance to harmonize site
boundaries to ensure effective conservation management of both terrestrial and freshwater
biodiversity.
Ghana has the largest number of KBAs (30 sites) but, as many of them are relatively small, the
total land area (5,490 km2) is less than for Liberia which has 22 KBAs covering a total area of
38,677 km2 representing one-third of the total area of KBAs in the hotspot. The distribution and
characteristics of KBAs within each subregion of the hotspot are discussed in some detail in the
following section.
Table 4.4. Distribution of Terrestrial and Freshwater KBAs by Country
Country KBA Area within Hotspot (sq km)
1
Number of Terrestrial KBAs
Number of Freshwater KBAs
2 Total Number of KBAs
Benin 984 1 0 1
Cameroon 13,837 19 2 21
Côte d’Ivoire 14,659 15 1 16
Equatorial Guinea 862 3 0 3
Ghana 5,490 30 0 30
Guinea 3,260 11 0 11
Liberia 38,677 18 4 22
Nigeria 21,231 12 2 14
São Tomé & Príncipe 961 4 1 5
Sierra Leone 6,245 9 2 11
Togo 3,065 2 1 3
Total 109,271 124 13 137 1 The area of overlap between terrestrial and freshwater KBAs has been accounted for in these measurements.
2 Several freshwater KBAs are transboundary and occur in more than one country. In each case, the KBA is assigned
to the country with which it has the largest area of overlap.

53
Figure 4.3 Terrestrial and Freshwater KBAs in Benin
Code Key Biodiversity Area Terrestrial or freshwater
Area (hectares)
BEN1 Lake Nokoué Terrestrial 98,403

54
Figure 4.4 Terrestrial and Freshwater KBAs in Cameroon
Code Key Biodiversity Area Terrestrial or freshwater
Area (hectares)
CMR1 Bakossi Mountains Terrestrial 75,581
CMR2 Bali-Ngemba Forest Reserve Terrestrial 899
CMR3 Bamboutos Mountains Terrestrial 7,396
CMR4 Banyang Mbo Wildlife Sanctuary Terrestrial 69,145
CMR5 Korup National Park Terrestrial 129,115
CMR6 Mbi Crater Faunal Reserve - Mbingo forest Terrestrial 3,233
CMR7 Mont Bana Terrestrial 159
CMR8 Mont Kupe Integral Ecological Reserve Terrestrial 428
CMR9 Mont Manengouba Terrestrial 8,740
CMR10 Mont Nganha Terrestrial 16,930
CMR11 Mont Nlonako Terrestrial 64,124
CMR12 Mount Cameroon and Mokoko-Onge Terrestrial 107,143
CMR13 Mount Lefo Terrestrial 1,649
CMR14 Mount Mbam Terrestrial 13,221
CMR15 Mount Oku Terrestrial 16,353
CMR16 Mount Rata and Rumpi Hills Forest Reserve Terrestrial 45,200

55
Code Key Biodiversity Area Terrestrial or freshwater
Area (hectares)
CMR17 Santchou Faunal Reserve Terrestrial 9,506
CMR18 Tchabal Mbabo Terrestrial 312,347
CMR19 Yabassi Terrestrial 264,867
fw1 Lake Barombi Mbo and surrounding catchments Freshwater 176,536
fw2 Lake Bermin and surrounding catchments Freshwater 152,302
Figure 4.5 Terrestrial and Freshwater KBAs in Côte d’Ivoire
Code Key Biodiversity Area Terrestrial or freshwater
Area (hectares)
CIV1 Adiopodoume Terrestrial 1,939
CIV2 Forêt Classée de Bossematié Terrestrial 21,976
CIV3 Forêt Classée de Cavally et Goin - Débé Terrestrial 197,925
CIV4 Forêt Classée de Mabi Terrestrial 62,095
CIV5 Forêt Classée de Mopri Terrestrial 32,459
CIV6 Forêt Classée de Yapo et Mambo Terrestrial 30,598
CIV7 Forêt Classée des Mont Guéoulé et Mont Glo Réserves Terrestrial 49,019
CIV8 Mount Nimba (part of Mount Nimba transboundary AZE) Terrestrial 27,035

56
Code Key Biodiversity Area Terrestrial or freshwater
Area (hectares)
CIV9 Parc National d’ Azagny Terrestrial 18,865
CIV10 Parc National de Marahoué Terrestrial 87,526
CIV11 Parc National de Taï et Réserve de Faune du N’Zo Terrestrial 539,376
CIV12 Parc National du Mont Péko Terrestrial 29,330
CIV13 Parc National du Mont Sangbé Terrestrial 75,029
CIV14 Réserve Intégrale du Mont Nimba Terrestrial 6,480
CIV15 Station de recherche écologique de Lamto Terrestrial 2,721
fw3 Lower Bandama River Freshwater 315,998
Figure 4.6 Terrestrial and Freshwater KBAs in Equatorial Guinea
Code Key Biodiversity Area Terrestrial or freshwater
Area (hectares)
GNQ1 Annobón Terrestrial 2,871
GNQ2 Reserva Cientifica de la Caldera de Lubá Terrestrial 51,075
GNQ3 Parque Nacional del Pico de Basilé Terrestrial 32,256

57
Figure 4.7 Terrestrial and Freshwater KBAs in Ghana
Code Key Biodiversity Area Terrestrial or freshwater
Area (hectares)
GHA1 Amansuri wetland Terrestrial 26,751
GHA2 Ankasa Resource Reserve - Nini-Sushien National Park Terrestrial 47,444
GHA3 Atewa Range Forest Reserve Terrestrial 21,111
GHA4 Bia National Park and Resource Reserve Terrestrial 34,115
GHA5 Boin River Forest Reserve Terrestrial 30,530
GHA6 Boin Tano Forest Reserve Terrestrial 12,181
GHA7 Bosomtwe Range Forest Reserve Terrestrial 7,546
GHA8 Bura River Forest Reserve Terrestrial 9,996
GHA9 Cape Three Points Forest Reserve Terrestrial 4,545
GHA10 Dadieso Forest Reserve Terrestrial 15,031
GHA11 Draw River Forest Reserve Terrestrial 19,391
GHA12 Ebi River Shelterbelt Forest Reserve Terrestrial 1,756
GHA13 Fure River Forest Reserve Terrestrial 14,046
GHA14 Jema-Asemkrom Forest Reserve Terrestrial 6,756
GHA15 Kakum National Park - Assin Attandaso Resource Reserve Terrestrial 31,783
GHA16 Kyabobo (proposed) National Park Terrestrial 21,882

58
Code Key Biodiversity Area Terrestrial or freshwater
Area (hectares)
GHA17 Mamiri Forest Reserve Terrestrial 4,815
GHA18 Mount Afadjato - Agumatsa Range Forest Terrestrial 2,185
GHA19 Neung South Forest Reserve Terrestrial 11,974
GHA20 Nsuensa Forest Reserve Terrestrial 6,330
GHA21 Pra-Sushien Forest Reserve Terrestrial 18,721
GHA22 Sapawsu Forest Reserve Terrestrial 922
GHA23 Shai Hills Game Production Reserve Terrestrial 343
GHA24 Southern Scarp Forest Reserve Terrestrial 24,882
GHA25 Subri River Forest Reserve Terrestrial 55,930
GHA26 Tano-Anwia Forest Reserve Terrestrial 14,105
GHA27 Tano-Ehuro Forest Reserve Terrestrial 20,787
GHA28 Tano-Nimiri Forest Reserve Terrestrial 19,026
GHA29 Tano-Offin Forest Reserve Terrestrial 43,061
GHA30 Yoyo River Forest Reserve Terrestrial 21,139
Figure 4.8 Terrestrial and Freshwater KBAs in Guinea

59
Code Key Biodiversity Area Terrestrial or freshwater
Area (hectares)
GIN1 Chutes de la Sala Terrestrial 1,440
GIN2 Diécké Terrestrial 59,232
GIN3 Forêt Classée de Balayan Souroumba Terrestrial 22,479
GIN4 Forêt Classée de Mont Bero Terrestrial 27,483
GIN5 Kabitaï Terrestrial 4,970
GIN6 Konkouré Terrestrial 45,744
GIN7 Kounounkan Terrestrial 10,644
GIN8 Massif du Ziama Terrestrial 91,481
GIN9 Monts Nimba Terrestrial 14,562
GIN10 Pic de Fon Terrestrial 32,117
GIN11 Sincery Oursa Terrestrial 1,586
Figure 4.9 Terrestrial and Freshwater KBAs in Liberia
Code Key Biodiversity Area Terrestrial or freshwater
Area (hectares)
LBR1 Cestos - Senkwen Terrestrial 350,405
LBR2 Cestos/Gbi Area Terrestrial 316,490

60
Code Key Biodiversity Area Terrestrial or freshwater
Area (hectares)
LBR3 Cestos-Sapo North Corridor forest blocks Terrestrial 81,401
LBR4 Gio National Forest Terrestrial 48,826
LBR5 Grand Kru Southeast Forest blocks Terrestrial 90,191
LBR6 Grand Kru Southwest blocks Terrestrial 55,111
LBR7 Grebo Terrestrial 282,195
LBR8 Kpelle Forest Terrestrial 216,898
LBR9 Krahn Bassa South Terrestrial 203,020
LBR10 Lake Piso Terrestrial 24,859
LBR11 Lofa-Mano Complex Terrestrial 437,854
LBR12 Nimba mountains Terrestrial 13,254
LBR13 Sapo - Grebo Corridor Terrestrial 197,421
LBR14 Sapo National Park Terrestrial 155,084
LBR15 West Nimba Terrestrial 11,625
LBR16 Wologizi mountains Terrestrial 167,985
LBR17 Wonegizi mountains Terrestrial 28,868
LBR18 Zwedru Terrestrial 64,458
fw4 Lower reaches of St Paul River Freshwater 350,405
fw7 Middle reaches of St Paul River Freshwater 316,490
fw11 Upper reaches of St Paul River Freshwater 81,401
fw12 Weeni creek - Grand Bassa County Freshwater 48,826

61
Figure 4.10 Terrestrial and Freshwater KBAs in Nigeria
Code Key Biodiversity Area Terrestrial or freshwater
Area (hectares)
NGA1 Afi River Forest Reserve Terrestrial 51,975
NGA2 Akassa Forests Terrestrial 8,333
NGA3 Biseni forests Terrestrial 21,619
NGA4 Cross River National Park: Oban Division Terrestrial 268,952
NGA5 Gashaka-Gumti National Park Terrestrial 586,803
NGA6 IITA Forest Reserve, Ibadan Terrestrial 327
NGA7 Mbe Mountains and Cross River National Park: Okwangwo Division Terrestrial 95,288
NGA8 Ngel-Nyaka Forest Reserve Terrestrial 3,004
NGA9 Obudu Plateau Terrestrial 70,743
NGA10 Okomu National Park Terrestrial 111,626
NGA11 Omo Forest Reserve Terrestrial 131,908
NGA12 Upper Orashi forests Terrestrial 9,883
fw10 South East Niger Delta - near Calabar Freshwater 269,451
fw13 West Niger Delta Freshwater 493,149

62
Figure 4.11 Terrestrial and Freshwater KBAs in São Tomé and Príncipe
Code Key Biodiversity Area Terrestrial or freshwater
Area (hectares)
STP1 Parque Natural Obô do Príncipe Terrestrial 5,670
STP2 Parque Natural Obô de São Tomé e Zona Tampão Terrestrial 44,830
STP3 Zona Ecológica dos Mangais do Rio Malanza Terrestrial 229
STP4 Zona Ecológica da Praia das Conchas Terrestrial 522
fw9 São Tomé Freshwater 90,467

63
Figure 4.12 Terrestrial and Freshwater KBAs in Sierra Leone
Code Key Biodiversity Area Terrestrial or freshwater
Area (hectares)
SLE1 Gola Forest Reserve Terrestrial 74,612
SLE2 Kambui Hills Forest Reserve Terrestrial 14,012
SLE3 Kangari Hills Non-hunting Forest Reserve Terrestrial 11,743
SLE4 Loma Mountains Non-hunting Forest Reserve Terrestrial 26,782
SLE5 Sierra Leone River Estuary Terrestrial 55,823
SLE6 Tingi Hills Non-hunting Forest Reserve Terrestrial 14,293
SLE7 Tiwai Island Game Sanctuary / Non-hunting Forest Reserve Terrestrial 1,251
SLE8 Western Area Peninsula Non-hunting Forest Reserve Terrestrial 16,414
SLE9 Yawri Bay Terrestrial 54,674
fw6 Gbangbaia River Basin Freshwater 266,478
fw8 Rhombe Swamp and Mouth of Little and Great Scarcies Rivers Freshwater 88,460

64
Figure 4.13 Terrestrial and Freshwater KBAs in Togo
Code Key Biodiversity Area Terrestrial or freshwater
Area (hectares)
TGO1 Fazao-Malfakassa National Park Terrestrial 215,337
TGO2 Missahoe Forest Reserve Terrestrial 1,225
fw5 Lower Volta eastern catchment Freshwater 91,184
As no Important Plant Areas (IPAs) had been identified for the hotspot at the time of the
ecosystem profiling exercise, most of the terrestrial KBAs designated for plants were largely
based on the presence of threatened or restricted-range species of terrestrial flowering plants. A
small number of freshwater aquatic plants trigger freshwater KBAs (see below) but only for the
few families assessed to date. Given the importance of this hotspot for its forest habitats,
expansion of IUCN Red List coverage for forest plants and subsequent identification of KBAs
for plants is a priority. For example, there are currently no KBAs identified for orchids (family:
Orchidaceae), many of which are known to be highly threatened and/or range restricted, and
none were proposed during the stakeholder consultations. A number of terrestrial and freshwater
KBAs incorporate coastal habitats but in the offshore marine realm adjacent to the hotspot, with
the exception of several coastal IBAs for seabirds, no marine KBAs have yet been identified. It is
worth noting, however, that the Cross River Estuary, which is shared between Nigeria and

65
Cameroon, is the biggest estuary in the Gulf of Guinea and has recently been proposed as a
candidate ’Ecologically or Biologically Sensitive Marine Area’. Although the biodiversity in this
mangrove area is not well-documented, it is believed to be rich in biodiversity. The mangrove
habitat is relatively untouched, with exploitation as the only source of significant human impact
(Nwosu 2005). The process for identifying and delineating freshwater KBAs, based on those
subcatchments identified as holding trigger species, has only just begun and only 13 freshwater
KBAs were identified during the ecosystem profiling process, representing a selection of the
highest priority sites.
4.3.3 Prioritization of KBAs Based on Relative Biological Importance It is not possible for CEPF to fund conservation actions at all of the 137 KBAs identified within
the hotspot during a single investment phase. Consequently, a subset of priority sites was
identified as those considered most likely to benefit from the financial resources available
through CEPF investments during the next five years.
The first step was to prioritize among KBAs based upon their relative biological importance,
following the protocol described in Langhammer et al. (2007). It is important to stress here that
this is an exercise in prioritization among sites that are all of global importance for the
persistence of biodiversity, and that the priority scores thereby assigned are relative.
Each terrestrial KBA was assigned a total score for relative biological importance, based upon
criteria of irreplaceability and vulnerability (Table 4.5).
1) Species-based Irreplacability. Each trigger species (defined as a species present which
meets one or more of the KBA criteria) was given an irreplaceability score calculated
from the number of confirmed and proposed KBAs within the hotspot where the species
is thought to be present. This reflects the number of spatial options for conservation
action for the species within the KBA network for the hotspot.
2) Species-based Vulnerability. Each trigger species was assigned a vulnerability score,
based on the global threat status of the species, following the IUCN Red List Categories.
This score reflects the likelihood that a species will go extinct in the near future if no
conservation actions are taken.
3) Site Vulnerability. The vulnerability of the KBA holding the trigger species was scored
according to the current level of spatial overlap with existing protected areas classified as
IUCN Categories I-IV. It is, however, recognised that this is not always a true reflection
of the actual protection a site receives but it is used here as a basic surrogate for the level
of current site protection.

66
Table 4.5 Criteria Used to Assign Species-based Irreplaceability, Species-based Vulnerability and Site Vulnerability Scores to KBAs
Species-based Irreplaceability Score
Number of KBAs where Present within the Hotspot
Species-based Vulnerability Score
Global Threat Status (i.e., IUCN Red List Category)
Site Vulnerability Score
Overlap of KBA with Protected Areas
2
Extreme Single site only Extreme CR
High <= 10 sites High EN High <25%
Medium <=100 sites Medium VU Medium 25-75%
Low >100 sites or “not known”
1
Low NT; LC; DD Low >75%
1 This applies to most plant species for which distribution ranges are yet to be mapped.
2 In IUCN Protected Area Categories I to IV only.
Finally, a priority score was assigned to each species-site combination based upon a combination
of all three criteria, and each KBA site was assigned to the highest priority ranking it triggered
(Table 4.6). For example, sites with extreme irreplaceability for CR or EN species are the highest
priorities for conservation action. These Priority 1 sites also qualify as AZE sites, although not
all are currently recognized as such on www.zeroextinction.org/. Table 4.6 Matrix Used to Assign Priority Scores to Species-site Combinations
Species-based Irreplaceability
Species-based Vulnerability
Site-based Vulnerability
High Medium Low
Extreme Extreme 1 1 1
High 1 1 1
Medium 2 3 4
Low 3 4 5
High Extreme 2 2 3
High 2 3 4
Medium 3 4 5
Low 4 5 5
Medium Extreme 4
High 4
Medium 5
Low 5
Low Extreme 4
High 5
Medium 5
Low 5
On completion of this prioritisation exercise, all terrestrial KBAs and their associated trigger
species were screened to ensure the top priority sites had been ranked correctly. In particular,
given the heavy weighting of the final priority KBA ranking to species irreplaceability, the
scores were checked for highly threatened species that are on the edge of their range within the
hotspot but widespread elsewhere. In cases of marginal occurrence, the species irreplaceability
score was downgraded and the KBA was assigned a different priority score for that species-site
combination.
A number of other sites were omitted because the trigger species leading to the site being ranked
as a Priority 1 KBA were found, on closer investigation, to be possibly extinct at the site or based

67
only on a single historical record. Adiopodoume KBA (CIV1), for example, was omitted from
the Priority 1 KBA list as its priority 1 ranking was based upon the presence of the Critically
Endangered Wimmer’s shrew (Crocidura wimmeri), which has not been recorded since 1976.
KBAs triggered through the presence of threatened and apparently restricted-range plants were
also omitted or downgraded where the species was found to be quite widespread within and
beyond the hotspot, as is often the case where species distribution maps are not available (e.g. for
almost all plant species considered here). Finally, in a few cases, the Red List status of a KBA
trigger species had changed since the original data download from the IUCN Red List in
November 2013, leading to an updating of the species vulnerability score. For example, Parc
National du Mont Péko (CIV12) was initially ranked as a Priority 1 KBA due to the presence of
Bobgunnia fistuloides but this species has recently been downlisted from Endangered to Least
Concern, meaning that the KBA no longer qualifies as a Priority 1 site.
The freshwater river/lake subcatchments were scored against the same criteria as described
above but with some differences, in accordance with the procedures proposed by Holland et al.
(2012). Species irreplaceability was scored against species range size according to the thresholds
given in Tables 4.7 and 4.8 below. Higher range size thresholds were set for odonates
(dragonflies and damselflies), as they tend to disperse more widely than other freshwater taxa.
Table 4.7 Criteria Used to Assign Species-based Irreplacability Scores to Odonates
Irreplacability Score Range Size
Extreme Site holds a species with a range size <2,000 km2
High Site holds a species with a range size >2,000 km2 and <5,000 km
2
Medium Site holds a species with a range size >5,000 km2 and <50,000 km
2
Low Site holds a species with a range size >50,000 km2
Table 4.8 Criteria Used to Assign Species-based Irreplacability Scores to Other Freshwater Taxa
Irreplacability Score Range Size
Extreme Site holds a species with a range size <2,000 km2
High Site holds a species with a range size >2,000 km2 and <5,000 km
2
Medium Site holds a species with a range size >5,000 km2 and <20,000 km
2
Low Site holds a species with a range size >20,000 km2
For the purposes of this profile, only a small number of the highest priority freshwater sites were
identified as KBAs through stakeholder feedback. Further work is needed to identify the full
suite of freshwater KBAs in the Guinean Forests Hotspot. The results of the biological
prioritization of terrestrial and freshwater KBAs in each hotspot country are given in Table 4.9.

68
Table 4.9 Terrestrial and Freshwater KBAs by Priority Score and Country
Priority Score
Be
nin
Ca
me
roo
n
Cô
te
d’I
vo
ire
Eq
ua
tori
al
Gu
ine
a
Gh
an
a
Gu
ine
a
Lib
eri
a
Nig
eri
a
Sã
o T
om
é
& P
rín
cip
e
Sie
rra
Le
on
e
To
go
Total Numberof KBAs
Terrestrial KBAs
1 0 12 0 2 0 1 1 0 3 2 0 21
2 0 4 6 0 12 2 7 6 1 4 1 43
3 1 1 2 1 5 6 4 3 0 1 0 24
4 0 2 7 0 7 2 6 2 0 2 1 29
5 0 0 0 0 6 0 0 1 0 0 0 7
Total 1 19 15 3 30 11 18 12 4 9 2 124
Freshwater KBAs
1 0 2 0 0 0 0 2 0 1 1 0 6
2 0 0 1 0 0 0 2 2 0 1 1 7
Total 0 2 1 0 0 0 4 2 1 2 1 13
Note: Some KBAs are transboundary and are counted for each of the countries into which they extend.
Those species triggering Priority 1 ranking of all terrestrial KBAs are shown in Table 4.10.
Mammal trigger species are almost all small-sized, restricted-range species, such as shrews,
mongoose and bats. This is driven by the high importance placed on irreplaceability. Table 4.10 Species Triggering Priority 1 Terrestrial KBAs on the Basis of Relative Biological Importance
Priority 1 KBA Country Species triggering
Priority 1 status Common name Class
Red List Category
Annobón Equatorial Guinea
Afroablepharus annobonensis
Annobón lidless skink
Reptilia CR
Bakossi Mountains Cameroon Hyperolius dintelmanni Leptodactylodon wildi
N/A N/A
Amphibia Amphibia
EN EN
Bamboutos Mountains
Cameroon Leptodactylodon axillaris N/A Amphibia EN
Gola Forest Reserve Sierra Leone
Hylomyscus baeri Baer’s wood mouse Mammalia EN
Konkouré Guinea Rhinolophus maclaudi Maclaud’s horseshoe bat
Mammalia EN
Mbi Crater Faunal Reserve - Mbingo forest
Cameroon Crocidura picea Cameroonian shrew
Mammalia CR
Mont Kupe Integral Ecological Reserve
Cameroon Werneria preussi N/A Amphibia EN
Mont Manengouba Cameroon
Cardioglossa trifasciata Leptodactylodon erythrogaster
N/A N/A
Amphibia Amphibia
CR CR
Mont Nganha Cameroon Astylosternus nganhanus N/A Amphibia CR
Mont Nlonako Cameroon Petropedetes perreti Cardioglossa venusta Astylosternus perreti
N/A N/A N/A
Amphibia Amphibia Amphibia
EN EN EN
Mount Cameroon and Mokoko-Onge
Cameroon
Pternistis camerunensis Sylvisorex morio Otomys burtoni
Mount Cameroon francolin Mount Cameroon forest shrew Burton’s vlei rat
Aves Mammalia Mammalia
EN
EN
EN
Mount Lefo Cameroon Lophuromys eisentrauti Mount Lefo brush-furred mouse
Mammalia EN

69
Priority 1 KBA Country Species triggering
Priority 1 status Common name Class
Red List Category
Mount Oku Cameroon
Hylomyscus grandis Lamottemys okuensis Lophuromys dieterleni Wolterstorffina chirioi Xenopus longipes
Mt Oku hylomyscus Mt Oku rat Mt Oku brush-furred rat N/A Lake Oku clawed frog
Mammalia Mammalia Mammalia Amphibia Amphibia
CR EN EN
CR CR
Mount Rata and Rumpi Hills Forest Reserve
Cameroon Myosorex rumpii Alexteroon jynx
Rumpi mouse shrew N/A
Mammalia Amphibia
EN
CR
Parque Natural Obô do Príncipe
São Tomé & Príncipe
Turdus xanthorhynchus Príncipe thrush Aves CR
Parque Natural Obô de São Tomé e Zona Tampão
São Tomé & Príncipe
Myonycteris brachycephala Columba thomensis Neospiza concolor
São Tomé collared fruit bat São Tomé olive-pigeon São Tomé grosbeak
Mammalia Aves Aves
EN
EN
CR
Parque Nacional del Pico de Basilé
Equatorial Guinea
Praomys morio Cameroon soft-furred mouse
Mammalia EN
Tchabal Mbabo Cameroon Cardioglossa alsco N/A Amphibia CR
Western Area Peninsula Non-hunting Forest Reserve
Sierra Leone
Cardioglossa aureoli Triclisia macrophylla
Freetown long-fingered frog N/A
Amphibia Magnoliopsida
EN
CR
Zona Ecológica da Praia das Conchas
São Tomé & Príncipe
Chaerephon tomensis São Tomé free-tailed bat
Mammalia EN
Zwedru Liberia Phyllastrephus leucolepis Liberian greenbul Aves CR
Notes: All species listed have only been recorded within a single KBA within the hotspot. All KBAs listed meet the
criteria for AZE sites.
4.3.3 Overview of KBAs Ranked as High Relative Biological Importance Upper Guinean Forests Subregion The Upper Guinean Forests subregion of the hotspot has 36 terrestrial and eight freshwater
KBAs of high relative biodiversity value (Priority 1 and 2). Four of these sites meet the criteria
for AZE sites: Gola Forest Reserve (SLE1); Konkouré (GIN6); Western Area Peninsula Non-
hunting Forest Reserve (SLE8); and Zwedru (LBR 18) (Table 4.10). Only Zwedru is listed as an
AZE site on the Alliance’s website, which also recognizes two other AZE sites in the Upper
Guinean Forests. The former, Parc National de Taï et Réserve de Faune du N’Zo (CIV11), was
formerly considered to be the only site for Taï toad but this species has recently been found at a
second site (Gola Forest Reserve (SLE1)) and downlisted from Critically Endangered to
Endangered. The latter site, Mount Nimba, is a transboundary AZE site, spanning Côte d’Ivoire,
Guinea and Liberia, which supports the entire global population of the Critically Endangered
Mount Nimba viviparous toad. In the analysis used for the ecosystem profile, Mount Nimba is
divided among several KBAs, none of which supports the entire population of this species.
Consequently, none of them qualified as Priority 1 KBAs.
Central and Western Guinea
In Central and Western Guinea, there are two KBAs of high relative biological importance. Forêt
Classée de Balayan Souroumba (GIN3) is ranked highly for the potential presence of the
Endangered white-backed vulture and the presence of chimpanzees and a number of plant

70
species of conservation concern. Konkouré (GIN6), a Priority 1 site near to Conakry on the coast
of Guinea, is important for the Endangered Maclaud’s horseshoe bat (Rhinolophus maclaudi),
which is known from very few localities in Guinea, one of which is Conakry Island. This site,
which encompasses some important mangrove habitat, is also potentially important for West
Africa manatee and many near-shore marine species, including two species of Critically
Endangered sawfishes.
Coastal Sierra Leone
Further south along the coast around Freetown in Sierra Leone is a cluster of Terrestrial KBAs,
including the Western Area Peninsula Non-Hunting Forest Reserve (SLE8), Yawri Bay (SLE9),
and Sierra Leone River Estuary (SLE5). The former site contains the only remaining patch of
tropical rainforest in western Sierra Leone and is an important site for many bird species,
including five species of global conservation concern. The site also supports a number of primate
species, including the Endangered chimpanzee and the Vulnerable Diana monkey. Three species
of duiker, including the Endangered Jentink’s duiker, are also found at the site, as well as the
Endangered Freetown long-fingered frog (Cardioglossa aureoli). Yawri Bay KBA, important for
numerous bird species, West African manatee, marine turtles, and chimpanzee, has recently been
described as being at high threat from agricultural expansion, mining and road construction
(BirdLife International 2015). Sierra Leone River Estuary KBA is another site of potential
importance for shorebirds, manatees, sawfishes and turtles.
Two freshwater KBAs are located in coastal Sierra Leone. Rhombe Swamp and Mouth of Little
and Great Scarcies Rivers (fw8) holds three globally threatened species of freshwater fish, one
threatened mollusk and two threatened odonates. The second site, Gbangbaia River Basin (fw6),
holds six globally threatened fish species and two threatened dragonflies. It is also believed to be
the only remaining site for the very rare, relict species of mollusk Pleiodon ovate, which is
thought to be the ancestral species for the western Africa bivalves.
Sierra Leone-Liberia-Guinea Transboundary Area
A little further south and inland near the Sierra Leone-Liberia-Guinea border is a highly
important transboundary complex of KBAs, which includes Gola Forest Reserve (SLE1),
Kambui Hills Forest Reserve (SLE2), Tiwai Island Game Sanctuary/Non-hunting Forest Reserve
(SLE7), Lofa-Mano Complex (LBR11), the Wologizi Mountains (LBR16) and Massif du Ziama
(GIN8). Tiwai Island Sanctuary in the Moa River, Sierra Leone, has one of the highest densities
of primate species remaining in Africa including the Endangered western red colobus
(Procolobus badius), Vulnerable Diana monkey, Endangered chimpanzee, and Vulnerable black-
and-white colobus (Colobus polykomos). More than 176 bird species, including the Vulnerable
Rufous fishing owl (Scotopelia ussheri), 700 butterfly species and 700 plant species have been
recorded on Tiwai (T. Garnet pers. comm.). Gola Forest Reserve holds the largest area of
rainforest in the Upper Guinean Forests Subregion of Sierra Leone, with a very high diversity of
species including 14 bird species of conservation concern. The KBA also supports many
primates, and a number of large mammals such as the African elephant, pygmy hippo and
Jentink’s duiker. This site is also home to a disjunct population of the Endangered Baer’s wood
mouse (Hylomyscus baeri). Lofa-Mano Complex, across the border in Liberia, is contiguous
with Gola Forest Reserve. The KBA is situated between the Lofa and Mano rivers covering a
large area of rainforest and a patch of savanna. It supports populations of chimpanzee, duikers,

71
monkeys and African elephant. This KBA is considered to be in danger due to the very high
current threat from agricultural expansion, mining, and residential and urban development.
Immediately to the southeast of this transboundary complex of KBAs, there are three high
priority freshwater KBAs. A KBA in the Upper reaches of St Paul River (fw11) is important for
the high concentration of globally threatened freshwater species including eight fish species and
also the Endangered treehole crab, Globonautes macropus. Barbus carcharhinoides and B.
melanotaenia are both Critically Endangered fish species thought to be globally restricted to this
upper section of the river. The Critically Endangered gastropod mollusk, Bellamya liberiana, is
also potentially found in this part of the river and could benefit from additional survey effort.
Downstream of the Upper reaches of St Paul River are two other freshwater KBAs: Middle
reaches of St Paul River (fw7); and Lower reaches of St Paul River (fw4).
Mount Nimba Area
Moving east across the subregion, one finds a complex of adjacent and overlapping KBAs in the
Mount Nimba area, which spans the borders of Liberia, Guinea and Côte d’Ivoire. This relatively
isolated range of steeply sloping and heavily forested mountains is extremely rich in biodiversity,
including many species endemic to the area. The diversity and density of tree ferns, such as
Cyathea cylindricus, is notable. The mountains are identified as an AZE site on account of three
species of amphibian, as well as Lamotte’s roundtail bat (Hipposideros lamottei), which are all
threatened and restricted to the area. The Mount Nimba area is divided among five KBAs, two of
which were ranked as high biological priorities: Mount Nimba (part of Mount Nimba
transboundary AZE) (CIV8) in Côte d’Ivoire; and Nimba mountains (LBR12) in Liberia. A little
further to the east, Forêt Classée des Mont Guéoulé et Mont Glo Réserves (CIV8) is also
considered a high relative biological priority.
In theory, the Mount Nimba area is protected: the Liberian part was designated as Monts Nimba
Strict Nature Reserve in 1944, and the Guinean and Ivorian parts were declared a World Heritage
Site (currently assigned the “in Danger” label) in 1981 and 1982, respectively. However, iron ore
mining on Mount Nimba has been a threat to biodiversity for over 20 years.
Liberia-Côte d’Ivoire Transboundary Area
Further south along the Liberia-Côte d’Ivoire border is another important transboundary cluster
of KBAs with high relative biological priority. Zwedru (LBR18) in central-eastern Liberia,
bordering Côte d’Ivoire, holds a number of restricted-range species, including Liberian greenbul.
This species was described from two forest patches 20 kilometers northwest of Zwedru in
Liberia in 1985 (Gatter 1997) but there have been no subsequent records. Grebo KBA (LBR7),
also bordering Côte d’Ivoire, is an area of forest bordered on three sides by the Cavalla River.
This KBA is rich in bird species and a number of threatened mammals, including Jentink’s
duiker, Liberian mongoose, pygmy hippopotamus, chimpanzee and West African red colobus.
Other high biological priority KBAs in this complex include Cestos - Senkwen (LBR1) and Sapo
National Park (LBR14) in Liberia, and Forêt Classée de Cavally et Goin - Débé (CIV3) in Côte
d’Ivoire. The latter KBA is the only site in Côte d’Ivoire known to hold the Endangered Gola
malimbe.

72
Another high relative biological priority in Liberia is a cluster of subcatchments around Weeni
Creek in Grand Bassa County (fw12), where a Critically Endangered crab, Liberonautes
grandbassa, and three threatened fish species are found. This freshwater crab’s entire known
global distribution is within Weeni Creek where it is currently unprotected and subject to the
impacts of ongoing deforestation.
Southern Côte d’Ivoire and Ghana
Further to the east, in southeastern parts of Côte d’Ivoire and southwestern parts of Ghana, are a
significant number of important forest reserves that are also confirmed KBAs of high relative
biological importance. These comprise Adiopodoume (CIV1), Forêt Classée de Bossematié
(CIV2) and Forêt Classée de Yapo et Mambo (CIV6) in Côte d’Ivoire, and Atewa Range Forest
Reserve (GHA3), Boin Tano Forest Reserve (GHA6), Cape Three Points Forest Reserve
(GHA9), Draw River Forest Reserve (GHA11), Jema-Asemkrom Forest Reserve (GHA14),
Neung South Forest Reserve (GHA19), Sapawsu Forest Reserve (GHA22), Southern Scarp
Forest Reserve (GHA24), Subri River Forest Reserve (GHA25) and Tano-Offin Forest Reserve
(GHA29) in Ghana. In addition to these terrestrial KBAs, the Lower Bandama River in Côte
d’Ivoire is a Priority 2 freshwater KBA (fw3) holding an Endangered mollusk and a Vulnerable
freshwater plant.
Ghana-Togo Transboundary Area
In the transitional zone between the Upper and Lower Guinean Forests, along the border between
Ghana and Togo, Kyabobo (proposed) National Park (GHA16) and Missahoé Forest Reserve
(TGO2) are of interest. Kyabobo (proposed) National Park, although not fully surveyed, has a
number of threatened species such as the Endangered Ukamia reed frog (Hyperolius torrentis).
Missahoé Forest Reserve is the only site in Togo where many forest species have been recorded
(BirdLife International 2015). A single transboundary freshwater KBA in the Lower Volta
eastern catchment (fw5) has a number of restricted range freshwater fish and mollusks, including
the Endangered butterfish (Irvineia voltae) which is only known from the lower Volta river
basin.
Lower Guinean Forests Subregion The Lower Guinean Forests subregion of the hotspot has 28 terrestrial KBAs and five freshwater
KBAs of high relative biological importance (i.e. Priority 1 and 2 sites). Seventeen of these sites
meet the criteria for AZE sites, mainly for small mammal and amphibians (Table 4.10), although
only 10 of them are currently recognized as such on the Alliance’s website.
Nigeria
On the Nigeria-Cameroon border is a cluster of three KBAs of high relative biological
importance: the Mbe Mountains and Cross River National Park: Okwangwo Division (NGA7),
Afi River Forest Reserve (NGA1) and Obudu Plateau (NGA9). The former KBA is most famous
for its important population of the Critically Endangered Cross River subspecies of western
gorilla. Including the discontiguous Oban Division (NGA4), Cross River National Park supports
11 species of primates, include the Nigeria-Cameroon subspecies of chimpanzee (Pan
troglodytes ellioti), Preuss’s monkey and drill. African elephant is also recorded here and plant
diversity is high. Afi River Forest Reserve KBA, which abuts the Mbe Mountains to the west, is
a large forest area where western gorilla, red-eared monkey and drill are present. The threats

73
from agricultural expansion and intensification, hunting and logging are ranked as current and
“very high” by BirdLife International (2015), despite conservation presence. The Mbe
Mountains Community Wildlife Sanctuary, an integral part of the Mbe Mountains and Cross
River National Park: Okwangwo Division KBA, forms an important habitat corridor and
contains important populations of several threatened species, including western gorilla,
chimpanzee, drill, leopard and African elephant. Further along the Nigeria-Cameroon border to
the northeast, Obudu Plateau KBA is a wet and mountainous extension of the Cameroon
Mountains. The site holds a number of threatened and restricted-range amphibians and birds,
including the Endangered white-throated mountain-babbler (Kupeornis gilberti). Preuss’ monkey
still occurs and western gorilla is thought to occasionally visit the site. Further still to the
northeast, Ngel-Nyaka Forest Reserve (NGA8), close to Gashaka-Gumti National Park, is ranked
as a Priority 2 KBA.
Central Nigeria has no KBAs specifically prioritized for high relative biological importance but,
to the west of the country, about 135 kilometers north of Lagos, Omo Forest Reserve (NGA11) is
the main stronghold for Ibadan malimbe, an Endangered bird restricted to a few patches of forest
in southwestern Nigeria. Once again this KBA is considered to be at very high risk due to
agricultural expansion and logging (BirdLife International 2015). The site is also known for its
high diversity of bird species. IITA Forest Reserve, near Ibadan (NGA6), while small and
isolated, also qualifies as a Priority 2 KBA.
Two freshwater KBAs are located in the Niger Delta, an area heavily impacted by oil spills, loss
of mangrove habitat, and extensive infestation by the invasive water hyacinth (Eichhornia
crassipes). West Niger Delta KBA (fw13), in the part of the delta southwest of Benin City, has
two Endangered freshwater shrimps: Desmocaris bislineata and Euryrhynchina edingtonae. The
former species has its known global range restricted to the KBA. South East Niger Delta near
Calabar KBA (fw10) is located in the eastern side of the delta at the lower reaches of the Cross
River. This KBA has a small number of threatened and restricted range fishes and plants and one
species of freshwater crab. An Endangered species of killifish, Fundulopanchax scheeli, is
entirely restricted to this KBA. The Vulnerable crab, Potamonautes reidi, which has a global
range restricted to the Niger Delta, is also present at the site.
Cameroon
Twelve Priority 1 terrestrial KBAs of the highest relative biological importance are located in
Cameroon, dispersed throughout the Cameroon Highlands mountain range. In almost all cases,
these KBAs have been ranked highly due to the presence of highly range restricted and/or
threatened species of amphibians and small mammals but a number of other species of
conservation concern are also found at these sites.
Nine of these KBAs are recognized as AZE sites. In the northeasternmost extremity of the
hotspot, Mont Nganha (CMR10) on the Adamawa Plateau is the only known location for the
Critically Endangered frog, Astylosternus nganhanus. Tchabal Mbabo (CMR18) also holds the
only known population of another Critically Endangered frog, Cardioglossa alsco, which is
dependent upon the remaining gallery forest and more inaccessible slopes where forest cover
remains. Bakossi Mountains (CMR1), Bamboutos Mountains (CMR3) and Mont Manengouba
(CMR9) are all also important for their populations of highly range-restricted, threatened

74
amphibians. Mount Rata and Rumpi Hill Forest Reserve (CMR16) is of high importance on
account of the Critically Endangered frog, Alexteroon jynx, and the Endangered Rumpi mouse
shrew (Myosorex rumpii), both of which are only known from this location. Mount Oku
(CMR15) has five species of Critically Endangered, restricted range amphibians and small
mammals. The KBA is considered to be under very high and immediate threat from agricultural
expansion, human disturbance and fire (BirdLife International 2015). Mount Cameroon and
Mokoko-Onge (CMR12), a vast volcanic dome west of Douala, holds the entire global world
populations of Burton’s vlei rat (Otomys burtoni), Mount Cameroon forest shrew (Sylvisorex
morio) and Mount Cameroon francolin, all of which are Endangered. Large mammals of
conservation concern include the Endangered drill and the Vulnerable African elephant, while
levels of plant endemism are also reported to be high (BirdLife International 2015). Finally,
Mount Lefo (CMR13) on the Barmileke Plateau is thought to hold the global population of the
Endangered Mount Lefo Brush-furred Mouse (Lophuromys eisentrauti). This area is densely
populated and under threat from logging operations.
Other KBAs of the highest biological importance in Cameroon include Mount Kupe Integral
Ecological Reserve (CMR8), a small KBA near the Bakossi Mountains, which supports one of
only a few subpopulations of an Endangered frog, Werneria preussi, plus several other
Endangered species, including drill, five-toed skink (Leptosiaphos pauliani), Kupe bush-shrike
(Telophorus kupeensis) and white-throated mountain-babbler. A short distance to the east, Mont
Nlonako (CMR11) is another KBA that holds a large number of threatened amphibians,
including three Endangered species of frog with highly restricted ranges. The Critically
Endangered Preuss’s red colobus and drill are also present. Lastly, Mbi Crater Faunal Reserve –
Mbingo Forest (CMR6) is important for a large number of highly threatened and restricted-range
species of small mammals, such as the Critically Endangered Cameroonian shrew, amphibians
and birds. A recent evaluation of the site by BirdLife International (2013) rated the threat from
agricultural expansion and livestock as very high and current.
An additional four terrestrial KBAs in Cameroon are ranked as Priority 2 sites, namely Bali-
Ngemba Forest Reserve (CMR2), Mont Bana (CMR7), Mount Mbam (CMR14) and Yabassi
(CMR19). These are all located along the eastern edge of the hotspot.
Cameroon contains two freshwater KBAs of high relative biological priority. The first of these,
Lake Barombi Mbo and surrounding catchments (fw1), to the northeast of Doula, partly overlaps
with Mount Cameroon and Mokoko-Onge KBA. Thirty-seven species of freshwater fishes,
plants, dragonflies and shrimps trigger the KBA criteria in this site, including two species of fish
(Clarias maclareni and Sarotherodon lohbergeri) and one plant (Ledermanniella batangensis)
that are Critically Endangered. The latter species has not been recorded since its original
collection in 1908 and may be extinct. A most important focal area within this KBA is Lake
Barombi Mbo, a crater lake of approximately 7 km2 in area, with a high diversity of endemic
freshwater species. The catfish, C. maclareni, is endemic to the lake along with 11 species of
endemic cichlid fishes. The main threat to the lake is the expansion of oil palm plantations,
proposed tourism development, water abstraction for Kumba town, and deforestation leading to
increased sedimentation in the lake. The Sunda Gorge Dam on the lower Nyong River poses a
potential threat to many riverine species should its construction be resumed.

75
The freshwater KBA, Lake Bermin and surrounding catchments (fw2) is located northwest of
Ngongsamba, and partly overlaps with Bakossi Mountains KBA (CMR1) and Mont Manengouba
KBA (CMR9), as well as overlapping more significantly with Banyang Mbo Wildlife Sanctuary
KBA (CMR4) and largely overlapping Banyang Mbo Wildlife Sanctuary KBA (CMR4). Forty-
nine freshwater KBA trigger species are present within the site including many fish, dragonfly,
and plant species. Nine species of Critically Endangered cichlid fishes are endemic to another
tiny crater lake, Lake Bermin, within this KBA, and two Critically Endangered species of
odonata are found within the wider KBA.
São Tomé and Príncipe, and Equatorial Guinea The chain of oceanic islands of Bioko, Príncipe, São Tomé and Annobón contains six terrestrial
KBAs and one freshwater KBA assigned a priority ranking of 1 or 2. One of these, Parque
Natural Obô de São Tomé e Zona Tampão (STP2), overlaps with two confirmed AZE sites (São
Tomé uplands and São Tomé lowlands).
Parque Nacional del Pico de Basilé (GNQ3) in the northern part of the island of Bioko holds the
endemic bird species, Fernando Po speirops (Speirops brunneus), along with 28 other bird
species which occur as endemic races on Bioko (BirdLife International 2015). Four globally
threatened primates occur here: Preuss’s monkey; red-eared monkey; black colobus (Colobus
satanas); and drill. In addition, one fish and three reptile species are endemic to the island
(BirdLife International 2015). Four species of marine turtle (green, hawksbill, olive ridley and
leatherback) nest on Bioko’s southern beaches along a restricted 20 kilometer coastline, and the
island is considered the most important in the region in terms of number of sea turtle species and
nesting individuals (Castroviejo et al. 1994).
Parque Natural Obô do Príncipe (STP1) on the island of Príncipe has four bird species of
conservation concern and seven species bird species endemic to the island. The island endemics
include the Critically Endangered Príncipe thrush. At least six species of reptile, four species of
frog and one species of shrew are also endemic to the island. A number of marine species of
conservation concern are found in the near shore coastal waters, including several threatened
sharks and green turtle.
São Tomé has three terrestrial KBAs of high biological importance: Parque Natural Obô de São
Tomé e Zona Tampão (STP2); Zona Ecológica dos Mangais do Rio Malanza (STP3); and Zona
Ecológica da Praia das Conchas (STP4). These three KBAs are primarily noted for their numerous
bird species of conservation concern. All three of them overlap with São Tomé (fw9): a
freshwater KBA of high biological importance. This KBA supports an Endangered freshwater
shrimp, Atya intermedia, which is otherwise known only from the island of Annobón in
Equitorial Guinea.
As well as its importance as one of only two sites to support A. intermedia, Annobón KBA
(GNQ1) is an important breeding site for a number of seabirds and at least two threatened
species of marine turtle: hawksbill turtle; and leatherback.

76
4.3.4 KBA Gap Analysis The majority of Priority 1 terrestrial KBAs have been prioritized due to the presence of site-
endemic threatened species of amphibians and/or small mammals. These sites also qualify as
AZE sites and are rightly considered high priority sites for actions to avoid the imminent species
extinctions. However, this heavy focus on small-bodied, range-restricted species, all of which are
well suited to benefit from site-based conservation, may have led to a lack of focus on some of
the more widespread but also highly threatened species, which may also benefit from site-based
actions. A subsequent analysis revealed that the most highly threatened (CR and EN species) and
wide-ranging species (irreplaceability scores of 3 and 4) were, however, relatively well
represented within the proposed network of Priority 1 and 2 KBAs (Table 4.11).
Table 4.11 Highly Threatened Species (CR/EN) with Irreplacebility Scores of 3 or 4 (i.e. Ranges that Overlap between 2 and 100 KBAs within the Hotspot)
Threatened Species Common Name
Number of Priority 1 KBAs Overlapping the Species’s Range
Number of Priority 2 KBAs Overlapping the Species’s Range
Number of Priority 1 & 2 KBAs
Overlapping the Species’s Range
Cephalophus jentinki Jentink’s duiker 3 7 10
Cercopithecus diana Diana monkey 5 21 26
Cercopithecus preussi Preuss’s monkey 3 2 5
Chelonia mydas Green turtle 5 6 11
Choeropsis liberiensis Pygmy hippopotamus 3 9 12
Necrosyrtes monachus Hooded vulture 2 8 10
Pan troglodytes Chimpanzee 11 29 40
Procolobus badius Western red colobus 4 17 21
Scotopelia ussheri Rufous fishing-owl 2 2 4
Tieghemella heckelii1 Cherry mahogany 3 8 11
1 The absence of a range map for this species means its presence within these KBAs still needs to be confirmed.
Other highly threatened (CR or EN) terrestrial species that are less widespread but are not site
endemics (i.e. they have an irreplaceability score of 2), including species such as western gorilla,
are present within many of the 43 Priority 2 terrestrial KBA sites. Only 19 terrestrial CR or EN
species are not covered by at least one of the Priority 2 KBAs. The majority of these species are
amphibians and birds with distribution ranges overlapping at least some KBAs which are
currently fully enclosed within existing protected areas, such that they have a lower priority
ranking due to perceived higher current levels of protection.
4.3.5 Current Overlap between KBAs and Protected Areas When assessing the level of protection provided for KBAs by the protected areas network, it was
decided, following advice received through the first stakeholder consultation workshop, to limit
the analysis of KBA spatial overlap with protected areas (as held within the World Database on
Protected Areas (WDPA)) to those classified by IUCN as Category I, II, III or IV. This
restriction to Category I to IV protected areas is based on the reported large number of protected
areas in the hotspot that either no longer exist (such as forest reserves where all forest has since
been cleared) or that are not expected to currently provide any effective protection.
A total of 25,925 km2 (approximately 24 percent) of land area within KBAs is within the
boundaries of existing Category I-IV protected areas. The level of cover by protected areas for

77
individual KBAs is presented in Appendix 5. Twenty KBAs have at least 90 percent of their area
within the boundaries of Category I-IV protected areas and, in most cases, share the same
boundaries. An additional eight KBAs have between 10 and 90 percent of their area within
Category I-IV protected areas. Therefore, 109 of the 137 KBAs are provided little or no
protection by the current protected area network. This lack of potential protection for KBAs
through inclusion within the protected areas network is an issue to be addressed for all countries
of the hotspot.
4.3.6 Data Gaps, Research Priorities and Proposed KBAs The KBA analysis and consultations with partners have shown that much remains to be
understood regarding biodiversity in the Guinean Forests Hotspot. Locality data are entirely
unavailable for some species, and many others lack locality data over part of their range. Plant
species represent a particularly significant gap and therefore represent a high priority for further
field research. IUCN Red List assessments are also lacking for many species, with plants,
butterflies and reptiles (particularly in parts of the Lower Guinean Forests subregion) notably
incomplete.
As a possible way forward for filling the major gap in assessment of plants for the IUCN Red
List, it has been recommended that, given the large number of species present, future assessment
of plant species should prioritize those classed as “useful species”, country endemics and wild
crop relatives (Schatz 2009). Once a species has been assessed and its status is known,
restoration measures might be appropriate for ensuring the survival of some threatened species
(Keenleyside et al. 2013). For those which cannot be conserved in situ, ex situ conservation
techniques, or cultivation of species outside their native habitats are recommended (Müller and
Eriksson 2013). For other species threatened by trade, such as the Vulnerable Prunus africana,
better enforcement of existing regulations may be required.
While the KBAs presented in the ecosystem profile represent the current confirmed KBAs within
the hotspot boundaries it is important to emphasize that the process of identifying KBAs is
iterative, and further refinement of the KBA analysis should be considered as a part of the CEPF
investment in the hotspot, in particular for plants and for freshwater subcatchments. Additionally,
given the serious outbreak of Ebola in a number of countries in the hotspot, it proved difficult to
obtain the necessary stakeholder input to identify more than a handful of additional KBAs for
terrestrial vertebrates. One would expect, therefore, the number of KBAs and their trigger
species to increase as additional data and stakeholder input are obtained. A notable geographic
gap is Sierra Leone, where stakeholder consultation for the profile was highly constrained by the
Ebola outbreak.
Only a small number of freshwater KBAs have been identified to date, because the stakeholder
workshops necessary to identify and confirm freshwater KBAs have still largely to be conducted.
Consequently, there are many gaps in the current freshwater KBA network and many threatened
and restricted-range species remain outside of these sites.

78
Finally, although outside of the hotspot boundary, KBAs for nearshore marine fishes, which
provide significant socio-economic benefits to people living within the hotspot, are still to be
identified.
4.4 Corridor Outcomes
There exist multiple different definitions of a “conservation corridor” (see:
http://conservationcorridor.org/library/), and thinking on corridors has somewhat shifted away
from simply assessing priorities and applying a relatively rigid definition of a corridor as merely
a mechanism to ensure connectivity for species (CSIRO 2008). A more fluid and flexible
approach is developing, as the corridor concept matures. There is a greater recognition of the
potential to manage landscapes proactively for maintenance of ecological functions, adaptation
to global change, and towards sustainable economies. In addition, a more sophisticated set of
conservation tools and analytical approaches are increasingly being employed to recognize and
tackle the multitude of emerging priorities and opportunities, threats, trade-offs and synergies
that occur across broad landscapes (e.g. systematic conservation planning tools, such as
MARXAN). These tools were not used for this exercise, in order to more easily incorporate the
results of previous conservation planning exercises in the region, which had established spatial
priorities at site and landscape scale with broad acceptance among key stakeholder groups.
For the purposes of the ecosystem profile, the following set of selection criteria was employed:
1) Hydrological units. The use of hydrological catchments as units for corridor and KBA
design was investigated and recommended through the collaborative CSIRO/CI
workshop on corridors (CSIRO 2008) and was subsequently adopted as one of the
corridor selection criteria for the profile. Hydrological systems are hierarchically nested
based on natural topographic attributes, and this allows for logical and biological scaling.
Catchments were also used in the profiling process as planning units for the definition of
freshwater KBAs. This allows adoption of a basin-wide approach to conservation, which
fulfils the need for connecting terrestrial, freshwater and marine biomes that are
intricately linked and often impacted by threats that permeate across all three biomes. For
example, land-based pollution, such as sedimentation following deforestation, has
downstream effects in a catchment impacting rivers lakes and wetland ecosystems and
ultimately the near shore marine environment. A final added benefit of the catchment
approach is that it allows for the inclusion of transboundary corridors, which are
important for terrestrial and freshwater ecosystems, particularly as species (and their
associated threats) do not stop at national borders, while environmental policy often does.
Overall, this approach aims to help overcome disciplinary/political boundaries and
facilitate integrated management of terrestrial, freshwater and marine environments.
2) Existing corridors. Pre-existing widely recognized landscape-scale corridors were
incorporated into the corridor analysis.
3) Clusters of connected KBAs. This was adopted as a selection criterion because site-based
actions throughout the corridor at KBAs should lead to benefits greater than the sum of
all individual actions, in large part due to the connectivity of species movements and

79
spread of threats between KBAs. For example, reforestation of upland KBAs may
provide downstream benefits to other KBAs in the corridor through a reduction in
sedimentation loading. Actions at KBAs throughout a corridor may also help ensure
species migration routes are maintained.
4) Clusters of spatially proximate KBAs. Where KBAs are located in the same area, even if
not apparently connected in any hydrological or ecological sense, they may be grouped
into corridors for ease of management as an investment package.
Following the above criteria, and in consultation with stakeholders through the consultation
workshops, nine corridors, covering a total area of 413,183 km2 (part of which includes the
marine environment) were identified (Table 4.12; Figure 4.14). Four of these corridors are
restricted to single countries, three are bi-national and two are tri-national. One hundred and five
of the 137 KBAs in the hotspot are included within these corridors. All of them contain at least
one Priority 1 or 2 KBA, with one corridor (Korupmba-Obachap) containing 22. Figure 4.14 Conservation Corridors in the Guinean Forests Hotspot

80
Table 4.12 Corridors Delineated within the Hotspot and Selection Criteria Met
No. Corridor Name Area (km2) Countries
Selection criteria met
1 Sierra Leone Coastal Corridor 17,096 Sierra Leone 4
2 Lofa-Gola-Mano Complex 47,545 Sierra Leone, Liberia, Guinea
1, 2, 3, 4
3 Mount Nimba Complex 6,829 Guinea, Côte d’Ivoire, Liberia
2,4
4 Cestos-Sapo-Grebo-Taï-Cavally Corridor
70,278 Liberia, Côte d’Ivoire 2,3,4
5 Bandama River Catchment 8,389 Côte d’Ivoire 1,3
6 Forest Reserves of Southeastern Côte d’Ivoire and Southwestern Ghana
72,579 Côte d’Ivoire, Ghana 4
7 Togo Highlands 6,049 Togo 4
8 Lower Niger Delta 65,743 Nigeria 3,4
9 Korupmba-Obachap 118,675 Cameroon, Nigeria 1,3,4
Total 413,183
4.5 Ecosystem Services As summarized in Chapter 3, the ecosystems of the Guinean Forests Hotspot provide many vital
services for human populations. The Co$ting Nature ecosystem service valuation tool was
employed to identify those corridors with particular value in providing a subset of these services
Co$ting Nature is a web-based tool for natural capital accounting and analysing ecosystem
services, identifying the beneficiaries of these services and assessing the impacts of human
interventions (see http://www.policysupport.org/costingnature).
4.5.1 Provisioning Services Water Services Water-provisioning analysis shows the relative realized water provisioning services for the
region, calculated using the Co$ting Nature water provisioning services module (Figure 4.15).
The map is based on the relative volume of clean water (not impacted by humans) that is
available to be used by people downstream of the water source. Areas shown as ‘high’ on the
map represent areas where the water services are being enjoyed (realized) by local people, and
where most benefit can be gained from its use for domestic purposes, agriculture, energy
production, etc. As this map represents the realized services derived from water based on
downstream use, the region’s geography and flow direction should be considered when
interpreting it.
Based on this analysis the most important region within the hotspot for water provisioning is the
Fouta Djallon Massif in the highlands of Guinea, a small part of which is included within the
northwest of the hotspot. Headwaters for north-flowing rivers, including the Senegal and Niger,
as well as shorter, more torrential, south-flowing rivers, emanate from the Fouta Djallon.
Overall, this part of the hotspot is ecologically important as a major source of water for a wide
part of western Africa. Protection and management of this area is of international concern,
although the vast majority of the area lies outside of the hotspot. The freshwater biodiversity of

81
the area is noted for its high levels of endemism, such that there are likely to be sites that would
qualify as KBAs in the future.
Figure 4.15 Map of Realized Water Provisioning Services in the Guinean Forests Hotspot
Source: Co$ting Nature tool
In Côte d’Ivoire the Bandama Rouge Mountain range at the head of the Bandama River is noted
for high levels of water provisioning. The Lower Bandama River (fw3) is directly downstream,
and the species in this KBA are currently threatened by upstream water abstraction and dams.
Management of environmental flows in this river system would be highly beneficial, not only for
people but also for the biodiversity in the downstream river reaches. Another area noted for high
realized water services is Oyo State of western Nigeria, where the headwaters of a number of
major rivers are located, including the Ogun, Oba, Oyan Otin, Ofiki, Sasa, Oni, Ernine and Osun.
Like the Fouta Djallon, this area is, however, largely located beyond the boundaries of the
hotspot. Finally, the Cameroon Mountains in Korupmba-Obachap (Corridor 9) are also noted as
having the highest area of realized water provisioning services within the conservation corridors.
Overall, however, the hotspot does not overlap greatly with areas of highest realized water
provisioning services, which are found further north, in arid and semi-arid areas, where water has
a higher value.

82
Timber and Non-timber Forest Products The provision of goods and materials from the hotspot’s forests, including medicine, housing
materials and food, is quite high, contributing 25 to 35 percent of non-cash income to rural
households. For instance, the Dozobele community, a group of medical practitioners found in
some of the hotspot countries, (e.g. Côte d’Ivoire, Guinea and Sierra Leone; Leach 2004) provide
the majority of the medical care to local populations in the Upper Guinean Forests subregion.
Bushmeat is probably the most valuable non-timber forest product (NTFP) in the hotspot.
Hunting is also shown to provide an important source of income for rural forest dwellers (Wilkie
and Carpenter 1999), who respond to the increasing demand for wild meat from growing urban
populations (Nasi et al. 2011; East et al. 2005).
Figure 4.16 Map of Forest Cover in the Guinean Forests Hotspot
Source: Hansen et al. (2013).
The supply of timber and NTFPs is likely to be directly correlated to the location of forested
areas within the hotspot. The Lofa-Gola-Mano Complex (Corridor 2), Cestos-Sapo-Grebo-Taï-
Cavally Corridor (Corridor 4), Forest Reserves of Southeastern Côte d’Ivoire and Southwestern
Ghana (Corridor 6), Lower Niger Delta (Corridor 8) and Korupmba-Obachap (Corridor 9) all
have over 30,000 km² of closed, open or fragmented forest (USGS 2002). Conversely, the
remaining corridors all have less than 10,000 kilometers² of forest cover, mainly because of
differences in size among them (Figure 4.16).

83
Fisheries Although it is difficult to ascertain the size of the artisanal fishery in the region, it is estimated
that in the region of western Africa spanning Mauritania, Chad and Gabon, 2 million individuals
rely on small-scale fisheries as their primary source of income, and another 6 million depend on
fishing resources as part of a diversified livelihood (WASSDA 2008). In Ghana alone, there are
an estimated 10,000 artisanal vessels and 170 industrial vessels, which employ more than
200,000 individuals directly, and provide more than 1.5 million jobs in related fishery sectors
(FAO 1999).
Data on the relative contribution of mangrove-related species to total fisheries catch is lacking
for western Africa, but is significant in regions where it is studied, with 67 percent of the entire
commercial catch in eastern Australia, 49 percent of the demersal fish resources in southern
Malacca Strait, 30 percent of the fish catch and almost 100 percent of shrimp catch in ASEAN
countries (Walters et al. 2008).
It is difficult to quantify the economic value of, or reliance upon, wetland goods and services by
local communities, but it is worth noting that the value of fisheries production for the major river
systems in western Africa is estimated as just over USD 200 million per year (The World Fish
Center 2008). Protein from fish also makes up a large proportion of the total protein from fish
and livestock sources in hotspot countries (see Section 5.3.2). All of the corridors, with the
exception of Mount Nimba Complex (Corridor 3), Forest Reserves of Southeastern Côte d’Ivoire
and Southwestern Ghana (Corridor 6) and Togo Highlands (Corridor 7), contain a Priority 1 or 2
freshwater KBA.
4.5.2 Regulating Services Carbon Storage and Climate Mitigation The potential carbon services for the region were calculated using the Co$ting Nature carbon
services module, which takes into account relative carbon sequestration and carbon stock
services, from living plant biomass and soil. The potential carbon value represents an ecosystem
service with global beneficiaries. The Lofa-Gola-Mano Complex (Corridor 2), Mount Nimba
Complex (Corridor 3), Cestos-Sapo-Grebo-Taï-Cavally Corridor (Corridor 4) and Korupmba-
Obachap (Corridor 9) are notable for their high potential carbon values (Figure 4.17). This is
largely a reflection of the extent and condition of remaining forest in these corridors.

84
Figure 4.17 Map of Potential Carbon Services in the Guinean Forests Hotspot
Source: Co$ting Nature tool.
Water Regulation, Sediment Retention and Microclimate Regulation by Forests Forests help protect river catchments and provide hydrological services, such as supplying water
for domestic and industrial consumption, irrigation, and power generation (Millennium
Ecosystem Assessment 2005). Enrichment of soil by leaf litter is another service provided by
forests, as well as a role in the regulation of local climate due to interaction with the water cycle
(Millennium Ecosystem Assessment 2005). However, the ability of forests to regulate these
services is affected by a variety of factors, such as intensity of rainfall, soil conditions, etc. Data
on these factors is not readily available for the hotspot, and studies in other areas have
encountered a similar lack of data with widely varying estimates of value as a result (Ninan and
Inoue 2013). In addition, services may not scale linearly with forest cover (Thorsen 2014).
However, as forest has to be present to provide these services, forest cover could be taken as an
indication of the likelihood of providing these ecosystem services. Using this proxy, the Lofa-
Gola-Mano Complex (Corridor 2), Mount Nimba Complex (Corridor 3), Cestos-Sapo-Grebo-
Taï-Cavally Corridor (Corridor 4), Forest Reserves of Southeastern Côte d’Ivoire and
Southwestern Ghana (Corridor 6) and Korupmba-Obachap (Corridor 9) are likely to be the most
important for the provision of these regulatory services (see Figure 4.16).

85
Flood Regulation by Coastal Systems The presence of coastal ecosystems, such as mangroves, can reduce the damage caused by
hurricanes or large waves (Millennium Ecosystem Assessment 2005). The provision of this
service will, therefore, overlap to a large extent with the provision of nursery habitats for fish.
4.5.3 Supporting Services Forest Biodiversity Korupmba-Obachap (Corridor 9) contains three Globally Outstanding ecoregions with high
species richness and endemism (Cameroonian Highlands Forest, Cross-Sanaga-Bioko Coastal
Forests, and Mount Cameroon and Bioko Montane Forests). The Sierra Leone Coastal Corridor
(Corridor 1), Lofa-Gola-Mano Complex (Corridor 2), Mount Nimba Complex (Corridor 3) and
Cestos-Sapo-Grebo-Taï-Cavally Corridor (Corridor 4) also include areas of the Globally
Outstanding Western Guinean Lowland Forest. For further information on the values of these
ecoregions, see Section 3.5.2.
Nursery Habitat for Commercial Fish Species Mangrove areas are critical nursery and spawning grounds for many fish and shrimp species
(Mumby et al. 2004; Ellison 2008), with offshore commercial fishing in the hotspot relying on
mangroves functioning as nursery grounds (UNEP 2007). The Lower Niger Delta (Corridor 8)
contains the Globally Outstanding Niger Delta ecoregion, with the highest concentration of
monotypic fish species in the world, as well as the Locally Important Central African Mangroves
ecoregion. The mangroves and freshwater swamp forests of this corridor provide habitats for
aquatic mammals, mollusks, herpetofauna, and are important for numerous waterbirds. The
Sierra Leone Coastal Corridor (Corridor 1) contains the Continentally Outstanding Northern
Upper Guinea ecoregion, whose mangrove forests are breeding and nesting grounds for many
species of fish, insects and shellfish. For further information on the values of these ecoregions
see Section 3.5.2.
4.5.4 Cultural Services Traditional Sacred Groves Sacred groves are found in all villages and can provide valuable, albeit spatially limited,
protection to forest fragments in farmed landscapes. In Ghana alone, it has been estimated that
between 2,000 and 3,200 sacred groves exist (Gordon 1992). The locations of these traditional
sacred groves have not been comprehensively mapped, so it is not possible to ascertain which
corridors or KBAs are especially important for providing this cultural service. However, the
Osun-Osogbo Sacred Grove in the Nigerian section of the hotspot has been given World Heritage
Site status, which provides cultural services by being an active religious site where daily, weekly
and monthly worship takes place, as well an annual processional festival. See Section 5.1.2 for
further information on sacred groves.
Tourism Services As mentioned in Chapter 3, tourism is of some importance to the economies of western African
countries, especially Nigeria. A spatial map of tourist visits (Figure 4.18) suggests that most
tourism is mainly not associated with forests but, instead, confined to coasts, mountains and

86
some interior savanna protected areas. The map is based on relative density of Panoramio photos
in non-urban areas. Panoramio is a community-powered site for exploring places around the
world through photography: cities, natural wonders, etc. These photos are made available
through Google Earth. Generally, areas on the map showing up as ‘high’ on the index (blue dots)
mean there is a sight of interest to tourists in the region. However, as this a realized index, some
countries may show low nature-based tourism if they contain areas of interest to tourism that
cannot be accessed due to political unrest, difficult access or some other reason, as is the case for
Liberia. Potential tourism services will therefore not always be represented here if access is
restricted at present.
Hotspot countries have seen an increasing trend in tourist numbers since 2000, although numbers
are still much lower than other countries in the area. Nigeria has the highest visitor numbers
compared to other countries within the hotspot, with just under 4.5 million visitors in 2012
(World Bank 2015a). Unfortunately, events in West Africa over the past couple of years have
further reduced tourism flows to the Upper Guinea portion of the hotspot, especially during the
recent Ebola crisis. See Section 5.1.1 for further discussion. Nevertheless, a few of the forest
protected areas in the hotspot do attract appreciable numbers of tourists, as below:
Kakum National Park. Located in the central region of Ghana, this national park covers
360 km2 of rainforest. Seven primate species are found in the park, including Diana monkey,
together with more than 500 species of butterflies and about 250 species of birds. The park
became Ghana’s first protected area in 1994 and has received major international support for
visitor facilities, including a canopy walkway. Tourism numbers have increased over the years:
2,000 in 1992; 27,000 in 1996; over 70,000 in 1999; and 135,870 in 2009. More recent figures
could not be located but the site is known to remain very popular, particularly with domestic
visitors, including school children.
Gola Forest Reserve. Despite being promoted as a visitor attraction, the number of tourists to
Gola is extremely low, with possibly no visitors throughout 2014, due to the Ebola outbreak in
Sierra Leone. The Western Area Peninsula National Park outside the capital Freetown received
more visitors, with people staying on beach hotels taking short trips to see the forest.
Taï National Park. Cote d’Ivoire was once a popular destination for foreign tourists, especially
from France. Some of these tourists visited Taï National Park to see wild chimpanzees. Numbers
of tourists have fallen since the civil wars but figures for the actual number of tourists visiting
Taï in recent years are not available. Since 2009, the Wild Chimpanzee Foundation has been
helping communities around the park to develop a community-based ecotourism project that
offers a range of touristic activities based on the concept of Nature and Culture to highlight the
exceptional heritage of Taï and its surroundings (WCF 2015).

87
Figure 4.18 Map of Realized Nature-based Tourism Services in the Guinean Forests Hotspot
Source: Co$ting Nature tool.
5. SOCIOECONOMIC CONTEXT OF THE HOTSPOT The 11 countries of the Guinean Forests Hotspot are highly complex from both social and
economic standpoints. The complex mix of cultures and indigenous groups found across the
region has been further complicated by historic and ongoing migrations of people, including into,
from and within the hotspot and its countries. Historical and contemporary periods of civil unrest
and disease outbreaks have contributed to the remaining high levels of poverty in the region and
acted as obstacles to development. Amidst all this, many of the region’s industries, such as
agriculture, mineral and oil extraction and forestry, among others, have continued to shape the
landscapes.
All of these factors have implications for biodiversity conservation, and can significantly
influence the success of conservation efforts in the region. This chapter provides the
socioeconomic context of the region, and links this to biodiversity conservation. It presents
information on the culture, social status and demography of the hotspot’s human populations, as
well as on major economic trends and sectors. As appropriate, this information is placed within
the context of nature conservation, in order to paint a picture of how these complex topics are
inter-related. The chapter is based upon a review of current knowledge, as documented in the

88
published literature, and is complemented by information gathered through consultations with
selected stakeholders across the region.
5.1 Introduction and Historical Context 5.1.1 Historical Context Recent archaeological investigations reveal that forests in Cameroon were occupied by people
from the Middle Stone Age (as early as 280,000 years ago, Lavachery et al. 2012). There is
evidence of sedentary farming and cattle domestication in West Africa from the 5th
millennium
BC and archaeological records show evidence of iron smelting and forging in Cameroon as early
as 3,000 to 2,500 BC (Zangato and Holl 2010).
Successive waves of immigration and colonization have occurred through pre-historical and
historical times. The Bantu expansion into Central Africa probably originated in what is now
Cameroon and Eastern Nigeria but the direction of expansion was to the south and east. Hence,
West Africa is largely populated by non-Bantu speaking peoples (see Section 5.1.2). Within the
hotspot countries, only some southern Cameroon tribes and the Fang people of Equatorial
Guinea (80 percent of the population) are of Bantu origin.
Significant West and Central African empires in historical times included the Sao and Kanem-
Borno Empires in the Chad Basin and the Kano and other Hausa Kingdoms, which were
absorbed into the Islamic Sokoto Caliphate in 1805. In West Africa, the Nok culture from 1,000
BC was followed by the Ghana, Mali and Songhai Empires in the 1st and 3
rd centuries AD. These
vast, wealthy empires were based on gold, salt mining and camel trade with North Africa, across
the Sahara Desert, and were also associated with the southward and westward spread of Islam.
Further south, the 10th
century Kingdom of Nri fostered the development of the Igbo peoples and
the Akan Empire of Ashanti. Camel trade across the Sahara brought influences from
Mediterranean, Arab and Nile Valley cultures, and sea routes brought wider European influences
from the 15th
century onwards.
European coastal settlements and trade (including the slave trade) generated huge impacts from
the 15th
century onwards, as did European colonialism in the 19th and 20th centuries. By the
beginning of the 20th
century, among the hotspot countries, only Liberia was independent (having
gained independence from the United States in 1862). Britain was the colonial power in Sierra
Leone, Gold Coast (part of present-day Ghana) and Nigeria. France controlled Guinea, Côte
d’Ivoire and Benin as part of ‘French West Africa’. Until the Treaty of Versailles in 1919,
Germany was the colonial power in Togoland (encompassing part of present-day Ghana and the
nation of Togo) and most of Cameroon (subsequently divided between British and French rule).
São Tomé and Príncipe was under Portuguese rule, having been discovered uninhabited in the
15th
century. Portugual also colonized Bioko (Fernando Po), which was later ceded to the
Spanish as part of ‘Spanish Guinea’, now Equatorial Guinea. All of these countries gradually
gained independence from 1957 onwards.
The interaction between immigrants and Indigenous Peoples has had huge impacts on cultures
across the hotspot. Also, colonial history has a large effect on present-day systems of governance

89
and policy relevant to conservation. For example, policies related to forest and protected area
management in Francophone and Anglophone countries are very different (see Chapter 6).
Since independence, land tenure in the hotspot countries has typically been based on a blend of
customary and statutory rights, although there have often been inconsistencies between the two
systems. This can result in conflict, for example between those holding land under customary
law and governments wishing to enforce their access to national (i.e. unregistered) land (USAID
2015). Some governments (e.g. Cameroon and Côte d’Ivoire) have in recent years been seeking
to address this issue by introducing reformed land laws, aimed at easing formalization of
customary land tenure through use of supportive registration processes. However, perceptions are
that these reforms have had limited success (USAID 2015). One example is of the Bagyéli
pygmy people in Cameroon, who have a customary system of land tenure involving communal
access to forest resources as members of residential units. During a compensation program by
the Cameroon Oil Transport Company, however, these customary rights were not taken into
account, and in 2012 the United Nations Economic Commission for Africa (UNECA) stated that
the Bagyéli had received no individual compensation for the pipeline project (UNECA 2012).
Chapter 8 examines in further detail the implications of land tenure arrangements for
conservation outcomes in the hotspot.
In March 2014, cases of Ebola Virus Disease were reported in Guinea, marking the recognized
beginning of the worst recorded outbreak of this disease. The most severely affected countries
were Guinea, Liberia and Sierra Leone, with a total of 26,969 confirmed cases and 11,135
confirmed deaths as of May 2015 (WHO 2015). While Liberia recently reached zero cases, new
cases are still occurring in Guinea and Sierra Leone. The outbreak will only be considered to
have ended 42 days after the last confirmed case has tested negative twice for the virus (WHO
2015). International organizations such as the World Health Organization (WHO), the World
Bank and international governments are coordinating public health and fiscal responses to the
outbreak.
Ebola has had a significant impact on the economies of the affected countries, with a predicted
forgone USD 1.6 billion in economic growth in 2015 (Thomas et al. 2015). The economic
impacts are due to a reduction in tourism to the region and contraction of production in key
industries, especially in Liberia and Sierra Leone. Although there are no tourism figures for
Guinea since 2008, it is likely that the same effect has occurred there. There is also predicted to
be a smaller economic impact beyond the three most affected countries.
As well as the economic impact, Ebola is likely to have affected conservation efforts in the
hotspot, although it is too soon to accurately quantify the impact, due to a lack of scientific
research on the subject. Potential impacts include hampering conservation efforts by impeding
the movement of people around the hotspot, reduction in available funds due to reduction in
tourism numbers (potentially for a considerable time after the current outbreak is declared over),
and increased pressure on natural resources due to shortage of food and other supplies (see
discussion in Altizer and Rushmore 2014). As the Ebola virus can also be transmitted to apes,
there is also a potential threat to western gorilla and chimpanzee populations, should this happen.

90
5.1.2 Religions, Languages and Ethnicity Islam is the predominant religion of the interior and western coast of West Africa. Within the
hotspot, traditional Muslim areas include Guinea (more than 90 percent of the population),
inland areas of Sierra Leone and Liberia, and the northern halves of Cameroon, Nigeria, Benin,
Togo, Ghana and Côte d’Ivoire (Table 5.1).
Table 5.1 Languages, Ethnic Groups and Religions of the Hotspot Countries
Country Number of
Extant Languages
Major Ethnic Groups Religions and Belief
Systems
Benin 55
Fon and related 39.2%, Adja and related 15.2%, Yoruba and related 12.3%, Bariba and related 9.2%, Peulh and related 7%, Ottamari and related 6.1%, Yoa-Lokpa and related 4%, Dendi and related 2.5%, other 1.6%, unspecified 2.9%
Christian 43%, Muslim 24%, indigenous beliefs 17%, other 16%
Cameroon 280
Cameroon Highlanders 31%, Equatorial Bantu 19%, Kirdi 11%, Fulani 10%, Northwestern Bantu 8%, Eastern Nigritic 7%, other African 13%, non-African < 1%
Indigenous beliefs 40%, Christian 40%, Muslim 20%
Côte d’Ivoire
81 Akan 42.1%, Voltaiques or Gur 17.6%, Northern Mandes 16.5%, Krous 11%, Southern Mandes 10%, other 2.8%
Muslim 38%, Christian 33%, indigenous beliefs 12%, none 17%
Equatorial Guinea
14 Fang 85.7%, Bubi 6.5%, Mdowe 3.6%, Annobon 1.6%, Bujeba 1.1%, other 1.4%
Christian 93%, indigenous beliefs 5%, Muslim 2%
Ghana 81
Akan 47.5%, Mole-Dagbon 16.6%, Ewe 13.9%, Ga-Dangme 7.4%, Gurma 5.7%, Guan 3.7%, Grusi 2.5%, Mande-Busanga 1.1%, other 1.6%
Christian 69%, Muslim 16%, indigenous beliefs 8%, other 1%, none 6%
Guinea 37 Peuhl 40%, Malinke 30%, Soussou 20%, smaller ethnic groups 10%
Muslim 85%, Christian 8%, indigenous beliefs 7%
Liberia 31 Kpelle 20.3%, Bassa 13.4%, Grebo 10%, Gio 8%, Mano 7.9%, Kru 6%, Lorma 5.1%, Kissi 4.8%, Gola 4.4%, other 20.1%
Christian 86%, Muslim 12%, indigenous beliefs 1%, none 1%
Nigeria 520
More than 250 ethnic groups, the most populous being: Hausa and Fulani 29%, Yoruba 21%, Igbo (Ibo) 18%, Ijaw 10%, Kanuri 4%, Ibibio 3.5%, Tiv 2.5%
Muslim 50%, Christian 40%, indigenous beliefs 10%
São Tomé and Príncipe
4 Several ethnic groups, reflecting the complex history of colonialization and settlement
Christian 78%, none 19%, other 3%
Sierra Leone
25 Temne 35%, Mende 31%, Limba 8%, Kono 5%, Kriole 2%, Mandingo 2%, Loko 2%, other 15% (includes Liberian refugees)
Muslim 60%, indigenous beliefs 30%, Christian 10%
Togo 43 37 tribes, of which the largest and most important are Ewe, Mina, and Kabre (99%); other 1%
Indigenous beliefs 51%, Christian 29%, Muslim 20%
Sources: ReligionFacts (2014); Paul et al. (2015).
Christianity was introduced by European missionaries during colonial times and has become the
predominant religion in the central and southern parts of Nigeria, and the coastal regions
stretching from southern Ghana to coastal parts of Sierra Leone. Catholicism is the predominant

91
religion in Equatorial Guinea (87 percent) and São Tomé and Príncipe (72 percent), followed by
other forms of Christianity and traditional beliefs. ‘Traditional African religions’ are also
intimately linked with the historical and cultural heritage of different populations.
Although the majority of the periods of war and unrest seen in the hotspot’s countries (described
later in this chapter) are not typically on sectarian grounds, there are indeed some cases where
this may be a factor. One example is the Boko Haram jihadist group in Nigeria (2009 - present),
whose activities have led to the displacement of millions of people. The implications of such
disputes for conservation in the region are discussed in Section 5.2.4.
Sectarian conflicts aside, the direct influences of religion on biodiversity conservation in the
hotspot are unclear. One exception is the influence of some traditional beliefs and practices,
which can have both positive and negative implications. In Benin, Ghana and Togo, for instance,
traditional sacred groves (sometimes called ‘fetish groves’) are designated as areas where
resource harvest and even entrance by people is highly restricted. This practice is believed to
have local benefits for the conservation of biodiversity held within the groves (Decher 1997;
Campbell 2005; Dudley et al. 2009), although no rigorous and comprehensive studies have been
conducted to examine the extent of these benefits. Conversely, many of the region’s traditional
belief systems involve the practice of harvesting wild species for use in traditional medicines.
Such practices occur throughout the region, and frequently involve the capture and trade of rare
or threatened species, including mammals (Djagoun et al. 2012), birds (Nikolaus 2001, 2011)
and reptiles (Segniagbeto et al. 2013). No comprehensive studies have examined the impacts of
these practices on wildlife populations, although all work describing the practice at a local scale
assumes them to be significant, particularly where threatened species are involved.
Languages across the region are also very diverse (Nigeria alone has 529 officially recognized
languages). Cameroon and Nigeria are part of a core area renowned for global biocultural
diversity including of language (Loh and Harmon 2005). In several countries, a form of Creole is
used (e.g. Krio is spoken by 90 percent of the population of Sierra Leone). There are semi-Bantu
speaking peoples in some parts, including around 5,000 pygmy people in the southern coastal
forests of Cameroon.
Official languages in most countries are those of the former colonial power. Most countries in
West and Central Africa are either Anglophone or Francophone; in some cases, both (e.g.
Cameroon). National languages in Equatorial Guinea and São Tomé and Príncipe reflect their
very mixed histories of colonization and immigration. Equatorial Guinea has three (French,
Portuguese and Spanish) and São Tomé and Príncipe has several languages spoken, including the
official language (Portuguese; spoken by 95 percent of the population), Portuguese-based creoles
such as Forro (85 percent) and Cape Verdean Creole (9 percent). The diverse range of ethnic groups present in the hotspot means that there is potential for
marginalization of groups who are in the minority. Of the hotspot countries, Cameroon, Côte
d’Ivoire, Equatorial Guinea, Guinea, Nigeria and Togo are all listed as having ethnic
communities at risk of repression (Minority Rights Group International 2014). Of these, Nigeria
is listed as the 12th
highest ranked country globally in terms of threats to ethnic groups, due to
activities of Boko Haram in the north of the country and deep-rooted conflicts between settled

92
farmers and nomadic herders. Political and economic marginalization also occurs in hotspot
countries due to land-rights issues (see Section 5.1.1). However, there is no evidence to suggest
that ethnic diversity, by itself, is an impediment to conservation.
5.2 Demographic and Social Trends 5.2.1 Regional and National Demographics; Ecological Footprint of Countries The hotspot countries have a combined population of 282.4 million (Table 5.2). Because it is
bounded by biogeographic and not political boundaries, demographic data specific to the hotspot
are not available, although the total population was estimated at 84.7 million in 2004
(Mittermeier et al. 2004), indicating an average population density of 136 people per km2.
However, centers of population are distributed patchily across the hotspot. While many areas of
the hotspot have between 10 and 100 people per km2, population densities can reach much higher
numbers in major cities.
There are nine population centers with 500,000 or more people in the hotspot countries (see
Section 5.2.2). In Cameroon, two of the country’s major population centers are located within the
hotspot, representing the cities of Douala and Bafoussam, and these are much more expansive
than other population centers within the country. In the Upper Guinean Forests subregion,
population centers are typically smaller and less clustered than in the Lower Guinean Forests
subregion. In Sierra Leone’s component of the hotspot, notable population centers are found in
and around the cities of Freetown, Kenema, Koidu and Makeni. In Côte d’Ivoire’s component,
they are found around the cities of Abidjan, Man and Yamoussoukro. In Ghana, major centers of
population are found around the cities of Accra and Kumasi. In Ghana, human presence is
evident (though often in low densities) across the majority of the hotspot but this is in contrast to
other countries of this subregion, which retain large expanses of unpopulated land within the
hotspot. Liberia has the lowest human presence within the hotspot, with much of the country
remaining uninhabited. Similarly the Togolese and Beninese hotspot components also have low
human presence, likely attributable to the high altitude of these areas compare with the rest of
these countries. High population density areas tend to be focused in coastal areas.
In line with much of Africa, the hotspot countries showed some of the highest rates of population
growth in the world in the early part of the 21st century. Twenty of the highest annual growth
rates were in Africa and Liberia had the highest growth rate in the world in 2007 (4.8 percent).
However, population growth in most hotspot countries appears to have slowed in recent years,
and, although current census data are not available, most are now estimated to have rates of only
a little above 2 percent per year (Table 5.2). Exceptions to this are Benin, Equatorial Guinea and
Liberia, which all have been estimated to have current growth rates of more than 2.5 percent.
Nigeria is the most populous country in Africa (and the 7th
most populous in the world in 2013)
and is predicted to have a population exceeding 250 million by 2030. Nigeria also has one of the
highest population densities in the hotspot (180 people per km2), exceeded only by São Tomé
and Príncipe (191 people per km2), which has a population of only around 200,000 but a very
small land area. The capital district of São Tomé and Príncipe has a population density exceeding
4,200 people per km2, and this is growing fast, making it among the highest densities recorded in
the whole hotspot.

93
Table 5.2 Key Demographic and Ecological Footprint Measures for Countries in the Guinean Forests Hotspot
Country
Land Area (km
2, 2008
data)
Population Density
(people per km
2, 2011
data)
Population in 2013
(millions)
Projected Population
in 2030 (millions)
Annual Population
Growth Rate 2000-2005
(%)
Estimated Annual
Population Growth Rate
2010-2015 (%)
Ecological Footprint of
Consumption (global hectares per capita, 2010)
Total Biocapacity
(global hectares
per capita, 2010)
Ecological Reserve (or
Deficit) (global
hectares per capita, 2010)
Benin 112,622 87 10.3 14.6 3.2 2.7 1.2 0.8 (0.4)
Cameroon 475,442 45 22.3 28.8 2.3 2.1 1.0 1.9 0.8
Côte d’Ivoire 322,463 61 20.3 29.8 1.7 2.2 1.0 1.7 0.7
Equatorial Guinea
28,051 26 0.8 1.1 3.1 2.7 2.4 approx.1
4.2 approx.1 1.8
Ghana 238,553 109 25.9 36.5 2.4 2.3 1.8 1.2 (0.6)
Guinea 245,857 45 11.8 15.9 1.6 2.5 1.7 2.8 1.1
Liberia 111,369 42 4.3 6.5 2.2 2.6 1.3 2.5 1.2
Nigeria 923,768 180 173.6 257.8 2.5 2.5 1.4 1.1 (0.3)
São Tomé and Príncipe
964 191 0.2 0.2 1.6 2.0 1.7 approx.1 0.75 approx.
1 (0.95)
Sierra Leone 71,740 82 6.1 8.5 4.4 2.1 1.1 1.2 0.1
Togo 56,785 119 6.8 8.7 2.4 2.0 1.0 0.6 (0.4)
TOTAL 2,587,614 - 282.4 408.4 - - - - -
Source: UNEP (2008); World Bank (2013); Global Footprint Network (2010); UNDP (2013).
Note: 1 = figure read off graph for 2009.
Ecological Footprint: A measure of how much area of biologically productive land and water an individual, population or activity requires to produce all the
resources it consumes and to absorb the waste it generates, using prevailing technology and resource management practices. The Ecological Footprint is usually
measured in global hectares (a productivity weighted area), which makes data and results globally comparable. For a city or a nation, it is simply the sum of the
Ecological Footprint of all the residents of that city or nation. Because trade is global, an individual or country’s Footprint includes land or sea from all over the
world. Ecological Footprint is often referred to in short form as Footprint. Footprint varies each year with consumption and production efficiency. The global
average is 2.7 global hectares per capita; the African average is 1.4 global hectares per capita.
Biological Capacity or Biocapacity: The capacity of ecosystems to produce useful biological materials and to absorb waste materials generated by humans,
using current management schemes and extraction technologies. “Useful biological materials” are defined as those demanded by the human economy. Hence
what is considered “useful” can change from year to year. The biocapacity of an area is calculated by multiplying the actual physical area by the yield factor (a
factor that accounts for differences between countries in productivity of a given land type) and the appropriate equivalence factor (a productivity based scaling
factor that converts a specific land type into a global hectare). Biocapacity is usually expressed in global hectares. Biocapacity varies each year with ecosystem
management, agricultural practices (such as fertilizer use and irrigation), ecosystem degradation, weather and population size.

94
Population density does not correlate with ecological footprint, however. For example, Nigeria
has one of the highest population densities but only the sixth highest ecological footprint of the
hotspot countries (Table 5.2). Nevertheless, when considering the ecological deficit or reserve of
the hotspot subregions (i.e. by how much the footprint exceeds the biocapacity of the country),
the five countries with the highest population density (Benin, Ghana, Nigeria, São Tomé and
Príncipe, Togo) are also those which have an ecological footprint exceeding their biocapacity
(Table 5.2). This suggests that, as the hotspot countries’ populations continue to grow, their
biocapacity will be exceeded or further exceeded, with unsustainable exploitation of natural
resources. To account for the complex relationship between the growing human population
densities and their associated environmental pressures, human demography has been considered
as an underlying driver, rather than a direct threat to biodiversity, including in the review of
threats (Chapter 8) and in the prioritization process used to define conservation outcomes
(Chapter 4) and investment priorities (Chapter 12).
5.2.2 Urbanization and Migration Trends
The hotspot contains cities with populations of 500,000 or more. These comprise: Conakry in
Guinea, Freetown in Sierra Leone, Monrovia in Liberia, Abidjan in Côte d’Ivoire, Kumasi in
Ghana and Abeokuta, Ibadan, Benin City and Port Harcourt in Nigeria. Accra in Ghana, with a
population of 2.3 million, is directly adjacent to the hotspot and depends heavily on the
ecosystem services it provides.
Table 5.3 Rural versus Urban Populations, and Past, Present and Projected Future Rates of Change in the Urban Population for each Hotspot Country
Country
Population of Urban and Rural Areas at Mid-Year (thousands) and Percentage Urban in 2014
Average Annual Rate of Change of the Urban Population (per cent) for three
time periods
Urban Rural Total Percentage
urban 2005-2010 2010-2015
2015-2020 (projected)
Benin 4,612 5,987 10,600 43.5 3.92 3.67 3.55
Cameroon 12,281 10,538 22,819 53.8 3.76 3.60 3.40
Côte d’Ivoire 11,126 9,679 20,805 53.5 3.27 3.69 3.39
Equatorial Guinea
309 469 778 39.8 3.04 3.12 3.09
Ghana 14,118 12,324 26,442 53.4 3.92 3.40 3.07
Guinea 4,418 7,626 12,044 36.7 3.76 3.82 3.73
Liberia 2,168 2,229 4,397 49.3 4.57 3.36 3.24
Nigeria 83,799 94,718 178,517 46.9 4.83 4.66 4.30
São Tomé and Príncipe
128 70 198 64.5 4.14 3.58 3.03
Sierra Leone 2,456 3,749 6,205 39.6 3.07 2.75 2.72
Togo 2,760 4,233 6,993 39.5 3.88 3.83 3.60
TOTAL 138,175 151,622 289,798 47.7 - - -
Source: United Nations, Department of Economic and Social Affairs, Population Division (2014).
Although figures specifically relating to the hotspot are not available, population data have been
collated by the United Nations, Department of Economic and Social Affairs, Population Division

95
(2014). Almost all countries in the hotspot experienced significant increases in the percentage of
their populations classed as urban, between 2000 and 2012. Moreover, these trends are projected
to continue into the future (Table 5.3). Despite this, rural populations continue to grow, although
percentages (mostly 50-60 percent rural) are lower than the Sub-Saharan African average.
Population increases (rural and urban) result from a combination of reproduction and inward
migration. In Equatorial Guinea, for example, the urban growth rate was twice the overall
population growth rate in 2006, driven by rural-urban migration and immigration of foreign oil
workers. Rapid urban growth has social and ecological consequences. For example, in Conakry
(Guinea), rapid growth caused by rural to urban migration and influxes of refugees (at least
600,000) from Liberia, Sierra Leone and Côte d’Ivoire have led to removal or degradation of
most of the woody savannahs and mangroves around the city on the Kaloum Peninsula (CBD
2002 in UNEP 2008; FAOSTAT 2015). As urban population growth is predominantly driven by
overall population growth, rather than rural-urban migration, pressures on environmental
resources are likely to increase. Threats to biodiversity created by the population growth and
urbanisation, as well as potential conservation solutions, are discussed in Chapter 8.
In West Africa, the southward movement of large populations of young men from countries north
of the hotspot is the result of greater economic opportunity in countries such as Cameroon,
Ghana and Liberia. At the same time, their place is being taken by (ex) pastoralists moving
southward, to settle and cultivate, partly as a response to climate change in their rangelands of
origin (Barrios et al. 2006, Warner et al. 2009). With the effects of climate change increasingly
being felt, this southerly migration pattern is likely to be exacerbated.
Three hotspot countries (Côte d’Ivoire, Liberia and Sierra Leone) have experienced major
conflicts and civil war in the last 20 to 25 years. These have had impacts not just on the countries
directly affected but also across the whole region. An estimated 250,000 people have been killed
in the Liberian civil wars, and more than a third of the population displaced to neighboring
countries (Insight on Conflict 2014). The Sierra Leone civil war saw approximately 70,000
casualties and 2.6 million people displaced (UNDP 2006). Since 2009, activities of the jihadist
group, Boko Haram, have also caused displacement of people from northern Nigeria and have
affected areas of northern Cameroon. The directly affected areas do not, at the time writing,
extend within the hotspot boundary. All forms of unrest and conflict, even on smaller scales, can
lead to serious internal and trans-boundary consequences, with mass migrations of refugees and
greatly increased population densities in new, informal settlements and camps. This can result in
serious land and resource degradation in areas with natural resources and infrastructure too
limited to cope with high local population densities. High levels of environmental degradation
can also lead to social and political breakdown and conflict (van Schaik and Dinnissen 2014).
5.2.3 Economic Development Table 5.4 presents economic data for the hotspot countries. Among these countries, Cameroon,
Côte d’Ivoire, Ghana, Nigeria and São Tomé and Príncipe are ranked as lower middle income
countries (World Bank income groups based on Gross National Income (GNI) per capita, Atlas
method) and Equatorial Guinea has upper middle income status (although there are no current
data on the percentage of the population below the income poverty line). The other hotspot

96
countries (Benin, Guinea, Liberia, Sierra Leone and Togo) are all low income and most have
high proportions of their populations below the income poverty line (USD 1.25 per day in 2011)
and/or the national poverty line. However, some higher income countries also have very high
proportions of the population below these thresholds (e.g. Nigeria: 68 percent of population
below the income poverty line). The Income Gini coefficient is a measure of inequality in
income distribution and most hotspot countries have Gini coefficients around or over 40 percent,
indicating relatively large income inequalities. There is no evidence to suggest that poorer
populations rely more on natural resources and hence have greater environmental impact.
Table 5.4 Economic Indicators for the Hotspot Countries
Country
GNI per Capita, Atlas Method
(USD, 2012 data)
World Bank Income Group
(2012 data)
% Population below Income Poverty Line of USD 1.25 per day
(2002-2012 data)
Income Gini Coefficient (2000-
2010 data)
Benin 750 Low 47.3 38.6
Cameroon 1,170 Lower middle 9.6 38.9
Côte d’Ivoire 1,220 Lower middle 23.8 41.5
Equatorial Guinea 13,560 Upper middle No data No data
Ghana 1,550 Lower middle 28.6 42.8
Guinea 440 Low 43.3 39.4
Liberia 370 Low 83.8 38.2
Nigeria 1,440 Lower middle 68.0 48.8
São Tomé and Príncipe
1,310 Lower middle No data 50.8
Sierra Leone 580 Low 51.7 42.5
Togo 500 Low 28.2 34.4
Source: World Bank (2103); UNDP (2014).
The main drivers of economic growth in the region are trade (Ghana), agriculture (Benin, Côte
d’Ivoire, Togo, São Tomé and Príncipe), the tertiary sector including transport (Cameroon), oil
and gas production (Equatorial Guinea, Nigeria), and mining (Guinea, Liberia, Sierra Leone)
(World Bank 2015a). All of the hotspot countries apart from Cameroon, Equatorial Guinea and
São Tomé and Príncipe are members of the Economic Community of West African States
(ECOWAS).
5.2.4 Human Development Table 5.5 shows development indicators for the 11 hotspot countries. In terms of the Human
Development Index (a composite indicator of life expectancy, educational attainment and
command over resources needed for a decent standard of living), all hotspot countries rank
among the lowest in the world, despite considerable recent advances. In the hotspot, Ghana and
São Tomé and Príncipe are the two highest ranked countries (138 and 142 respectively), while
Guinea (179) and Sierra Leone (183) are the lowest ranked (out of 187 countries). This is also
reflected in the stagnation in attainment of the Millennium Development Goals (MDGs) in the
region, undermined by poor governance and the current Ebola outbreak. With the exception of

97
Ghana, Benin, Cameroon and Côte d’Ivoire, more than 50 percent of the populations of hotspot
countries are living below the national poverty line.
Table 5.5 Development Indicators for the Hotspot Countries
Country
Life Expectancy
at Birth (both sexes) (years, 2013
data)
% Population below
National Poverty Line (2002-2012
data)
Infant Mortality Rate (per 1,000 live
births) (2013 data)
Adult Literacy
Rates (%, 2005-2010
data)
Human Development Index (HDI) score (2013
data)
HDI Global Rank (2013
data)
Improvement in HDI rank
(2007-2013 data)
Benin 59 39.0* 70 42.4 0.48 165 -3
Cameroon 54 39.9* 62 70.7 0.50 152 1
Côte d’Ivoire
50 42.7* 68 56.2 0.45 171 -3
Equatorial Guinea
52 76.8** 65 93.9 0.56 144 -5
Ghana 61 28.5 53 67.3 0.57 138 7
Guinea 56 53.0* 67 41.0 0.39 179 -3
Liberia 60 63.8 63 60.8 0.41 175 3
Nigeria 52 54.7 97 61.3 0.50 152 2
São Tomé & Príncipe
66 66.2 44 89.2 0.56 142 -1
Sierra Leone
45 66.4 128 42.1 0.37 183 2
Togo 56 61.7* 69 57.1 0.47 166 -1
Source: UNDP (2014); Population Reference Bureau (2013).
Notes: * = Estimates based on surveys 2002-2006. ** = National data from 2006.
The Global Hunger Index, which combines three weighted indices of undernourishment,
proportion of children underweight and child mortality, is falling in all countries, yet remains
high, with Sierra Leone categorized as having ‘Alarming’ hunger levels, and all other countries
except Ghana having ‘Serious’ ones (Table 5.6).
Table 5.6 Global Hunger Index and Gender Inequality Index Values for the Hotspot Countries
Country Global Hunger Index Scores
Hunger Index Category
Gender Inequality Index
Gender Inequality Index Rank
Benin 13.3 Serious 0.614 134
Cameroon 14.5 Serious 0.622 138
Côte d’Ivoire 16.1 Serious 0.645 143
Equatorial Guinea No data No data No data No data
Ghana 8.2 Moderate 0.549 123
Guinea 16.9 Serious No data -
Liberia 17.9 Serious 0.655 145
Nigeria 15.0 Serious No data No data
São Tomé and Príncipe No data No data No data No data
Sierra Leone 22.8 Alarming 0.643 141
Togo 14.7 Serious 0.579 129
Source: von Grebmer (2013), UNDP (2014).

98
Ghana was the only country in Sub-Saharan Africa among the top 10 improvers worldwide in
2013 for the Global Hunger Index, based on improvement since 1990 (von Grebmer et al. 2013).
Access to services (health services, clean water and sanitation) is improving across the hotspot in
rural and urban areas, although many rural populations and slum dwellers in uban areas still have
very limited access to them.
The Gender Inequality Index is a composite measure reflecting inequality in achievements
between women and men in three areas: reproductive health; empowerment; and the labor
market. Countries in Sub-Saharan Africa perform worse than those in all other regions on earth
and this is the pattern for the hotspot countries, which, despite some improvements from 2000 to
2013, have some of the lowest Gender Inequality Index ranks in the world (UNDP 2014). This is
largely due to high maternal mortality and adolescent fertility rates and huge gaps in educational
attainment. In an analysis of 72 countries on the IUCN Environment and Gender Index (IUCN
2013), Ghana was the only hotspot country assessed as a moderate performer and Liberia and
Cameroon fell into the category of weakest performance. Gender inequality is especially
pertinent to conservation activities (see Al-Azzawi 2013, FFI 2015, IUCN 2015b, WWF 2015),
and the impact of gender inequality as relates to conservation in West Africa is discussed by
Anoko (2008). Impacts can include male-driven exclusion of women from conservation
initiatives and loss of female held natural resource knowledge due to exclusion of women (for
deeper discussion and analysis see the above works). Aspects of poverty, gender and local
livelihoods are discussed in more detail in relation to communities, forest use and non-cash
economies in Section 5.4.2.
5.3 Economic Trends 5.3.1 Key Recent Economic Trends For Sub-Saharan Africa as a whole, economic growth was strong in 2013, with real Gross
Domestic Product (GDP) growth of 4.7 percent; the second fastest growing region world-wide in
2013. It should be noted, however, that there is a large range of growth patterns in the hotspot
countries, with some countries (e.g. Equatorial Guinea) showing very erratic patterns in GDP
growth (Figure 5.1). This is largely due to fluctuations in key export prices (e.g. oil); the Ebola
crisis has also had an impact on economic growth in the region. There has been much foreign
investment in oil, gas and mining exploration and development but service sectors, such as
telecommunications, finance, retail and transport, are also expanding rapidly in many countries,
as consumer incomes rise and domestic demand increases.
During the global financial crisis of 2008-2009, developing country economies, including
hotspot countries, were less affected than those of developed nations and larger economies. This
was largely because their economies were not as linked into global financial markets. This is
reflected in the emergence of a rapidly growing, though still small, middle class. Coupled with
this is a massive increase in consumption and domestic consumer expenditure in the ‘Global
South’, including hotspot countries. There have been exponential rises in internet use and
connectedness within and between countries and increasing ‘South-South’ trade.
Entrepreneurship and new business models are developing, for example the use of mobile phones
for banking, money transfer, paying bills, obtaining information on weather, farming and

99
commodity prices, and provision of business services. South-South trade in the region is,
however, still hampered by barriers to integration, such as inadequate transportation and energy
infrastructure and non-complimentary production structures (Chete 2012, IMF 2013). In many
countries, governments continue to emphasize North-South trade.
Figure 5.1 Annual GDP Growth in the Hotspot Countries since 2005
Source: World Bank (2015a).
Large flows of Foreign Direct Investment (FDI) are making very substantial contributions to
growth in hotspot countries (e.g. an estimated 0.9 percent of total growth in Nigeria between
2003 and 2009). Increasing amounts of this FDI comes from state-owned and private in China,
which also provides preferential loans, training and joint business support to sectors including
garments and textiles, telecommunications, pharmaceuticals, electronics and construction
(UNDP 2013, UNCTAD 2014). Using agreements such as ‘infrastructure for oil’, China has
become a major funding source for infrastructure developments in Africa (PwC 2014). Such
investments can be seen in throughout the hotspot, such as the construction of a new USD 200
million international airport in Sierra Leone by the China Railway International Company (to be
constructed near Freetown, inside the hotspot) and the contracts won by Huawei to provide
mobile phone service in Nigeria (PwC 2013). There is no discernible information on which
KBAs are impacted. It should be noted that between 2007 and 2013 only 4.2 percent of FDI in
Africa originated from China, with the majority coming from the US, UK and UAE (EY 2014).
India is also growing in its importance in terms of FDI in Africa as a whole.
GD
P G
row
th (
An
nu
al
%)
Benin
Cameroon
Cote d'Ivoire
Equitorial Guinea
Ghana
Guinea
Liberia
Nigeria
Sao Tome and Principe
Sierra Leone
Togo

100
Foreign investment in Sub-Saharan Africa also includes the acquisition of very large land areas,
particularly for the development of agro-industries such as biofuel production. This is a concern
where environmental and social standards and governance are weak, and the ecosystem benefits
of existing intact and low intensity managed landscapes are not valued. Rural communities often
have the most to lose and have little ability to be heard in negotiations or in the awarding of
leases at national level. For example, British companies had acquired more than 3.2 million
hectares of land for biofuels in Africa by 2011, including concessions in Ghana, Guinea and
Liberia (The Guardian 2011). Such developments can be seen as welcome investment in the
agriculture sector (FAO 2009) or as a major threat, which may go against the interests of the
local communities (Cotula 2011; Zagerma 2011). In São Tomé and Príncipe, there have been two
major recent concessions granted: 5,000 hectares to the French-Belgian company Socfinco
(locally registered as Agripalma) to grow oil palm and 2,500 hectares to the French-Swiss
company SATOCAO to produce cacao. Although seemingly small, these areas represent nearly
10 percent of the island of São Tomé, which is already crowded and heavily dependent on
imported food.
5.3.2 Main Economic Sectors Agriculture Agriculture is a major economic sector in all countries. Agricultural expansion to feed a growing
population and for commercial export development is the most significant contributor to land-use
change and deforestation across the hotspot and, hence, is the major pressure on species, site and
corridor outcomes (see Chapter 8). As much as 80 percent of the original West African rainforest
may now be an agriculture-forest mosaic (Norris et al. 2010), although patterns of human
influence on forest change are variable across the hotspot and subject to different interpretations
(see Section 5.4). Agriculture makes significant contributions to national GDP (from a 21 percent
share in Guinea to 57 percent in Sierra Leone), as well as to employment (more than 40 percent
of the labor force in most hotspot countries, around 60 percent in Equatorial Guinea, Liberia and
Sierra Leone and 80 percent in Guinea).
In the hotspot, agriculture takes many different forms, ranging from low intensity, traditional
cultivation and grazing, to intensive, commercial crop growing and plantations, for both urban
and export markets. Most rural populations supply both their own needs and a proportion of the
urban demand for cassava, maize and beans, meat, wood fuel and charcoal. Urbanization
increases local demand that has to be supplied from rural areas, and drives the conversion of
more agricultural land in the absence of technologies for the intensification of land-use (Norris et
al. 2010).
There is great variation among hotspot countries with regard to the proportion of land used for
arable and permanent crops (excluding land used for livestock grazing). In Togo, for example, 80
percent of potential arable land is already being used and severe land degradation is occurring in
the absence of affordable fertiliser or effective composting techniques (UNEP 2008). There is
also wide variation in the top commodities grown (by land area). Cacao and other significant
export crops, such as oil palm and rubber, are usually grown as single species monocultures and
plantations.

101
The significance of cacao, especially in Cameroon, Côte d’Ivoire, Ghana and São Tomé and
Príncipe is shown in Appendix 5. In Côte d’Ivoire, one third of the population depends on cacao
cultivation (in 2011, nearly 1.1 million tonnes of cacao beans were exported and cacao beans and
their products accounted for over 60 percent of total export revenues; FAOSTAT 2015). Even
though much smaller in scale, cacao is the most important cash crop in São Tomé and Príncipe,
and most of the islands’ low altitude forests were cleared to make way for expansion of cacao
farming during the last century (UNEP 2008). Commonly, small-scale producers sell to export
companies. Due to the nature of the crop, large scale production by private companies is less
successful than smallholder cultivation. However, the low productivity of smallholder agriculture
in the hotspot has led to an expansion of area under cultivation. It has been postulated that a
switch to more intensive cacao farming methods in the 1960s could have averted over
21,000 km² of deforestation and degradation and the emission of nearly 1.4 billion tonnes of CO₂ (Gockowski and Sonwa 2011). It should also be noted that some areas in the hotspot (e.g. the
Kwahu Plateau in Ghana and southwestern Côte d’Ivoire) are predicted to become more suitable
for cacao production under climate change scenarios (Läderach et al. 2013), potentially
stimulating further expansion of agriculture.
Main exporters of cacao include Cargill in Ghana and Côte d’Ivoire, ADM in Côte d’Ivoire
(under the UNICAO brand), and Cacao Marketing Company and Cacao Processing Company in
Ghana. Cargill and ADM have their own sustainability schemes (the ‘Cargill Cacao Promise’ and
ADM’s SERAP programme), both certified by UTZ. Individual smallholders or co-operatives are
certified by consumer-recognised schemes, such as Rainforest Alliance (with certified farms in
Cameroon, Côte d’Ivoire, Ghana, Nigeria and Togo) and Fairtrade (with certified cooperatives in
Côte d’Ivoire and Ghana). In recent years, São Tomé and Príncipe has also invested in creating
cooperatives to export certified organic cacao and coffee, spices and fairtrade cacao. The
implementation of these projects has brought benefits to rural populations, by offering support
and a better payment to small scale farmers, but their impact on the forests is difficult to assess.
Cacao is normally produced in areas that have been cleared a long time ago, and the stabilization
of the price might reduce pressure on forest resources (R. Lima pers. comm.). The indirect
supply chain of cacao (i.e. the existence of intermediary exporters) makes it difficult to directly
connect major international end-product manufacturers with in-country impacts.
When world cacao prices decrease, countries compensate for declines in foreign exchange
earnings by increasing other export sectors (e.g. timber and minerals in the case of Ghana).
Cacao farming can therefore be both a direct and indirect driver of deforestation and forest
degradation.
Together with the Democratic Republic of Congo, Cameroon, Côte d’Ivoire, Ghana and Nigeria
are the largest producers of palm oil in Africa, responsible for 72 percent of Africa’s total oil
palm production in 2013 (FAOSTAT 2015); figures for 2013 production for the hotspot countries
are shown in Table 5.7. Major private sector producers operating in the hotspot include Presco
Plc (a subsidiary of the Belgian Siat Group), Okomu Oil Palm Company Plc. (in Nigeria), Dekel
Oil (in Côte d’Ivoire), Ghana Oil Palm Development Company Ltd. (a subsidiary of the Belgian
Siat Group), Twifo Oil Palm Plantations Ltd., Benso Oil Palm Plantations Ltd. (Ghana),
SOCAPALM, SAFACAM (both part of the SOCFIN group), Swiss Farm, Cameroon
Development Corporation and PAMOL (Cameroon), Agripalma (São Tomé and Príncipe) (also

102
part of the SOCFIN group). There is strong pressure for expansion of production to supply
increasing demand from China, India and European and North American markets. There are
currently five large companies (French, Swiss and Cameroonian) involved in industrial palm oil
production in Cameroon, and six further multi-nationals believed to be trying to secure more
than 1 million hectares of land for palm oil production in the southern forested zone. This
expansion in Cameroon has potential for achieving poverty reduction, infrastructure expansion,
state revenues and smallholder support but there are also risks, including loss of forest and
farmland for local communities (Hoyle and Levang 2012). The Siat Group and Benso Oil Palm
Plantation have Roundtable for Sustainable Palm Oil (RSPO) certified plantations in Ghana.
Agripalma plantations (operating on São Tomé and Príncipe) are also trying to get RSPO
certification but may have to pay large compensation for having cleared high conservation value
forests. In addition, Unilever (a global buyer of palm oil) has partnered with Solidaridad (an
international CSO) to implement a sustainability initiative in West Africa (including hotspot
countries).
Table 5.7 Oil Palm Production in the Hotspot Countries
Country Production in 2013
(thousands of tonnes) % of Production in Hotspot Countries
% of Production in Africa
Benin 56 2.9 2.4
Cameroon 225 11.6 9.5
Côte d’Ivoire 415 21.3 17.4
Equatorial Guinea 5.5 0.3 0.2
Ghana 120 6.2 5.0
Guinea 50 2.6 2.1
Liberia 43.5 2.2 1.8
Nigeria 960 49.3 40.3
São Tomé & Príncipe 3.5 0.2 0.1
Sierra Leone 60 3.1 2.5
Togo 9 0.5 0.4
Source: FAOSTAT (2015).
Forestry In most hotspot countries, forestry departments in colonial times established extensive networks
of reserves to be managed for production or conservation, though many of these “forest reserves”
have not been managed or protected effectively and many now contain little or no forest.
Forestry as a production sector can be divided into two broad categories. The first category
includes large-scale, commercial logging and timber extraction, including exploitation of natural
and semi-natural (i.e. secondary) forest, and plantation forestry. The second includes smaller-
scale, local or artisanal exploitation for local use and domestic markets (e.g. poles, fuel wood,
charcoal and NTFPs). For maps of forest loss see Chapter 8.
Commercial Logging from Natural Forest
Production forestry and commercial timber logging were large industries in many hotspot
countries in colonial times. Forests were also cleared to make way for cacao production,
especially in Ghana, São Tomé and Príncipe and Côte d’Ivoire. Timber is no longer a major
export commodity for most of the countries, with the exception of Benin, Cameroon and
Equatorial Guinea (Observatory of Economic Complexity 2015) and better forest management
and more selective felling methods used on some plantations have reduced the direct threats to

103
forests and wildlife from the sector. However, the secondary effects (such as increased hunting
using logging roads) remain serious threats to biodiversity (see Chapter 8).
Cameroon is now the only hotspot country in which timber is a top commodity export by value
(UNdata 2015). Large logging enterprises in Cameroon consist of GRUMCAM (a subsidiary of
Italian owned ALPI), PALLISCO (a subsidiary of French PASQUET Group), CFC and CUF
(both Cameroonian companies) (ITTO 2009). Cameroon has a history of weak regulation and
management of logging concessions, and illegal logging (large and small-scale) is still a
widespread problem here, as well as in Côte d’Ivoire. Due to the illicit nature of such activities,
there is no data on any specific KBAs that this might be affecting. However, Mount Lefo
(CMR13), Omo Forest Reserve (NGA11) and Afi River Forest Reserve (NGA1) are all known to
be under threat from logging. In 2009, there was a total of 6.4 million hectares of forest under
concession in Cameroon (equivalent to 34 percent of the country’s total forest area) and the
official export sector accounted for 343,000 m3 of sawn wood. However, ‘official’ export
volumes are dwarfed by those extracted by ‘informal’ chainsaw milling 662,000 m3 and for
domestic markets 860,000 m3. The informal sector is hugely important to rural economies and
provides thousands of jobs but is largely unregulated.
More selective and sustainable approaches to forest management and exploitation are being
adopted in most countries, such as adoption of sustainable forestry policies and creation of
conservation concessions. In 2010, five concessions were certified by the sustainability
certification scheme of the Forest Stewardship Council (FSC), with more under consideration
(ITTO 2011). The market demand for certified wood indicates that other producers may move
towards certification and good management practices.
Plantations Forestry plantations were mainly introduced under colonial rule, when colonists planted fast
growing trees such as pine and eucalyptus. From the mid-20th
century onwards, plantations
increased, mainly with support from international agencies such the World Bank (Jacovelli
2014). Previously run mainly by state forestry departments, plantations are now mainly privately
owned enterprises. Ghana and Côte d’Ivoire are the two main hotspot countries involved in
plantation forestry, with 260,000 and 377,000 hectares respectively, although Ghana has received
more focus from investors, such as Africa Plantations for Sustainable Development, Siricec, and
Miro Forestry Co. (Jacovelli 2014). The main species cultivated are Tectona grandis and
Terminalia sp. The Miro Forestry Co, T. grandis plantations are within the hotspot in Boumfoum,
Ghana; the exact locations of other plantations are unavailable.
Rubber is a major export commodity by value in Liberia (USD 260 million), Côte d’Ivoire
(USD 946 million) and Nigeria (USD 2,643 million), though much less important than cacao and
petroleum products. In Liberia, more than 57,000 hectares of forest have been converted to
monoculture rubber plantations. Major producers include Firestone (with a plantation near
Harbel, a subsidiary of Japanese owned Bridgestone), Liberia Agricultural Company (with a
plantation near Buchanan, part of the SOCFIN group), Guthrie (with a plantation near Baha, a
subsidiary of Sime Darby), and Liberia Company (with a plantation near Cocopa) (VERITE
2011). There is little research examining the environmental impact of African rubber plantations,
although known impacts include surface water pollution by chemical waste from rubber

104
plantations. The wider impacts of large-scale rubber plantations are likely to be similar to thos of
palm oil plantations, i.e. loss of biodiversity, soil degradation, etc., due to forest clearance to
accommodate plantations.
Small-scale Exploitation: Fuelwood, Charcoal, Mangroves
Fuelwood and charcoal represent 90 percent of all wood harvested from African forests
(79 percent in Cameroon and 31 percent in Equatorial Guinea in 2009; de Wasseige et al. 2012).
All hotspot countries show very high dependence on fuelwood (e.g. 95 percent of the population
in Benin and 85 percent in Sierra Leone). In Benin, total production is estimated at over
6 million m3 of fuel wood annually (UNEP 2008). Mangroves are particularly vulnerable to over-
exploitation for poles and charcoal, especially as they occur along the coastal fringe of the
hotspot where the highest population densities and urban centres are found. The interactions
between communities and forests are considered in more detail in Section 5.4.
Guinea’s coastal mangrove forests contain around 25 percent of all West African mangroves,
which are a crucial resource for local economies. Increasing use for a variety of purposes
(e.g. salt production, which used 93,000 tonnes of firewood from mangroves in 2002), coupled
with coastal development pressure due to expanding populations in and around Conakry,
threatens mangrove ecosystems. Over-exploitation in turn leads to declines in the ecosystem
benefits and productivity they support.
Tourism No tourism data exists for Equatorial Guinea or Liberia. The remaining hotspot countries have
seen an increasing trend in tourist numbers since 2000 (Figure 5.2), although numbers are still
much lower than other countries in the region, and form a small proportion of Sub-Saharan
African figures (40.3 million in 2012). Nigeria is an exception to this, with tourist figures much
higher than the other hotspot countries, with 4.7 million in 2012.
In the hotspot, Guinea, Liberia, Togo and Equatorial Guinea are classified as “Pre-emerging” in
terms of their level of tourism development; Benin, São Tomé and Príncipe, Sierra Leone, Côte
d’Ivoire, Cameroon and Nigeria as “Potential/initiating”, and Ghana as
“Consolidating/maintaining and deepening success” (Christie et al. 2013).
Several hotspot countries have suffered decades of civil unrest, making international tourism
largely impossible. The recent Ebola outbreak has also negatively affected tourism. However,
countries like Sierra Leone and Liberia have attractive forests, wildlife and landscapes, pristine
beaches and interesting cultural heritage, music and food. Others countries like Ghana, Nigeria
and Cameroon offer ecotourism products with wildlife-viewing opportunities and established
national tour operators, coupled with cultural history and sophisticated accommodation and
facilities in capital cities. Since the cessation of the various civil wars in the region (see Section
5.2.2), ecotourism initiatives have begun to increase in number. One example is the Tiwai Island
initiative in Sierra Leone, which was restarted in 2003 with the aim of encouraging support for
conservation in local communities and bringing external scientific and recreational visitors to the
area. Other ecotourism initiatives include the Banana Islands and John Obey Beach in Sierra
Leone, the Volta region in Ghana and various sites throughout the parts of the hotspot in Togo
and Benin.

105
Figure 5.2 Number of International Overnight Visitors to Hotspot Countries since 2000
Source: World Bank (2015a).
Only countries with available data are shown; Nigeria is omitted because it had visitors greatly in excess of those of
other hotspot countries (e.g., Nigeria had 4,463,000 visitors in 2012).
These initiatives feature a combination of community-based home-stays and more established
businesses with links to local communities. However, many of these ecotourism initiatives are
likely to suffer from relatively low-visibility in the world market and poor access and hospitality
infrastructure, as well as a likely continued reduction in tourism to the hotspot for the short-term
due to the Ebola outbreak. Low visitor numbers were listed as a concern by the local
communities in the Tiwai Island initiative (Environmental Foundation for Africa 2006). It should
also be noted that there are a number of operators and government tourism websites which use
the term ‘ecotourism’ to refer generally to wildlife/nature/environment based tourism, and
therefore do not meet the definition of ecotourism as laid out the International Ecotourism
Society (i.e. “improves the welfare of local people”).
Fisheries Protein from fish makes up a large proportion of the total protein from fish and livestock sources
in the hotspot countries (Figure 5.3). The hotspot countries with the largest dependence on fish
protein are Ghana, São Tomé and Príncipe and Sierra Leone. São Tomé and Príncipe is
surrounded by water and Ghana has a large freshwater fishery. People in coastal areas tend to be
more reliant on fish protein, which constitutes between 40 and 80 percent of total annual protein
consumed per capita (IGCC 2006).
Nu
mb
er
of
inte
rna
tio
na
l o
ve
rnig
ht
vis
ito
rs
Benin
Cote d'Ivoire
Cameroon
Ghana
Guinea
Sierra Leone
Sao Tome and Principe
Togo

106
Figure 5.3 Percentage of Protein from Fish in Hotspot Countries since 2000
Source: FAOSTAT (2015).
Note: Equatorial Guinea is omitted as there are no data available for this country.
Table 5.8 Percentage Point Difference in Daily Protein Consumption (grams of protein per capita per day) from Different Sources between 2007 and 2011
Country Fish,
Seafood Meat
Milk (Excluding
Butter)
Cereals (Excluding
Beer) Pulses
Starchy Roots
Benin 0.4 3.1 -0.1 -1.3 -3.8 0.9
Cameroon 0.5 -0.6 -0.1 -0.3 0.5 -0.3
Côte d’Ivoire 1.5 -0.3 0.2 -0.5 0.2 -2.2
Ghana -3.3 0.7 0.0 2.0 0.9 -2.1
Guinea 1.1 0.2 0.2 1.0 -1.4 -0.7
Liberia -1.7 3.4 -0.3 2.0 -0.9 -2.3
Nigeria -0.6 0.4 -0.6 0.4 -0.4 1.5
São Tomé & Príncipe -0.7 2.6 -1.8 -0.5 0.7 0.2
Sierra Leone 2.6 0.9 0.1 -2.6 -2.7 0.4
Togo -0.2 1.2 -0.2 -1.1 0.5 -0.7
Source: FAOSTAT (2015).
Notes: Equatorial Guinea is excluded from the table as there are no data from this country. 2011 is used because it is
the most recent year with data. Only those food groups for which one or more countries showed a change equal to or
greater than one percentage point are shown.
% o
f P
rote
in s
up
ply
qu
an
tity
(g
/ca
pit
a/d
ay)
fro
m F
ish
Benin
Camerooon
Côte d'Ivoire
Ghana
Guinea
Liberia
Nigeria
São Tomé and Príncipe
Sierra Leone
Togo

107
In the last five years for which there are data (2007-2011), five countries (Ghana, Liberia,
Nigeria, São Tomé and Príncipe and Togo showed a decrease in the percentage of protein in the
diet originating from fish (Table 5.8). In Liberia, São Tomé and Príncipe and Togo this is
attributable to an increase in dietary protein originating from meat, whereas in Ghana and
Nigeria the deficit is met by an increase in consumption of cereals and starchy roots,
respectively. The drop in consumption of fish protein is likely to be driven by a combination of
dwindling fish stocks due to overfishing (see below) and an increase in the availability of meat.
In Ghana especially the reduction in fish consumption per capita is more likely to be due to a
switch in consumer preference, as Ghana is one of the best performing of the hotspot countries in
terms of economic and development indicators (see Section 5.2).
Of the 11 hotspot countries, seven have a marine or freshwater product as one of their top 20
exports (see Table 5.9). However, the percentage share of the total exports for these products is
low (between 0.28 and 3.1 percent), indicating that their main importance to the economy is as a
food source for the local population, rather than as an export commodity.
Table 5.9 Value of Fish and Marine Product Exports by the Hotspot Countries
Country Export product In-country Ranking in Terms of %
of Total Exports Value (USD)
% of Total Exports
Côte d’Ivoire Processed Fish 12 186,544,747 1.5
Ghana Processed Fish 8 150,894,900 0.92
Guinea Non-fillet Frozen Fish 7 43,310,720 3.1
Processed Fish 13 6,988,835 0.49
Liberia Fish Fillets 14 2,517,095 0.27
Nigeria Crustaceans 9 349,405,301 0.28
Sierra Leone Crustaceans 18 2,128,140 0.28
Source: Observatory of Economic Complexity (2015).
Freshwater
Freshwater river systems in the hotspot are highly productive, and it is frequently the poorest
communities who rely most directly on freshwater resources (particularly fish and crustaceans)
as sources of protein. Nearly 14 percent of the land area in Liberia consists of fresh water and
fisheries provide over half the overall population’s protein intake and 10 percent of GDP (UNEP
2008). Many rivers are seasonal and artisanal fishing takes place on floodplains in rivers and
seasonal pools, which also function as fish breeding, nursery and shelter areas. Lake Volta is the
most important inland fishery in Ghana (with around 140 species of fish, many exploited
commercially for sale in markets) but over-fishing has resulted in stagnation of the commercial
fishery. Reduced water levels (probably due to erosion and siltation associated with operation of
a hydropower dam) also contribute to declines in fish numbers (UNEP 2008) and water pollution
can exacerbate this issue.
Marine and Coastal
More than 30 percent of people in the Gulf of Guinea countries live on or near the coast (100
percent are considered coastal residents on the offshore islands). There are large-scale industrial
and artisanal fisheries in all countries in the hotspot, with artisanal fisheries contributing 70
percent of total fishery production (Koranteng et al. 1998).

108
Most fishing (industrial and artisanal) takes place relatively close to shore, at depths of less than
100 meters, and is poorly regulated. Both fisheries also target two main groups of resources:
small and large pelagics; and demersal species. Sharks are also targeted in deeper water for their
fins. Catch and effort data are not well recorded and monitored but Nigeria and Ghana have the
highest reported proportions of regional catches overall (23 and 16 percent, respectively).
Industrial fishing is highly globalized, as foreign fleets operate offshore throughout the Gulf of
Guinea, in addition to national fleets. Large foreign offshore trawlers originate from European
nations, as well as Korea and Japan. The numbers of industrial trawlers in the region have been
estimated to be too high in relation to available biomass. For example, 50 boats were operating
off Cameroon and 400 trawlers off Nigeria (IGCC 2006). In addition, it is estimated that, in West
Africa, two million individuals rely on small-scale fisheries as their primary source of income,
and another six million depend on fishing resources as part of a diversified livelihood (WASSDA
2008). In Ghana alone, there are an estimated 10,000 artisanal vessels and 170 industrial vessels,
which employ more than 200,000 individuals directly, and provide more than 1.5 million jobs in
related fishery sectors (FAO 2014). It has been noted that the amounts paid to countries for
access to their marine waters for fishing are far below the value of the fish stocks removed from
their territorial waters. Bottom-up re-estimations of catches also suggest that foreign vessels
drastically underreport their catches in the region (Pauly et al. 2014; Belhabib et al. 2015). It is
likely that decreases in catches caused by overfishing will prompt artisanal and small-scale
fishers to move to other territorial waters, as already seen in Senegal (Belhabib et al. 2014).
Aquaculture
West Africa is currently responsible for only a very small percentage of the world’s aquaculture
production (approximately 0.3 percent in 2013; FAOSTAT 2015). However, since 2000, the
output of aquaculture in hotspot subregions has increased 10-fold, from 32,037 tonnes to 316,841
tonnes. This is representative of the even greater global increase in agriculture output (a 42-fold
increase over the same period) but is mainly driven by two countries: Ghana; and Nigeria.
Falling aquaculture output in countries such as the USA and Japan, coupled with globally
dwindling fish stocks, is likely to be increased demand for aquaculture products, and potentially
stimulate the expansion of aquaculture in West Africa and the hotspot subregions (FAO 2014).
Government support for aquaculture is also strong in Ghana (Kassam 2014). While this
expansion of aquaculture has the potential for positive environmental impacts through easing of
pressure on wild stocks, aquaculture systems themselves can have serious environmental
impacts, such as eutrophication of water (Ewoukem et al. 2012), destruction of mangroves and
pollution of waters (Martinez-Porchas and Martinez-Cordova 2012). This is an area with the
potential for instigation of good environmental practice before further establishment of the
industry.
Energy and Power Production Access to electricity in the hotspot countries has increased since 1990, when records began
(Figure 5.4). Five of the hotspot countries (Ghana, Côte d’Ivoire, São Tomé and Príncipe,
Cameroon and Nigeria) have a higher percentage of the population with access to electricity than
for the aggregate population of developing countries in Sub-Saharan Africa. Households without
access to electricity are likely to rely on local fuel sources, such as wood and charcoal (CIFOR
2013).

109
Alternative and nuclear energy still contribute low percentages to the energy produced in the
hotspot countries, although no data exists for Guinea, Equatorial Guinea, Liberia, Sierra Leone,
and São Tomé and Príncipe. Two of the hotspot countries, Ghana and Cameroon, produce a
higher percentage of electricity from alternatives and nuclear than for the total developing
countries in Sub-Saharan Africa, with 6.2 percent and 5.6 percent respectively, compared to 2.7
percent for Sub-Saharan Africa.
Figure 5.4 Percentage of National Population with Access to Electricity in Hotspot Countries since 1990
Source: World Bank (2015a).
Hydropower dams are a particular feature across the hotspot with impacts on freshwater
ecosystems and dependent rural populations. The Akosombo Dam on the Volta River, built in
1965 to supply electricity for the aluminium industry, created Ghana’s most important freshwater
fishery (Lake Volta) but water volumes have declined due to a long period of drought in the
1980s and subsequent climate variation, with potential consequences for both the fishery and
power generation. The Nangbéto Hydroelectric dam on the Mono River in Togo, was built in the
1980s, creating a reservoir with a surface area of 180 km2. The scheme generates electricity for
domestic and commercial use and the reservoir supports commercial fishing, tourism and
irrigated agriculture. The construction of the dam, reservoir and transmission lines resulted in the
loss of nearly 150 km2 of savannah and gallery forest and the reservoir submerged 1,285
households and 5,500 hectares of agricultural land. The loss of natural vegetation and creation of
an artificial lake appears to have affected the local climate and led to an increase in snail species,
which are intermediate hosts for the bilharzia parasite (UNEP 2008). There are a large number of
proposed dams in West Africa but only one proposed inside the hotspot: Mambila Hydropower
Ac
ce
ss
to
ele
ctr
icit
y (
% o
f p
op
ula
tio
n)
Benin
Cameroon
Côte d'Ivoire
Ghana
Guinea
Equatorial Guinea
Liberia
Nigeria
São Tomé and Príncipe
Sierra Leone
Togo
Sub-Saharan Africa(developing only)

110
Dam in Nigeria (International Rivers 2010). However, it should be noted that, despite being
conceived as a project in 1982, little progress has been made on construction to date.
Industry, Manufacturing and Transport Most of hotspot countries’ economies are based on exporting raw commodities, such as gold
(Ghana, Benin), crude petroleum (Nigeria, Cameroon, Equatorial Guinea), ore (Guinea, Liberia,
Sierra Leone) and cacao beans (Côte d’Ivoire, São Tomé and Príncipe). The exception to this
pattern is Togo, where the leading exports are refined petroleum and cement (Observatory of
Economic Complexity 2015). Value added through manufacturing made up between 3.6 percent
(Liberia) and 14.5 percent (Cameroon) of GDP in hotspot countries in 2011 (World Bank 2015a),
which is low compared to more industrialised manufacturing nations, such as Japan. The greater
reliance on raw-commodity exports makes hotspot country economies potentially vulnerable to
global price movements (KPMG 2014).
Infrastructure and transport development in West Africa is poor, and a barrier to intra-regional
trade (see Section 5.3.1). However, recent surveys of investors in the region indicate that there is
an expected 25 percent increase in spending on infrastructure (PwC 2014). Hotspot countries had
between 1,730 (Benin) and 51,904 (Nigeria) registered air transport carrier departures worldwide
in 2013, equating to 15.8 percent of the total departures in developing Sub-Saharan African
countries (World Bank 2015a). The liner shipping connectivity index is a measure of
connectedness of a country to global shipping networks. Hotspot countries have increased their
scores on the index since 2004, apart from Guinea and Sierra Leone, which have fallen slightly
in their scores (World Bank 2015a). Hotspot countries’ scores currently range from 5.6 to 21.8,
which is substantially lower than more industrialised countries, such as China, which has a score
of 165, or South Africa, with a score of 37.9. There are no corresponding data on rail and road
transportation.
Mining and Oil Mining (both large-scale and artisanal) for various minerals and fossil fuels is a huge industry in
the hotspot (Table 5.10). These industries bring economic benefits to the countries concerned but
at major social and environmental costs. Oil, discovered offshore in the Gulf of Guinea in the
1980s and 1990s, has also had enormous economic and social impacts.
In Sierra Leone, mining officially accounted for more than 90 percent of the country’s export
earnings and 20 percent of GDP before the war in 1991. Despite the historical importance of
diamonds as the key export commodity, iron and titanium ore have become the key exports for
Sierra Leone, making up 69 percent of total exports (Observatory of Economic Complexity
2015). Leading producers in the country include Sierra Rutile and African Minerals.
In Ghana, most mining is carried out by international corporations but small-scale, illegal mining
is ‘pervasive’. On the advice of the IMF and World Bank, both logging and mining laws and
regulations were relaxed in the 1980s and 1990s, and investment by mining and forestry
industries was encouraged through incentives. The mining industry was privatised and liberalised
and some mines were even permitted in forest reserves. This brought gold production to new
highs (replacing cacao as Ghana’s most valuable commodity). Gold mining in Wassa Amenfi
West District, which includes Mamiri Forest Reserve KBA (GHA17), received hundreds of

111
millions of dollars in foreign investment. Currently, more than 60 percent of land in the district is
under concession to mining companies: the greatest single concentration of mining anywhere in
Africa (UNEP 2008). Nevertheless, gold exports have been falling in recent years, mainly driven
by a fall in international gold prices resulting in a scale-back in production (Herrera and Aykut
2014). Leading gold mining companies operating in Ghana include Gold Fields Limited,
AngloGold Ashanti Ltd. (both South African companies) and Golden Star Resources Ltd. (a
Canadian company).
Table 5.10 Value of Mining and Oil Products to the Hotspot Countries
Country
Coal Minerals Gas Oil
% GDP
Value in million
USD
% GDP
Value in million USD
% GDP
Value in million USD
% GDP
Value in million USD
Benin 0 - 0.01 0.7 0 - 0 -
Côte d’Ivoire 0 - 1.40 434.5 0.83 257.6 3.66 1,137.8
Cameroon 0 - 0.18 53.8 0 - 5.53 1,634.7
Ghana 0 - 5.74 2,761.5 0 - 6.26 3,011.1
Guinea 0 - 10.00 614.5 0 - 0 -
Equatorial Guinea 0 - 0.04 6.7 0 - 53.25 8,297.0
Liberia 0 - 0.67 13.1 0 - 0 -
Nigeria 0.0003 158.58 0.01 48.8 0.91 4,724.2 13.43 70,083.1
Sierra Leone 0 - 0.33 13.7 0 - 0 -
São Tomé and Príncipe 0 - 0 - 0 - 0 -
Togo 0 - 1.99 86.3 0 - 0 -
Source: (World Bank 2015a).
Nigeria was the 13th
largest oil producer in the world in 2013 (EIA Beta 2015). More than 75
percent of government revenue is derived from the petroleum industry, and, as such, the
economy is vulnerable to falls in crude oil prices. However, the country has established fiscal
buffers in the form of savings generated when oil revenues exceed those budgeted (EIA Beta
2015). Oil operations started in the 1960s and national production reached a peak of around
2.6 million barrels per day in 2005, although production has subsequently declined significantly
due to the activities of militant groups (EIA Beta 2015). A large number of international oil
producers have a presence in the country, including Shell, Total, Addax Petroleum (a subsidiary
of the Sinopec Group), ExxonMobil and Chevron. Production takes place principally in the
Niger River delta (which includes West Niger Delta KBA (fw13)), where there are persistent
environmental and social problems deriving from thousands of oil spills every year. Local
communities receive little or no benefit from the oil wells on their land and no compensation for
pollution and loss of land and ecosystem services. Corruption and vandalism are rife, with many
deaths every year caused by local people trying to steal oil directly from pipelines and setting up
thousands of small refineries operated illicitly under cover of darkness throughout the delta.

112
5.4 Land-use Change (Deforestation, Land Degradation), Forest Resource Use, Communities and Livelihoods 5.4.1 Historic Rates of Land-use Change in West Africa Patterns of forest cover change can be complex to assess, due to difficulties with assessing, for
example, the condition of the forest being lost and gained or changes in forest composition
(UNEP 2008). Canopy cover is a commonly used metric, measurement of which has been made
easier in recent years by the use of frequently updated satellite imagery analysis. In Togo, forest
loss has been reported at the site level (Adjonou et al. 2010); and in Côte d’Ivoire the forest edge
has been found to be both stable (Goetze et al. 2006) and expanding (Gautier 1990, Menaut et al.
1990). In Cameroon, despite widespread use of fire, the forest edge is also expanding (Mitchard
et al. 2009). This trend is very common at the forest edge in Central Africa (Vincens et al. 1999,
Favier et al. 2004, Palla et al. 2011). In Guinea, villages in the forest-savanna mosaic create the
forest surrounding them, thus creating forest islands (Fairhead and Leach 1996), an observation
which has been documented in many other countries with this vegetation type. Other variations
of forest loss related to fire are reported for Ghana, where the forest edge comprises fire-sensitive
dry forest; forest loss was exacerbated by drought in the 1970s and 1980s, making fire control a
priority (Swaine 1992). However, the situation remains complex since some areas exhibit forest
expansion. São Tomé presents a singular history of land-use change. Peak deforestation was
reached at the beginning of the 20th
century, associated with the expansion of coffee and cacao
plantations. With the decline of those plantations, there was a massive forest expansion. These
new forests were nevertheless very distinct from the native ecosystems, both structurally and in
terms of species composition. More recently, the island again experienced an increase in
deforestation rates, associated with large agricultural concessions and small-scale horticulture to
supply the local market. This deforestation trend is likely to continue, due to steady population
growth.
Causes of deforestation in West Africa are multiple and driven by economics, institutions,
policies and other influences: shifting agriculture and population growth are not the main causes
(Geist and Lambin 2002). In Africa, human numbers have varied over the past millennium, in
response to migration, slavery, colonial labour, war and the rise and fall of major states (Vansina
1990). The general trend was for a slow increase in the human population during the period prior
to the slave trade and colonisation, subsequent to which population growth declined. Since then
populations have begun to grow again, with rapid growth since the 1970s. Wherever people were
located, their land use had the potential to impact on forests but also to enhance them by the
creation of village forests, and by soil enrichment around settlement sites, in Sierra Leone,
Guinea, Liberia and Ghana (J. Fraser pers. comm.).
5.4.2 Livelihoods in West Africa and Their Relationship to Forest Evidence from a global IUCN project entitled Livelihoods and Landscapes Strategy shows that
income from forests in hotspot landscapes is higher than the overall global average, averaging
between 30 and 39 percent of household income (IUCN 2012). This high percentage is, in part, a
result of the difficulty of raising cattle in the hotspot. In drier countries further north it is evident
that income from cattle can substitute for at least 10 percent of forest income.

113
Rural people who live further from markets and roads are more reliant on environmental
resources than people who live nearer to them. Those people who live more remotely are less
likely to have paid employment, market crops much less often, and live on the food they grow
and the products they gather from forests. In general, women rely on forest income more than
men, and poorer people more than wealthier people.
In hotspot countries, forest resources are vital for energy, medicine, and income generation, as
well as for protein, vitamins and minerals from wild foods to complement usually carbohydrate-
heavy foods from household farms. These forest products translate to income for households, and
can be a relatively substantial amount. For example, in Ghana, income from forest resources is
typically worth USD 100-200 a year to local households. However, agricultural lands and non-
forest environment can provide similar or greater value and products than forests, creating an
incentive for forest clearance (Pouliot et al. 2012). This is posited to be likely where poorer
households have socially restricted access to forest areas, and where there are equivalent NTFPs
available outside of the forest.
Bushmeat Bushmeat is probably the most valuable NTFP in the hotspot. As with fuelwood, bushmeat off-
take to supply local rural needs has a relatively low impact on biodiversity, whether consumption
or sale is involved. For instance, in specific forest areas of Cameroon (and Congo), the main day-
to-day sources of bushmeat come from traps set in farmers’ own fields and fallows, as much to
protect crops as to catch animals (Endamana 2013a,b). However, bushmeat trade to large urban
areas is a different matter, with professional hunters supplying a huge demand. Some are self-
financing and some are effectively on contract to members of urban elites, who supply the
ammunition as required. As a high value-to-weight product, easily preserved through smoking,
bushmeat is one of very few tradable commodities to generate cash in remote areas.
In 2008, the bushmeat trade in West and Central Africa was estimated to be worth as much as
USD 200 million annually (Reuters 2008). Within the hotspot itself, one survey in Cameroon
estimated that 70 to 90 tonnes of bushmeat per month were being sold in Yaoundé’s four main
markets (Nasi et al. 2008). Bushmeat is also transported from the mainland to the ‘luxury
bushmeat market’ in Malabo on Bioko (including species such as giant pangolin not found on the
island), because of the high prices which can be obtained (Bioko Biodiversity Protection
Program 2015). This in turn is due to the relative wealth created by oil exploitation and higher
disposable incomes among immigrant and local oil workers (Hearn et al. 2006). There is also an
illicit trade in bushmeat out of the region to the West African diaspora overseas. In São Tomé and
Príncipe, bushmeat might offer some interesting trade-offs to conservation. Although some of the
endemic and native species are threatened by hunting, such as pigeons and the Critically
Endangered dwarf olive ibis, hunters might also be controlling populations of introduced
mammals, such as pigs and monkeys, that contribute to forest degradation (Carvalho et al. in
press; 2015). Threats to biodiversity created by the bushmeat trade and potential conservation
solutions are discussed in Chapter 8.

114
6. POLICY CONTEXT OF THE HOTSPOT The countries within the hotspot contain remarkable biodiversity and high rates of endemism
within their forests (see Chapters 3 and 4). The countries are also generally poor and face many
social challenges for their development and their ability to undertake conservation actions (see
Chapter 5). Pressures on the species, sites and corridors of global conservation importance are
also high, and often increasing (see Chapter 8). Political and economic instability in the region
has also reduced the ability of countries to respond to challenges, and disease outbreaks such as
Ebola in 2014, have also had their impacts in parts of the region. Countries across the region
have, nonetheless, become increasingly aware of environmental issues over the past 20 years,
and all 11 hotspot countries have introduced relevant policies and laws to tackle environmental
challenges and conserve biodiversity. These responses take various forms.
This chapter presents the context of global, regional and national policies, agreements and
institutions in the hotspot, and provides an evaluation of the responses they have elicited and the
results they have brought. Where possible, the findings of the chapter are linked back to the
conservation outcomes defined in Chapter 4.
6.1 Governance
6.1.1 National Governance and Corruption
The popular perception is that many West African countries suffer from high rates of corruption
and poor governance. The 2014 Corruption Perception Index assigns all hotspot countries a
scores between 48 (61st rank) and 25 (145
th rank), with the maximum score of 100 indicating
good governance (Transparency International 2014). These results suggest that, in all hotspot
countries with the possible exception of Ghana, corruption is a factor in citizen’s daily lives, and
hence impacts all work across the region. Additional details on the governance structure of each
of the countries in the hotspot are given in Appendix 7.
6.1.2 Conflicts and Security Issues
West Africa has experienced considerable political instability, authoritarian regimes, civil unrest
and armed conflicts in the past 20 years. Security and economic conditions have improved in the
past five years but the root causes that led to these conflicts persist today in some countries, due
to high levels of unemployment, inequality and poverty, ethnic or sectarian tensions, and power
struggles over land and the extraction of natural resources.
In some countries, the aftermath of war has reduced the ability of the state to enforce the rule of
law and to place the environmental agenda alongside other immediate development concerns. In
the case of Sierra Leone, the devastating civil war (1991–2002), which began as an overspill
from an earlier war in Liberia, led to a series of direct and indirect impacts on conservation
efforts in the country. For instance, rebel groups destroyed or damaged park facilities as well as
urban, water and agricultural infrastructure in rural areas and towns in the east of the country
(UNEP 2010). Cross-border poaching increased between Sierra Leone, Liberia and Guinea, and
there was a mass movement of refugees to Guinea, causing significant deforestation. Destruction

115
of public records led to land grabbing and lack of clarity regarding property rights. Institutions in
charge of environmental management collapsed, and low levels of transparency and
accountability led to illegal logging concessions inside protected areas (Brown and Crawford
2006). Although there has been a marked progress in security conditions, environmental and
natural resource governance remained at a critical stage for a number of years (UNEP 2010),
although improving in recent years.
The armed conflict that took place across Liberia from the 1990s to the early 2000s also resulted
in significant loss of life, large population displacements and the dismantlement of institutions
and infrastructure facilities. Although environmental conditions declined in general as a
consequence of the overall state of lawlessness, the illegal exploitation of natural resources
financing the struggle was particularly damaging, as well as the destruction of the already
precarious sewage treatment and waste management systems (Tigani and Brandolini 2006).
Since the signing of the Accra Peace Accord in 2003, which marked the end of the Second
Liberian Civil War, the country has stabilized and shown signs of moderate economic recovery,
security conditions in rural areas have improved, government institutions and key infrastructure
is being rebuilt, and there have been moderate socio-economic advances.
Nigeria’s transition from military to civilian rule occurred in 1999 and the country is now a
democracy, although all three elections held since then have been highly contested (Agbu 2004).
Security concerns remain due to a struggle over political control, economic resources and
landownership, coupled with ethnic and religious differences (International Crisis Group 2012).
High unemployment figures, corruption and poor governance are also contributory factors that
exacerbate these problems (Nwanegbo and Odigbo, 2013). These challenges make it hard for
environmental policies to be implemented effectively and corruption around logging is
widespread, for example.
Benin and Ghana have been fairly stable for the past 20 years. Both countries present
encouraging governance indexes compared to other countries in the region, according to the
Worldwide Governance Indicators (World Bank 2014b), which measures voice and
accountability, political stability and absence of violence, government effectiveness, regulatory
quality, rule of law and control of corruption. Ghana, in particular, has made good progress
towards accomplishing the MDGs but environmental sustainability is among the areas to have
shown slow progress (African Development Bank 2013). Even in Ghana, ‘chainsaw’ logging in
forest areas outside (and also within) reserves is commonplace.
Since the beginning of the new millennium, Côte d’Ivoire has seen two civil wars: the first
lasting from 2002 to 2007; and the second from 2010 to 2011. These resulted in substantial
security issues, including civilian casualties, and have left the political situation in the country
highly polarized and unstable. Guinean politics are also highly unstable, and concerns over the
transparency of the election process have recently resulted in incidents of political violence and
inter-ethnic clashes. Forest change statistics for Côte d’Ivoire show that there was significant
forest loss between 2000 and 2010, including within reserves, presumably due to the impacts of
the civil war and loss of government control.
During the past three decades, Cameroon and Equatorial Guinea have experienced a fairly stable
political context but without any alternations of power. Both countries have been ruled by long-

116
standing presidents and strong majority parties. The political situation in São Tomé and Príncipe
is also fairly stable. A recent intended coup and parliamentary shake-up notwithstanding, crime,
terrorism and civil unrest are uncommon in the relatively peaceful island nation.
6.2 Global Environmental Agreements
The governments of all the countries within the hotspot are signatories to a range of global
agreements (Table 6.1). These international agreements influence national policy and the
development of national laws. These in turn support partnerships between government and CSOs
for the process of safeguarding the countries’ natural resources and achieving the conservation of
species, sites and corridors.
Table 6.1 Overview of Participation in Multilateral Agreements Related to Environmental Protection and Conservation by the Hotspot Countries
Multilateral Agreement
Ben
in
Cam
ero
on
Cô
te
d’Ivo
ire
Eq
uato
ria
l
Gu
inea
Gh
an
a
Gu
inea
Lib
eri
a
Nig
eri
a
São
To
mé &
Prí
nc
ipe
Sie
rra
Leo
ne
To
go
CBD (Biodiversity) x x x x x x x x x x x
UNFCCC (Climate) x x x x x x x x x x x
Ramsar (wetlands) x x x x x x x x x x x
CITES (Wildlife Trade) x x x x x x x x x x x
UNCCD (Desertification) x x x x x x x x x x x
CPWCNH (World Heritage) x x x x x x x x x x x
UNDRIP (Human Rights) x x x x x x
Source: Authors and consultation workshops.
6.2.1 Convention on Biological Diversity The Convention on Biological Diversity (CBD) is a multilateral treaty, effective since 1993,
which currently has 168 signatories. Within the hotspot, Benin, Cameroon, Côte d’Ivoire, Ghana,
Guinea, Liberia, Nigeria and São Tomé and Príncipe have all ratified the convention; Equatorial
Guinea and Sierra Leone have acceded to the document, while Togo has accepted it.
Nine of the hotspot countries produced National Biodiversity Strategies and Action Plans
(NBSAPs) to guide national implementation of the CBD in the period 2002–2007 (for details see
Appendix 8). After the 10th
Conference of the Parties to the CBD in Nagoya in 2010, all
countries were encouraged to revise their NBSAPs and present new and updated versions. So far,
only Cameroon has presented a new version and Guinea has produced a draft. It may be that
other hotspots countries are also working towards the revision of their NBSAPs but this is not
recorded on the CBD database (Secretariat of the Convention on Biological Diversity 2015).
To evaluate progress towards the targets of the Strategic Plan for Biodiversity 2011-2020 (i.e. the
Aichi Targets), a review of all 5th
progress reports to the CBD was undertaken. This shows that
national self-reporting of progress against the 20 CBD Aichi Targets by 15 West African
countries suggests poor progress in the region, and that much will be required to achieve these
targets by 2020 (Figure 6.1). For the majority of the Aichi Targets, progress was reported as

117
either “no information”, “progress but at an insufficient rate” or “no progress”. For some, there
was even movement away from the target.
Figure 6.1: Progress toward the Aichi Targets by 15 West African Countries
Source: Review of 5
th Progress Reports submitted to the Convention of Biological Diversity.
Assisting countries to improve progress towards the Aichi Targets could be an important target
for CEPF investment in the hotspot, especially in relation to those targets that are relevant to
forest conservation, such as targets 5, 11 and 12.
6.2.2 United Nations Framework Convention on Climate Change and Kyoto Protocol
The United Nations Framework Convention on Climate Change (UNFCCC) is an international
environmental treaty signed in 1992, and the sole current international policy venue on climate
change with widespread recognition, owing to its virtually universal membership. All 11
countries in the hotspot are Non-Annex I members: Guinea ratified the treaty in 1993; Benin,
Cameroon, Côte d’Ivoire and Nigeria in 1994; Ghana, Sierra Leone and Togo in 1995; São Tomé
and Príncipe in 1999; Equatorial Guinea in 2000; and Liberia in 2002.
The Kyoto Protocol, unlike the UNFCCC, includes legally binding commitments for developed
nations. Equatorial Guinea and Guinea ratified the treaty in 2000; Benin, Cameroon and Liberia
in 2002; Ghana in 2003; Nigeria and Togo in 2004; Sierra Leone in 2006; Côte d’Ivoire in 2007;
and São Tomé and Príncipe in 2008. A commitment period from 2008 to 2012 was established,
while an extension known as the Doha Amendment has been proposed to take effect for the
Moving away from target No progress Progress but at insufecient rate
On track to meet the Target, On track to exceed the target No information

118
period between 2012 and 2020. The 11 countries of the hotspot are Non-Annex I parties, and
therefore have no binding commitments under the Kyoto Protocol to reduce GHG emissions.
Under the UNFCCC, another global mechanism for mitigating climate change is REDD+, which
refers to reducing emissions from deforestation and forest degradation, and the role of
conservation, sustainable management of forests, and enhancement of forest carbon stocks in
developing countries. Within the hotspot there are active national REDD+ processes underway in
many of the hotspot countries, with UN-REDD supporting Nigeria and Côte d’Ivoire, and other
funding mechanisms supporting other countries. In addition, there are also well-advanced plans
for voluntary carbon offset projects in the Gola forests of Sierra Leone and the Takamanda Mone
Landscape of southwestern Cameroon.
6.2.3 Ramsar Convention
The Convention on Wetlands of International Importance especially as Waterfowl Habitat,
commonly known as the Ramsar Convension, is an international treaty with 168 parties at
present. All countries in West Africa are parties to the convention, and have nominated 64
wetland sites, with a total area of 115,486 km2 as Wetlands of International Importance (or
‘Ramsar sites’). Sixteen of these Ramsar sites are located within the hotspot and cover a total
reported area of 7,509 km2: Barombi Mbo Crater Lake (4 km
2) and Estuaire du Rio Del Rey
(1,650 km2) in Cameroon; Azagny National Park (194 km
2) in Côte d’Ivoire; Isla de Annobón
(230 km2) in Equatorial Guinea; Owabi Reservoir (73 km
2) in Ghana; Konkouré (900 km
2) in
Guinea; Gbedin Wetlands (< 1 km2), Kpatawee Wetlands (8 km
2), Lake Piso (761 km
2), Marshall
Wetlands (122 km2) and Mesurado Wetlands (68 km
2) in Liberia; Apoi Creek Forests (292 km
2),
Oguta Lake (6 km2) and Upper Orashi Forests (252 km
2) in Nigeria; Ilots Tinhosas in São Tomé
and Príncipe (< 1 km2); and Sierra Leone River Estuary (2,950 km
2) (Table 6.2).
Table 6.2 Years in which Hotspot Countries Joined the Ramsar Convention, Number of Ramsar Sites per Country and Number within the Hotspot
Country Year joined Ramsar Sites in Country
Ramsar Sites in Hotspot
Benin 2000 4 0
Cameroon 2006 7 2
Côte d’Ivoire 1996 6 1
Equatorial Guinea 2003 3 1
Ghana 1988 6 1
Guinea 1993 16 1
Liberia 2003 5 5
Nigeria 2001 11 3
São Tomé and Príncipe 2006 1 1
Sierra Leone 2000 1 1
Togo 1995 4 0
Source: Authors’ review of Ramsar Convention data.

119
6.2.4 Convention on International Trade in Endangered Species of Wild Fauna and Flora
The Convention on International Trade in Endangered Species of Wild Fauna and Flora (CITES)
aims to ensure that international trade in specimens of wild animals and plants does not threaten
the survival of the species in the wild, and confers varying degrees of protection on more than
35,000 species of fauna and flora. The hotspot countries are all parties to the convention: Nigeria
ratified the convention in 1974, Ghana in 1975 and Togo in 1978, while Cameroon, Guinea and
Liberia acceded in 1981, Benin in 1984, Equatorial Guinea in 1992, Côte d’Ivoire and Sierra
Leone in 1994, and São Tomé and Príncipe in 2001.
CITES is an important convention for the countries of the Guinean Forests Hotspot, as it seeks to
regulate trade in wildlife. In the hotspot, international unregulated trade in wildlife and wildlife
products has posed a threat to plant and animal biodiversity in the past (for example grey parrot
(Psittacus erithacus) export to the EU) and continues to do so for some species, for example for
bushmeat export to the West African diaspora. The previously significant trade in wild birds to
Europe from West African countries was greatly reduced by an EU trade ban. Better
understanding the effectiveness of CITES and the scale of legal and illegal trade is an important
conservation need in the hotspot and something that CSOs are well placed to address.
The National Legislation Project of CITES has looked at which countries need to strengthen their
legal frameworks for the effective implementation of CITES, including to combat illegal trade in
wildlife (CITES 2014). Out of 17 countries identified to require priority attention, one is a
hotspot country: Liberia. Of the 11 hotspot countries, only Nigeria is considered to fall into
category 1, meaning that its national legislation is believed generally to meet the requirements
for implementation of CITES. However, Nigeria is currently subject to a CITES suspension on
all commercial trade in wildlife, because of failure to provide a National Ivory Action Plan.
Guinea is also subject to a CITES suspension on all commercial trade, because of compliance
and enforcement issues.
The following hotspot countries are subject to CITES trade suspensions for particular species:
i. Benin (Pandinus imperator – because trade levels not considered sustainable)
ii. Cote d’Ivoire (Pericopsis elata – because trade levels not considered sustainable)
iii. Ghana (Pandinus imperator – because trade levels not considered sustainable)
iv. Togo (Poicephalus robustus, Pandinus imperator – because trade levels not considered
sustainable)
West African countries are currently subject to 110 species/country specific EU trade suspensions
(under the EU Wildlife Trade Regulations, which implement CITES in the EU) for wild-sourced
specimens, i.e. the trade in 109 species and one ‘commodity’ (coral rock) is banned in at least
one of these countries (Species+ 2015).
6.2.5 Other Conventions
The Convention concerning the Protection of the World’s Cultural and Natural Heritage
(CPWCNH or World Heritage Convention), effective since 1975, has been ratified by all 11

120
countries of the hotspot. Out of three World Heritage Sites nominated because of their natural
values by the hotspot countries, only one is situated within the hotspot: Taï National Park in Côte
d’Ivoire, with a reported area of 3,300 km2.
This site is included within Parc National de Taï et
Réserve de Faune du N’Zo KBA (CIV11). Other KBAs might also qualify for natural World
Heritage Site status, were they to be assessed against the criteria and nominated.
The United Nations Convention to Combat Desertification (UNCCD) is a convention adopted in
1994 to combat desertification and mitigate the effects of drought. Although all 11 hotspot
countries are members of the convention, it is not relevant to the parts of these countries within
the hotspot, as they are not affected by desertification.
The United Nations Declaration on the Rights of Indigenous Peoples (UNDRIP) was adopted by
the General Assembly of the United Nations in 2007, following approval by 143 member
countries. While not a multilateral environmental agreement, it comprises an important part of
the global legal framework establishing Indigenous Peoples’ rights with respect to land and
natural resource ownership, management and access. It is thus directly relevant to conservation
issues in the hotspot that relate to conflicts around resource rights. In the hotspot, Benin,
Cameroon, Ghana, Guinea, Liberia and Sierra Leone voted in favor of the declaration, Nigeria
abstained and Côte d’Ivoire, Equatorial Guinea, São Tomé and Príncipe and Togo were absent.
The declaration outlines the rights of Indigenous Peoples globally and outlaws discrimination
against them. In particular, it enshrines the principle of free, prior and informed consent with
indigenous communities with regard to development decisions that affect their lives. This
declaration is important for conservation practices that involve local communities, such as
community-based forest management, which is emerging as an important conservation process in
a few countries in the hotspot.
6.3 National Legislation
The following section provides a non-exhaustive description of some of the main constitutional
and legal frameworks and policies that relate to the management of natural resources and to
biodiversity conservation in hotspot countries. The main laws in each country are presented in a
detailed table below (Table 6.3), and summarized later (Table 6.4). In some of the hotspot
countries, legislation related to conservation is very old. For instance, the environmental laws in
Ghana date back to the colonial era (pre-1957) and mostly deal with disease prevention and
control and wildlife protection. Moreover, environmental legislation in Sierra Leone is at least
two decades old. Many of the hotspot countries have been or are modernizing their laws and
including new considerations, such as provisions for community-based conservation.
Since the ceasefire in 2003, Liberia has enacted a great deal of environmental reform. Recent
environmentally relevant laws and policies include the following: the 2009 Community Rights
Law; the 2011 Community Rights Regulation; the 2009 Liberia Extractive Industries
Transparency Initiative Act; the 2010 Maritime Authority Act; and others (Table 6.3).

121
Table 6.3 Main Environmental Laws, Policies and Institutions in the Hotspot Countries
Country Main Environmental Laws and Policies Key Features Main Environmental Institutions Key Role(s)
Benin
Law n° 98-030
- Country’s main environmental law. - Creates the main institutions in charge of implementing the environmental policies and provides provisions on soil, subsoil, continental and marine waters, flora and fauna; pollution, hazardous and non-hazardous waste; Environmental Impact Assessments (EIA), environmental audits and applicable sanctions. - Creates the Environmental Agency of Benin and the National Commission of Sustainable Development
Ministry of the Environment and Protection of Nature (Created 2006 – Decree nº 2006-460)
Supporting the implementation of environmental policies at national and municipal levels.
Law nº 93-009
- Governs the forest sector. - Regulates both public and private forests and allows for community management arrangements. This regime distinguishes between classified and protected State forests - Calls for management plans developed with participation of local communities and defines access to wood and non-wood products for commercial or medicinal purposes. - Regulates licenses for commercial exploitation of these areas and provides some tax exemptions to promote reforestation
Beninese Agency for the Environment (ABE)
Law n° 2002-016 - Legal regime on wildlife The National Center for the Management of Wildlife Reserves (CENAGREF)
Responsible for managing protected areas.
Decree 2011-394 - Includes wildlife conservation and management measures
The Ministry of Mines, Energy and Water
As stated
Law nº 2006-17 - Mining Code Ministry of Agriculture, Livestock and Fisheries are also relevant in this context
As stated Law n° 2002-16
- Allows local participation in the management of protected areas

122
Country Main Environmental Laws and Policies Key Features Main Environmental Institutions Key Role(s)
Cameroon
Law nº 96/12
- Main legislative act governing environmental management - Contains basic principles for environmental legislation formulation: Precautionary; Polluter pays; Prevention and corrective action; Also contains specific mandates on air, water, soil and subsoil, pollution and chemical and toxic waste; Creates National Fund for Environmental and Sustainable Development; Promotes development of national environmental management plans and regulates EIAs
Ministry of Forests and Fauna
Principal authority on forests, wildlife and protected area issues
Law nº 94/01 - Protects and manages forests - Contains provisions on protected areas, wildlife protection and hunting rights
Ten-year (2005–2015) Forest and Environment Sector Program
- Facilitates sustainable forest management - Five priorities: five priorities: 1) Environmental management, including environmental monitoring and awareness; 2) Forest production; 3) Wildlife and protected areas (focused on the development of a network of protected areas properly financed and managed with local participation; 4) Community forest management, with three subcomponents: community forest management, community forest regeneration and fuel wood supply in the northern regions; and 5) Institutional strengthening, training and research
Ministry for the Environment and the Protection of Nature
Responsible for implementing and monitoring national environmental policies

123
Country Main Environmental Laws and Policies Key Features Main Environmental Institutions Key Role(s)
Côte d’Ivoire
Environmental Code (Law 96-766)
- Main environmental legislation, regulated by a series of ministerial decrees on land-use, management, and organization of forests
Ministry of Environment and Sustainable Development Head national environmental
policies Water Code (Law 98-755)
National Agency for the Environment (ANDE)
Mining Code (Law 96-553) (regulated by the Decree 634-1996)
- As stated National Commission of Sustainable Development
Defines national strategies and action plans in this area
Oil and Gas Code (Law 96-669) - As stated Ministry of Water and Forests (Created by Decree 2002-359)
Responsible for the management of wildlife, plants and habitats in parks and reserves
Law 96-478 - Governs fisheries
Law 225-1965 (amended by Law 442-1994)
- Governs faunal protection and hunting National Agency for the Development of Forests
Decree (96-894) - Governs applicable procedures for EIAs National Office for National Parks and Nature Reserves Law 102-2002
- Finances and manages natural parks and reserves
Equatorial Guinea
Law 7-2004 - First and main environmental law in the country, governs areas such as air, water and soil quality, pollution and conservation
Ministry of Environment
Responsible for generating national environmental policies, and classifying and managing protected areas such as natural parks, nature reserves, natural monuments, protected landscapes and scientific reserves
Law 4-2000 - Governs protected areas
Decree 172-2005 - Governs trade of threatened life
Act 1-1997 (Amended by Law 7 of 2003)
- Governs forest use and management, covers classification and definition of forest products; conservation of ecosystems; economic and taxation regime; monitoring and penalties, as well as the two main forest areas: production and conservation
Law nº 2/1987
- Fisheries Law, regulated by Decree nº 123/1987 - Decree nº 86/1981 – Regulates artisanal fishing
Mining Law nº 9/2006 - As stated

124
Country Main Environmental Laws and Policies Key Features Main Environmental Institutions Key Role(s)
Ghana
1971 Wildlife Reserves Regulations and 1961 Wildlife Animals Preservation Act
-Main environmental laws
Ministry of Lands and Natural Resources
In charge of mining, land administration and forestry
Environmental Protection Agency
In charge of compliance, monitoring and enforcement of environmental regulations; prescribes standards and guidelines relating to air and land pollution, waste discharges and control of toxic substances, among others
Environment Protection Authority (EPA) Act 490-1994
- Governs EIAs Forestry Commission
In charge of protection, development, management and regulation of forests and wildlife resources
1997 Timber Resource Management Act (Amended by Acts 617 and 624 of 2002) and 1999 Forestry Commission Act
- Governs forestry regulations Ministry of Environment, Science and Technology
As stated
Forestry Development Master Plan (1996–2020)
- Guides the implementation of Forest and Wildlife Policy
Environmental and Natural Resources Advisory Council
Advises parliament
Guinea
Law 045-1987 and Law 022-1989
- Deal with environmental protection National Directorate of Waters and Forests
Legally responsible for managing all forests in Guinea Law 038-1999 - Main forest code
Law 038-1999 - Main law on wildlife protection and hunting Ministry of the Environment, Water and Forestry
In charge of promoting the environmental and forestry policies
1995 Mining Code - As stated
1995 Code for Sea Fishing - As stated National Centre for the Management of Protected Areas (CENAGAP)
As stated Arrêté nº 676/MPA/SGG/2006 and Décret D/97/017/PRG/SGG
- Govern artisanal fishing and provide sanctions and penalties for fisheries

125
Country Main Environmental Laws and Policies Key Features Main Environmental Institutions Key Role(s)
Liberia
2003 Environment Protection and Management Law
- Meant to enhance and manage Liberia’s environment and natural resources; Contains the usual environmental principles; provisions on EIAs; environmental quality standards; pollution control and licensing; protection of biodiversity and environmental restoration
Environmental Protection Agency Implements national environmental policies
1988 Wildlife and National Parks Act - Ensures conservation and development of wildlife by controlling hunting and preserving habitats in protected areas
2006 National Forestry Reform Law and 2007 Forestry Regulations
- Governs the conservation and management of all commercial, conservation and community forests
2003 Environmental Protection Agency Act - As stated
National Environment Policy Council
Provides policy guidance and coordinate policies and regulations
2006 Mineral and Mining Act (nº 703) and 2010 Mineral Policy
- As stated
2010 Fisheries Regulation - As stated
2007 Integrated Water Resource Policy - As stated
Forestry Development Authority
Responsible for managing forests and parks, nature reserves and other protected areas
2009 National Environment Policy and Regulation on the Commercial and Sustainable Extraction of NTFPs
- As stated
Nigeria
Environmental Impact Assessment Act and 2009 Regulation on Environmental Permits and Licenses (S. I. nº 29)
- As stated
Federal Ministry of Environment
Ensures environmental protection and natural resources conservation for sustainable development
1999 Act 46 - Current legal instrument under which national parks and their head offices are managed
1956 Forest Law and 1956 Forestry Regulations and 2006 National Forest Policy
- Main acts in the forestry management sector - Provides for wildlife conservation and management through the creation of national parks, game reserves, and tourist facilities, etc.
National Drought and Desertification Policy - As stated
Environmental Enforcement Policy - As stated

126
Country Main Environmental Laws and Policies Key Features Main Environmental Institutions Key Role(s)
Nigeria (continued)
National Environmental Sanitation Policy, National Policy Guidelines on Solid Waste Management and National Policy Guidelines on Market and Sewage Management and 2009 Regulation on Sanitation and Waste Control (S. I. nº 28)
- As stated
National Council on Environment Highest environmental policy-formulating organ in the country
1992 Inland Fisheries Act and 1992 Sea Fisheries Act
- As stated
2007 National Minerals and Metals Policy and 2007 Nigerian Minerals and Mining Act
- As stated
National Council on Environment Highest environmental policy-formulating organ in the country
1963 Wild Animals Law - As stated
1985 Endangered Species (Control of International Trade and Traffic) Act
- As stated
1978 Land Use Decree nº 6 - As stated
2009 Regulation on Wetlands (S. I. nº 26) - As stated
Nigeria National Park Service Responsible for managing National
2009 Regulation on Access to Genetic Resources and Benefit Sharing (S. I. nº 30)
- As stated
2011 Regulation on Protection of Endangered Species in International Trade (S. I. nº 16)
- As stated
1979 Decree nº 46 - Establishes of a network of National Parks
1991 Decree nº 36 - Creates the National Parks Governing Board
1999 Act 46 - Current legal instrument under which park units and their head offices are managed
São Tomé and Príncipe
Law nº 10/99 - Outlines basic principles relating to environmental policy in the country
Ministry for the Environment As stated
Law nº 11/99 - Provides a framework for the conservation of fauna, flora and protected areas
Forestry Department As stated
Decree nº 37/99 - Regulates the process for EIAs, ensuring habitat protection
ECOFAC Conservation and Rational Utilization of Forest Ecosystems in Central Africa
Forestry Law nº 5/01 - As stated São Tomé and Príncipe Union for Progress (SteP Up)
Focuses on education, training in agriculture, the environment, health, and income-generation
Laws nº 6/06 and nº 7/06 - Create the Obô Natural Parks of São Tomé and Príncipe, respectively

127
Country Main Environmental Laws and Policies Key Features Main Environmental Institutions Key Role(s)
Sierra Leone
1972 Wildlife Conservation Act - Governs the protected areas system; under review
Environmental Protection Agency
Implements and ensures compliance of environmental policies, and evaluates and approves EIAs
1988 Forestry Act - As stated; under review Ministry of Lands, Country Planning and the Environment
Govern environmental and forestry issues
1960 Provinces Land Act (Cap 122) - Governs land issues Ministry of Agriculture
2007 Fisheries Act nº 10 - As stated Forestry and Food Security (MAFFS)
2011 Petroleum Exploration and Production Act nº 11
- As stated Ministry of Fisheries and Marine Resources
2009 Mines and Mineral Act
- Governs the mining operations in the country; contains prohibition in Section 32 (1) (a) to develop mining operation in land set apart for public purposes (e.g. roads, highways)
Conservation and Wildlife Management Unit of the Forestry Division (part of MAFFS)
Responsible for biodiversity conservation and protected areas
Togo
Environmental Law 2008-005
- Establishes main framework for environmental management, protected areas, conservation of biological diversity, sustainable development and environmental impact assessments
Ministry of the Environment and Natural Resources
In charge of implementing the state policy on environmental matters and forest and wildlife resources
2008 Forestry Code - Main legislation in forestry area National Environmental Committee (CNE)
As stated; Created by Environmental Code and restructured by 1997 Order n° 008/MERF
2001 National Action Plan for the Environment
- As stated Commission for Sustainable Development
As stated; Created by Law n° 2008-005 Strategy for Conservation and Sustainable
Use of Biological Diversity - As stated
1998 Fisheries Management Policy - As stated National Agency for the Management of the Environment
Responsible for contributing to the implementation of environmental policies
Fisheries Law nº 98-012 - As stated
Mining Code nº 96-004 - As stated
Source: Authors review of national legislation.

128
Table 6.4 Overview of National Policies, Laws and Regulations Relating to Environmental Protection and Biodiversity Conservation
Topic Addressed by Policies, Laws and Regulations
Ben
in
Cam
ero
on
Cô
te
d’Ivo
ire
Eq
uato
ria
l
Gu
inea
Gh
an
a
Gu
inea
Lib
eri
a
Nig
eri
a
São
To
mé &
Prí
nc
ipe
Sie
rra
Leo
ne
To
go
Protected areas x x x x x x x x x x x
Species conservation1
x
Forestry management x x x x x x x x x x x
Land use planning x x x x
Poverty Strategy Reduction Paper (PSRP)
x x x x x x x x x x x
Sustainable financing2 x x x x
Environmental Impact Assessment (EIA)
x x x x x x x x x x x
Community conservation x x
Transboundary conservation
x x x x x n/a x
Decentralization x x x x x x x x x x
Source: Authors’ review of national legislation.
Notes: 1 = Seemingly only under the auspices of CITES and NBSAPs; 2 = Development of a Trust Fund in Liberia
and REDD+ in Cameroon, Nigeria and Ghana.
Over the last two decades Côte d’Ivoire has issued a series of laws concerning forests, protected
areas, land-use planning and wildlife protection, as well as a constitutional provision promoting
the right to a healthy environment. The Forest Code of 1965 has been under review since 2002.
Moreover, a forest policy and strategic plan was approved for the 2010–2015 period, which
contemplates the creation of a forest development fund, new reforestation efforts and
prescriptions for the management of rural forests (Blaser et al. 2011). In 2014, a new national
forest code was introduced, which defines forest protection and reforestation areas, including the
various categories of rights applicable in forestry, the establishment of protected forests and
reserves, and matters concerning customary rights and the issuance of logging concessions.
In Ghana, to date, no comprehensive legislation has been enacted setting environmental
standards and general environmental principles. Wildlife conservation and environmental
concerns are not prioritized compared with competing agendas in the health, agriculture or
education sectors, which has an impact in terms of funds allocations for environmental protection
(IUCN/PACO 2010). Recent years of political and social unrest have also reduced the
effectiveness of environmental protection in Togo (USAID 2008).
In Benin, Article 27 of the constitution determines that every person has the right to enjoy a
healthy environment. Benin updated its forestry policy in 2011 and introduced a series of
environmental measures to improve energy efficiency and to extend waste management services
(African Economic Outlook 2013).
In order to improve its environmental performance, Nigeria developed a number of policies for
biodiversity, forests, and other biological resources at all levels of government (USAID 2008).
Although Nigeria does not have a comprehensive environmental act, the government has been

129
active in enacting relevant legislation, such as the Environmental Impact Assessment Act, as well
as a series of regulations on various topics. A new forest law, which would provide legal backing
to the National Forest Policy of 2006, is currently under discussion.
Although most of the environmental legislation in São Tomé and Príncipe is not legally binding,
mechanisms and laws exist that are used to protect species and habitats. Arguably the greatest
problem surrounding environmental legislation in the country is enforcement. Although the
existing legislation has shortcomings, it is still likely to be enough to overcome many of the
problems, if it was implemented (R. Lima pers. comm.).
6.3.1 Environmental Laws and Regulations
Across the hotspot, the legislation in place to support conservation activities is variable. Most
countries have laws in place around protected areas, forestry, environmental impact assessments,
and poverty reduction. Some countries also have laws and regulations governing land-use
planning and community conservation, transboundary conservation, sustainable financing
species conservation, and decentralization of decision-making. Targeted CSO advocacy
programs might be used to help countries develop relevant laws and regulations, where these are
not already in place.
6.3.2 Protection of Sites
Protected areas constitute an essential tool, not only to protect biodiversity, but also the
ecosystem services they provide to the communities (IUCN 2008). However, biodiversity
conservation through protected areas in West Africa presents a particularly challenging task,
given the high levels of poverty and often low institutional capacity of the countries (Homewood
2004). West Africa includes some of the least developed and most populated countries in the
world (UNDP Human Development Index 2013). Protected area management institutions face
limitations in capacity and motivation, often severe. Moreover, three quarter of the poorest
people in the region are found in rural areas, where they depend on agriculture and related
activities for their livelihoods (GEF 2010).
The constitutions of all hotspot countries provide legislation relevant to the creation and
management of a framework of protected areas, and all hotspot countries have made significant
progress towards creating a national PA network (see Table 6.5). About 108,104 km², or
17.4 percent, of the remaining closed forest in the hotspot is within protected areas of various
types (including national parks, wildlife sanctuaries and a few private and community-managed
reserves). However, when the area under more strict levels of protection for biodiversity
conservation purposes (IUCN protected area Categories I to IV) is calculated, the protected area
coverage falls to 18,800 km2 (three percent of the forest area). Much of the remainder of the
protected area network in the hotspot is made up of a network of forest reserves, some of which
are also managed for timber production.
Challenges remain within the hotspot to develop a comprehensive protected area network, and
include the prevailing customary land ownership, resource tenure, limited capacity and conflicts
over alterative land uses, such as logging and mining. These mean that the creation of any new

130
protected area is a long, complicated and costly process, especially if people are living in the
area.
Table 6.5 Summary Information on Protected Areas in the Hotspot Countries
Country No. of PAs
% Cover of PAs
Realm Status Level of Protected Area
International National
Terrest-rial
Marine (all or part)
Desig-nated
Propos-ed
Not reported
WHS Ramsar MAB
Benin 58 23.5 58 0 55 1 2 0 4 2 52
Cameroon 106 15.8 104 2 55 16 35 1 7 3 95
Côte d’Ivoire
252 30.3 241 11 252 0 0 2 6 2 242
Equatorial Guinea
16 32.7 7 9 16 0 0 0 3 0 13
Ghana 321 15.2 316 5 310 11 0 0 6 2 313
Guinea 124 4.9 117 7 122 2 0 0 16 4 104
Liberia 21 13.3 16 5 7 14 0 0 5 0 16
Nigeria 1,000 15.8 994 6 984 16 0 0 11 1 988
São Tomé & Príncipe
4 30.1 4 0 2 2 0 0 1 0 3
Sierra Leone
50 6.1 42 8 43 7 0 0 1 0 49
Togo 95 12.2 95 0 95 0 0 0 4 1 90
Source: World Database on Protected Areas, downloaded September 2013.
Notes: WHS signifies UNESCO World Heritage Sites; Ramsar signifies Wetlands of International Importance (i.e.,
Ramsar sites); and MAB signifies UNESCO Man and Biosphere Reserves. Percentage cover figures calculated
using only protected areas for which polygons were available; protected areas mapped as points were not included.
6.3.3 Protection of Species
Laws protecting specific species do not exist within the countries of the hotspot, apart from those
species listed on CITES Appendices or in NBSAPs. However, several species conservation
action plans have been produced at the national or regional levels, which are often endorsed by
the national governments. Conservation action plans exist for for both subspecies of chimpanzee
present in the hotspot, as well as western gorilla, which include the creation of sanctuaries,
efficient biomonitoring, increased education and awareness, and review of legislation and
enforcement (Kormos and Boesch 2003, Tutin et al. 2005, Morgan et al. 2011, IUCN 2014). In
addition, these action plans identify certain critical regions in Cameroon, Côte d’Ivoire,
Equatorial Guinea, Ghana, Guinea, Liberia, Nigeria, Sierra Leone and other non-hotspot
countries. In São Tomé and Príncipe, action plans with specific conservation objectives have
been created for the Critically Endangered bird species of São Tomé and Príncipe thrush
(BirdLife International 2014a,b). Targeted action plans for key species in the hotspot are a way
to focus attention and funding on the needs of specific species but require significant funding to
implement them.
6.3.4 Forestry Management
This hotspot is mainly composed of lowland to montane forests and hence the policies and laws
relating to forest utilization in the region are important for conservation of all forest areas,
including protected areas, as well as KBAs and corridor areas with no legal protection.

131
There is a general tendency for the forest resources of the region to be degraded through
overexploitation, often illegally (see Chapters 5 and 8). For example, the forestry industry of
Ghana has declined from a major export earner to a more minor part of the Ghanaian economy in
less than 20 years (Domson and Vlosky 2007). The same is true in Sierra Leone, Nigeria and
Côte d’Ivoire. This means that less attention is given to forestry in policy making within many of
the hotspot countries than in the past. Only Cameroon has an important forestry sector remaining
that generates a significant amount of national income. Work to improve forest management,
enhance forest certification and reduce illegality in the forest sector is important across the
hotspot. Yet, as long as timber has high value and there remains a significant lack of
transparency in the forestry sector, achieving lasting change through CSO engagement will be
challenging.
6.3.5 Land-use Planning
Land-use planning at the national and subnational scales is important for the protection of KBAs
and corridors. Across the different countries, land use planning legislation is in place in four of
the hotspot countries only (see Table 6.4). This is an important lacuna because the allocation of
land to different uses, ranging from smallholder farming to industrial plantations to protected
areas is a politicized issue and a major conservation challenge in hotspot countries.
6.3.6 Poverty Reduction Strategy Papers
Poverty Strategy Reduction Papers were prepared by World Bank member countries, as a guide
for donor investment in support of the MDGs. A review in 2010 showed that biodiversity
considerations were variably reflected in these papers (Figure 6.2).
Following the adoption of the Sustainable Development Goals (SDGs) in September 2015, there
is now a need to revise national priorities for development. This creates opportunities to
mainstream biodiversity into national development objectives. CSOs have potentially important
contributions to make to this process, in support of national implementation of the SDGs,
especially SDG15 to “protect, restore and promote sustainable use of terrestrial ecosystems,
sustainably manage forests, combat desertification, and halt and reverse land degradation and
halt biodiversity loss”.
6.3.7 Sustainable Financing
As protected areas have generally not been a high budgetary priority for governments in the
hotspot, one of the responses has been to try and develop alternative sustainable financing
streams. In at least two places, attempts are being made to develop funding streams from
REDD+ forest carbon payments using the voluntary carbon market: Gola Forest in Sierra Leone
(including KBA SLE1) and in Korup National Park (CMR5) in Cameroon. Nigeria is also
developing its national REDD+ strategy, which may result in additional funding sources for
forest conservation. In other countries, attempts are being made to develop funding streams from
tourism. For example, Kakum National Park in Ghana (part of KBA GHA15) has an aerial
walkway, which, as of 2010, attracted 140,000 visitors per annum, roughly 80 percent of whom
were local Ghanaians. Taï National Park in Côte d’Ivoire (part of KBA CIV11) also attracts

132
tourists for viewing of groups of habituated chimpanzees. Natural resource income tends to be
centralized and in the hands of the wildlife or (especially) forest administrations, which means
that sustainable financing mechanisms that operate locally are difficult to establish.
Figure 6.2 Integration of Biodiversity into the Poverty Reduction Strategy Papers of Selected African Countries
Source: Roe (2010). Note: 0 means that biodiversity is not reflected and 3 means that it is strongly reflected.
There are few other sustainable financing mechanisms for conservation in the hotspot, such as
green taxation schemes, conservation trust funds, tourism tax schemes, or PES schemes based on
water or carbon. While a number of initiatives are seeking to bring these kinds of mechanisms
into existence, few are yet to become truly active. For example, the Global Conservation Fund is
seeking to establish a sustainable financing mechanism for the East Nimba Nature Reserve in
Liberia and there are REDD+ pilot schemes under the voluntary carbon scheme in Sierra Leone
and Cameroon. Promoting sustainable financing mechanisms could be an important area for
investment through CSOs in the hotspot. One example of an active conservation trust fund is the
Fondation pour les Parcs et Réserves de Côte d’Ivoire, which aims to manage environmental

133
funds, finance projects and programs relating to the conservation of national parks and reserves
of Côte d’Ivoire, and to strengthen management capacity within Côte d’Ivoire’s conservation
sector.
6.3.8 Environmental Impact Assessment
All of the hotspot countries have Environmental Impact Assessment (EIA) requirements in place.
This is a relatively new development, partly in response to more rapid development in the mining
and oil and gas sectors, and the emerging pressures for development of plantations of palm oil
and rubber. Individual EIAs were not assessed during the ecosystem profiling process but the
limited experience of applying the tool in the hotspot suggests that the average quality of the
EIAs undertaken in the Guinean Forests is likely to be lower than the international norm.
Regarding the extractive industries, initiatives like the Extractive Industries Transparency
Initiative (EITI, which is a global initiative primarily focused on setting standards for ensuring
full disclosure of taxes and other payments made by oil, gas and mining companies to
governments) are improving the levels of accountability and transparency in this sector, although
environmental safeguards in some countries are still behind international standards. Countries in
the region complying with the EITI Standards are: Cameroon, Nigeria, Togo, Côte d’Ivoire,
Ghana and Liberia. Sierra Leone’s compliance status has been temporarily suspended until
remedial actions are taken and São Tomé and Príncipe, Equatorıal Guinea and Guinea are yet to
meet all the requirements. Much could be done to improve the quality of EIA and SEA in the
hotspot and there is a clear role for CSOs in this area of work.
6.3.9 Community Conservation
Another emerging trend in the legislation is the need to include local communities in
conservation actions, including protecting and managing their own conservation areas. Across
the hotspot as a whole, regulations governing community-based conservation are not particularly
well developed, with relevant legislation existing only in Cameroon and Ghana and being
developed in Sierra Leone. In Ghana and Cameroon, examples of community-managed reserves
can be found where communities are using a combination of customary and statutory laws to
regulate forest resource use. In other countries, it remains difficult for communities to own and
manage their natural resources according to statutory laws, although they still do so according to
their customary rules. Promoting community-based forest management in the countries where
there is a legal basis for it and promoting policy reform in countries where there is not was
identified by stakeholders consulted during the profiling process as an important conservation
strategy for CSOs.
6.3.10 Transboundary and Corridor Conservation
Most of the conservation corridors that are identified in this hotspot are regions of high shared
biological diversity within a single forest ecoregion. At the present time in most parts of the
hotspot the degree of connectivity between forest patches is declining and there ability to support
viable populations of wide-ranging species and deliver ecosystem services is being diminished.
Chapter 4 identifies nine conservation corridors, where enhancing connectivity at the landscape

134
scale would strengthen conservation efforts at KBAs and ensure long-term persistence of
biodiversity. Five of these countries span two or more countries. However, there currently exists
no national legislation related to transboundary cooperation for conservation.
6.3.11 Decentralization The process of decentralization involves the transfer of power from central to local governments,
with various degrees of administrative, financial and political implications. Encouraged by
international organizations, a significant amount of reform towards decentralizing institutional
structures has taken place in the region over more than two decades.
Some of the decentralization processes in the region have received criticism due to problems of
transparency in the management of public resources, insufficient transfer of funds and fiscal
power to local authorities, exceeding concentration of political and financial power as well as
human resources at higher levels of government, and a lack of accountability in the public sector
(Okojie 2009). In Cameroon, for instance, transferring the management of forest resources to
village or local management committees has allegedly led to the overexploitation of timber in the
absence of proper monitoring controls designed to prevent elite capture and corruption (Oyono
2004, 2005).
Processes of decentralization typically take place within the context of strong customary land
management systems. Very often, the de jure national to local government legal system operates
alongside the de facto customary management of land and resources at the village level. This
tension between ‘modern’ and ‘traditional’ ownership and management is found in all countries
and is important for all conservation projects in the hotspot.
Countries like Benin, Cameroon, Côte d’Ivoire and Ghana have also transferred power to local
authorities with respect to land-use planning and environmental management. For example,
Legislative Acts 97-028 and 99-029 in Benin empower the regions and municipalities to develop
land-use plans that deal with environmental affairs, among other issues. Others, such as Liberia,
are behind in this regard, despite having made progress in developing national decentralization
policies.
Benin has undergone a decentralization process since 1998, effective with local elections in 2002
and 2008. While Beninese departments are managed by a central government representative,
communes are governed by locally elected leaders (Caldeira et al. 2010).
In Sierra Leone, following the Local Government Act of 2004, the governance system now
features a central and a local government structure, as well as elected and chiefdom councils
(The REDD Desk 2015). Local authorities have the decision-making authority to establish their
own land-use plans and extract natural resources. However, the national government still plays a
central role in licensing mineral and forestry rights. Large levels of informality in these sectors
and weak institutional capacities remain a challenge in these processes as well as a lack of
transparency and some form of elite capture by certain chiefs and their families (UNEP 2010).
Nonetheless, the relatively decentralized nature of governance in Sierra Leone reportedly allows

135
traditional authorities, local councils and district forestry officers to play an important role in
managing protected areas (Brown and Crawford 2006).
The legal framework in Cameroon shows that the 2004 decentralization laws have local
development and governance as their main focus and represent a step forward for the process.
Nonetheless, effective legal instruments are needed for their application and the acceleration of
the process to provide good local governance (Cheka 2007).
In Côte d’Ivoire, upon independence, decentralization was not of major concern for the
authorities, despite relevant legal documentation. The new constitution of 2000, however,
provided for establishment of local authorities, members of which are elected by the local
population.
Equatorial Guinea contains decentralization and coordination principles in its main
environmental legislation (Law nº 7/2003). Yet, so far, they have not been operationalized. This
legislation also has specific procedures on land use plans for natural resources that are meant to
be followed by local authorities but they also have not been implemented, which is causing
conflicts among sectors with regard to competing land uses (Observatoire des Forêts d’Afrique
Centrale 2012).
Ghana has implemented reforms aimed at political, administrative and fiscal decentralization and
local government since 1988, leading to significant advances and 170 locally governed
authorities. Nevertheless, several issues still remain, including a slow integration rate of
decentralized departments with national governance, ineffectiveness of local substructures, lack
of popular participation in local governance and low capacity of local assembly members
(Government of Ghana 2010).
While decentralization in Guinea (a historically highly centralized country) has not been
achieved to a great extent, the process, envisioned for the first time in 1985, is being reluctantly
pursued. Important steps in the process have included local elections and the adoption of the
Local Government Code (World Bank 2008).
In Nigeria, a very populous country with a federal system, decentralization has become
increasingly important in the last two decades. Thus, the constitution provides for the division of
responsibilities between the central, state and local governments. The latter are in charge of
several matters including: economic planning and development, health services, land use, social
welfare, sewage and refuse disposal, adult and vocational education, and development of
agriculture and natural resources (Okojie 2009).
In São Tomé and Príncipe, governing district councils (known as ‘câmaras distritais’) in each of
the seven municipal districts are elected every five years and maintain limited autonomous
powers. In addition, the autonomous status of the island of Príncipe guarantees an element of
decentralization in the country; Príncipe has its own local government and parliament
(Democratic Republic of São Tomé and Príncipe 2004).

136
The ongoing decentralization process in Togo began in 1991, with the creation of the Ministry of
Decentralization and relevant constitutional reforms in 1992. Under the close supervision of the
ministry, the decentralized entities at the middle and local levels were jointly assigned decision-
making powers, as well as implementation, consultation and control functions, while financing
remained under the exclusive control of the central government. These entities, however, failed
to obtain necessary resources for these responsibilities, and thus the decentralization process has
since lost pace, resulting in the limited autonomy of local governance in the country (FAO n.d.).
6.3.12 Enforcement of Laws and Regulations
Despite the development of policy and laws over the past 20 years in the hotspot countries, the
enforcement capacity of implementing agencies is limited by financial and human constraints in
most countries. Inadequate implementation and enforcement mechanisms remain a big challenge,
as well as overlaps and a lack of coordination between the different governmental bodies and
sectors. Scarce resources, inadequate personnel, particularly at local levels, continue to hinder
the appropriate implementation of the legal and policy measures adopted so far.
6.4 Regional Agreements
The region is covered by a number of regional bodies and agreements that have an important
bearing on conservation in the hotspot. Two regional bodies foster economic and conservation
cooperation: the Economic Community of West African States (ECOWAS) and the Economic
Community of Central African States (ECCAS). The eight hotspot countries in West Africa are
members of ECOWAS, while Cameroon, Equatorial Guinea and São Tomé and Príncipe belong
to ECCAS. ECOWAS has formulated a forest convergence plan, which recognizes the role of
CSOs, while a similar plan has been developed for Central Africa by the Central African Forest
Commission (COMIFAC). Both the ECOWAS and COMIFAC convergence plans define
regional priorities for the conservation and sustainable management of forest resources. There
are also a number of regional or pan-African programs that are working in the hotspot.
6.4.1 Economic Community of West African States
ECOWAS was founded in 1975 as a regional pillar of the African Economic Community,
responsible for contributing to the continent’s development. Its mission is to promote collective
self-sufficiency, economic integration, stability and cooperation within the region, including in
areas such as natural resources, energy and agriculture, through the creation of a single large
West African economic and trading union. The ECOWAS Treaty aims to harmonize and
coordinate national policies on environmental protection, through the promotion of programs,
projects and activities in the fields of agriculture and natural resources. The ECOWAS
Commission has produced an Environmental Policy, in line with the Vision 2025 of the
ECOWAS Heads of State, which envisions a “peaceful, dignified and prosperous region whose
various and productive natural resources are preserved and managed on sustainable basis for the
development and equilibrium of the subregion” (ECOWAS 2008).

137
6.4.2 Commission of Central African Forests COMIFAC is an intergovernmental organization focused on the sustainable management of
Central African forests. It has 10 member states, including Cameroon, Equatorial Guinea and
São Tomé and Príncipe within the hotspot. In 2005, COMIFAC adopted a convergence plan to
improve the preservation and management of Central African forests.
6.4.3 New Partnership for Africa’s Development
The New Partnership for Africa’s Development (NEPAD) is an economic development program
of the African Union, of which all hotspot countries are member states. Adopted in 2001, it aims
to provide an overarching vision and policy framework for accelerating economic cooperation
and integration among African countries. The program’s primary objectives include the
eradication of poverty, the empowerment of women, and the promotion of sustainable growth
and development. In order to complement other African processes and improve environmental
conditions by assisting African countries to implement regional and international environmental
agreements, NEPAD has launched an Environment Initiative, with an Environment Action Plan
(NEPAD 2003).
6.4.4 Sustainable and Thriving Environments for West African Regional Development The Sustainable and Thriving Environments for West African Regional Development Program
(STEWARD) is a forest conservation and sustainable livelihoods program. STEWARD’s work is
focused on two priority ecosystems in West Africa. The first comprises Outamba-Kilimi
National Park and neighboring subprefectures in northwestern Sierra Leone, outside the
boundaries of the hotspot. The second comprises Mount Nimba and East Nimba Nature Reserve,
in Côte d’Ivoire, Guinea and Liberia, and broadly corresponds to the Mount Nimba Complex
(Corridor 3). STEWARD’s strategic objective is to implement a coherent regional program that
addresses transboundary threats to biodiversity, capitalizes on regional opportunities to spread
best practices, harmonizes policies, and addresses the adverse effects of global climate change.
6.4.5 Central African Regional Program for the Environment
The Central African Regional Program for the Environment (CARPE) is an initiative to promote
sustainable management of natural resources in the Congo Basin. It aims to reduce forest
degradation and loss of biodiversity rates by increasing local, national, and regional natural
resource management capacities. In order to achieve this goal, CARPE works on the
implementation of sustainable forest and biodiversity management practices, the strengthening of
environmental governance, as well as forest and other natural resource monitoring. CARPE is
currently active in several countries, including Cameroon, Equatorial Guinea and São Tomé and
Príncipe, the governments of which have express their willingness to create a meaningful
transboundary forest protection framework (CARPE 2012).

138
6.4.6 Congo Basin Forest Partnership The Congo Basin Forest Partnership (CBFP) is a non-profit initiative promoting conservation
and responsible management of the tropical forests in the Congo Basin through improvement of
techniques and information sharing by involved organizations. Launched in 2002, CBFP is led
by the United States and sponsored by more than 40 international governments and investors.
CBFP works closely with COMIFAC, and has 10 member countries, including Cameroon,
Equatorial Guinea and São Tomé and Príncipe in the hotspot. In 2011, a meeting was held under
the partnership, aimed at the creation of an action plan to strengthen national wildlife law
enforcement.
7. CIVIL SOCIETY CONTEXT IN THE GUINEAN FORESTS HOTSPOT This chapter provides an overview of the CSOs that are engaged in natural resource management
and biodiversity conservation in the Guinean Forest Hotspot. CEPF broadly defines civil society
as the set of institutions, organizations and individuals located between the family, the state and
the market, in which people associate voluntarily to advance common interests. This chapter is
based on desk studies and reviews, information obtained from representatives of civil society
groups during the stakeholder consultation workshops described in Chapter 2, personal
knowledge of the authors, and responses from a number of CSOs through remote consultations.
7.1 General Overview
As is the case in almost all parts of Africa, CSOs in the Guinean Forests Hotspot are broadly
those institutions and organizations operating at the interface between the government and
private sector, and those who tackle issues at the level of families and individuals (e.g. land
ownership matters). These include NGOs, private voluntary organizations, community based
organizations (CBOs), trade unions, gender groups, cultural and religious groups, private
companies, and research institutions. Civil society groups display differences in their relative
degrees of formality, autonomy and power relationship with other stakeholder groups. A
breakdown of the different categories of civil society groups is provided in Section 7.2.
Although the organizations consulted during this profiling process varied in terms of their
composition, vision and core values, most shared an ideology of promoting the conservation and
sustainable management of West Africa’s biodiversity. During the consultation process, key
CSOs were identified in each of the hotspot countries. A number of the CSOs consulted showed
significant potential for the implementation of conservation strategies in the hotspot. Figure 7.1
shows the number of CSOs involved in the conservation or sustainable management of
biodiversity within the hotspot, including national and international NGOs; community-based
organizations; universities and research centers. Cameroon has the largest number with 59,
followed closely by Nigeria with 57 and Ghana with 46. The country with the fewest CSOs
involved in conservation or sustainable management of biodiversity is São Tomé and Príncipe,
with eight.

139
Figure 7.1 Number of CSOs Involved in Conservation Identified in Each of the Hotspot Countries
Source: Consultation workshops and remote consultations between December 2013 and September 2015.
Table 7.1 Selected Local CSOs in the Hotspot Countries
Country Organizations
Benin
Association Vive le Paysan Nouveau (AVPN); Centre de Recherche pour la Gestion de la Biodiversité et du Terroir (CERGET); Benin Ecotourism Concern; Bees; CREDI-ONG; Femmes Solidaires; Groupe de Recherche et d’Action pour le Bien- être au Benin (GRABE-Benin); Nature Tropicale ONG.
Cameroon
Cameroon Wildlife Conservation Society; Cameroon Biodiversity Conservation Society (CBCS); Food and Environment Development Association; ERUDEF; Cameroon Environmental Watch (CEW); Centre for Environment and Development (CED); Community Action for Development (CAD), Forest and Rural Development Foundation(FORUDEF); Nature Cameroon; Forest Resources and People (FOREP), Youth Development Center, Community Action for Justice and Development (CAJAD), Network for the Environment and Sustainable Development Forest Governance Learning Group (NESDA/GREG), Operation Total Impact, Forest Governance and Industrial Concerns (EGI), People Earthwise, Education for sustainable Development (ASYOUSED), Global Water Partnership Central Africa, Cameroon Ecology (CAMECO), REACHOUT Cameroon.
Côte d’Ivoire ACB - Côte d’Ivoire; Les Familles et Environnement Restaures (LESFERES); NGO Société et Vie; ONG Le Monde Rural; Source De Vie; SOS - Forets.
Equatorial Guinea
ONG Amigos de la Naturaleza y Desarrolle ge Guinea Ecuatorial (ANDEGE); Asociación de Apoyo à la Mujer Africana ( (ASAMA); Asociación para la Promoción de la Mujer (ASPROMU); Red de Mujeres Africanas; para el Desarr Ollo Sostenible (REFADD); COMAPROGE.
Ghana
A Rocha Ghana; Conservation Alliance; Ghana Wildlife Society; Civic Response; Green Earth Organization (GEO); Together Rural Development Solidarity (TORUDES); Tropenbos International Ghana (TBI-Ghana); Development Institute (DI); Friends of the Earth Ghana (FOE); Friends of the Nation.
Guinea Guinea Ecologie; COLUFIFA Guinea.
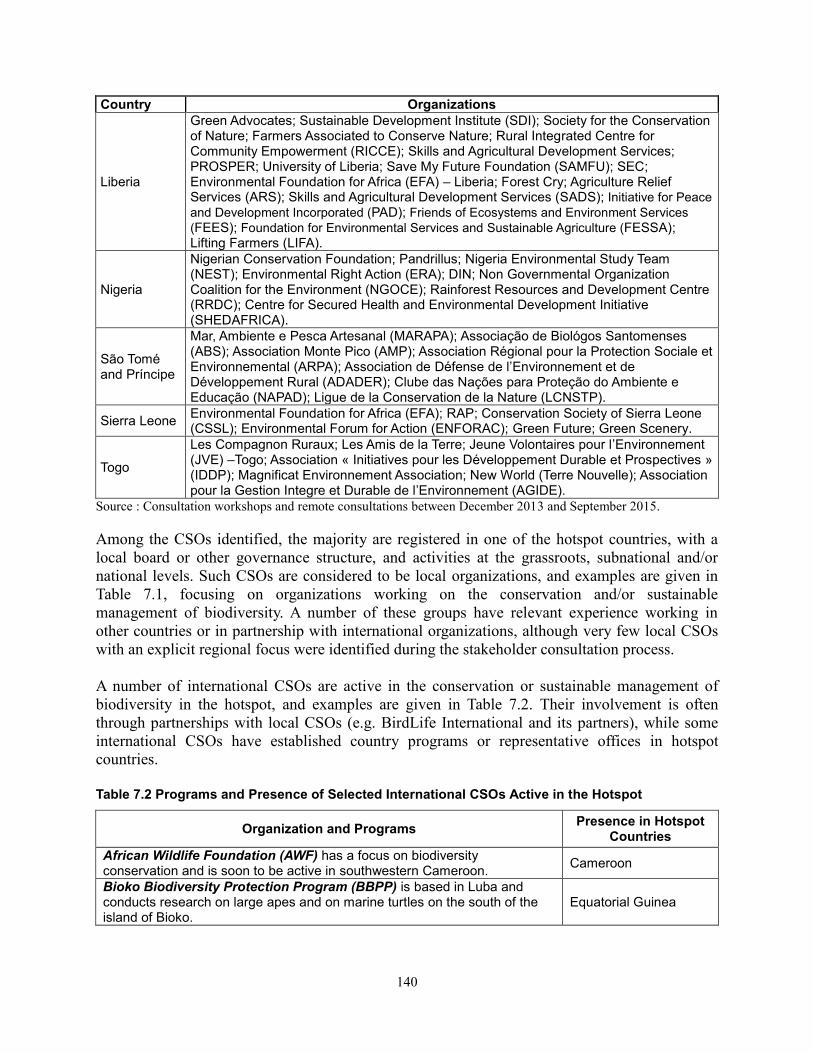
140
Country Organizations
Liberia
Green Advocates; Sustainable Development Institute (SDI); Society for the Conservation of Nature; Farmers Associated to Conserve Nature; Rural Integrated Centre for Community Empowerment (RICCE); Skills and Agricultural Development Services; PROSPER; University of Liberia; Save My Future Foundation (SAMFU); SEC; Environmental Foundation for Africa (EFA) – Liberia; Forest Cry; Agriculture Relief Services (ARS); Skills and Agricultural Development Services (SADS); Initiative for Peace
and Development Incorporated (PAD); Friends of Ecosystems and Environment Services
(FEES); Foundation for Environmental Services and Sustainable Agriculture (FESSA); Lifting Farmers (LIFA).
Nigeria
Nigerian Conservation Foundation; Pandrillus; Nigeria Environmental Study Team (NEST); Environmental Right Action (ERA); DIN; Non Governmental Organization Coalition for the Environment (NGOCE); Rainforest Resources and Development Centre (RRDC); Centre for Secured Health and Environmental Development Initiative (SHEDAFRICA).
São Tomé and Príncipe
Mar, Ambiente e Pesca Artesanal (MARAPA); Associação de Biológos Santomenses (ABS); Association Monte Pico (AMP); Association Régional pour la Protection Sociale et Environnemental (ARPA); Association de Défense de l’Environnement et de Développement Rural (ADADER); Clube das Nações para Proteção do Ambiente e Educação (NAPAD); Ligue de la Conservation de la Nature (LCNSTP).
Sierra Leone Environmental Foundation for Africa (EFA); RAP; Conservation Society of Sierra Leone (CSSL); Environmental Forum for Action (ENFORAC); Green Future; Green Scenery.
Togo
Les Compagnon Ruraux; Les Amis de la Terre; Jeune Volontaires pour l’Environnement (JVE) –Togo; Association « Initiatives pour les Développement Durable et Prospectives » (IDDP); Magnificat Environnement Association; New World (Terre Nouvelle); Association pour la Gestion Integre et Durable de l’Environnement (AGIDE).
Source : Consultation workshops and remote consultations between December 2013 and September 2015.
Among the CSOs identified, the majority are registered in one of the hotspot countries, with a
local board or other governance structure, and activities at the grassroots, subnational and/or
national levels. Such CSOs are considered to be local organizations, and examples are given in
Table 7.1, focusing on organizations working on the conservation and/or sustainable
management of biodiversity. A number of these groups have relevant experience working in
other countries or in partnership with international organizations, although very few local CSOs
with an explicit regional focus were identified during the stakeholder consultation process.
A number of international CSOs are active in the conservation or sustainable management of
biodiversity in the hotspot, and examples are given in Table 7.2. Their involvement is often
through partnerships with local CSOs (e.g. BirdLife International and its partners), while some
international CSOs have established country programs or representative offices in hotspot
countries.
Table 7.2 Programs and Presence of Selected International CSOs Active in the Hotspot
Organization and Programs Presence in Hotspot
Countries
African Wildlife Foundation (AWF) has a focus on biodiversity conservation and is soon to be active in southwestern Cameroon.
Cameroon
Bioko Biodiversity Protection Program (BBPP) is based in Luba and conducts research on large apes and on marine turtles on the south of the island of Bioko.
Equatorial Guinea

141
Organization and Programs Presence in Hotspot
Countries
BirdLife International has its international headquarters in the United Kingdom, but also has an African Regional Office in Nairobi Kenya, which oversees the West African Regional Office based in Accra, Ghana. BirdLife has national partner NGOs in six of the hotspot countries. While it does not have a partner in São Tomé and Príncipe (due to the inexistence of a suitable candidate), BirdLife nevertheless has had a strong presence in the country over the last decade or so, due to its elevated importance for bird conservation. The organization’s major interest is on birds and people, and it undertakes programs for the conservation of birds which are jointly implemented with national partners
Cameroon, Côte d’Ivoire, Ghana, Liberia, Nigeria and Sierra Leone
CARE International began operations in Ghana in 1994, but soon expanded operations to Benin and Togo. CARE programs and projects are implemented through partnerships with local CSOs.
Benin, Ghana, and Togo
Center for International Forestry Research (CIFOR) is present mainly in Cameroon. Works in research partnership around Manyemen in the Korupmba-Obachap corridor.
Cameroon
Conservation International (CI) works with regional and national partners in the Mano River Conservation Program comprising of 4 of the hotspot countries – Côte d’Ivoire, Guinea, Liberia and Sierra Leone. CI also has forest conservation programs in Ghana and Liberia. CI works with Conservation Alliance on many of their programs especially in Ghana.
Mano River Program, Equatorial Guinea, Ghana, and Liberia
ECOGUINEA is based in Pico Basile, and provides support to the conservation of biodiversity through sensitization and research extension.
Equatorial Guinea
Environmental Justice Foundation (EJF) is a UK-based non-profit organisation working internationally to protect the environment and defend human rights. EJF aims to use direct and effective information gathered from field projects based on community partnerships to influence national policies.
Côte d’Ivoire, Ghana, Liberia and Sierra Leone
Environmental Foundation in Africa (EFA) aims to protect and restore the environment in West Africa. EFA is involved in environmental education and awareness raising campaigns, restored degraded lands and conserved pristine forests.
Liberia and Sierra Leone.
Forest Peoples Program (FPP) is similar to the RRI in all respects and works in partnership.
Cameroon, Liberia.
International Union for Conservation of Nature (IUCN) is present in the hotspot through the West and Central Africa Regional Program, and has its regional office situated in Ouagadougou, Burkina Faso. IUCN supports networking activities and capacity building for CSOs and governments in the hotspot countries. The organization has a range of programs on forest governance, supports research into the inter-relations between biodiversity and economics or climate change, and develops activities in specific biomes such as freshwater, wetlands and drylands.
Benin, Cameroon, Côte d’Ivoire, Equatorial Guinea, Guinea, Sao Tomé and Príncipe, and Togo
Last Great Apes (LAGA) is a Wildlife Law Enforcement NGO based in Cameroon and working in close cooperation with Governments. It aims at fighting the commercial poaching with its related trade of protected species.
Cameroon
Rights and Resources Initiative (RRI) focuses on community rights, land tenure and small forest enterprises. They work with national advocacy groups and networks, local communities and indigenous organizations.
Cameroon, Liberia
Royal Society for the Protection of Birds (RSPB) is a UK charity working to secure a healthy environment for birds and all wildlife. RSPB programs in the hotspot include: a) the conservation of São Tomé’s critical species, b) the conservation of the Gola Rain Forest, c) development of conservation capacity in Nigeria, and d) development of conservation capacity in Sierra Leone.
Cameroon, Ghana, Nigeria, and São Tomé and Príncipe, Sierra Leone

142
Organization and Programs Presence in Hotspot
Countries
Wild Chimpanzee Foundation (WCF) aims to enhance the survival of the remaining wild chimpanzee populations and their habitat, using an evidence-based approach to conservation. WCF is working mainly in the Cestos-Sapo-Grebo-Taï-Cavally Corridor (Corridor 4) in Côte d’Ivoire and Liberia, and also has local partners on the Fouta Djallon Massif in Guinea.
Côte d’Ivoire, Guinea, Liberia
Wildlife Conservation Society (WCS) has programs with various CSOs and governments in the hotspot forest landscapes of Cross River State, Nigeria, and Korup National Park (CMR5) and the Banyang Mbo Wildlife Sanctuary in the Western part of Cameroon.
Cameroon, Equatorial Guinea, Nigeria
World Wide Fund for Nature (WWF) also collaborates with various national and regional partners in the Congo Basin on a variety of issues including ecosystem services, REDD+ initiatives and landscape programs. The organization has conservation programs in the Mount Cameroon landscape and Korup National Park (CMR5) of Cameroon.
Cameroon, Côte d’Ivoire, Equatorial Guinea, Ghana, Liberia, and São Tomé and Príncipe
World Agroforestry Center (ICRAF) focuses on agroforestry research and achieved development goals through partnerships with local and national NGOs.
Cameroon, Cote d’Ivoire, Nigeria
Source: Consultation workshops and remote consultations between December 2013 and September 2015.
7.2 Categories of CSO More than 300 CSOs working on conservation-related issues in the hotspot were identified
during the profiling process (Figure 7.1). It is important to note that not all of these CSOs are
equally active, with some not having implemented activities for several years, as a result of
funding gaps, loss of key staff or other constraints. Most of these CSOs can be classified into one
of five major categories, which are reviewed in turn in this section.
7.2.1 Technical Organizations
These are organizations that operate their own projects to pioneer new or improved approaches
to problems, generally within a specific field. Typically they are international organizations, and
have support of international donors and governments. Examples include: CI and FFI in Liberia;
Wildlife Conservation Society (WCS) and Pandrillus Foundation in Nigeria; IUCN and World
Wide Fund for Nature (WWF) in Cameroon; and Conservation Alliance, IUCN, Rainforest
Alliance and Tropenbos International in Ghana. The national NGO partners of BirdLife
International play active roles in eight of the 11 hotspot countries: Cameroon; Côte d’Ivoire;
Ghana; Guinea; Liberia; Nigeria; Sierra Leone; and São Tomé and Príncipe.
7.2.2 Development Organizations These are organizations that concentrate on grass-roots democracy, social justice and social
development, and whose members attempt to shape a popular development process. Most of
these organizations have links with international NGOs (e.g. OXFAM, CARE International,
etc.). Most of the funds available for carrying out their activities are sourced from development
agencies.

143
7.2.3 Advocacy Groups and Networks
These are organizations without field projects, and whose primary activity is advocacy.
Examples include Civic Response and Ghana Forest Watch in Ghana; Sustainable Development
Institute (SDI) and Green Advocates in Liberia, Centre for Environment and Development
(CED) in Cameroon, Mar Ambiente E Pesca Artesanal (MARAPA) and Zatona-Adil in São
Tomé and Príncipe, and Amigo de la Naturaleza y del Desarrollo de Guinea Ecuatorial
(ANDEGE) in Equatorial Guinea.
7.2.4 Awareness Groups
These are organizations whose major activities revolve around improving the awareness of local
communities on issues related to conservation and sustainable management. Examples include
Ghana Wildlife Society, whose program includes environmental education activities, and Korup
Rainforest Conservation Society, whose work is focused on Korup National Park (CMR5) in
Cameroon.
7.2.5 Networking Groups
These are organizations that relate to the awareness group above, and complement their
advocacy activities at both the national and regional scales. Forest Watch Ghana, national
components of the Network of African Women for Sustainable Development (REFADD) in
Equatorial Guinea and Cameroon, and the Environmental Foundation for Africa and Green
Actors of West Africa in Sierra Leone are specific examples.
7.3 Operating Context and Political Space
A critical factor affecting any given CSO’s ability to work in a country is the legal and regulatory
framework, which allows and governs its establishment, and space and scope to function in
public life. All of the organizations consulted during the profiling process justified their
legitimacy by reference to their registration with their respective state institutions. This allows
them to operate as advocacy organizations and to engage stakeholders in the management of
natural resources, including government institutions.
The role played by civil society in the protection and sustainable management of natural
resources in the hotspot countries is generally still limited, although they have significant
impacts in some cases. The hotspot countries typically face many political and socioeconomic
problems which have ramifications for the conservation and management of natural resources
(see Chapters 5 and 6). Examples include the recent wars in Côte d’Ivoire, Liberia and Sierra
Leone, and the recent outbreak of the Ebola virus in Guinea, Liberia, Nigeria and Sierra Leone.
CSOs working on public policy, advocacy or projects in controversial areas face particular
challenges. Notwithstanding this sometimes complex working environment, CSOs continue to
play a key role in supporting and complementing government policies and programs, especially
at the local and regional levels where decentralization has expanded government mandates but
has often not increased capacities.

144
The stakeholder consultation workshops and remote consultations undertaken during the
profiling process provided opportunities to collect information on the operating environment in
the hotspot. Stakeholders were asked to assess the operating environment for civil society in the
11 hotspot countries in terms of legal frameworks, political space and funding availability; the
results are summarized in Table 7.3. This feedback from stakeholders suggests that, among the
hotspot countries, Cameroon and Guinea are the most conducive to CSO engagement, with an
enabling legal framework and political space, although funding availability remains variable by
area and interest. The operating environments in Côte d’Ivoire and Togo were reported to be the
least favorable for CSO engagement, due to their constrained legal frameworks and political
space, although this is not reflected in the availability of funds for conservation activities in Côte
d’Ivoire, perhaps because the high levels of biodiversity in certain areas of the country remain
appealling to international donors.
Table 7.3 Perceived Operating Environment for CSOs in the Hotspot Countries
Country Legal Framework Political Space Funding Availability
Benin Enabling Neutral Constrained
Cameroon Enabling Enabling Variable
Côte d’Ivoire Constrained Constrained Variable
Equatorial Guinea Constrained Neutral Constrained
Ghana Enabling Neutral Variable
Guinea Enabling Enabling Variable
Liberia Enabling Neutral Variable
Nigeria Enabling Neutral Constrained
São Tomé and Príncipe Enabling Neutral Constrained
Sierra Leone Enabling Enabling Variable
Togo Constrained Constrained Constrained
Source: Consultation workshops and remote consultations between December 2013 and September 2015.
Ghana and Liberia are of particular interest because these two countries favor collaboration
between government and CSOs. Both countries’ legal frameworks were judged as enabling and
as providing a neutral political space, which is an indication that the CSOs are given freedom to
perform, so long as they contribute positively to the development of government policies. This is
reflected in CSOs’ substantive contributions to the development of the negotiation texts for the
Voluntary Partnership Agreements between the EU and the governments of the two countries.
However, the representatives from these two countries highlighted the fact that, although the
relevant legal frameworks exist, there remain challenges with respect to weak implementation by
government institutions. Funding availability for these two countries remains variable.
Nigeria is the only country in the hotspot where the legal framework on natural resource policies
and legislations are implemented at two levels of government (federal and state). Although, this
may be considered cumbersome, all CSOs in the country are required to register with the
Corporate Affairs Commission at the federal level. Stakeholders from Nigeria highlighted that,
with adequate understanding and management support, the process can be overcome, thus
enabling CSOs to better access relevant funding at the appropriate levels.
Representatives from Côte d’Ivoire, Equatorial Guinea and Togo agreed that enacting favorable
policy and legislation to support the creation of CSOs would be beneficial should it be paired
with increased capacities of those CSOs at technical, institutional and financial levels. Most of

145
the West and Central African governments’ treatment of CSOs exacerbates the weaknesses that
already exist in civil society. Governments typically regard autonomous CSOs with suspicion,
particularly those groups that advocate for government reforms, such as the just redistribution
and use of natural resource revenues. For home-grown CSOs, the result has been a lack of
adequately informed and trained individuals, and an operating environment in which civil society
is neither well understood nor organized.
Generally though, the increasing democratization of the hotspot’s countries has led to improved
civil society involvement in the conservation and sustainable management of the hotspot’s
natural resources, as well as increased cooperation between CSOs and governments. Some of the
governments of the hotspot countries (e.g. Cameroon, Ghana, Liberia, Nigeria and Sierra Leone)
are signatories to agreements that support partnerships between government and CSOs to assist
in the management of natural resources. The forest convergence plan of ECOWAS recognizes
the role of CSOs, while that of COMIFAC encourages the engagement of CSOs in forest
conservation.
CSOs in some of the hotspot countries have also successfully engaged their governments and the
private sector in the development of enabling policies for natural resource utilization and
conservation. Of particular note are the engagement of Liberian CSOs in the development of the
community rights law, the participation of Ghanaian CSOs in the revision of national forest and
wildlife policies, and the development of biodiversity action plans for specific forest reserves in
the Niger Delta through cooperation between Shell Petroleum Development Company and the
Nigerian Conservation Foundation (NCF) in Nigeria. These plans were produced as a means of
managing the company’s biodiversity impacts in areas where they are operating, and also as a
means of ascertaining compliance with the Shell Group’s own biodiversity standard. Cameroon,
Ghana and Liberia are also noted for the inclusion of civil society representatives in the
composition of their national REDD+ working groups/steering committees. In Equatorial
Guinea, CSOs worked with the government to promulgate a law prohibiting the hunting of large
primates and other endangered species. In Cameroon, CSOs successfully advocated for a
community forest reform that strengthened the management of community forestry by CSOs and
CBOs. In São Tomé and Príncipe, CSOs such as MARAPA have been instrumental in promoting
the sustainable management of key marine/coastal species and the protection of their habitats.
The discovery of new deposits of oil, gas and high value minerals in parts of the hotspot
countries (e.g. Cameroon, Côte d’Ivoire, Equatorial Guinea, Ghana, Liberia, Nigeria and Sierra
Leone) has introduced another dimension to the relationship between CSOs, government, and the
private sector. Most of the oil and gas is located in coastal and offshore areas, except in Nigeria,
where it is also found in the Niger Delta. When responding to social and environmental issues
arising from exploration for and extraction of oil, gas and minerals, CSOs are increasingly
finding themselves in conflict with both governments and the private sector, due primarily to the
nature and scale of the operations, insufficient consideration of environmental impacts by the
proponents, and a lack of adequate planning for the local communities in the areas where the
extraction occurs. Stakeholders consulted during the profiling process resoundingly advocated
for the strengthening of institutional capacity and the development of adequate skills among
CSOs to help prevent and resolve such conflicts in future.

146
7.4 Capacity Needs
The collective capacities of the conservation-focused CSOs in the Upper and Lower Guinean
Forests subregion were assessed by the stakeholders at the final consultation workshops in
Monrovia and Limbé in August-September 2015, using a standard set of criteria and indicators
developed by CEPF. Table 7.4 presents the results of this exercise, which are very similar for the
two subregions, with the only substantive difference concerning the incidence of effective
partnership mechanisms.
Table 7.4 Baseline of the Collective Capacities of CSOs in the Upper and Lower Guinean Forests Subregions
Criterion
Upper Guinean Forests
subregion
Lower Guinean Forests
subregion
i. Human resources
Local and national civil society groups collectively possess technical
competencies of critical importance to conservation.
Not met Not met
Partially met Partially met
Fully met Fully met
ii. Management systems and strategic planning
Local and national civil society groups collectively possess sufficient
institutional and operational capacity and structures to raise funds for
conservation and to ensure the efficient management of conservation
projects and strategies.
Not met Not met
Partially met Partially met
Fully met Fully met
iii. Partnerships
Effective mechanisms exist for civil society groups to work in
partnership with one another, and through networks with local
communities, governments, the private sector, donors, and other
important stakeholders, in pursuit of common objectives.
Not met Not met
Partially met Partially met
Fully met Fully met
iv. Financial resources
Local CSOs have access to long-term funding sources to maintain the
conservation results achieved via CEPF grants and/or other initiatives,
through access to new donor funds, conservation enterprises,
memberships, endowments, and/or other funding mechanisms.
Not met Not met
Partially met Partially met
Fully met Fully met
v. Transboundary cooperation
In multi-country hotspots, mechanisms exist for collaboration across
political boundaries at site, corridor and/or national scales.
Not met Not met
Partially met Partially met
Fully met Fully met
Specifically, stakeholders from both subregions considered that collective knowledge and
capacity within local and national CSOs could be rated as satisfactory or above in at least
50 percent of the technical competencies considered as priorities in the hotspot. Similarly, they
agreed that at least 50 percent of CEPF priority KBAs had at least one local, national, or
international CSO dedicated to their conservation with at least satisfactory institutional and
operational capacity. However, considering partnerships, stakeholders from the Lower Guinean
Forests considered that less than 50 percent of CEPF priority sites had fully institutionalized and
sustainable partnerships dedicated to coordinating conservation and development actions among
key stakeholder groups, while stakeholder from the Upper Guinean Forests felt that this figure

147
should be between 50 and 90 percent for their subregion. As will be highlighted in Chapter 10,
less than 50 percent of CEPF priority KBAs have access to stable and diversified long-term
funding sources for conservation through support to local CSOs in both subregions. Lastly,
stakeholders from both subregions considered that effective mechanisms for transboundary
collaboration existed in at least 90 percent of the countries in the hotspot. However, due to the
other criterion not being met, those collaborations are often very weak.
Information obtained through the stakeholder consultation workshops and remote consultations
also provided an indication of the capacities of individual CSOs active in the hotspot. Most of
the international CSOs working in the hotspot were deemed to have adequate institutional
capacity and relevant technical expertise, although it was suggested that some could still benefit
from additional financial resources considering the number of projects and activities that they
undertake, coupled with a need to follow up on projects as results and impacts becomes visible.
The majority of the local CSOs (see Table 7.1 for examples) considered themselves to have
significant technical capacity, institutional and political knowledge and the requisite competence
to execute their core mandates, albeit with inadequate knowledge in specific areas and, most
importantly, a shortage of financial resources, as mentioned previously.
Apart from shortage of financial resources, the local CSOs consulted as part of the profiling
exercise identified several key capacity needs that, if addressed, would enable them to engage
more effectively in biodiversity conservation:
i. Technical training on conservation and sustainable management;
ii. Ability to engage with the private sector to mainstream biodiversity conservation into
development;
iii. Training in project development and proposal writing, especially for leveraging that can
lead to sustainable funding for conservation activities;
iv. Exchange visits for CSOs between and within hotspot countries, especially with
international CSOs and large national organizations;
v. Training on organizational governance issues, especially accountability to local
communities and other consituencies.
It should be reiterated here that capacity needs vary considerably among local CSOs. There are a
number of CSOs in countries such as Cameroon, Ghana, Nigeria, Liberia and Sierra Leone that
have institutional capacities deemed adequate to engage the government on conservation and
sustainable use issues, while most CSOs in countries such as Benin, Equatorial Guinea, Guinea,
São Tomé and Príncipe, and Togo are at an early stage of organizational development. These
capacity differences may be related to the challenging operating environment for civil society in
many of the hotspot countries, as well as the lack of a regulatory framework. Ghana Wildlife
Society, Nigerian Conservation Foundation, and the Conservation Society of Sierra Leone (to
mention a few) have benefited immensely from technical support from international
organizations, such as BirdLife International, RSPB and WCS, with demonstrably positive
results.

148
Representatives from the 11 countries that were consulted at the final consultation workshops in
Monrovia and Limbé were asked to identify major barriers to effective civil society performance
and to suggest how they could be best supported to overcome them (Table 7.5).
Table 7.5 Barriers to Effective Civil Society Performance in the Hotspot Countries and Priorities for Support
Ben
in
Cam
ero
on
Cô
te
d’Ivo
ire
Eq
uato
ria
l
Gu
inea
Gh
an
a
Gu
inea
Lib
eri
a
Nig
eri
a
São
To
mé &
Prí
nc
ipe
S
ierr
a
Leo
ne
To
go
Total
Barr
iers
to
perf
orm
an
ce
du
e
to in
ad
eq
uate
:
CSOs technical and institutional capacities
x x x x x x x x 8
Access to public and other long term funding
x x x x x x x x 8
Project timeframe and design to obtain community ownership
x x x x 4
Process for establishing / recognition CSOs
x x x 3
Communication / partnerships between CSOs
x x x 3
Participation in policy formulation and implementation
x 1
Su
pp
ort
need
ed
wit
h:
Building CSOs’ technical and institutional capacities
x x x x x x x x 8
Building partnerships among CSOs
x x x x x x x 7
Establishing transparent performance monitoring systems by CSOs
x x x x x x 6
Simplifying establishment/ recognition processes for CSOs
x x x x x 5
Creating sustainable funding mechanisms
x x x x x 5
Demonstrating CSOs contributions to Governments
x
x
x x
4
Source: Final consultation workshops, August and September 2015.
Major barriers for CSOs in eight countries are lack of adequate technical and institutional
capacity, as well as the difficulty in accessing fundings, including from their respective
government. More specifically, when looking at their capacities, CSOs identified gaps at two
levels: individual skills (such as leadership and financial management); and institutional skills
(such as strategic planning, proposal development and reporting). The lack of funding options for
CSOs (see Section 7.5) goes hand in hand with constraining timeframes. To obtain results in
terms of sensitization, community ownership or development of alternative livelihoods often
takes longer than the typical project cycles of international donors. This, in turn, creates fatigue
and disenchantment among communities that are left on their own between projects. Limited and
unstable funding was also perceived as a contributing factor to higher staff turnover. Trained staff
members with the capacities to raise and manage funds too often leave their institutions for more

149
stable employment and higher salaries within bigger institutions, the private sector and/or the
government, thereby creating a vicious circle.
Fostering partnerships among CSOs, encouraging South-South exchanges between CSOs, and
promoting mentorship by international NGOs are all perceived as positive pathways for civil
society development (mentioned by CSOs from seven countries) along with recurrent training
based on standardized modules (mentioned by CSOs from eight countries). Simplification of the
public funding process would enhance CSOs access to government funding, should CSOs better
align their funding needs and strategies with priorities of government as well as bilateral and
multilateral donors. CSOs feel the need to put in place rigorous and more transparent
performance monitoring systems including regular audits. This is another theme for which CSOs
consulted requested dedicated training and support. Along with a dire need for the creation of
sustainable funding mechanisms, such as Conservation Trust Funds, consulted CSO
representatives highlighted the necessity of engaging in policy formulation and implementation
processes, to demonstrate to government the important contribution that CSOs can make with
their unique perspectives. This will require greater alignment of CSOs’ agendas with government
priorities and improved dissemination of information produced by CSOs via local-language
media.
7.5 Funding Context Funding for CSOs has long been problematic in the hotspot, not least because there is often little
or no internally generated funding from the countries themselves. Most of the hotspot’s CSOs
rely solely on funds from developed countries for the implementation of their activities. Even
then, few have been successful in supporting programs with funds from international donors over
a sustained period of time, due in part to a typically low capacity for fundraising. A number have,
however, developed partnerships with international NGOs, from whom they gain technical and
fundraising support, and who can help them to access such funding sources that may be available
locally (e.g. discretionary embassy funds and some private companies).
A large number of aid agencies, including AFD, Danida, le Fonds Français pour l’Environnement
Mondial (FFEM), NORAD, the UK Department for International Development (DfID), the
United States Agency for International Development (USAID) and the World Bank, among
others, have shown interest in the conservation and sustainable management of biodiversity in
the hotspot. Much of their funding has been directed towards governments and regional
institutions and bodies (e.g. ECOWAS in West Africa and COMIFAC in Central Africa) and
international NGOs. A small proportion of these funds also go to CSOs, most of which are either
solicited directly from the aid agencies or contracted by governments to competent in-country
NGOs. Most of the hotspot countries have remained among the aid agencies’ priorities owing to
their ongoing low levels of per capita income. However, in recent times, and particularly since
some countries have discovered reserves of oil and gas (e.g. Côte d’Ivoire, Equatorial Guinea,
Ghana, and São Tomé and Princípe), international donors are beginning to view them as ‘middle-
income’ countries, and, hence, lower priorities for development assistance.
Most of the international development assistance that goes directly to local NGOs in the hotspot
supports governance of the forest sector, especially following the African Forest Law
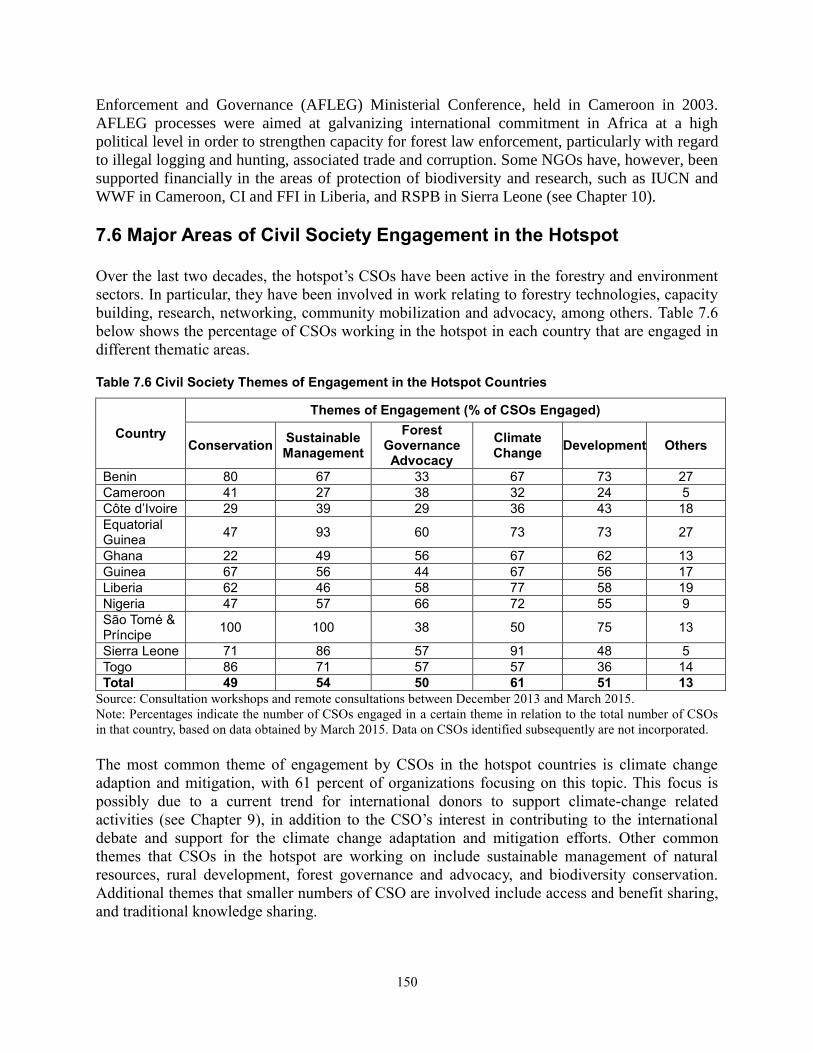
150
Enforcement and Governance (AFLEG) Ministerial Conference, held in Cameroon in 2003.
AFLEG processes were aimed at galvanizing international commitment in Africa at a high
political level in order to strengthen capacity for forest law enforcement, particularly with regard
to illegal logging and hunting, associated trade and corruption. Some NGOs have, however, been
supported financially in the areas of protection of biodiversity and research, such as IUCN and
WWF in Cameroon, CI and FFI in Liberia, and RSPB in Sierra Leone (see Chapter 10).
7.6 Major Areas of Civil Society Engagement in the Hotspot Over the last two decades, the hotspot’s CSOs have been active in the forestry and environment
sectors. In particular, they have been involved in work relating to forestry technologies, capacity
building, research, networking, community mobilization and advocacy, among others. Table 7.6
below shows the percentage of CSOs working in the hotspot in each country that are engaged in
different thematic areas.
Table 7.6 Civil Society Themes of Engagement in the Hotspot Countries
Country
Themes of Engagement (% of CSOs Engaged)
Conservation Sustainable Management
Forest Governance Advocacy
Climate Change
Development Others
Benin 80 67 33 67 73 27
Cameroon 41 27 38 32 24 5
Côte d’Ivoire 29 39 29 36 43 18
Equatorial Guinea
47 93 60 73 73 27
Ghana 22 49 56 67 62 13
Guinea 67 56 44 67 56 17
Liberia 62 46 58 77 58 19
Nigeria 47 57 66 72 55 9
São Tomé & Príncipe
100 100 38 50 75 13
Sierra Leone 71 86 57 91 48 5
Togo 86 71 57 57 36 14
Total 49 54 50 61 51 13
Source: Consultation workshops and remote consultations between December 2013 and March 2015.
Note: Percentages indicate the number of CSOs engaged in a certain theme in relation to the total number of CSOs
in that country, based on data obtained by March 2015. Data on CSOs identified subsequently are not incorporated.
The most common theme of engagement by CSOs in the hotspot countries is climate change
adaption and mitigation, with 61 percent of organizations focusing on this topic. This focus is
possibly due to a current trend for international donors to support climate-change related
activities (see Chapter 9), in addition to the CSO’s interest in contributing to the international
debate and support for the climate change adaptation and mitigation efforts. Other common
themes that CSOs in the hotspot are working on include sustainable management of natural
resources, rural development, forest governance and advocacy, and biodiversity conservation.
Additional themes that smaller numbers of CSO are involved include access and benefit sharing,
and traditional knowledge sharing.

151
7.6.1 Management of Protected Areas International NGOs have long supported governments with the management of protected areas,
mainly due to the lack of adequate capacity and funding within the governments themselves.
Support to protected areas in the Upper Guinean Forests is being provided by CI and FFI in
Liberia, WCF in Côte d’Ivoire, Guinea and Liberia, and RSPB in Sierra Leone. In the Lower
Guinean Forests, support is being provided by WCS in Nigeria, IUCN in Cameroon and WWF in
Equatorial Guinea, including on Annobón and Bioko islands. There has been relatively less
support for the social aspects of protected area management, such as poverty reduction and
participatory management, although these have become higher priority interests among
international NGOs and donors in recent decades.
Several local NGOs are also involved in protected area management within the hotspot. For
example, Ghana Wildlife Society (GWS) is involved with the management of several protected
areas and other IBAs in Ghana, including Amansuri Wetland (GHA1). In the same country, A
Rocha Ghana is currently involved in the conservation and sustainable management of several
sites, including Atewa Range Forest Reserve (GHA3). In Nigeria, NCF is supporting the
management of several protected areas, including Gashaka-Gumpti National Park (NGA5) and
Okomu National Park (NGA10). NCF is also involved with the conservation and sustainable
utilization of resources in the Niger Delta. In Sierra Leone, CSSL has played an important role in
the protection of natural resources in the country, including through development of the Gola
Rainforest Programme, in collaboration with the Ministry of Agriculture Forestry and Food
Security (MAFFS) and RSPB. One of the most significant achievements of the project has been
the 2011 declaration, by the President of Sierra Leone, of the Gola Forest Reserve as a National
Park. Across the border in Liberia, the Society for Conservation of Nature in Liberia (SCNL)
plays an important role in the management of the Gola Trans-boundary Peace Park.
7.6.2 Livelihood and Local Development
Around half of the national NGOs consulted during this profile implement livelihood and local
development activities (Table 7.1), and the same applies for most international NGOs. This is an
area in which national CSOs have had demonstrable success in the hotspot, and where they have
a comparative advantage because of their relative proximity to local communities. Notable CSOs
involved in livelihoods and local development activities included A Rocha Ghana, Conservation
Alliance (CA) in Ghana, SDI in Liberia and WCS in Nigeria. The six BirdLife partner NGOs in
the hotspot are also involved in livelihood and local development, based around building a
network of Local Conservation Groups (LCGs) and other means of community engagement, and
then providing support via a decentralized global secretariat.
CA, an offshoot of CI, is a non-profit, environmental NGO with activities related to improving
livelihoods at the community level. CA brings together the people and skills needed to build
Africa’s capacity to conserve biodiversity through sound science, local initiatives and good
governance. It also aims to assist fringe communities to create economic opportunities that result
in improved wildlife and habitat management, and wealthier, healthier communities. It works
with agricultural industries (e.g. cacao and oil palm producers) to ensure that best practices are
followed in the use of natural resources. CA currently works in six hotspot countries (Sierra

152
Leone, Liberia, Côte d’Ivoire, Ghana, Nigeria and Cameroon), and in a number of KBAs (e.g.
Ankasa Resource Reserve - Nini-Sushien National Park (GHA2) in Ghana).
It should be noted that, with important exceptions, livelihood projects implemented by
conservation-oriented CSOs tend to be small in scale, and to be supported by short-term grants
that often leave communities struggling to meet their objectives with the available time, funding
and capacity. Some projects tend to be small-scale in nature and in some cases, external threats to
target ecosystems and species (e.g. commercial hunting activity conducted by people from
outside the community) far outweigh the internal threats (hunting within the community), thus
minimizing the overall impact of community-based projects (Wicander and Coad 2015). These
issues of scale need to be taken into account when developing grant portfolios in the hotspot.
7.6.3 Sensitization and Media Outreach CSOs in the hotspot have been successful at a wide variety of awareness-raising activities. Such
activities are typically implemented at the grassroots and national levels, depending on the
issue(s) of concern. Awareness-raising activities at the national level include participation in
‘United Nation Days’ relating to the environment (e.g. World Environment / Forest / Wetland
Day, to mention but a few).
Issues relating to conservation and sustainable use of natural resources seldom receive equitable
media attention, not least because journalists have poor knowledge and understanding of the
issues and other immediate human concerns are prioritized. In some countries, press freedom is
curtailed to a greater or lesser extent.
7.6.4 Advocacy Some CSOs have had an active history of environmental advocacy and lobbying in the hotspot.
In Sierra Leone, the awareness created around ‘blood diamonds’, including the launching of the
Campaign for Just Mining project, under the auspices of the Network Movement for Justice and
Development (NMJD), helped to highlight CSOs’ work on the link between natural resource
utilization and violent conflicts. Despite the gains made over the years by CSOs in advocating
for the rights of marginalized groups, there is a general lack of capacity to engage key
stakeholders in the sector on issues such as disclosure of extractive revenues, monitoring of
compliance with social and environmental legislation, economic policy, and protection of
communities affected by natural resource utilization, among a suite of other concerns.
The experience to date of civil society advocacy in the hotspot also highlights the importance of
networking among local NGOs for mutual support in advocating for policy reforms related to
biodiversity conservation and for the application of environmental safeguards. Although
advocacy outcomes are often mixed, they point to an emerging role for civil society within the
hotspot in ensuring that good environmental policies are formulated and implemented. Such
efforts are most effective when coalitions are formed that address threats to and from specific
sectors, such as forest governance, as evident in examples from Ghana and Liberia on the signing
of Voluntary Partnership Agreements (VPA) with the EU. The VPA is a trade agreement

153
involving the EU and tropical timber exporting countries, with the proviso that any timber to be
exported to any EU country must come from certified legal sources.
7.6.5 Community Mobilization Communities affected by extractive activities, such as mining, generally lack the capacity to
monitor impacts on water, air, soil and forest resources in and around the areas where the mining
has taken place. They also often lack the ability to negotiate for appropriate compensation for
losses of land and resources, and for impacts to their general livelihoods. CSOs play a key role in
raising awareness about communities affected by mining. Nigeria and Cameroon both have
national laws that dispossess citizens of their land rights, so that the government effectively owns
both the mineral and land rights, while citizens are tenants (see Chapter 5 for a discussion of land
use rights in the hotspot countries). In such cases, compensation is only paid for the loss of crops
but not for the land on which citizens depend for their livelihoods. Apart from the fact that there
is usually no satisfactory process of free, prior and informed consent before mining activities
commence, when compensation is paid, it is typically neither adequate nor timely. These are
among the key issues at the heart of the crisis in the Niger Delta in Nigeria and around Koidu in
Sierra Leone.
7.6.6 Capacity Building The stakeholder consultations revealed that training and capacity enhancement of local
communities on their rights, roles, and responsibilities relating to conservation and sustainable
use of natural resources is of great priority and importance in the hotspot. Such capacity building
is not restricted to local communities but includes government agencies, elected representatives,
smaller CSOs and national NGOs. In Ghana, district assemblies have benefited from such
training, for example on participatory and gender-sensitive ways to support resource utilization.
A capacity building role is common among almost all the CSOs active in the hotspot, with the
exception of CBOs, which tend to be a recipient not a provider of capacity building.
Examples of CSO involvement in capacity enhancement include GWS’s current implementation
of the project “Enhancing the capacity and participation of local communities and District
Assemblies in Environmental Monitoring and Decision Making in the Western Region of
Ghana”. The objective of this project is to secure the integrity of selected habitats and related
livelihoods by increasing the participation of communities and district assemblies in
environmental monitoring and decision making, in order to reduce the environmental threats of
the emerging oil and gas industry in the Western Region of Ghana. Other organizations, such as
SDI in Liberia, are also implementing similar projects at various locations within the hotspot.
7.6.7 Education and Research The hotspot is endowed with a number of universities and research institutions that offer
scientific knowledge and conduct research on topics relevant to conservation and sustainability
within the hotspot. Universities and research centers identified and consulted during the profiling
process, included: the Kwame Nkrumah University of Science and Technology in Kumasi,
Ghana, the University of Sierra Leone in Freetown, Sierra Leone, the University of Liberia in
Monrovia, Liberia, the University of Yaoundé in Cameroon, the Universidad National de Guinea

154
Ecuatorial in Equatorial Guinea and the University of Ibadan and the University of Science and
Technology in Akure, Nigeria (Table 7.7). Among the 11 hotspot countries, Nigeria has the
greatest number of public and private universities offering courses on the environment and other
related disciplines. Table 7.7 Examples of Universities and Research Institutions with Research Areas and/or Curricula Relevant to Conservation and Sustainable Use of Biodiversity in the Hotspot Countries
Country Universities and Research Institutions
Benin Universite de Parakou; Universite des Sciences et Technologies du Benin
Cameroon
University of Yaoundé, Institut de Recherche Agricole pour le Développement (IRAD), University of Buea, University of Dschang, Pan African Institute for Development, University of Douala, Oxford University Fisheries Institute in Yabassi, Smithsonian Institute
Côte d’Ivoire Centre Suisse de recherches scientifiques (CSRS); Université de Cocody - Abidjan; Université d’Abobo-Adjame; Centre de Recherche en Ecologie, Abidjan
Equatorial Guinea
Universidad Nacional de Guinea Ecuatorial
Guinea SAV/Farannah ; CU N’zerekore ; Cerescor ; IRAG ; Université de Conakry, Centre de Recherche Scientifque de Conakry; Centre National des Science Halientiques de Boussoura
Ghana Kwame Nkrumah University of Science and Technology - Kumasi; University of Cape Coast, Cape Coast; Centre for African Wetlands; Forestry Research Institute of Ghana (FORIG)
Liberia CARI; FTI; All Community Colleges in Liberia; CUC, UMU, SMPU; University of Liberia, Monrovia
Nigeria
University of Ibadan, Ibadan; University of Benin, Benin; Federal University of Technology, Akure; University of Calabar, Calabar; Forestry Research Institute of Nigeria (FRIN); A.P. Leventis Ornithological Research Institute (APLORI), Federal College of Wildlife, New Busa
São Tomé and Príncipe
Universidade Pública de São Tomé and Príncipe
Sierra Leone University of Sierra Leone, Freetown; Njala University, Freetown; SLARI
Togo Université des Sciences et Technologies du Togo; Université du Lomé, Université de Kara
7.7 Involvement of the Private Sector in the Hotspot
In all 11 hotspot countries, the private sector is the primary taxpayer and the secondary provider
of jobs after the state. The major private sector companies operating in the hotspot, and which
have notable implications for conservation, include logging companies, mining companies and
large scale agribusinesses (see Table 7.8 for examples). The activities of this stakeholder group
are often viewed as posing a threat to conservation and sustainable management in the hotspot.
Overall, however, there is a lack of incentives for the private sector to develop, implement and
comply with their corporate responsibilities, especially for small to medium size companies.

155
Table 7.8 Examples of Conservation Initiatives with Private Sector Involvement in the Hotspot Countries
Country Description Private Sector Involvement
Benin There is no record of any private sector involvement in conservation efforts within the hotspot in Benin.
None
Cameroon
The WWF Forest and Trade Network members are involved in the conservation and sustainable management of the forest resources in some of the KBAs in Cameroon, especially following FSC Principles, Criteria and Indicators.
FSC-certified timber producing companies in Cameroon
GIZ/KFW engages private sector to promote conservation approaches through work with contractorsand procurement approach. They give money to do conservation projects
Corporate social responsibility
ERUDEF/APS: Man and nature Enterprise cooperatives
REACHOUT Cameroon – working with women on wealth creation in the Bakassi area in collaboration with oil companies – Haddax
Initiatives with oil industry
City council of Nkongsamba promoting conservation and sustainable development
Enterprise cooperatives
Côte d’Ivoire
The WWF Forest and Trade Network members are involved in the conservation and sustainable management of the forest resources, especially following FSC Principles, Criteria and Indicators.
Timber companies carrying out logging operations in Côte d’Ivoire
Equatorial Guinea
There is no reliable information on private sector involvement in conservation activities on Annobón and Bioko islands.
None
Guinea Company’s environmental standards and corporate responsibilities as regards mining of natural resources as a measure of compliance.
ALCOA (works with Guinea Ecology); Rio Tinto Simfer (also works with Guinea Ecology); Guinea Aluminium Company (GAL) working with Guinea Ecology and WCF.
Ghana
The WWF Forest and Trade Network members are involved in the conservation and sustainable management of the forest resources. Payment of Social Responsibility Agreements (SRAs) to communities. Mining companies corporate environmental standards and payment of SRAs
Samartex – a logging company in Ghana. Anglo Gold Ashanti on gold mining.
Liberia
Company’s environmental standards and corporate responsibilities as regards mining of natural resources as a measure of compliance. Ensuring local communities benefits economically from mining.
Arcelor Mittal works with CI and FFI; Hummingbird is engaging with stakeholders; GVL, Putu Mining Company, Equatorial Oil Palm, Same Darby, and Liberty Aureus Gold are also engaged to a certain extend in the conservation of biodiversity.
Nigeria
Availability of company’s environmental standards and corporate responsibilities as regards mining of natural resources. Remediation and Rehabilitation of Biodiversity and Habitats of Oil Spill Sites in the Niger Delta.
Shell Petroleum Development Company

156
Country Description Private Sector Involvement
São Tomé and Príncipe
The Praia Yame Hotel HBD-BOAVIDA is involved in agro-industrial and ecotourism activities that facilitate the sustainable management of protected areas on the island of Príncipe. Most of these conservation functions are now the responsibility of a foundation linked to the company: the Príncipe Trust.
HBD-BOAVIDA
Sierra Leone Company’s environmental standards and corporate responsibilities as regards mining of natural resources as a measure of compliance.
National Environmental Fund for Corporate Social Responsibility.
Togo There is no private sector presence in the small hotspot area of Togo.
None.
Source: Consultation workshops and remote consultations between December 2013 and September 2015.
There has often been little or weak interaction between the private sector and NGOs in the
hotspot. The lack of engagement with the private sector, often due to inadequate technical
capacity on the part of civil society, has been noted as a major issue that will need to be
addressed, particularly in light of the deposits of oil, gas and minerals found at certain locations
within the hotspot and the increasing demand for agricultural commodities. At the same time, a
low level of interest among private sector companies in developing partnerships with civil
society groups to enhance their environmental performance is evident in most of the hotspot
countries, with the exception of some logging companies in Cameroon, Ghana and Liberia, who
have signed up to recognized forest certification schemes, and some tourism operators in Ghana
and elsewhere, who have shown a genuine interest in ecotourism.
Actions of civil society to hold the private sector accountable for its actions are limited in the
hotspot. The few examples identified include the work of international organizations, such as
WWF in Cameroon, Ghana, Côte d’Ivoire, and Liberia working through its Global Forest and
Trade Network to persuade logging companies to adopt FSC certification. Other organizations,
including BirdLife International, CI, FFI and TRAFFIC International, are also working with the
private sector on wildlife trade in several hotspot countries. Activities by other CSOs, which
aimed to ensure accountability within the private sector have had limited impact to date. For
example, the work of A Rocha Ghana in reducing illegal gold mining at the Atewa Range Forest
Reserve (GHA3) in the Eastern Region of Ghana encountered problems due to an inadequate
technical and financial capacity to engage both legal mining companies and illegal ones.
Representatives from some of the private companies and CSOs involved in these projects have
been consulted in Liberia to draw on successful approaches and potential recommendations for a
better way forward. CI is working with the steel company Arcelor Mittal to ensure that local
communities share the economic benefits of mining activities around East Nimba Nature Reserve
in Liberia and are empowered to protect the natural resources they rely on. The approach is based
on engaging local communities and NGOs and developing an environmental consciousness.
Hummingbird Resources, a gold miner operating in Liberia, has engaged with local stakeholders
and developed its environmental consciousness, the company still needs to improve on meeting
its environmental commitments. In the agriculture sector, GVL, Putu Mining company, Sime
Darby and Equatorial Oil Palm have all engaged with communities and attempted to implement
an environmental approach but need to improve when it comes to land acquisition and their
corporate responsibilities.

157
7.8 Partnerships and Networks 7.8.1 National Partnerships and Networks
Cameroon, Ghana and Liberia are the hotspot countries with the largest numbers of civil society
networks and partnerships working on issues of conservation and sustainable management of
natural resources (Table 7.9). Ghana has created National, Regional and District Forest Forums
where issues of forest governance are discussed and consensus reached at the different levels.
Cameroon and Liberia have also created working groups on forest governance and climate
change. In Nigeria, the NGO Coalition for the Environment (NGOCE) is a coalition of all
conservation CSOs in the Cross River state, which has a number of aims and objectives in
common, including education, capacity building, research and facilitating national and
international cooperation.
Table 7.9 Examples of National Civil Society Partnerships and Networks in the Hotspot Countries
Country National Partnerships and Networks
Benin Amis de l’Afrique Francophone - Benin.
Cameroon
National REDD Working Group; National VPA Working Group; Cameroon Committee of IUCN; National Gender Working Group; FGLG; REFADD; South West Civil Society Organisation Network (SWECSON); Association pour l’Etude Taxonomique de la Flore d’Afrique Tropicale (AETFAT); Colletif de Femmes pour la Protection des l’Enfant et de l’Environnement.
Côte d’Ivoire National REDD Working Group; Tai-Sapo-Grebo Forest Complex Steering committee, Association des Femmes de Côte d’Ivoire; Alliance Ivoirienne pour l’Habitat; FLEGT.
Equatorial Guinea
REFADD.
Ghana
Forest Watch Ghana; National, Regional and District Forest Forums; National REDD Working Group; National REDD Gender SubWorking Group; National VPA Working Group; National Coalition on Mining; National Coalition of NGOs in Water and Sanitation; Ghana Climate Change Coalition; Western Regional Environmental NGOs Coalition; Landscape Management Board; FGLG.
Guinea Forum des ONGs pour le Dévelopement Durable.
Liberia National REDD Working Group; National VPA Working Group; Conservation Leadership Network; Tai-Sapo-Grebo Forest Complex Steering committee; Sapo Conservation Centre Steering Committee; Nimba Biodiversity Forum.
Nigeria National REDD Working Group; Nigerian Youth Climate Coalition; Ogoni Interactive Youths Network; NGO Coalition for the Environmnet (NGOCE).
São Tomé and Príncipe
Federação da ONGs em São Tomé e Príncipe (FONG); RedeBios.
Sierra Leone SLANGO and Environmental Protection Board.
Togo Association Togolaise d’Etude, de Recherche et d’Appui au Development Humain Durable (ASTERADHD); Magnificat Environment Association.
Source: Consultation workshops and remote consultations between December 2013 and September 2015.

158
7.8.2 Regional and Subregional Partnerships and Networks
Eleven regional or subregional partnerships and networks led by or involving CSOs were
identified during the consultation process. CSOs from the hotspot countries are involved or
associated with the objectives and activities of the following networks:
i. The African Forest Forum (AFF). AFF has its West African component based in Côte
d’Ivoire. This network’s major objective is to promote forest conservation.
ii. The African Forest Action Network (AFAN). AFAN an informal group of NGOs
established in 1994 to promote the sustainable use of African forests. This network
promotes the conservation of forests and the sustainable use of forest resources,
particularly for the wellbeing of the people. The activities carried by AFAN include
dissemination of information and exchange experiences among members with other
networks, and other organizations, and coordination of advocacy activities in the field of
sustainable management of forests.
iii. Climate Action Network (CAN) West Africa. CAN is a worldwide network of more
than 900 NGOs in over 100 countries working to promote government and individual
action to limit human-induced climate change to ecologically sustainable levels. CAN
members work to achieve this goal through information exchange and the coordinated
development of strategies on international, regional and national climate issues. CAN
West Africa was formed in 2008, covering West and Central Africa, and currently has 41
member organizations.
iv. Green Advocates for West Africa (GAWA). GAWA is a network consisting of
members from the 16 member states of ECOWAS, eight of which are hotspot countries
(Benin, Côte d’Ivoire, Ghana, Guinea, Liberia, Nigeria, Sierra Leone and Togo). These
countries represent a diverse range of ecosystems, people and political structures. GAWA
members represent the diversity of the region and are active in all aspects of
environmental activism. Participating groups include national networks, higher education
institutions, international NGOs, national NGOs and other CSOs. Their combined
knowledge-base allows the network to draw upon experts in all of the GAWA thematic
issues, and ensures that the unified environmental voice is representative of the entire
spectrum of society. The GAWA network is an effort to unite the environmental
movement across the region and better inform those outside of West Africa of the
challenges faced and successes realized.
v. Women’s Network for Community Management of Forests (REFACOF). REFACOF
is a network of women involved in the sustainable management of forest resources in
Africa. The network was formed at the 2009 International Conference on Forest Tenure,
Governance and Enterprise, held in Yaoundé, Cameroon. REFACOF’s goal is to
advocate with governments and international organizations for the inclusion of women-
specific needs, constraints and interests, as well as their ownership rights to land and
forest resources in reforms and the political agenda.
vi. Global Forest and Trade Networks. This is a global initiative of WWF, which, in West
and Central Africa, supports companies and individuals that are committed to responsible
forest management and trade in forest products to meet the requirements of sustainable
forest management and certification. The core business of the networks in the two
subregions is to provide technical support and guidance on forest and chain of custody

159
certification and sustainable forest management, facilitate timber trade links among
companies and individuals committed to responsible forest management and forest
product trade, and build local capacity on forest certification and auditing techniques. The
network also undertakes education and awareness-raising activities in forest fringe
communities on local peoples’ rights and responsibilities in forest management and, in
particular, on communities’ engagement in Social Responsibility Agreements with
logging companies.
vii. Réseau des Aires Protégées d’Afrique Centrale (RAPAC). RAPAC is a non-profit
organization whose members include both governments and NGOs working for the
preservation of protected areas in Central Africa. Its aim is to harmonize conservation
approaches, facilitate the exchange of experiences, and improve coordination and support
its members (technically and, to some extent, financially, playing the role of a hub for
international funding). Among the hotspot countries, Cameroon, Equatorial Guinea, and
São Tomé and Príncipe are the ones whose protected areas are involved in this network.
viii. Congo Basin Forest Partnership (CBFP). This partnership comprises governments of
the Congo Basin countries, representatives of the donor community, conservation NGOs,
forest research centers and private sector associations. Launched in Johannesburg in
2002, CBFP is the regional body in charge of forest and environmental policy,
coordination and harmonization, with the objective of promoting the conservation and
sustainable management of the Congo Basin’s forest ecosystems. Within the hotspot,
Cameroon, Equatorial Guinea and São Tomé and Príncipe are all involved in CBFP.
ix. Forest Governance Learning Group (FGLG). FGLG is an alliance of independent
CSOs working in 10 countries, including Cameroon and Ghana. The activities of the
groups include learning exchanges and the development of ideas on practical, just and
sustainable forest governance. This is an alliance of independent CSOs and research
institutions that promote sustainable forest management through strong and inclusive
governance structures and processes (e.g. democratic institutions, policy and legislative
reforms, etc.).
x. Network of African Women for Sustainable Development (REFADD). This
network’s main objective is to increase the participation of women in
natural resource management and biodiversity conservation through the promotion of the
participation of CSOs in the development and implementation of national programs on
natural resource management and biodiversity conservation. Within the hotspot, the
network has national branches in Cameroon and Equatorial Guinea.
xi. Network of Youths for the Sustainable Management of the Central African Moist
Forest Ecosystems (REJEFAC). This network’s main objective is to ensure full
participation of vulnerable people, especially youth and women, in decision-making
process. They are advocates for sustainable development and the effective consideration
of the roles of children, youth and women in public policy. REJEFAC is present in
Cameroon within the hotspot.
One major priority that was frequently reiterated during the consultation processes was the
importance of building partnerships and working with networks. It came out strongly that most
CSOs do not have the capacity to independently raise funds, whether from within or outside of
their own countries, and that working collectively can help them secure the resources they need
to sustain their programs.

160
7.9 Conclusion Civil society serves as a uniting force within the hotspot and should work towards making
positive, long-term impacts on the region’s development. Civil society can be the voice of the
marginalized population as a whole, and serves as a critical link between society and the state.
Civil society also plays an educating and supervisory role and facilitates community outreach
and capacity-building measures.
Civil society has struggled to define its relationship with the state in many hotspot countries,
with some governments fearing that civil society will usurp state responsibilities. Consequently,
governments have sought to maintain control over the activities of CSOs, to a greater or lesser
extent. Stakeholders consulted for this profile expressed frustration that governments often
exclude civil society from policy-making processes. Civil society representatives believe they
can play a role that complements state efforts to rebuild society and enhance sustainable
development, working in remote locations and using innovative methods that bring together
actors from different sectors.
There are significant variations among the national CSOs in the hotspot, both in terms of their
technical competence and their levels of financial resources available for their conservation
activities. The international CSOs involved in the hotspot are typically better equipped both
technically and financially, and they often perform better by working with national CSOs.
Financial sustainability (or a lack thereof) was a recurring theme throughout the consultation
process.
The existence of regional and national partnerships and networks in the hotspot countries was
viewed as positive, as it represents a key strategy to overcome the technical and financial
constraints facing CSOs. Maintaining partnerships and networks, and thus facilitating
experience-sharing, will help contribute towards building the capacity of organizations to
influence national policies and regulatory frameworks. There is a need to promote greater
cooperation and coordination between international CSOs, national CSOs, donors, and the
governments of the hotspot countries. This will lead to the development of additional networks,
and can facilitate the long term sustainability of CSOs in the hotspot.
Strengthening the capacity of the hotspot’s CSOs will be an important step towards increasing
their overall conservation impact. Some CSOs are unable to influence public policies due to the
lack of enabling regulatory frameworks. CSOs need to have the capacity to hold government and
the private sector accountable, and to ensure that local communities in their respective countries
are aware of their rights and responsibilities. Many CSOs have close links to local communities
and are well placed to contribute to the strengthening of community capacities, and to enable the
people to carry out collective actions for the betterment of the environment.
CSOs within the hotspot face several structural, logistical and political obstacles. Structurally,
civil society continues to lack unity and clarification of purpose. Many disparate CSOs represent
small groups focused on specific issues, rather than on the interests of society in general.

161
CSOs in the hotspot need to improve on their approaches and means of communication and
information sharing. They also need to improve levels of cooperation between each other, and to
establish mechanisms that will allow for self-monitoring and regulation. The capacities of CSOs
in the hotspot countries (and especially in Benin, Côte d’Ivoire, Cameroon, Equatorial Guinea,
Guinea, and Sáo Tomé and Príncipe) will need to be improved so as to effectively take up a
watchdog role. They will also need to build their social capital and increase the trust of the local
communities in their respective countries.
Finally, a gap in the understanding of how CSOs can effectively engage with the private sector is
apparent, and it will be important to support the CSOs in the hotspot with a view to increasing
their capacities in terms of interest-based negotiation skills, which will ultimately enable them to
engage positively with both governments and the private sector.
8. THREATS TO BIODIVERSITY IN THE HOTSPOT
This chapter presents an overview of the main threats to biodiversity and natural ecosystems in
the hotspot. The main information sources include the IUCN Red List, threat-related datasets
from Co$ting Nature, the IUCN/UNEP “Situation Analysis Desk Study on Terrestrial and
Freshwater Fauna in West and Central Africa”, published literature, and stakeholder inputs
received through the workshops and remote consultations. The chapter is divided into a
description of the main threats confronting the hotspot, as well as specific species, sites and
corridors found within, including the major principal actors involved (Section 8.1); a description
of the drivers and root causes of these threats (Section 8.2); a review of the major barriers that
are hindering conservation within the hotspot (Section 8.3); and suggestions of possible solutions
that can help overcome the these threats, drivers and barriers (Section 8.4).
8.1 Key Threats and Baselines
West African rainforests have been greatly modified by people: a conservative estimate is that
around 10 million hectares of forest were lost in the 20th
century (Fairhead and Leach 1998 cited
in Norris et al. 2010, Li et al. 2007). Agricultural expansion has been the most significant cause
of deforestation and 80 percent of original Guinean Forests can now be considered as an
agriculture-forest mosaic (Norris et al. 2010). Today, forests have been, and continue to be,
cleared or degraded to allow for expanding areas of agriculture, including for commercial crops,
as well as urban expansion and industry, roads and infrastructure. A number of these threats
emerged as priorities through the analysis, and are examined in greater detail below.
A general baseline of overall threats to biodiversity in the hotspot has been provided through
remote analysis using two approaches. Figure 8.1 below shows an assessment of the Relative
Pressure Index in the hotspot, produced using Co$ting Nature. This indicates current areas of
high to low pressure on ecosystems, based on population, wildfire frequency, grazing intensity,
agricultural intensity, dam density, and density of other infrastructure (i.e. mines, oil and gas
facilities and urban areas). As shown in Figure 8.1, the areas potentially experiencing the highest
levels of pressure are in the northern zones of the hotspot, such as along the northern boundary of
the hotspot in Côte d’Ivoire and Ghana. There are also extensive areas of the hotspot in Nigeria,
as well as areas in Togo and central Sierra Leone, where the pressure index is shown to be

162
medium-high. Notably, the forest regions that form the core of the hotspot are regarded as
experiencing low to moderate pressure according to this composite pressure measure. This is not
to say that wildlife populations within these forests are not under severe pressure but only that
the forests themselves are not being rapidly degraded, fragmented or converted.
In terms of a forest cover baseline, recent work on understanding tree cover loss and gain for
2000-2012 (Hansen et al. 2013), reveals both the status and trends for the hotspot. Figure 8.2
shows tree cover loss in the hotspot and surrounding areas over 2000-2012. Tree cover loss is
evident throughout most parts of the hotspot (with the exception of São Tomé and Príncipe) but
is especially prevalent in southern Côte d’Ivoire and Ghana, as well as several parts of Sierra
Leone, Nigeria and Cameroon. The lack of tree cover loss in São Tomé and Príncipe is most
likely due to the small size of the country relative the scale of the analysis, as significant losses
of forest cover and increases in forest degradation have been reported (IFAD 2014).
Figure 8.1 Map of Current Relative Pressure Index in the Guinean Forests Hotspot
Source: Co$ting Nature.
However, there have also been small areas of tree cover gain over this period. When examined
closely, the gains are found throughout the agricultural mosaic and into Guinean savanna
habitats, as well as near cities. In savanna areas along the northern margin of the hotspot,
especially in Guinea and Sierra Leone, CO2 fertilisation and collapses in populations of large
mammals, like elephants, encourages the growth of trees. In other areas, tree cover gains suggest
that land-use practices in these areas can also result in positive changes in tree cover (Hansen et
al. 2013). However it should be noted that much of this is believed to be the growth of useful
exotic and indigenous species that provide food and building materials but do not necessarily
have the same biological values, such as provision of habitat for wildlife, as the natural savanna
vegetation that it might have replaced.

163
Table 8.1 Loss, Gain and Net Loss of Tree Cover between 2000 and 2012 in the Hotspot Countries
Country Rank (out of 180 Countries)
Total Loss (km2) Total Gain (km
2) Net Loss (km
2)
Benin 60 3,307 69 3,238
Cameroon 48 4,816 651 4,165
Côte d’Ivoire 22 14,889 2,298 12,591
Equatorial Guinea 107 439 56 383
Ghana 43 5,406 1,345 4,061
Guinea 55 3,933 296 3,637
Liberia 54 3,955 1,084 2,871
Nigeria 31 10,239 603 9,636
São Tomé and Príncipe Unknown Unknown Unknown Unknown
Sierra Leone 72 1,967 451 1,516
Togo 95 768 24 744
Source: Hansen et al. (2013) supplementary data.
Taking consideration of losses and gains in tree cover, there is generally a net tree cover loss in
most parts of the hotspot (with the exception of São Tomé and Príncipe). Côte d’Ivoire lost the
highest amount of tree cover, 1.25 million hectares, during this period, with the net loss in other
countries ranked in Table 8.1. Although on São Tomé and Príncipe data on net loss of tree cover
are not available, anecdotal evidence suggests that a realistic estimate of loss would be around
five percent between 2000 and 2012 (R. Lima pers. comm.). Figure 8.2 Map of Forest Cover Loss in the Hotspot between 2000 and 2012
Source: Hansen et al. (2013).
The classification of threats in this study follows the IUCN standardized threat categories, which
are used for the Red List to maintain consistency among countries and to allow regional analysis.
Threats to species, sites and corridors in the hotspot have then been ranked in two ways. Figure

164
8.3 shows the ranking according to threats to Red Listed species (marine, freshwater and
terrestrial) in the hotspot, based on the IUCN threat classification. An alternative ranking, based
on expert opinion, was conducted through the stakeholder consultations, again using the IUCN
threat categories (Table 8.2). In both approaches, biological resource use, agriculture and
aquaculture, and pollution emerge as key threats. Table 8.3 also shows that workshop
participants considered energy production and mining, transportation and service corridors,
human intrusions and disturbance, climate change and severe weather, and residential and
commercial development to be among the main threats to biodiversity in the hotspot.
Recognising that the IUCN threat classification provides a global framework for analyzing
threats under Red List criteria, rather than a locally specific threat framework, participants were
also asked to list any additional threats affecting their part of the hotspot. Additional threats
identified by representatives from Nigeria and Togo are shown at the end of Table 8.2. Figure 8.3 Major Threats to Species Thought to be Present in the Hotspot, According to an Analysis of the IUCN Red List
Source: IUCN Red List version 2013.
Note: The chart is based on an analysis of 4,666 assessed species in all categories (i.e., Extinct to Data Deficient), in
the terrestrial, marine and freshwater realms.
The key threats are described in detail below, ordered according to the threat rankings assigned
by workshop participants (Table 8.2). In the descriptions that follow, the naming of the threats
has been sometimes altered from the original IUCN threat categorisation, in order to better
reflect the nature of the threat in the hotspot.
% of threatened species impacted by threat
PLANTS
INVERTEBRATES
VERTEBRATES

165
8.1.1 Unsustainable Biological Resource Use
In both the analysis of threats to IUCN Red Listed species (Figure 8.3) and the threat rankings by
workshop particpants (Table 8.2), biological resource use emerged as the most severe threat to
biodiversity in the hotspot. Further consultation and research shows that this threat category can
be broken down into: hunting for bushmeat and wildlife trade; logging; and overfishing. Table 8.2 Prioritized Threats in the Guinean Forests Hotspot
IUCN Threat Category
Threat Ranking by Workshop Participants from Country
Rank Totals
Hotspot Ranking
Ben
in
Cam
ero
on
Eq
uato
ria
l
Gu
inea
Gu
inea
Gh
an
a
Cô
te
d’Ivo
ire
Lib
eri
a
Nig
eri
a
São
To
mé &
Prí
nc
ipe
Sie
rra
Leo
ne
To
go
Biological resource use
1 1 1 1 1 1 2 1 1 - 1 11 1
Agriculture and aquaculture
2 1 2 1 1 1 1 1 1 - 1 12 2
Energy production and mining
2 2 3 1 1 1 1 1 2 - 3 17 3=
Human intrusions and disturbance
1 3 3 3 1 1 1 1 2 - 1 17 3=
Climate change and severe weather
2 3 2 2 1 2 1 2 2 - 2 19 5
Pollution 1 2 3 3 1 2 2 1 3 - 2 20 6=
Natural system modifications (e.g. dams, fires)
2 3 3 1 1 2 1 3 2 - 2 20 6=
Transportation and service corridors
3 3 1 2 2 2 1 2 3 - 2 21 8
Residential and commercial development
3 3 1 2 1 3 2 1 3 - 3 22 9=
Invasive and other problematic species and genes
2 3 3 2 1 3 3 2 1 - 2 22 9=
Geological events 3 3 3 3 3 3 3 3 3 - 2 29 11
Other threats (outside of IUCN categories)
Insecurity and conflict in the Delta
1 n/a
Enclaves 1 n/a
Livestock grazing /pastoralism
1 2 n/a
Erosion (montane and coastal)
2 n/a
Notes: This table summarizes the ranking of threats to biodiversity based on the IUCN categories during the national
consultation workshops, according to the ranking: 1 = severe; 2 = moderate; 3 = minor/not relevant. The rankings
given by participants have been interpreted and standardized by the authors to present them in this table, as each
group used slightly different ways to provide their feedback. Due to travel restrictions imposed following the Ebola
outbreak, participants from Sierra Leone were unable to participate in this exercise.

166
Bushmeat Hunting and Wildlife Trade Hunting traditions are strong in the hotspot countries, and for rural communities, bushmeat
consumption has historically represented a significant source of protein. The threat to
biodiversity posed by bushmeat consumption and trade has proved very difficult to address, and
there are mixed assessments in the literature of its impact on biodiversity. As noted in Section
5.4.2, offtake to supply local rural needs is probably not very harmful, whether consumption or
sale is involved. Studies from parts of Cameroon show that, in certain forest areas, the main
sources of bushmeat come from traps set in fields and fallows to protect crops as well as catch
animals (Endamana 2013a; Endamana 2013b). Other papers (e.g. Vega 2013) report similar
findings. However, professional hunters also supply urban markets, and there is an illicit trade in
bushmeat to West African nationals living abroad (Section 5.4.2 provides more information on
the scale of the trade).
The productivity of forest systems, in terms of their ability to support high densities of large
mammals is much lower than savanna systems in Africa. It is, therefore, fairly easy to over hunt
and effectively remove large-bodied mammals from the forest systems of the hotspot (Bennett
2002; Bennett et al. 2007). Bushmeat hunting is, thus, considered a major threat to some species
in West Africa (Wicander 2012), including the hotspot area. For example, Jentink’s duiker, an
Endangered species with a global range restricted to the Upper Guinean Forests subregion, is
declining due to hunting and deforestation. It is only in places such as Parc National de Taï et
Réserve de Faune du N’Zo (CIV11), Grebo (LBR7), Sapo National Park KBA (LBR14) and
Western Area Peninsula Non-hunting Forest Reserve (SLE8) that prospects for the species’s
long-term survival are hopeful. As another example, Preuss’s monkey, an Endangered species
globally restricted to western Cameroon, eastern Nigeria and Bioko island, has declined by more
than 50 percent over the past 20 to 30 years. This species is semi-terrestrial and relatively large-
bodied making it very attractive to hunters, particularly on Bioko, where it has declined most
significantly.
Globally, bushmeat hunting has been recognized as one of the largest threats to tropical forest
biodiversity (Wilkie et al. 2011, Harrisson 2011, Abernethy et al. 2013), even in remote forest
areas (Fa et al. 2002, Abernethy et al. 2013). Several studies have documented the decline of
various mammal species throughout the Afrotropical region (see review in Bowen-Jones and
Pendry 1999, Walsh et al. 2003), and with around 100 people per km2, the average population
densities are almost two times higher than the region’s ability to sustainably supply the demand
for bushmeat (Bennett 2002).
Most large mammal populations have already been depleted to very low levels in West Africa,
which has left forests with a fauna of smaller, more rapidly reproducing species (Bennett et al.
2007). Although there is a lack of comprehensive and recent assessments specific to the hotspot,
there are studies to support this claim. In Ghana, for example, a study revealed that bushmeat
trade may have reached ‘post-depletion sustainability’, meaning that large mammal populations
are so severely reduced that almost exclusively smaller mammals able to withstand current
hunting levels are being extracted (Cowlishaw et al. 2005). Large mammals such as pygmy
hippopotamus in Liberia and West African manatee in Ghana are believed to be threatened by
hunting (ACET 2014), and changes in the abundance of these species brought about by hunting
for consumption or trade can have broader impacts on ecosystem health (Abernethy et al. 2013).

167
For example, the removal of large seed dispersers, such as elephants and gorillas, has
consequences for forest diversity and regeneration (Effiom et al. 2013; Harrison et al. 2013), and
potentially its carbon storage capacity (Brodie and Gibbs 2009).
Hunting pressure due to demand for bushmeat is a threat to several Priority 1 and 2 terrestrial
KBAs. For example, overharvesting for the bushmeat trade threatens the Endangered Maclaud’s
horseshoe bat (Fahr 2008), which is known from Konkouré (GIN6), a Priority 1 KBA on the
coast of Guinea. Elsewhere, hunting may be the most serious threat to the Critically Endangered
dwarf olive ibis, known only from São Tomé, which is apparently a secondary catch for pig
hunters (BirdLife International 2013c).
Apart from the bushmeat trade, there is some evidence of the impact of wildlife trade on
biodiversity in West Africa broadly and the hotspot more specifically. In terms of legal
international trade in CITES-listed species, West African, South American and South East Asian
countries were the main exporting countries of wild birds over the period 1996-2010, although
legal trade from these countries has declined in recent years (UNEP-WCMC 2013). One study
also points to the common practice of hunting African pottos (Perodicticus spp.) and
angwantibos (Arctocebus spp.) for meat and medicine (and sometimes the pet trade), particularly
in Nigeria (Svensson and Friant 2014).
Although habitat loss remains the most significant threat to the hotspot’s great ape populations,
they are also trafficked. Information on countries of origin is limited but, from 2005 to 2011, 643
chimpanzees, 48 bonobos (a species that does not occur in the hotspot), 98 gorillas and 1,019
orangutans (also not in the hotspot) are recorded as lost from the wild through illicit activities,
based on seizures and arrival rates at sanctuaries in 12 African countries and Indonesia, as well
as expert reports (Nellemann et al. 2014). Based on extrapolations, Nelleman et al. (2014)
estimate that as more than 22,000 wild great apes were lost between 2005 and 2011 through
illegal trade, with chimpanzees comprising 64 percent of the toll. Although the recent resurgence
in ivory poaching is focused on Central and East Africa, it has also impacted elephant
populations in the hotspot countries. Monitoring the Illegal Killing of Elephants (MIKE) data for
West Africa shows that the overall losses are small but that poaching levels are increasing
(CITES-MIKE Programme, West Africa, 2013). In the most egregious case, 650 African
elephants were killed in Cameroon’s Bouba N’Djida Park in 2012 by heavily armed poachers
(Lawson and Vines 2014).
Logging Threats to biodiversity posed by logging in the hotspot vary significantly among countries and
according to the type of logging being undertaken. For example, almost 30 percent of the 269
amphibian species in the hotspot are threatened due to the habitat loss/degradation resulting from
expanding logging and agricultural expansion.
In the past, production forestry and commercial timber extraction were large industries in many
hotspot countries, leading to the clearing of large forest areas. They thus had direct impacts on
forests and wildlife in the hotspot. In recent years, the situation has changed, with a reduction in
the number of concessions and the contraction of logging industries. In most countries in the

168
hotspot, timber is no longer a major export commodity, with the main exception being Cameroon
(see Section 5.3.2).
In Cameroon over 1 million hectares of forest was felled between 2000 and 2005, due to a mix of
commercial logging (legal and illegal), domestic fuelwood demand and agricultural expansion.
As this figure is at the national level it is unknown what proportion was in the hotspot. Logging
of commercial timber species constitutes one of main threats within the Lower Niger Delta
(Corridor 8), as well as the Northern Gulf of Guinea Drainages, where extensive logging is
linked to subsequent land-use change (Burgess et al. 2004).
In Liberia, before the current democratic government, the area of logging concessions awarded
was around 2.5 times the entire area of forest in the country, with multiple overlapping
concessions. Their legality and status was reviewed and all concessions cancelled in 2006
(UNEP 2008). Similarly, all forest concessions in Equatorial Guinea were cancelled in 2008 (de
Wasseige et al. 2012).
Commercial logging can be well-managed and may itself cause only modest negative impacts on
biodiversity, or indeed these impacts may be positive: new growth in open spaces attracts
wildlife of all kinds (TerHeegde and Rietbergen 2008). However, the secondary effects of
commercial logging can be devastating for biodiversity. Logging roads offer easy pathways into
remote forest areas for poachers, farmers and settlers, until they grow over a year or two after.
Logging companies (see Appendix 9) who practice reduced-impact logging (e.g. who remove
bridges once use in a particular area is over, and who supply their workers with meat, rather than
leaving them to go hunting in the evening) are rare. Nevertheless, there has been an increase in
FSC certification of companies in the hotspot countries in recent years, which has helped to
improve practices (see Section 8.4.2).
Informal and illegal logging also continues to threaten biodiversity in the hotspot. Small-scale
companies tend to operate illegally and are responsible for much forest fragmentation, for
example in Cameroon and Ghana. Many small-scale companies are well-positioned in local
markets and use their ties with local administrations and national governments to avoid the costly
charges that would be required under stringent law enforcement. In Ghana, Hansen and Treue
(2008) estimated that 70 percent, or around 2.5 million m3, of timber was illegally cut each year
between 1996 and 2005, often using informal ‘chainsaw’ logging gangs. Illegal logging (large
and small-scale) is also still problematic in Cameroon, Côte d’Ivoire and Nigeria.
Information on specific KBAs that logging might be affecting is limited. However, Mount Lefo
(CMR13), Omo Forest Reserve (NGA11) and Afi River Forest Reserve (NGA1) are all known to
be under threat from logging, with the latter site being assessed as facing “very high” threat
(BirdLife International 2015). In Cross River State, a ban on logging concessions (instituted in
2009) and the establishment of an Anti-deforestation Taskforce had not fully prevented illegal
logging from continuing in the state’s forests; reportedly, the ban is being reconsidered and the
taskforce has been dissolved, leading to speculation that logging concessions will be granted in
the state’s forest reserves again in the near future (for example, see MyCrossRiver.com 2015).

169
On São Tomé island, most timber outside of protected areas is of poor quality, despite 90 percent
of the island being described as forested (de Lima et al. 2013). The potential conflict between
law enforcement for conservation and demand for timber is imminent, since most houses are
built with timber. On Príncipe, timber resources seem to be more abundant, although most
resources are also found withing protected areas. Also, on this island the regional government
has forbidden the sale of timber and charcoal to the main island of São Tomé, and local
developers have been using timber imported from mainland Africa, to reduce the pressure on
local forests.
Overfishing of Marine and Freshwater species
As coded on the IUCN Red List, fishing and harvesting aquatic resources are some of the main
threats to marine species, especially sharks and rays (Figure 8.3). The main threats to freshwater
fishes in the hotspot are overharvesting, as well as reduced water levels and pollution. Lake
Volta, for example, has been the most important inland fishery in Ghana but overfishing,
combined with reduced water levels and pollution, has led to the stagnation of the commercial
fishery.
As described in Section 5.3.2, artisanal and industrial fisheries in the hotspot are poorly
regulated, few catch data are recorded, and most fishing takes place relatively close to shore.
Both artisanal and industrial fisheries target two main groups of resources: small and large
pelagics; and demersal species. Small and large pelagics that are important fishery species
include sardinellas, bonga, carangids, anchovy, scombrids and tunas. Important dermersal fish
species, many of which occur in shallow, near-shore waters, include croakers, snappers and
seabreams. Demersal fisheries also target shrimp, octopus and cephalopods. Sharks are also
targeted in deeper water for their meat and fins. A study of shark fishing by West Africa Sub-
Regional Fisheries Commission members (which include Sierra Leone and Guinea in the
hotspot) showed that, after a rapid expansion in the 1990s, shark fisheries declined in the early
2000s, with a drop in landings (Diop and Dossa 2011).
Near-shore trawling and methods such as blast fishing and poison are very damaging to species
and habitats, as are use of beach and purse seines to target spawning areas and juveniles in
coastal habitats (Koranteng 2001). Industrial fishing in the hotspot is highly globalized, with
foreign and national fleets operating throughout the hotspot region in numbers estimated as too
high in relation to available biomass (IGCC 2006). Independent trawl surveys in the region have
shown significant decreases in overall fish biomass over the past 10-15 years, which has been
attributed to the increase in fishing activity of trawlers in inshore areas (IGCC 2006), as well as
globalization of the fishing industry, including the dominance of Europe’s distant water fleets
operating in the region (Atta-Mills et al. 2004).
8.1.2 Agriculture and Aquaculture
Agriculture and aquaculture were ranked through the workshops as the next most severe threat to
biodiversity, after biological resource use. The identification of threats in the IUCN Red List
analysis for the hotspot shows a similar pattern, with agriculture and aquaculture appearing as
the second most significant threats to plants and vertebrates (see Figure 8.3). As noted in Section
5.3.2, West African countries currently account for only a small portion of global aquaculture

170
production, though this has expanded substantially in recent years in Ghana and Nigeria. In
addition to its potential for positive impacts, negative impacts of poorly planned and managed
aquaculture can include conversion of coastal habitats, such as mangroves and tidal marshes, as
well as pollution and introduction of invasive alien species. Given the relatively small role of
aquaculture in the hotspot, the discussion of this threat category will focus on the threats posed
by agricultural development, including commercial plantations.
Today in the hotspot, rural communities practice small-scale subsistence agriculture (growing
crops like paddy and upland rice, cassava and maize with minimal fertilizer inputs and little to no
irrigation), with smallholder cultivation of cash crops, such as cacao, in some areas. Terrestrial
KBAs, for example within the Mount Cameroon and Bioko Montane Forests ecoregion, are
threatened by the demand for new agricultural land by the expanding human population. The
high diversity of aquatic and wetland plants of lower Niger River is also threatened by drought
and habitat loss, due to expanding agriculture where wetland habitats are drained and converted
to farmland; seven of the 200 species found here are assessed as globally threatened. There is a
paucity of published data on wetland losses in Africa (Moser et al. 1996), and the production of
wetland inventories and studies on the rate and extent of wetland loss are urgently required
(Spiers 2001). Information exists for some areas of the hotspot. For example, Coleman et al.
(2008) showed that, between 1987 and 2002, in an area of 1,110 km2 of the lower Niger Delta,
some 88 km2 of wetlands had been converted to open water or agricultural usage.
Cash crops have a long history in the hotspot, especially as cacao in Ghana and Côte d’Ivoire.
This crop was originally associated with unregulated and profitable logging, which fuelled forest
fragmentation, degradation and further deforestation in these countries (see Chapter 5 and
Appendix 6 for more information on cacao production in the hotspot). Such development
patterns favored large-scale forestry and the granting of large timber concessions (Karsenty
2007). Clearance of land for other monocultures, particularly industrial tree crops such as palm
oil, rubber and Gmelina arborea, is also threatening forests and biodiversity in the hotspot.
Nigeria, Ghana, Cameroon and Côte d’Ivoire are among the largest producers of palm oil in
Africa (see Table 5.7). Palm oil in the hotspot is produced through smallholder farming, as well
as increasingly through large-scale plantations.
Development and expansion of oil palm plantations represents an increasing threat to the entire
forest plant flora in those areas of the hotspot where forest is cleared (Mallon et al. 2015),
including São Tomé island (Lopes 2012) and northwestern Cameroon (Hoyle and Levang 2012).
The largest tract of remaining primary rainforest in Nigeria is centered on Cross River National
Park: Oban Division (NGA4), which is especially rich in endemic plants and animals. These
species are threatened by commercial plantations, among other threats (Borokini et al. 2014).
Appendix 6 and Section 5.3.2 include details of specific companies involved in palm oil
production in the hotspot.
8.1.3 Energy Production and Mining
This threat was ranked joint third by workshop participants as the third most severe to
biodiversity in the hotspot, and includes several subcategories of threat: oil and gas extraction;
fuelwood and charcoal production; and mining.

171
Oil and Gas Extraction Poorly managed oil extraction in the hotspot has led to pollution and habitat destruction, with
impacts on biodiversity, as well as socio-economic and political consequences. Oil is an
important resource in the Niger Delta, impacting species in two freshwater KBAs: South East
Niger Delta - near Calabar (fw10); and West Niger Delta (fw13). It has also been found in the
Gulf of Guinea (around São Tomé, Príncipe and Bioko islands) and is inflicting huge impacts on
coastal and marine ecosystems off the coast of Ghana.
A 2011 UNEP Environmental Assessment of Ogoniland in southern Nigeria found that, even
without an active oil industry, oil contamination is widespread and severely affecting many
components of the environment, washing into creeks, stressing and killing vegetation when it
reaches the root zone, and contaminating soils (UNEP 2011). Two of the five freshwater KBAs
in the Lower Guinean Forests subregion are situated within the Niger Delta and are heavily
impacted by oil spills. More than 630 freshwater fish species have been assessed in the hotspot,
of which around one-third are threatened. The highest densities of fish species in the hotspot are
found within the Niger Delta and the Atlantic river catchments of Sierra Leone and Liberia,
which are threatened by pollution and habitat loss resulting from oil exploitation. Most of the
threatened molluscs in the hotspot occur in restricted areas, and rely on clean waters, making
them susceptible to pollution. Pollution from activities connected with the oil industry also
constitutes one of the main threats to both resident and migrant birds in the region (IGCC 2006).
As also discussed in Chapter 5, the oil and gas industry in the hotspot is also associated with
socio-economic and political impacts that can translate into a challenging context for achieving
conservation outcomes. In theory, oil and gas resources bring great wealth to the countries
concerned but the history of oil extraction in Nigeria has shown that this does not usually
translate into better livelihoods for all and better care for natural resources. More frequently, it
precipitates a much greater gap between the rich and the poor, and encourages corruption and
lawlessness rather than better governance, which is often referred to as the ‘resource curse’ in
economic jargon. Civil unrest has been another legacy of the oil industry in Nigeria. In the case
of the Gulf of Guinea, the socio-economic impacts on islands with tiny economies prior to the
discovery have also been significant.
Fuelwood and Charcoal Production Although not ranked separately in the analysis of IUCN Red List species in the hotspot or by
workshop participants, fuelwood collection and charcoal production are among the greatest
drivers of forest degradation in Africa (Kissinger et al. 2012; Rautner et al. 2013). Sub-Saharan
Africa, with the exception of South Africa, has the largest proportion of its population relying on
traditional biomass (an estimated 93 percent of households depend on wood energy for daily
cooking needs), mainly fuelwood and charcoal, as well as the highest regional per capita wood
energy consumption, an average of 0.69 m3 in 2011, compared with a global average of 0.27 m
3
(IEA 2006, IEA 2010, Iiyama et al. 2014 cited in Cerutti et al. 2015). This consumption is also
predicted to increase. In 2009, the number of people in Sub-Saharan Africa dependent on
traditional biomass for cooking reached 653 million, and this is projected to reach 918 million in
2030 (UNDESA 2004, Arnold et al. 2006, cited in Cerutti et al. 2015). Charcoal consumption is
often growing faster than fuelwood consumption, particularly in urban areas.

172
Throughout the hotspot, there exist high levels of dependence on fuelwood, including 95 percent
and 85 percent of the populations in Benin and Sierra Leone respectively (UNEP 2008). Wood
for fuel and charcoal has been shown to represent 31 percent of all wood harvested in Equatorial
Guinea and 79 percent in Cameroon (de Wasseigeet al. 2012). According to Oyedepo (2012),
fuelwood is used by over 70 percent of rural Nigerians, and the country consumes over 50
million tonnes of fuel wood annually, a rate exceeding the potential for replenishment through
various afforestation programs. Harvesting of fuelwood for domestic and commercial uses is
associated with desertification in Nigeria’s arid zones and erosion in its south (Oyedepo 2012).
In Togo, fuelwood and charcoal account for more than 80 percent of national household energy
consumption (Fontodji 2007, in Kouami et al. 2009), resulting in heavy pressure on the country’s
vegetation, particularly impacting the country’s savannas and dry forests (Kouami et al. 2009).
The thriving market for charcoal and fuelwood extracted from coastal mangrove forests in some
of the hotspot countries is also of concern (see Section 5.3.2). Charcoal production is also
sometimes a by-product of logging within the hotspot, where offcuts and sawdust may be made
into charcoal and charcoal briquettes respectively.
Local community forest use, including for fuelwood and charcoal production, can be managed
sustainably in areas where population density is low and forests are not degraded. Yet, across the
hotspot, exploitation is increasingly being carried out for trade as well as for household
consumption, and the cumulative impact of numerous small-scale producers can be very
significant. Studies show that fuelwood is often sourced from areas being cleared for agriculture
or close to urban markets and that demand for fuelwood is seldom the primary cause of forest
conversion on a large scale (Arnold et al. 2003). Trees outside forests also appear to supply a
large share of overall fuelwood demand in many countries in Africa, highlighting the importance
of non-forest resources. Within the hotspot countries, land tenure (see Section 8.2.1) is still a
major impediment to the creation of new on-farm forest resources for fuelwood and charcoal.
Mining
Many parts of the hotspot are rich in gold and other valuable minerals, and their exploitation
(especially surface mining) can cause direct loss of forest and other habitats, particularly because
geodiversity of minerals tends to occur in the same areas as biodiversity. In addition, impacts on
communities can be substantial, as these areas also often coincide with good agricultural land
(rich, fertile soils and forests). Liberia and Sierra Leone are particularly rich in diamonds, while
Ghana is noted for its gold reserves (e.g. in Wassa Amenfi West district, including Mamiri Forest
Reserve KBA (GHA17)). In addition to large-scale industrial gold mining in Ghana, small-scale
illegal mining is common (see Section 5.3.2 for more detail on the mining sector, including
specific mining companies). Exact locations are unknown but, geologically, much of the region
has the potential to contain minerals and metals and is, therefore, potentially at risk from mining.
Yawri Bay KBA (SLE9) in southwest Sierra Leone has recently been described as being highly
threatened by mining, along with from agricultural expansion and road construction (BirdLife
International 2015). Nimba Mountains KBA (LBR12) has been identified as a transboundary
AZE site for more than 20 years, and the mining of iron ore has been an issue of much
controversy and contention between conservation groups and mining supporters (Mallon et al.
2015). The Mount Nimba Strict Nature Reserve at the centre of this AZE site is also a Biosphere

173
Reserve and World Heritage Site (in Danger) but has nevertheless been reduced by
1,500 hectares to facilitate iron ore extraction (Edwards et al. 2014).
8.1.4 Human Intrusions and Disturbance
This IUCN threat category includes the subcategories of: recreational activities (e.g. tourism in
protected areas), war, civil unrest and military activities (e.g. military zones and exercises); and
work and other activities. Although not a prominent threat according to the Red List analysis, it
was ranked joint third by workshop participants. Two related threats identified by workshop
participants from Nigeria include conflict and insecurity in the Delta and enclaves of refugees.
These threats are closely linked to the drivers of particular threats to biodiversity in the hotspot,
discussed in Section 8.2, including population movements and poor governance. More details on
conflicts in the hotspot and their impacts are provided in Section 5.2.2.
8.1.5 Climate Change
Climate change and severe weather was ranked as the fifth most severe threat to conservation
outcomes during the workshop process, equal with residential and commercial development.
Although climate change across the hotspot is not expected to have impacts as extreme as in
other parts of Africa, low-lying coastal areas are particularly vulnerable to sea level rise, with
consequent threats to habitats and species. Along with projected temperature increases, greater
unpredictability of rainfall and extreme events (droughts and floods), and varying predictions for
impacts on and responses by species, habitats and ecosystems, human responses (adaptation and
mitigation) to climate change may also result in additional pressures being placed on biodiversity
and ecosystems. The detailed threats and impacts from related to climate change are reviewed in
Chapter 9.
8.1.6 Agricultural Run-off, Poisoning and Industrial Pollution
Agricultural run-off, poisoning and industrial pollution are considered major threats to
biodiversity in the hotspot. Pollution was ranked through the workshop process as the sixth most
significant threat in the hotspot (Table 8.2). In contrast, it appears as the third most significant
threat (to vertebrates and invertebrates in particular) in the IUCN Red List analysis (Figure 8.3).
The Endangered Rüppell’s vulture (Gyps rueppellii), hooded vulture (Necrosyrtes monachus)
and Egyptian vulture (Neophron percnopterus), marginally present in the hotspot, have suffered
from secondary poisoning from carburofan and other toxins inserted into animal carcasses to kill
mammalian predators and changes in methods of carcass disposal (Mallon et al. 2015), which,
together with other factors, have contributed to severe population declines. Water pollution is
also a problem for many species, especially due to agricultural run-off and oil exploitation.
Rubber plantations cause problems such as surface water pollution by chemical wastes and
exposure of workers and local communities to toxic chemicals in Liberia and elsewhere (UNEP
2008; FAOSTAT 2015).
Although the oil industry has been singled out as a major polluter in the hotspot (see Section
8.1.3), improper domestic and industrial waste disposal is also a significant threat. Although
there is a lack of recent studies, investigations in the past decade found that as wastewater
treatment systems are often either absent or inadequate, pollution from residential and industrial

174
sources is often directly discharged into freshwater and near-shore marine waters in the Gulf of
Guinea, resulting in habitat degradation, loss of biological diversity and productivity, and
degenerating human health (Ukwe et al. 2003). An estimated 3.8 million metric tonnes per year
of solid waste was produced in the Gulf of Guinea coastal zone in 2002 (Scheren and Ibe 2002).
Much of this ends up in the ocean, and solid waste on Gulf of Guinea beaches predominantly
constitutes plastics (Scheren and Ibe 2002). Solid waste or debris sometimes constituted 69
percent of coastal trawl catches in Nigeria (Solarin et al. 2010). Cetaceans, sea turtles and marine
fishes are at risk of physical entanglement with certain kinds of debris, including plastics and
discarded fishing nets.
Sedimentation, linked to erosion and run-off from deforested and agricultural lands, also
threatens biodiversity in the hotspot. Deforestation for agricultural expansion leads to increased
levels of runoff and greater sediment loads in rivers and lake systems, with subsequent impacts
on freshwater species and habitats. For example, the Critically Endangered river fish, Barbus
carcharhinoides, restricted to the Upper reaches of St Paul River KBA (fw11) in Liberia, is
suffering from an ongoing decline in habitat quality due to siltation and pollution from
deforestation and mining. In the floodplain wetlands, where cattle raising and small-scale dry
season agriculture are traditional practices, overgrazing is leading to soil erosion and, as a result
of reduced vegetation cover, increased flooding (World Bank 2005). As another example, the
main threats to Lake Barombi Mbo and surrounding catchments KBA (fw1) in Cameroon are the
expansion of oil plantations and slash and burn agriculture in the surround catchments, leading to
sedimentation and pollution of the lake.
8.1.7 Dams and Other Natural System Modifications
The majority of African countries rely upon dams to supply their electricity (hydropower) and to
provide irrigation and water supplies. There are approximately 150 major dams (over 15 meters)
in West Africa, with a number more proposed (UEMOA 2010) and most major rivers in West
Africa have at least one or two large dams (around 50 percent for hydropower generation)
creating ecological problems for many freshwater species. Although this density is relatively low
compared to other parts of Africa, there is an ongoing decline in river flows (ECOWAS-
SWAC/OECD 2008) and likely an increase in the construction of dams. The two largest dams in
the hotspot are the Akosombo dam on the Volta River in Ghana, built in 1964, which stands
134 meters high (the fourth highest in Africa) and forms Lake Volta, the largest manmade lake in
the world, with a surface area of nearly 8,500 km2 (Nilsson 2009), and the Kossou dam on the
Bandama River in Côte d’Ivoire (the sixth largest in Africa).
The majority of these dams were designed in a top-down manner, without taking into account the
wider impacts of such developments, which should be considered at the basin scale. Given the
transboundary nature of some of the rivers proposed to be dammed, the risks of international
disagreement and tension are real, such that the development of river basin organisations and
joint observation systems to address and monitor both the environmental and political impacts of
such developments are essential (ECOWAS-SWAC/OECD 2008). Critical riverine habitats, such
as rapids and pools, are converted into lacustrine habitats often unsuitable for former residents of
the river that has been dammed. Fish migrations are physically impacted and the river discharge
and siltation patterns, which are used by many species as a cue for important behaviours, are
altered (e.g. in the Western Equatorial Crator lakes, where dams hinder fish migration upstream

175
for breeding). Curtailment of flood regimes may prevent or reduce the seasonal inundation of
floodplains, thus interrupting lateral fish migrations and the availability of feeding, breeding, and
nursery grounds. In the case of mollusks, most threatened species occur in restricted areas where
they rely on clean rapidly flowing waters, making them susceptible to pollution and the impact of
dams. Agriculture is also affected, as the suppression of flooding and the associated deposition of
sediment reduces floodplain fertility for pastoral grazing and agriculture. The Akosombo dam
has not only impacted downstream fisheries along the Volta River but also, due to the decreased
levels of sediment load, led to erosion of the coastlines of Togo and Benin at a rate of 10 to
15 meters per year (World Commission on Dams 2000).
The ECOWAS Permanent Forum for the Coordination and Monitoring of the Integrated
Management of Water Resources in West Africa could play a pivotal role in the promotion of
better governance of water resources in the region, along with other regional organisations.
However, with growing demands for electricity from hydropower, the number of dams is likely
to increase throughout the region. Hydropower projects under development include the Mambilla
Plateau dam in Nigeria, which is being supported by a USD 1 billion loan from China; as one of
the largest dam projects in Africa (around 3000 MW installed capacity), it would double the
country’s electricity supply (International Rivers 2015; This Day Live 2013).
8.1.8 Economic Corridors and Infrastructure The IUCN threat category of ‘transportation and service corridors’ was ranked fourth as a threat
to biodiversity in the hotspot by the workshop participants, yet was ranked low in the IUCN Red
List analysis. This may be due to its status as an emerging threat, as transportation and other
infrastructure is improved in the region. Further investigation of the impacts on conservation
outcomes is needed, as road development may have positive effects on rural poverty
(e.g. through better market access) as well as negative impacts on species and habitats (e.g. by
fragmenting and opening up forest areas to encroachment). Within 10-15 km of roads and
settlements, large and medium bodied mammals experience sharp declines in population
(Laurance et al. 2006).
ECOWAS plays an important role in the coordination and development of infrastructure
programmes in West Africa. It leads NEPAD’s programs in West Africa, including the
Comprehensive African Agriculture Development Program (CAADP) and the Program for
Infrastructure Development in Africa (PIDA) (AfDB 2011). The PIDA priority action plan
contains 51 programmes and projects designed to address priority infrastructure deficits in
energy, transport, information and communication technology, and transboundary water up to
2040 (PIDA 2015). Other key players in financing and coordinating infrastructure development
include the African Development Bank (AfDB), the World Bank, the EU, China and India (see
Section 5.3.1 for discussion of investment trends in infrastructure and other sectors). A recent
survey of investors in the region indicates that the region is considered an attractive investment
destination, with strong economic growth rates, abundant natural resources and a growing
population, but a ‘chronic infrastructure deficit’; among those surveyed, more than half expect to
increase their spending on infrastructure in the future (PwC 2014).
Transportation infrastructure is likely to account for a substantial portion of these investments. In
2011, the AfDB considered West Africa to have the lowest quality of transport services in the

176
world, as measured by the Logistics Performance Index. This is due to poor quality roads, as
well as an outdated network based on the colonial era trade links (i.e. north-south, as opposed to
east-west; AfDB 2011). Priorities for improving transport infrastructure include developing the
17 railway links identified in the ECOWAS Railway Master Plan, two of which (B2: Kaya–
Dori–Niamey; and B1, Bamako–Bougouni–Ouangolodougou) are undergoing detailed design
with support from the EU and other donors (AfDB, 2011). Priority road corridors include
completing missing links in the TransCoastal (4,900 km) and Trans-Sahelian (5,400 km)
highways (AfDB 2011).
8.1.9 Residential and Commercial Development
As shown in Table 8.2, residential and commercial development was ranked as the fifth most
significant threat to conservation outcomes during the workshops. There was considerable
variation among the country groups with regard to their views on this threat, with participants
from Equatorial Guinea, Ghana and Nigeria ranking it as severe, while those from São Tomé and
Príncipe, Togo, Cameroon and Côte d’Ivoire considering it minor. The subcomponents of this
threat category examined here include urbanization (which can also be classified as a driver) and
coastal development.
As discussed in Section 5.2.2, almost all countries in the hotspot have experienced increases in
the percentage of their populations classified as urban between 2000 and 2012, and these trends
are projected to continue in the future. West African urbanization trends tell a complicated story,
however. The region has one of the fastest urban growth rates, yet with only 31 percent of its
inhabitants living in agglomerations of more than 10,000 inhabitants, it remains one of the least
urbanized regions (AFD 2009). Urbanization is occurring through the growth of small urban
centers, as well as the expansion of existing large cities. Countries projected to experience
particularly large shifts to urban populations by 2020 include Liberia (from 36.5 percent in 2000
to 53.5 percent in 2020) and Ghana (from 39.1 percent in 2000 to 48.4 percent in 2020). AFD
(2009) also projects the formation by 2020 of an urban band of high density in the coastal area of
the Gulf of Guinea. Residential and commercial development, driven predominantly by
population growth and rural-to-urban migration, is placing increasing pressure on environmental
resources within the hotspot. One KBA threatened by residential and urban development is Lofa-
Mano Complex (LBR11) in Liberia.
Countries within the hotspot, particularly Ghana, Cameroon and Liberia, experience large
southward movement of populations of young men due to greater economic opportunities there.
Accounting for net immigration to coastal countries in western Africa, the total urban population
of the coastal zone was expected to double between 2000 and 2020 and to double again between
2020 and 2050 (UEMOA 2010). The impacts in terms of land use are through horizontal spread
of built-up areas, spread of development along coastal roads, and increased environmental
pressures of food production in coastal landscapes such as through rice farming, salt production,
and increased fishing effort (UEMOA 2010). Urbanization is one of the contributing factors to
loss of large areas of mangrove forests within the hotspot, primarily off the coasts of Nigeria and
Cameroon.

177
Although the coastline is subject to natural erosion and sedimentation processes due to high
wave energy and strong littoral transport in the region, these phenomena are intensified by
human activities associated with residential and commercial development, such as sand/gravel
mining along the coast, damming of rivers, port and jetty construction, dredging, and mangrove
removal. Harbor and jetty construction are responsible for erosion rates of 15-25 meters per year
in Nigeria, Benin, Togo, Ghana and Côte d’Ivoire, due to alteration of long-shore sediment
transport and dredging (IGCC 2010, IGCC 2006). This can impact biodiversity by damaging
important habitat, such as mangroves, estuaries, sand dunes and seagrass beds, and may reduce
opportunities for more sustainable development options. If the development of coastal tourism in
the hotspot is to move forwards successfully, it is recommended that lessons be learned from the
experiences of coastal development in North and Northwest Africa, where coastal erosion is
reported to have devastating effects, with many communities no longer able to live close to the
sea (UNESCO 2012).
Large industrial developments, such as the Punta Europa gas and hydrocarbon facility on Bioko
in Equatorial Guinea can also lead to direct impacts on ecosystems and people through coastal
erosion, pollution, domestic and industrial sewage and effluent, solid wastes (much of it plastics)
and loss and degradation of key resources such as mangroves. Coastal development also affects
all four of the marine turtle species present within the hotspot, which suffer from loss of nesting
beaches, especially the Critically Endangered hawksbill turtle, which nests on Bioko Island and
São Tomé and Príncipe. Timber lost at sea by logging companies washes up onshore and
obstructs nesting beaches in Equatorial Guinea and Cameroon. Coastal erosion due to sand
mining, harbour building and irregular current flows has compromised the suitability of long
stretches of coastal areas as nesting sites, particularly between Ghana and Nigeria. There are also
social and economic impacts of commercial coastal developments, as public access to beaches is
also becoming increasingly restricted and is especially unpopular with fisher folk.
8.1.10 Invasive and Other Problematic Species, Genes and Diseases
Invasive species, genes and diseases were ranked through the consultation workshops as the joint
ninth most significant threat in the hotspot, only followed by geological events, which was
universally considered to be either minor or not relevant. Although ranked lowly, this threat has
impacts on several key habitats and species, mainly through the subcategories of invasive, non-
native species and diseases, and problematic native species and diseases.
Diseases, such as Ebola and Simian Immunodeficiency Virus (SIV) and respiratory illnesses
transmitted from humans, have been confirmed as important threats wild gorillas and
chimpanzees, with outbreaks of the Zaire strain of Ebola in Gabon and Congo estimated to have
killed approximately one third of the world’s gorillas and a slightly smaller proportion of its
chimpanzees in the past 20 years (Ryan and Walsh 2011). For example, western gorilla, found
within the hotspot in Cameroon and Nigeria, is Critically Endangered due to a combination of
exceptionally high levels of hunting and disease-induced mortality from Ebola: over 90 percent
in some large remote areas, according to the IUCN Red List, though mainly outside of the
hotspot (e.g. in Gabon and Congo). The Cross River subspecies of western gorilla, occurring
only in a small area on the Nigeria-Cameroon border, is mainly threatened by its small

178
population size and habitat loss; Ebola has not been reported in this population but may become
a threat in the future.
Chimpanzee, with subpopulations across much of the hotspot, including in KBAs such as Gola
Forest Reserve (SLE1) and Sapo National Park (LBR14), is Endangered due to high levels of
hunting and loss of habitat, as well as Ebola. Although the wildlife reservoir for Ebola is not yet
confirmed, the recent outbreak in West Africa has been linked to a zoonotic transmission from
Angolan free-tailed bat (Mops condylurus) in Guinea; larger wildlife (including chimpanzees) in
this location were apparently not affected by Ebola (Saéz et al. 2015). The Conservation Action
Plan for the Nigeria-Cameroon chimpanzee subspecies notes that, although outbreaks of Ebola
have not been found in Nigeria-Cameroon chimpanzee populations, they do harbour anthrax and
multiple strains of malaria, hence field research and coordination with the Global Viral
Forecasting Initiative should be encouraged (Morgan et al. 2011).
With regard to invasive species, infestation of water hyacinth, native to South America and
originally introduced on account of its wide appeal for introduction to water gardens across
Africa, is a critical problem for the health of many systems in the hotspot, including Lake Volta
in Ghana. Water hyacinth management was, until recently, costing Nigeria USD 639 per hectare
per year in mechanical control, and USD 161 per hectare per year in chemical control (Boy and
Witt, 2013). Experience from other areas, specifically Lake Victoria, suggests that, if rapid
action is not taken to address the problem, there will be serious economic, health, and
environmental consequences. Weed infestation impedes transportation, damages equipment used
for fishing (boats, nets, tackles, etc.), irrigation and water supply (pumps and other water
extraction machinery), and potentially impacts operation of hydroelectric plants with huge
associated costs. Weeds also multiply rates of evapo-transpiration by several times, and provide
habitats for disease vectors. Extensive lake surface cover by plants such as water hyacinth can
also reduce light penetration and oxygen levels, as the detritus of plant leaves accumulates; this
can have a significant impact on associated fish, plant and invertebrate communities.
WorldFish Center is working with partners to introduce the Genetically Improved Farmed
Tilapia (GIFT), a genetically improved strain of Nile tilapia (Oreochromis niloticus), to help
small and medium-sized farmers overcome poverty and hunger in Ghana and other countries in
the Volta Basin, such as potentially within the Lower Volta eastern catchment KBA (fw5),
through improved aquaculture production. These fast-growing fish are already benefiting many
rural communities. However, the GIFT tilapia also poses a potential threat to other freshwater
species if it escapes from the experimental farms. The impacts of such escapes are still hotly
debated and need to be determined through additional research before irreversible mistakes are
made.
Being an island nation, introduced species on São Tomé and Príncipe are likely having negative
ecological impacts, although this has been systematically overlooked in recent studies (R. Lima
pers. comm.). Although the islands’ only native mammals are shrews and bats, they now support
populations of introduced monkeys, pigs, civet, rats and weasels. There are also exotic fish, birds
and invertebrates, such as the highly invasive African giant land snail. During colonial times,
numerous plant species were introduced, many of which are nowadays behaving invasively.
Some examples include bamboo, oil palm, coconut, quinine, cinnamom, avocado, African

179
breadfruit and African nutmeg. The impact of these exotic species in the native ecosystems is not
known, mainly due to a lack of research on the topic, though it is a reasonable assumption that so
many exotic species on such small islands are likely to be having negative impacts of some kind
on the native species.
The globally devastating amphibian chytrid fungus Batrachochytrium dendrobatidis, which has a
patchy distribution across Africa, has been recorded in Lower Guinean Forests subregion of the
hotspot (Olsen et al. 2013) but appears not to have reached the Upper Guinean Forests
subregion, possibly due to the Dahomey Gap, which is an arid region that may represent a barrier
to its spread (Penner et al. 2013). The Upper Guinean Forests subregion may now be the last
tropical region, apart from Madagascar, where chytrid does not exist.
8.2 Drivers and Root Causes
The following section explores the underlying causes, or drivers, of the main threats to
biodiversity in the hotspot. The main generic root causes acting to generate the identified threats
described in Section 8.1 are analysed in Table 8.3, and a number of these are then examined in
greater detail. It is important to note that, for most threats, there is no single identifiable root
cause at the scale of the hotspot. A more detailed examination of legal, political and socio-
economic drivers and actors is needed in relation to a specific location or issue, in order to
understand the complexities of the local situation and to derive acceptable and workable
conservation solutions.
With respect to land use change resulting in deforestation, for example, it is impossible to
discern any single root cause at the scale of the hotspot, given that each country is different
politically, economically, and culturally (Geist and Lambin 2002). Ghana’s Approved REDD
Readiness Preparation Proposal states that “By and large, the problem is one of gradual
‘degradation’ rather than ‘deforestation’, and is incremental rather than dramatic, with no single
dominant driver” (Bamfo 2010). The immediate drivers (and associated barriers) include forest
industry over-capacity, policy/market failures in the timber sector, population growth, increasing
local demand for agricultural and wood products, high demand for wood and forest products on
the international market, heavy dependence on charcoal and fuelwood for rural and urban
energy, limited technology development in farming systems, and continued reliance on cyclical
‘slash and burn’ methods to maintain soil fertility. Drivers would therefore need to be described
on a case by case basis (and the same applies to root causes and drivers underlying other threats).
Table 8.3 Root Causes Underlying Threats to Biodiversity in the Guinean Forests Hotspot
Root Cause Description
Poverty and wealth inequality
Most countries in the hotspot are poor and poverty levels are highest in rural areas where communities are most dependent on direct exploitation of natural resources for their survival and livelihoods. Although there is rapid economic growth and a developing middle class in several hotspot countries, the poverty gap is widening across Sub-Saharan Africa (the rich become richer and the poor, poorer). Poverty and inequality, coupled with lack of alternative options, drive communities to use unsustainable practices of resource exploitation, which threaten sites, species and ecosystem integrity.

180
Root Cause Description
Population pressure (population growth, densities, movements and demographic change)
National populations across the hotspot are growing, with an increasing proportion living in urban centres in all countries. Patterns of population growth and movement vary greatly between and within countries. In rural areas, increasing populations and inward migration can result in greatly increased demand for land, water and resources. This can, in turn, drive unsustainable resource exploitation practices, conflict over land and resources and direct threats to species, sites and corridors (including protected areas). The most fertile and productive areas of land and water (which may also be key areas for biodiversity and ecosystem services conservation) are often those under greatest pressure for unsustainable development.
Outdated/inequitable systems of land and resource tenure
The outdated and inequitable tenure arrangements that are found in many countries in the hotspot are helping to drive non-biodiversity friendly land use practices and blocking the transition to better forest and agricultural land-use. Land tenure and access systems that favor elites and exclude local communities from involvement in management or access to resources can inhibit efforts to achieve long-term, sustainable conservation and development solutions. Community involvement in co-management of protected areas or conservation management and sustainable use in buffer zones can be very effective but is often not supported by policy, legislation and governance at national and local levels.
Socio-economic trends, development models and fiscal pressures
Changes in society and development patterns can bring new pressures on species and habitats, e.g. increasing wealth, health, and education can result in greater attention to conservation but can also lead to greater demands for resources. New technologies and means of communication change how people manage and exploit natural resources and conduct business and trade. Conflict can displace large numbers of people, exploiting resources for survival and losing attachment to the land and land management systems. Global, regional and national development and economic policies and influences may have unforeseen negative impacts. Trade patterns, land ownership and management are undergoing major changes in the hotspot countries as a result of new international economic and development influences. Perverse incentives can drive unsustainable practices (e.g. the promotion of biofuels at the expense of other land uses). Global recession, changes in international trade and competition, changes in commodity prices, can also drive unpredicted amd often negative impacts.
8.2.1 Outdated/Inequitable Land Tenure Arrangements
The outdated and inequitable tenure arrangements for land and natural resources that are found in
many countries in the hotspot are contributing to non-biodiversity friendly land use practices and
blocking the transition to better forest and agricultural land-use. As outlined in Chapter 5
(section 5.1), land tenure in the hotspot countries is often a mix of customary and statutory land
rights, resulting in discrepancies and conflict as the two systems are implemented. In addition, it
is a feature of all the Francophone West African countries in the hotspot and of some of the
Anglophone ones (notably Ghana) that tree tenure and land tenure are separated. The result is
that agricultural land may belong to one person and the indigenous trees on it to another. This
situation dates from an earlier era when crops belonged to the grower but the trees belonged to
the state or to the land-owner who rented the land to the grower. This situation has caused major
problems in the cacao belt in Ghana. Cacao is a crop that grows well under forest shade and a
cacao landscape could also be a forest landscape. However, cacao farmers have grown so tired of

181
contractors felling trees, destroying cacao trees and offering poor compensation, that they often
destroy volunteer forest tree seedlings as they appear, to avoid trouble in the future.
The tenure split between land and trees has at least three important negative implications for
biodiversity. First, it destroys what would otherwise be a land-use protective of biodiversity.
Second, it forces farmers who need timber to seek it, sometimes illegally, from forest reserves
and protected areas instead of using what they have on their own land. Third, compared with
parts of Africa where trees on farms are clearly the property of the owner, farmers are
discouraged from planting trees for their own timber, fuelwood and nutritional use, and from
selling trees: an obvious way forward to increase forest cover is blocked (Shepherd and Kofi
Nyame 2009). As a result, timber mills are still geared only for large forest trees, and the
processing of smaller diameter trees from farms, e.g. agroforestry, hardly exists.
8.2.2 Socio-economic Trends, Development Models and Fiscal Pressures
Global, regional and national development and economic and fiscal policies and influences may
have unforeseen negative impacts on biodiversity and ecosystems and inhibit sustainable
development, largely through their role in driving land-use change. Changes in society and
development patterns can bring new pressures on species and habitats. For example, increasing
wealth, health and education levels can result in greater investment in conservation, but they can
also lead to greater demands for resource exploitation (e.g. land development for new housing;
roads, access and infrastructure for recreation and tourism). As the population of hotspot
countries is projected to increase by 1.5 times by 2030 (see Chapter 5), these increased pressures
are likely. Recent surveys of investors in the region indicate that there is an expected 25 percent
increase in spending on infrastructure (PwC 2014), with potential impacts on habitat
fragmentation. New technologies and means of communication also change the ways in which
people manage and exploit land, water and natural resources and conduct business and trade.
Wars and conflict can result in large numbers of people being displaced and reliant on natural
resources for survival, as well as losing previous attachments to landscapes and land
management systems that may previously have functioned sustainably.
Trade patterns, land ownership and natural resource management are undergoing major changes
in the hotspot countries as a result of new international economic and development influences,
notably from China and other investors in the hotspot and increasing “south-south” trade
relationships. Agreements between hotspot countries and China such as ‘infrastructure for oil’
have the potential to create ‘lose-lose’ situations for biodiversity, due to potential incursion of
infrastructure into biodiverse areas and indirect effects from increased oil consumption and
climate change. Perverse incentives or other financial arrangements can drive unsustainable
practices (e.g. tax breaks and incentives for the promotion of biofuels at the expense of other
land uses that are more ecologically and socially sustainable and equitable, such as the
maintenance of biodiverse and carbon-rich forests or the production of food crops). Global
recessions, changes in international trade and competition, and volatile commodity prices can
also drive unpredicted negative impacts on species and sites.
A variety of imminent and already extant initiatives in the region have implications for forests.
This includes growing pressure for the direct conversion of forest land to other uses, as well as

182
the effects of land alienation on small-scale farmers, which will likely lead to increased pressure
on remaining forests. For example, increased profitability and access to investment is changing
the patterns of palm oil production (a traditional smallholder crop, e.g. see GRAIN 2014) in the
hotspot, and encouraging the development of large-scale industrial plantations. Recent
moratoriums on deforestation and land shortages in Southeast Asia have also been linked to the
increased targeting of the African tropical forest zone by multinational companies for palm oil
(e.g. Feintrenie 2012 in Linder 2013). Many of the hotspot countries have recently committed (at
a meeting in Côte d’Ivoire in 2013) to oil palm expansion for development. In Ghana, significant
growth in cacao production is also expected as the government is committed to supplying free
inputs and improving infrastructure for farmers in this sector (PwC 2014).
The large land leases that have displaced small-scale farmers in Northeast and East Africa may
not yet be an important feature of the hotspot countries but other change is on its way. In
February 2014, the G8 (through its New Alliance for Food Security and Nutrition) declared its
interest in “boosting agriculture and relieving poverty” by inviting big business to create large
commercial farms in many parts of Africa, including West Africa (The Guardian 2014). Many of
the proposed crops, the article notes, are actually cash crops for export, such as cotton and palm
oil but they will not be grown through smallholders as is the case with cacao. It is likely that
many of the displaced smallholders will be forced into remaining forest areas in search of land.
8.2.3 Poverty and Wealth Inequality
The gap between rich and poor across the hotspot countries is widening (see Section 5.2.3 and
Table 8.4). Highly unequal income distribution generates, among its side effects, low trust of
those in authority, deep poverty that becomes harder to alleviate as the income gap between rich
and poor widens, and consequent indifference among the wealthy to the situation of the poor.
However, even if rural people should feel marginalised, local level rules and norms may still be
in place in many areas for relatively equitable and sustainable sharing of natural resources. It is
the inability of poor rural people to hold outsiders to account that causes many problems at site
and ecosystem level.
Countries with the highest perceptions of corruption are Equatorial Guinea, Guinea, Nigeria and
Cameroon (Table 8.4). Corruption and tolerance of extreme inequality and injustice make it
difficult to achieve effective and equitable conservation solutions. For example, the conversion
of natural ecosystems to agriculture and residential areas, as well as the development of large
infrastructure projects, is more likely to be driven by large commercial interests and facilitated
by corruption, than the result of the actions of the rural poor.

183
Table 8.4 Gini Index and Corruption Perception Index Rankings for the Hotspot Countries
Country Gini Coefficient Ranking
1 (and Year)
Transparency International
Corruption Perception Index (ranking out of 177 countries
scored2)
Benin no data. 94
Cameroon 38.9 (2007) 144
Côte d’Ivoire 41.5 (2008) 136
Equatorial Guinea no data 163
Ghana 42.8 (2006) 63
Guinea 39.4 (2006) 150
Liberia 39.4 (2007) 83
Nigeria 48.8 (2010) 144
São Tomé and Príncipe no data no data
Sierra Leone 35.4 (2011) 119
Togo 39.3 (2011) 123
Source: Transparency International.
1 = The Gini Coefficient measures the extent to which the distribution of income or consumption expenditure among
individuals/ households within an economy deviates from equal distribution: the size of the gap between the richest
and the poorest. An index of 0 would mean perfect equality and 100 perfect inequality: so the higher the number, the
wider the gap between rich and poor. Data come from different years, but where the World Bank has data for more
than one year for one of these countries, the trend is always upwards towards greater inequality. Data are from the
most recent year available. Highly unequal distribution generates, among its side effects, low trust of those in
authority, deep poverty that becomes harder and harder to alleviate the wider the income gap between rich and poor
grows, and indifference among the wealthy to the situation of the poor.
2 = Transparency International Corruption Perception Index measures levels of corruption as perceived by a range of
stakeholders in the countries ranked. There is almost by definition no way of measuring actual corruption. However,
this index is a proxy indicator for the quality of governance in a country. The higher the number, the poorer the
governance.
8.2.4 Population Pressure and Southerly Migration
Both urban and rural populations in parts of the hotspot are still increasing, placing pressure on
land and natural resources, especially where in-migration is adding to these trends. However, the
urban-rural split for countries in the hotspot is lower than the African average (see Chapter 5 for
a more detailed discussion of demographic and socio-economic factors in the hotspot). Although
urbanisation rates are increasing, much of Africa still has 70 percent of its population in rural
areas because there has been too little investment in urban employment opportunities. The
activities of this rural population are associated with a number of the main drivers of threats to
biodiversity in the hotspot, such as the expansion of agriculture and bushmeat consumption.
Although many rural areas still suffer from rapidly increasing populations and associated
pressures on natural resources, overall African population growth rates have begun to decrease.
This may constitute the very early signs of a transition that will eventually benefit conservation
and more sustainable development in rural areas.
At the regional scale, a significant proportion of the population is also moving southwards, with
impacts on the habitats and species of the hotspot. Drought and climate change (discussed in
Chapter 9) and political instability in countries outside of the hotspot, such as Mali, have forced

184
many former pastoralists to settle further south in countries such as Burkina Faso and Niger
where agriculture is possible. In turn, the descendants of the farmers who settled in these areas,
understanding that there will likely be no land and very limited future livelihood options, have
migrated in huge numbers southward into those countries along the West and Central African
coast, particularly Ghana, Cameroon and Liberia. Some find urban employment and no doubt
others settle in rural areas, initially as employees of wealthier farmers. The implications of this
migration for biodiversity conservation is yet to be considered in any meaningful way but it is
likely to mean that urban and rural populations in parts of the hotspot continue to increase
rapidly, while natural population growth rates decline, with concomitant increases in pressure on
land and natural resources.
Movements of refugees and resulting increased population densities in new areas also lead to
increased pressures on natural resources and environmental degradation. In 2002, several
hundred thousand of refugees from conflicts in Sierra Leone and Liberia were displaced to
Guinea (with local population densities already as high as 400 per km2). Many of these were in
the colloquially named ‘Parrot’s Beak’ region of Guinea: the small area of land jutting southward
into Sierra Leone between the Meli and Mokona Rivers (within the hotspot boundary), where
there is clear evidence of environmental degradation and loss of forest cover on satellite images
taken before and after the influx of refugees. Many people settled semi-permanently in the area,
which was transformed from a mosaic of forest, villages and agricultural plots to bare ground
with almost no forest remaining (UNEP 2008). Paradoxically, forest regenerates rapidly in areas
vacated by refugees if then left unfarmed and unoccupied. This phenomenon has occurred in
northern Uganda where armed conflict inadvertently enabled much forest regrowth (Shepherd et
al. 2013). Such regeneration may also have occurred in conflict-affected areas of the hotspot,
although further study is required.
Displacement of people across borders and internally is likely to continue to feature as a driver of
environmental change in the hotspot. In Nigeria alone, the National Commission for Refugees
reported 3.3 million internally displaced persons in the country as of December 2013 (IDMC
2014). The Internal Displacement Monitoring Center (IDMC) lists the causes of displacement in
Nigeria as: inter-communal conflict between Christians and Muslims in the Middle Belt of the
country; other religious, sectarian and electoral violence; Boko Haram attacks, and government
responses, in northeastern Nigeria; forced evictions, e.g. from city slums; recurrent floods in
lowlands and coastal zones; and desertification in the north. UNHCR (2015) also notes that there
are more than 14,000 refugees, mainly Ivorians and Togolese, in Ghana.
8.3 Barriers to Action
Barriers to conservation action refer to policy, socio-economic, financial and other factors that
form obstacles to or diminish the impact of conservation efforts, current and potential. The key
barriers identified in the hotspot are outlined in Table 8.5. As mentioned above, these barriers are
closely linked to the drivers of threats to biodiversity. For example, land tenure arrangements
drive practices that are harmful to biodiversity, and these inequitable arrangements also create a
barrier to certain reforms. The following sections discuss three key barriers in greater detail:
legislative and policy weaknesses; poor governance; and lack of awareness and education.

185
Table 8.5 Barriers to the Attainment of Conservation Outcomes in the Guinean Forests Hotspot
Barrier Description
Weak policies and legislation (and/ or enforcement of regulations) for the protection of biodiversity and ecosystems, and wider policy context (land use, production sectors, development etc.)
Legal barriers to achievement of conservation outcomes include weak legislation and/or regulation at the national level (for the protection of biodiversity and ecosystems, including protected areas). Where legislation is sufficient, it may not be enforced adequately (e.g. trade in endangered species; fisheries regulations for sustainable use). Specific barriers can be identified at the national level and in relation to specific conservation issues (species, sites, corridors) as the basis for legislative reform or strengthened regulation and management. At national and regional levels, policy development is often very slow and policies are poorly integrated or conflicting, unable to provide supportive framework for conservation. Development and other sectoral policies often take no account of the needs of biodiversity and do not provide a supportive policy context for sustainable management of key biodiversity and ecosystems. Sectoral policies do not include the real values of biodiversity and ecosystems in underpinning development and livelihoods nor the need for ecosystem approaches to management. They frequently exclude or inhibit local community involvement in land use planning and management.
Weak governance (environmental and other): grassroots to regional levels
Weak governance, both of environmental/natural resources and in other sectors (such as broader land use planning and development), can lead to direct negative impacts on species and ecosystems (e.g. destruction or loss of habitat for other land uses, over-exploitation or over-development, and pollution). Weak governance (in policy development, legislation, regulation, and implementation) occurs at local, national and regional levels. One example is that local communities and civil society may be excluded from decision-making at various levels and the overall impact is frequently the destruction or reduction in biodiversity and ecosystem services (the natural resource base on which most rural communities and their livelihoods depend).
Lack of education and awareness, and understanding and recognition of the real values of biodiversity and ecosystems
Attitudes to and awareness of natural resource management values and issues are key factors in the success or failure of efforts to achieve conservation and sustainable management. If biodiversity and ecosystem services are not understood and/ or are under-valued, individuals and institutions are more likely to make decisions based on short-term gains and exploitation, rather than a longer-term conservation and sustainable development perspective. Education levels are also a very significant factor in poverty and development. Education (especially of girls) generally slows population growth rates, gives communities greater influence on policy and decision-making and access to more livelihood and income-generating options. The crucial importance of sustainable management of biodiversity and ecosystems for livelihoods opportunities and development, especially among the rural poor, is often ignored or overlooked.
Lack of access to alternatives (e.g. more sustainable land and resource use practices, new forms of income-generation, new technologies)
At the grassroot levels, in particular, communities are often constrained or driven to carry out unsustainable practices of land use or natural resource exploitation by a lack of alternative options. This can be the result of a variety of factors or other barriers (specific to the community or location) – inability of communities to access ideas, technologies or funding support to initiate alternatives; policy, legislative or resource access barriers etc. energy.
Lack of knowledge and ideas/ lack of access to networks for ideas exchange
Rural communities in particular may lack access to new ideas and technologies which can support more sustainable practices and to opportunities to learn from experience elsewhere (nationally and regionally). Community consultations and project evaluations consistently report that networking, exchange visits (seeing what others are doing successfully), exchange of ideas and expertise are some of the most effective ways of learning and achieving positive change.

186
Barrier Description
Lack of capacity for effective conservation and sustainable management
A lack of capacity at all levels of government and civil society often inhibits effective conservation action. It can be a barrier at individual, community and institutional levels. Components include lack of political will; lack of skills, expertise and adequately trained individuals; lack of organizational capacity or management systems; lack of staff and materials/ equipment etc.; poor governance and lack of accountability. Many individual protected areas and national protected area systems in the hotspot lack the required capacity to manage and conserve biodiversity and ecosystems inside protected areas effectively. Outside protected areas, the capacity for integrating civil society and government approaches and achieving effective conservation management of key biodiversity and ecosystems is very low in most countries.
8.3.1 Legislative and Policy Weaknesses
Probably the largest single barrier to the achievement of good conservation outcomes in the
hotspot is the development and implementation conservation policy and legislation. At national
and regional levels, policy development is often very slow (e.g. Liberia’s Forest Code of 1965
has been under review since 2002), and policies are poorly integrated or conflicting, unable to
provide supportive framework for conservation.
As shown in Section 6.2, all hotspot countries have ratified the major multilateral environmental
agreements, and most have a legal framework for protected areas and forestry. Indeed, in many
African countries, forest policy has been updated in the years since the United Nations Earth
Summit in 1992. Some environmental laws in the hotspot date back to the colonial era, yet
reforms have been ongoing, with the forest sector in the lead. For example, Benin introduced a
new forest policy in 2011, while Nigeria is currently considering a new forest policy. Forest
policies in Africa now accord a far larger role and set of responsibilities to local people than
colonial forest policies did. Much experience has been gained on how to work effectively with
communities and other non-government actors as forest managers as a result, though there is a
way to go. Aspects of conservation policy in the hotspot, however, lag far behind in this process.
No hotspot country has legislation on species conservation, and only two have laws related to
community based conservation (Cameroon and Ghana), though this does represent a degree of
progress. Forest policy reform may offer a model for conservation policy reform; this experience
has shown that as forest policy updates have been driven by new and better field experience on
the ground. In the medium term, conservation policy barriers may be best addressed in a similar
way: from the bottom up, building a greater role for community-based natural resource
management.
Gaps and weaknesses in policies and legislation in other sectors can also have crucial
implications for conservation outcomes. For example, as noted in Section 6.3.5, only four
hotspot countries have land-use planning legislation. Development and other sectoral policies
often take no account of the needs of biodiversity and do not provide a supportive policy context
for sustainable management of key biodiversity and ecosystems. For instance, policies and
targets for socio-economic development can frame conservation as a cost that cannot be met until
development levels are higher. In addition, although all countries in the hotspot have
requirements for environmental impact assessments (EIAs), it is unknown whether these
requirements are consistently applied, whether assessments meet quality standards or whether

187
their recommendations are implemented. Poor EIA standards, combined with poor definitions of
‘degraded’ or ‘secondary’ forest, can encourage the allocation of forest areas for conversion to
agriculture, as was allegedly the case for an oil palm concession in southwestern Cameroon
(Linder 2013).
Further, sectoral policies (e.g. land use, production sectors such as fisheries and agriculture,
protected areas) do not include an understanding or assessment of the real values of biodiversity
and ecosystem services in underpinning development and livelihoods, nor the need for
ecosystem approaches to management. They also frequently exclude or inhibit local community
involvement in land use planning and management. WRI’s Environmental Democracy Index (a
measure of national-level laws to protect environmental democracy) includes a measure of
participation. Of the hotspot countries included in the 2015 provisional rankings, all score below
average on participation: Benin ranks 55 out of 70 countries, while Ghana ranks 51 and Nigeria
38.
8.3.2 Weak Governance
Weak governance underlies many of the root causes of threats to species and ecosystems across
the hotspot and creates a barrier to efforts to address the drivers of these threats. For example,
rural poverty is often a product of weak governance through such factors as: lack of provision for
effective education and thereby a potential exit from poverty; lack of access to markets and other
essential services, such as healthcare; and absence of savings and loans schemes for the poor.
Such services and enabling conditions can play an important role in supporting poverty
alleviation. For example, a recent study by FAO and IFAD on rebuilding West Africa’s food
production potential notes that “inclusive value chains” are essential in improving the livelihoods
of the rural poor, that markets should be more inclusive of small-scale producers, including
women, and that constraints faced by women in accessing resources (land, credit, technology,
training, extension) should be broken down (Elbehri 2013).
Weak governance also plays a part in driving badly managed or short-sighted development
programs and schemes that often lead to environmental impacts that degrade the very ecosystems
that underpin both rural and urban livelihoods. For example, schemes to promote industrial and
intensive agriculture, as a path to economic development, carry substantial negative social,
environmental and economic risks. Where land is removed from traditional uses and put to
alternative uses, such as for the production of biofuels or other cash crops, if the needs of local
farmers and workers are not accommodated, then the pressure is increased on the diminishing
agricultural land-bank and risks are posed to rural livelihoods and food security. Such pressures
may, in turn, increase the demand for land and resources currently maintained in protected areas,
forest reserves, and unprotected natural areas. For example, there are suggestions that the
USD 800 million of investments in large-scale rice farming being encouraged under Côte
d’Ivoire’s Cooperation Framework with the G8 New Alliance for Food Security and Nutrition,
though aimed at improving rural conditions, will lead to the displacement of tens of thousands of
small-holder farmers (GRAIN 2013).
Corruption in the hotspot has already been discussed in the section above on drivers, in relation
to poverty and inequality but it is important to emphasis its role in entrenching weak governance

188
and acting as a barrier to improved conservation outcomes. Transparency International’s
Corruption Perception Index (see Table 8.4), which is frequently used as a proxy indicator for
the quality of governance in a country at national level, shows that Equatorial Guinea and Guinea
have the highest perceived levels of corruption, and Ghana and Liberia the least among the
hotspot countries. Corruption and a lack of transparency have in the past facilitated access to
forests for logging; the potential for corruption to facilitate the approval of large land
concessions and infrastructure projects without proper planning, assessment and risk mitigation
is likely to emerge as another problem for conservation initiatives in the hotspot.
As described in Section 6.1.2, civil wars and conflict in parts of the hotspot, both past and
present, have also been linked to poor governance, either as cause (such as conflict over the
sharing of oil wealth and responsibility for environmental degradation in the Niger Delta) or a
result (when an ongoing conflict or its aftermath reduces the rule of law). Côte d’Ivoire’s two
civil wars from 2002 to 2007, and from 2010 to 2011, have resulted in a highly unstable political
situation and the country’s significant forest loss between 2000 and 2010, including within forest
reserves, may be linked to the impacts of conflict and the loss of government control. Conflicts
in the hotspot have also resulted in mass movements of people within and among countries
(e.g. from Sierra Leone to Guinea during the Sierra Leone civil war, 1991-2002), some of whom
remain encamped in enclaves. This leads to increased pressure on local natural resources, with
no social structures or regulation of land and resource exploitation to support sustainable use and
conservation.
Effective conservation requires more than just appropriate policies and laws at the national level.
It also requires effective implementation of laws, and good governance at the local level. Local
level governance can often be improved, even where national level governance is weak, through
the opportunities for experimentation, demonstration and locally specific reforms provided by
projects implemented on the ground. Landscape or ecosystem approaches applied at the local
level can also improve the governance of conservation and other initiatives. Such approaches
involve gaining an appreciation of the way in which forests, protected areas, farming areas and
water sources fit together to support local livelihoods, developing or strengthening management
structures that support a variety of land uses, and encouraging different sectors and actors to
work with one another, with potentially positive outcomes for governance.
8.3.3 Lack of Education, Awareness and Understanding for Effective Conservation
Attitudes to and awareness of natural resource management are key factors in the success or
failure of efforts to achieve conservation and sustainable management. This is true at many
levels, from national and regional policy-makers, to local communities, to international and
national project developers in industries such as mining and agriculture. If biodiversity and
ecosystem services are not understood and/or are under-valued, individuals and institutions are
more likely to make decisions based on short-term gains and exploitation, rather than from a
longer-term conservation and sustainable development perspective. Damaging and unsustainable
developments often take precedence over conservation and sustainable management.

189
Education levels are a very significant factor in poverty alleviation, as well as conservation.
Education (especially of girls) generally slows population growth rates, gives communities
greater influence on policy and decision-making, and increases access to livelihood and income-
generating options (Tuwor and Sossou 2008). On average, globally, just one year of school
increases earnings by 10 percent (UNESCO 2014). West African literacy rates, though
improving, remain among some of the lowest in the world (IRIN 2009). As Section 5.2.4 shows,
adult literacy rates, as an indicator of education levels, vary considerably across the hotspot,
from 94 percent in Equatorial Guinea (the highest), to 41 percent in Guinea (the lowest). Other
countries with literacy rates in the 40-50 percent range include Benin and Sierra Leone.
Enrolment rates in secondary and tertiary education in hotspot countries are also relatively low:
the average secondary enrolment rate is about 34 percent, while the average tertiary enrolment
rate is about 9 percent. In addition, only Ghana and São Tomé and Príncipe spend above the
targeted 7 percent of GDP on education (World Bank 2015b).
Beyond the general levels of educational attainment, the content of education, such as the
inclusion of environmental issues or presence of environmental curricula at tertiary level, is also
relevant. The crucial importance of sustainable management of biodiversity and ecosystems for
livelihoods opportunities and development, especially among the rural poor, is often ignored or
overlooked. The lack of high-level knowledge and skills among civil society actors in
conservation and biodiversity is another gap. As noted in Section 7.4, most national CSOs
consulted felt that they have sufficient institutional capacities but lack technical knowledge in
specific areas, and identified training needs on technical conservation and sustainable
management, as well as governance issues.
8.4 Solutions: Approaches to Address Threats, Drivers and Barriers The following section explores approaches to address the key threats identified in the hotspot,
and where possible some of the drivers and barriers associated with those threats. It outlines
some of the main conservation approaches applied in the hotspot in recent years, and based on
the assessment of threats, root causes and barriers in the preceding sections, as well as priorities
identified by stakeholders during consultations, suggests additional approaches. The discussed
solutions are arranged according to the key threats they address, although these have been
modified slightly to reduce repetition, because some solutions address multiple threats. In
addition, approaches to climate change mitigation and adaptation are covered in Chapter 9.
8.4.1 Addressing Hunting for Bushmeat and Wildlife Trade, and Overfishing
In the case of unsustainable bushmeat exploitation, there is considerable debate in the academic
literature and among conservation practitioners regarding how to address it. Globally, solutions
proposed range from a total ban on all bushmeat hunting and sale (on the grounds that it is too
difficult in practice to allow the sale of common species and forbid the sale of Red Listed ones),
to the legalization and regulation of parts of the bushmeat trade. Within the hotspot, initiatives
tackling overexploitation of wildlife for bushmeat include community-based approaches (e.g. the
Bushmeat Hunting and Trade in the Nimba Mountains Project in Guinea, implemented by FFI
with funding from CEPF), provision of alternative livelihoods (e.g. in the Conservation and
Sustainable Use of the Ngoyla-Mintom Forest Project in Cameroon, led by WWF with funding

190
from the GEF via the World Bank), and demand-side measures (e.g. the Awareness Campaign
on the Bushmeat Crisis project in Ghana, implemented by CI with funding from CEPF) (see
Appendix 9 for further examples).
Nasi et al. (2008) note that blanket bans on wild meat consumption are bound to fail, and, if
enforced, would deprive poor families of much-needed nutrition and cash earnings. As a high
value-to-weight product, easily preserved through smoking, wild meat is one of very few
tradable commodities in remote areas. Rather, Nasi et al. (2008) recommend the application of
lessons learned from the local management of inshore fishing in many parts of the world and
from Indigenous People’s reserves (e.g. in Latin America). In these cases, strengthening the
rights of local people to manage their natural resources has resulted in much better protection for
wildlife and rigorous exclusion of those without rights to the area. There is enough anecdotal
evidence from within the hotspot to suggest that similar approaches might work there too –
certainly in remoter and still well-forested areas.
The provision of alternative protein and income-generating sources has become one of the most
widely used strategies at the community level to reduce bushmeat consumption and trade while
aiming to improve (or at least have no negative impact on) local livelihoods (van Vilet 2011).
However, while many such alternative livelihood projects have been implemented across West
and Central Africa at various scales, there has been little analysis of their successes and failures,
and little synthesis of lessons learned. A recent study of these projects conducted with project
managers in West and Central Africa revealed that, while projects have had some success, they
are based on many assumptions (e.g. about hunting drivers, market access, theory of change,
etc.) that potentially undermine success (Wicander 2012; Wicander and Coad 2015).
Restructuring is needed for future alternative livelihood projects to contribute more significantly
to reducing the pressure of bushmeat hunting.
Given the complex and multi-dimensional nature of the bushmeat ‘crisis’, it is also crucial to
integrate the various individual approaches into a comprehensive strategy. This includes the
promotion of approaches that work with local communities to address the threats and barriers
that operate at the local level, such as the exclusion of local people from natural resources
governance and unclear tenure arrangements. A general conclusion that can be drawn is that
approaches that take into account local conditions (e.g. understanding the actual socio-economic
drivers of increased bushmeat consumption) and address the needs and rights of even the poorest
and most remote hunters, traders and communities depending on this resource, are more likely to
achieve sustained conservation outcomes. Other elements of a comprehensive strategy could
include the institution of protected area management plans and regulations that allow
comanagement and sustainable use of natural resources by local communities, (e.g. the co-
management of Pendjari Biosphere Reserve in Benin), as well as measures related to consumer
demand reduction.
There is a lack of initiatives in the hotspot or the West Africa region more widely that
specifically tackle overexploitation of fisheries, whether marine or freshwater. For inland
fisheries, the development and enforcement of fishery management plans is recommended. The
potential for development of brush park or ‘acadja’ systems, which have been shown to enhance
fisheries (Welcomme 2002), might also be investigated. Regional partnerships to govern marine
habitats and wildlife in include the Canary Current Large Marine Ecosystem and the Guinea

191
Current Large Marine Ecosystem initiatives. There are also projects related to marine protected
areas, including WWF’s West African Marine Ecoregion program and a marine protected areas
comanagement project in Sierra Leone and Liberia.
8.4.2 Addressing Forest Degradation: Logging, Fuelwood Collection and Charcoal Production
Efforts to reduce deforestation and forest degradation from logging (legal and illegal) have been
prioritized by donors, governments and other actors in West and Central Africa. These efforts
have been focused on the formal forest sector, as well as the protected area system, and include
high-level forest sector planning, although more attention has gone to regional planning in the
Congo Basin than in the hotspot. Restrictions and reforms to the forestry sector, including the
reduction and cancellation of concessions, have contributed to contractions in the formal sector
in the hotspot but potentially also to the expansion of the informal sector.
There has been progress in recent years with initiatives to develop legal and sustainable timber
industries globally and in the hotspot. These include the promotion of forest law enforcement,
governance and trade (FLEGT), through bilateral and multilateral initiatives, such as the EU’s
Voluntary Partnership Agreements (VPAs), which are currently being implemented with
Cameroon, Ghana and Liberia and negotiated with Côte d’Ivoire. Forest certification is
expanding, though remains largely limited to Cameroon and Ghana. All but one of the 37 valid
certificates listed on the FSC database as of June 2015 (for both forest management and chain of
custody) were for companies in these two countries; one company in Nigeria is also certified. In
the case of some tree species (e.g. Pericopsis elata), there are CITES quotas in place and EU
restrictions on import. For instance, the species is currently suspended from export in Côte
d’Ivoire (see Section 6.2.4). There has also been some investment in partnerships with the
private sector (e.g. the Wildlife Wood Project in Cameroon, which works with logging
companies to promote low-impact logging practices and improved wildlife management in
concessions).
Approaches in forestry also need to address threats and drivers related to the informal forestry
sector. Karsenty (2007) notes that, in every country in the region, pro-active policies toward the
integration of small-scale logging and processing activities into the formal economic sphere are
much needed, and granting forest land on which logging can be done legally is essential. Small-
scale producers are the main suppliers of timber for local demand. While there has been much
international focus on efforts to verify the legality of timber for export from larger companies,
the domestic sector has thus far received too little support and regulation. There are a few
exceptions to this, such as the EU-funded Developing Alternatives for Illegal Chain Saw Milling
through Multi- Stakeholder Dialogue project in Ghana. The same need for support and regulation
applies to the supply of fuelwood and charcoal, which are likely to remain important sources of
energy (for homes and businesses) in the hotspot well into the future.
Community-based natural resource management is one strategy to address the threats to forests
and biodiversity posed by informal and unregulated logging, fuelwood collection and charcoal
production. In addition to the maintenance and updating of some traditional community
conservation practices (such as sacred forest sites in Nigeria and Ghana, or the ‘modified
taungya’ agroforestry system in Ghana), there are other foundations for community forestry in

192
the hotspot that can be built upon. These include community forestry by-laws and forest
management committees in Nigeria, as well as county forest forums in Liberia.
The extension and effectiveness of community forestry in the hotspot will rely on addressing the
fundamental barrier posed by current tenure arrangements. This applies to fuelwood and charcoal
initiatives as well, because trees outside of forests play an important part in supplying these
products. Agroforestry, or ‘on-farm’ trees, could help meet this demand, provided farmers have
secure tenure over these resources. Fuelwood and charcoal initiatives also need to address the
issue of sustainability. Although it is clear that these will remain important sources of energy,
continued use of fuelwood and charcoal have negative impacts on the environment (through
greenhouse gas emissions) and health (through indoor air pollution), and thus improved practices
are required. In Ghana and Nigeria, there are projects to promote efficient wood stoves and
‘green’ charcoal (see Appendix 9), but these need to be extended to other parts of the hotspot and
implemented on a larger scale if they are to have greater environmental and health benefits.
8.4.3 Addressing Conversion of Forests and Other Habitats: Agricultural Development and Infrastructure
The threats to habitats and biodiversity posed by the expansion of agriculture (particularly
commercial plantations) and the development of large-scale infrastructure projects in the hotspot
are emerging as increasingly important issues for the conservation sector. Addressing these
threats will also likely require the formation of new strategies and partnerships with other
sectors.
Landscape-scale approaches have been implemented in the hotspot, recognising the links
between different land-uses and ecosystem services, and the need for ecosystem approaches.
These include landscape initiatives, such as the Conservation of the Western Area Peninsula
Forest Reserve and its Watersheds project in Sierra Leone, as well as the establishment of
conservation corridors and transboundary protected areas, such as the Cestos-Sapo-Grebo-Taï-
Cavally Corridor between Côte d’Ivoire and Liberia.
Landscape-scale, ecosystem-based approaches should continue to form one of the core strategies
for improving conservation outcomes in the hotspot. However, they may increasingly need to
work outside of protected areas and in partnership with key actors in agricultural expansion and
infrastructure development, including government agencies outside of the forest/conservation
sector, the private sector, and communities affected by policies and projects aimed at
transforming the economies and landscapes they live in. Such approaches should be based on a
full assessment of the links between forests, water bodies and other ecosystems, and protected
areas, agricultural areas, urban areas and emerging industries. Specific tools and methods may
include the promotion of integrated and participatory land use planning, as well as integrated
water resources and coastal zone management. Ecosystem-based adaptation to climate change, or
the integration of ecosystem services into other kinds of adaption planning, can also contribute to
landscape-scale planning that aims to maintain ecosystem services that are important for future
livelihoods and resilience.

193
Improved governance is needed to facilitate such landscape-scale approaches, and to reduce the
negative impacts on the environment and people from agriculture and infrastructure projects.
Often involving partners outside of the conservation sector, these approaches may include:
i. Helping governments to develop sustainable investment and infrastructure plans (e.g. that
aim to attract sustainable investors or that site infrastructure in the most suitable
locations);
ii. Strengthening land-use planning and zoning processes (e.g. ensuring consultation among
sectors and the consideration of biodiversity and ecosystem services);
iii. Adjusting fiscal and other frameworks that incentivise poor environmental/social
practices;
iv. Strengthening EIA processes (from ensuring that the required EIAs are performed
through to the implementation of environmental management plans);
v. Asking financiers to apply lending and safeguard policies; and
vi. Supporting the monitoring of agriculture and infrastructure projects, and the sanctioning
of companies that fail to abide by agreements or standards.
There is also scope to promote more sustainable models for agricultural and infrastructure
projects, such as conservation agriculture, sustainability certification, climate-smart
infrastructure development, and so on. Currently in the hotspot, industry sustainability initiatives
are focused on oil palm companies and concessions (e.g. the West Africa Fair Fruit initiative
promoting RSPO certification and small-holder capacity building). In addition to promoting
certification or the application of sustainability guidelines in other sectors (e.g. rubber,
eucalyptus, rice, sugarcane), another potentially useful strategy is to explore alternative models
for plantation development that reduce the negative environmental and social risks associated
with large-scale monoculture concessions. In particular, such models may avoid projects that
displace small-holder farmers and result in further deforestation as well as potentially exacerbate
economic hardship and food insecurity for communities.
8.4.4 Addressing the Impacts of Energy Production and Mining
Impacts associated with the threats posed by energy production and mining include habitat loss
and modification, as well as environmental degradation from pollution and secondary effects
(e.g. mining roads providing access to forests for hunting and logging). As discussed in Section
8.1.3, the mining, oil and gas industries in the sector are also linked to negative socio-economic
and political impacts, such as conflict, corruption and sudden economic shifts for small
communities. There are a number of initiatives in the hotspot that aim to address these threats,
including the EITI and Publish What You Pay initiatives. Partnerships with mining and energy
companies include the Niger Delta Shell-Wetlands International wetlands program in Nigeria,
and the Arcelor Mittal/East Nimba Nature Reserve and Biodiversity Conservation Programme in
Liberia. There have also been investments in ecosystem restoration, focused on repairing the
damage from oil exploitation and conflict in the Niger Delta. Restoration remains a priority in
these parts of the hotspot.
As the mining and energy industries expand in the hotspot, the conservation sector will need to
work more with companies and with the government agencies responsible for planning,
approving and monitoring these projects. Similar to addressing threats posed by agriculture and

194
infrastructure, improved governance (such as better planning and EIA implementation, as well as
requirements for restoration funds/plans) will be a key part of this strategy. Among large,
international mining and energy companies, corporate social and environmental responsibility
programmes are increasingly the norm, and partnerships with local and international CSOs are
relatively common. This is rarely the case among small and medium-scale companies, and
companies with less exposure to international markets. In these cases, the role of government in
enforcing environmental and social protection measures is very important.
Hydropower schemes pose several other challenges. Energy shortages in hotspot countries
indicate that hydropower is likely to expand as part of the energy mix. However, further
assessment (at an ecosystem level) is needed of the costs and benefits posed by these schemes to
the environment and communities in the hotspot, as well as by dams outside the hotspot with
potentially far-reaching impacts, such as those planned for the Niger and Volta Rivers (e.g. see
Thomas Reuters Foundation 2013). It may help to build on or transfer experiences from other
countries and regions in strategic environmental assessment (SEAs) and optimisation of
hydropower development (i.e. studying the most efficient and low risk options for hydropower or
other types of energy production). Alternatives to large hydropower schemes (e.g. alternative
renewable energy sources or alternative hydropower models) may be deemed more appropriate,
cost-effective and lower risk. IIED reports that, in April 2014, ECOWAS member states
approved a draft guideline for developing water infrastructure in West Africa, which aims to
better regulate hydropower development. The guideline states that large dams should be
evaluated at least every 10 years assessing economic, social and environmental impacts and
informing decisions about future investments and policy-making.
8.4.5 Addressing the Impacts of Residential and Commercial Development
The threats posed by expanding residential and commercial development in the hotspot have
some similarities with energy and mining, insofar as they result in habitat loss and modification,
as well as environmental degradation from waste and other types of pollution. These threats are
relatively poorly addressed by current conservation initiatives in the hotspot, potentially due to
the still emerging picture of urbanization and population movements in the region. Currently,
there are few examples of integrated land-use planning or coastal zone management initiatives,
or sustainable consumption, production and waste management projects. Projects aimed at
conserving and restoring mangrove ecosystems include the Mangroves in West Africa Initiative
in Guinea and Sierra Leone, and the Building Mangrove Resilience to Climate Change in the
Douala-Edea, Ntem and Rio del Rey Estuaries project in Cameroon. Lessons learned by existing
integrated river basin authorities within the hotspot (e.g. the newly created Volta River Basin
Authority) and beyond need to be shared and additional authorities established. These authorities
should be encouraged to work with ECOWAS to promote integrated river basin management in
the hotspot. As part of this process, environmental flows should be assessed, to ensure sufficient
flows remain in rivers to maintain the ecological functions of wetlands and their continued
provision of services such as water purification, fisheries production and flood control.
An important element in addressing this threat to biodiversity in the hotspot is improving
knowledge and data about the current situation. Urbanization and patterns of population
movements are relatively complex. As described in Section 5.2.2, it is not simply a case of rural

195
people moving to large coastal cities, although that occurs as well. Strategies to address the
impacts of urbanization and commercial development, such as improved waste management or
city planning, will thus need to be appropriate to small urban centers as well as large cities.
There is also a lack of recent data on the extent of pollution and waste disposal problems, and the
extent of the conversion of wetlands, so studies of these issues should be encouraged.
Although a number of the interventions to address threats from residential and commercial
development are necessarily related to environmental management and sustainable production
and consumption (as opposed to green-field conservation), as with addressing the impacts of
agriculture and infrastructure development, landscape-scale, ecosystem-based approaches should
be included. An ecosystem-based approach will help to incorporate the links between what
happens on land (deforestation, erosion, agricultural chemical use, irrigation) and impacts in
freshwater, coastal and marine environments (e.g. sedimentation, water pollution, reduced
freshwater flows). An ecosystem-based approach can also provide a more realistic or accurate
way to set targets for water consumption or limits for waste emissions. Similarly, a strong link
can be made between ecosystem-based approaches in the coastal zone and climate change
adaptation initiatives. Effective adaptation options for the hotspot’s urban areas, in particular,
will be linked to the health of coastal and other ecosystems, which provide the ecosystem
services that will support future resilience to climate change.
8.4.6 Addressing Invasive Species and Disease
The threats posed to biodiversity in the hotspot by invasive non-native species, problematic
native species and disease were relatively low-ranked by workshop participants and the Red List
analysis. This may be partly due to a lack of available data on these threats. Current initiatives in
the hotspot related to invasive species and diseases are limited. There are some projects on
control of water hyacinth in Cameroon and Benin, as well as a recent trial of an Ebola (Zaire
strain) vaccine for chimpanzees, conducted in the United States (see Warfield et al. 2014). In São
Tomé and Príncipe, the ecology and impact of invasive species is currently poorly understood,
meaning that the first step for action should be identifying the key threats, and then defining a
strategy to tackle them.
Research and monitoring will be a key element in strategies to address these impacts. In
particular, more information is needed on which diseases of which species are of the greatest
conservation concern in the hotspot. For example, there is still limited evidence of impacts from
Ebola in hotspot primate populations but the risk profile may be changing. Other diseases may be
more prevalent among primate populations in the hotspot, such as SIV and malaria. Similarly,
the expansion of agriculture and aquaculture in the hotspot may bring an increased risk from
invasive species (such as GIFT tilapia, see Section 8.1.10).
8.4.7 Addressing Key Barriers: Participation, Knowledge and Awareness
This chapter points out that a lack of participation of local communities and other actors in
environmental governance, as well as low awareness and knowledge regarding biodiversity and
ecosystem values, still form key barriers to promoting conservation outcomes in the hotspot.
Although conservation awareness-raising, capacity building and education have long been a
target of investment in the hotspot, continued support in fostering awareness and understanding

196
of biodiversity and ecosystem values is recommended, and this should be extended, not
necessarily to a wider audience but to a more targeted one.
There is now a stronger recognition that local people play a vital role in the success of
conservation projects. There is also a growing recognition of the role of other actors and drivers
of environmental change, and a need to engage them on conservation issues (e.g. city dwellers
and international markets for wildlife products, and banks and companies involved in developing
commercial projects). Efforts need to move beyond awareness raising for changing local
behavior, to a multi-sectoral approach that can engage non-conservation sector actors from
government and the private sector, and provide a platform for these sectors to communicate with
each other. These should utilise the expanding range of tools currently being used to
communicate biodiversity and ecosystem values (including intrinsic, cultural and option values),
with a consideration of how this information can be best communicated to decision-makers
(political, social and private sector). Within the hotspot, it is also advisable to continue to build
up the capacity of local organizations to carry out this kind of comprehensive, multi-sector
awareness raising work and to address issues related to environmental governance. This is
potentially a different set of knowledge and skills than those needed for working with
communities on the ground.
Related to effective advocacy for the environment is a continued need for more detailed and
longer term information on biodiversity status and trends, and on the impacts of conservation
interventions. There has already been an improvement in the biodiversity information available
in the hotspot (e.g. through efforts such as the Pan-Africa Freshwater Biodiversity Assessment
coordinated by IUCN) and work has gone into improving regional monitoring processes.
However, projects that can provide detailed monitoring data against useful indicators over a long
period of time tend to be exceptions rather than the rule (e.g. where long-term funding is
available for biodiversity conservation in a landscape). It will become increasingly important to
have long-term biodiversity and ecosystem services data over different landscapes and
conditions of environmental change. Monitoring data that can illuminate the biodiversity and
other benefits of conservation interventions will help to show that these are effective land-use
strategies.
9. CLIMATE CHANGE
9.1 Climates of the Guinean Forests Hotspot 9.1.1 Climatic History The Guinean Forests Hotspot includes two of Africa’s six main climatic zones, namely ‘humid’
and ‘subhumid humid’ (ECOWAS-SWAC/OECD 2008). Mean temperatures in the hotspot
countries remain remarkably constant through the year and across the region, although annual
maximum temperatures range from around 30°C to 36°C, with the cooler areas being nearer to
the coast and further south (Hijmans et al. 2005). The hotspot’s precipitation regimes, however,
vary more markedly (see Table 9.1).

197
Table 9.1 Precipitation and Rainfall Averages and Trends for the Hotspot Countries
Country
Temperature (°C) Precipitation (mm per month)
Mean 1970-1999 Trend 1960-2006
(change per decade)
Mean 1970-1999
Trend 1960-2006 (change per
decade)
Benin 26.8 0.24 88.1 -1.7
Cameroon 24.1 0.15 129.7 -2.9
Equatorial Guinea 24.2 0.14 177.0 -3.7
Ghana 26.6 0.21 98.0 -2.3
Guinea 25.6 0.18 134.7 -4.5
Liberia 25.0 0.18 186.4 -5.4
Nigeria 26.2 0.18 95.8 -1.1
Sierra Leone 25.7 0.18 197.8 -6.9
Togo 26.5 0.24 95.9 -2.3
Source: McSweeney et al., 2010.
Note: Data were unavailable for Côte d’Ivoire and São Tomé and Príncipe.
Benin has the lowest average monthly rainfall of all hotspot countries (88.1 mm) with an average
of only 16 mm from January to March. Nigeria, Togo and Ghana also have relatively low mean
monthly rainfall, with 95.8 mm, 95.9 mm and 98.0 mm respectively. The wettest hotspot
countries are Sierra Leone, Liberia and Equatorial Guinea, with mean monthly rainfall of 197.8
mm, 186.4 mm and 177.0 mm respectively. Greatest variability in annual precipitation occurs in
Guinea, which has both the highest (329 mm) and third lowest (13 mm) per quarter monthly
rainfall averages. In West Africa, the onset of the rainy season is a key factor triggering changes
in the vegetation, as well as feedbacks to the local atmospheric heat and moisture cycle. The
length and frequency of dry spells as well as the length of the rainfall season also affect this, and
all are affected by a large inter-annual variability (Janicot et al. 2011, Rodríguez-Fonseca et al.
2011).
9.1.2 Observed Recent Climatic Changes
The latest Intergovernmental Panel on Climate Change (IPCC) reports that each of the last three
decades has been successively warmer at the Earth’s surface than any preceding decade since
1850, and almost the entire globe has experienced surface warming and sea level rise at rates
greater than during the previous two millennia (IPCC 2013). In West Africa, increases in both
the frequency and intensity of droughts have been observed (Hartmann et al. 2013). The western
Sahel region has remained dry following the droughts of the 1970s, while the eastern Sahel has
returned to wetter conditions (Rhein et al. 2013). The IPCC concludes that the region has
experienced an increase in dryness overall (medium confidence) and greater inter-annual
variability than the previous 40 years (IPCC 2013).
In the hotspot region, McSweeney et al. (2010) report average per decade temperature increases
of between 0.14°C (Equatorial Guinea) and 0.24°C (Benin and Togo) from 1960-2006, while
most other countries have experienced increases of 0.18 °C per decade (see Table 9.1).
Conversely, hotspot countries’ mean monthly precipitation has shown a general decreasing trend
over this period, with mean per decade declines ranging from 1.1 mm (Nigeria) to 6.9 mm
(Sierra Leone). Precipitation seasonality has also altered, and despite the overall declining trend,
some per quarter means have increased, such as Benin’s October to December mean (by 0.5 mm

198
per decade) and Nigeria’s December to February and September to November means (by 0.6 mm
and 1 mm per decade respectively).
9.1.3 Projected Future Climatic Changes and Sea Level Rise
Continued emissions of greenhouse gases will cause further warming and changes in all
components of the climate system. Even if emissions are stopped immediately, the gases already
emitted will result in persistent global mean surface warming until the late 21st century and
beyond, along with most other aspects of climate change (IPCC 2013). This section discusses the
IPCC’s projections of future climate and other environmental changes, as well as its confidence
in them. The section also presents more detailed model predictions for the hotspot region, using
downscaled climate projections produced by York University in the UK (Platts et al. 2014).
These models describe four possible climate futures, known as Representative Concentration
Pathways (RCPs), which are all considered possible, depending on the amounts of greenhouse
gases emitted in the coming decades.
Temperature Changes Global surface temperature changes for the end of the 21
st century are likely to exceed 1.5°C
relative to the pre-industrial era (1850-1900) (projected for all RCPs except one) and warming
will continue beyond 2100 (projected for all RCPs except one). For Africa, at a continental scale,
the limited degree of climatic measurement limits opportunities for testing model predictions
and, hence, confidence in them (Rhein et al. 2013). However, the IPCC concludes with high
confidence that warm days and nights are likely to increase and cold days and nights to decrease,
and that it is very likely that all of Africa will continue to warm during the 21st century
(Christensen et al. 2013). Table 9.2 provides a summary of projected changes in temperature and
precipitation, showing that West African warming will be greater than the global average,
reaching the 1.5°C by 2065, rather than the 2100 global projection. By 2100, the high-end
scenario projects a change in mean annual temperature of up to 3.2°C averaged across the region,
while more optimistic scenarios limit this to about 1°C (Christensen et al. 2013).
Table 9.2: Projected Changes to Mean Annual Temperature and Precipitation for West Africa
Year Projected Temperature Change (
oC) Projected Precipitation Change (%)
Minimum Median Maximum Minimum Median Maximum
2035 0.6 0.8 1.2 -4 1 8
2065 1.1 1.5 2.5 -10 2 6
2100 1.0 1.9 3.2 -8 3 8
Source: Christensen et al., (2013).
Note: Changes are measured as the difference between a baseline period (1986-2005 average) and projected periods
(2016-2035, 2046-2065 and 2081-2100) of the RCP4.5 experiments. Based on the difference between these two
periods, the table shows the 50th
percentiles, and the lowest and highest response among 42 models.
Regionally downscaled projections of temperature changes in West Africa between a baseline of
1995 (mean of 1986-2005) and 2055 (2041-2070), are shown in Figure 9.1. These show a clear
pattern of overall warming in both mean and maximum temperatures, and a trend of increasing
change from coastal to interior regions. Analyses of trends in these projections within the hotspot
alone (carried out by the authors) show that, on average, mean annual temperatures are predicted
to increase by 1.9oC by 2055 (from 25.6
oC to 27.5
oC), and approximately 35 percent of the
hotspot’s area has a projected mean annual temperature increase of greater than 2oC. Intra-annual

199
variability in monthly mean temperatures is predicted to remain relatively constant (1.5oC).
Mean maximum monthly temperatures for the hotspot (which are representing means of
temperatures including by day and night) are expected to rise by a similar amount on average by
2055 (30.5oC to 32.3
oC), with predicted maximum mean diurnal temperatures of over 40
oC in
March and April, and over 35oC for all but July, August and September, by this time.
Figure 9.1 Regionally Downscaled Projections of Changes in (a) Mean Annual Temperature and (b) Maximum Temperature in the Warmest Month
a.
b.
Source: Platts et al. (2014).
Note: Temperature change compares 1975 (based on a mean of 1961 to 1990) and 2055 (based on a mean of 2041-
2070), based on the RCP 4.5 scenario.

200
Precipitation Changes Projections of changes to precipitation regimes in West Africa are uncertain and the differences
in projections between different models and RCPs is considerable (Christensen et al. 2013). This
is due, in particular, to the complex nature of the West African monsoon system. Overall, most
Africa-wide and regional projections broadly suggest an increase in rainfall in the region, and a
possible small delay in the development of the West African rainy season (low confidence).
Should the latter occur, its impact would be considerable, given the key role rainy season onset
plays in triggering vegetation changes and local atmospheric heat and moisture cycle feedbacks
(Christensen et al. 2013).
Figure 9.2 shows the proportions of precipitation changes predicted by regionally downscaled
climate change projections (Platts et al. 2014). Both mean annual precipitation and mean
precipitation in the wettest quarter (June to August) show a general trend of increasing rainfall,
except in the Dahomey Gap and inland areas of southeastern Nigeria where conditions become
drier. A pattern of fairly consistent drying, however, occurs in the driest quarter of the year
(December to February), suggesting that variability in precipitation in the region is likely to
increase.
Within the Guinean Forest Hotspot, analyses of downscaled projections (Platts et al. 2014) by
the authors suggest an average increase of 8.1mm (4.9 percent) in mean monthly precipitation,
along with a small increase in variability. Greatest increases in mean annual precipitation by
2055 are predicted to occur in the central areas of the western block of the hotspot, including the
inland area of the Upper Guinean Forests subregion, eastern coastal Nigeria and parts of north
coastal Cameroon. Greatest declines in mean annual precipitation are predicted for coastal Côte
d’Ivoire and Ghana, the western Nigerian components of the hotspot and parts of topographically
diverse northwestern Cameroon.
Predicted changes in driest quarter (December to February) rainfall by 2055 include dramatic
decreases in hotspot parts of Guinea, coastal Sierra Leone and a small area of northwestern
Cameroon. Increases in driest quarter precipitation of more than 10 percent are predicted in parts
of Liberia, Sierra Leone and São Tomé and Príncipe but relatively little change is predicted for
the majority of the hotspot. Patterns of predicted change in mean precipitation in the wettest
quarter (June to August) by 2055 are similar to those of mean annual precipitation changes, with
increases of less than 10 percent in central parts of the Upper Guinean Forests subregion
(including Liberia, Côte d’Ivoire and Ghana), as well as eastern coastal Nigeria and parts of
northern coastal Cameroon, and with the addition of central Togo. Declines in mean precipitation
are less severe for the wet season compared to annual averages though coastal Côte d’Ivoire and
Ghana, while parts of northwestern Cameroon show the greatest declines.

201
Figure 9.2 Regionally Downscaled Projections of Changes in (a) Mean Annual Precipitation, (b) Mean Precipitation in the Driest Quarter and (c) Mean Precipitation in the Wettest Quarter
a.
b.
c.
Source: Platts et al. (2014).
Note: Precipitation change compares a mean of 1975 and 2055, based on the RCP 4.5 scenario.

202
Extreme Events IPCC (2012) projections for West Africa, predict increases in warm days and nights and
decreases in cold days and nights with high confidence, along with an increase in the 20-year
return value of the annual maximum hottest day. An increase in frequency and/or duration of
heat waves is also predicted with high confidence. Predictions relating to the region’s
precipitation, consecutive dry days and soil moisture are of low confidence, however, due to
disagreement among models. An increase in precipitation extremes related to the monsoon is
considered very likely in Africa as a whole, however, and modeling by the Meteorological
Research Institute and Japan Meteorological Agency (Hirabayashi et al. 2008) show an increase
in the risk of floods in tropical Africa with resulting risks of slope instabilities and landslides. A
possible intensification of late-season rains in West Africa has also been noted (IPCC 2013).
Sea Level Rise A comparative study on the potential for coastal inundation resulting from a 1 meter sea level
rise in 84 developing countries found that North and Sub-Saharan Africa were amongst the eight
regions at greatest risk (Dasgupta et al. 2008). Sea level rise implications for West Africa are
likely to be significant and most severe for its oceanic islands and estuaries. These may include
coastal erosion, damage to infrastructure and salination of freshwater resources and farmlands.
The hotspot boundary avoids the coast in some of its constituent countries. Nonetheless, an
analysis carried out by the authors found that approximately 2,300 km2 of the hotspot area (0.4
percent) occurs at or below 1 meter above sea level, making it extremely vulnerable to sea level
rise, while a further 600 km2 falls at or below 2m above sea level. These low-lying areas are
mainly along coastal sections of the hotspot in southern Sierra Leone, southwestern Nigeria and
western Cameroon, as well as lower stretches and estuaries of the region’s major rivers,
including the Rokel (Sierre Leone), Sanaga (Cameroon) and Niger (Nigeria).
9.2 Impacts of Climate Change
Africa is particularly vulnerable to the impacts of climate change, due to widespread poverty,
recurrent droughts, inequitable land distribution and rain-dependent agriculture (IPCC 2013).
Concerns include impacts on both natural systems (e.g. biodiversity, forestry and coastal
ecology) and human livelihoods (e.g. access to water and food resources, health and economies).
In preparation for climate change, each hotspot country has developed national action plans,
strategies and/or communications describing the climate change impacts about which they are
most concerned. Table 9.3 classifies these into broad categories of impacts. Agricultural and
livestock impacts, particularly on farmers, were listed as a vulnerability by all countries except
São Tomé and Príncipe. Impacts on mangroves and coastal zones were the next most commonly
listed concern, and impacts of climate change on water resources and catchments, fisheries, and
drought or soil drying listed third most often, each by six countries. Impacts on urban areas,
human migration, national security and vegetation loss were listed least often, each by only a
single country. These findings are valuable for understanding national governments’ concerns
about climate change and for identifying areas where further vulnerability assessment and
information sharing might be necessary.

203
Table 9.3 Overview of Vulnerabilities Identified by Hotspot Countries in their NAPAs and Other Adaptation Strategies and Communications
Vulnerability
Ben
in
Cam
ero
on
Cô
te d
’Ivo
ire
Gh
an
a
Gu
inea
Lib
eri
a
Nig
eri
a
São
To
mé &
Prí
ncip
e
Sie
rra L
eo
ne
To
go
To
tal
Agricultural and livestock impacts, farmers
x x x x x x x x x 9
Biodiversity x x x 3
Catchments/water resources x x x x x x 6
Coastal municipalities x x x x 4
Coastal zone/ mangroves x x x x x x x 7
Drought/drying of soils x x x x x x 6
Delayed/changed timing of rains x x x 3
Disease/health x x x x x 5
Flooding x x x x x 5
Fishers/fisheries x x x x x 6
Food security x x x x 4
Forests, savannah and NTFPS x x x x 4
Heavy rain and storms x x 2
High temperatures x x 2
Industry/infrastructure x x x 3
Land degradation x x x 3
Landslides/erosion x x 2
Loss of vegetation x 1
Marine impacts x x x 3
Migration/displacement x 1
Security x 1
Settlements/urban areas x 1
Source
NA
PA
200
8
Nat. C
om
m.
Nat. C
om
m.
NC
-CA
S
2012
NA
PA
200
7
NA
PA
200
7
NA
-SP
A-
CC
N, 2
011
NA
PA
200
8
NA
PA
2011
NA
PA
200
9
Sources: NAPA = National Adaptation Programme of Action; Nat. comm. = National Communication to UNFCCC;
NCCAS= National Climate Change Adaptation Strategy; NASPA= National Adaptation Strategy and Plan of Action
Note: Classification of vulnerabilities was devised by profiling team. No NAPA, strategy or other relevant document
was identified for Equatorial Guinea.
9.2.1 Impacts on Biodiversity
Direct Impacts of Climate Change on Biodiversity Changes in local temperature and precipitation have the potential to directly affect Africa’s
rainforests and have led to large ecological shifts on millennial timescales (Malhi and Wright
2004). These changes are likely to be mediated and affected by changing fire regimes, as well as
by increasing numbers of invasive species and new pathogens and diseases. To date, West Africa
has been relatively poorly covered by assessments of climate change vulnerability of

204
biodiversity, although recent initiatives such as PARCC (Protected Areas Resilient to Climate
Change 2010) have made sound progress towards addressing this. Since most studies focus on
one or a few taxonomic groups, their results are discussed by group in the following sections. It
should be noted, however, that tropical ectotherms, such as amphibians, reptiles, fishes and
invertebrates, are likely to face disproportionally large impacts from even small shifts in
temperature because they are currently living very close to their optimal temperature (Deutsch et
al. 2008).
Amphibians Global studies on amphibians by Hof et al. (2011) and Foden et al. (2013a) predict that West
African species are of medium to high climate change vulnerability on a global scale, with the
region of greatest risk overlapping with the Guinean Forest Hotspot. Garcia et al. (2012) made
the opposite finding that, at an African scale, the region has by far the lowest vulnerability of any
region, with up to 35 percent of species retaining suitable climate by 2050. A West African study
by Carr et al. (2014), which covered most of the hotspot, showed that greatest numbers of
climate change vulnerable amphibians occur in the Niger Delta region by 2055, spreading
westward to most of the hotspot by 2085.
Mammals Most of the hotspot was found to be of high climate change risk for mammals by Thuiller et al.
(2006), although Garcia et al. (2014) also examined climate change vulnerability of African
terrestrial mammals and suggested the region was of intermediate vulnerability. Carr et al.’s
(2014) West African study predicts greatest mammal climate change vulnerability in the forested
hotspot region, largely reflecting the high species richness there. A study of climate change
impacts on great apes (Lehmann et al. 2010) found that while their range south of Cameroon
becomes increasingly unsuitable, most of the hotspot remains suitable to 2100.
Birds
Global assessments of bird climate change vulnerability by Hannah et al. (2013), Garcia et al.
(2012) and Foden et al. (2013a) suggest that the avifauna of the hotspot is of intermediate
vulnerability to climate change, both in the African context and globally. Carr et al.’s (2014)
West African study showed that climate change vulnerable bird species are concentrated in the
forested hotspot region. The western part of the hotspot (Sierra Leone, Liberia and Cote d’Ivoire)
and northwestern Cameroon are highlighted as regional priorities for adaptation interventions by
Hannah et al. (2013) due to their high projected loss in habitat suitability for range-restricted
birds. New assessments on climate change impacts on the birds of the region by researchers from
the University of Durham are expected to be released soon but were not available for inclusion in
the ecosystem profile.
Reptiles
Carr et al. (2014) found greatest reptile climate change vulnerability in the hotspot region of
West Africa, but predicted that by 2085, the Dahomey Gap would face the greatest risk. Garcia
et al. (2012), however, found the area to have amongst the highest retention of climatic
suitability for snakes in Sub-Saharan Africa. Because of the low thermal safety margins, tropical
lizards and turtles such as those occurring in the hotspot are predicted to fare poorly under
climate change (Deutsch et al. 2008).

205
Plants
McClean et al. (2005) found that the hotspot emerged among the areas of highest vulnerability in
Africa, with the Dahomey Gap and the Upper Guinean Forests subregion emerging as particular
priorities. A study on the effects of climate change on the richness of crop wild relatives of the
chickpea and Bambara groundnut in Africa (Jarvis et al. 2008) predicts dramatic declines in
numbers of these species in most of the hotspot.
Freshwater Ecosystems
Thieme et al. (2010) found that African ecoregions such as the hotspot, which contain high
proportions of freshwater fish species and several outstanding ecological and evolutionary
phenomena, are likely to experience hydrologic conditions substantially different from the
present. Carr et al.’s (2015) West African study showed the Niger Delta and Sierra Leone to be
the parts of the hotspot containing the greatest numbers of climate change vulnerable freshwater
species.
Indirect Impacts of Climate Change: the Effects of Human Reactions and Responses on Biodiversity Despite increasing recognition that human responses to climate change will result in impacts on
biodiversity additional to those occurring through more ‘direct’ mechanisms (Turner et al. 2010;
Watson and Segan 2013), most assessments, including almost all of those described above, fail
to include them. Masumbuko and Somda (2014) provide a review of the subject for five West
African countries, including the hotspot countries of Sierra Leone and Togo, and give particular
attention to impacts on protected areas. Although empirical evidence remains sparse to date,
perhaps the most commonly anticipated impacts in West Africa relate to climate driven changes
in agricultural practices and productivity. Decreases in agricultural productivity are likely to
necessitate increased dependence on wild natural resources (e.g. bushmeat, edible wild plants),
which could place additional pressure on wild species, and in certain cases could lead to an
increase in (often illegal) resource harvesting from protected areas (Masumbuko and Somda
2014).
Similarly, any reduction in precipitation, whether annual or seasonal, could necessitate increased
water abstraction from new, previously unused, natural sources (USAID 2013), thereby
impacting biodiversity and freshwater species in particular. Unsustainable water abstraction has
already been shown to be negatively impacting biodiversity in the region (Smith et al. 2009).
Similarly, dams, sea walls and other human structures designed to alter water courses, respond to
climate change impacts or generate electricity can affect riverine wildlife communities as well as
downstream wetlands and marine ecosystems (Bonnardeaux 2012). Other impacts to biodiversity
are likely to occur as a result of climate change-driven human migration to new areas
(International Organization for Migration 2008), whereupon increased human presence can
exacerbate many of the threats described in Chapter 8 of this profile (Eastaugh 2010).
Including Climate Change in Conservation Planning As species move in response to shifting climates, the ability of existing protected area networks
to meet their objectives may change, including those objectives related to conservation of target
species and areas of greatest species richness. New areas may gain importance in a landscape due
to their role as corridors for species movements or for their ability to provide refuge for species

206
through their high topographic (and hence microclimatic) heterogeneity or because they contain
important microhabitats (e.g. boulders, lakes, caves, canyons, etc.). Others may cease to be
important, as target species move away or go extinct, they become degraded or inundated by sea
water or their use by humans changes. As a result, protected area networks need to be re-
evaluated for their conservation effectiveness in light of climate change. Such re-evaluation is
currently being carried out for West Africa by the GEF-funded PARCC project, although results
were not available at the time of writing this report. Encouragingly, however, Hole et al. (2009)
show that, in the hotspot, projected turnover of breeding bird species in IBAs is only 0-20
percent, the hotspot is perhaps the least affected by turnover in all of Sub-Saharan Africa.
9.2.2 Impacts on Water
Relatively few catchments provide the main surface water resources within the West Africa
region, principally the Niger, Senegal, Gambia and Volta Rivers and Lake Chad. Stream flows in
these sources has already dropped significantly, with the Niger River’s stream flow, for example,
falling by 30 percent between 1971 and 1989 and those of the Senegal and Gambia Rivers falling
by almost 60 percent (ECOWAS-SWAC/OECD 2008). In many areas, groundwater recharge is
likely to decline, with groundwater shortages exacerbated by an increase in water demand and
abstraction. Salination of freshwater resources and land is of particular concern, both from
natural sources and sea water intrusion, but will be ameliorated to some extent if rainfall and or
monsoonal activity increases. In combination with a predicted increase in frequency and
intensity of drought (Hartmann et al. 2013), as well as of floods, these factors are likely to have
severe impacts on agriculture, human health and the potential for hydroelectric power generation
in the region.
9.2.3 Impacts on Food
Africa relies heavily on agriculture, which contributes to about 21 percent of its GDP and
approximately 50 percent of its total export value (IPCC 2013). Rain-fed farming dominates
agricultural production in Sub-Saharan Africa, accounting for around 97 percent of total
cropland, and exposes agricultural production to high seasonal rainfall variability (Calzadilla et
al. 2013). Ringler (2009) points out that world food prices are important indicators of the effects
of climate change on agriculture, food affordability and security, and the IPCC predicts that
maize, rice, and wheat prices in 2050 are predicted to be 4, 7, and 15 percent higher than in the
historic climate scenario. Impacts of higher food prices on people of the hotspot region will be
substantial, depressing food demand in the longer term and increasing childhood malnutrition
rates (IPCC 2013).
9.2.4 Impacts on Health
Shifts in the distribution of vector-borne diseases such as malaria, Rift Valley fever, African
trypanosomiasis (sleeping sickness), yellow-fever and the almost eradicated onchocerciasis are
expected (ECOWAS-SWAC/OECD 2008), as rainfall, temperature and temperature regimes
shift and humans and animals migrate across the region.

207
9.2.5 Impacts on Human Migration
Climate change-driven human migration is likely to occur at scales ranging from local to
international. While West African patterns are difficult to predict, a broad pattern of migration
from northern to southern areas has been observed in the recent past, owing to the development
of cash crops and urbanization in coastal areas and degradation of the natural environment in the
Sahelian areas, and as a response to the need to seek economic opportunities, diversify risk and
reduce poverty (Bossard 2009). This migration, which results in displacement of northern
groups, and particularly from the Sahel, may increase in future due to climate change impacts on
agriculture, which are expected to be particularly severe in these more northern regions (USAID
2013).
9.3 Responses to Climate Change
9.3.1 Contribution of the Guinean Forest Hotspot Countries to Global Climate Change
In 2010, the 11 hotspot countries emitted only 2.03 percent of global greenhouse gas (GHG)
emissions, including consideration of the land use, land use change and forestry (LULUCF)
sector (WRI 2013). Nigeria and Cameroon emitted substantially more GHGs than the other
hotspot countries but Equatorial Guinea had the highest per capita GHG emissions (Figure 9.3). Figure 9.3: Greenhouse Gas Emissions for Hotspot Countries
Source: Climate Analysis Indicators Tool (CAIT 2.0) (WRI, 2013).
Total GHG emissions incl LULUCF (MtCO2e)
Total GHG emissions exl LULUCF (MtCO2e)
Per capita GHG emissions (inc LULUCF)(tCO2e)

208
At present, the hotspot countries are relatively undeveloped but their GHG emissions will likely
increase substantially with economic development, unless ‘green’, low carbon pathways to
development are successfully promoted. Preliminary research by WRI (2013) suggests that net
forest conversion (including the LULUCF sector) is the most significant source of emissions in
all hotspot countries, including those most industrialized, with the exceptions of Côte d’Ivoire
and Guinea, where agricultural emissions dominate. Agricultural and energy related emissions
form the next two largest sectors (WRI 2013). Overall, 42 percent of the hotspot countries’
emissions are from land use change (including deforestation and degradation), compared to
approximately 22 percent for Africa as a whole (WRI 2013).
9.3.2 International Agreements and National Frameworks focusing on Climate Change There has been a clear expansion of climate change mitigation initiatives in the region since the
last CEPF investment period. All eleven hotspot countries have ratified the UNFCCC and the
Kyoto Protocol. All except Equatorial Guinea have produced their first National
Communications in response to their UNFCCC commitments, and most have developed National
Adaptation Programmes of Action (NAPAs) or other adaptation strategies (see Table 9.4).
Table 9.4 International and National Agreements and Strategies Relating to Climate Change in Hotspot Countries
Country Year of UNFCCC Ratification
Year of Kyoto Protocol Ratification
Year(s) of National Communi-cations
National Adaptation Programme of Action (NAPAs) / National Adaptation Plan (NAPs)
Benin 1994 2002 2002; 2011 Programme d’action national d’adaptation aux changements climatiques du Bénin (PANA-BENIN), 2008. Currently developing NAP.
Cameroon 1994 2002 2005 Preparing through UNDP ‘Supporting Integrated and Comprehensive Approaches To Climate Change Adaptation in Africa’ project.
Côte d’Ivoire 1994 2007 2001; 2010 No NAPA submitted to UNFCC.
Equatorial Guinea
2000 2000 Plan de acción nacional de adaptación al cambio climático (PANA), 2013.
Ghana 1995 2003 2001; 2011 No NAPA (not LDC). National Climate Change Adaptation Strategy (NCCAS) released in 2012.
Guinea 1993 2000 2002 Plan d’action national d’adaptation aux changements climatiques (PANA) de la République de Guinée, 2007
Liberia 2002 2002 2013 National adaptation programme of action (NAPA), 2007. Currently developing NAP.
Nigeria 1994 2004 2003 No NAPA. National Adaptation Strategy and Plan of Action (NASPA) process initiated by NGOs and finished in 2011.
São Tomé and Príncipe
1999 2008 2005; 2012 National Adaptation Programme of Action on Climate Change, 2007.
Sierra Leone 1995 2006 2007; 2012 National Adaptation Programme of Action of Sierra Leone, 2008.
Togo 1995 2004 2001; 2011 Plan d’action national d’adaptation aux changements climatiques (PANA), 2009.
Notes: LDC = Least Developed County; NAP = National Adaptation Plan; NAPA = National Adaptation Program of
Action; NASPA = National Adaptation Strategy and Plan of Action; NCCAS = National Climate Change Adaptation
Strategy; PANA = National Action Plan for Adaptation to Climate Change.

209
All hotspot countries are establishing or have established climate change related institutional and
policy frameworks including national steering committees or departments and climate change
policies. 9.3.3 Mitigation Initiatives The hotspot countries’ commitments to international and national agreements and strategies have
enabled increased access to a growing stream of climate change related funding for mitigation,
including under the Clean Development Mechanism (CDM) and REDD+ initiatives.
REDD+ Nine of the 11 hotspot countries are now developing REDD+ initiatives. The main climate and
REDD+ programmes involved in the hotspot are described in the following sections.
The UN-REDD Program This is the United Nations’ collaborative initiative on REDD+ in developing countries, and
involves UNDP, UNEP and FAO. It supports nationally-led REDD+ processes and REDD+
readiness efforts in 56 partner countries. This is mainly through direct support to the design and
implementation of UN-REDD National Programs, and complementary support to national
REDD+ action through common approaches, analyses, methodologies, tools, data and best
practices. Among hotspot countries, Nigeria has a national programme, while Benin, Cameroon,
Côte d’Ivoire and Ghana are also collaborating with the program (see FAO, UNDP and UNEP
2015).
The Forest Carbon Partnership Facility (FCPF)
This initiative is implemented by the World Bank, and is a global partnership of governments,
businesses, civil society, and Indigenous Peoples aiming to provide financial and technical
assistance for countries’ REDD+ programmes. Its complementary funding mechanisms are the
Readiness Fund and the Carbon Fund. Forty-seven developing countries have been selected to
join the FCPF and have signed the Participation Agreement. In the hotspot, these include
Cameroon, Côte d’Ivoire, Ghana, Liberia, Nigeria and Togo (see FCPF 2015).
Global Climate Change Alliance (GCCA)
The GCCA has a program covering all 79 member countries of the African, Caribbean and
Pacific group of states and supports member countries, in particular Least Developed Countries
and Small Island Developing States, in their adaptation and mitigation responses. It includes a
pan-African component to support the ClimDev Africa programme, and four regional
components in Eastern and Southern Africa, Western Africa, the Caribbean and Pacific.
Activities in the West Africa/ECOWAS component include monitoring in the Sahel, enhanced
participation in CDM and other funds, and national projects Benin, São Tomé and Príncipe, and
Sierra Leone.
The Government of Norway’s International Climate and Forest Initiative, the UK International
Climate Fund/Forest Governance, Markets and Climate Programme (FGMC) and the
development banks’ Climate Investment Funds (CIF) are also supporting REDD+ capacity
building and other climate mitigation and adaptation activities in the hotspot. For example,
Norway announced a bilateral agreement in September 2014 to provide around USD 150 million

210
to support Liberia to reduce GHG emissions linked to deforestation (Government of Norway
2015).
A summary of each hotspot country’s participation in REDD+ activities is listed in Appendix 10.
Five countries, namely Benin, Cameroon, Côte d’Ivoire, Ghana and Nigeria, are active UN-
REDD partners, while Equatorial Guinea is likely to become a member in the near future. Six
countries (Côte d’Ivoire, Ghana, Togo, Liberia, Cameroon and Nigeria) are accepted FCPF
members. Most hotspot countries also have a number of other REDD+ initiatives supported by
the GCCA, FCMC and CIF, as well as by a range of other independent national and non-
governmental organizations. Countries with notably poor REDD participation are São Tomé and
Príncipe, and Equatorial Guinea.
In addition, there are a number of REDD+ projects under development by NGOs and others in
the hotspot, such as in Sierra Leone (Gola Forest), Cameroon (Korup National Park) and Nigeria.
Nigeria’s Cross River State is currently involved in three REDD+ pilot projects, including one
targeting 58,000 hectares of mangroves (Oyebo et al. 2010). These mangroves are considered to
be richer in biodiversity than those elsewhere in West Africa. Given this species richness and
Nigeria’s possession of the largest expanse of mangrove forest in Africa (and the third largest in
the world), the country is strongly promoting the importance of mangroves in REDD+.
It should be remember that, as with all ecosystem-service based mechanisms, REDD+ and other
forms of carbon financing depend upon the market price for the service. If the market price for
carbon falls, projects may need to seek alternative sources of funding to cover operational costs
and meet local communities’ expectations for benefit sharing. There is a need, therefore, for
diversified funding strategies for forest conservation that do not rely too heavily on a single
source. In the context of the ecosystem profile, there may be a need for adaptive management
with regard to geographic priorities for CEPF investment, if important sites currently considered
to be adequately resourced turnout to be facing funding shortfalls.
The Clean Development Mechanism (CDM) While REDD+ has received relatively large amounts of investment and attention in the region,
CDM projects, which focus on helping to develop low-emissions solutions to energy needs, have
received little support. Most of the CDM projects that are occurring in the hotspot are located in
Nigeria, Côte d’Ivoire, Cameroon and Ghana. These projects focus mainly on capacity building
for and initiatives relating to energy production (from landfills, waste and other biomass), waste
composting, fuel substitution and efficient fuel-wood stoves. Investment in CDM initiatives,
particularly in Equatorial Guinea, Guinea, Liberia, Togo and Benin, is a clear priority.
9.3.4 Adaptation Initiatives Using hotspot countries’ national adaptation programmes and plans, a table was compiled listing
the key adaptation measures that stakeholders consulted from each country considered most
important (see Table 9.5; note that the categories were defined by the authors). Measures listed
most frequently included those focusing on coastal zone protection from sea level rise,
agriculture and food security, disease and health management, early warning systems for extreme
events (e.g., droughts, storms or floods), and water conservation and management. Education and
awareness raising for climate change adaptation was also regarded as a high priority by

211
stakeholders from the majority of countries. The identified adaptation needs provide an
important foundation for discussing adaptation activities in the hotspot. Also apparent from
Table 9.5 is the potential of many of the climate change adaptation measures to have significant
positive and negative impacts on biodiversity. Examples of key climate change adaptation
projects currently occurring in hotspot countries are shown in Appendix 10.
Table 9.5 Overview of Measures for Climate Change Adaptation Identified by Hotspot Countries in their NAPAs and Other Adaptation Strategies and Communications
Adaptation Measure
Ben
in
Cam
ero
on
Cô
te d
’Ivo
ire
Gh
an
a
Gu
inea
Lib
eri
a
Nig
eri
a
São
To
mé &
Prí
nc
ipe
Sie
rra L
eo
ne
To
go
To
tal
Agroforestry x 1
Agriculture/food security x x x x x x x 7
Anti-disease/health measures x x x x x x x 7
Coastal zone protection/SLR mitigation
x x x x x x x x 8
Ecosystem management/ restoration
x x x 3
Education/awareness raising x x x x x x 6
Efficient stoves/fuel wood x x x 3
Fire management/prevention x 1
Fisheries management/enhancement
x x x x x 5
Flood control/mitigation x 1
Forestry/protected areas/corridors
x x 2
Indigenous/traditional knowledge
x 1
Income enhancement/ diversification/microfinance
x x x x 4
Infrastructure x x 2
Renewable energy/energy efficiency
x x x x 4
Rapid alert/early warning system
x x x x x x x 7
Water utilization/irrigation/dams
x x x x x x x 7
Water conservation/management/ wetlands
x x x X x x x 7
Water and sanitation x X x x 4
Source
NA
PA
2008
Nat. c
om
m
Nat. c
om
m
NC
CA
S
2012
NA
PA
2007
NA
PA
2007
NA
SP
A
2011
NA
PA
2008
NA
PA
2011
NA
PA
2009
Sources: NAPA = National Adaptation Programme of Action; Nat. comm. = National Communication to UNFCCC;
NCCAS= National Climate Change Adaptation Strategy; NASPA= National Adaptation Strategy and Plan of Action
Notes: Classification of adaptation measures devised by profiling team. No NAPA, strategy or other relevant
document was identified for Equatorial Guinea.

212
Ecosystem-based Adaptation Ecosystem-based Adaptation has been defined as “the use of biodiversity and ecosystem services
to help people adapt to the adverse effects of climate change” (Convention on Biological
Diversity 2009). Many of the initiatives focusing on human adaptation to climate change in the
region explicitly or implicitly refer to biodiversity, particularly those related to coastal zone
protection, land degradation, vulnerability and impact assessment. More recently, however,
programs have been attempting to comprehensively integrate ecosystem, social and economic
aspects of climate change adaptation.
Examples of ecosystem-based adaptation and/or resilience activities being undertaken in the
region include:
i. Mangrove ecosystem rehabilitation and conservation (e.g. the Building Mangrove
Resilience to Climate Change project in the Douala-Edea, Ntem and Rio del Rey
Estuaries in Cameroon);
ii. Community-focused projects in vulnerable coastal and agricultural areas (e.g. the
Adaptation to Climate Change in Vulnerable Coastal Communities project in São Tomé
and Príncipe);
iii. Projects aimed at protecting, restoring or enhancing forests for the purpose of both
mitigation and adaptation (e.g.: REDD+ and the Nigerian National Council on Shelterbelt
and Afforestation/national afforestation programme; CIFOR research on potential role of
Ghana’s modified ‘taungya’ system for adaptation (under the Tropical Forest and Climate
Change Adaptation project, TroFCCA); and the Climate Change and Forests in the
Congo Basin: Synergies between Adaptation and Mitigation (COBAM) project including
Cameroon and Equatorial Guinea).
Some of the barriers to the integration of ecosystem-based adaptation, as noted by UNFCCC
(2013) and Doswald et al. (2014), are prevalent in the hotspot. These include poor understanding
among decision makers of ecosystem-based adaptation’s distinctiveness from other approaches,
a lack of case studies and an evidence base for the benefits associated with ecosystem-based
adaptation, that climate change vulnerability assessments do not always integrate ecosystem
considerations, and a lack of monitoring and evaluation measures to quantify ecosystem-based
adaptation effectiveness.
Community-based Adaptation Community-based adaptation is “a community-led process, based on communities’ priorities,
needs, knowledge, and capacities, which should empower people to plan for and cope with the
impacts of climate change” (Reid et al. 2009). A distinction is often made between community-
based adaptation and ecosystem-based adaptation approaches, although the synergies between
them are considerable and important (Girot et al. 2012). Because community-based adaptation
initiatives tend to be process rather than outcome driven, a range of possible adaptation
measures, outcomes and benefits may result, including ecosystem-based adaptation measures.

213
Given its broad scope, there are numerous initiatives that can be identified as community-based
adaptation in the hotspot. These include:
i. The Advancing Capacity for Climate Change Adaptation project, which includes
community-led activities in coastal Nigeria, Cameroon, Ghana, and the Sahelian zone;
ii. Community-based activities under the COBAM project in Cameroon and Equatorial
Guinea;
iii. CARE’s Adaptation Learning Program for Africa, covering 40 communities across
Ghana, Niger, Mozambique and Kenya.
Infrastructural and Hybrid Adaptation Approaches Infrastructural approaches to climate change adaptation use hard-engineered infrastructure to
respond to climate change impacts (e.g. reservoirs to retain freshwater, sea walls to mitigate sea
level rise). Hybrid approaches combine hard-engineered infrastructure with ecosystem-based
adaptation and/or other adaptation measures (e.g., the combination of sea walls and mangrove
conservation to reduce the impacts of sea level rise and/or storm surges). Examples of
infrastructural and hybrid approaches being implemented in the hotspot include:
i. Senegal River Basin Multi-Purpose Water Resources Development Project 2 and the
Senegal River Basin Climate Change Resilience Development Project. These GEF-
funded projects promote Integrated Water Resource Management as well as water
resources development and dam management in the context of improving climate
resilience.
ii. Development of agricultural and flood mitigation infrastructure in Benin’s Ouémé Valley
for increased productivity and resilience (funded by the AfDB)
iii. Promotion of sustainable and climate-resilient grid-based hydroelectric electricity in São
Tomé and Principle (funded by GEF with UNDP as Implementing Agency), as well as
the São Tomé: Adaptation to Climate Change project (funded by the GEF with the World
Bank as Implementing Agency), which includes an early warning system, coastal
protection works, and both community and ecosystem-based adaptation measures.
9.3.5 Capacity Building and Policy Support
The NAP process for Least Developed Country Parties, established at the UNFCCC 16th
Conference of Parties (2010), requires them to identify their medium- and long-term adaptation
needs. They are then required to develop and implement strategies and programs to address these
needs, building upon their experience with NAPAs (UNFCCC 2014). In response, a NAP Global
Support Programme was established and among its focal countries, Benin and Liberia are
currently receiving assistance. Other examples of capacity building and policy support include
UNDP assistance with the development of NAPAs and GEF projects to mainstream environment
and natural disaster management in Sierra Leone, such as the $4 million full-sized GEF project
implemented by UNDP, “Strengthening climate information and early warning systems in Africa
for climate-resilient development and adaptation to climate change”.

214
9.3.6 Monitoring the Impacts of Climate Change Initiatives to Develop an Evidence Base for Improving Interventions
Given the recent and unprecedented nature of climate change in the history of biodiversity
conservation, it is important to recognize that many of the solutions and actions recommended in
this document and implemented by the global community are tentative and of unproven efficacy.
In such situations, a strategy of constantly reviewing the impacts, effectiveness and potential
damage resulting from management actions, and consequently carrying out frequent and rapid
updates to actions plans (i.e., adaptive management) is a sensible approach. There is a need for
conservation practitioners and donors to recognize that, in this challenging fledgling field,
unintended outcomes of conservation actions are likely and should be regarded not as failures but
as lessons, providing valuable information that should be shared with the community and used to
inform further steps.
In order to be able to review the effectiveness and potential negative impacts of actions plans,
strategies to monitor and measure interventions outcomes are integral. These should be measured
in ways that are as quantitative as possible, include indicators, and be as replicable and
comparable as possible among initiatives. Development of a facility to record, analyze and share
these outcomes and experiences is a priority for the region and in general, and guidance on this
can be gained from the growing field of evidence-based conservation. Frequent re-evaluation of
management strategies is essential, with provision to update them according to outcomes from
the effectiveness evaluation.
9.4 The Role of Civil Society
The enormous challenge presented by climate change in the immediate and longer-term is likely
to leave government resources and capacity overextended. Civil society has an essential role in
supporting governments’ work in the hotspot, and in filling the inevitable gaps in government
strategies and outreach. Given the broad scope and rapid development of emerging climate
change related issues, CSOs, particularly those operating at grassroots and subnational levels, are
often under-resourced and face critical capacity constraints. Their current and potential roles in
capacity building, policy development and roll-out and active management are often under-
played. In particular, interorganization coordination, information exchange and capacity building
are clear and important priorities for international donor support to civil society in the region.
A broad spectrum of CSOs operates in the hotspot, ranging from locally based programmes to
international conservation organizations. Appendix 10 gives examples of some of the key local
NGOs operating in the hotspot, and describes their geographic scope and foci, as related to
climate change and to biodiversity.
Regarding international CSOs, as discussed in Chapter 7, most large international conservation
organizations have programs in one or more of the hotspot countries, all of which include climate
change concerns in conjunction with their ongoing work. Some international NGOs have
programs that are more specifically focused on climate change. These include CI, whose work
includes a low-carbon economy analysis for Liberia, involving an assessment of the climate
change mitigation and economic implications of various policy scenarios. IUCN, UNEP-WCMC

215
and other partners are implementing the Protected Areas Resilient to Climate Change project
(PARCC; 2009-2015), which aims to enhance biodiversity conservation in West Africa’s
protected area network under climate change (including in Sierra Leone and Togo, with
participation from Côte d’Ivoire and Ghana). The project includes distributing downscaled
climate projections, carrying species-level assessment of most of the region’s vertebrate species,
developing spatially explicit conservation plans, compiling adaptation and risk reduction plans,
capacity building and a pilot project. In addition, Wetlands International is developing a regional
mangrove conservation plan with piloting of mangrove restoration actions. The project will
promote multi-country agreement on subregional policies and plans for the sustainable
management of mangrove forests. Moreover, BirdLife International hosts the African Climate
Exchange website, which makes information related to climate change in Africa, including
scientific, management and policy documents, broadly available for comment and exchange.
9.5 Conclusions
CEPF is in a position to engage with civil society to enhance climate change preparedness for
biodiversity conservation in the hotspot. This can be achieved by improving informational
resources for conservation-decision-making under climate change, such as climate change
vulnerability assessments and carbon inventories. This can also be done by increasing the
number and diversity of climate change adaptation initiatives for biodiversity, particularly in
areas containing large numbers or high proportions of climate change vulnerable species.
Because the hotspot includes forested areas that are inherently rich in species, few of its
geographical regions contain low numbers of climate change vulnerable species. Even so, the
combined inputs of studies across a range of taxonomic groups suggest that the main forest
blocks in the Upper and Lower Guinean Forests subregions are of slightly higher priority relative
to the savanna-forest mosaics of the intervening area.
Another important consideration for CEPF is to ensure that climate change related initiatives in
the hotspot measure and report on their outcomes, including their effectiveness at meeting their
objectives, any unintended consequences, and explanation of the reasons for these and lessons
learned. Monitoring should also be based on context-specific indicators that measure changes in
community resilience, biodiversity and ecosystem service provision (especially for ecosystem-
based adaptation initiatives.
CEPF is also well placed to advance the national policy response to climate change by
strengthening the capacity of CSOs to engage in formulation of public policy. In this way, CSOs
can help governments develop national frameworks, policies and regulations for climate change
mitigation and adaptation, such that they meet national needs for development, adaptation and
environmental sustainability, as well as commitments to international agreements, and, in
particular, promote positive synergies between climate change mitigation, adaptation and
biodiversity conservation.
Climate change funding provides opportunities for sustaining conservation efforts for site and
corridor outcomes. CEPF can support CSOs to leverage international funding for climate change
mitigation and adaptation, including from the Climate Adaptation Fund, REDD+ readiness
support programmes, and bilateral funding for REDD+, in support of conservation outcomes in

216
the hotspot. This may involve working with investors from both within and outside the region, as
well as forest communities and local governments, to increase private sector investment in
projects through the voluntary carbon markets that seek environmental and social benefits, for
instance through application of the Climate, Communities and Biodiversity (CCB) standards.
10. ASSESSMENT OF CURRENT CONSERVATION INVESTMENT 10.1 Introduction
This chapter contains an assessment of current conservation investment across the hotspot for the
period 2009 to 2014. This includes funding for direct biodiversity conservation (species and
ecosystem) initiatives, as well as for broader thematic investment, which, on investigation,
appear to have some benefits or components relating to biodiversity conservation in the hotspot.
Examples of the latter include initiatives addressing climate change, protected areas, poverty
reduction/livelihoods, ecosystem services, and corridor and landscape management approaches.
A total of 158 national and 24 regional (multiple country and trans-boundary) ‘projects’ (182 in
total) were identified across the hotspot, representing a total conservation investment of
USD 266 million over the five-year period to 2014. This total represents less than one percent of
total official development assistance (ODA) to the 11 hotspot countries (of USD 28,441 million)
for the five-year period up to 2013 (OECD Aid statistics: http://stats.oecd.org/qwids/ accessed
April 2014). These 182 investments were analyzed to investigate levels of funding by country
and by type of donor and project partner and to look at gaps, specifically in relation to priority
KBAs.
A study of the policies and programs of major bilateral and multi-lateral donors in relation to
funding for forests and forest-dependent communities (Speechly 2015) found that the element of
ODA going from European donors to forest-related and biodiversity projects increased
dramatically between 2002 and 2012 (totals for the period were USD 2.55 billion and USD 1.57
billion, respectively). Given that European donors invest heavily in African countries, it can be
inferred that this trend was reflected in the hotspot countries. However, the report underlines the
difficulty of separating out relevant information even for individual countries (let alone KBAs or
areas within the hotspot boundary) and the significance (in terms of funding) of large thematic
programs. For example, the Norwegian International Climate and Forest Initiative (NICFI),
which alone accounted for USD 287 million in 2012, and made up for more than half of all
donors’ disbursements. The report also underlines the need for, and cost implications of, more
detailed research, if specific information is required by country, site or theme. The trends
identified in the report (of relevance to the hotspot) are discussed further under Section 10.5.1.
10.1.1 Methodology
Most of the funding allocated to conservation in KBAs and protected areas in the hotspot overall
is provided by international donors. The approach taken for the Guinean Forests (as had been
done previously for hotspots) was to obtain as much information as possible from projects and
programs of relevance to the hotspot and/or for named KBAs (predominantly through literature
and website review, supplemented by and cross-checked with information obtained during the
stakeholder consultations during the profile preparation process and other information from

217
specific requests by the authors to donors or other relevant contacts). Each discrete investment
by a donor was considered a ‘projects’ for the purposes of the quantitative analyses by source or
donor type (Section 10.2) and by country (Section 10.3). Nevertheless, it was often not possible
to identify funding specifically allocated for biodiversity conservation at particular KBAs
(although a few KBAs receive grants entirely dedicated to biodiversity conservation).
In addition to this ‘master list’ of projects identified and compiled through regional consultations
and extensive web-based and other research, additional information was also gleaned from donor
websites on their wider funding priorities in the region. In most cases this was presented by the
donor as thematic funding or totals for a certain region, country and time period (but not
necessarily for the time period under review). It was rarely possible to distinguish hotspot or
KBA-specific funding from these additional data but, where additional funding information that
appeared relevant to the hotspot was available, it was included in the relevant tables. These
figures were not added to the quantitative analyses presented in Sections 10.2 and 10.3, to avoid
double counting of the same investments.
Projects were included in the master list and the quantitative analyses only if the investment
amount was USD 50,000 or more. One implication of this was that the small grant programs of
multilateral and bilateral donors (see Tables 10.2 and 10.3) and Trusts, Foundations and NGOs
(see Tables 10.4 and 10.5) were not included in the overall quantitative analyses. Instead, these
are considered separately in the relevant sections and tables. Although the funding levels are
smaller, these small grants tend to be allocated predominantly or exclusively to civil society, so
they are of particular relevance in helping to define a funding niche for CEPF in the hotspot.
A number of assumptions and estimations were made for the inclusion of projects in the analyses
in Sections 10.2 and 10.3. Project funds were allocated pro rata across years where the
investment years fell outside the 2009 to 2014 period, and were divided equally between relevant
hotspot countries in the case of initiatives in more than one country. Efforts were made to
mitigate the risk of double counting in relation to funding streams (e.g. bilateral funds disbursed
through multilateral programs and international NGO funds derived from larger donors) but this
risk could not be entirely removed. Figures on government cofinancing were excluded from most
analyses because they are calculated and presented differently in different countries, donor
budgets and reports and because they were considered typically to constitute in-kind
contributions or sectoral investments not directly relevant to biodiversity conservation (see
Section 10.4.1).
Questions asked during the subregional consultation meetings in relation to conservation funding
provided some information on major projects for most hotspot countries (see Chapter 2 for detail
of questions and consultations). However, planned follow-up meetings were cancelled due to the
Ebola crisis and no new data on investments resulted from the regional questionnaires circulated
in November 2014. Most data were obtained from donor web sites and published documents,
followed up with specific enquiries to donors and grant recipients. A separate donors’ meeting
held in the region in November 2014 (US organizations, led by USFWS and including CEPF)
provided some additional detail on investments and ‘post-Ebola’ plans for the Upper Guinean
Forests subregion of the hotspot.

218
Information was included for coastal/ marine conservation and sustainable fisheries
management, where it appeared likely to be relevant to specific KBAs, corridors or globally
threatened species within the hotspot. Although efforts were made to track down as many
relevant investments as possible, the ease of obtaining information from different donors varied
greatly. Hence, the figures obtained are almost certainly under-estimates.
10.2 Major Sources of Conservation Investment in the Hotspot
Sources of conservation investment were divided into the following six categories: bilateral;
multilateral; national government; NGOs; foundations and trusts; and private sector. Grants from
bilateral and multilateral organizations are by far the largest contributor to conservation funding
in the hotspot, accounting for two-thirds of the total (Figure 10.1). The different types of donor
and the contributions of individual donors to conservation in the hotspot are considered in more
detail in Section 10.4.
Figure 10.1 Conservation Investment in the Guinean Forests between 2009 and 2014 by Source
10.3 Distribution of Conservation Investment by Country The breakdown of conservation investment between 2009-2014 by hotspot country is shown in
Figure 10.2. The apparently high levels of funding (relative to the area of the hotspot in the
country) in Benin (in particular) and also Sierra Leone are a consequence of including a few very
large investments covering large areas (water basins and estuarine/coastal areas). These appeared
With Gov Funding, Bilateral
agencies, 40, 40%
With Gov Funding,
Multilateral agencies, 28,
28%
With Gov Funding,
NGOs, 3, 3%
With Gov Funding,
Foundations and trusts, 5, 5%
With Gov Funding, Private
Sector, 2, 2%
With Gov Funding, National
goverments, 22, 22%
Bilateral agencies Multilateral agencies NGOs
Foundations and trusts Private Sector National goverments

219
to be of relevance to the conservation of KBAs in the hotspot and were, therefore, included.
However, it was not possible to attribute the specific conservation relevance of such investments
more accurately in the absence of detailed information on the locations and impacts of specific
project activities. Hence, the inclusion of these projects may give a skewed impression of the
relative levels of actual biodiversity conservation investment in the hotspot in these countries.
Excluding these two countries, Côte d’Ivoire, Ghana and Liberia appear to receive the greatest
total level of conservation investment, while Equatorial Guinea, São Tomé and Príncipe appear
to receive the least.
Figure 10.2 Conservation Investment (in USD) in the Guinean Forests between 2009 and 2014 by Country
Note: ‘RGNL’ (regional) denotes investments covering two or more countries.
10.4 Distribution of Conservation Investment by Individual Donor
10.4.1 Governments
Within the constraints of the profiling process, it proved to be very difficult to obtain data on
budget allocations for biodiversity conservation by hotspot country governments. Few relevant
data are in the public domain and none were forthcoming from the stakeholder consultations. It
would have required extensive consultation with relevant government agencies across the 11
countries to obtain this information, and, even then, it would have been difficult to determine
which components of national programs or budget lines were relevant to conservation, or
targeting areas within the hotspot boundary. This also applies to national strategies, such as
NBSAPs and NAPAs, which are, in any case, frequently fully or partly funded by external
donors or projects.

220
Many of international donors and programs list government ‘co-funding’ but, in many cases, this
is not actual cash contributions to conservation, because many international donor projects,
especially those funded by bilateral and multilateral donors, are incremental investments on top
of sectoral loans for agriculture, forestry or fisheries development, which are tangentially related
to biodiversity conservation at best. For example, initial data collected for Nigeria showed ‘co-
funding’ of USD 284 million, mainly in the form of sectoral loans from the World Bank, against
grants of USD 20 million. Other donor-funded programs relevant to the same area or theme may
also be shown as ‘co-funding’, thereby raising the risk of double counting. The analysis of
conservation investment in this chapter exclude government co-funding, except where it is clear
that these are additional resources made available for conservation from government budgets.
Table 10.1 presents some examples of government funding targeting conservation outcomes in
the Lower Guinean Forests subregion.
Table 10.1 Government Investment in Conservation in the Lower Guinean Forests Subregion
Country Focus of Investment Annual Amount Source
Cameroon
Protected area 1st grade (>100,000
hectares): Korup National Park; and Mount Cameroon National Park
FCFA 30 million (approx. USD 52,000)
Public Investment Budget
Protected area 2nd
grade (50,000 to 100,000 hectares): Banyang Mbo Sanctuary; and Takamanda National Park
FCFA 15 million (approx. USD 26,000)
Public Investment Budget
Protected area 3rd
grade (<50,000ha): Bakossi National Park
FCFA 10 million (approx. USD 17,000)
Public Investment Budget
Protected area 1st grade: Limbé
Zoological Garden FCFA 30 million (approx. USD 52,000)
Public Investment Budget
Equatorial Guinea
INDEFOR-AP : management of 13 protected areas [not all of which are located in the hotspot]
USD 1 million State Budget
São Tomé and Príncipe
National Parks Management Unit USD 10,000 State Budget
Source: Interactive Atlas of Cameroon, MINFOF, 2011 and final consultation workshop, September 2015.
10.4.2 Multilateral Donors
The most significant single source of conservation investment in the region is the GEF,
principally working through the three Implementing Agencies: UNDP; UNEP; and the World
Bank. GEF Focal Areas relevant to conservation include Biodiversity, Climate Change, Land
Degradation and Multi-Focal. Efforts were made to identify the biodiversity component of grants
with a broader scope, and only include in the analyses the percentage of a total grant that
appeared relevant to biodiversity conservation within the hotspot. Twenty-four full- and medium-
sized GEF projects with a biodiversity conservation objective were implemented in the hotspot
during the period under consideration, providing a total of USD 135 million in GEF grants
(Appendix 11). Out of this total amount, an estimated USD 85.3 million was invested within the
hotspot over the five-year period up to 2014. A further USD 10 million was invested over the
same period through the GEF Small Grants Program (Table 10.2).
Global and regional multilateral development finance institutions (the AfDB, World Bank and
others) finance numerous other programs (often through loans and other mechanisms), which

221
have a primary focus on economic development focus, including large infrastructure projects and
investments in the agriculture, fisheries and forestry sectors. While these investments carry
obligations with regard to environmental standards and best practice, they do not typically have
funding allocated directly to biodiversity conservation, other than where GEF grants provide
incremental funding. For this reason, such investments were not included in the analyses, which
focus on funding with a biodiversity conservation component and relevant to the hotspot (even if
it was not possible in all instances to identify impacts on specific KBAs).
Table 10.2 Overview of Multilateral Donor Investments in Conservation in the Guinean Forests Hotspot between 2009 and 2014
Donor Main Countries and Themes of Investment
Total invested (2009-2014)
(estimated, in USD)
GEF with the World Bank as Implementing Agency (see Appendix 11)
The majority of World Bank support to conservation investment in the hotspot is through GEF grant-funded projects with the World Bank as Implementing Agency and/or co-funder. The World Bank also provides grant-aid to non-GEF projects and many other forms of lending and co-finance, principally to governments. These are not included in the analyses as most have a primary economic development focus, not directly related to biodiversity. There were 18 World Bank initiatives related to conservation in the hotspot over the period of analysis, including projects supporting ecosystem-based land management in forests and forest-adjacent areas (Benin, Cameroon, Guinea, Liberia); support to protected areas management (Benin, Côte d’Ivoire, Liberia); coastal and marine biodiversity and fisheries (Benin, Ghana); erosion and basin management (Nigeria); biodiversity and wetlands (Sierra Leone) and climate change adaptation (São Tomé and Príncipe). Specific KBAs targeted include Parc National de Taï et Réserve de Faune du N’Zo KBA (CIV11), Parc National de Marahoué (CIV10), Parc National du Mont Sangbé (CIV13), Parc National du Mont Péko (CIV12) and Réserve Intégrale du Mont Nimba (CIV14) in Côte d’Ivoire; Sapo National Park (LBR14) in Liberia, Sierra Leone River Estuary (SLE5) and two freshwater KBAs in Sierra Leone, coastal and marine parts of several proposed corridors, and the whole of São Tomé and Príncipe.
52.0 million
GEF with UNDP as Implementing Agency (see Appendix 11)
GEF-UNDP supported 19 projects in hotspot countries: Benin (4); Côte d’Ivoire (2); Guinea (3); Equatorial Guinea (3); Liberia (3); Nigeria (1); Togo (3). Four of these form part of the GEF SPWA (Strategic Program for West Africa) – Sacred Forests and Protected Areas in Benin; the Niger Delta Biodiversity Project in Nigeria and Strengthening the national system of Protected Areas in Togo. A specific rehabilitation project targets Parc National de Taï et Réserve de Faune du N’Zo KBA (CIV11) in Côte d’Ivoire and two projects in Equatorial Guinea also focus on KBAs, including Parque Nacional del Pico de Basilé (GNQ3). All projects have a biodiversity conservation focus; several also have components dealing with climate change adaptation, resilience and ecosystems, including fresh water and coastal zones in Benin, Guinea, Equatorial Guinea and Liberia. UNDP is also under-taking a coastal biodiversity sensitivity mapping exercise in Sierra Leone, with technical support from Wetlands International, which could inform subsequent investments in coastal conservation in that country or regionally. These include a USD 10 million project entitled “Adapting to climate change induced coastal risks in Sierra Leone”, currently under development, which is projected to run from 2017 to 2021.
29.3 million

222
Donor Main Countries and Themes of Investment
Total invested (2009-2014)
(estimated, in USD)
GEF with UNEP as Implementing Agency (see Appendix 11)
The project “Evolution of Protected Area Systems with Regard to Climate Change in the West Africa Region” (PARCC West Africa) is a Full-size GEF-UNEP project (2010-2015) with a focus on climate change and protected areas, managed by UNEP World Conservation Monitoring Centre (UNEP-WCMC). The total budget is USD 15.6 million, which consists of USD 3.5 million from GEF and partner co-financing of USD 12.1 million. The geographic scope of the project covers five core countries in West Africa, only two of which (Sierra Leone and Togo) are in the hotspot. An additional three countries are involved in activities relating to trans-boundary conservation, including two hotspot countries (Côte d’Ivoire and Ghana). While not included period of analysis, a second GEF/ UNEP project: “Conservation des Ressources Naturelles” (CORENA) will provide USD 5.9 million from 2015 onwards for national parks in Côte d’Ivoire, including the KBAs Parc National d’Azagny (CIV9) and Parc National du Mont Sangbé (CIV13). UNEP also supports the Great Apes Survival Partnership (GRASP) which supports work to conserve chimpanzees and gorillas in the hotspot, focusing on illegal trade, habitat loss, disease, trans-boundary issues.
1.2 million
GEF with the AfDB as Implementing Agency (see Appendix 11)
The AfDB is a GEF Implementing Agency for the project: “Integrated Development for Increased Rural Climate Resilience in the Niger Basin” in: Guinea, Côte d’Ivoire, Benin, Cameroon and Nigeria, plus four other countries outside the hotspot.
2.7 million
GEF Small Grants
The GEF Small Grants Program (GEF-SGP) is administered by UNDP and provides financial and technical support to communities and CSOs to meet the overall objective of “global environmental benefits secured through community-based initiatives and actions”. Grants are provided up to a maximum of USD 50,000, (average USD 20,000 to USD 25,000). All countries in the hotspot, apart from Equatorial Guinea and São Tomé and Príncipe, received GEF Small Grants over the period of analysis. In descending order of total value of grants for biodiversity (with total number of biodiversity projects in brackets), the hotspot countries received: Ghana: USD 2.27 million (111); Côte d’Ivoire: USD 1.74 million (94); Liberia: USD 1.27 million (45); Cameroon: USD 1.21 million (53); Nigeria: USD 1.00 million (34); Togo: USD 0.86 million (33); Benin: USD 0.72 million (23); Sierra Leone: USD 0.48 million (17); Guinea: USD 0.43 million (13).
10 million
FAO/IFAD
The Rome-based UN agencies, Food and Agriculture Organization (FAO) and International Fund for Agricultural Development (IFAD) have a remit for technical assistance, reducing rural poverty and increasing productivity and sustainability of agriculture, forestry, fisheries and natural resource management. In West and Central Africa the focus is more on drylands and agriculture (than forests). Co-funding and/ or technical assistance is provided to three GEF projects of biodiversity relevance in the hotspot: “Development of a Trans-frontier conservation area linking forest reserves and protected areas in Ghana and Cote d’Ivoire” and two projects in Guinea: “Coastal, Marine Biodiversity Management” and “Community-Based Land Management Project” (selected subcatchments).
3.7 million as co-funding to to GEF projects
African Development Bank
The AfDB is a regional, multilateral development finance institution established to contribute to the economic development and social progress of African countries. Most investments are for economic purposes, infrastructure projects etc., but the following initiatives in the hotspot have some element of biodiversity conservation impact: the AfDB is a co-funder (USD 1.7 million - with FFEM and others) in the project “Gestion durable des forets communales du Bénin”.
1.7 million

223
Donor Main Countries and Themes of Investment
Total invested (2009-2014)
(estimated, in USD)
CEPF
CEPF first invested in the Guinean Forests of West Africa hotspot in 2001-2006, a five-year investment phase of USD 6.2 million, focused exclusively on the Upper Guinean Forests subregion. A follow-up phase of this investment (to 2012) overlapped with the period of analysis. Six projects (mostly follow-ons from the initial investment phase) were funded in five hotspot countries: Liberia, Ghana, Côte d’Ivoire, Sierra Leone and Guinea through recipients: BirdLife International, Arizona State University; IUCN; Conservation International, Environmental Foundation for Africa, FFI, RSPB. Activities included NGO and government capacity building, research, conservation action and community livelihoods focussed on various KBAs, including Ankasa Resource Reserve - Nini-Sushien National Park (GHA2), Bia National Park and Resource Reserve (GHA4), Kakum National Park - Assin Attandaso Resource Reserve (GHA15), Tano-Offin Forest Reserve (GHA29), Gola Forest Reserve (SLE1), Tiwai Island Game Sanctuary / Non-hunting Forest Reserve (SLE7) and Monts Nimba (GIN9), as well as Liberia’s national protected area system.
1.9 million
GEF-6 and country indicative allocations under the System for Transparent Allocation of
Resources (STAR) are currently being agreed. The total West and Central Africa regional
allocation of USD 83.9 million under GEF-6 represents a 22 percent increase from GEF-5. There
is an increased number and variety of GEF Implementing Agencies and partnerships in addition
to World Bank and UN agencies. Recent additions to the list of GEF Implementing Agencies
include three international NGOs working in the hotspot region: Conservation International,
IUCN and WWF (US).
10.4.3 Bilateral Donors
Many bilateral donors have a focus on conservation funding in the hotspot and most donor
governments identify priority countries for their investment as well as broad themes, such as
climate change adaptation and mitigation (often with subcomponents including biodiversity,
ecosystem services, forest management, or people and livelihoods). Many donor countries have
development finance institutions, whose focus is more on economic development, enterprise and
trade, while an overseas development agency provides funding for themes such as forest
conservation and natural resource management. However, there is considerable overlap, for
example in relation to poverty reduction and achievement of the MDGs. Most European bilateral
donors justify ODA in relation to forests, in terms of the contribution that forests make to the
broader goals of poverty reduction, enhancing sustainable trade, strengthening governance and
mitigating climate change. The most significant bilateral funders of conservation initiatives in the
region are the EU and France (Table 10.3). With the exceptions of the EU, France, Germany and
the USA, few countries have specific overseas biodiversity strategies and it is hard to
disaggregate investment in conservation from other investment (and even more so investments in
specific KBAs or corridors).
The EU Global Public Goods and Challenges (GPGC) fund is largely dedicated to environment
(climate change, water, forests) and is structured under flagship initiatives, including
Biodiversity for LIFE (B4L). This is “an ecosystem-based approach for economic growth,
climate change mitigation and adaptation, food security and good governance”, under which

224
funding for biodiversity in developing countries will be doubled. The four elements of B4L are
good governance; ecosystem conservation for food security and rural development; green
economy; and the Wildlife Crisis Window. It will be funded under various EU instruments
including the European Development Fund and may be supported in the longer-term through an
EU Trust Fund. Approximately USD 900 million is allocated for biodiversity protection, with
biodiversity as a subsidiary target (for mainstreaming) in other programs. More funding is
budgeted for West Africa than for any of the other regions (Central Africa, East and Southern
Africa, the Caribbean or the Pacific). The B4L facility will have a budget of 3 million Euros to
be launched in October/November 2015. The EU African Wildlife Conservation Strategy is
likely to be a major implementation mechanism for B4L (from 2016 onwards), with a particular
focus on wildlife crime and trafficking, conservation of key sites (protected areas) and “Key
Landscapes for Conservation” (KLCs), threats from bushmeat and fuelwood harvesting,
transfrontier conservation areas (TFCA), and particular species groups (elephants, birds,
primates, carnivores, plants). It is not yet clear how KLCs relate to the KBAs and conservation
corridors defined in this ecosystem profile.
Table 10.3 Overview of Bilateral Donor Investments in Conservation in the Guinean Forests Hotspot between 2009 and 2014
Donor Main Countries and Themes of Investment
Total invested (2009-2014)
(estimated, in USD)
EU
Most EU funding to hotspot countries is provided through multi-donor funded projects, in collaboration with the GEF, UN agencies, European bilateral donors and NGOs. Beneficiary countries in the hotspot comprise Benin, Côte d’Ivoire, Ghana, Equatorial Guinea, Liberia, Sierra Leone and Togo. Contributing programs/ funds include the EU Program on Tropical Forests and other forests in Developing Countries and the EU Thematic Program for Environment and Sustainable Management of Natural Resources including Energy (ENRTP). Themes for support include sustainable forest management and Protected Areas (including nation-wide protected areas and capacity building projects in Côte d’Ivoire, Ghana, Equatorial Guinea and Togo). Benin has received over USD 10 million for widespread projects relating to conservation of gallery forests, faunal reserves and community reserves. Liberia and Sierra Leone have received grants of more than USD 8 million (through BirdLife International and RSPB) for work in Gola Forest Reserve (SLE1) under the following projects “Securing Liberian forest connectivity through community forest management and innovative financing mechanisms” (GolaMA); “Across the River – a trans-boundary peace park for Sierra Leone and Liberia” (ARTPP); and “The Gola Forest- a new practical model for achieving sustainable protected areas in post-conflict Sierra Leone”. Another KBA in Sierra Leone, Western Area Peninsula Non-hunting Forest Reserve (SLE8), received USD 3 million in EU funding through a partnership with Deutsche Welthungerhilfe E.v. for the project: “Western Area Peninsula Forest Reserve and its Watershed” (see Table 10.4). The EU is also a partner (EU-Joint Research Committee) and donor in the regional BIOPAMA project under the 10
th European Development Fund (to
African, Caribbean and Pacific Developing Countries), which is listed under IUCN’s entry in Table 10.5.
30 million

225
Donor Main Countries and Themes of Investment
Total invested (2009-2014)
(estimated, in USD)
France / AFD and FFEM
France was the fourth largest contributor worldwide to ODA (behind USA, Germany and UK) in 2012. Sub-Saharan Africa is France’s main priority region and two-thirds of AFD grants are allocated to 16 countries suffering from poverty; these include Benin, Ghana, Guinea and Togo. Guinea is also a special category for funding (countries in or recently emerged from conflict) and received additional support for Ebola treatment centres in 2014. France and Germany are the only European countries with a bilateral biodiversity strategy. France’s AFD biodiversity strategy focus for 2013-16 includes sustainable management and protection of ecosystems, with specific sectors: forestry, fisheries and protected areas. Under the special France-IUCN Framework Agreement, a roadmap was created in 2011 to strengthen the network of protected areas in West and Central Africa; this now forms the basis for work of a range of partners (governments, NGOs, donors (GEF, EU, KfW, AFD). The third phase (2013-2016) will focus on: 1. Strengthening the network of Protected Areas in Africa. 2. Preserving oceans and valuing their resources. 3. Biodiversity governance. FFEM is a bilateral fund, established following the Earth Summit in Rio, for the promotion of innovations in the global environment; it contributes to sustainable development projects through grants. FFEM’s focal areas of action are the preservation of biodiversity and international waters, the fight against climate change and against persistent organic pollutants (POPs), land degradation, desertification and deforestation. Although a bilateral fund, FFEM projects are usually integrated with funding from other bi- and multilateral donors (including AFD) and implemented through partnerships. Major investments by FFEM in the hotspot include support to management of community forests in Benin, conservation of Sapo National Park (LBR14), protection of Gola Forest Reserve (SLE1) and community-based conservation of protected areas in Western Region of Ghana. Regional investments include a major initiative on capacity building and access to remote sensing data for forest monitoring in Central and West Africa. FFEM has funded a Small Grants program of support to southern NGOs, principally in Francophone Africa, since 2006 (le Program de Petites Initiatives or PPI). The objectives of support to civil society are to facilitate action on the ground; to increase capacity for project preparation, management and monitoring; the ability to influence national environmental decision-making and learning lessons. Projects are funded for a maximum of two years with average grants of EUR 34,000. The French Committee for IUCN coordinates the program with technical support from IUCN-PACO in West Africa. Themes include conservation of endangered species and ecosystems; protected areas; sustainable natural resource use and community forestry; animal-human conflicts; ecotourism; environmental education; and climate change. In the hotspot, the main beneficiary countries are Benin and Cameroon (10+ projects each); Ghana and Togo (3) and Liberia, Nigeria, São Tomé and Príncipe, and Togo all have one or two. Over the period of analysis, projects in the hotspot have received USD 1.7 million through PPI. Although grants are small, many target regions and key species within the hotspot, as well as specific KBAs, such as Bosomtwe Range Forest Reserve (GHA7), Amansuri wetland (GHA1), Mount Oku (CMR15), Lake Nokoué (BEN1), Sierra Leone River Estuary (SLE5) and Wonegizi mountains (LBR17).
24.0 million

226
Donor Main Countries and Themes of Investment
Total invested (2009-2014)
(estimated, in USD)
Germany/ Federal
Ministry for Economic
Cooperation and
Development (BMZ)
through German
Agency for International Cooperation
(GIZ) and KfW
Development Bank (KfW)
Germany’s bilateral biodiversity strategy includes: mainstreaming biodiversity across government and society; reducing direct pressures on biodiversity and promoting sustainable use; improving the status of biodiversity by safeguarding ecosystems, species and genetic diversity; and enhancing the benefits to all from biodiversity and ecosystem services. There is also support to knowledge management and capacity building (including NBSAPs). Support to Benin is provided under two projects: “Gestion durable des forets communales du Bénin” (GIZ) and “Support to the Protected Areas Management Project” (KfW). In Côte d’Ivoire, there are also two major projects supported by Germany: “Protected Areas Management Project” (PCGAP) and “Améliorer la conservation de la biodiversité dans l’espace Taï” (both GIZ/KfW). In Cameroon, the “Supporting the implementation of the National Forestry and Environmental Program” (ProPSFE), includes a component: “Contribution to sustainable management of protected areas”, which focuses on preserving high-value ecosystems and to improving living conditions for the population of the villages bordering the National Parks in the Southwest Region (GIZ/KFW). Also in Cameroon, the Program for the Sustainable Management of Natural Resources (GTZ/ DED/ KfW and MINFOF), includes support to the following KBAs: Banyang Mbo Wildlife Sanctuary (CMR4), Korup National Park (CMR5) and Mount Cameroon and Mokoko-Onge (CMR12). GIZ also manages the Access and Benefit Sharing component of the regional Biodiversity and Protected Areas Management Program (BIOPAMA). Germany’s Federal Ministry for the Environment, Nature Conservation, Building and Nuclear Safety has also established an International Climate Initiative (IKI) which finances climate and biodiversity projects in developing countries in four areas: Climate change mitigation; Adaptation to the effects of Climate Change; Conservation of natural Carbon sinks with a focus on REDD+; Conservation of biological diversity.
30 million
Japan/ JICA
Bilateral development assistance from Japan in the hotspot countries is directed towards health, education, disaster relief, rural and urban development and infrastructure projects, with some support to agricultural development (e.g. rice). There is some involvement from JICA in investments in forest projects in Cameroon (sustainable livelihoods and natural resource management) but not in areas of the country within the hotspot. In Côte d’Ivoire and Ghana there is a focus on national forest resource management. In Côte d’Ivoire the “Project for Rehabilitation and Restoration of Forests with the involvement of Local Communities” is funded jointly by JICA and ITTO (May 2013 - present). The project is implemented by Côte d’Ivoire’s Forest Development Corporation (Société de Développement des Forêts, or SODEFOR) with the involvement of displaced people and local communities (following successive conflicts between 2002 and 2011). It includes rehabilitation of degraded forest lands through the establishment of taungya agroforestry plantations, other forest rehabilitation work with local communities and support to agroforestry and marketing in or near the hotspot but does not appear to target KBAs in the country. Prior to the period of analysis, the Participatory Forest Resource Management Project in the Transitional Zone (PAFORM) Project was also supported by JICA in Ghana from 2004 to 2009, with a total grant of JPY 460 million. However, this project does not appear to have directly funded biodiversity conservation activities within the hotspot. JICA is supporting climate change adaptation projects in the domains of agriculture, water, forests and energy in São Tomé and Príncipe.
1.8 million
Belgium/ Belgian
Ministry for Development Cooperation
Belgium has a country focus on Benin, but thematic areas are predominantly agriculture (cotton and rice), health and decentralization. The Walloon Agency for Air and Climate contributes to an EU initiative for resilient agriculture and sustainable development in the Porto-Novo region, containing Lake Nokoué KBA (BEN1).
No specific biodiversity
funding identified in the hotspot

227
Donor Main Countries and Themes of Investment
Total invested (2009-2014)
(estimated, in USD)
Denmark/ DANIDA
The only country in the hotspot for which DANIDA has a country policy is Ghana (Denmark-Ghana Partnership Policy 2014-18). This contributes to specific biodiversity objectives under Ghana’s Shared Growth and Development Agenda (Agriculture and Natural Resources) for example: “Manage biodiversity; Manage Protected Areas; Manage Land and Restore Degraded Forests; Promote integrated Marine and Coastal management; Ensure sustainable use of Wetlands and Water Resources; Enhance Community Participation in Natural Resource management; Mitigate impacts of Climate Variability and Change.” but levels of funding directed at biodiversity or the hotspot are not identifiable. (Total ODA to Ghana, 2011: 400M DKK)
No specific biodiversity
funding identified in the hotspot
Finland/ FINNIDA
FINNIDA supports eight focal countries in the hotspot: Benin, Cameroon, Côte d’Ivoire, Ghana, Guinea, Liberia, Nigeria, Sierra Leone, predominantly in the areas of human rights, peace-building, democracy and development. Another area is sustainable management of natural resources and environmental protection. No information specifically for the hotspot; project themes of potential relevance include forest and timber resources, sustainable use and climate (Guinea); environment and livelihoods (Sierra Leone); food security and climate change adaptation (Benin, Cameroon, Ghana).
No specific biodiversity
funding identified in the hotspot
Norway/ NORAD
NORAD has an overarching goal of sustainable development and poverty reduction and two focal countries (Ghana and Liberia) in the hotspot. The Norwegian Climate and Forest Initiative (NICFI) aims to develop a new international climate regime, reduce greenhouse gas emissions and promote the conservation of natural forests to maintain their carbon storage capacity. It has an integrated strategic component: “The Norwegian Climate and Forest funding to civil society” which funds actors working for increased knowledge and innovative solutions for reduced deforestation and forest degradation (to drive forward REDD+). Beneficiaries include vulnerable social groups, indigenous communities, local societies and civil society “living in and of the forest”. A total of 11 “Sustainable landscapes and REDD+” thematic projects were allocated for civil society in hotspot countries in the 2013-2015 NORAD Guide to thematic areas: Liberia (one project: NOK 3.2 million); Ghana (three projects: NOK 3.1 million); Nigeria (one project: NOK 100,000); Cameroon (six projects: NOK 3.3 million), although none of these are known to have an explicit focus on biodiversity conservation in the hotspot. It is also important to note that investments in Cameroon were likely directed to the Congo Basin rather than the Guinean Forests. Liberia is also an eligible country for the five-year phase 2016-2020 Climate and Forest funding to civil society (including indigenous and other forest-dependent populations’ rights and interests; conservation, sustainable management of forests and enhancement of forest carbon stocks (NOK 4 to 20 million annual budget per project).
No specific biodiversity
funding identified in the hotspot
Spain
Support from the Spanish government and UNESCO to the Ghanaian Council for Scientific and Industrial Research (CSIR) for sustainable management of Lake Bosomtwe, Ashanti Region, and for the development of sustainable livelihoods, sustainable agricultural improvements, soil management, water quality and monitoring.
1.6 million
Sweden/ SIDA
Sweden has a long-term development cooperation agreement with Liberia and previously had the same in Sierra Leone (terminated in December 2012). Priorities are democratic governance, human rights, agricultural development (and trade). With the USA, Sweden supports Liberia’s New Deal (support to post-conflict countries). SIDA supported the Gola Forest Trans-boundary Peace Park from 2009-2012, linking Gola Forest Reserve KBA (SLE1) in Sierra Leone and Lofa-Mano Complex KBA (LBR11) in Liberia). Support was based on the importance of the trans-boundary Gola Forest for ecosystem services (water and soils) for adjacent communities and climate change mitigation. SIDA also contributes to the WWF Coastal forests program supporting Bakossi National Park in Cameroon (see Table 10.5).
No specific biodiversity
funding identified in the hotspot

228
Donor Main Countries and Themes of Investment
Total invested (2009-2014)
(estimated, in USD)
UK/ Department for International Development (DFID) and
Department of Environment,
Food and Rural Affairs (DEFRA)
British development assistance in the hotspot region principally targets Anglophone countries (Ghana, Nigeria and Sierra Leone) with historic ties to the UK, principally through programs supporting peace, governance, women and girls, health, education, poverty and vulnerability. The Darwin Initiative (through DfID and DEFRA) is a UK government grant scheme that helps protect biodiversity and the natural environment through locally-based projects worldwide. It is designed to help countries rich in biodiversity but poor in financial resources to meet their objectives under international biodiversity conventions. Funded projects aim to benefit biodiversity conservation and local communities by addressing threats to biodiversity from over-exploitation, invasive species, habitat loss and degradation, climate change and pollution. Projects supported through the Darwin Initiative include: the Wildlife Wood Project in Cameroon and Ghana; a project on biodiversity, socioeconomics and agricultural development in São Tomé and Príncipe; the Developing Cross-sectoral Environmental Governance Platform for Mount Nimba project in Côte d’Ivoire, Guinea, Liberia; the capacity building of Mano River countries for compliance with CBD project in Sierra Leone; a project in Liberia to build the capacity of the next generation of natural resource managers (including creation of a Centre of Excellence for Ecological Research and Conservation Learning in Sapo National Park); a project in Cameroon to improve anti-poaching patrols and sustainable livelihoods, including in Korup National Park (CMR5); and a project in Sierra Leone to enhance habitat connectivity through sustainable development around the Gola Forest Reserve (SLE1) through cacao restoration and community livelihoods The UK government’s International Climate Fund (ICF) was established in 2011 as part of the UK commitment to reduce poverty by helping developing countries adapt to climate change, take up low carbon growth and tackle deforestation. The ICF will provide GBP 3.9 billion of climate finance from 2011 to 2016. Ghana is a beneficiary country within the hotspot under the Community-based Adaptation (CBA) program, in association with CARE and other bilateral aid programs (participatory scenario planning, Farmer Field Schools, disaster reduction and early warning systems, community monitors and CBA plans). The Forest Governance, Markets and Climate (FGMC) Program aims to reduce the illegal trade in forest resources by addressing forest sector governance and market failures that permit illegal forest practices. It supports the negotiation and implementation of bilateral trade agreements under the EU Forest Law Enforcement, Governance and Trade (FLEGT) Action Plan in countries including Ghana and Liberia. The aim is to help protect forests, avoid carbon emissions, protect the livelihoods of forest-dependent communities and increase the incomes of men, women and children reliant on farming.
3.0 million
USA/ United States Fish and Wildlife
Service (USFWS)
USFWS supports “wildlife conservation projects” in hotspot countries through four grant programs: 1) “Multi-national Species Conservation Funds” (for great apes, African elephant and marine turtles); 2) Wildlife Without Borders-Africa; 3) Amphibians in Decline Fund; and 4) Critically Endangered Animal Fund. The majority of recipients/ implementing agencies are international and local NGOs and universities. Grantees in the hotspot include CI, WCS, FFI, RSPB, A Rocha Ghana, Herp Conservation Ghana, CSSL (Sierra Leone), SOS Forêts (Côte d’Ivoire), Pan African Sanctuary Alliance and Chelonee (Guinea), Sea Turtle Watch (Liberia) and Njala University (Sierra Leone). Other grants are direct to relevant government Ministries (e.g. Instituto Nacional Desarrollo INDEFOR Forestal y Manejo del Sistema de Areas Protegidas in Equatorial Guinea). Over the period of analysis, USFWS supported 36 national and regional projects in the hotspot, covering all countries apart from Benin and Togo.
3.3 million

229
Donor Main Countries and Themes of Investment
Total invested (2009-2014)
(estimated, in USD)
USA/ United States
Agency for International Development
(USAID)
USAID provides funding under several major REDD+ initiatives (including integration of biodiversity and REDD+ in the region) and specific programs with biodiversity conservation objectives. The US government also funds the Tropical Forest Alliance 2020 (see the discussion on strategic funding initiatives in Section 10.5.2). 1) The People, Rules and Organizations Supporting the Protection of Ecosystem Resources (PROSPER) project aims to introduce, operationalize and refine appropriate models for community management of forest resources for local self-governance and enterprise development” in Liberia. It builds on earlier USAID support to sector reform in post-conflict Liberia (land policy reform, land dispute resolution, customary rights and community forestry development). PROSPER has a total investment of USD 9 million between 2012 and 2017. 2) The Sustainable and Thriving Environments for West African Regional Development project (STEWARD), currently in its third phase from 2012 to 2015, focuses on Upper Guinean Forest ecosystems. The project is funded by USAID and implemented by USFWS and US Forest Service with partners (CARE, BioClimate, AUDER and PCI-Media Impact). It incorporates community-level activities, women’s empowerment and livelihoods and building capacity for sustainable natural resource management (including community co-management of forests). Phase III includes scaling-up activities and coordination between community-level committees, government ministries and the Mano River Union (MRU) Secretariat. The four hotspot countries in the MRU are Côte d’Ivoire, Guinea, Liberia and Sierra Leone. Ghana and Nigeria are also beneficiaries (including ecotourism initiatives in Cross River State). STEWARD also incorporates regional strategies for sustainable agriculture, sustainable trade in natural resources and coastal and fisheries management. 3) In late 2015, USAID will launch a new regional program, called West Africa Biodiversity and Climate Change (WA-BiCC), integrating components on climate change adaptation, biodiversity-wildlife trafficking, mangroves and coastal area conservation (see Section 10.5.2). As well as supporting regional and national government-led initiatives on biodiversity conservation and climate change, this program will also have a dedicated component focused on engaging and strengthening civil society. Therefore, there are potentially strong linkages with the CEPF investment program. USAID also funds various research initiatives in hotspot countries. Although figures on current investments were not available, the following initiatives are of potential relevance to conservation: - CIFOR research grant for mapping Ebola and human and non-human transmission models to develop an early warning system under the Bushmeat Research Initiative. - Support to the Permanent Interstates Committee for Drought Control in the Sahel (CILSS) for hydrological and climate mapping and monitoring across West Africa, including in the four Mano River Union countries: Côte d’Ivoire; Guinea; Liberia; and Sierra Leone. - United States Geological Survey land cover/ land use program, which includes Benin, Ghana, Guinea, Côte d’Ivoire, Liberia, Nigeria, Sierra Leone and Togo.
19.1 million
A much larger study of the policies and programs of major European donors in relation to
funding for forests and forest-dependent communities found that the element of ODA going from
European donors to forest-related and biodiversity projects increased dramatically between 2002
and 2012 (fern UK 2015). The totals for the period were USD 2.9 billion and USD 1.6 billion,
respectively. A significant contribution to forest ODA is from NICFI, which alone accounted for
more than half of all donors’ disbursements. The report underlines the difficulty of separating out

230
relevant information even for individual countries (let alone KBAs or areas within the hotspot
boundary), the significance (in terms of funding) of large thematic programs, and the need and
cost implications for more detailed research if this level of information is required. The general
trend has been for EU development aid spending to go up (including on climate, forests, and
biodiversity), but for staff to go down. Consequently, much of this funding is disbursed to
multilateral agencies and/or large, well organized recipients to reduce transaction costs for donor
government staff. The report suggests that such funding may not be effective in reaching its
intended targets in the recipient countries, because much of the money may never really leave
these larger institutions. Of even greater concern, the report cited evidence of projects funded by
some European development aid funds which ‘have been shown to involve, or strongly appear to
involve land grabs’ and others which run the risk of involving land grabs in the future.
10.4.4 Foundations and Trusts
A variety of philanthropic foundations and trusts (both large and small) in North America,
Europe and the Middle East provide conservation investment in the hotspot, principally through
grants to international and local NGOs (Table 10.4). Many of these are small grants with a focus
on a specific species, a research topic or capacity building. A few provide larger funding to
broader thematic programs, such as climate change mitigation and adaptation. The most
important philanthropic foundations and trusts operating in the hotspot, from the perspective of
volume of investment, are the Arcus Foundation, the JRS Biodiversity Foundation and the
Mohamed Bin Zayed Species Conservation Fund.
Table 10.4 Overview of Foundation, Trust and Fund Investments in Conservation in the Guinean Forests Hotspot between 2009 and 2014
Donor Main Countries and Themes of Investment
Total invested (2009-2014)
(estimated, in USD)
Aage V Jensen Charity Foundation
The foundation is providing support, via BirdLife International (see NGOs, Table 10.5), to the project: “The Gola National Park in Liberia: realizing its vast potential” to facilitate the establishment of the Gola National Park in Liberia and support communities to sustainably manage forest resources to maximize benefits to them whilst protecting globally threatened endemic wildlife. Partners are BirdLife International, CSSL and the Forest Development Authority of Sierra Leone.
450,000
Arcadia (arcadiafund.org.uk)
Arcadia is a UK charitable fund providing grants to charities and scholarly institutions for preservation of the environment and cultural heritage. An Arcadia grant supports three BirdLife International Partners in the hotspot to build their capacity and ensure sustainable management of priority species and habitats. The BirdLife Partners are: GWS in Ghana, SOS Forêts in Côte d’Ivoire and SCNL (see also BirdLife International in Table 10.5).
40,000
Deutsche Welthungerhilfe E.v.
This German charitable foundation is providing funds for development and emergency aid, health, education and environmental protection. It provides technical and implementation support to Western Area Peninsula Non-hunting Forest Reserve KBA (SLE8) in Sierra Leone through the EU-funded project “Western Area Peninsula Forest Reserve and its Watershed” with local partner Environmental Forum for Action.
Amount not known

231
Donor Main Countries and Themes of Investment
Total invested (2009-2014)
(estimated, in USD)
Arcus Foundation
The Arcus Foundation channels the majority of funding to projects in priority landscapes. In the hotspot there is also a focus on conservation of apes (e.g. western gorilla and chimpanzee) in their natural habitats. It supports initiatives and organizations which focus on long-term engagement and collaboration, including linking livelihoods and development initiatives with conservation goals and capacity building. Projects supported in the hotspot include: strengthening wildlife law enforcement in Cameroon (and other Central African countries); support to forest conservation in the Cestos-Sapo-Grebo-Taï-Cavally Corridor (Liberia-Côte d’Ivoire border) and supports Trans-boundary conservation between Okwangwo Division of Cross River National Park in Nigeria and Takamanda National Park in southwest Cameroon. Ape-related conservation activities include research, capacity building, community natural resource management in priority landscapes in Guinea (Fouta Djallon Massif), Sierra Leone, Côte d’Ivoire and Liberia. Partners include WCS, FFI, ZSL and national NGOs (e.g. Guinée Ecologie, Conservation Society of Sierra Leone, Wild Chimp Foundation (Côte d’Ivoire)). Arcus also supports chimpanzee sanctuaries in hotspot countries – including funding to Grebo in Liberia and Tacugama Chimp Sanctuary in Sierra Leone during the Ebola crisis.
2.3 million
Global Greengrants Fund
A US-based fund providing small grants to civil society and community-based projects “to invest in global grassroots change that honors people, livelihoods and ecosystems equally”. The focus is on advocacy and environmental justice campaigns relating to extractive industries, land and water pollution, community rights and livelihoods, environmental diversity and economic justice. Between 2009 and 2013, green grants relevant to hotspot conservation were awarded in Cameroon (6), Côte d’Ivoire (1), Ghana (17), Guinea (1), Liberia (4), Nigeria (7), Sierra Leone (2) and Togo (2) amounting to a total of nearly USD 200,000 (individual grants between USD 3,000 and USD 10,000). Specific KBAs supported include Korup National Park (CMR5) in Cameroon.
200,000
JRS Biodiversity Foundation
This is a private foundation funded by an endowment created through the sale of a non-profit company (BIOSIS) to Thomson Scientific in 2004. JRS funds projects which support increases in, and availability of, biodiversity knowledge and data (to researchers, local communities, conservation practitioners, policy makers and the public), for the benefit and sustainability of life on Earth. Grants were awarded in Benin (National Biodiversity Information System), Ghana (University of Ghana – DNA Barcoding and Plant Biodiversity Data management) and subregionally (West African Marine Biodiversity), with University of Bergen Museum.
600,000
MAVA
The Swiss-based MAVA Foundation principally funds capacity building and research programs for conservation in the hotspot region. The main focus in the hotspot is on coastal and marine biodiversity which has some relevance to KBAs. Projects include conservation of sea turtles, seabirds, IBAs and Mprotected areas, fisheries and habitat management but information on individual grants to KBAs across the hotspot is not available. For example, the “Migratory birds and habitats project” (mangroves restoration and livelihoods in Freetown - Aberdeen creek) is supporting Sierra Leonean NGO CSSL, through BirdLife International.
40,000

232
Donor Main Countries and Themes of Investment
Total invested (2009-2014)
(estimated, in USD)
Mohamed Bin Zayed Species
Conservation Fund
This is a philanthropic endowment (funded by the Crown Prince of Abu Dhabi), which provides grants to individual species conservation initiatives; to recognize leaders in the field of conservation; and to elevate the importance of species in the broader conservation debate. Over the period of analysis, 50 projects totaling over USD 620,000 were funded in the hotspot. All countries in the hotspot have funded projects, from one to three (Benin, Equatorial Guinea, Guinea, São Tomé and Príncipe, Togo) to five to eight projects (Cameroon, Côte d’Ivoire, Ghana, Liberia, Nigeria, Sierra Leone). Country total investments vary from USD 6,000 (Benin, one project) to USD 112,500 (Côte d’Ivoire, eight projects). Individual grants vary in size from USD 6,000 to USD 25,000. Although it is not possible to determine whether all grants are allocated strictly within the hotspot, the focus is on threatened forest, fresh water and marine species (e.g. Lake Oku clawed frog (Mount Oku KBA (CMR15)), Togo slippery frog, green turtle, apes and monkeys, lion, endangered trees and other plants etc.) so the majority of grants are likely to represent conservation investment in the hotspot.
620,000
Gordon and Betty Moore Foundation
The Gordon and Betty Moore Foundation is investing in strengthening national and project-level capacity for REDD+ in Ghana through a grant to Forest Trends.
310,000
10.4.5 Others/ NGOs/ Private Sector
Several international conservation NGOs (e.g. BirdLife International, CI, FFI, IUCN, RSPB,
WCF, WCS and WWF) have a strong focus on conservation action in the hotspot (project
implementation, procurement of external donor and own matched funding and capacity building
with national NGO partners). Several have country programs and/or subregional offices in the
hotspot, including the BirdLife Africa Partnership WASRO (West Africa Subregional Office) in
Accra and CI’s office in Monrovia. International development NGOs (notably CARE) are often
involved in partnership programs involving both biodiversity and livelihoods or poverty
reduction objectives (for example, with bilateral donors USAID and the UK International
Climate Fund, see Table 10.3).
Many regional and international academic institutions and zoos have species and habitat
conservation programs with a forest conservation focus in the hotspot, often in partnership with
INGOs. Wider partnerships including NGOs, governments, agencies and (increasingly) private
sector finance are a developing theme in the region (see Section 10.5 on Trends and Gaps in
Investment).

233
Table 10.5 Overview of NGO and Private Sector Investments in Conservation in the Guinean Forests Hotspot between 2009 and 2014
Donor Main Countries and Themes of Investment
Total invested (2009-2014)
(estimated, in USD)
Amarada HESS ASAMA , Equatorial Guinea Amount not
known
Chevron Support to NCF to manage the Lekki Conservation Centre Amount not
known
Conservation International
CI’s recent and current country focus in the hotspot is on Ghana, Sierra Leone and Liberia. Most CI grants are disbursed under thematic programs. These include the Global Conservation Fund/International Ecofund, which is supported by the Gordon and Betty Moore Foundation and gives grants to local communities, NGOs and governments for biodiversity and habitat protection and financial support for local economies. The fund provided USD 1.8 million of support towards conservation efforts for the Gola Forest Reserve (SLE1) led by RSPB and its partners. The Conservation Stewards Program (CSP) supports local farmers and communities who protect natural resources and ecosystem benefits on return for compensation from investors The Althelia Carbon Fund awards grants to support low-emission business projects and provide incentives to stop deforestation and deliver benefits to local communities. The fund also supports “carbon offsets,” through which the private sector invests in projects that reduce CO2 emissions from deforestation. The focus is on projects that bring environmental as well as economic benefits to improve the livelihoods of forest-dependent communities CI also contributed co-funding donor of USD 300,000 to the GEF project “Sustainable forest management in Equatorial Guinea for the conservation of representative ecosystems and globally significant biodiversity” implemented by UNDP, which targeted protected areas and KBAs, including Parque Nacional del Pico de Basilé (GNQ3), Reserva Cientifica de la Caldera de Lubá (GNQ2) and Annobón (GNQ1).
2.1 million
Conservation Leadership
Program (CLP)
The CLP is run by a partnership of three international biodiversity conservation organizations (BirdLife International, FFI and WCS). It gives funding to early-career conservationists from developing countries (including the hotspot). Emerging leaders receive both the financing they need for conservation projects and the training, mentoring and networking opportunities that can help them advance their careers. Supported by BP plc and other corporate donors.
No specific biodiversity
funding identified in the
hotspot
Fauna & Flora International (FFI)
FFI has a widespread program of support in Cameroon and Nigeria (western gorilla, Afi Mountain Wildlife Sanctuary) and Upper Guinean Forest countries: Guinea, Côte d’Ivoire and Liberia, with a particular focus on the western chimpanzee, pygmy hippo and African elephant conservation, trans-boundary protected areas, capacity building and community engagement/alternatives to bushmeat hunting. Targeted Upper Guinean Forest KBAs and corridors include Massif du Ziama (GIN8) and Monts Nimba (GIN9) in Guinea, and Nimba mountains (LBR12), Sapo National Park (LBR14) and Wonegizi mountains (LBR17) in Liberia. FFI implements projects funded by donors including Arcus, USFWS, SOS, multiple donors to Sapo National Park (FFEM, GEF, USAID, UK Darwin Initiative etc.). FFI has worked in Liberia since 1997 and continues to support forest management, species conservation and sustainable community livelihoods as the country recovers from years of conflict. FFI supports the Forest Development Authority (FDA) in the gazettement and management of newly proposed protected areas and the implementation REDD+ through the Wonegizi Community REDD+ Pilot Project. See also Conservation Leadership Program.
Amount not known

234
Donor Main Countries and Themes of Investment
Total invested (2009-2014)
(estimated, in USD)
International
Union for Conservation of Nature (IUCN)
IUCN is technically an inter-governmental organization but operates in the hotspot region much like other international NGOs. The West and Central Africa Regional Office (PACO) manages the country program in Cameroon technical programs on protected area management tools, World Heritage and Ramsar site evaluations, and regional capacity building. IUCN serves as the secretariat for the SOS - Save Our Species initiative, in collaboration with the GEF and the World Bank (see Table 10.2). Grants are allocated according to strategic directions identified by the IUCN Species Program and Species Survival Commission. A total of 13 species grants (USD 9,000 to USD 90,000) were awarded in Cameroon, Côte d’Ivoire, Ghana, Guinea, Liberia, Nigeria, Sierra Leone and São Tomé and Príncipe. Three are trans-boundary projects (Key Cross River Gorilla Habitat in Nigeria and Cameroon (WCS); Sharks and People in Guinea and Sierra Leone (AFRICASAW/ Save our Seas); and Community-managed Forest/ Trans-Border Reserve between Ghana and Côte d’Ivoire (West African Primate Conservation Action-Ghana). WCS, BirdLife International and FFI are implementing projects on birds in São Tomé, on primates in Nigeria’s Cross River National Park, and on pygmy hippopotamus in the Wonegizi mountains (LBR17) in Liberia.
700,000
MARATHON
ECOGUINEA/INDEFOR-AP, Equatorial Guinea
Amount not known
Noble Energy
WCS/INDEFOR-AP , Equatorial Guinea
Amount not known
Ocean Energy
UNGE/BBPP, Equatorial Guinea
Amount not known
RSPB
RSPB (the BirdLife International partners in the UK) provides core support grants to three BirdLife partner NGOs in the hotspot, plus technical input, advice and training in several hotspot countries. The BirdLife Interational subregional office and conservation programs in West Africa also receive support and funding from RSPB and other members of the BirdLife International partnership. RSPB has also provided matching funding for large conservation projects in the hotspot especially towards conservation of Gola Forest Reserve (SLE1) and contiguous forests in Liberia.
3.3 million
Wetlands International
Africa
Wetlands International Africa focuses on wetland conservation and restoration, with a head office in Dakar, Senegal and, within the hotspot, a subsidiary office in Nigeria (with a focus on the Niger Delta). Programs include the conservation of wetlands, and particularly mangroves, along the west coast of Africa and, inland, the West African Manatee and migratory waterbirds. Focal countries in the hotspot include Guinea, Nigeria and Sierra Leone. Wetlands International coordinates or supports regional initiatives including the Mangrove Charter and National Action Plans, Conservation Strategy for the West African Manatee, and the African Eurasian Waterbird Census (AEWC).
Amount not known
Wild Chimpanzee Foundation (WCF)
WCF is a European-based NGO with a regional head office in Abidjan, Côte d’Ivoire. Its focus is on the conservation of chimpanzees and their habitats in Liberia, Guinea, Sierra Leone and Côte d’Ivoire, including at the following KBAs: Parc National de Marahoué (CIV10); Parc National de Taï et Réserve de Faune du N’Zo (CIV11); and Forêt Classée de Cavally et Goin – Débé (CIV3).
Amount not known
Wildlife Conservation
Society (WCS)
WCS has a focus on the Lower Guinean Forests subregion. In Cameroon and Nigeria, it is working on the conservation of western gorilla, chimpanzee and other primates in Cross River and Takamanda National Parks and Afi River Forest Reserve, and supporting the establishment of Mbam et Djerem National Park. WCS also works on Sea Turtle conservation in the Gulf of Guinea.
Amount not known

235
Donor Main Countries and Themes of Investment
Total invested (2009-2014)
(estimated, in USD)
World Wide Fund for Nature (WWF)
WWF’s Central Africa Program is based in Cameroon and supports projects in Cameroon, including the Program for the Sustainable Management of Natural Resources (PSMNR) funded by GTZ/ DED/ KfW, including support to the following KBAs: Banyang Mbo Wildlife Sanctuary (CMR4); Korup National Park (CMR5); and Mount Cameroon and Mokoko-Onge (CMR12). WWF has less of a focus on West Africa than previously. The West Africa Forest Program Office has transformed into a new local organization, ‘The Nature and Development Foundation’, with a subregional office in Accra and a focus on strengthening the forest sector’s capacity in West Africa for responsible forest management. WWF was involved as a partner and/ or co-financer of the following hotspot projects in the last five years: Améliorer la conservation de la biodiversité dans l’espace Taï (Côte d’Ivoire); SPWA - Development of Trans-frontier conservation area linking forest reserves and protected areas in Ghana and Côte d’Ivoire. The WWF Coastal Forests Program (SAWA) operates in a large area between the Sanaga and Cross Rivers in Nigeria and Cameroon.
500,000
Universities and Zoological
Societies/ Zoos
Several international academic and charitable institutions are involved in conservation research and project implementation in the hotspot. The Zoological Society of London (ZSL), Zoological Society of San Diego (ZSSD) and International Primate Protection League (IPPL) support forest conservation and efforts to conserve great apes and specific sites (e.g. Ebo Forest) in Cameroon and Nigeria and work with local communities to develop alternatives to bushmeat hunting in Equatorial Guinea. North Carolina Zoological Society provides protection for western gorilla (ranger-based monitoring and law enforcement) at Afi Mountain Wildlife Sanctuary in Nigeria. Drexel University is the Implementing Agency for the USFWS-funded project Biodiversity Conservation on Bioko Island, Equatorial Guinea (including removal of threats to wildlife from bushmeat hunting).
Amount not known
Private sector example, IUCN/
Swiss govt./ Novella
Partnership, Ghana, Nigeria
IUCN and Swiss State Secretariat for Economic Affairs. The project forms part of a public-private partnership called the Novella Partnership, co-ordinated by a secretariat, funded by Unilever and operating in Ghana and Nigeria. In Ghana, Unilever supports a local organisation (registered as a not-for-profit company), called Novel Ghana Development Limited (NDGL) which has the mandate to develop the supply chain for Allanblackia from the production of seedlings through purchasing of nuts to processing of the oil and finally to export to Unilever in the Netherlands.
Amount not known
10.5 Trends and Gaps in Investment in the Hotspot 10.5.1 Overall Trends
There is significant funding for biodiversity conservation projects and programs across the
hotspot but the distribution of this funding is very patchy, and many KBAs and proposed
corridors have received limited or zero investment. Although programs such as the UNDP-GEF
Strategic Program for West Africa are supporting some national governments to review and
strengthen national protected area networks, there is insufficient investment and capacity for
effective management of national protected area systems across the hotspot, and in any case
many KBAs are not part of national protected area networks and investment programs (see
Chapter 4).

236
Multilateral funding is the largest component overall and the GEF is the largest investor in
conservation in the hotspot. However, there is a trend towards more complex multi-country and
multi-donor programs, often with GEF, EU or FFEM funding combined with bilateral
development aid funding and other co-funding, making it hard to distinguish and separate donor
contributions. Although GEF agencies (for example UNDP) have policies requiring the
engagement of civil society in projects this does not make the funding easily accessible,
especially for smaller NGOs or CBOs with limited capacity to work in partnership with large
agencies and government structures. Stakeholders reported that even the GEF-SGP, which was
originally intended as a civil society funding mechanism, had been captured by government in
some countries (Ghana, for example) so that it is much harder, even for NGOs with strong track
records in effective biodiversity conservation and work with communities, to access the funding.
National and local NGOs and CBOs have a constant struggle to find funds which cover their core
running costs and support their own priorities (rather than taking funds for project work that is
not in their program in order to keep their finances afloat). It is particularly difficult to retain
good, committed staff and build capacity in CSOs in countries in the hotspot which have
expanding economies (e.g. Ghana, Nigeria) and where there is competition for good staff from
the private sector (e.g. mining, energy, commercial agriculture) and also UN and other
development agencies (and government), which can frequently offer far higher salaries.
Thematic Programs Another trend is towards thematic programs covering broad themes such as climate change
adaptation and resilience (of both communities and ecosystems). There is frequently a
biodiversity component within these, but without detailed investigation of project objectives,
target sites, implementation and monitoring outputs it is not possible to gauge how much direct
biodiversity conservation impact they will achieve, particularly in relation to specific KBAs.
Food security, human health and wildlife trafficking (including bushmeat hunting and marketing)
are all themes which appear to be gaining importance in the region and especially in those
countries in the hotspot recovering from the Ebola crisis. This was described as a “new poverty-
health-environment paradigm” at a meeting of USFWS and other agencies in the region in 2014.
Consortia and Capacity; NGOs, Government and Private Sector Some major donors increasingly expect funding applications to be made by partnerships or
consortia (i.e. groups of NGOs or NGOs plus government, research institutes or private sector).
This can also exclude smaller national NGOs and CBOs from access to funding if they do not
have the capacity and management systems to engage with larger actors, even though they may
be best placed to carry out relevant work, for example local community engagement). Some of
the large INGOs (CI, BirdLife International/ RSPB and FFI especially) have greater capacity to
engage with multi- and bilateral donors and access larger grants, matching these with their own
funding and/or smaller amounts from trust funds and other donors and channeling this through
national partner NGOs in-country. This can be a very effective way to build national and regional
capacity, especially where the INGO supports national partners (NGOs and government) with a
long-term commitment to countries, national NGOs and networks. BirdLife International has
supported countries and BirdLife Partners in the hotspot, including 25 years support from RSPB/
BirdLife International to the Conservation Society of Sierra Leone and the Gola Rainforest
National Park, and also long-term support to Ghana, Liberia, Nigeria, and (more recently), Cote
d’Ivoire and São Tomé and Príncipe. FFI has similar long-term commitments in Guinea, Liberia,

237
Sierra Leone. The Arcadia program, through BirdLife, currently supports capacity building of
NGOs in several hotspot countries for national NGO development and conservation programs.
Private Sector and Public-private Partnerships There are private sector companies which offer to ‘connect’ private sector finance and
conservation projects or programs (often NGO-led). Other private sector initiatives similarly
offer to link communities and forest biodiversity conservation with potential investors and
financial markets. For example, Permian Global provides investment through the production and
sale of high-quality verified carbon credits, generated through large-scale conservation and
recovery of natural forest in Ghana (e.g. at Atewa Range Forest Reserve KBA (GHA3)) and
other hotspot countries. Their approach is to ‘invest in and manage natural forest protection and
restoration projects across the tropics to deliver significant climate, biodiversity and social
benefits’ with a focus on large-scale forest protection projects, biodiversity conservation and
community benefit-sharing. Another public-private partnership example involves IUCN and the
Swiss State Secretariat for Economic Affairs in Ghana. The project is part of a broader public-
private partnership (the Novella Partnership, which is co-ordinated by a secretariat, funded by
Unilever and operates in Ghana, Nigeria and Tanzania). In Ghana, Unilever supports a local
organisation (registered currently as a not-for-profit company), called Novel Ghana Development
Limited (NDGL) which has the mandate to develop the supply chain for Allanblackia (a native
forest tree) all the way from the production of seedlings through purchasing of nuts to processing
of the oil and finally to export to Unilever in Holland.
Transboundary and Regional Initiatives Several larger donors and programs promote trans-boundary KBA conservation initiatives and a
small number of such initiatives have been funded, although some remain investigations rather
than active partnerships involving two countries in joint management of a trans-boundary KBA.
Programs include the Across the River Peace Park in Gola Forests (EU funding; RSPB, BirdLife,
national governments and NGOs) between Liberia and Sierra Leone (and future plans for an
even wider ‘Greater Gola Landscape’ initiative); and the GEF/FAO/WWF initiative
Development of a trans-frontier conservation area linking forest reserves and protected areas in
Ghana and Côte d’Ivoire.
Several other initiatives, particularly relating to primates, have a cross-border focus, though these
are collaborative research agreements rather than joint management of trans-boundary KBAs.
For example, research and action plans for conservation of chimpanzees and western gorillas on
the border between Cameroon and Nigeria, with funding from a variety of donors (e.g. USFWS,
Arcus, San Diego Zoo, WCS). Investments in other regional and trans-boundary initiatives
include river basin management in the Volta River Basin and marine and coastal programs
focusing on widespread habitats (e.g. mangroves) and migratory species such as fish, turtles and
manatees.
10.5.2 Key Strategic Funding Initiatives
There are many climate-related funding initiatives across the hotspot and most countries are
involved in global processes under the UNFCCC REDD+ (Reducing Emissions from
Deforestation and Forest Degradation) processes. This aims to create a financial value for the

238
carbon stored in forests, offering incentives for developing countries to reduce emissions from
forested lands and to invest in low-carbon paths to sustainable forest development and
enhancement of forest carbon stocks. A variety of donor, government, NGO and private sector
initiatives and partnerships operate in the hotspot to use these mechanisms to try to achieve
sustainable biodiversity conservation financing.
Many large-scale KBA conservation programs are establishing Trust Funds for specific sites
using a variety of funding mechanisms (Carbon trading, commodities, private sector finance
etc.). For example, in Côte d’Ivoire, the GEF World Bank Protected Area Management Project
(PCGAP) has the objective: “To enhance sustainable management of national parks and reserves
in Ivory Coast by reversing trends of biodiversity loss, increasing the area of key ecosystems
under protection and strengthening the capacity for resources management”. One component
includes the revitalization of a private foundation (initially established prior to recent conflicts,
and based on an initial endowment of USD 57 million in IDA loans and GEF funding), which
will fundraise and manage the financing for the long-term management of parks and reserves in
post-conflict Côte d’Ivoire. Additional examples are given below.
The EU Global Climate Change Alliance (GCCA) was launched in 2007 to support developing
countries in climate change mitigation and adaptation activities. Under the REDD+ component,
the GCCA supports projects to reduce deforestation, create incentives for forest protection and
preserve livelihoods and ecosystems that depend on forests. Several bilateral donors in the
hotspot also have specific climate funding initiatives (see Table 10.3).
The USAID resources for integrating biodiversity and REDD+ in the region program will
incorporate action for climate change adaptation, biodiversity-wildlife trafficking, mangroves
and coastal area conservation under a new West Africa Biodiversity and Climate Change (WA-
BiCC) Program, which launched in late 2015. The Tropical Forest Alliance (TFA) 2020 is a
public-private alliance launched in 2012 by the US Government and the Consumer Goods
Forum, a network of more than 400 global companies with over USD 3 trillion in annual sales.
TFA 2020 partners are committed to taking action to reduce tropical deforestation tied to
production of global commodities including palm oil, soy, beef, and pulp and paper (all major
global drivers of tropical deforestation). TFA 2020 partners include developing country and
industrialized country governments, businesses, and CSOs. USAID contributions to TFA 2020
include support for a new Global Forest Watch 2.0 tool, which will use satellite monitoring, tree
cover loss alert systems, integrated maps with information on current land use and major
concessions, and mobile technology to provide near real-time monitoring of tropical forests.
GFW 2.0 is being developed by WRI, and USAID will work with partner countries to ensure
they have the capacity to access and use the tool.
RSPB and BirdLife International in Sierra Leone and FFI in Liberia and Guinea are also
supporting government and NGO partnerships in REDD+ processes, gaining access to carbon
trading markets and financing mechanisms and to commodity markets (e.g. cacao) to finance
conservation and community livelihoods in the hotspot. In Sierra Leone, early work in Gola
Rainforest National Park was supported by the CI Global Conservation Fund, the Darwin
Initiative, the EU and FFEM. RSPB is currently leading the development of the Gola REDD
project which will result in the sale of carbon credits on the voluntary market under two leading

239
standards (VCS and CCB) in 2015. The GRNP will be managed by a non-profit Company
Limited by Guarantee.
The World Bank Program on Forests (PROFOR) is working with the Forest Development
Authority and other partners on a ‘National Biodiversity Offset Scheme: A Road Map for
Liberia’. The program is exploring the feasibility of implementing a national biodiversity offset
scheme in Liberia to help minimize adverse impacts on biodiversity resulting from mining. The
proposed scheme would follow the “no net loss or net gain in biodiversity” approach and is
investigating the feasibility of a national scheme that would finance the whole system of
Proposed Protected Areas (Protected areas) in Liberia. This would cover currently unprotected
KBAs such as Wonegizi mountains (LBR17) and link to current REDD and carbon credit/
financing approaches (Wonegizi mountains is a REDD+ pilot site, supported by FFI working
with FDA). The ultimate aim will be to establish a Conservation Trust Fund to finance the
national system of protected areas.
The Great Green Wall Initiative is a pan-African proposal to “green” a corridor of land across the
continent south of the Sahara in order to combat desertification and tackle poverty and soil
degradation. It was initially championed by the Presidents of Nigeria and Senegal with a focus
on the Sahel and support from the World Bank, African Union and African Development Bank.
GEF involvement has resulted in a broader approach of relevance to the hotspot in some
countries and regions. The focus is on sustainable land and water management (SLWM) and
adaptation in targeted landscapes and in climate vulnerable areas in West Africa and the Sahel
(total USD 100 million). In Nigeria this approach is being applied at a catchment scale (including
in the hotspot) under the national GEF-GGW initiative: the Nigeria Erosion and Watershed
Management Project (NEWMAP). NEWMAP also links to catchments outside of its immediate
focal area, such as the GEF SPWA Niger Delta Biodiversity Project which aims to mainstream
biodiversity in to the oil and gas sector in the Niger Delta and to establish and capitalize a Niger
Delta Biodiversity Trust under a private sector-government-community partnership.
A USD 1 million MacArthur Foundation ‘Award for Creative and Effective Institutions’ was
made to Forest Trends in 2015 (‘Bringing the value of forests into the modern economy’). Forest
Trends created the international specialist Katoomba Group, to build market capacity and
payments for ecosystem services and pioneered “no net loss” (the first global biodiversity offset
standard to focus businesses, governments, financial institutions, and civil society on
conservation). Forest Trends focuses on local communities and livelihoods by ‘enabling
Indigenous People to participate in environmental markets and benefit from preserving the
forests they live in and around’ (including payment or compensation mechanisms to local
communities to maintain catchment protection or forest cover under carbon market agreements).
They run the global platform ‘Ecosystem Marketplace’ to provide transparent information about
ecosystem values and market transactions in these emerging markets. Forest Trends have worked
with the private sector in Ghana.
A USAID initiative, The “Feed the Future Ebola Recovery Partnership” is being established in
2015 to engage and mobilize the expertise, infrastructures and resources of the private sector,
foundations, and other partners, including in-country partners, to achieve a rapid and robust
recovery from the Ebola outbreak and foster broad-based food security in the short, medium and
long term in Liberia, Guinea and Sierra Leone. The three key objectives relate directly to food

240
production and availability; economic access and SMEs; nutritional/ food security and reducing
consumer vulnerability. There are no clear biodiversity objectives within this but there may be
opportunities for funding for initiatives, which combine food security objectives with sustainable
natural resource management, alternatives to bushmeat etc. Other multi- and bilateral
development aid agencies (e.g. DFID in the UK) are developing post-Ebola response programs
which may have the potential to support conservation as well as livelihoods and food security
objectives. However, caution has been expressed about the risk of over-emphasis of these links,
particularly in a funding context (see Section 10.5.4).
10.5.3 Efficiency and Effectiveness of Conservation Investments by Donor Type
Efficiency and effectiveness of conservation investments by donor type were assessed and
ranked collectively by the stakeholders at the final consultation workshops that took place in
Monrovia, Liberia and Limbé, Cameroon in August-September 2015 (Table 10.6). The
stakeholders were requested to consider the efficiency (defined as the accomplishment of a goal
with the least wastage of time and effort) and the effectiveness (defined as the production of the
intended or expected results) of funds made available to CSOs for biodiversity conservation in
the hotspot.
There are noticeable differences between the two subregions when considering the types of
donors considered as most efficient versus most effective. In the Upper Guinean Forests
subregion, the most efficient type of donor was felt to be private foundations, while the most
effective in terms of impact was considered to be bilateral donors. For the stakeholders in the
Lower Guinean Forests subregion, funds from NGOs were considered to be the most accessible
to CSOs while bilateral donor funding was ranked as having the greatest positive impact for
biodiversity conservation.
Table 10.6 Evaluation of Donor Types by Efficiency and Effectiveness for the Upper and Lower Guinean Forest Subregions
Donor Type Upper Guinean Forests Subregion Lower Guinean Forests Subregion
Efficiency Effectiveness Efficiency Effectiveness
Multilateral 2 3 6 13
Bilateral 1 4 4 3
Foundation 4 2 1 2
Trust Fund
1
Private Sector 2 1 3 3
Governmental 2
NGO
10 2
Note: The figures in the table represent the number of stakeholders who assessed a particular donor type as being
most efficient or most effective.
Nevertheless, when asked to explain their choices, the stakeholders used very similar
justifications. First, they explained that procedures to access funds from private foundations and
NGOs are fast (funds are usualy released within one year after application) and more adapted to
the capacities of the local CSOs. However, the average size of grants rarely exceeds
USD 500,000, and thus projects are more limited in scope. Their second justification was that
multilateral and bilateral donors (excluding their potential small grants programs) are often “out
of reach” for local CSOs and potentially for international ones as well, unless they can form large

241
consortia or partnerships. These funds are often disbursed to and through government
institutions, where they can have a much more widespread impact as they can encompass
transboundary projects, infrastructure development and negociations / implemention of policies.
Modalities for accessing funds are thus crucial for CSO engagement. Simplified, fast and flexible
procedures seemed to be more in line with their capacities both in terms of applying for funds
and also in terms of managing them and reporting to the donor.
10.5.4 Gap Analysis
Gaps in investment in conservation in the hotspot include both geographical gaps (priority KBAs
with no or insufficient funding) and thematic gaps (for example lack of capacity to implement
conservation effectively). An analysis of the distribution of conservation investment among
KBAs (based upon data collated from donor and project websites, verified through the
stakeholder consultation process) showed that four-fifths of the KBAs in the hotspot received no
known external funding over the last five years (Table 10.7). Most of the KBAs to receive
external funding received between one and four grants over the period, while only three KBAs
received five or more grants, comprising Parc National de Taï et Réserve de Faune du N’Zo
(CIV11), Sapo National Park (LBR14) and Gola Forest Reserve (SLE1).
Table 10.7 International Donor Projects at KBAs in the Guinean Forests Hotspot
KBAs with no Identified Projects
KBAs with 1 to 4 Identified Projects
KBAs with 5 or More Identified Projects
Number of KBAs
106 28 3 Parc National de Taï et Réserve de Faune du N’Zo (CIV11) Sapo National Park (LBR14) Gola Forest Reserve (SLE1)
Source: Data on conservation investments collated from donor websites and other sources.
The only ‘thematic gap’ revealed through the consultation process is the lack of secure (long-
term) funding and the difficulties of obtaining sufficient funding for effective conservation,
especially for large and complex projects (for example in Equatorial Guinea and Bioko the
difficulty of obtaining secure, “sustainable” funding or follow-on funds for KBA initiatives at the
end of the funding cycle – even for management planning for nationally protected areas).
Similarly in Sierra Leone, Yawri Bay (SLE9) is another KBA listed in the consultation as newly
established (or in the final stages of establishment) but with no funding to implement any
conservation management.
The Ebola crisis in several of the hotspot countries has brought an added burden on many KBA
conservation initiatives, and the flexible support from both INGOs and multi- and bilateral
donors during the crisis has proved essential. In Sierra Leone, the RSPB and EU have continued
to pay salaries to staff in the Gola Rainforest National Park project while field activities were
suspended due to the Ebola crisis. They have also contributed to the fight against Ebola in the
area in and around Kenema through use of project vehicles and other support to local Ebola
coordination efforts. Such support is essential to local communities and helps to cement good
partnerships between projects and communities for longer-term conservation initiatives. The
impacts of the crisis on national NGOs and CBOs have been considerable. The national NGOs,

242
Conservation Society of Sierra Leone and Society for the Conservation of Nature in Liberia have
both maintained activities in the capitals, despite having to suspend all field activities and to deal
with the personal crises of their staff. Both CSSL and SCNL have run campaigns advocating
against the eating of bushmeat, linking together the health dangers and conservation needs of
bushmeat species in the hotspot. However, their programs, and especially their fundraising
activities, have been seriously affected and there will be a great need in the post-Ebola months
and years for support to civil society in all affected countries to ensure that their conservation
activities can be reinvigorated and sustained. It is likely that the attention of the development aid
community and donors ‘post-Ebola’ will be more focused on health, education and other
immediate development needs so it will be a priority for conservation donors and agencies to
ensure adequate funding for biodiversity conservation and priority sites in the hotspot. Although
there are potential crossovers (and funding opportunities) linking conservation and health
(Ebola) in the hotspot, caution has also been urged that the Ebola epidemic should not be used as
a Trojan horse to achieve conservation ends.
Transboundary conservation program implementation also represents a gap in conservation
investment. Trans-boundary projects require considerable investment in terms of time and money
to negotiate and agree acceptable cross-border solutions and to ensure real integration across
national boundaries and between different local communities. There are almost no funded
initiatives in the hotspot with a sufficient long-term perspective and the funding to ensure the
achievement of successful, durable trans-boundary initiatives.
10.6 Conclusion
National NGOs and CBOs in particular undergo a constant struggle to secure funds for their core
operational costs of staffing, running their organizations, managing finances and building their
capacity to carry out biodiversity conservation. They are frequently caught in a cycle of applying
for specific project funds but failing to cost their own core funding needs adequately within
project budgets and/or taking on projects and donor funding which do not support their own
priorities and needs, in order to try to keep afloat financially afloat. There are very few
investments directed entirely at capacity building for NGOs (only the Arcadia fund in the hotspot
region and a few larger INGOs (RSPB and BirdLife, FFI) provide core funding and direct
capacity building support to national NGOs). Many decades of core investment are required to
build strong national NGOs capable of accessing and using donor funds effectively and forming
partnerships with governments and the private sector. The hotspot region has a past and recent
history of conflict and unrest in many regions, and has recently experienced a severe Ebola
crisis. In this CSOs are often best placed to ensure the sustainability of conservation initiatives,
through working effectively with local communities. However, this requires strong external
support in capacity building and the securing of long-term funding to enable NGOs and CBOs to
sustain their operations and impacts, and to engage effectively with larger players, such as
governments and the private sector.
11. CEPF’S NICHE FOR INVESTMENT The preceding chapters describe the context for biodiversity conservation in the Guinean Forests
of West Africa Biodiversity Hotspot, in terms of regional background, conservation outcomes,

243
social and legal context, CSO presence and capacity, threats to biodiversity and patterns in
investment. The situational analysis informs an investment niche for CEPF, where the Fund can
focus its resources most effectively on engaging and strengthening civil society to bring about
biodiversity conservation.
11.1 Key Findings
Chapters 3 and 4 review the biological and ecological context and highlight that the hotspot
harbors impressive levels of biodiversity, including numerous endemic species, making it a
conservation priority at the global scale. At the national and local levels, the hotspot’s forests and
freshwater habitats provide a wide range of ecosystem services to millions of people, who, for
the most part, are considered to be among the poorest globally. The provision of goods and
materials from the hotspot’s forests, including medicines, housing materials and food, is quite
high, and is thought to contribute around 25 to 35 percent of the non-cash income to rural
households. In addition, the hotspot’s forests protect the catchments of rivers providing key
sources of water for irrigation and domestic use. For instance, Western Area Peninsula Non-
hunting Forest Reserve (SLE8), protects the catchment of the two reservoirs supplying Freetown,
the capital of Sierra Leone, while Atewa Range Forest Reserve (GHA3) protects the three main
rivers that supply Ghana’s capital, Accra.
In terms of conservation outcomes, Chapter 4 reveals that at least 936 species found in the
hotspot are threatened with extinction globally, including 135 species assessed as Critically
Endangered: the highest category of threat. Major factors threatening species include
unsustainable hunting, deforestation due to agricultural expansion and logging, and difficulties in
enforcing laws on illegal hunting and incidental catches. The ecosystem profile also sets
conservation outcomes at the site level, with 137 KBAs having been identified to date across the
hotspot, comprising 124 terrestrial and 13 freshwater KBAs, with some overlap between the two.
These KBAs have been ranked according to their relative biological importance, as an input to
the prioritization process. The Upper Guinean Forests subregion contains 36 terrestrial KBAs
and eight freshwater KBAs of high relative biological importance (i.e. Priority 1 and 2 sites),
while the Lower Guinean Forests subregion contains 28 and five, respectively. In addition to the
KBAs, the ecosystem profile also defines nine landscape-scale conservation corridors within the
hotspot, spanning six countries in the Upper Guinean Forests subregion and two in the Lower
Guinean Forests subregion. These corridors provide the basis for targeting conservation
investments at a spatial scale greater than that of the individual site, particularly with regard to
integrating biodiversity into sectoral development plans and policies.
The socioeconomic context for conservation in the hotspot is set out in Chapter 5. The main
drivers of growth in the region are trade (Ghana), agriculture (Benin, Côte d’Ivoire, São Tomé
and Príncipe, and Togo), the tertiary sector including transport (Cameroon), oil and gas
production (Equatorial Guinea, Nigeria), and mining (Guinea, Liberia, Sierra Leone). In hotspot
countries, forest resources are vital for energy, medicine, and income generation, as well as for
the nutrition provided to local people by wild foods. Bushmeat is arguably the most valuable
NTFP. The socioeconomic context of the hotspot has continued to shape its landscapes, with
various implications for biodiversity conservation. Land tenure in the hotspot’s countries is
typically a blend of customary and statutory land rights. Several hotspot countries have suffered

244
decades of civil unrest, placing them essentially off-limits for tourism, while the recent Ebola
outbreak in Guinea, Liberia and Sierra Leone has also negatively affected tourism, as well as the
economy more generally; the effects will continue to be felt for years to come. Others countries,
such as Cameroon, Ghana and Nigeria, continue to offer ecotourism options within their
remaining forests.
Chapter 6 shows that the governments of the hotspot countries are signatories to a range of
international agreements, including multilateral environmental agreements, and that these have
been incorporated into domestic policy, including through the development of National
Biodiversity Strategies and Action Plans. At the regional level, the countries within the hotspot
are all either Member State of ECOWAS or ECCAS. Regional priorities for the conservation and
sustainable management of forest resources are defined by the convergence plans of ECOWAS
and COMIFAC. These agreements influence national policy and the development of national
laws, and most of countries in the hotspot have policies, laws and regulations in place around
protected areas, forestry, environmental impact assessment, and poverty reduction. Some
countries also have laws concerning land-use planning, community conservation, transboundary
conservation, sustainable financing for species conservation, and decentralization of decision-
making. In countries where they exist, these policy provisions create legal space for CSOs to
engage in biodiversity conservation. One challenge, however, is to develop a comprehensive
protected area network that supports prevailing customary land ownership and resource tenure. It
will also be important to strengthen the capacity of government officials and manage conflicts
over alterative land use practices.
In most parts of the hotspot, the degree of ecological connectivity among forest patches is
declining, and the remaining forest is increasingly being restricted to the current network of
protected areas and forest reserves. Work to improve forest management, enhance forest
certification and reduce illegality in the forest sector is important across the hotspot. Thus,
promoting community-based forest management in the countries where the legal framework
allows it (e.g. Cameroon, Ghana and Sierra Leone) will be an important element of any
conservation strategy for the hotspot. In addition, supporting and strengthening the ongoing
process of decentralization will also be important, to enhance the transfer of decision-making
power from central to local governments. Targeted action plans for key species, such as
chimpanzee and western gorilla, will also require significant funding to implement, and this
cannot rely indefinitely on international donors. Finally, despite the development of policies and
laws conducive to biodiversity conservation over the past 20 years in the hotspot countries, the
enforcement capacity of implementing agencies is limited by financial and human constraints in
most countries in the region, in some cases severely.
As Chapter 7 shows, both national and international CSOs are contributing to the implementation
of national conservation policies in the hotspot countries, and thereby helping their governments
deliver on the Aichi Targets, the SDGs and other international commitments. For example, a
number of CSOs have shown significant potential for implementing conservation strategies in
the hotspot, with regard to forest governance, species conservation and, especially, climate
change. Over the last decade, climate change adaptation and mitigation have been the most
attractive themes for CSOs engaged in conservation-related fields. This is probably so because
international donors have increasingly made climate change a funding priority.

245
Despite the complex working environment, CSOs continue to play a key role in supporting and
complementing government policy and programs, especially at the local and sub-national levels,
where decentralization has expanded local government mandates. However, capacity limitations
remain a major barrier to the civil society sector playing a more effective role in the protection
and sustainable management of natural resources in the hotspot. Moreover, most local CSOs in
the hotspot have little or no experience of working with the private sector to advance a
sustainable development agenda. This lack of engagement with the private sector is mainly due
to inadequate technical capacity among CSOs, which is a limitation that will need to be
addressed as a priority, especially since the hotspot harbors diverse mineral and hydrocarbon
resources. Most local CSOs also lack the institutional and technical capacities to manage large or
complex conservation projects, and lack access to sustainable sources of funding to address the
various threats to biodiversity conservation that are present in the hotspot. In contrast, the
international CSOs operating in the hotspot countries typically have adequate institutional
capacities, with relevant technical expertise, although some of them could benefit from
additional financial resources. There are a number of areas where international CSOs can
demonstrate added value or unique capabilities, including with regard to mentoring and capacity
building for local partner organizations, coordinating transboundary and regional cooperation
and information flows, and design of sustainable financing mechanisms.
Chapter 8 reviews threats to species, sites and corridors within the hotspot and ranks them
according to their severity. The top-ranked threat is unsustainable biological resource use, which
takes the form of bushmeat hunting, logging and overfishing. The second-ranked threat is
unsustainable agriculture and aquaculture. Agricultural expansion is a direct threat to terrestrial
biodiversity, as forests are converted to agricultural lands. This is driven by a combination of
human population growth within the hotspot, and international demand for and investment in
agricultural commodities, such as rubber, cacao and palm oil. These crops are produced through
a mixed of smallholder farming and, increasingly, large-scale plantations owned by
agribusinesses. Agriculture is also an indirect threat to freshwater biodiversity. For example,
freshwater ecosystems in the lower Niger River are threatened by drought and habitat loss due to
increased offtake of water for irrigation.
Energy production and mining was ranked joint third by the stakeholder consulted during the
profiling process. This threat takes a number of forms, including oil and gas production,
hydropower generation, fuelwood and charcoal production, and mining. With the exception of
fuelwood and charcoal production, these threats do not tend to be widespread but, rather,
restricted to particular locations. Nevertheless, their direct impacts in these locations can be very
severe, and they can have indirect impacts across a wide area. Energy production and mining
shares the third rank with human instrusions and disturbance. This threat category includes
impacts on biodiversity arising from recreational activities (e.g. tourism in protected areas), war
and civil unrest, and work and other human activities. A related threat, identified in Nigeria, is
ongoing conflict and insecurity in the Niger Delta. Other threats to biodiversity in the hotspot
include climate change, pollution, and development of residential and commercial settlements.
Chapter 9 provides a review of the climate change context for conservation in the Guinean
Forests. The hotspot includes two of Africa’s six main climatic zones, namely the ‘humid’ and
‘subhumid’ zones. The wettest hotspot countries in terms of rainfall are Equatorial Guinea,

246
Liberia and Sierra Leone. Climat change is starting to be observed in the hotspot. The overall
picture is one of increasing temperatures, decreasing and less predictable rainfall and sea-level
rise. These trends are predicted to have direct impacts on biodiversity, leading to changes in
species’ distributions and placing increased stress on ecosystems already under pressure from the
human activities described in Chapter 8. There are currently few studies from the region looking
at the response of species and ecosystems to climate change. More readily observable are the
indirect impacts of climate change on biodiversity, arising from changes in agricultural and
resource use patterns and, ultimately, displacement of human populations in response to climate
change. For example, decrease in agricultural productivity is likely to increase dependence on
wild natural resources, such as bushmeat and edible wild plants. A combination of widespread
poverty, recurrent droughts, inequitable land distribution, and agriculture with a high level of
dependence on rain makes the hotspot countries highly vulnerable to climate change and
variability. To combat climate change impacts, each hotspot country has developed national
action plans, strategies and/or communications describing the most pressing climate change
problems and how they expect to tackle them.
The assessment of current conservation investment in Chapter 10 reveals that funding is
available for direct conservation of species and habitats, as well as for broader ‘themes’, which
have potential to indirectly benefit biodiversity conservation, for example climate change,
poverty reduction, etc. Although national governments provided funding for biodiversity
conservation, available data indicate that these are limited, as conservation is a relatively low
budgetary priority. Grants from multilateral and bilateral donor organizations are by far the
largest source of conservation funding in the hotspot. A variety of philanthropic foundations and
trusts in North America, Europe and the Middle East also provide conservation investment in the
hotspot, principally through grants to international and local NGOs. There are private sector
companies that offer to ‘connect’ conservation projects (often NGO-led) to private sector
finance. Other private sector initiatives offer to link communities and forest biodiversity
conservation with potential investors and financial markets.
The level of conservation investment the hotspot as a whole is not insignificant but the picture is
very patchy, with many KBAs and corridors receiving very limited or zero funding. The
assessment identifies those sites that have received no funding over the last five years, or
otherwise represent significant funding gaps. The assessment also highlights the lack of secure
long-term funding for conservation, which is a major barrier to sustaining effective management
on the ground and retaining the trust of communities engaged in conservation initiatives and
related livelihood activities. There remain very few conservation investments directly targeting
capacity building for local communities, CSOs and government agencies. Yet, lack of capacity at
the field level, combined with shortage of long-term funding, remain the major obstacles to
sustained and effective conservation initiatives in the hotspot.
11.2 CEPF Niche The countries of the Guinean Forests of West Africa Hotspot are experiencing unprecedented
economic growth, based on extractive industries, agribusiness and infrastructure expansion,
which brings the promise of development to millions of people, but also come with potentially
large environmental and social costs. At the same time, the benefits of development are not

247
shared equitably across the hotspot, with large sections of the rural population practicing
subsistence agriculture and depending heavily on extractive uses of natural resources. Improving
the conservation prospects for species and ecosystems in the hotspot will require strategies that
achieve a balance between economic development and biodiversity conservation objectives,
while ensuring that rural people, especially women, can benefit from sustainable and equitable
development. In this context, and to meaningfully address identified gaps in current conservation
investment, CEPF will promote the conservation of globally important biodiversity at species,
site and corridor scales, while promoting development models that are environmentally
sustainable, socially equitable, and well aligned with national conservation priorities.
To do this, the CEPF investment niche is to provide CSOs at grassroots, national and
international levels with the tools, capacity and resources to establish and sustain multi-
stakeholder partnerships that demonstrate models for sustainable, pro-poor growth and
achieve priority conservation outcomes in the Guinean Forests of West Africa Hotspot.
Local CSOs are very knowledgeable because they understand the local and national context of
biodiversity conservation and sustainable development, as well as the needs and aspirations of
local people. However, they have shown low capacity for fundraising, sustainable financing and
private sector engagement. Involving international CSOs in the delivery of the program, where
they demonstrate clear added value, will facilitate capacity building of local CSOs, to ensure
policy reform and implementation of conservation actions on the ground. CEPF, through its
grantmaking and RIT, will also catalyze and support multi-stakeholder partnerships, among
governmental agencies, private sector companies, CSOs and local communities and their
associations, while at the same time establishing long-term funding mechanisms for
conservation, especially ones that take advantage of growing markets for biodiversity and
ecosystem services.
Based upon the situational analysis presented in Chapters 3 to 10, and informed by the results of
the stakeholder consultations, the CEPF investment niche was defined in three dimensions.
Geographic priorities for investment at the site scale were defined as a set of ‘priority sites’,
selecting from among the list of KBAs identified in the hotspot (Table 4.4). Geographic priorities
for investment at the landscape scale were defined as a set of ‘conservation corridors’, providing
for conservation actions related to development and land-use planning and policy (Table 4.12).
Thematic priorities for investment were defined as a set of investment priorities grouped under
broad strategic directions by identifying fields of work that: contribute to the conservation of
globally important biodiversity; fill gaps in existing conservation investment; address high
priority threats; focus where civil society can make the most effective contribution to
conservation; and, where appropriate, deliver human well-being benefits. In order not to disperse
investment too thinly, and to maximize the chances of achieving a transformational impact on
particular issues, CEPF’s investments will specifically prioritize three development sectors with
large biodiversity footprints, namely agriculture, forestry, and mining. The investment strategy is
intended to guide investments by other funders, either through the mechanisms put in place by
CEPF or in parallel. These other investments may align with those of CEPF by focusing on a
different set of geographic priorities, responding to the impacts of other sectors or supporting
complementary actions for the same geographic and thematic priorities.

248
11.3 Theory of Change The analysis presented in the earlier chapters reveals that the Guinean Forests Hotspot is
characterized by diverse socio-economic, cultural and political conditions, and that conservation
and sustainable use of biodiversity is influenced by many actors, with varied interests and
aspirations. Remaining natural ecosystems remain under pressure and will continue to be
degraded and fragmented in the absence of more effective responses. At the same time,
experience with conservation efforts in the hotspot to date, including but not limited to earlier
investments by CEPF in the Upper Guinean Forests, points the way towards conservation
strategies that have the promise of success. The theory of change takes into consideration these
different conditions, actors, challenges and opportunities, and is grounded in on-the-ground
realities, as understood by the stakeholders consulted during the profiling process. It seeks to
address the CEPF investment niche defined in Section 11.2, namely to support CSO at different
levels with the necessary tools, capacity and resources to create sustainable partnerships and
resources to achieve priority conservation outcomes.
The theory of change underlying the CEPF niche is that local CSOs have untapped potential that,
if released, can contribute to reconciling biodiversity conservation with development agendas at
different scales and improving natural resources governance in the Guinean Forests Hotspot. To
realize the potential of civil society as a force for sustainable, pro-poor growth in the hotspot,
CEPF investment will need to be delivered in a strategic manner, with grant resources linked to
capacity building and partnership building across sectors, to leverage complementary
capabilities, strengthen networks across borders, and facilitate transboundary conservation and
exchange of information and lessons learned. At the same time, conservation efforts must be
relevant to local communities and incorporate meaningful benefit sharing mechanisms that
ensure the participation of vulnerable groups, especially Indigenous People and women. Without
responding to the legitimate development needs and aspirations of local communities, it is
unlikely that conservation initiatives will reach a level of social acceptance that ensures their
long-term sustainability. As well as ensuring relevance to local communities and incorporating
capacity building for civil society actors, CEPF investments must also ensure ecological
connectivity at the landscape scale, in order to maintain and restore ecosystem function, maintain
viable species populations, buffer sites against the effects of fragmentation and isolation, and
enhance resilience to the impacts of climate change. In other words, investments in species-
focused and site-based conservation should not be made in isolation but with consideration to
their contributions to connectivity at the corridor-scale.
Focusing on connectivity, community and capacity will require the development and
consolidation of robust partnerships, including not only civil society but also other partners like
government, private sector and the donor community. There will be a need to explore
opportunities to leverage additional funding and/or align with other initiatives from the very
beginning of the investment phase, to complement the resources CEPF is able to marshal and
ensure sustainability beyond the end of CEPF funding to the hotspot. There will also be a need to
make sure that CEPF’s limited resources are made effective use of, including by monitoring the
effectiveness of different approaches, facilitating experience exchange among grantees, and
promoting replication of good practice. In these regards, the role of the RIT will be of critical
importance, in building a portfolio of grants whose overall impact is greater than the sum of its

249
parts, and it will need to be resourced accordingly. In addition, to maximize opportunities to
engage local CSOs as grantees, and to take account of the high costs of operating at remote sites
with difficult access, it is proposed that the maximum small grant size for the portfolio be set at
USD 50,000 per grant (which may be one or more years in duration).
12. CEPF INVESTMENT STRATEGY 12.1 Geographic Priorities
This chapter synthesizes the results and feedback from the stakeholder consultation process
(including both workshops and remote consultations) and recommendations from the preceding
chapters to formulate a CEPF investment strategy for the next five years in the Guinean Forests
Hotspot. The information thus analyzed reveals that, although most stakeholders are in dire need
of funds to sustain their conservation efforts, there is limited funding available from donors for
this purpose, and that those resources that are available tend to be difficult for local CSOs to
access. Also, even where funds are available and accessible, donors sometimes find it difficult to
decide where and how to invest effectively in conservation, because of a lack of adequate
empirical data on the needs and priorities of target groups and the values of individual sites. This
lack of information has become a barrier to cost-effective and results-oriented investments,
especially for donors working under tight timeframes and other constraints. This leads to the
conclusion that sound investment decisions require the type of detailed, systematic analysis of
scientific data and contextual information, such as is presented in this ecosystem profile.
Given the fragmented nature of many of the remaining sites of global biodiversity importance
within the hotspot, it is highly desirable that, wherever possible, CEPF-supported projects aim to
maintain or increase the ecological connectivity of these sites, and ideally focus at the landscape
scale, giving focus to the priority corridors identified in this profile.
The nine conservation corridors described in this profile are given in Table 12.1 and Figure 12.1.
These cover a total area of 413,183 km2, equivalent to 66 percent of the hotspot, and range in
size from the Togo Highlands at 6,049 km2 to the Korumpba-Obachap Corridor at 118,675 km
2.
Although four of the corridors are restricted to single countries, five are transboundary and
provide opportunities for coordinated actions across borders. Several conservation corridors also
incorporate a number of entire river basins, from their headwaters to their outflow. These
corridors provide opportunities for basin-wide approaches, extending from high altitude areas to
coastal zones. For instance, reforestation of upland sites may provide downstream benefits to
other sites in the corridor through a reduction in sediment loads.

250
Table 12.1 Conservation Corridors in the Guinean Forests Hotspot
No. Corridor Name Countries Area (km2)
1 Sierra Leone Coastal Corridor Sierra Leone 17,096
2 Lofa-Gola-Mano Complex Sierra Leone, Liberia, Guinea
47,545
3 Mount Nimba Complex Guinea, Côte d’Ivoire, Liberia
6,829
4 Cestos-Sapo-Grebo-Taï-Cavally Corridor
Liberia, Côte d’Ivoire 70,278
5 Bandama River Catchment Côte d’Ivoire 8,389
6 Forest Reserves of Southeastern Côte d’Ivoire and Southwestern Ghana
Côte d’Ivoire, Ghana 72,579
7 Togo Highlands Togo 6,049
8 Lower Niger Delta Nigeria 65,743
9 Korupmba-Obachap Cameroon, Nigeria 118,675
Figure 12.1 Conservation Corridors in the Guinean Forests Hotspot
To promote ecological connectivity within the conservation corridors, it is important to focus on
all sites of biological importance, not only KBAs designated as protected areas but also those

251
under other designations, including within production landscapes. In this regard, it is evident that
all KBAs identified within the corridors warrant attention. Nevertheless, to ensure that CEPF
investments are not spread too thinly, and are thus able to deliver significant, sustained impacts,
it it was necessary to select a set of priority sites, from among the full list of KBAs in the
hotspot, to receive targeted investment (Appendix 5). These priorities allow investments by
CEPF to focus on sites of high global biodiversity value that present good opportunities to
engage civil society in conservation, without duplicating investments by national governments or
international donors.
Two exercises were conducted to identify priority sites from among the full list of KBAs in the
hotspot. First, an initial biological prioritization was conducted, to identify sites of the highest
relative biological importance, based on the principles of irreplaceability and vulnerability (see
Section 4.3.3). Second, during the final stakeholder consultation workshops, expert opinion was
used to identify sites presenting the greatest opportunities for CEPF investment, based upon the
application of a set of standard criteria. Finally, the results of the two exercises were combined,
to produce a final prioritization that took into account both scientific information and expert
opinion. In this way, the priority sites respond to the needs, priorities and aspirations of CSOs
from across the hotspots, while ensuring that CEPF investments remain targeted towards the
conservation of globally important biodiversity.
Eight standard criteria were used to guide deliberations among stakeholders regarding selection
of priority sites for CEPF investment. The first criterion was biological importance. The relative
biological importance of each KBA was determined by an assessment of species-based
vulnerability, species-based irreplaceability and site vulnerability, following the methodology set
out in Section 4.3.3. During the final consultation workshops, it was recognized that a
prioritization system based upon a narrow set of global criteria does not necessarily capture the
full range of values that determine the global biological importance of a site. Consequently, a
number of additional factors were taken into consideration, including importance for emblematic
species, and importance for delivery of realized ecosystem services.
The second criterion was degree of threat. Additional consideration was given to KBAs with site
vulnerability scores that highlighted the presence of major threats, such as large infrastructure
(roads, dams, railways, etc.), agriculture (including agri-business), oil exploration and
exploitation, pipelines, mining, urbanization and climate change. Although there is a clear
association between human population presence and level of threat faced, this factor is
considered to be an underlying driver and is, therefore, considered implicitly in the assessment of
other threat types.
The third criterion was need for additional funding. The level of investment by national and
international donors and governments for conservation of the KBA was taken into account. This
was to understand whether there was a need for CEPF to invest in a particular site, and to avoid
duplicating efforts of other funders operating in the hotspot.
The fourth criterion was management need. Consideration was given to the existence of
management plans, personnel, infrastructure and mechanisms for community engagement and

252
sustainable funding. Since management needs are key factors in sustainable management of
priority sites, preference was given to KBAs where the needs are high.
The fifth criterion was capacity of civil society to engage in conservation at the KBA. This
criterion was applied to data derived from the institutional capacity surveys and consultations
and highlighting the capacity needs of local civil society groups, CBO, etc. These provided
insight into where and how CEPF could invest most effectively to engage and strengthen the
capacity of civil society, especially local organizations, to make sure that they are fully involved
in the implementation of the CEPF conservation outcomes.
The sixth criterion was operational feasibility. This was one of the most important criteria
because it determines whether or not civil society and other actors can effectively work in a
particular site, taking into account the accessibility of particular sites, costs of implemting and
monitoring conservation actions there, and the presence of some security threats, health risks and
legal barriers.
The seventh criterion was opportunity for landscape-scale conservation. This criterion took into
the account the potential for civil society and other actors to work together to achieve
conservation at a landscape-scale through linking KBAs together, including through
transboundary cooperation.
The final criterion was alignment with national priorities. KBAs that were recognized as
priorities in National Biodiversity Strategies and Action Plans and other national policy
documents were given additional priority because they presented opportunities to support hotspot
governments contribute to the Aichi Targets, SDGs and other international commitments, and to
align CEPF support to investments in conservation from national budgets.
These criteria were applied to data collated through the remote stakeholder consultations, using a
scoring system. Based upon this desktop analysis, the 56 KBAs with the highest scores were
presented at the final stakeholder consultations as candidate priority sites, and the assembled
stakeholders were asked to narrow down the list of priority sites for each country, taking into
account the prioritization criteria. At this final stage of stakeholder review, a limited number of
modifications to the KBA list were proposed, by merging or extending KBAs. This resulted in a
final list of 40 priority sites for CEPF investment (Table 12.2).
It is important to be aware that the socio-economic contexts and situations in and around the
priority KBAs can vary widely. For example, in areas such as the Bakossi Mountains (CMR1) in
Cameroon and the Reserva Cientifica de la Caldera de Lubá (GNQ2) on Bioko Island,
inhabitants follow traditional methods of subsistence agriculture and practice small-scale logging
for local purposes, whereas in the Western Area Peninsula Non-hunting Forest Reserve (SLE8)
in Sierra Leone, logging occurs at much greater level, because the sale of fuelwood to inhabitants
of the nearby capital city of Freetown constitutes a major income-generating activity for many
local people. Around Nigeria’s Obudu Plateau (NGA9), farming is becoming a much less
common practice, as much of the younger generation are pursuing education in a bid to change
their vocation, and because tourism is also able to provide some income to local people. Such
socio-economic differences can have implications for the strategies and successes of

253
conservation investements at a given site, and, while such factors were not considered explicitly
in our prioritization process, there will be a need to look into the socio-economic context as part
of the grant making process, and applicants will be asked to consider such factors when seeking
grants.
Table 12.2 Priority Sites for CEPF Investment in the Guinean Forests Hotspot
Code Priority Site Realm Total Area in Hectares
Priority Score
CAMEROON
CMR1 Bakossi Mountains Terrestrial 75,581 1
CMR2 Bali-Ngemba Forest Reserve Terrestrial 899 2
CMR3 Bamboutos Mountains Terrestrial 7,396 1
CMR6 Mbi Crater Faunal Reserve - Mbingo forest Terrestrial 3,233 1
CMR12 Mount Cameroon and Mokoko-Onge Terrestrial 107,143 1
CMR15 Mount Oku Terrestrial 16,353 1
CMR16 Mount Rata and Rumpi Hills Forest Reserve Terrestrial 45,200 1
CMR18 Tchabal Mbabo Terrestrial 312,347 1
CMR19 Yabassi Terrestrial 264,867 2
fw1 Lake Barombi Mbo and surrounding catchments Freshwater 176,536 1
CÔTE D’IVOIRE
CIV3 Forêt Classée de Cavally et Goin - Débé Terrestrial 197,925 2
EQUATORIAL GUINEA
GNQ1 Annobón Terrestrial 2,871 1
GNQ2 Reserva Cientifica de la Caldera de Lubá Terrestrial 51,075 3
GNQ3 Parque Nacional del Pico de Basilé Terrestrial 32,256 1
GHANA
GHA3 Atewa Range Forest Reserve Terrestrial 21,111 2
GHA9 Cape Three Points Forest Reserve Terrestrial 4,545 2
GHA29 Tano-Offin Forest Reserve Terrestrial 43,061 2
GUINEA
GIN6 Konkouré Terrestrial 45,744 1
LIBERIA
LBR1 Cestos - Senkwen Terrestrial 350,405 2
LBR2 Cestos/Gbi Area Terrestrial 316,490 4
LBR7 Grebo Terrestrial 282,195 2
LBR11 Lofa-Mano Complex Terrestrial 437,854 2
LBR12 Nimba mountains Terrestrial 13,254 2
LBR14 Sapo National Park Terrestrial 155,084 2

254
Code Priority Site Realm Total Area in Hectares
Priority Score
LBR17 Wonegizi mountains Terrestrial 28,868 2
LBR18 Zwedru Terrestrial 64,458 1
NIGERIA
NGA4 Cross River National Park: Oban Division Terrestrial 268,952 3
NGA5 Gashaka-Gumti National Park Terrestrial 586,803 4
NGA7 Mbe Mountains and Cross River National Park: Okwangwo Division Terrestrial 95,288 2
NGA9 Obudu Plateau Terrestrial 70,743 2
fw10 South East Niger Delta - near Calabar Freshwater 269,451 2
fw13 West Niger Delta Freshwater 493,149 2
SÃO TOMÉ AND PRÍNCIPE
STP1 Parque Natural Obô do Príncipe Terrestrial 5,670 1
STP2 Parque Natural Obô de São Tomé e Zona Tampão Terrestrial 44,830 1
STP3 Zona Ecológica dos Mangais do Rio Malanza Terrestrial 229 2
STP4 Zona Ecológica da Praia das Conchas Terrestrial 522 1
SIERRA LEONE
SLE8 Western Area Peninsula Non-hunting Forest Reserve Terrestrial 16,414 1
SLE9 Yawri Bay Terrestrial 54,674 2
fw6 Gbangbaia River Basin Freshwater 266,478 2
fw8 Rhombe Swamp and Mouth of Little and Great Scarcies Rivers Freshwater 88,460 1
The priority sites range in size from the 229 hectare Zona Ecológica dos Mangais do Rio
Malanza (STP3) in São Tomé and Príncipe to the 586,803 hectare Gashaka-Gumti National Park
(NGA5) in Nigeria. Taken together, the 40 priority sites cover 53,184 km2, equivalent to nine
percent of the total area of the hotspot (Figures 12.2 and 12.3).
There are 17 priority sites in the Upper Guinean Forests, comprising 15 terrestrial KBAs and two
freshwater KBAs. The largest concentration is in Liberia, including five sites adjacent to
neighboring countries, which provide opportunities for transboundary cooperation. Another
concentration is in the coastal zone of Sierra Leone and neighboring Guinea, which provides
opportunities for conservation of mangroves and other important coastal ecosystems, as well
development of payment for ecosystem service mechanisms.
There are 23 priority sites in the Lower Guinean Forests, comprising 20 terrestrial KBAs and
three freshwater KBAs. Most of the priority sites are located along the chain of volcanic
mountains that stretches across northwestern Cameroon and into the Gulf of Guinea. These sites
all support localized endemism: those in Equatorial Guinea and São Tomé and Príncipe because
they are oceanic islands; and those in Cameroon because they are islands of montane habitat.
There is another concentration of priority sites along the border between Cameroon and Nigeria,
which, again, provides opportunities for transboundary cooperation.

255
Figure 12.2 Priority Sites for CEPF Investment in the Upper Guinean Forests Subregion
The 40 priority KBAs represent a mix of protected areas in need of management improvement
and strengthened community participation in conservation, and areas outside of protected areas
that are very vulnerable to threats and in need of conservation management. In most cases, the
conservation need for these ‘unprotected’ sites is not for inclusion within national protected area
systems (which are severly underfunded, meaning that expansion would be likely to result in the
creation of ‘paper parks’) but for innovative, locally appropriate conservation models that
involve communities, local government and, where relevant, private sector actors in
collaborative actions. Six priority sites are wholly included within protected areas in IUCN
categories I to IV, and three have between 25 and 75 percent of their area included. The
remaining 31 priority sites are not included within protected areas in IUCN categories I to IV,
although some are under other management designations at least nominally consistent with
biodiversity conservation, such as forest reserve (forêt classée).
Based on the results of the initial biological prioritization, 21 terrestrial and six freshwater KBAs
were assigned the highest priority score. These sites are the highest biological priorities for
conservation in the hotspot, because the loss of any of them would result in the global extinction
of at least one species (Table 4.10). Seventeen of these KBAs were included in the final list of
priority sites agreed during the final stakeholder consultations. Five of the exceptions were in

256
Cameroon, which, with 10 priority sites selected, more than for any other country, was
considered to present adequate opportunities for engaging civil society in conservation of the
highest global conservation priorities. Another exception was Gola Forest Reserve (SLE1),
which was considered to have a relatively low need for additional conservation investment, due
to major past investments by the European Union, and a planned voluntary carbon offset.
Finally, four Priority 1 freshwater KBAs were not selected as priority sites for various reasons,
including that stakeholders considered them to have limited opportunities for engaging CSOs in
their conservation.
Figure 12.3 Priority Sites for CEPF Investment in the Lower Guinean Forests Subregion
Of the remaining 23 priority sites, 19 were assigned a priority score of 2. The remaining four
were all included because stakeholders at the final consultation workshops considered them to
have high relative biological importance that was not well captured by the prioritization scheme,
including important populations of primates and other emblematic species.
Some of the KBAs not selected as priority sites were excluded mainly because of lack of
information. In addition, several candidate KBA sites were proposed during the final consultation
workshops, which had not been identified during earlier exercises. This indicates that there is a
need to fill knowledge gaps and integrate new information into the identification of KBAs and,

257
eventually, an update of priority sites for CEPF investment strategy. Opportunities for doing so
may arise at a later stage of the investment process or during a future update of the ecosystem
profile.
12.2 Strategic Directions and Investment Priorities
The aim of this section is to present a five-year investment strategy for CEPF to support CSOs to
conserve global biodiversity in the Guinean Forests Hotspot. This will be done by targeting
investment towards 13 investment priorities grouped into five strategic directions (Table 12.3).
This is only a subset of the investment priorities that were identified during the stakeholder
consultations, because not everything could be addressed over five years with the level of
funding available and considering the absorptive capacity of civil society in the hotspot. A
shortlist of candidate investment priorities was developed through the consultation process,
drawing on the results of the situational analysis, especially the analysis of threats and drivers
(Chapter 8), which informed the types of conservation action needed to address immediate
threats and their root causes, and the analysis of the civil society context (Chapter 7), which
informed the types of investments required to engage and strengthen civil society, especially
local groups. This list was then narrowed down during the final consultation workshops by
applying the following four criteria: (i) need for additional funding (informed by the analysis of
conservation investment in Chapter 10); (ii) appropriateness for implementation by civil society;
(iii) availability of CSOs with the necessary skills and connections for implementation; and
(iv) urgency for implementation during the next five-years.
The resulting investment strategy includes actions appropriate for civil society to lead at local,
national and regional levels. At the local level, the focus is on demonstrating practical solutions
to conservation and development threats and problems that have the potential for wider
replication. At the national level, the focus is on empowering civil society to influence
conservation policies and private sector business practices in ways that positively affect
biodiversity conservation, through partnerships and dialogue. Since some priority KBAs and
conservation corridors are transboundary in nature, for example the Korupmba-Obachap
Corridor, support will also focus on regional and transboundary actions that facilitate
conservation of transboundary clusters of KBAs, facilitate regional dissemination of information
and conservation models, and contribute to the emergence of a regional conservation movement.
Furthermore, since most countries in the hotspot have identified the conservation of biodiversity
as their major nature-based solution to climate change, especially through their engagements in
ongoing REDD+ preparatory processes (as reflected in relevant REDD+ Strategy Documents), it
is logical for this strategy to encapsulate climate change as a theme. Specifically, CEPF will
support civil society to participate in an influence to the climate change discourse in favor of
mitigation and adaptation responses beneficial to biodiversity conservation, such as REDD+ and
ecosystem-based adaptation. In addition, the strong focus on capacity building that runs through
the investment strategy will enable local CSOs to play an increasingly important role in
conceiving, implementing and monitoring climate change mitigation and adaptation projects.

258
Table 12.3 CEPF Strategic Directions and Investment Priorities in the Guinean Forests Hotspot
Strategic Direction Investment Priorities
1. Empower local communities to engage in sustainable management of 40 priority sites and consolidate ecological connectivity at the landscape scale
1.1 Strengthen the elaboration and/or implementation of land-use planning, land tenure and forestry reforms to facilitate good governance in the management of community and private reserves and concessions
1.2 Promote preparation and implementation of participatory management plans that support stakeholder collaboration in protected area management
1.3 Demonstrate sustainable livelihood/job creation activities for local communities that will act as incentives for the conservation of priority sites (e.g. domestication of wildlife species, sustainable logging from locally-controlled forests, harvesting of NTFPs, sustainable agriculture, etc.)
2. Mainstream biodiversity conservation into public policy and private sector practice in the nine conservation corridors, at local, sub-national and national levels
2.1 Conduct policy-relevant research, analysis and outreach that informs and influences the development of national government conservation policies, including on protected area management, payment for ecosystem services, REDD+ and ecosystem-based adaptation to climate change
2.2 Generate locally-relevant information on natural ecosystems (e.g., economic valuations of ecosystem services) to influence political and economic decision-making in favor of their conservation
2.3 Facilitate partnerships among local communities, private sector and government to demonstrate models for best practice mining, sustainable forestry and sustainable agriculture by private companies
3. Safeguard priority globally threatened species by identifying and addressing major threats and information gaps
3.1 Support the implementation of Conservation Action Plans for Critically Endangered and Endangered species on the IUCN Red List
3.2 Update the KBA analysis by incorporating recently available data, including on Alliance for Zero Extinction sites and global Red List assessments and by conducting targeted research to fill critical knowledge gaps
4. Build the capacity of local civil society organizations, including Indigenous People’s, women’s and youth groups, to conserve and manage globally important biodiversity
4.1 Strengthen the capacity of local civil society organizations in financial, institutional and project management, organizational governance, and fundraising
4.2 Establish and strengthen women-led conservation and development organizations, associations and networks to foster gender equality in natural resource management and benefit sharing
4.3 Strengthen the communication capacity of local civil society organizations in support of their mission and to build public awareness on the importance of conservation outcomes
5. Provide strategic leadership and effective coordination of conservation investment through a Regional Implementation Team
5.1 Operationalize and coordinate CEPF’s grant-making processes and procedures to ensure effective implementation of the investment strategy throughout the hotspot
5.2 Build a broad constituency of civil society groups working across institutional and political boundaries to achieve common conservation objectives

259
Strategic Direction 1. Empower local communities to engage in sustainable management of 40 priority sites and consolidate ecological connectivity at the landscape scale Chapter 7 reveals that pressure from local communities to meet their basic daily needs is a threat
to the conservation and sustainable management of many KBAs. Chapter 8 highlights that
hunting and overfishing are threats to wildlife populations in all hotspot countries, driven in large
part by the demand for protein among expanding rural communities, as well as urban populations
with increasing purchasing power. This chapter also reveals that rural population growth,
coupled with increasing demand for agricultural commodities within and outside of the hotspot,
is driving agricultural expansion, leading to habitat loss. Illegal logging and unsustainable
extraction of fuelwood and charcoal are additional threats, which are again driven by external
demand combined with a lack of sustainable livelihood options for local communities. These
threats are especially severe in KBAs that are not adequately covered by protected areas but even
protected areas have serious problems with unsustainable resource use. Chapter 6 also highlights
that most countries in the hotspot have legislation in place related to protected areas, forest
management and environmental protection. However, the capacity of government agencies to
actually enforce the law is, in many cases, weak. This is especially so in remote forest areas
outside of protected areas. In this context, local communities are often the best placed actors to
address key threats to priority sites, either alone or in collaboration with government agencies.
Currently, however, local community involvement in conservation is patchy. Where they have
limited incentives or economic alternatives, they may engage in illegal or unsustainable
activities, such as conspiring with illegal loggers, miners and poachers to deplete species
populations and degrade natural habitats.
To address these issues, CEPF will support projects that empower local communities to engage
in sustainable management of the 40 priority sites identified in Table 12.2, in order to consolidate
ecological connectivity at the landscape scale. Investment Priority 1.1 will focus outside of
conventional protected areas, taking advantage of policy reforms to pilot new, community-led
models for site conservation, such as community reserves and conservation concessions.
Investment Priority 1.2 will work within protected areas, to promote participatory management
plans that create opportunities to engage communities and other local stakeholders as active
partners in conservation. Finally, Investment Priority 1.3 will focus on all priority sites and
demonstrate sustainable livelihood activities that have the potential to address local people’s
needs and incentivize them to participate in the conservation and sustainable management of
biological resources. The focus of these investments will be on those communities that are
currently placing the greatest pressure on priority sites, which means that they may not
necessarily be inside the boundaries of the KBAs themselves. To be eligible for CEPF support,
all projects under this strategic direction must engage target communities at all stages of project
design and implementation, take account of existing governance structures, including customary
ones, and address access to resources for local people and equitable sharing of costs and benefits.
Projects that aim to address illegal logging and/or respond to issues of forest governance should
also demonstrate alignment with the EU FLEGT Action Plan, and, where they exist, VPAs.

260
Investment Priority 1.1 Strengthen the elaboration and/or implementation of land-use
planning, land tenure and forestry reforms to facilitate good governance in the management
of community and private reserves and concessions
It has been observed in the hotspot that current land tenure arrangements are one of the main
issues that are hampering conservation, mainly because communities and private companies do
not typically own the agricultural or forestry land they use, because most land belongs to the
State, which leases it out for temporary use. This land tenure system makes it very difficult for
smallholder farmers or companies to invest in a wide parcel of land over a long period of time,
since they are afraid that the government may retake or change ownership of their lands;
especially considering, as field experiences have revealed, that land allocation is not done in a
transparent way. Land-use planning is also an issue due to overlapping jurisdictions among
different government bodies, leading to land-use practices that conflict with one another. For
example, there have been cases where mining permits have been granted to exploit minerals in
forest concessions owned by another concessionnaire.
These problems with land-tenure are gradually being addressed through policy and legislative
reforms that favor secured community and private ownership of lands over longer periods.
Taking advantage of this opportunity, CEPF will support participatory land-use planning
processes and methodologies, notably those that empower communities to own and manage land
and forestry resources. At some sites, this will require supporting actions that protect the rights of
communities and private sector investors against the whims and caprices of local government
officials and other stakeholders. In some cases, CEPF investments will result in the
establishment of community or private reserves or conservation concessions. However, the
models that integrate biodiversity conservation into the management of production landscapes
will also be supported under this investment priority, even if they do not explicitly involve the
establishment of conservation areas.
Investment Priority 1.2 Promote preparation and implementation of participatory
management plans that support stakeholder collaboration in protected area management
Elaboration and implementation of participatory management plans is an important approach to
sustainably manage protected areas. The consultation process revealed, however, that some
protected areas lack management plans, the legal duration of many other plans has expired, while
some with valid legal status are not being respected due to a lack of participation of local
stakeholders in their preparation. There is also a shortage of financial and human resources on
the part of government agencies charged with protected area management. All this is not
facilitating the participation of CSOs, local communities and other stakeholders in the
preparation and implementation of protected area management plans.
CEPF will, therefore, support CSOs to work with local and national governments and designated
private sector officials to brainstorm, elaborate, update, implement and monitor the
implementation of participatory management plans. In this way, key enabling conditions will be
put in place for collaborative management of protected areas, that treat local stakeholders as
positive partners in conservation, and give them a voice in management decisions.

261
Investment Priority 1.3 Demonstrate sustainable livelihood/job creation activities for local
communities that will act as incentives for the conservation of priority sites (e.g. domestication
of wildlife species, sustainable logging from locally-controlled forests, harvesting of NTFPs,
sustainable agriculture, etc)
It is widely recognized by stakeholders consulted during the preparation of the ecosystem profile
that, because local communities depend heavily on natural resources for their livelihoods, it will
be very difficult for them to conserve natural resources if they either do not have access to
sustainable livelihood projects or alternative development strategies that reduce their dependence
on unsustainable forms of natural resource use. Also, because of a high incidence of poverty,
some community members connive with poachers and illegal loggers, in exchange for either part
of the booty or funds to cover their immediate medical or household needs. This partially
explains why many conservation projects in the hotspot have allocated an important part of their
resources to incentivizing local communities to fully participate in conservation programs and
activities, and experience from the first phase of investment suggests that such approaches yield
significant results. However, it is important to note that lessons learned from the consultation
process and previous CEPF investments in the hotspot show that local projects will also fail if
sound and transparent benefit-sharing mechanisms are not set up to promote good governance
virtues, and if the sustainability of financial incentives is not ensured.
CEPF will support local communities in and around the priority KBAs to conceive, develop
and/or implement sustainable livelihood projects, such as domestication of wildlife and
indigenous fruit species, apiculture, nature-based tourism and sustainable harvesting of NTFPs.
With regard to domestication of wildlife species, there is an inherent risk of domestication
projects facilitating the ‘laundering’ of wild-caught animals and, thereby, facilitating poaching
and wildlife trade. To mitigate this risk, all activities will be closely monitored, support will only
be given for domestication of non-threatened species, such as cane rats, and CEPF will support
the development of legal community enterprises to facilitate the implementation of these
activities.
With regard to domestication and transformation of NTFPs, the stakeholder consultations
revealed that value-addition and marketing of NTFPs has been very difficult for communities in
the hotspot because of a lack of funds, technology, know-how and markets. CEPF will therefore
support communities (financially and technically) to sustainably harvest, transform and market
these products, while supporting complementary activities to develop markets for the finished
products.
As well as reducing pressure on natural resources and encouraging communities to support
conservation efforts on the ground, sustainable livelihood activities are also expected to build
capacity among community leaders. The skills developed can be later employed for community
mobilization for conservation activities. Projects supported under this investment priority will be
expected to ensure the equitable involvement of women in the design and implementation of
project activities, including in leadership positions. Grantees must also ensure that participatory
benefit sharing mechanisms are designed, implemented and monitored to enable all stakeholders
to fully participate in and receive benefits from projects that are equivalent to their efforts and
costs, giving priority to vulnerable groups, including Indigenous People and women.

262
Strategic Direction 2. Mainstream biodiversity conservation into public policy and private sector practice in the nine conservation corridors, at local, sub-national and national levels Most countries in the hotspot are in dire need of development projects to create employment and
generate revenues to pay for education, health care and other essential services. As such,
development projects, such as mines, hydroelectric dams and large-scale cash crop plantations
tend to be viewed positively by public officials and elected representatives. However, one of the
main causes of biodiversity loss in the hotspots is the development and implementation of large
development projects that do not adequately integrate environmental concerns and social
safeguards.
As seen in Chapter 8, agriculture and aquaculture is viewed by stakeholders as the second ranked
threat to biodiversity in the hotspot, while energy production and mining is the third ranked
threat. A number of hotspot countries are currently planning and implementing large
development projects within or close to priority sites. To balance the exigencies of development
and the need to conserve biodiversity, there is, therefore, a need to mainstream biodiversity
conservation into government development policies, legislation and regulatory frameworks, as
well as the business practices of private sector companies.
Since most existing policies, laws and legislation were elaborated without full consultation with
stakeholders, notably rural communities and civil society, significant opportunities exist for
policy reforms that promote sustainable, pro-poor growth models. The availability of resources
and the absorptive capacity of conservation organizations in the hotspot mean that CEPF
investments over the next five years will be able to test and refine a range of innovative
conservation and sustainable development approaches at selected sites but will not be able to
amplify these alone. Rather, CEPF will support targeted research, analysis and outreach to
facilitate evidence-based policy making that takes into account the economic and climate values
of natural ecosystems, i.e. natural capital accounting (Investment Priority .2.1). This will be
complemented by initiatives that generate locally relevant information that can influence
political and economic decision making to facilitate the sustainable management of priority
KBAs (Investment Priority 2.2). Finally, CEPF grants will empower local communities and their
associations to engage with private sector and government actors and demonstrate good practice
models for sustainable development, particularly with regard to mining, agriculture and forestry:
the three sectors targeted by the CEPF investment program (Investment Priority 2.3). The
geographic focus for investments under this strategic direction will be the nine conservation
corridors (Figure 12.1).
Investment Priority 2.1 Conduct policy-relevant research, analysis and outreach that informs
and influences the development of national government conservation policies, including on
protected area management, payment for ecosystem services, REDD+ and ecosystem-based
adaptation to climate change
Information on the conservation outcomes in the Guinean Forests is patchy, and mainly limited
to the intrinsic values of biodiversity, such as levels of species richness, threat and endemism.
This information, while highly relevant to apportioning conservation investment, is unlikely to
influence national policy making, which needs to compare the socio-economic costs and benefits

263
of different alternatives. With a few exceptions, information on the social and economic values
of natural ecosystems and the services they provide is either unavailable or limited to anecdote.
Consequently, CEPF will support the undertaking and dissemination of policy-relevant research
and analysis that will facilitate the development of national policies that support sustainable
protected areas management, payment for environmental services and the use of nature-based
solutions to climate change, especially ecosystem-based adaptation. In particular, support will be
given to projects that promote biodiversity as a co-benefit within REDD+ policies and strategies.
Activities under this investment priority may require the participation of research institutions and
policy think-tanks, as well as NGOs with a poverty-alleviation focus. Projects will be
encouraged to incorporate information generated on the values of natural ecosystems under
Investment Priority 2.2, where relevant.
Investment Priority 2.2 Generate locally-relevant information on natural ecosystems (e.g.,
economic valuations of ecosystem services) to influence political and economic decision-
making in favor of their conservation
In order to support policy-reform and economic decision-making that will favor conservation
over alternative development visions inconsistent with the long-term persistence of biodiversity,
it is very important to generate science-based and locally rooted information on the socio-
economic values of natural ecosystems and the ecosystem services they provide.
To this end, CEPF will support the generation of locally relevant information that will ecourage
sound economic and political decision-making. Because decision-makers in government and
private sector will quantify the development alternatives to investments in the conservation of
priority sites in economic terms, the conservation scenario must also be quantified in the same
terms, if decision makers are to be influence in favor of it. Projects under this investment priority
could help establish the evidence basis for subsequent development of payment for ecosystem
services or other long-term financing mechanisms under Investment Priority.2.1
Investment Priority 2.3 Facilitate partnerships among local communities, private sector and
government to demonstrate models for best practice mining, sustainable forestry and
sustainable agriculture by private companies
Most countries in the hotspot have elaborated national development strategies and goals that
emphasize the mining, agriculture and forestry sectors as engines of development. To ensure that
developments in these sectors proceed in ways consistent with the conservation of biodiversity,
there is a need for demonstration models that adapt global best practice and sustainability
standards, and apply them in the local context. To this end, CEPF will support projects that aim
to facilitate partnerships among local communities, private companies and government bodies to
demonstrate such models at priority sites. CSOs are well placed to facilitate such partnerships, to
introduce the partners to international standards, such as FSC certification for forestry projects,
and the RSPO and Sustainable Agriculture Network standards in the agriculture sector, and to
develop market linkages for certified commodities.

264
Strategic Direction 3. Safeguard priority globally threatened species by identifying and addressing major threats and information gaps
At least 936 species in the Guinean Forests Hotspot are globally threatened (Table 4.1). The
analysis presented in Chapter 8 indicates that the most widespread threat affecting these species
is unsustainable biological resource use, followed by agriculture and aquaculture, and pollution.
Moreover, as seen in Chapter 10, there is very limited funding from donors for species based
conservation. The conservation needs of many globally threatened species would be adequately
addressed through habitat protection and controls on unsustainable exploitation at the KBAs
where they occur; this calls for site-based conservation actions. Such actions will be taken for the
most highly threatened species, and guided by available species conservation action plans, to
ensure they align with other investments by national governments and international donors
(Investment Priority 3.1). In parallel, CEPF will support analysis of newly available data,
complemented by targeted research to fill critical gaps, in order to provide more reliable
information on which to base allocation of scarce resources and design of strategies for the
conservation of globally threatened species (Investment Priority 3.2). Priority will be given to
projects that align with the EU’s strategy for wildlife conservation in Africa (European
Commission 2015).
Investment Priority 3.1 Support the implementation of Conservation Action Plans for
Critically Endangered and Endangered species on the IUCN Red List
Other species have conservation needs that require species-specific actions. For instance,
poaching is a threat to many populations of globally threatened primates across the hotspot.
While site-based protection can alleviate this pressure, it needs to be complemented by actions to
address illegal trade in bushmeat, which is driving poaching at many sites. This requires
complementary actions away from KBAs, for instance consumer demand reduction campaigns in
urban centers. Another example is globally threatened vultures, which are wide-ranging species
that can cover hundreds of kilometers in search of carrion and occur widely outside of KBAs.
Site-based action is not sufficient to meet the conservation needs of vultures, which are exposed
to threats in the wider landscape, including decline in wild ungulate populations, secondary
poisoning by toxins used to kill carnivores, and targeted killing to provide parts for traditional
medical practices.
Under this investment priority, CEPF will support species-specific conservation actions that
address priorities set out in Conservation Action Plans for globally threatened species. CEPF
funds will not be used to prepare the plans themselves but will be reserved for
implementation of plans already prepared or to be prepared with other sources of support. In
order to focus limited resources among the extensive list of threatened species in the
hotspot, support will be limited to species assessed as Critically Endangered or Endangered:
the two highest threat categories. Although 405 species fall into one of these categories, it is
likely that most activities under this investment priority will address either mammals or
birds, of which there are only 35 and 17, respectively (Table 4.1), because site-based
conservation actions will be largely sufficient for most species in other taxonomic groups.

265
Investment Priority 3.2. Update the KBA analysis by incorporating recently available data,
including on Alliance for Zero Extinction sites and global Red List assessments and by
conducting targeted research to fill critical knowledge gaps As has been seen, this profile has highlighted some important information taxonomic and
regional gaps that make it very difficult to accurately evaluate the conservation status of
many species or the relative biological importance of different KBAs in the hotspot. Of
perhaps greater concern is the fact that many sites of global importance for the persistence
of biodiversity have not yet been identified and documented as KBA, especially in the
freshwater realm. A more comprehensive KBA identification would not only draw attention
to sites in need of conservation action but also facilitate the implementation of
environmental standards, for instance those of the International Finance Corporation and the
Equator Banks.
CEPF will support actions to fill these information gaps. Data on the status of species and
sites that became available during the profiling process or that become available during the
implementation of the investment strategy will be used to update the KBA analysis. In
particular, there is a need to define additional terrestrial KBAs in the Lower Guinean Forests
for taxonomic groups other than birds, and to conduct comprehensive identification of
freshwater KBAs across the entire hotspot. This investment priority will also support a
limited number of highly targeted field surveys to fill critical gaps in knowledge with regard
to the status of selected species and sites. The information generated will inform planning,
implementation and monitoring of conservation actions for globally threatened species,
while the surveys themselves will provide early career conservationists, such as
postgraduate students, with opportunities to gain field experience and work with
conservation organizations.
Strategic Direction 4 Build the capacity of local civil society organizations, including Indigenous People’s, women’s and youth groups, to conserve and manage globally important biodiversity Lessons learned from ongoing and recent conservation projects in West Africa have highlighted
the need to build partnerships and alliances among the three key sectors of society – government,
private sector and civil society – to develop and implement solutions to the complex sustainable
development challenges facing the region. Civil society faces a number of barriers to engaging in
such partnerships, the most significant of which are capacity ones. The CEPF investment
program provides an important opportunity to invest in the capacity development of local CSOs,
ranging from national NGOs to community-based organizations, to facilitate their emergence as
agents of change and credible partners to government and private sector partners.
One of the lessons learned of the first phase of CEPF investment was the need to link grant
making to capacity building, especially when working with small, emerging CSOs. To this end,
capacity building under this strategic direction will complement the small grant making to local
CSOs that will take place throughout the investment strategy as a whole. Both strategies are
essential elements of facilitating the emergence of local conservation movements in the hotspot
countries but neither is sufficient alone. Small grants not linked to capacity building can ignite a
certain level of enthusiasm and energy in recipient organizations but this can be dissipated unless

266
they can build a reputation for sound programmatic and financial management and attract
funding from other sources. Capacity building without resources prevents CSOs from applying
their new capabilities. Therefore, capacity building activities under this strategic direction will be
closely coordinated with the overall development of the grant portfolio, with the RIT playing the
key coordinating role. To this end, grants will be awarded to a mixture of CSOs in need of
capacity building and local and international service providers, able to provide training,
mentoring and/or networking for groups of CSOs with common capacity needs. Specific
emphasis will be placed on strengthening Indigenous People’s organizations, women’s groups
and youth groups and engaging them in conservation of globally threatened species, priority sites
and conservation corridors. To help manage the volume of applications from CSOs for capacity
building grants, other grant-making modalities may be considered in addition to open calls for
proposals, including restricted, competitive calls, and grants by invitation.
Investment Priority 4.1 Strengthen the capacity of local civil society organizations in financial,
institutional and project management, organizational governance, and fundraising
As seen in Chapter 7 and throughout the consultation process, although some CSOs are fully
involved in natural resource management, they lack the necessary knowledge to manage
conservation projects, notably conceiving, implementing and monitoring the implementation of
projects. Specifically, many groups lack the capacity to design projects and write funding
proposals to the standard required by international donors. Local CSOs often also lack the
capacity to manage project funds according to donor requirements, since their staff have
generally not received any formal training in financial management. To effectively engage these
organizations as partners in conservation and sustainable development, there is a fundamental
need to strengthen their core capacity in the areas of financial and institutional management,
strategic planning, organizational governance, and fundraising. There is also the issue of good
governance in financial management of funds generated by the projects. It is common in the
region to witness corruption at the local level, notably unequal sharing of cost and benefits.
Vulnerable groups like Indigenous People are often neglected when it comes to benefit-sharing,
and priority will be given to capacity building initiatives that target Indigenous People’s
organizations.
As part of this investment priority, CEPF will support independent community-based
organizations to improve their capacities, notably by improving their governance structures and
accounting systems. It will be important to support decentralized civil society structures, to
effectively involve local and vulnerable groups like indigenous communities stakeholders in
natural resource management, establish a foundation for equitable benefit-sharing mechanisms,
and avoid over-emphasizing the development of a professional class of national NGOs that can
become a barrier to the growth of grassroots civil society, as has been seen in some other
hotspots where CEPF operates. Taking on board experience from the first phase, priority will be
given to mentoring arrangements and other innovative approaches, as opposed to conventional
training courses.

267
Investment Priority 4.2 Establish and strengthen women-led conservation and development
organizations, associations and networks to foster gender equality in natural resource
management and benefit sharing
Because of the patriarchal nature of most cultures in the hotspot, women are not often involved
or included in decision making related to natural resource management and development
projects. In fact, until very recently, conservation of biodiversity was seen as an all-male pursuit,
and this is reflected in the composition of leadership positions within conservation NGOs. Until
recently women’s potential contributions to both natural resource management at the grassroots
level and conservation practice at the national level had been hardly harnessed, due to
disempowerment on issues such as insecure land tenure rights, limited opportunities in decision-
making, lack of access to education, and inadequate training and career development
opportunities.
Luckily, there is a glimmer of hope, because most of the hotspot countries are increasingly
discovering the important contributions that women can make to conservation and sustainable
livelihood projects, while the policy environment and societal attitudes are gradually becoming
more supportive of women’s participation and leadership. Through the activities of regional and
national women’s groups and networks, such as the Network of African Women for Sustainable
Development (REFADD), and line ministries in charge of Women’s Affairs, the vital role of
women in conservation is increasingly being showcased through some important pilot projects.
For example, some small grants schemes, such as CARPE and PPI, have not only supported
women’s groups to implement biodiversity conservation and rural development activities on the
ground but have also acted as an instrument through which women have influenced numerous
policies that are currently supporting women-led conservation actions.
To reinforce these positive trends, CEPF will strengthen the capacity of women’s groups to
advocate for natural resources management and development rights, especially gender equality.
CEPF will also provide training to support women-led CSOs to address some institutional issues
that do not favor women’s participation in biodiversity conservation in priority sites. These
activities could be linked to investments under Investment Priority 1.3 on sustainable livelihood
and job creation activities. Livelihood activities that present especially good opportunities for
participation by rural women include sustainable harvesting, value addition and marketing of
NTFPs.
Investment Priority 4.3 Strengthen the communication capacity of local civil society
organizations in support of their mission and build public awareness on the importance of
conservation outcomes
Strategic communication is one of the major components of conservation programs, especially
where they are competing with other development visions for the attention of decision makers
and local communities. Stakeholders reported, however, that most conservation programs do not
allocate sufficient time and resources to generating and disseminating information about the
importance of species and ecosystems in locally appropriate formats. In addition, experience
from the first phase of CEPF investment in the hotspot revealed a need to move beyond
conventional environmental education and outreach efforts, which have not proven to be very
successful. To address this gap, CEPF will fund activities that strengthen the communication
capacity of local CSOs, so they can build awareness of the importance of conservation outcomes

268
among key audiences at local, sub-national and national levels. This capacity building will
potentially cover a range of media, including scientific journals, policy and technical briefs, radio
and television programs, newspapers and online media. CEPF will also support sensitization
workshops to create public awareness on the importance in the conservation of conservation
projects. Peer-to-peer education and social marketing will also be among the tools that CSOs
could receive capacity building in, as they can be particularly appropriate to the catalyzing the
types of behavioral change and consumer demand reduction needed to respond to threats such as
poaching and wildlife trade.
It will also be very important to strengthen local CSOs’ capacity to document and exchange
experiences, lessons learned and innovative approaches both internally within their own
organizations, and externally among peer CSOs. While much of this exchange among CSOs will
take place within countries, CEPF will also take advantage of the regional nature of the
investment program by facilitating exchange among CSOs in different hotspot countries working
on similar themes. This will not only prevent other civil society actors from repeating approaches
that have failed or not been useful elsewhere, but will also facilitate scaling up of experiences,
lessons learned and success stories in other sites. This will enable actors to quickly achieve their
conservation outcomes in a cost effective way.
Finally, that capacity of CSOs to disseminate the results of their demonstration projects to
decision makers in the public and private sectors will be strengthened. Drawing on experience
from other hotspots, building alliances of CSOs, including Indigenous People’s organizations
and women’s groups, working on similar issues, who can communicate with these audiences in a
coordinated fashion, has proven to be an effective strategy. This type of capacity building support
will facilitate the biodiversity mainstreaming into public policy and private sector practice that is
envisioned under Strategy Direction 3, drawing on results of demonstration projects supporting
under Strategic Directions 1 and 2.
Strategic Direction 5. Provide strategic leadership and effective coordination investment through a Regional Implementation Team As can already be seen from the interdependencies that exist among different elements of the
investment strategy, and the need to integrate grant making with capacity building, development
of a grant portfolio whose impacts are greater than the sum of its parts will require strategic
leadership and effective coordination. While the CEPF Secretariat will provide overall strategic
oversight and ensure compliance with all policies and requirements, such leadership and
coordination can be most effectively provided by an organization or organizations with a
permanent presence the hotspot. This will also help ensure the sustainability of the program, by
building a repository of know-how, experience and contacts that will endure beyond the end of
the investment period. To this end, CEPF will implement its grant program in close collaboration
with a Regional Implementation Team (RIT). The RIT will help promote and manage grant-
making process, undertake key capacity-building, maintain and update data on conservation
outcomes. It also will provide leadership to promote the overall conservation outcomes agenda to
government and other stakeholders. The detailed terms of reference for the RIT can be found on
CEPF’s website: www.cepf.net.

269
Investment Priority 5.1 Operationalize and coordinate CEPF’s grant-making processes and
procedures to ensure effective implementation of the investment strategy throughout the
hotspot
For large grants, the RIT will assist the CEPF Secretariat by reviewing and processing grant
applications, ensuring compliance with CEPF policies, and facilitating on-time and accurate
grantee and portfolio reporting and monitoring. In particular, the RIT will play a very important
role in soliciting and reviewing proposals. This role encompasses a wide range of activities, from
issuing calls for proposals to establishing review committees to making final recommendations
for approval or rejection. These tasks require technical expertise, knowledge of strategy, and the
ability to understand that all selected projects will make a unique contribution to the achievement
of CEPF’s objectives.
The RIT will also assume responsibility for management of the CEPF small grants mechanism in
the hotspot, including budgeting, processing proposals, contracting grants and monitoring
impacts. Small grants play an extremely important role in the CEPF portfolio. They can address
themes or geographic areas of importance, serve as planning grants, or provide opportunities to
engage local and grassroots groups that may not have the capacity to implement large grants. The
strategic role that these grants play cannot be underestimated, and the RIT will be responsible for
strategic oversight of the small grants portfolio to ensure coherence with the overall grant
portfolio, will decide on the award of all grant applications. As mentioned in Section 11.2, in
order to address the needs of local CSOs in the hotspot, the maximum small grant size will be set
at USD 50,000, although the RIT will have the option of awarding small grants of a range of
sizes.
The RIT will also be responsible for montiroing and reporting on portfolio performance,
ensuring compliance with reporting requirements, ensuring that grantees understand and comply
with social and environmental safeguard policies, and reviewing reports. To this end, the RIT
will undertake site visits to grants, to identify needs for follow-up capacity building. This will
ensure effective project implementation and monitoring, and requires technical expertise to be
performed effectively and inform adaptive management.
Investment Priority 5.2 Build a broad constituency of civil society groups working across
institutional and political boundaries to achieve common conservation objectives The RIT will also perform programmatic duties that directly support strategic development of the
grant portfolio and contribute in their own right to the achievement of conservation results that
yield portfolio-wide benefits. Such duties will include facilitating learning exchanges among
grantees and other stakeholders, identifying leveraging opportunities for CEPF, and aligning
CEPF investment with investments by other donors. These functions will require the RIT to
maintain in-house conservation expertise to ensure that CEPF funds are strategically channeled
to optimize the achievement of its conservation objectives. They will also require the RIT to
foster collaboration and build networks among CSOs, thereby responding to lessons learned
from the first investment phase, which pointed to the value of such networks in avoiding
duplication of effort and maximizing conservation results.
The objectives of this investment priority are mainly to coordinate and communicate CEPF
investment, build partnerships and promote information exchange in the priority sites and

270
conservation corridors. It will also support capacity building, a function that is regarded as being
at the core of the RIT’s responsibility. While complementary forms of capacity building will be
supported under Strategic Direction 4, the RIT will play an active role in building the capacity of
local CSOs to access and make effective use of CEPF funding. Ensuring that partners have the
institutional and individual ability to design and implement projects that contribute to the targets
of the investment strategy is not capacity building for its own sake; rather, it is essential to the
delivery of CEPF’s global mission of engaging and strengthening civil society, and to the
delivery of other elements of the investment strategy. Experience from earlier CEPF investments
in the hotspot has shown that these capacity building efforts are essential to ensuring good
projects that are integrated into a wider hotspot strategy and a common conservation vision.
Capacity building for CSOs in project design, implementation and reporting will also help them
access funding from other available donors, thereby enhancing the sustainability of the impacts
of CEPF funding.
13. SUSTAINABILITY
One of the major findings of the consultation process was that some conservation projects in the
hotspot were ultimately unsuccessful, despite initial success in some cases, because they did not
incorporate long-term financing mechanisms as a strategy to sustain biodiversity conservation
actions on the ground. Also, some conservation initiatives and key stakeholders lacked the
necessary human capacity, policies and legislative and regulatory frameworks to drive the
process and create real impact in the field. Unfortunately, when this happens, funds are wasted,
time is lost, hard-earned results crumble, and, above all, local and indigenous populations are
discouraged from participating in future conservation initiatives.
Most stakeholders consulted during the preparation of the ecosystem profile emphasized the need
to emphasize sustainability in the design of individual projects and the portfolio as a whole. A
strong focus on sustainability will ensure that the impacts of CEPF-funded projects continue to
be felt after funding ends. Above all, building partnerships with other donors, government
agencies and private sector actors to leverage funds, train conservation actors, and reform and
better implement policies was felt to be a very important component of any sustainability
strategy. Other components of the sustainability strategy for CEPF in the hotspot included
establishment of sustainable financing mechanisms, capacity building for local civil society at
individual, organization and network levels, and mainstreaming of results into policy, legislative
and regulatory frameworks. The following sections consider each of these components in turn.
13.1 Building Strategic Partnerships It is immediately apparent from a comparison of the number of conservation outcomes in the
hotspot (Chapter 4), the intensity of the threats facing them (Chapter 8) and the level of resources
available (Chapter 10) that CEPF cannot hope to address more than a fraction of the conservation
actions required for the 137 identified KBAs, all of which are global priorities for biodiversity
conservation. To elicit a response at a level commensurate with the scale of the challenge, CEPF
will need to build strategic partnerships for conservation and sustainable management of
biodiversity with other donors, as well as with governments and private companies.

271
Within the investment strategy, Investment Priority 2.3 focuses on facilitating partnerships
among local communities, private sector and government to demonstrate best practice models in
the three priority sectors addressed by CEPF investment: agriculture; mining; and forestry. This
is complemented by the other investment priorities under Strategic Direction 2, which aim to
empower civil society to influence governments to recognize the values of natural ecosystems
and reflect them in their policies and decisions, including with regard to budgetary allocations
for conservation finance.
Beyond the use of grants to facilitate strategic partnerships between civil society and other
sectors, the CEPF Secretariat and RIT will need to work closely together to forge strategic
partnerships with some of the other major donor-funded initiatives in the hotspot. One such
initiative is the WA-BiCC program of USAID, implemented by TetraTech, which has a similar
geographic focus to the CEPF investment, and an overlapping thematic focus, including
conservation of mangroves and coastal areas, which are represented in several priority sites and
conservation corridors. The WA-BiCC program has a dedicated componend focused on engaging
and strengthening civil society organizations, which is an area with significant potential for
collaboration with CEPF, in order to deliver support to CSOs in a coordinated manner that
reduces transaction costs and increases accessibility to local groups. Dialogue with the program
to explore these opportunities further is underway. There area also significant opportunities for
collaboration with the USAID-funded PROSPER project in Liberia, which addresses community
management of forest resources. As this project ends in 2017, the immediate opportunities for
collaboration may relate to capturing lessons learned and incorporating them into CEPF’s grant
making, as well as to exploring potential strategic partnership with a possible future phase of the
project.
There is also potential for strategic partnership with the German government, which is providing
significant support to the protected area systems of several hotspot countries, including Benin,
Cameroon and Côte d’Ivoire, through GIZ and KfW. CEPF investments could complement this
support, in particular by engaging civil society partners, supporting activities outside of protected
areas that alleviate pressure on their core zones or enhance ecological connectivity among them,
and supporting initiatives that integrate protected areas into sectoral development plans and
policies. The CEPF Secretariat plans to visit Germany in January 2016 to explore possibilities
for partnership further.
Similar opportunities for strategic partnership exist with the French government, which is
supporting a range of protected area and community-based conservation initiatives across the
hotspot, including in Benin, Ghana, Liberia and Sierra Leone, through FFEM. Again, CEPF
investments could complement those of the French government by engaging and strengthening
civil society actors and supporting conservation actions outside of protected areas to enhance
ecological connectivity within the conservation corridors. In addition, CEPF is in a position to
sustain or amplify conservation models piloted under the PPI, which has restrictions on the size
and duration of the support it is able to provide.
Finally, CEPF will explore opportunities for collaboration and alignment with the EU Wildlife
Conservation Strategy for Africa. The synthesis report released in November 2015 (European
Commission 2015) proposes a strategic EU response to wildlife conservation in Africa,

272
particularly in light of the current poaching crises driven by the illegal trade in wildlife and
wildlife products. The report proposes nine categories of indicative priority conservation actions,
five of which are directly addressed by the CEPF investment strategy for the Guinean Forests
Hotspot: in situ support for key landscapes for conservation and important individual sites (by
Strategic Direction 1); facilitating legal reforms for local ownership and rights to wildlife and
natural resources (by Strategic Direction 2); tackling indirect threats to conservation (by
Strategic Direction 2); research and monitoring (by Investment Priority 3.2); and awareness
raising and communication (by Investment Priority 4.1). The CEPF Secretariat will liaise closely
with the team with Directorate General for International Cooperation and Development to
explore ways of using the ecosystem profile to guide EU investment under the strategy in the
West Africa region.
13.2 Institutionalization through Improved Policy and Legislative Frameworks Strategic Direction 2 explicitly addresses the need identified by stakeholders to mainstream
biodiversity conservation into public policy and private sector practice at local, sub-national and
national levels. This is included as a major focus for CEPF investment, because integrating
biodiversity conservation into the overall policy landscape for economic development and
climate change response is key to sustainability. Without this, biodiversity conservation will
remain a low public policy priority. Some of the specific areas where biodiversity provisions are
most needed include the policies and legislation governing land tenure and the agriculture,
mining, and forestry sectors. Reforming policy or legislation in any given sector requires a
participatory and multidisciplinary approach, since any revisions will directly or indirectly affect
biodiversity conservation in other sectors.
Success stories of pilot projects and lessons learned at local level should not only be documented
and shared but also used to facilitate policy and legislative reforms to ensure wider impact than
can be achieved by individual projects. This will be a role for the RIT, which will be tasked with
developing channels to feed relevant experience from the CEPF grants portfolio into ongoing
policy and legislative reform processes, and is also the explicit purpose of Investment Priority
2.1. Moreover, since governments in the hotspot often design sectoral policies and laws that
affect local development and biodiversity conservation, it will be necessary to ensure that the
grant portfolio developed in each country aligns with relevant national and regional institutional
arrangements and strategies, such as Readiness Preparation Proposals (R-PPs), National REDD+
Strategies and NBSAPs. Where possible, CEPF investments should inform these strategies,
which will require funding proposals to be screened for their policy relevance, and relevant
experience gained through implementation to be captured and disseminated to relevant audiences
through case studies, policy briefs, study visits, small-group briefings and other appropriate
means. As a starting point for promoting alignment between CEPF investments and national
strategies for conservation and sustainable development, the expected contributions of the CEPF
investment portfolio in the Guinean Forests Hotspot to the Aichi Targets and the SDGs are set
out in Appendix 12.
Good governance structures for natural resource management and conservation should also be
institutionalized. Correctly done, decentralization of the management of biodiversity will

273
devolve decision-making powers and ensure accountability, particularly at the local level.
However, experience from some countries suggests that decentralized structures that do not
receive adequate decision-making powers tend not to function well, while some decentralized
structures with greater decision-making power are not necessarily accountable to local
communities, because they take their direction from the center. It will, therefore, be very
important to support local institutions, where real decision-making powers abound and which are
downwardly accountable to local populations.
13.3 Sustainable Financing In order for conservation projects to produce results and create sustainable impact on the ground,
it is important to conceive and implement a long-term vision for support to civil society engaged
in conservation in the Guinean Forests Hotspot, as well as institutional structures that will
encourage donors other than CEPF to fund conservation projects in the hotspot. Although some
existing small grants mechanisms are operating in the region, including the GEF-SGP, PPI and
IUCN/CARPE small grants, they are not sufficient to meet the high demands for conservation
funding from CSOs and government institutions. Nevertheless, it will be essential that any
sustainable financing mechanism developed with support of CEPF complement and, where
possible, cooperate with existing mechanisms, to avoid duplication and to provide a diversity of
financing that responds to different needs.
It will be necessary to design and implement innovative sustainable funding schemes where
international/national donors, governments, private sector and even local entrepreneurs will
commit to providing long-term funds to ensure the attainment of conservation outcomes in the
hotspot. CEPF will work closely with other donors to leverage its investments, with the aim of
encouraging long-term financial commitments by donors; creating self-sustaining community-
based enterprises (e.g. community forests, producer cooperatives, ecotourism ventures, etc.);
facilitating partnerships with private companies in support of community-led initiatives for
ecosystem conservation and restoration (such as those envisioned under Investment Priority 2.3);
and facilitating public government funding (such as proposed under Investment Priority 2.1). It
will be especially important to closely work with governments in the protection of priority
KBAs, especially those designated as protected areas, because they are likely to be the main
source of continued funding in most cases (i.e., for forest guards, park infrastructure, ecotourism
development, etc.). It will also be very important for conservation NGOs to pool their efforts and
resources together to work collaboratively, to engage different partners and donors in support of
a common conservation agenda, rather than compete with one another for resources and
influence. This is the explicit focus of Investment Priority 5.2.
13.4 Capacity Building Enhancing individual and institutional capacities is a cross-cutting priority theme that was
recommended by various stakeholders during the consultation process. Chapter 10 highlights the
need to train local communities, and national NGOs, government agencies and elected
representatives to better understand their roles, responsibilities and interests in piloting
conservation projects. The investment strategy responds to this by including Strategic Direction
4, which has an explicit focus on capacity building for local CSOs, especially Indigenous

274
People’s, women’s and youth groups. This will be complemented by capacity building provided
by the RIT under Strategic Direction 5, to enable CSOs, especially newer organizations and
grassroots groups, to access CEPF funds, and design and implement effective conservation
actions. In addition, it can reasonably be expected that capacity building will be integrated into
many of the grants awarded under other strategic directions, in order to facilitate the emergence
of a stronger conservation-focused civil society at national and regional levels that can sustain
and build upon the results of the next five years of CEPF investment.

275
GUINEAN FORESTS OF WEST AFRICA LOGICAL FRAMEWORK: 2016-2020
Objective Target Means of Verification Important Assumptions
Engage civil society in the conservation of globally threatened biodiversity through targeted investments with maximum impact on the highest conservation priorities.
At least 60 local communities are empowered to engage in the sustainable management of priority sites and/or consolidate ecological connectivity at the landscape scale. At least 20 Key Biodiversity Areas targeted by CEPF grants have new or strengthened protection and management. At least 100,000 hectares within production landscapes are managed for biodiversity conservation or sustainable use. Public policies and/or private sector business practices in at least 6 conservation corridors incorporate provisions for biodiversity conservation. Populations of at least 30 globally threatened species targeted by CEPF grants are stable or increasing. At least 15 networks are formed among civil society, government and private sector actors to facilitate capacity building, avoid duplication of effort and maximize impact. At least 50 civil society organizations, including at least 10 Indigenous People’s, women’s and/or youth groups, demonstrate improvements in organizational capacity. Investment strategies of at least 2 other donors active in the Guinean Forests incorporate geographic and/or thematic priorities from the ecosystem profile.
Grantee and Regional Implementation Team performance reports. Annual portfolio overview reports. Portfolio midterm and final assessment reports. Protected Area Tracking Tool (SP1 METT). IUCN Red List of Threatened Species. Civil society organizational capacity tracking tool. Strategies and reports of other donors.
The CEPF ecosystem profile effectively guides and coordinates conservation action in the Guinean Forest Hotspot. Stakeholder interest remains stable or increases with respect to working in partnership with civil society organizations to achieve conservation outcomes. Investments by other funders support complementary activities that reduce threats to priority corridors, sites and species, and improve the operating environment for civil society. Regulatory and institutional environments for conservation and civil society engagement remain stable or improve over time. Implementation of conservation initiatives and operations of civil society organizations are not prevented by political instability, public health emergencies or other crises.

276
Intermediate Outcomes Intermediate Indicators Means of Verification Important Assumptions
Outcome 1: Local communities are empowered to engage in sustainable management of 40 priority sites and consolidate ecological connectivity at the landscape scale. $3,000,000
At least 15 local land-use plans elaborated and implemented to facilitate good governance in the management of community and private reserves and concessions. At least 10 local and indigenous communities are trained to initiate and advocate for land tenure and forestry reforms in relation to management of community and private reserves and concessions. At least 10 participatory management plans that support stakeholder collaboration in Protected Area management are prepared and implemented. At least 30 local communities targeted by sustainable livelihood/job creation activities or benefit-sharing mechanisms show tangible wellbeing benefits.
Official land-use plans. Pre- and post-activity training needs assessment reports. Approved participatory management plans. Human wellbeing monitoring reports. Grantee and Regional Implementation Team performance reports. Secretariat supervision mission reports.
Local communities are willing to play an active role in site-based conservation. Local governments are receptive to participation of local and indigenous communities in reform and implementation of policies related to land and natural resource management. Government policies continue to provide for participatory management of protected areas. Appropriate, cost-effective protocols for monitoring human well-being impacts can be developed.
Outcome 2: Biodiversity conservation mainstreamed into public policy and private sector practice in the nine conservation corridors, at local, sub-national and national levels. $2,000,000
At least 5 conservation-related policies of national governments are informed or influenced by research, analysis and outreach supported by CEPF grants. Locally-relevant information on natural ecosystems is generated for at least 20 key biodiversity areas and used to influence political and economic decision-making in favor of their conservation
At least 20 partnerships are formed or strengthened among civil society, government, private sector and communities to promote best practices in mining, sustainable forestry and agriculture by private companies. At least 5 private companies adopt new management practices consistent with biodiversity conservation at operations in the conservation corridors.
National government conservation policies. Reports on the values of natural ecosystems. Partnership agreements. Corporate sustainability strategies, annual reports and media. Grantee and Regional Implementation Team performance reports. Secretariat supervision mission reports.
Governments and companies remain committed to sustainable development goals. Governments create space for civil society to engage in policy reform processes. Economic decision making can be influenced by arguments about the values of natural ecosystems. Sufficient civil society capacity to undertake biodiversity mainstreaming exists or can be built.

277
Intermediate Outcomes Intermediate Indicators Means of Verification Important Assumptions
Outcome 3: Priority globally threatened species are safeguarded by identifying and addressing major threats and information gaps. $1,200,000
Priority actions identified in Conservation Action Plans are implemented for at least 15 Critically Endangered and Endangered species. The inventory of Key Biodiversity Areas in the hotspot is updated to fill critical information gaps, particularly with regard to the Lower Guinean Forests subregion, and freshwater ecosystems. The global conservation status of at least 100 species from poorly assessed taxonomic groups is updated or assessed for the first time on the IUCN Red List.
World Bird and Biodiversity Database. IUCN Red List of Threatened Species. Grantee and Regional Implementation Team performance reports. Secretariat supervision mission reports.
Sufficient civil society capacity to conceive and implement species conservation actions exists or can be built. The main causes of declines in specific species populations are amenable to conservation action and can be addressed within the timeframe of the investment. Organizations and individuals holding data on species and sites are willing to share it.
Outcome 4: Capacity of local civil society organizations, including Indigenous People’s, women’s and youth groups built to conserve and manage globally important biodiversity. $1,300,000
At least 50 local civil society organizations, including at least 10 Indigenous People’s organizations, demonstrate strengthened capacity with regard to financial, institutional and project management, organizational governance, and fundraising. At least 20 women-led conservation and development organizations, associations and networks are established and strengthened to foster gender equality in natural resource management and benefit sharing. At least 20 local civil society organizations demonstrate increased communication capacity in ways that support the delivery of their mission.
Pre- and post-activity training needs assessment reports. Civil society organizational capacity tracking tool. Grantee and Regional Implementation Team performance reports. Secretariat supervision mission reports.
Civil society actors are able to work collaboratively to respond to conservation challenges. The operating environment for civil society remains constant or improves across the hotspot Key capacity limitations of civil society organizations can be addressed through trainings, mentorship and other activities suitable for grant support. Civil society organizations are able to retain trained staff who benefit from capacity building opportunities.

278
Intermediate Outcomes Intermediate Indicators Means of Verification Important Assumptions
Outcome 5: A Regional Implementation Team provides strategic leadership and effective coordination of CEPF conservation investment in the Guinean Forests Hotspot. $1,500,000
At least 60 civil society organizations, including at least 30 local and indigenous NGOs actively participate in conservation actions guided by the ecosystems profile. At least 85 percent of local NGOs receiving grants demonstrate more effective capacity to design and implement conservation actions. At least 5 civil society organizations supported by CEPF secure follow-up funding to promote the sustainability of their CEPF grants. At least $1 million in additional funding is leveraged from other donors towards the priorities set in the ecosystem profile. At least 2 participatory assessments are undertaken and documented.
Civil society organizational capacity tracking tool. Portfolio midterm and final assessment reports. Grantee and Regional Implementation Team performance reports. Secretariat supervision mission reports. Strategies and reports of other donors.
Suitably qualified organizations will apply to serve as the Regional Implementation Team in line with the approved terms of reference and the ecosystem profile. Calls for proposals will elicit appropriate proposals that advance the goals of the ecosystem profile. Civil society organizations will collaborate with each other, other donors, government agencies, and private sector actors in a coordinated regional conservation program in line with ecosystem profile.
Funding Summary Amount
Total Budget $9,000,000
279
REFERENCES
Abell, R., Thieme, M.L., Revenga, C., Bryer, M., Kottelat, M., Bogutskaya, N., Coad, B.,
Mandrak, N., Balderas, S.C., Bussing, W., Stiassny, M.L.J., Skelton, P., Allen, G.R.,
Unmack, P., Naseka, A., Ng, R., Sindorf, N., Robertson, J., Armijo, E., Higgins, J.V.,
Heibel, T.J., Wikramanayake, E., Olson, D., López, H.L., Reis, R.E., Lundberg, J.G.,
Sabaj Pérez, M.H. and Petry, P. (2008) Freshwater ecoregions of the world: A new map
of biogeographic units for freshwater biodiversity conservation. BioScience 58: 403-414.
Abernethy, K., Coad, L., Taylor, G., Lee, M. and Maisels, F. (2013) The extent and ecological
consequences of hunting in Central African rainforests in the 21st century. Philosophical
Transactions of the Royal Society, B 368(1625).
Adjonou, K., Kokutse, A. D. and Kokou, K. (2010) Dynamique spatiale et diversité floristique de
la Réserve de Faune de Togodo au Sud Est du Togo (Afrique de l’Ouest). In African Plant
Diversity: systematics and sustainable development. Proceedings of the XIXth AETFAT
Congress, Antananarivo, Madagascar, 26-30 April 2010, 63 edn, N. Beau, S. Dessein, and
E. Robbrecht, eds., Meise, Belgium: p. 72.
AFD (2009) AFRICAPOLIS: Urbanization Trends in West Africa 1950-2020. Available from:
http://www.afd.fr/webdav/site/afd/shared/PUBLICATIONS/THEMATIQUES/autres-
publications/BT/0808ProjetFicheResumeeAfricapolisV4-en.pdf
African Center for Economic Transformation (ACET) (2014) Bushmeat and the future of protein
in West Africa. West Africa Trends Newsletter, Issue 9, 2014. Available from:
https://www.rockefellerfoundation.org/app/uploads/Bushmeat-and-The-Future-of-
Protein-in-West-Africa.pdf
African Development Bank (2013) African Economic Outlook 2013. Abidjan: African
Development Bank. Available from: http://www.africaneconomicoutlook.org/en/
Agbu, O. (2004) Ethnic Militias and the Threat to Democracy in Post-Transition Nigeria.
Research report no. 127, Nordiska Afrikainstitutet, Uppsala.
Al-Azzawi, R. (2013) Gender in conservation: Does a gender aware approach lead to an
improvement in the achievement of conservation outcomes? WWF-UK, Surrey, UK.
Altizer, S. and Rushmore, J. (2014) The wildlife side of ebola: what animal ecology can
contribute to studying the spread of a deadly virus. Animal Ecology in Focus. Available
from: https://journalofanimalecology.wordpress.com/2014/12/05/the-wildlife-side-of-
ebola-what-animal-ecology-can-contribute-to-studying-the-spread-of-a-deadly-virus/
Anoko, J.N. (2008) Gender and equity in the protected areas of West Africa. IUCN and FIBA.
Available from:
http://www.lafiba.org/var/plain/storage/original/application/0d396aabbb9ce4b97f43a306
803c0add.pdf
Arnold, M., Kohlin, G., Persson, R., and Shepherd, G. (2003) Fuelwood Revisited: What Has
Changed in the Last Decade? Occasional Paper No 39, CIFOR, Bogor, Indonesia.
Atta-Mills, J., Alder, J. and Sumailia R. (2004). The decline of a regional fishing nation: The
case of Ghana and West Africa. Natural Resources Forum 28(1): 13-21.
Awosika, L.F. and Ibe A.C. (1998) Geomorphic features of the Gulf of Guinea shelf and littoral
drift. IOC/UNIDO, Cotonou, Benin.
Bamfo, R. (2010) Readiness Preparation Proposal Ghana, The Forestry Commission Ghana,
Accra, Ghana.

280
Barbour, K. M., Oguntoyinbo, J. S., Onyemelukwe, J. O. C., and Nwafor, J. C. (1982) Nigeria in
Maps. London: Hodder and Stoughton.
Barrios, S., Bertinelli, L. and Strobl, E. (2006) Climate change and rural-urban migration: The
case of Sub-Saharan Africa. Journal of Urban Economics 63(3): 357-371.
Belhabib, D., Koutob, V., Sall, A., Lam, V. and Pauly, D. (2014) Fisheries catch misreporting and
its implications: The case of Senegal. Fisheries Research 151:1-11.
Belhabib, D., Sumaila, U.R., Lam, V.W.Y., Zeller, D., Le Billon, P., Abou Kane, E. and Pauly, D.
(2015) Euros vs. Yuan: Comparing European and Chinese Fishing Access in West Africa.
PLoS ONE 10(3): e0118351.
Bennett, E.L. (2002) Is there a link between wild meat and food security? Conservation Biology
16(3): 590-592.
Bennett, E.L., Blencowe, E., Brandon, K., Brown, D., Burn, R.W., Cowlishaw, G., Davies, G.,
Dublin, H., Fa, J.E., Milner-Gulland, E.J., Robinson, J.G., Rowcliffe, J.M., Underwood,
F.M. and Wilkie, D.S. (2007) Hunting for Consensus: Reconciling Bushmeat Harvest,
Conservation, and Development Policy in West and Central Africa. Conservation Biology
21(3): 884-87.
Bioko Biodiversity Protection Program (2015) Bioko Bushmeat Project. Available from:
http://bioko.org/conservation/bushmeatproject/
BirdLife International (2008) Community management of forest on Mount Oku, Cameroon, has
led to significant habitat regeneration. Presented as part of the BirdLife State of the
world’s birds website. Available from:
http://www.birdlife.org/datazone/sowb/casestudy/253
BirdLife International (2012) The IUCN Red List of Threatened Species. Version 2014.2.
<www.iucnredlist.org>. Downloaded on 17 October 2014.
BirdLife International (2013a) Endemic Bird Area Factsheets. Available from:
http://www.birdlife.org/datazone/
BirdLife International (2013b) IUCN Red List for birds. Downloaded from
http://www.birdlife.org on 17/10/2014.
BirdLife International (2013c) Bostrychia bocagei. The IUCN Red List of Threatened
Species.Version 2014.3.<www.iucnredlist.org>. Downloaded on 26 April 2015.
BirdLife International (2014a) International Species Action Plan for the Conservation of
Critically Endangered birds on Sao Tomé. Cambridge: BirdLife International.
BirdLife International (2014b). Single Species Action Plan for the conservation of the Principe
Thrush Turdus xanthorhynchus. Cambridge: BirdLife International.
BirdLife International (2015) Important Bird Areas factsheets. Available from:
http://www.birdlife.org/datazone/
Blanc, J. (2008) Loxodonta Africana. The IUCN Red List of Threatened Species. Version 2015.3.
<www.iucnredlist.org> Downloaded on 12 October 2015.
Blaser, J., Sarre, A., Poore, D., and Johnson, S. (2011) Status of Tropical Forest Management
2011. ITTO Technical Series No 38. International Tropical Timber Organization,
Yokohama, Japan.
Bonnardeaux, D. (2012) Linking Biodiversity Conservation and Water, Sanitation and Hygiene:
Experiences from Sub-Saharan Africa. Conservation International and Africa
Biodiversity Collaborative Group, Washington, USA.
Borokini, T.I. (2014) Systematic compilation of endemic flora in Nigeria for conservation
management. Journal of Threatened Taxa 6 (11): 6406–6426.

281
Bossard L. (2009) The Future of International Migration to OECD Countries: Regional Note
West Africa. OECD Publishing Paris, France.
Bowen-Jones, E. and S. Pendry (1999) The threat to primates and other mammals from the
bushmeat trade in Africa, and how this threat could be diminished. Oryx 33: 233–246.
Bowen-Jones, E., Brown, D. and Robinson, E.J.Z. (2003) Economic commodity or
environmental crisis? An interdisciplinary approach to analyzing the bushmeat trade in
central and West Africa. Area 35 (4), 390-402.
Boy, G. and Witt, A. (2013) Invasive alien plants and their management in Africa.Synthesis
Report of the UNEP/GEF Removing Barriers to Invasive Plant Management in Africa
(RBIPMA) Project, implemented in four African countries (Ethiopia, Ghana, Uganda and
Zambia) between 2005 and 2010.
Brodie, J.F. and Gibbs, H.K. (2009) Bushmeat hunting as climate threat. Science 326(5951):
364–365.
Brown, D.S. (1980). Freshwater Snails of Africa and their Medical Importance (1st Edition).
Taylor and Francis Ltd., London, UK.
Brown, D.S. (1994). Freshwater Snails of Africa and their Medical Importance (2nd Edition).
Taylor and Francis Ltd., London, UK.
Brown, O. and Crawford, A. (2006) Conservation and Peacebuilding in Sierra Leone.
International Institute for Sustainable Development, Winnipeg, Canada. Available from:
http://www.iisd.org/pdf/2012/iisd_conservation_in_Sierra_Leone.pdf
Burgess, G.H., de Carvalho, J.F. and Imhoff, J.L. (2009) An evaluation of the status of the
largetooth sawfish, Pristis perotteti, based on historic and recent distribution and
qualitative observations of abundance. Internal report to NOAA.
Burgess, N.D., de Klerk, H., Fjeldså, J., Crowe, T., and Rahbek, C. (2000) A preliminary
assessment of congruence between biodiversity patterns in Afrotropical forest birds and
forest mammals. Ostrich 71: 286–290.
Burgess, N., Hales, J.D., Underwood, E., Dinerstein, E., Olson, D., Itoua, I., Schipper, J.,
Ricketts, T. and Newman, K. (2004) Terrestrial Ecoregions of Africa and Madagascar, A
Conservation Assessment. World Wildlife Fund, Washington DC, USA.
Burgess, N., Kuper, W., Mutke, J., Brown, J., Westaway, S., Turpie, S., Meshack, C., Taplin, J.,
Mcclean, C. and Lovett, J.C. (2005) Major gaps in the distribution of protected areas for
threatened and narrow range Afrotropical plants. Biodiversity and Conservation 14:
1877-1894.
Caldeira, E., Foucault, M. and Rota-Graziosi, G. (2010) Decentralization in Africa and the
nature of local governments’ competition: Evidence from Benin. Etudes et Documents, E
2010.19, CERDI, Clermont-Ferrand, France. Available from:
http://cerdi.org/uploads/ed/2010/2010.19.pdf
Calzadilla, A., Zhu, T., Rehdanz, K., Tol, R.S.J. and Ringler, C. (2013) Economy-wide impacts
of climate change on agriculture in Sub-Saharan Africa. Ecological Economics 93: 150–
165.
Campbell, M.O. (2005) Sacred Groves for Forest Conservation in Ghana’s Coastal Savannas:
Assessing Ecological And Social Dimensions. Singapore Journal of Tropical Geography
26: 151–169.
CARPE (2012) Regional Development Cooperation Strategy 2012-2020. Available from:
https://www.usaid.gov/sites/default/files/documents/1860/CARPE_RDCS_0.pdf

282
Carr J.A., Meng H., Hughes A. and Foden W.B. (2014) A Climate change vulnerability
assessment of West African species. UNEP-WCMC, Cambridge, UK.
Carvalho, M., Palmeirim, J.M., Rego, F., Sole, N., Santana, A. and Fa, J.E. (2015) What
motivates hunters to target exotic or endemic species on the island of São Tomé, Gulf of
Guinea? Oryx 49(2): 278-286.
Carvalho, M., Rego, F.C., Palmeirim, J.M. and Fa, J.E. (in press) Wild meat consumption on São
Tomé Island, West Africa: implications for conservation and local livelihoods. Ecology
and Society.
Castroviejo, J. Juste B, J., Del Val Pérez, J., Castelo, R., and Gil, R. (1994) Diversity and status
of sea turtle species in the Gulf of Guinea islands. Biodiversity and Conservation 3: 828-
836.
CBD (2002) Guinea Ministry of Mines, Geology and Environment. National Strategy and Action
Plan for Biological Diversity. Available from: http://www.cbd.int/doc/world/gn/gn-nbsap-
01-p1-en.pdf.
Ceperley, N., Montagnini, F. and Natta, A. (2010) Significance of sacred sites for riparian forest
conservation in central Benin. Bois et Forests des Tropiques 303: 5-23.
CEPF (2000) Ecosystem Profile: Upper Guinean Forest ecosystem of the Guinean Forests of
West Africa Biodiversity Hotspot. Critical Ecosystem Partnership Fund, Arlington, USA.
Cerutti, P.O, Sola, P., Chenevoy, A.,Iiyama, M., Yila, J., Zhou, W., Djoudi, H., Eba’aAtyi, R.,
Gautier, D.J., Gumbo, D., Kuehl, Y.,Levang, P., Martius, C., Matthews, R.,Nasi,
R.,Neufeldt, H.,Njenga, M.,Petrokofsky, G., Saunders, M., Shepherd, G., Sonwa, D.J.,
Sundberg, C. and van Noordwijk, M. (2015) The socioeconomic and environmental
impacts of wood energy value chains in Sub-Saharan Africa: a systematic map protocol.
Environmental Evidence 4: 12.
Cheka, C. (2007) The State of the Process of Decentralisation in Cameroon. Africa Development.
32(2): 181–196.
Chete, L.N. and Adewuyi, A.O. (2012) Dynamics of Trade between Nigeria and other ECOWAS
Countries. In Accelerating Growth through Improved Intra-African Trade.: Brookings
Africa Growth Institute, Washington DC, USA.
Christensen J.H., Krishna Kumar K., Aldrian E., An S.-I., Cavalcanti I.F.A., Castro M. de, Dong
W., Goswami P., Hall A., Kanyanga J.K., Kitoh A., Kossin J., Lau N.-C., Renwick J.,
Stephenson D.B., Xie S.-P. and Zhou T. (2013) Climate Phenomena and their Relevance
for Future Regional Climate Change. In: Climate Change 2013: The Physical Science
Basis. Contribution of Working Group I to the Fifth Assessment Report of the
Intergovernmental Panel on Climate Change (ed. by T.F. Stocker, G.-K. D. Qin, Plattner,
M. Tignor, S.K. Allen, J. Boschung, A. Nauels, Y. Xia, V. Bex, and P.M. Midgley).
Cambridge University Press, Cambridge, UK.
Christie, I., Fernandes, E., Messerli, H. and Twining-Ward, L. (2013) Tourism in Africa:
Harnessing Tourism for Growth and Improved Livelihoods. World Bank Group,
Washington DC, USA.
CIFOR (2013) Forests, fuel wood and charcoal: What policymakers should know. CIFOR,
Bogor, Indonesia.. Available from: http://www.cifor.org/library/4063/forests-fuel-wood-
and-charcoal-what-policymakers-should-know/.
CITES (2014) National Laws for implementing the convention. Available from:
http://cites.org/legislation.

283
Cole, N.H.A. (1968) The Vegetation of Sierra Leone. Njala University College, Njala, Sierra
Leone.
Coleman, J.M., Huh, O.K. and DeWitt, B. (2008) Wetland Loss In World Deltas. Journal of
Coastal Research 24(1): 1-14.
Cotula, L. (2011) Land deals in Africa: What is in the contracts? IIED, London, UK. Available
from: http://pubs.iied.org/pdfs/12568IIED.pdf.
Cowlishaw, G., Mendelson, Y. and Rowcliffe, J.M. (2005) Structure and Operation of a
Bushmeat Commodity Chain in Southwestern Ghana. Conservation Biology 19(1): 139-
49.
Cronin, D.T., Libalah, M.B., Bergl, R.A. and Hearn, G.W. (2014) Biodiversity and conservation
of tropical montane ecosystems in the Gulf of Guinea, West Africa. Arctic, Antarctic, and
Alpine Research 46: 891-904.
CSIRO (2008) Modelling economic trade-offs and ecological processes in landscape-scale
conservation planning. Cebu, Philippines, January 9-13, 2008. A CSIRO and CI
publication.
Cumberlidge, N. (2008) Liberonautes grandbassa. The IUCN Red List of Threatened Species.
Version 2014.3. <www.iucnredlist.org>. Downloaded on 06 January 2015.
Cumberlidge, N. (2009) Chapter 6. The status and distribution of freshwater crabs. In: Smith,
K.G., Diop, M.D., Niane, M. and Darwall, W.R.T. (Compilers). The Status and
Distribution of Freshwater Biodiversity in Western Africa. IUCN, Gland, Switzerland and
Cambridge, UK.
Cumberlidge, N., Ng, P.K.L., Yeo, D.C.J., Magalhaes, C., Campos, M.R., Alvarez, F., Naruse, T.,
Daniels, S.R., Esser, L.J., Attipoe, F.Y.K., Clotilde-Ba, F.-L., Darwall, W., McIvor, A.,
Ram, M., and Collen, B. (2009) Freshwater crabs and the biodiversity crisis: importance,
threats, status, and conservation challenges. Biological Conservation, 142: 1665–1673.
Dahdouh-Guebas, F., Jayatissa, L.P., Di Nitto, D., Bosire, J.O., Lo Seen, D., et al. (2005) How
effective were mangroves as a defence against the recent tsunami? Current Biology 15:
443-447.
Darkwa A, Amponsah, N. and Gyampoh, E. (2006) Civil society in a Changing Ghana - An
Assessment of the Current State of Civil Society in Ghana. CIVICUS: Civil Society
Index Report for Ghana. Available from:
http://www.civicus.org/new/media/CSI_Ghana_Country_Report.pdf.
Darwall, W.R.T, Holland, R.A., Smith, K.G., Allen, D. Brooks, E.G.E., Katarya, V., Pollock,
C.M., Shi, Y. Clausnitzer, V., Cumberlidge, N., Cuttelod, A., Dijkstra, K-D. B., Diop,
M.D.,Garcia, N., Seddon, M.B., Skelton, P.H., Snoeks, J., Tweddle, D. Vié, J-C. (2011).
Implications of bias in conservation research and investment for freshwater species.
Conservation Letters 4(6): 474-482.
Das, S., and Vincent, J.R. (2009) Mangroves protected villages and reduced death toll during
Indian super cyclone. Proceedings of the National Academy of Sciences of the United
States of America 106: 7357-7360.
Dasgupta, S., Laplante, B., Meisner, C., Wheeler, D. and Yan, J. (2008) The impact of sea level
rise on developing countries: a comparative analysis. Climatic Change 93: 379–388.
Dauby, G., Duminil, J., Heuertz, M., Koffi, G.K., Stévart, T. and Hardy. O.J. (2014) Congruent
phylogeographical patterns of eight tree species in Atlantic Central Africa provide
insights into the past dynamics of forest cover. Molecular Ecology 23: 2299–2312.

284
de Grave, S., Smith, K.G., Adeler, N.A., Allen, D.J., Alvarez, F., Anker, A., Cai, Y., Carrizo, S.F.,
Klotz, W., Mantelatto, F.L., Page, T.J., Shy, J.-Y., Villalobos, J.L. and Wowor, D. (2015)
Dead Shrimp Blues: A Global Assessment of Extinction Risk in Freshwater Shrimps
(Crustacea: Decapoda: Caridea). PLoS ONE 10(3): e0120198.
de Grave, S. (2013) Atya intermedia. The IUCN Red List of Threatened Species. Version 2014.3.
<www.iucnredlist.org>. Downloaded on 6 January 2015.
de Lima, R.F., Olmos, F., Dallimer, M., Atkinson, P.W. and Barlow, J (2013) Can REDD+ Help
the Conservation of Restricted-Range Island Species? Insights from the Endemism
Hotspot of São Tomé. PLoS One 8(9): e74148.
de Wasseige, C., de Marcken P., Bayol N., Hiol Hiol F., Mayaux P.., Desclée B., Nasi R., Billand
A., Defourny P. and Eba’a Atyi R. (eds.) (2012) The Forests of the Congo Basin – State
of theForest 2010. EU, Luxembourg..
Decher, J. (1997) Conservation, Small Mammals, and the Future of Sacred Groves in West
Africa. Biodiversity and Conservation 6:1007-1026.
Democratic Republic of São Tomé and Príncipe (2004) Public Administration, Country Profile.
Available from:
http://unpan1.un.org/intradoc/groups/public/documents/un/unpan023284.pdf.
Democratic Republic of São Tomé and Príncipe (2005) Estratégia Nacional e Plano de Acção da
Biodiversidade. Available from: https://www.cbd.int/doc/world/st/st-nbsap-01-p1-pt.pdf.
Deutsch, C.A., Tewksbury, J.J., Huey, R.B., Sheldon, K.S., Ghalambor, C.K., Haak, D.C. and
Martin, P.R. (2008) Impacts of climate warming on terrestrial ectotherms across latitude.
Proceedings of the National Academy of Sciences of the United States of America. 105:
6668–6672.
Dijkstra, K-D. B., Tchibozo, S. and Ogbogu, S.S. (2009) Chapter 5. The Status and distribution
of dragonflies and damselflies (odonatan) in western Africa. In: Smith, K.G., Diop, M.D.,
Niane, M. and Darwall, W.R.T. (Compilers) (2009) The Status and Distribution of
Freshwater Biodiversity in Western Africa. IUCN, Gland, Switzerland and Cambridge,
UK.
Diop, M.S. and Dossa, J. (2011) Thirty years of shark fishing in West Africa: Development of
Fisheries, Catch Trends, and Their Conservation Status in Subregional Fishing
Commission Member Countries. Fondation Internationale du Banc d’Arguin (FIBA),
Dakar, Senegal.
Djagoun, C.A.M.S., Akpona, H.A., Mensah, G.A, Nuttman, C. and Sinsin, B. (2012) Wild
Mammals Trade for Zootherapeutic and Mythic Purposes in Benin (West Africa):
Capitalizing Species Involved, Provision Sources, and Implications for Conservation. In:
Alves, R.R.N. and Rosa, I.L. (2012) Animals in Traditional Folk Medicine: Implications
for Conservation. Springer-Verlag, Berlin, Germany.
Dobson, M. (2004). Freshwater crabs in Africa. Freshwater Forum 21: 3-26.
Dodd, R.S. and Ong, J.E. (2008) Chapter 12: Future of mangrove ecosystems to 2025. In:
Polunin, N.V.C (Ed.) (2008) Aquatic Ecosystems: Trends and Global Prospects.
Cambridge University Press, Cambridge, UK.
Domson, O. and Vlosky, R.P. (2007) A Strategic Overview of the Forest Sector in Ghana.
Louisiana Forest Products Development Center Working Paper #8. Available from:
https://www.lsuagcenter.com/NR/rdonlyres/10AF8836-05BA-4F7A-8AB9-
E86C0B6EC792/53404/wp81.pdf.

285
Dorenbosch, M., van Riel, M.C., Nagelkerken, I. and van der Velde G. (2004) The relationship
of reef fish densities to the proximity of mangrove and seagrass nurseries. Estuarine,
Coastal and Shelf Science. 60: 37-48.
Doswald, N., Munroe, R., Roe, D., Giuliani, A., Castelli, I., Stephens, J., Möller, I., Spencer, T.,
Vira, B. and Reid, H. (2014) Effectiveness of ecosystem-based approaches for
adaptation: review of the evidence-base. Climate and Development 6(2): 185-201.
Droissart, V., Sonke, B., Hardy, O.J., Simo, M., Taedoumg, H., Nguembou, C.K. and Stévart, T.
(2011) Do plant families with contrasting functional traits show similar patterns of
endemism? A case study with Central African Orchidaceae and Rubiaceae Biodiversity
Conservation 20: 1507–1531.
Dudley, N., Higgins-Zogib, L. and Mansourian, S. (2009) The Links between Protected Areas,
Faiths, and Sacred Natural Sites. Conservation Biology 23: 568–577.
Duke, N.C., Meynecke, J.O., Dittmann, S., Ellison, A.M., Anger, K., Berger, U., Cannicci, S.,
Diele, K., Ewel, K.C., Field, C.D., Koedam, N., Lee, S.Y., Marchand, C., Nordhaus, I.
and Dahdouh-Guebas, F. (2007) A world without mangroves. Science 317(5834): 41-42.
Eastaugh C. (2010) Climate Change Impacts on African Forests and People. Vienna:
International Union of Forest Research Organizations.
ECOWAS-SWAC/OECD (2008) Atlas on Regional Integration in West Africa. Available from:
http://www.oecd.org/regional/atlasonregionalintegrationinwestafrica.htm
ECOWAS Commission (2008) ECOWAS Environmental Policy. Economic Community of
African States (ECOWAS), Lomé, Togo.
Edwards, D.P. Sloan, S., Weng, L., Dirks, P., Sayer, J. and Laurance, W.F. (2014) Mining and the
African environment. Conservation Letters 7: 302-311.
Effiom, E.O., Nuñez-Iturri, G., Smith, H.G., Ottosson, U. and Olsson, O. (2013) Bushmeat
hunting changes regeneration of African rainforests. Proceedings of the Royal Society B
280: 20130246.
EIA Beta (2015) International energy data and analysis. Available from:
http://www.eia.gov/countries/cab.cfm?fips=NI
Eken, G., Bennun, L., Brooks, T.M., Darwall, W., Fishpool, L.D.C., Foster, M., Knox, D.,
Langhammer, P., Matiku, P., Radford, E., Salaman, P., Sechrest, W., Smith, M.L., Spector,
S., Tordoff, A., (2004) Key biodiversity areas as site conservation targets. Bioscience
54(12): 1110-1118.
Elbehri, A. (ed) (2013) Rebuilding West Africa’sfoodpotential: Policies and marketincentives for
smallholder-inclusive food value chains. FAO and IFAD, Rome, Italy.
Elephant Database and IUCN SSC African Elephant Specialist Group (2013) 2013 Provisional
African Elephant Status Report. Available from:
http://www.elephantdatabase.org/preview_report/2013_africa/Loxodonta_africana/2012/
Africa
Ellison, A.M. (2008) Managing mangroves with benthic biodiversity in mind: moving beyond
roving banditry. Journal of Sea Research 59: 2-15.
Emslie, R. 2012. Diceros bicornis. The IUCN Red List of Threatened Species. Version 2014.3.
<www.iucnredlist.org>. Downloaded on 06 January 2015.
Endamana, D. (2013a) Etudes sur les conditions de vie des populations dépendantes des forêts
dans le contexte REDD+ Volume1. TNS Congo. IUCN and Congo Basin Forest Fund.

286
Endamana, D. (2013b) Etudes sur les conditions de vie des populations dépendantes des forêts
dans le contexte REDD+ Volume 2: TRIDOM Cameroun. IUCN and Congo Basin Forest
Fund.
Entsua-Mensah, M. (2010) Barbus boboi. The IUCN Red List of Threatened Species.Version
2014.3. <www.iucnredlist.org>. Downloaded on 26 April 2015.
Environmental Foundation for Africa (2006) CEPF Final Project Completion Report:
Reconstruction for Biodiversity Conservation, Research and Ecotourism in the Tiwai
Island Wildlife Sanctuary, Sierra Leone. Available from:
http://www.cepf.net/Documents/Final.Environmental.Found.pdf
European Commission (2015) Larger than elephants: inputs for an EU strategic approach to
wildlife conservation in Africa: synthesis. Brussels: European Commission Directorate
General for International Cooperation and Development. Available from:
https://capacity4dev.ec.europa.eu/sites/default/files/file/26/11/2015_-_1812/eu-wildlife-
strategy-africa-synthesis-2015_en.pdf
Ewoukem, T.E., Aubin, J., Mikolasek, O., Corson, M.S., Tomedi Eyango, M., Tchoumboue, J.,
van der Werf, H.M.G. and Ombredane, D. (2012) Environmental impacts of farms
integrating aquaculture and agriculture in Cameroon. Journal of Cleaner Production 28:
208-214.
EY (2014) EY’s Attractiveness Survey, Africa 2014: Executing growth. Ernst and Young, South
Africa.
Fahr, J. (2008) Rhinolophus maclaudi.The IUCN Red List of Threatened Species.Version 2014.3.
<www.iucnredlist.org>. Downloaded on 26 April 2015.
Fairhead J. and Leach M. (1996) Misreading the African Landscape: Society and Ecology in a
Forest Savanna Mosaic. Cambridge University Press, Cambridge, UK.
Fairhead, J. and Leach, M. (1998) Reframing Deforestation. Global Analyses and Local
Realities: Studies in West Africa. Routledge, London, UK.
FAO (n.d.) Republic of Togo General Country Data. Available from:
http://www.ciesin.org/decentralization/English/CaseStudies/TOGO.html
FAO (1999). FAO Fisheries Circular Numbers of Fishers Circular No.929, Numbers of fishers
1970-1996. Available from: http://www.fao.org/fishery/statistics/global-fishers/en.
FAO (2007) FAO Forestry Paper 153: The World’s Mangroves 1980-2005. FAO Forest
Resources Division, Rome, Italy.
FAO (2009) From Land Grab to Win-Win. In: Economic and Social Perspectives Policy Briefs
No. 4. Available from: http://www.fao.org/economic/es-policybriefs
FAO (2014) State of World Fisheries and Aquaculture 2014. FAO, Rome, Italy.
FAO, UNDP and UNEP (2015) UN REDD Programme. Available from: www.un-redd.org/.
FAOSTAT (2015) Online Statistical Service. Available from: http://faostat.fao.org/.
Faria, V.V., McDavitt, M.T., Charvet, P., Wiley, T.R., Simpfendorfer, C.A. and Naylor, G.J.P.
(2013) Species delineation and global population structure of Critically Endangered
sawfishes (Pristidae). Zoological Journal of the Linnean Society 167: 136-164.
Favier, C., de Namur, C., and Dubois, M.A. (2004) Forest progression modes in littoral Congo,
Central Atlantic Africa. Journal of Biogeography 31:1445-1461.
FCPF (2015) Forest Carbon Partnership Facility. Available from:
https://www.forestcarbonpartnership.org/.
FFI (2015) Conservation and Gender. Available from:
http://www.fauna-flora.org/initiatives/conservation-and-gender/

287
FFI and FDA (2013) National Action Plan for the Conservation of the Pygmy Hippopotamus in
Liberia. Fauna & Flora International, Cambridge, UK and Forestry Development
Authority, Monrovia, Liberia.
Figueiredo E., Paiva J., Stévart T., Oliveira F. and Smith G.F. (2011) An annotated catalogue of
the flowering plants of São Tomé et Príncipe. Bothalia 41: 41-82.
Fishpool L.D.C. and Evans M.I. (2001) Important Bird Areas in Africa and associated islands:
Priority sites for conservation. Pisces Publications and BirdLife International, Newbury
and Cambridge.
Foden W., Mace G.M. and Butchart S.H.M. (2013a) Indicators of climate change impacts on
biodiversity. In: Collen, B., Pettorelli, N., Baillie, J.E.M.and Durant, S. (eds.) (2013)
Biodiversity Monitoring and Conservation: Bridging the gap between global commitment
and local action. Wiley-Blackwell, Cambridge, UK.
Foden W.B., Butchart S.H.M., Stuart S.N., Vié J.-C., Akçakaya H.R., Angulo A., DeVantier
L.M., Gutsche A., Turak E., Cao L., Donner S.D., Katariya V., Bernard R., Holland R.A.,
Hughes A.F., O’Hanlon S.E., Garnett S.T., Şekercioğlu Ç.H., and Mace G.M. (2013b)
Identifying the World’s Most Climate Change Vulnerable Species: A Systematic Trait-
Based Assessment of all Birds, Amphibians and Corals. PLoS ONE. 8, e65427.
Formia, A., Tiwari, M., Fretey, J., and Billes, A. (2003) Sea turtle conservation along the coast of
Africa. Marine Turtle Newsletter 100: 33-37.
Fretey, J. (2001) CMS Technical Series Publication 6: Biogeography and Conservation of
Marine Turtles of the Atlantic Coast of Africa/Biogéographie et conservation des tortues
marines de la cote Atlantique de l’Afrique. UNEP/CMS Secretariat, Bonn, Germany.
Garcia R.A., Araújo M.B., Burgess N.D., Foden W.B., Gutsche A., Rahbek C., and Cabeza M.
(2014) Matching species traits to projected threats and opportunities from climate
change. Journal of Biogeography 41: 724–735.
Garcia R.A., Burgess N.D., Cabeza M., Rahbek C., and Araújo M.B. (2012) Exploring
consensus in 21st century projections of climatically suitable areas for African
vertebrates. Global Change Biology 18: 1253–1269.
Gatter, W. (1997) Birds of Liberia. Pica Press, Robertsbridge, UK.
GEF (2010) GEF’s programmatic approach to biodiversity conservation in west and central
Africa. Available from: http://www.thegef.org/gef/sites/thegef.org/files/publication/west-
africa-BIO.pdf
Gautier, L. (1990) Contact forêt-savana en Côte d’Ivoire centrale: évolution du recouvrement
ligneux des savanes de la Réserve de Lamto (sud du V-Baoulé). Candollea 45: 627-641.
Geist, H.J. and Lambin, E.F. (2002) Proximate causes and underlying driving forces of tropical
deforestation. Bioscience 52: 143-150.
Girot P., Ehrhart C., Oglethorpe J., Reid H., Rossing T., Gambarelli G., Jeans H., Barrow E.,
Martin S., Ikkala N. and Phillips J. (2012) Integrating community and ecosystem-based
approaches in climate change adaptation responses. Ecosystems and Livelihoods
Adaptation Network (ELAN) report. Available from:
http://cmsdata.iucn.org/downloads/a_eba_integratedapproach_15_04_12_0.pdf
Global Footprint Network (2010) National Ecological Footprint Account (NFA) Tables 2010
Results. Available from:
http://www.footprintnetwork.org/en/index.php/GFN/page/footprint_for_nations/

288
Gockowski, J. and Sonwa, D. (2011) Cocoa Intensification Scenarios and Their Predicted Impact
on CO2 Emissions, Biodiversity Conservation, and Rural Livelihoods in the Guinea Rain
Forest of West Africa. Environmental Management 48(2): 307-321.
Goetze, D., Hörsch, B., and Porembski, S. (2006) Dynamics of forest-savanna mosaics in
northeastern Côte d’Ivoire from 1954-2002. Journal of Biogeography 33(4): 653-664.
Gordon, C. (1992) Sacred groves and conservation in Ghana. Newsletter of the IUCN SSC
African Reptile and Amphibian Specialist Group 1: 3-4.
Government of Ghana (2010) Draft Decentralization Policy Framework. Available from:
http://www.giz.de/en/downloads/en-national-decentralization-policy.pdf.
Government of Norway (2014) Norway launches climate and forest partnerships with Peru and
Liberia. [Press Release No: 90/2014]. Available from:
https://www.regjeringen.no/en/aktuelt/Norway-launches-climate-and-forest-partnerships-
with-Peru-and-Liberia/id2001135/
GRAIN (2013) The G8 and land grabs in Africa. Available from:
https://www.grain.org/article/entries/4663-the-g8-and-land-grabs-in-africa
GRAIN (2014) Oil palm production in West and Central Africa. Available from:
https://www.grain.org/article/entries/5034-oil-palm-production-in-west-and-central-africa
The Guardian (2011) Biofuels boom in Africa as British firms lead rush on land for plantations.
Available from: http://www.theguardian.com/environment/2011/may/31/biofuel-
plantations-africa-british-firms
The Guardian (2014) G8 New Alliance condemned as new wave of colonialism in Africa
Available from: http://www.theguardian.com/global-development/2014/feb/18/g8-new-
alliance-condemned-new-colonialism.
Hannah L., Ikegami M., Hole D.G., Seo C., Butchart S.H.M., Townsend A. and Roehrdanz P.R.
(2013) Global Climate Change Adaptation Priorities for Biodiversity and Food Security.
PloS ONE. 8(8): e72590.
Hansen, C.P. and Treue, T. (2008) Assessing illegal logging in Ghana. International Foresty
Review 4: 573–590.
Hansen, M.C., Potapov, P.V., Moore, R., Hancher, M., Turubanova, S.A., Tyukavina, A.,Thau,
D., Stehman, S.V., Goetz, S.J., Loveland, T.R., Kommareddy, A., Egorov, A., China, L.,
Justice, C.O. and Townshend, J.R.G. (2013) High-Resolution global maps of 21st-century
forest cover change. Science (342): 850-853.
Harrison, R.D. (2011) Emptying the Forest: Hunting and the Extirpation of Wildlife from
Tropical Nature Reserves. Bioscience 61(11): 919-924.
Harrison, R.D., Tan, S., Plotkin, J.B., Slik, F., Detto, M., Brenes, T., Itoh, A. and Davies, S.J.
(2013) Consequences of defaunation for a tropical tree community. Ecology Letters 16:
687–94.
Hartmann D.L., Klein Tank A.M.G., Rusticucci M., Alexander L.V., Brönnimann S., Charabi Y.,
Dentener F.J., Dlugokencky E.J., Easterling D.R., Kaplan A., Soden B.J., Thorne P.W.,
Wild M. and P.M. Zhai (2013) Observations: Atmosphere and Surface. In: Stocker, T.F.,
Qin, D., Plattner, G.-K., Tignor, M., Allen, S.K., Boschung, J., Nauels, A., Xia, Y. , Bex,
V. and Midgley, P.M. (2013) Climate Change 2013: The Physical Science Basis.
Contribution of Working Group I to the Fifth Assessment Report of the
Intergovernmental Panel on Climate Change. Cambridge University Press, Cambridge,
UK.

289
Hearn, G.W., Morra, W. and Butynski., T.B. (2006) Monkeys in Trouble: The Rapidly
Deteriorating Conservation Status of the Monkeys on Bioko Island, Equatorial Guinea.
Report prepared by the Bioko Biodiversity Protection Program (BBPP), part of the
academic partnership between Arcadia University and the Universidad Nacional de
Guinea Ecuatorial (UNGE). Available from: http://bioko.org/wp-
content/uploads/2011/11/3b_2006monkeysintroublev8.pdf
Henschel, P., Coad, L., Burton, C., Chataigner B., Dunn, A., MacDonald, D., Saidu, Y. and
Hunter L.T.B. (2014) The Lion in West Africa is Critically Endangered. PLoS ONE 9(1):
e83500.
Herrera, S. and Aykut, D. (2014) Long-run growth in Ghana: Determinants and prospects. World
Bank Group Policy Research Working Paper 7115.: World Bank Group, Washington,
USA.
Hijmans, R. J., Cameron, S. E., Parra, J. L., Jones, P. G. and Jarvis, A. (2005) Very high
resolution interpolated climate surfaces for global land areas. International Journal of
Climatology 25: 1965-1978.
Hirabayashi Y., Kanae S., Motoya K., Masuda K. and Döll P. (2008) A 59-year (1948-2006)
global near-surface meteorological data set for land surface models. Part I: Development
of daily forcing and assessment of precipitation intensity. Hydrological Research Letters
2: 36–40.
Hof C., Araújo M.B., Jetz W. and Rahbek C. (2011) Additive threats from pathogens, climate
and land-use change for global amphibian diversity. Nature 480: 516–519.
Hole, D.G., Willis, S.G., Pain, D.J., Fishpool, L.D., Butchart, S.H.M., Collingham, Y.C.,
Rahbek, C. and Huntley, B. (2009) Projected impacts of climate change on a continent-
wide protected area network. Ecology letters 12: 420–431.
Holland R., Darwall W., and Smith K. (2012). Conservation priorities for freshwater
biodiversity: the Key Biodiversity Area approach refined and tested for continental
Africa. Biological Conservation 148(1): 167-179.
Hoyle, D. and Levang, P. (2012) Oil Palm Development in Cameroon. WWF, Yaounde,
Cameroon.
Humle, T., Boesch, C., Duvall, C., Ellis, C.M., Farmer, K.H., Herbinger, I., Blom, A. and Oates,
J.F. (2008) Pan troglodytes ssp. verus. The IUCN Red List of Threatened Species 2008.
http://dx.doi.org/10.2305/IUCN.UK.2008.RLTS.T15935A5323101.en Downloaded on
18 October 2015.
Ibe, A.C. and Ajayi, T.O. (1985) Possible Upwelling Phenomenon off the Nigerian Coast.
NIOMR Technical Publication No. 25. Nigerian Institute for Oceanography and Marine
Research, Lagos, Nigeria.
IDMC (2014) Nigeria: multiple displacement crises overshadowed by Boko Haram. Available
from: http://www.internal-displacement.org/Sub-Saharan-africa/nigeria/2014/nigeria-
multiple-displacement-crises-overshadowed-by-boko-haram
IFAD (2014) Spotting deforestation from space. Availbalby from: http://ifad-
un.blogspot.pt/2014/01/spotting-deforestation-from-space.html
IGCC (2006) Guinea Current Large Marine Ecosystem (GCLME) Transboundary Diagnostic
Analysis. GCLME Regional Coordinating Unit, Accra, Ghana.
IGCC (2010) State of the Coastal and Marine Ecosystems in the Guinea Current Large Marine
Ecosystem Region. GP/RAF/04/004/1191/. GCLME member countries, GEF, UNIDO,
UNDP, UNEP, US-NOAA, NEPAD, FAO and IMO. Available from:

290
http://gclme.iwlearn.org/publications/our-publications/state-of-the-coastal-and-marine-
ecosystems-in-gclme/view
IIED (2015) ECOWAS encourages states to learn from returns on investment of large dams in
West Africa. Available from: http://www.iied.org/ecowas-encourages-states-learn-returns-
investment-large-dams-west-africa.
IMF (2013) West African Economic and Monetary Union (WAEMU): Staff Report on Common
Policies for Member Countries. IMF, Washington, USA. Available from:
https://www.imf.org/external/pubs/ft/scr/2013/cr1392.pdf
Insight on Conflict (2014) Liberia Conflict Profile.. Available from:
http://www.insightonconflict.org/conflicts/liberia/conflict-profile/
International Crisis Group (2012) Curbing Violence In Nigeria (I): The Jos Crisis. Africa Report
No. 196, International Crisis Group, Brussels, Belgium.
International Crisis Group (2013) Guinea: A way out of the Election Quagmire. Africa Report
No. 199, International Crisis Group, Brussels, Belgium.
International Rivers (2010) African Dams Briefing. Available from:
http://www.internationalrivers.org/files/attached-files/afrdamsbriefingjune2010.pdf
International Rivers (2015) Mambilla Dam, Nigeria. Available from:
http://www.internationalrivers.org/resources/mambilla-dam-nigeria-3596
IPCC (2013) Summary for Policymakers. In: Stocker, T.F., Qin, D., Plattner, G.-K., Tignor, M.,
Allen, S.K., Boschung, J., Nauels, A., Xia, Y., Bex V. and Midgley, P.M. (eds.) Climate
Change 2013: The Physical Science Basis. Contribution of Working Group I to the Fifth
Assessment Report of the Intergovernmental Panel on Climate Change. Cambridge
University Press, Cambridge, UK and New York, USA.
IRIN (2009) West Africa: Combating world’s lowest literacy rates. Available from:
http://www.irinnews.org/report/84052/west-africa-combating-world-s-lowest-literacy-
rates
ITTO (2009) Study on Development and Progress in Timber Procurement Policies; Country
Case Study: Cameroon. ITTO, Yokohama, Japan.
ITTO (2011) Tropical Forest Management 2011. ITTO Technical Series No 38. ITTO,
Yokohama, Japan.
IUCN/PACO (2010) Parks and Reserves of Ghana: Management effectiveness assessment of
protected areas. IUCN/PACO, Ouagadougou, Burkina Faso.
IUCN (2012) Livelihoods and Landscapes Strategy: Results and Reflections. IUCN, Gland,
Switzerland.
IUCN (2013) The Environment and Gender Index (EGI) 2013 Pilot. IUCN, Washington D.C.,
USA.
IUCN (2014) Regional Action Plan for the Conservation of Western Lowland Gorillas and
Central Chimpanzees 2015–2025. IUCN SSC Primate Specialist Group, Gland,
Switzerland.
IUCN (2015a) The IUCN Red List of Threatened Species. Version 2015.1. [Online]. [Accessed
10/07/2015]. Available from: http://www.iucnredlist.org.
IUCN (2015b). Global gender office. Available from: http://genderandenvironment.org/
IUCN and UNEP-WCMC (2015) The World Database on Protected Areas (WDPA). United
Nations Environment Programme World Conservation Monitoring Centre, Cambridge,
UK.

291
IUCN Species Survival Commission Primate Specialist Group (2013) Industrial oil palm
expansion in great ape habitat in Africa: A Policy Statement from the Section on Great
Apes (SGA) of the IUCN SSC Primate Specialist Group. Available from:
http://static1.1.sqspcdn.com/static/f/1200343/24628342/1395834881613/Statement_on_o
il_palm_in_Africa.pdf?token=i8OyAzvcao1NBZgBJs5IGjz7VrE%3D
Jacovelli, P.A. (2014) The future of plantations in Africa. International Forestry Review 16(2):
144-159.
Jalloh, A., Nelson, G.C., Thomas, T.S., Zougmoré, R., and Roy-Macauley, H. (2013) West
African Agriculture and Climate Change: A Comprehensive Analysis.: International Food
Policy Research Institute (IFPRI), Washington DC, USA.
Janicot S., Caniaux G., Chauvin F., de Coëtlogon G., Fontaine B., Hall N., Kiladis G., Lafore J.-
P., Lavaysse C., Lavender S.L., Leroux S., Marteau R., Mounier F., Philippon N.,
Roehrig R., Sultan B. and Taylor C.M. (2011) Intraseasonal variability of the West
African monsoon. Atmospheric Science Letters 12: 58–66.
Jarvis A., Lane A., and Hijmans R.J. (2008) The effect of climate change on crop wild relatives.
Agricultural Ecosystems and Environment 126: 13–23.
Jongkind, C.C.H. (2004) Checklist of Upper Guinea forest species. In: Poorter, L., Bongers, F.,
Kouamé, F.N. and Hawthorne, W.D. (eds.) (2004) Biodiversity of West African Forests:
an ecological atlas of woody plant species. CABI Publishing, Cambridge, Massachusetts,
USA.
Karsenty, A. (2007) Overview of Industrial Forest Concessions and Concession-based Industry
in Central and West Africa and Considerations of Alternatives. Prepared by CIRAD-
FORET, Montpellier France, at the invitation of the Rights and Resources Group to
provide background information for Rights and Resources Initiative’s efforts in Central
and West Africa.
Kassam, L. (2014) Aquaculture and food security, poverty alleviation and nutrition in Ghana:
Case study prepared for the Aquaculture for Food Security, Poverty Alleviation and
Nutrition project. WorldFish, Penang, Malaysia.
Kissinger, G., Herold, M. and De Sy, V. (2012) Drivers of Deforestation and Forest
Degradation: A Synthesis Report for REDD+ Policymakers. Lexeme Consulting,
Vancouver Canada.
Koranteng, K.A. (1998) The impacts of environmental forcing on the dynamics of demersal
fishery resources of Ghana. PhD Thesis, University of Warwick, UK.
Koranteng, K. A. (2001) Diversity and stability of demersal species assemblages in the Gulf of
Guinea. West African Journal of Applied Ecology 2: 49-63.
Kormos, R. and Boesch, C. (2003) Regional Action Plan for the Conservation of Chimpanzees in
West Africa. IUCN/SSC Primate Specialist Group and Conservation International
Washington, DC, USA.
Kouame, O.M.L., Jengre, N., Kobele, M., Knox, D., Ahon, D.B., Gbondo, J., Gamys, J.,
Egnankou, W., Siaffa, D., Okoni-Williams, A. and Saliou, M. (2012). Key Biodiversity
Areas identification in the Upper Guinea forest biodiversity hotspot. Journal of
Threatened Taxa 4(8): 2745–2752.
Kouami, K., Yaovi, N. and Honan, A. (2009) Impact of charcoal production on woody plant
species in West Africa: A case study in Togo. Scientific Research and Essay 4(9): 881-
893.

292
KPMG (2014) Sector Report: Manufacturing in Africa. KPMG Africa Ltd, Parktown, South
Africa.
Kristensen, T. K., Stensgaard, A-S., Seddon, M. B., and McIvor, A. (2009). Chapter 4. The status
and distribution of freshwater mollusks (Molluska). In: Smith, K.G., Diop, M.D., Niane,
M. and Darwall, W.R.T. (Compilers). The Status and Distribution of Freshwater
Biodiversity in Western Africa. IUCN, Gland, Switzerland and Cambridge, UK.
Läderach, P., Martines-Valle, A., Schroth, G. and Castro, N. (2013) Predicting the future climatic
suitability for cacao farming of the world’s leading producer countries, Ghana and Côte
d’Ivoire. Climatic Change 119: 841-854.
Langhammer, P.F., Bakarr, M.I., Bennun, L.A., Brooks, T.M., Clay, R.P., Darwall, W., Silva,
N.D., Edgar, G.J., Fishpool, L.D.C., Foster, M.N., Knox, D.H., Matiku, P., Radford, E.A.,
Rodrigues, A.S.L., Salaman, P., Sechrest, W. and Tordoff, A.W. (2007) Identification and
Gap Analysis of Key Biodiversity Areas. IUCN, Gland, Switzerland.
Larsen, T.B. (2005) Butterflies of West Africa. Apollo Books, Vester Skerninge, Denmark.
Larsen, T.B. (2011) Liptena tiassale. The IUCN Red List of Threatened Species. Version 2015.1.
<www.iucnredlist.org>.
Larsen, T.B. (2012) Mylothris atewa. The IUCN Red List of Threatened Species. Version 2015.1.
<www.iucnredlist.org>.
Laurance, W.F., Croes, B.M., Tchignoumba, L., Lahm, S. A., Alonso, A., Lee, M.E., Campbell, P.
and Ondzeano, C. (2006) Impacts of roads and hunting on Central African rainforest
mammals. Conservation Biology 20(4): 1251-1261.
Lavachery, P., MacEachern, S., Mbida Mindzie, C. and Bouimon, T. (2012) Komé -
Kribi: Rescue Archaeology Along the Chad-Cameroon Oil Pipeline, 1999-2004. Journal
of African Archaeology Monograph. Africa Magna Verlag, Frankfurt, Germany.
Lawson, K. and Vines, A. (2014) Global impacts of the illegal wildlife trade: The costs of crime,
insecurity and institutional erosion. Chatham House, London, UK. Available from:
http://www.chathamhouse.org/sites/files/chathamhouse/public/Research/Africa/0214Wild
life.pdf
Le Barbé, L., T. Lebel, and D. Tapsoba (2002) Rainfall variability in West Africa: A
hydrological perspective. Journal of Climatology 15: 187–202.
Lebbie, A.R. (2015) World Wildlife Fund ecoregions; Tropical and Subtropical Moist Broadleaf
Forests. West Africa: Scattered across Guinea, Ivory Coast. Available from:
http://www.worldwildlife.org/ecoregions/at0114
Leach, M. (2004) Introduction to special issue: security, socio-ecology, and polity: mande
hunters. Civil Society and Nation-States in Contemporary West Africa. Africa Today
50(4): VII-XVI.
Leh, M.D.K., Matlock, M.D., Cummings, E.C., and Nalley L.L. (2013) Quantifying and
mapping multiple ecosystem services change in West Africa. Agriculture Ecosystems &
Environment. 165: 6-18.
Lehmann, J., Korstjens, A.H. and Dunbar, R.I.M. (2010) Apes in a changing world - the effects
of global warming on the behaviour and distribution of African apes. Journal of
Biogeography 37: 2217–2231.
Lévêque C., Paugy D. and Teugels G.G. (eds.) (1990) Faune des poissons d’eaux douces et
saumàtres de l’Afrique de I’Ouest, Tome 1. Faune tropicate, 28, Orstom/MRAC, Paris,
France.

293
Lévêque C., Paugy D. and Teugels G.G. (eds.) (1992) Faune des poissons d’eaux douces et
saumàtres de l’Afrique de I’Ouest, Tome 2. Faune tropicate, 28, Orstom/MRAC, Paris,
France.
Lewison, R. and Oliver, W. (IUCN SSC Hippo Specialist Subgroup) (2008) Choeropsis
liberiensis. The IUCN Red List of Threatened Species. Version 2015.1.
<www.iucnredlist.org>.
Li, K.Y., Coe, M.T., Ramankutty, N. and De Jong, R. (2007) Modeling the hydrological impact
of land-use change in West Africa. Journal of Hydrology 337: 258-268.
Linder, J.M. (2013) African primate diversity threatened by “new wave” of industrial oil palm
expansion. African Primates 8: 25-38.
Lindsell, J.A. and Klop, E. (2013) Spatial and temporal variation of carbon stocks in a lowland
tropical forest in West Africa. Forest Ecology and Management 289: 10-17.
Loh, J. and Harmon, D. (2005) A global index of biocultural diversity. Ecological Indicators
5(231): 231-241.
Lopes, M. (2012) São Tomé and Príncipe: Biodiversity threatened by oil palm plantations. World
Rainforest Movement Bulletin 183. Available from: http://wrm.org.uy/articles-from-the-
wrm-bulletin/section2/sao-tome-and-Príncipe-biodiversity-threatened-by-oil-palm-
plantations/
Macdonald, D.W., Johnson, P.J., Albrechtsen, L., Seymour, S., Dupain, J., Hall, A. and Fa, J.
(2012) Bushmeat trade in the Cross-Sanaga rivers region: evidence for the importance of
protected areas. Biological Conservation 147: 107-114.
Malhi, Y. and Wright, J. (2004) Spatial patterns and recent trends in the climate of tropical
rainforest regions. Philosophical transactions of the Royal Society of London. Series B,
Biological sciences 359: 311–29.
Mallon, D.P., Hoffmann, M., Grainger, M.J., Hibert, F., van Vliet, N. and McGowan, P.J.K.
(2015) An IUCN Situation Analysis on Terrestrial and Freshwater Fauna in West and
Central Africa. Occasional Paper of the IUCN Species Survival Commission No. 54.
IUCN, Gland, Switzerland and Cambridge, UK.
Marechal, C., Cawoy, V., Cocquyt, C., Dauby, G., Dessein, S., Douglas-Hamilton, I., Dupain, J.,
Fischer, E., Fouth Obang, D., Groom, Q., Henschel, P., Jeffery, K.J., Korte, L., Lewis,
S.L., Luhunu, S., Maisels, F. and Williamson, E.A. (2014) Biodiversity Conservation and
Management. In: de Wasseige, C., Flynn, J., Louppe, D., Hiol Hiol, F. and Mayaux P.
(eds) The Forests of the Congo Basin - State of the Forest 2013. Weyrich Edition
Neufchateau, Belgium.
Martinez-Porchas, M. and Martinez-Cordova, L.R. (2012) World Aquaculture: Environmental
Impacts and Troubleshooting Alternatives. The Scientific World Journal 2012: Article ID:
389623.
Masumbuko, B. and Somda, J. (2014) Analysis of the links between climate change, protected
areas and communities in West Africa. UNEP-WCMC, Cambridge, UK.
McClean C.J., Lovett J.C., Hannah L., Sommer H., Barthlott W., Termansen M., Smith G.F.,
Tokumine S., D J.R. and Ju N. (2005) African plant diversity and climate change. Annals
of the Missouri Botanical Garden 92: 139–152.
McSweeney, C., New, M., Lizcano, G. and Lu, X. (2010) The UNDP Climate Change Country
Profiles: Improving the Accessibility of Observed and Projected Climate Information for
Studies of Climate Change in Developing Countries. American Meteorological Journal.
91: 157–166.

294
Menaut, J.-C., Gignoux, J., Prado, C., and Clobert, J. (1990) Tree community dynamics in a
humid savanna of Côte d’Ivoire: modelling the effects of fire and competition with grass
and neighbours. Journal of Biogeography 17: 471-481.
MIKE Programme (Monitoring the Illegal Killing of Elephants) (2013) CITES-MIKE
Programme, West Africa, Meeting of the Subregional Steering Committee:
Minutes.Ouagadougou, 29-30 May 2013. Available from:
http://www.cites.org/sites/default/files/common/prog/mike/sub_reg/fw/1305_FW_MIKE
SSC_Minutes_Ouagadougou_en.pdf
Millennium Ecosystem Assessment (2005) Ecosystems and Human Well-being: Synthesis. Island
Press, Washington DC, USA.
Minority Rights Group International (2014) Peoples under threat: State of the world’s minorities
and indigenous peoples 2014. Minority Rights Group International, London, UK.
Mitchard, E.T.A., Saatchi, S.S., Gerard, F.F., Lewis, S.L. and Meir, P. (2009) Measuring woody
encroachment along a forest-savanna boundary in Central Africa. Earth Interactions
13(8): 1-29.
Mittermeier, R.A., Myers, N., Thomsen, J.B., Fonseca, G.A.B and Olivieri, S. (1998)
Biodiversity hotspots and major tropical widerness areas: approaches to setting
conservation priorities. Conservation Biology. 12(3): 516-520.
Mittermeier, R.A., Robles-Gil, P., Hoffmann, M., Pilgrim, J.D., Brooks, T.B., Mittermeier, C.G.,
Lamoreux, J.L. and Fonseca, G.A.B. (2004) Hotspots Revisited: Earth’s Biologically
Richest and Most Endangered Ecoregions. CEMEX, Mexico City, Mexico.
Möller, I. (2006) Quantifying saltmarsh vegetation and its effect on wave height dissipation:
results from a UK East coast saltmarsh. Journal of Estuarine, Coastal, and Shelf Sciences
69: 337-351.
Möller, I. and Spencer, T. (2002) Wave dissipation over macro-tidal saltmarshes: Effects of
marsh edge typology and vegetation change. Journal of Coastal Research. SI36, pp.506-
521.
Morgan, B., Adeleke, A., Bassey, T., Berg, R., Dunn, A., Fotso, R., Gadsby, E., Gonder, K.,
Greengrass, E., Koulagna, D.K., Mbah, G., Nicholas, A., Oates, J., Omeni, F., Saidu, Y.,
Sommer, V., Sunderland-Groves, J., Tiebou, J. and Williamson, E. (2011) Regional
Action Plan for the Conservation of the Nigeria-Cameroon Chimpanzee (Pan troglodytes
ellioti). IUCN/SSC Primate Specialist Group and Zoological Society of San Diego, CA,
USA.
Morton, J.K. (1986) Montane Vegetation. In: Lawson, G.W. (ed.) Plant ecology in West Africa:
systems and process. John Wiley and Sons, Chichester, UK.
Mumby, P.J., Edwards, A.J., Arias-Gonzalez, J.E., Lindeman, K.C., Blackwell, P.G., Gall, A.,
Gorczynska, M.I., Harborne, A.R., Pescod, C.L., Renken, H., Wabnitz, C.C.C and
Llewellyn, G. (2004) Mangroves enhance the biomass of coral reef fish communities in
the Caribbean. Nature 427: 533-536.
MyCrossRiver.com (2015) QIS, police and illegal logging of timber. Available from:
http://www.mycrossriver.com/qis-police-aid-illegal-logging-of-timber/
Nasi, R., Brown D., Wilkie, D., Bennett, E., Tutin, C., van Tol, G., and Christopherson, T.
(2008) Conservation and use of wildlife-based resource: the bushmeat crisis (Technical
Series No 33).Secretariat of the Convention on Biological Diversity, Montreal, Canada
and Center for International Forestry Research (CIFOR) Bogor, Indonesia.

295
NCRC (2008) Capacity Assessment of Environmental Organizations in Liberia in Preparation for
REDD. Available from:
http://growingforestpartnerships.org/sites/gfp.iiedlist.org/files/docs/liberia/general/Liberi
an%20Organizational%20Capacity%20Findings%20Oct08%20FINAL%20DRAFT%20d
js%201%20.pdf Nellemann, C., Henriksen, R., Raxter, P., Ash, N. and Mrema, E. (eds.) (2014) The
environmental crime crisis: Threats to sustainable development from illegal exploitation
and trade in wildlife and forest resources.A UNEP Rapid Response Assessment. United
Nations Environment Programme, Nairobi, Kenya and GRID-Arendal, Arendal, Norway.
NEPAD (New Partnership for Africa’s Development) (2003) Action Plan for the Environment
Initiative. Available from:
http://www.nepad.org/system/files/Environment%20Action%20Plan.pdf Niang-Diop, F. and Ouedraogo, L. R. (2009) Chapter 7. Aquatic plants of western Africa. In:
Smith, K.G., Diop, M.D., Niane, M. and Darwall, W.R.T. (Compilers) (2009) The Status
and Distribution of Freshwater Biodiversity in Western Africa. IUCN, Gland, Switzerland
and Cambridge, UK.
Nikolaus, G. (2001) Bird exploitation for traditional medicine in Nigeria. Malimbus 23: 45-55.
Nikolaus, G. (2011) The fetish culture in West Africa: An ancient tradition as a threat to
endangered birdlife? In: Schuchmann, K.L. (Ed.) (2008) Tropical vertebrates in a
changing world. Bonner Zoologische Monographien, ZFMK, Bonn, Germany.
Nilsson, C. (2009) Reservoirs. In: Likens, G.E. (ed) (2010) Lake Ecosystem Ecology: A Global
Perspective. Elsevier, New York, USA.
Ninan, K.N. and Inoue, M. (2013) Valuing forest ecosystem services: What we know and what
we don’t. Ecological Economics 93: 137-149.
Norris, K., Asase, A., Collen, B., Gockowksi, J., Mason, J., Phalan, B. and Wade, A. (2010).
Biodiversity in a forest-agriculture mosaic – The changing face of West African
rainforests. Biological Conservation 143: 2341-2350.
Nwanegbo, J. B. and Odigbo, J. (2013) Security and National Development in Nigeria: The
Threat of Boko Haram. International Journal of Humanities and Social Science 3(4):
285-291.
Nyambo, T.J (2008) The Legal Framework of Civil Society and Social Movements. In: Vubo,
E.Y. (ed.) (2008) Civil Society and the Search for Development Alternatives in
Cameroon. Council for the Development of Social Science Research in Africa, Dakar,
Senegal.
Oates, J. F. (2011) Primates of West Africa: a field guide and natural history. Conservation
International, Arlington, VA.
Oates, J.F., Bergl, R.A., Sunderland-Groves, J. and Dunn, A. (2008a) Gorilla gorilla ssp. diehli.
The IUCN Red List of Threatened Species 2008.
http://dx.doi.org/10.2305/IUCN.UK.2008.RLTS.T39998A10291873.en Downloaded on
18 October 2015.
Oates, J.F., Dunn, A., Greengrass, E. and Morgan, B.J. (2008b) Pan troglodytes ssp. ellioti. The
IUCN Red List of Threatened Species 2008.
http://dx.doi.org/10.2305/IUCN.UK.2008.RLTS.T40014A10301774.en Downloaded on
18 October 2015.

296
Observatoire des Forêts d’Afrique Centrale (2012) The Forests of the Congo Basin State of the
Forest 2010. Available from:
http://www.observatoire-comifac.net/docs/edf2010/EN/State_of_the_Forest_2010.pdf
Observatory of Economic Complexity (2015) Available from: https://atlas.media.mit.edu/en/
Okojie, C. (2009) Decentralization and Public Service Delivery in Nigeria. International Food
Policy Research Institute (IFPRI), Washington DC, USA.
Olson, D.H., Aanensen, D.M., Ronnenberg, K.L., Powell, C.I., Walker, S.F., Bielby, J., Garner,
T.W.J., Weaver, G., The Bd Mapping Group and Fisher, M.C. (2013) Mapping the Global
Emergence of Batrachochytrium dendrobatidis, theAmphibian Chytrid Fungus. PLoS
ONE 8(2): e56802.
Olson, D.M., Dinerstein, E., Wikramanayake, E.D., Burgess, N.D., Powell, G.V.N., Underwood,
E.C., D’amico, J.A., Itoua, I., Strand, H.E., Morrison, J.C., Loucks, C.J., Allnutt, T.F.,
Ricketts, T.H., Kura, Y., Lamoreux, J.F., Wettengel, W.W., Hedao, P. and Kasse, K.R
(2001) Terrestrial ecoregions of the world: a new map of life on Earth. Bioscience 51(11):
933-938.
Onana, J.M. and Cheek, M. (2012) Red Data Book of the Flowering Plants of Cameroon: IUCN
Global Assessments. Royal Botanic Gardens Kew, Richmond, UK.
Ong, J.E. (1993) Mangroves – a carbon source and sink. Chemosphere 27: 1097-1107.
Oyebo M., Bisong F. and Morakinyo T. (2010) A preliminary assessment of the context for
REDD in Nigeria. Federal Ministry of Environment, Cross River State’s Forestry
Comission and UNDP.
Oyedepo, S.O. (2012) Energy and sustainable development in Nigeria: the way forward. Energy,
Sustainability and Society 2012(2):15
Oyono, P.R. (2004) Institutional Deficit, Representation, and Decentralized Forest Management
in Cameroon: Elements of Natural Resource Sociology for Social Theory and Public
Policy. Available from: http://www.africa.upenn.edu/Articles_Gen/egawp15.pdf
Oyono, P.R. (2005) Profiling Local-Level Outcomes of Environmental Decentralizations: The
Case of Cameroon’s Forests in the Congo Basin. Journal of Environment and
Development 14(2): 1–21.
Palla, F., Picard, N., Abernethy, K., Ukizintambara, T., White, E.C., Riera, B., Rudant, J.-P., and
White, L.J.T. (2011) Structural and floristic typology of the forests in the forest-savanna
mosaic of the Lopé National Park, Gabon. Plant Ecology and Evolution 144(3): 255-266.
PARCC (2010). PARCC Project: Protected Areas Resilience to Climate Change. Available from:
http://www.parcc-web.org/
Paugy, D., Lévêque, C. and Teugels, G.G. (2003) Poissons d’eaux douces et saumâtres de
l’Afrique de l’Ouest [The Fresh and Brackish Water Fishes of West Africa]. Tomes 1 and
2. IRD Editions, France.
Paul, F.M., Simons, G.F and Fennig C.D. (eds.). (2015) Ethnologue: Languages of the World,
Eighteenth edition. SIL International, Dallas, Texas, USA.
Pauly, D., Belhabib, D., Blomeyer, R., Cheung, W.W.W.L., Cisneros-Montemayor, A.M.,
Copeland, D., Harper, S., Lam, V.W.Y., Mai, Y., Le Manach, F., Österblom, H., Mok,
K.M., van der Meer, L., Sanz, A., Shon, S., Sumaila, U.R., Swartz, W., Watson, R., Zhai,
Y. and Zeller, D. (2014) China’s distant-water fisheries in the 21st century. Fish and
Fisheries 15:474–488.
Penner, J., Adum, G.B., McElroy, M.T., Doherty-Bone, T., Hirschfeld, M., Sandberger, L.,
Weldon, C., Cunningham, A.A., Ohst, T., Wombwell, E., Portik, D.M., Reid, D., Hillers,

297
A., Ofori-Boateng, C., Oduro, W., Plötner, J., Ohler, A., Leaché, A.D. and Rödel, M.-O.
(2013) West Africa - A Safe Haven for Frogs? A SubContinental Assessment of the
Chytrid Fungus (Batrachochytrium dendrobatidis). PLoS ONE 8(2): e56236.
PIDA (Programme for Infrastructure Development in Africa) (2015) PIDA objectives. Available
from: http://www.au-pida.org/pida-objectives
Platts P.J., Omeny P.A. and Marchant R. (2014) AFRICLIM: high-resolution climate projections
for ecological applications in Africa. African Journal of Ecology. 53(1): 103-108.
Polidoro, B.A., Carpenter, K.E., Collins, L., Duke, N.C., Ellison, A.M., Ellison, J.C., Farnworth,
E.J., Fernando, E.S., Kathiresan, K., Koedam, N.E., Livingstone, S.R., Miyagi, T.,
Moore, G.E., Nam, V.N., Ong, J.E., Primavera, J.H., Salmo III, S.G., Sanciangco, J.C.,
Sukardjo, S., Wang, Y. and Yong. Y.W.H. (2010) The loss of species: mangrove
extinction risk and geographic areas of global concern. PLoS One 5(4): e10095.
Polis, G.A., Sánchez-Piñero, F., Stapp, P.T., Anderson, W.B. and Rose, M.D. (2004) Trophic
flows from water to land: marine input affects food webs of islands and coastal
ecosystems worldwide. In: Polis, G.A., Power, M.E. and Huxel, G.R. (eds.) (2004) Food
webs at the landscape level. University of Chicago Press, Chicago, Illinois, USA.
Population Reference Bureau (2013) 2013 World Population Data Sheet. Available from:
http://www.prb.org/pdf13/2013-population-data-sheet_eng.pdf
Pouliot, M., Treue, T., Obiri, B.D., and Ouedraogo, B. (2012) Deforestation and the Limited
Contribution of Forests to Rural Livelihoods in West Africa: Evidence from Burkina Faso
and Ghana. Ambio. 41(7): 738–750.
PwC (2013) Gridlines: Seperating fact from fiction in the China-Africa relationship.
Pricewaterhouse Coopers, USA.
PwC (2014) Trends, challenges and future outlook: Capital projects and infrastructure in East
Africa, Southern Africa and West Africa. Pricewaterhouse Coopers, South Africa.
Rautner, M., Leggett, M. and Davis, F. (2013) The Little Book of Big Deforestation Drivers.
Global Canopy Programme, Oxford, UK.
Reid, H., Alam, M., Berger, R., Cannon, T., Huq, S. and Milligan, A. (2009) Participatory
Learning and Action 60: Community-based Adaptation to Climate Change. IIED,
London, UK.
Religion Facts (2014) Religion statistics by country. Available from:
http://www.religionfacts.com/
Republic of Benin (2002) Stratégie Nationale et Plan d’Actionpour la Conservation de la
Diversité Biologique. Ministere de L’Environnement, de L’Habitat et de L’Urbanisme,
Cotonou, Benin.
Republic of Benin (2014) Cinquième Rapport National sur la Mise en Œuvre de la Convention
sur la Diversité Biologique au Bénin. Ministere de L’Environnement, de L’Habitat et de
L’Urbanisme, Cotonou, Benin.
Republic of Cameroon (1999) Biodiversity Status and Action Plan. Available from:
http://www.informea.org/sites/default/files/reports/action_plans/cm-nbsap-01-p1-en.pdf.
Republic of Cameroon (2012) National Biodiversity Strategy and Action Plan. Available from:
https://www.cbd.int/doc/world/cm/cm-nbsap-v2-en.pdf.
Republic of Côte d’Ivoire (2002) Stratégie Nationale de conservation et d’Utilisation Durable de
la Diversité Biologique de la Côte d’Ivoire. Available from:
https://www.cbd.int/doc/world/ci/ci-nbsap-01-fr.pdf.

298
Republic of Equatorial Guinea (2005) Estrategia y Plan de Acción para la Conservación de la
Biodiversidad en Guinea Ecuatoria. Ministerio de Pesca y Medio Ambiente, Malabo,
Equatorial Guinea.
Republic of Ghana (2002) National Biodiversity Strategy for Ghana. Available from:
http://gh.chm-cbd.net/implementation/documents-relation-cbd/national-strategy-and-
action-plan/nbsap-gha.pdf/download/en/1/nbsap-gha.pdf?action=view.
Republic of Guinea (2002) Stratégie Nationale et Plan d’Actions sur la Diversité Biologique.
Available from: https://www.cbd.int/doc/world/gn/gn-nbsap-01-p1-en.pdf.
Republic of Liberia (2004) Liberia’s National Biodiversity Strategy and Action Plan. Available
from: https://www.cbd.int/doc/world/lr/lr-nbsap-01-p1-en.pdf.
Republic of Liberia (2014) Fifth National Report of Liberia to the Convention on Biological
Diversity. Available from: https://www.cbd.int/doc/world/lr/lr-nr-05-en.pdf.
Republic of Nigeria (2006) National Biodiversity Strategy and Action Plan. Federal Ministry of
Environment, Abuja, Nigeria.
Republic of Sierra Leone (2006) Biodiversity Strategy and Action Plan. Available from:
https://www.cbd.int/doc/world/sl/sl-nbsap-01-en.pdf.
Reuters (2008) “Bushmeat fuels wildlife debate. Available from:
http://www.reuters.com/article/2008/09/16/us-bushmeat-idUSLG23848920080916
Rhein, M., Rintoul, S.R., Shigeru, A., Campos, E., Chambers, D., Feely, R., Gulev, S., Johnson,
G., Josey, S., Kostianoy, A., Maurizen, C., Rooemmich, D., Talley, L. and Wang, F.
(2013) Observations: Ocean. In: Stocker, T.F., Qin, D., Plattner, G.-K., Tignor, M.,
Allen, S.K., Boschung, J., Nauels, A., Xia, Y., Bex, V. and Midgley, P.M. (eds.) (2013)
Climate Change 2013: The Physical Science Basis. Contribution of Working Group I to
the Fifth Assessment Report of the Intergovernmental Panel on Climate Change.
Cambridge University Press, Cambridge, UK.
Ricketts, T.H., Dinerstein, E., Boucher, T., Brooks, T.M., Butchart, S.H.M., Hoffmann, M.,
Lamoreux, J.F., Morrison, J., Parr, M. and Pilgrim, J.D. (2005) Pinpointing and
Preventing Imminent Extinctions. Proceedings of the National Academy of Sciences of the
United States of America 102; 18497–18501.
Ringler C. (2009) Mapping South African Farming Sector Vulnerability to Climate Change and
Variability: A Subnational Assessment. IFPRI, Washington, USA.
Robinson, J.G. and Bennett, E.L. (eds.) (2000) Hunting for sustainability in tropical forests.
Columbia University Press, New York, USA.
Rodríguez-Fonseca, B., Janicot, S., Mohino, E., Losada, T., Bader, J., Caminade, C., Chauvin,
F., Fontaine, B., García-Serrano, J., Gervois, S., Joly, M., Polo, I., Ruti, P., Roucou, P.
and Voldoire, A. (2011) Interannual and decadal SST-forced responses of the West
African monsoon. Atmospheric Science Letters 12: 67–74.
Ross, G.J.B. (2002) Humpback dolphins Sousa chinensis, S. plumbea, and S. teuszii. In: Perrin,
W.F., Wursig, B. and Thewissen, J.G.M. (eds.) (2002) Encyclopedia of Marine Mammals.
Academic Press, Waltham, USA.
Ryan, S.J. and Walsh, P.D. (2011) Consequences of Non-Intervention for Infectious Disease in
African Great Apes. PLoS ONE 6(12): e29030.
Saéz, A.M., Weiss, S., Nowak, K., Lapeyre, V., Zimmermann, F., Düx, A., Kühl, H.S., Kaba, M.,
Regnaut, S., Merkel, K., Sachse, A., Thiesen, U., Villányi, L., Boesch, C., Dabrowski,
P.W., Radonić, A., Nitsche, A., Leendertz, S.A.J., Petterson, S., Becker, S., Krähling, V.,
Couacy-Hymann, E., Akoua-Koffi, C., Weber, N., Schaade, L., Fahr, J., Borchert, M.,

299
Gogarten, J.F., Calvignac-Spencer, S. and Leendertz, F.H. (2015) Investigating the
zoonotic origin of the West African Ebola epidemic. EMBO Molecular medicine 7: 17–
23.
Scheren, P.A.G.M. and Ibe, A.C. (2002) Environment Pollution in the Gulf of Guinea: A regional
Approach. In: McGlade, J.M., Cury, P., Koranteng, K.A. and Hardman Mountford, N.J.
(2002) The Gulf of Guinea Large Marine Ecosystem. Elsevier Science B.V.
Segniagbeto, G., Petrozzi, F., Aïdam, A . and Luiselli, L. (2013) Reptiles Traded In The Fetish
Market Of Lomé, Togo (West Africa). Herpetological Conservation and Biology 8:
400−408.
Seto, K.C., Güneralp B. and Hutyra L.R. (2012). Global forecasts of urban expansion to 2030
and direct impacts on biodiversity and carbon pools. Proceeding of the National Academy
of Sciences 109(40): 16083-16088.
Shepherd, G., Kazoora, C. and Mueller, D. (2013) Forests, livelihoods and poverty alleviation:
the case of Uganda (Forestry Policy and Institutions Working Paper No. 32). FAO,
Rome, Italy.
Shepherd, G. and Kofi Nyame, S. (2009) Results from application of the Forests-Poverty Toolkit
in WasaAmenfi West District, Ghana. Livelihoods and Landscapes Programme, IUCN,
Gland Switzerland.
Smith, K.G., Diop, M.D., Niane, M. and Darwall, W.R.T. (Compilers) (2009) The Status and
Distribution of Freshwater Biodiversity in Western Africa. IUCN, Gland, Switzerland
and Cambridge, UK.
Solarin, B.B., Williams, A.B., Hamzat, M.B., Rabiu, A., Oguntade, O.R., Bolaji, D.A. and
Oramadike, M. (2010) Report on survey of fish and other living resources of the Nigerian
coastal waters conducted between 14th April and 6th June 2009. NIOMR, Lagos,
Nigeria.
Spalding, M.D., Fox, H.E., Allen, G.R., Davidson, N., Ferdaña, Z.A., Finlayson, M., Halpern,
B.S., Jorge, M.A., Lombana, A., Lourie, S.A., Martin, K.D., McManus, E., Molnar,
J.,Recchia C.A. and Robertson, J. (2007) Marine ecoregions of the World: A
bioregionalization of coastal and shelf areas. BioScience 57(7): 573-583.
Species+ (2015) Species trade database of MEA listed species. Available from:
http://www.speciesplus.net/species.
Speechly, H. (2015) Taking stock: Tracking trends in European Aid for forests and communities.
Fern, Moreton in Marsh, UK and Brussels, Belgium.
Spiers, A.G. (2001) Wetland Inventory: Overview at a global scale. In: Finlayson, C.M.,
Davidson, N.C. and Stevenson, N.J. (eds.) (2001) Wetland inventory, assessmentand
monitoring: Practical techniques and identification of major issues. Proceedings of
Workshop 4, 2nd International Conference on Wetlands and Development, Dakar,
Senegal, 8-14 November 1998, (Supervising Scientist Report 161). Supervising Scientist,
Darwin, Australia.
Stoms, D.M., Davis, F.W., Andelman, S.J., Carr, M.H., Gaines, S.D., Halpern, B.S., Hoenicke,
R., Leibowitz, S.G., Leydecker, A., Madin, E.M.P., Tallis, H. and Warner, R.R. (2005)
Integrated coastal reserve planning: making the land-sea connection. Frontiers in
Ecology and the Environment 3: 429-436.
Strassburg, B., Creed, A. and Ashton, R. (2009) Policy Briefs 1: Distribution of terrestrial carbon
across developing countries, Terrestrial Carbon Group (TCG). Available from:

300
http://www.theredddesk.org/sites/default/files/resources/pdf/2010/TCG_Policy_Brief_1_
Distribution_of_TC_Jun_09.pdf
Svensson, M.S, and S. C. Friant (2014) Threats from trading and hunting of pottos and
angwantibos in Africa resemble those faced by slow lorises in Asia. Endangered Species
Research 23: 107–114.
TerHeegde, M. and Rietbergen, S. (2008) Northern Congo, the case of CIB: applying the
ecosystem approach in the context of a logging concession. In: Shepherd, G. (ed.) (2008)
The Ecosystem Approach, learning from experience. IUCN, Gland, Switzerland.
The REDD Desk (2015) REDD in Sierra Leone. Available from:
http://theredddesk.org/countries/sierra-leone/
Thieme, M.L., Abell, R., Stiassny, M.L.J.S., Lehner, B., Skelton, P., Teugels, G., Dinerstein, E.,
Toham, A.K., Burgess, N. and Olson, D. (2005) Freshwater Ecoregions of Africa and
Madagascar, a Conservation Assessment. World Wildlife Fund (WWF), United States.
Thieme M.L., Lehner B., Abell R. and Matthews J. (2010) Exposure of Africa’s freshwater
biodiversity to a changing climate. Conservation Letters 3: 324–331.
This Day Live (2013) FG Approves $1.72 bn Counterpart Funding for Hydro Dams. Available
from: http://www.thisdaylive.com/articles/fg-approves-1-72-bn-counterpart-funding-for-
hydro-dams/149335/
Thomas, M.R., Smith, G., Ferreira, F.H.G., Evans, D., Maliszewska, M., Cruz, M., Himelein, K.
and Over, M. (2015) The economic impact of Ebola on Sub-Saharan Africa : updated
estimates for 2015. World Bank Group, Washington DC, USA.
Thomas Reuters Foundation (2013) West Africa hopes new hydropower dams will cut poverty,
climate risk. Available from: http://www.trust.org/item/20131217125940-0yqo5/.
Thorsen, B.J. (2014) Valuing water externalities from forests. In: Thorsen, J., Mavsar, R.,
Tyrvӓinen, L., Prokofieva, I. and Stenger, A. (eds.) (2014) The Provision of Forest
Ecosystem Services Volume I: Quantifying and valuing non-marketed ecosystem services.
European Forest Institute, Joensuu, Finland.
Thuiller W., Broennimann O., Hughes G., Alkemade J.R.M., Midgley G.F. and Corsi F. (2006)
Vulnerability of African mammals to anthropogenic climate change under conservative
land transformation assumptions. Global Change Biology 12: 424–440.
Tigani, M. and Brandolini, G. V. (2006) Liberia Environmental Profile. Available from:
http://www.londonpressservice.org.uk/haeu/20131119131420/http://ec.europa.eu/develop
ment/icenter/repository/liberia_CEP_preliminary_report.pdf.
Transparency International (2014) Corruption Perceptions Index 2014: Results. Available from:
www.transparency.org/cpi2014/results.
Tsikata, D., Gyekye-Jandoh, M. and Hushie, M. (2013) Political Economy Analysis (PEA) of
Civil Society in Ghana. STAR-Ghana report. STAR-Ghana, Accra, Ghana.
Turner W.R., Bradley B.A., Estes L.D., Hole D.G., Oppenheimer M. and Wilcove D.S. (2010)
Climate change: helping nature survive the human response. Conservation Letters 3:
304–12.
Tutin, C., Stokes, E., Boesch, C., Morgan, D., Sanz, C., Reed, T., Blom, A., Walsh, P., Blake, S.
and Kormos, R. (2005) Regional Action Plan for the Conservation of Chimpanzees and
Gorillas in Western Equatorial Africa. IUCN/SSC Primate Specialist Group and
Conservation International Washington DC, USA.

301
Tuwor, T, and Sossou, M.A. (2008) Gender discrimination and education in West Africa:
strategies for maintaining girls in school. International Journal of Inclusive Education
12(4): 363–379.
UEMOA (West African Economic and Monetary Union) (2010). Regional shoreline monitoring
study and drawing up of a management scheme for the West African coastal area.
Available from:
https://cmsdata.iucn.org/downloads/sdlao_1__general_management_scheme.pdf
Ukwe, C.N., Ibe, C.A., Alo, B.I. and Yumkella, K.K. (2003) Achieving a Paradigm shift in
Environmental and Living Resources Management in the Gulf of Guinea: the Large
Marine Ecosystem Approach. Marine Pollution Bulletin 47: 219-225.
Ukwe, C.N., Isebor, C.E. and Alo, B.I. (2001) Implementing the Quality of Coastal Waters in the
Gulf of Guinea Large Marine Ecosystem Through Mangrove Restoration. Proceedings of
the 12th Biennial Coastal Zone Conference. Cleveland, Ohio, July 15-19. CD-ROM.
UNCTAD (2014) World Investment Report 2014: Investing in the SDGs: an action plan. United
Nations Publications, Switzerland.
UNdata (2015) Cameroon Country Profile. Available from:
http://data.un.org/CountryProfile.aspx?crName=Cameroon
UNDP (2006) CIVICUS Civil Society Index - A diagnostic Study of Togolese Civil Society.
Available from:
http://www.afrimap.org/english/images/documents/CSI_Togo_Country_Report.pdf
UNDP (2006) CIVICUS Civil Society Index for the Republic of Sierra Leone - A Critical time
for Civil Society in Sierra Leone. Available from:
http://www.civicus.org/new/media/CSI_SierraLeone_Country_Report.pdf
UNDP (2006) Evaluation of UNDP Assistance to Conflict-Affected Countries: Case study Sierra
Leone. UNDP Evaluation Office, New York, USA.
UNDP (2011) CIVICUS Civil Society Index for Guinea - Guinea Civil Society between
Activities and Impacts. Available from:
http://www.civicus.org/images/stories/csi/csi_phase2/guinea%20acr.pdf
UNDP (2013) Human Development Report 2013 - The Rise of the South: Human Progress in a
Diverse World. UNDP, New York, USA.
UNDP (2014) Human Development report 2014 – Sustaining Human Progress: Reducing
vulnerabilities and building resilience. UNDP, New York, USA.
UNDP Human Development Index (2012). Available from: https://data.undp.org/dataset/Table-
1-Human-Development-Index-and-its-components/wxub-qc5k
UNECA (2012) Land policy in Africa: Central Africa Regional Assessment. UNECA, Addis
Ababa, Ethiopia.
UNEP (2007) Mangroves of Western and Central Africa. UNEP-Regional Seas Programme,
Nairobi, Kenya and UNEP-WCMC, Cambridge, UK.
UNEP (2008) Africa: Atlas of Our Changing Environment. UNEP, Nairobi, Kenya.
UNEP (2010) Sierra Leone: Environment, Conflict and Peacebuilding Assessment. UNEP
Technical Report. UNEP, Nairobi, Kenya.
UNEP (2011) Environmental Assessment of Ogoniland. UNEP, Nairobi, Kenya.
UNEP-WCMC (2013) CITES at 40: perspectives, trade patterns and future prospects. UNEP-
WCMC, Cambridge, UK.

302
UNESCO (2012) Coastal erosion major threat to West Africa. Available from:
http://www.unesco.org/new/en/media-services/single-
view/news/coastal_erosion_major_threat_to_west_africa/#.UwTUOc5Aca1%29
UNESCO (2013) State of Conservation (SOC) Mount Nimba Strict Nature Reserve. Available
from: http://whc.unesco.org/en/soc/1857
UNESCO (2014) EFA Global MonitoringReport, 2013/2014. Available from:
http://unesdoc.unesco.org/images/0022/002256/225660e.pdf
UNFCCC (2013) Report on the technical workshop on ecosystem-based approaches for
adaptation to climate change. Note by the secretariat. Available from:
http://unfccc.int/resource/docs/2013/sbsta/eng/02.pdf.
UNFCCC (2014) LDC Info. - National Adaptation Plans. Available from:
http://unfccc.int/adaptation/workstreams/national_adaptation_plans/items/7595.php.
UNHCR (2015) 2015 UNHCR subregional operations profile: West Africa. Available from:
http://www.unhcr.org/pages/49e484f76.html.
United Nations (2012) World Urbanisation prospects: the 2011 revision, highlights. United
Nations Economic and Social Affairs, New York, USA.
United Nations Department of Economic and Social Affairs, Population Division (2014) World
Urbanization Prospects: The 2014 Revision, CD-ROM Edition. United Nations
Economic and Social Affairs, New York, USA.
USAID (2008) Togo: 118/119 Biodiversity and Forest Assessment. Available from:
http://pdf.usaid.gov/pdf_docs/PNADL905.pdf.
USAID (2013) Background paper for the ARCC West Africa regional climate change
vulnerability assessment. USAID, Washington, USA.
USAID (2015) USAID Land Tenure and Property Rights Portal Country Profiles. Available
from: http://usaidlandtenure.net/country-profiles
Usman, B.A. and Adefalu, L.L. (2010) Nigerian Forestry, Wildlife and Protected Areas: Status
Report 2010. Available from: http://www.tandf.co.uk/journals/pdf/freeaccess/Nigerian-
forestry.pdf
van der Burgt, X.M. and Eyakwe, M. (2010) Searching for undescribed large tree species in the
rainforest of Korup National Park, Cameroon. In: van der Burgt, X.M. van der Maesen,
J. and Onana, J.M. (eds.) (2010) Systematics and Conservation of African Plants. Royal
Botanic Gardens, Kew, London, UK.
van Schaik, L. and Dinnissen, R. (2014) Terra Incognita: land degradation as an underestimated
threat amplifier. Clingendael Institute and The Netherlands Institute of International
Relations, The Hague, The Netherlands.
van Waerebeek, K., Barnett, L., Camara, A., Cham, A., Diallo, M., Djiba, A., Jallow, A., Ndiaye,
E., Ould-Bilal, A. O. S. and Bamy, I. L. (2004) Distribution, status, and biology of the
Atlantic humpback dolphin, Sousa teuszii (Kukenthal, 1892). Aquatic Mammals 30(1):
56-83.
Vansina, J. (1990) Paths in the Rainforest: toward a history of political tradition in Equatorial
Africa. James Currey, London, UK.
Vega, M.G., Carpinetti, B., Duarte, J., and Fa, J.E. (2013) Contrasts in Livelihoods and Protein
Intake between Commercial and Subsistence Bushmeat Hunters in two Villages on Bioko
Island, Equatorial Guinea. Conservation Biology 27(3): 576-587.
VERITE (2011) Rubber production in Liberia: An exploratory assessment of living and working
conditions, with special attention to forced labour. VERITE, Amherst, USA.

303
Vincens, A., Schwartz, D., Elenga, H., Reynaud-Farrera, I., Alexandre, A., Bertaux, J., Mariotti,
A., Martin, L., Meunier, J.-D., Nguetsop, F., Servant, M., Servant-Vildary, S., and
Wirrman, D. (1999) Forest response to climate changes in Atlantic Equatorial Africa
during the last 4,000 years BP and inheritance in the modern landscapes. Journal of
Biogeography 26: 879-895.
von Grebmer, K., Heady, D., Olofinbiyi, T., Wiesmann, D., Fritschel, H., Yin, S., Yohannes, Y.,
Foley, C., von Oppeln, C., Iseli, B., Béné, C. and Haddad, L. (2013) International Food
Policy Research Institute 2013 Global Hunger Index. IFPRI, Washington DC, USA.
Walsh, P.D, Abernethy, K.A., Bermejo, M., Beyers, R., De Wachter, P., Akou, M.E., Huijbregts,
B., Mambounga, D.I., Toham, A.K., Kilbourn, A.M., Lahm, S.A., Latour, S., Maisels, F.,
Mbina, C., Mihindou, Y., Obiang, S.N., Effa, E.N., Starkey, M.P., Telfer, P., Thibault, M.,
Tutin, C.E.G., White, L.J.T. and Wilkie, D.S. (2003) Catastrophic ape decline in western
equatorial Africa. Nature 422: 611-614.
Walsh, P.D., Tutin, C.E.G., Oates, J.F., Baillie, J.E.M., Maisels, F., Stokes, E.J., Gatti, S., Bergl,
R.A., Sunderland-Groves, J. and Dunn. A. (2008) Gorilla gorilla. The IUCN Red List of
Threatened Species. Version 2014.2. <www.iucnredlist.org>.
Walters, B.B., Ronnback, P., Kovacs, J.M., Crona, B., Hussain, S.A., Badola, R., Primavera,
J.H., Barbier, E. and Dahdouh-Guebas, F. (2008) Ethnobiology, socio-economics and
management of mangrove forests: a review. Aquatic Botany 89: 220-236.
Warfield, K.L., Goetzmann, J.E., Biggins, J.E., Kasdac, M.B., Unfera, R.C., Vua, H., Amana,
M.J., Olinger Jr., G.G. and Walsh, P.D. (2014) Vaccinating captive chimpanzees to save
wild chimpanzees. Proceedings of the National Academy of Sciences 111(24): 8873–
8876.
Warner, K., Erhart, C., de Sherbinin, A., Adamo, S. and Chai-Onn, T. (2009) In Search of
Shelter: Mapping the effects of climate change on human migration and displacement.
Care International, Atlanta, Georgia, USA.
WASSDA (2008) West African Fisheries Profiles. Available from:
http://www.imcsnet.org/imcs/docs/west_africa_fisheries_country_profile_exec_sum.pdf.
Watson, J.E.M. and Segan, D.B. (2013) Accommodating the human response for realistic
adaptation planning: response to Gillson et al. Trends in ecology and evolution. 28: 573–
574.
WCF (2015) Wild Chimpanzee Foundation. Available from: http://www.wildchimps.org.
Weigert, M. (2015) Tourism in West Africa: an economic, social and cultural opportunity.
Available from: http://www.afdb.org/en/blogs/measuring-the-pulse-of-economic-
transformation-in-west-africa/post/tourism-in-west-africa-an-economic-social-and-
cultural-opportunity-14479/
Welcomme, R.L. (2002) An evaluation of tropical brush and vegetation park fisheries. Fisheries
Management and Ecology 9: 175-188.
West African Resource Watch Bulletin (2011) Natural Resources Management in West Africa -
The Role of Civil Society and the Media. Available from:
http://www.comminit.com/natural-resource/content/natural-resource-management-west-
africa-role-civil-society-and-media.
WHO (2015) Ebola Situation Reports. Available from: http://apps.who.int/ebola/
Wicander, S. (2012) The lessons learned from alternative livelihood projects to reduce bushmeat
hunting in West and Central Africa. MSc dissertation, University of Oxford, Oxford, UK.

304
Wicander, S. and Coad, L. (2015) Learning our Lessons: A Review of Alternative Livelihood
Projects in Central Africa. ECI, University of Oxford, Oxford, UK and IUCN, Gland,
Switzerland.
Wilkie, D.S., Bennett, E.L., Peres, C.A. and Cunningham, A.A. (2011) The empty forest
revisited. Year in Ecology and Conservation Biology 1223: 120-128.
Wittig, R., König, K., Schmidt, M. and Szarzynski, J. (2007) A Study of Climate Change and
Anthropogenic Impacts in West Africa. Environmental Science and Pollution Research
14: 182-189.
World Bank (2005) Ghana: Natural Resources Management and Growth sustainability. Report
Prepared by the Department of International Development, UK, the Institute of Statistics
and Social studies, Ghana, and the World Bank, USA.
World Bank (2008) Decentralization in Guinea: Strengthening Accountability for Better Service
Delivery. Report No. 38664-GN. Public Sector Reform and Capacity Building Unit
(AFTPR) Africa Region, World Bank Group, Washington DC, USA.
World Bank (2013) The World Bank – World Development Indicators: Table 1.1 Size of the
Economy. Available from: http://databank.worldbank.org/data/download/WDI-2013-
ebook.pdf.
World Bank (2014a) Côte d’Ivoire – Country Overview. World Bank Group, Washington DC,
USA.
World Bank (2014b) The Worldwide Governance Indicators (WGI) Project. World Bank Group,
Washington DC, USA.
World Bank (2015a) The World Bank – World Development Indicators. Available from:
http://data.worldbank.org/indicator
World Bank (2015b) EdStats Dashboards. Available from:
http://datatopics.worldbank.org/Education/wDashboard/tbl_index.aspx
World Commission on Dams (2000) Dams and development: A new framework for decision-
making. The report of the World Commission on Dams. Earthscan, London, UK and
Sterling, Virginia, USA.
Worldpop (2015) Worldpop. Available from: http://www.worldpop.org.uk/
World Tourism Organization (WTO) (2006) Tourism Market Trends – Africa. Available from:
http://www.e-unwto.org/doi/book/10.18111/9789284412136
World Tourism Organization (WTO) (2007) Tourism Market Trends – Africa. Available from:
http://www.e-unwto.org/doi/pdf/10.18111/9789284412914
WWF (2015) Gender and conservation. Available from:
http://wwf.panda.org/what_we_do/how_we_work/people_and_conservation/our_work/ge
nder_and_conservation/
WRI (2013) CAIT Climate Data Explorer. Available from: http://cait2.wri.org
Zagerma, B. (2011) Land and Power: The growing scandal surrounding the new wave of
investments in land. Oxfam International, Oxford, UK.
Zangato, E. and Holl, A.F.C. (2010) On the iron front: new evidence from North-Central Africa.
Journal for African Archaeology 8(1): 7-23.

305
Appendix 1: Overview of Terrestrial Ecoregions within the Guinean Forests of West Africa Hotspot
Ecoregion Threat status
Geographic notes Major habitat(s) and defining
features
Upper Guinean Forests Subregion
Cross-Sanaga-Bioko Coastal Forests
Vulnerable Extending from the left bank of the Cross River in southeastern Nigeria, following the coast as far south as the Sanaga River in Cameroon, and extending inland up to 300 km. It also includes the lowland forests of the island of Bioko.
Comprising lowland and coastal forest habitats, the biogeographical barriers of the Sanaga River in Cameroon and the Cross River in Nigeria define the mainland boundaries of this ecoregion.
Eastern Guinean Forests
Critical Stretching from Sassandra River in western Côte d’Ivoire, and east to Lake Volta in Ghana. The Dahomey Gap defines the far eastern border of the ecoregion.
Tropical and subtropical broadleaf forests are the primary habitat of this ecoregion. The forest grades from the south to north from moist evergreen, to moist semi-evergreen, to dry semi-evergreen in the north of the ecoregion.
Guinean Montane Forests
Critical/ Endangered
Spanning four countries in the Upper Guinean Forests subregion: from Guinea in the north and northwest to Côte d’Ivoire in the east. Patches also occur in Sierra Leone and Liberia
High altitude peaks and plateaus of the four associated countries, delimited by a lower altitude of 600m.
Western Guinean Lowland Forests
Critical/ Endangered
Comprising a significant proportion of the whole (western) Upper Guinean Forests subregion, this ecoregion spans from eastern Guinea, across Sierra Leone and Liberia, to the Sassandra River in southwestern Côte d’Ivoire.
Seemingly contiguous with the Eastern Guinean Forest ecoregion, a biogeographical distinction is made due to the differences in certain species groups, in particular amphibians, duikers, lizards and primates.
Lower Guinean Forests Subregion
Cameroonian Highlands Forests
Critical/ Endangered
Covers the mountains and highland areas of the border region between Nigeria and Cameroon. This ecoregion includes the Rumpi Hills, the Bakossi Mountains, Mount Nlonako, Mount Kupe and Mount Manengouba.
Comprises tropical and subtropical moist broadleaf forests in a non-volcanic, montane region. Lower boundaries are determined by agricultural lands.
Cross-Niger Transition Forests
Critical/ Endangered
Separated by the Cross River to the east from the Cross-Sanaga-Bioko Coastal Forests, and by the Niger River in the west from the Nigerian Lowland Forests.
The transitional ecoregion between the Forest types of the two subregions. Remnant forests with low species richness and endemism relative to adjacent ecoregions. Biota reflects a transition between the Upper and Lower Guinean Forests subregions
Mount Cameroon and Bioko Montane Forests
Critical/ Endangered
Parts of a volcanic chain that extends northeast along the border between Cameroon and Nigeria, and southwest towards the Guinean islands of Annobón, Bioko, São Tomé and Príncipe.
Considered distinct from the associated Cameroonian Highlands Forests ecoregion due to the younger geological age, and the consequent absence of certain restricted range species.

306
Ecoregion Threat status
Geographic notes Major habitat(s) and defining
features
Niger Delta Swamp Forests
Critical/ Endangered
Delineated by the Benin and Imo Rivers forming its western and eastern boundaries, respectively.
The second largest swamp forests on the continent, this ecoregion is considered biologically distinct due to the presence of endemic mammal subspecies: Pennant’s red colobus (Procolobus pennantii pennantii) and Heslop’s Pygmy Hippo (Choeropsis liberiensis heslopi).
Nigerian Lowland Forests
Critical/ Endangered
Forming a band along the coast in southwestern Nigeria, from the eastern margin of the Dahomey Gap in Benin to the Niger River in the west.
A dry lowland forest, notable for the endemic White-throated Guenon (Cercopithecus erythrogaster). Considered distinct from the drier Dahomey Gap to the west and the Niger River Delta to the east.
São Tomé, Príncipe and Annobón Moist Lowland Forests
Vulnerable Covering the three volcanic islands: Annobón, São Tomé and Príncipe.
Notable for high endemism (particularly relative to its size), including several endemic genera and families, and for evolutionary features among its biota, including examples of gigantism, dwarfism and unusual ecological, physiological and behavioral adaptations in some species.

307
Appendix 2: Freshwater Ecoregions within the Guinean Forests of West Africa Hotspot
Ecoregion Conservation Status
Geographic Notes Major habitat(s) and defining features
Occurrence within the hotspot
Upper Guinean Forests Subregion
Ashanti Endangered Ranges from Ghana’s southwestern corner and includes a small portion of Côte d’Ivoire’s southeast
Tropical and subtropical coastal rivers, within semi-deciduous, moist evergreen, and wet evergreen rainforest (much of which has now been cleared) and mangroves. Fish fauna is primarily Nilo-Sudanian.
High. Occurs almost exclusively within the hotspot boundary in the Upper Guinean Forests subregion.
Eburneo Endangered Located mainly in Côte d’Ivoire spanning most of the country, extending north to Southern Burkina Faso, and east to small areas of Western Ghana.
Tropical and subtropical coastal rivers, stretching from Sudanian savanna woodland in the north, to a forest-savanna mosaic, and down to Guinean rain forest in the south. The largest rivers being Comoé, Bandama and Sassara Rivers.
Medium. Occurs largely in Northern Côte d’Ivoire with roughly half of the ecoregion within the Upper Guinean Forests subregion.
Fouta-Djallon
Vulnerable Located in Central Guinea, and is defined by the Fouta Djallon Plateau.
Mountain freshwaters. Mountainous area with sections of elevated plateau (600-1500m) separated by deep gorges through which rivers and gorges descend. Rivers isolated from downstream by waterfalls and rapids. Upland area of Fouta-Djallon plateau dominated by submontane vegetation surrounded by forest/savanna transition. Includes the headwaters of the Senegal and Niger Rivers.
High. The majority of his ecoregion is found within the Upper Guinean Forests subregion.
Mount Nimba
Endangered This is a mountainous region, which is located at the intersection between Guinea, Côte d’Ivoire and Liberia. Mount Nimba forms the southern extent of the “Guinean Backbone”.
Montane freshwater systems with surrounding variable surrounding habitats as a function of elevation. This varies from plains savannah (500m), forests dominated by epiphytes (850m), to grasslands on the summit (850m). The steep slopes of Mount Nimba lead to swift running rivers.
Medium. Roughly half of the ecoregion Mount Nimba is located within the hotspot boundaries.

308
Ecoregion Conservation Status
Geographic Notes Major habitat(s) and defining features
Occurrence within the hotspot
Northern Upper Guinea
Endangered Lies on the western side of the Guinean range, and stretches from the foothills of Fouta Djallon in Guinea to Sierra Leone’s southern border. Small portions of the ecoregion lie in Guinea-Bissau and Liberia.
Tropical and subtropical coastal rivers, with an intricate hydrological network. Floodplain lakes surrounded by extensive areas of swamp forests. Mangroves backed by freshwater swamp forests are found along most of the coast and in riverine estuaries.
Medium. The ecoregion extends to western Guinea and eastern Guinea- Bissau which are outside the hotspot boundaries, with the southeastern part including most of Sierra Leone lying within the hotspot.
Southern Upper Guinea
Endangered The ecoregion covers nearly all of Liberia, a portion within southern Guinea and south western part of Côte d’Ivoire.
Relatively short, an partly torrential tropical and subtropical coastal rivers with drainages flowing into the Atlantic Ocean. Few floodplains are found in the ecoregion. Mangrove forests and swamps occur near the mouths of the rivers.
Very High. Occurs exclusively within the hotspot boundary within the Upper-Guinea sub region.
Upper Niger Vulnerable This ecoregion lies primarily within the countries of Guinea and Mali, and has two smaller portions in Burkina Faso and Côte d’Ivoire.
Tropical and subtropical upland rivers. The two rivers, The upper Niger and its tributary, and the Baniriver together define this ecoregion. Due to the high rainfall and topography of Fouta Djallon and central Guinean highlands the steep rivers and streams of the Upper Niger ecoregion are fast-flowing. The Upper Niger has relatively clear water with low sediment load.
Very Marginal. The vast majority of this ecoregion lies north of the hotspot boundaries. The portion within the hotspot is lies in southeastern Guinea.
Volta Critical The Volta River basin extends into parts of 6 countries, with the majority falling within Burkina Faso and Ghana. The ecoregion also stretches into Mali, Côte d’Ivoire, Togo and Benin.
The Volta is one of the largest rivers in West Africa, with major habitats in the ecoregion being subtropical floodplain rivers and wetland complexes created by the many tributaries. During flood season large swampy areas are created.
Very Marginal. The majority of the ecoregion lies north of the hotspot boundaries on the far eastern side of the Upper Guinean Forests subregion.

309
Ecoregion Conservation Status
Geographic Notes Major habitat(s) and defining features
Occurrence within the hotspot
Lower Guinean Forests Subregion
Bight Drainages
Critical Spans four countries (Benin, Ghana, Nigeria and Togo). Primarily in the coastal regions of Benin, Togo and western Nigeria, but also includes the southeastern-most point of Ghana.
Tropical and subtropical coastal rivers in an area of relatively dry, savanna habitat (the Dahomey Gap). Low [fish] endemism is a defining feature of the ecoregion, indicating the region’s biogeographical history of extinctions during dry phases, and subsequent recolonization by fauna from the river Niger.
Medium. Occurs largely in the Dahomey Gap (outside of hotspot boundary) but also comprises a significant portion of the Lower Guinean Forests subregion (within Nigeria)
Lake Chad Endangered Lake Chad lies within Niger, Cameroon, Chad and Nigeria. It is located on the southern edge of the Sahara desert.
An extensive floodplain system in a xeric region, with seasonal river floods and large variation in inundated area. The landscape is a mixture of open water (38%), archipelagoes (23%), and reed belts (39%) during “Normal Chad” periods.
Very Marginal. The entire ecoregion covers a large area within 4 countries with only a small area in the southwestern part situated within the hotspot.
Lower Niger-Benue
Critical The Niger-Benue system runs through Niger, Mali, Burkina Faso, Guinea, Côte d’Ivoire, Benin and Cameroon. The ecoregion includes the Benue River basin and the lower and middle portions of the Niger River basin below the Inner Niger Delta and above the Niger Delta
Largely savanna ecoregion with tropical and subtropical biannual floodplain rivers, including wetland complexes. High variation of habitat within ecoregion with Niger flowing through dryer parts of Mali to rainforests in southern Nigeria.
Marginal. The majority of the ecoregion lies west of the area within the hotspot, which is situated between Cameroon and Nigeria.
Niger Delta Critical The Niger Delta lies entirely in Nigeria, with drainages flowing into the Gulf of Guinea in the Atlantic Ocean. The Benin River and Imo River mouths define the western and eastern boundaries of the ecoregion.
Niger Delta has 3 major sections with distinct habitats: the upper riverine floodplain, lower tidal floodplains, and coastal barrier islands. Permanent and seasonal swamp forests grade into the mangrove forests of the lower tidal floodplain. Bothe black and white water rivers flow into the Niger Delta.
Very High. The entire ecoregion of the Niger Delta lies within the Lower Guinean Forests subregion of the hotspot.

310
Ecoregion Conservation Status
Geographic Notes Major habitat(s) and defining features
Occurrence within the hotspot
Northern Gulf of Guinea Drainages- Bioko
Endangered The ecoregion lies within the three countries Cameroon, Equatorial Guinea, and Nigeria and encompasses coastal rivers and streams that feed the Gulf of Guinea. Bioko is the largest island in the Gulf of Guinea.
The ecoregion lies within the evergreen forest zone, including the Cameroonian Highlands Forest and Bioko’s mountain forests. Major habitats are also reed beds along the rivers and mangroves which occur in the estuaries. Tropical hot-humid climate, with rainfall reaching as much as ten meters per year in southwest Bioko.
High. The majority of the ecoregion falls within the Lower Guinean Forests subregion of the hotspot with the exception of the most northern area which lies in Nigeria.
S. Tomé and Príncipe - Annobón
Vulnerable Volcanic islands located off the coast of Equatorial Guinea and Gabon. Islands include São Tomé, Príncipe, Annobón and several smaller islands.
Tropical and subtropical coastal rivers, which flow swiftly and are marked by waterfalls and rapids. Rivers descend from highland interiors and flow to the Gulf of Guinea. Rivers are surrounded by lowland forest, montane rainforest and mangrove forest.
Very high. All of the islands of this ecoregion lie within the hotspot boundaries.
Western Equatorial Crater Lakes
Endangered The ecoregion is situated in southwestern Cameroon, and lies along the “Cameroon Line,” a volcanic ridge that runs southwest-northeast.
Montane freshwaters and crater lakes. The main lakes of the ecoregion are BarombiMbo, Bermin, Dissoni, Ejagham, Kotto and Mboandong. Vegetation consists of submontane forests, as well as submontane forests and montane grasslands.
Very high. The ecoregion lies entirely within the hotspot boundaries in the Lower Guinean Forests subregion

311
Appendix 3: Marine Ecoregions Adjacent to the Guinean Forests of West Africa Hotspot
Ecoregion Geographic Notes Major habitat(s) and defining features
Gulf of Guinea Central
extends from the Togo/Benin border to Cape Lopez, Gabon.
Coastal habitat includes huge marshy areas formed by the Niger delta, with mangroves indented by fluvial channels. Productivity depends largely on nutrient input from land and river drainages (i.e. Niger River, Sanaga River).
Gulf of Guinea Islands
extends around the offshore islands of Bioko, São Tomé, Príncipe, and Annobón.
Although these islands are not especially rich in marine species, they have relatively high endemism of bony fishes and marginellid mollusks.
Gulf of Guinea Upwelling
extends approximately from Cape Palmas to the border of Togo/Benin (the exact area can vary seasonally).
Coastal habitat is characterized by low sandy coastal plains with alternating lagoons and estuaries. This ecoregion is characterized by thermal instability due to seasonal (June through September) upwelling of cold, nutrient-rich waters. These periodic upwellings drive seasonal biological productivity in the region.
Gulf of Guinea West
extends from the Bissagos Islands in Guinea-Bissau to Cape Palmas (Liberia/Côte d’Ivoire).
Coastal habitat along Sierra Leone and Liberia is generally characterized by rocky scarps and sandy beaches, alternating with mangrove vegetation. This marine ecoregion is characterized by the largest continental shelf in West Africa, with large riverine input that is partially responsible for its thermal stability, namely warm and stable surface water over a bottom layer of cooler waters exist year round.
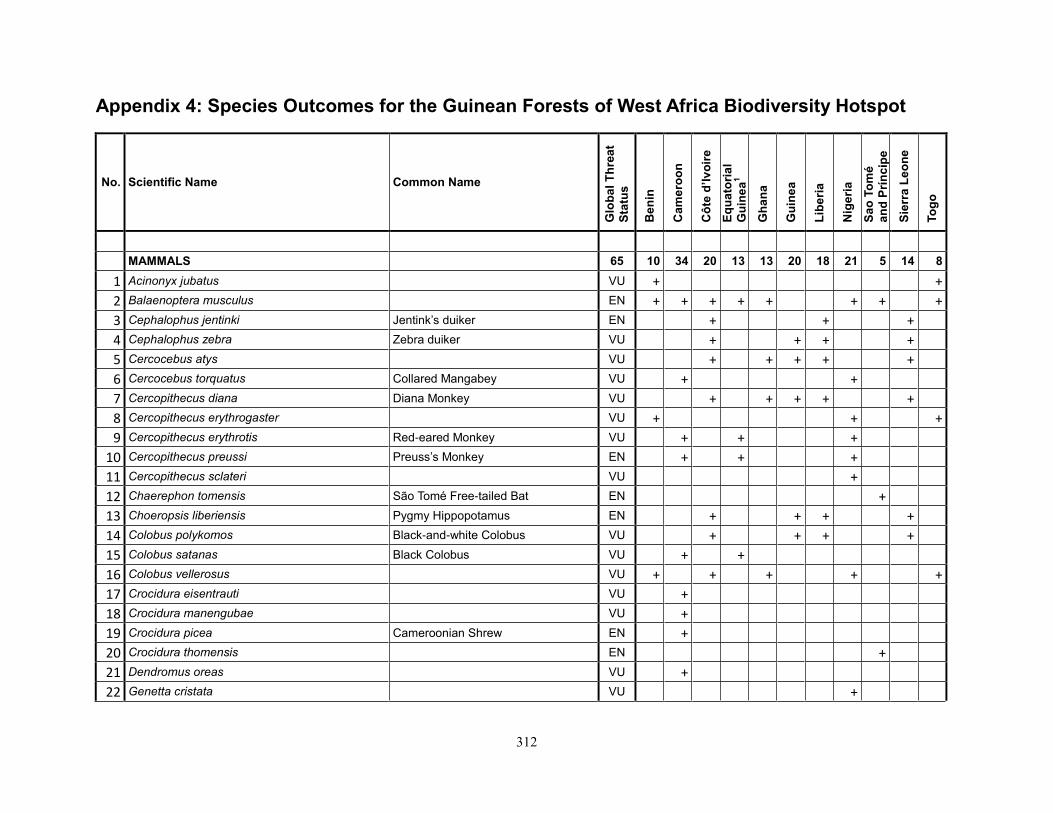
312
Appendix 4: Species Outcomes for the Guinean Forests of West Africa Biodiversity Hotspot
No. Scientific Name Common Name
Glo
ba
l T
hre
at
Sta
tus
Ben
in
Cam
ero
on
Cô
te d
’Iv
oir
e
Eq
ua
tori
al
Gu
ine
a1
Gh
an
a
Gu
ine
a
Lib
eri
a
Nig
eri
a
Sa
o T
om
é
an
d P
rín
cip
e
Sie
rra
Le
on
e
To
go
MAMMALS 65 10 34 20 13 13 20 18 21 5 14 8
1 Acinonyx jubatus VU + +
2 Balaenoptera musculus EN + + + + + + + +
3 Cephalophus jentinki Jentink’s duiker EN + + +
4 Cephalophus zebra Zebra duiker VU + + + +
5 Cercocebus atys VU + + + + +
6 Cercocebus torquatus Collared Mangabey VU + +
7 Cercopithecus diana Diana Monkey VU + + + + +
8 Cercopithecus erythrogaster VU + + +
9 Cercopithecus erythrotis Red-eared Monkey VU + + +
10 Cercopithecus preussi Preuss’s Monkey EN + + +
11 Cercopithecus sclateri VU +
12 Chaerephon tomensis São Tomé Free-tailed Bat EN +
13 Choeropsis liberiensis Pygmy Hippopotamus EN + + + +
14 Colobus polykomos Black-and-white Colobus VU + + + +
15 Colobus satanas Black Colobus VU + +
16 Colobus vellerosus VU + + + + +
17 Crocidura eisentrauti VU +
18 Crocidura manengubae VU +
19 Crocidura picea Cameroonian Shrew EN +
20 Crocidura thomensis EN +
21 Dendromus oreas VU +
22 Genetta cristata VU +

313
No. Scientific Name Common Name
Glo
ba
l T
hre
at
Sta
tus
Ben
in
Cam
ero
on
Cô
te d
’Iv
oir
e
Eq
ua
tori
al
Gu
ine
a1
Gh
an
a
Gu
ine
a
Lib
eri
a
Nig
eri
a
Sa
o T
om
é
an
d P
rín
cip
e
Sie
rra
Le
on
e
To
go
23 Genetta johnstoni VU + + + +
24 Gorilla gorilla Western Gorilla CR + +
25 Hippopotamus amphibius Common Hippopotamus VU + + + + + + + + +
26 Hipposideros curtus VU + +
27 Hipposideros lamottei CR +
28 Hipposideros marisae VU + + +
29 Hybomys badius EN +
30 Hybomys basilii EN +
31 Hylomyscus baeri Baer’s Wood Mouse EN + + +
32 Hylomyscus grandis Mount Oku Hylomyscus CR +
33 Lamottemys okuensis Mount Oku Rat EN +
34 Lemniscomys mittendorfi VU +
35 Liberiictis kuhni Liberian Mongoose VU + +
36 Lophuromys dieterleni Mount Oku Brush-furred Rat EN +
37 Lophuromys eisentrauti Mount Lefo Brush-furred Mouse EN +
38 Loxodonta africana African elephant VU + + + + + + + + +
39 Lycaon pictus EN +
40 Mandrillus leucophaeus Drill EN + + +
41 Mandrillus sphinx Mandrill VU +
42 Micropotamogale lamottei Mount Nimba Otter Shrew EN + + +
43 Myonycteris brachycephala São Tomé Collared Fruit Bat EN +
44 Myosorex eisentrauti CR +
45 Myosorex okuensis EN +
46 Myosorex rumpii Rumpi Mouse Shrew EN +
47 Otomys burtoni Burton’s Vlei Rat EN +
48 Otomys occidentalis VU + +

314
No. Scientific Name Common Name
Glo
ba
l T
hre
at
Sta
tus
Ben
in
Cam
ero
on
Cô
te d
’Iv
oir
e
Eq
ua
tori
al
Gu
ine
a1
Gh
an
a
Gu
ine
a
Lib
eri
a
Nig
eri
a
Sa
o T
om
é
an
d P
rín
cip
e
Sie
rra
Le
on
e
To
go
49 Pan troglodytes Chimpanzee EN + + + + + + +
50 Panthera leo Lion VU + + + + + +
51 Physeter macrocephalus VU + + + + + + + + + +
52 Praomys hartwigi EN +
53 Praomys morio Cameroon Soft-furred Mouse EN + +
54 Praomys obscurus EN +
55 Procolobus badius Western Red Colobus EN + + + + +
56 Procolobus pennantii Pennant’s Red Colobus CR + +
57 Procolobus preussi Preuss’s Red Colobus CR + +
58 Rhinolophus guineensis VU + + + +
59 Rhinolophus maclaudi Maclaud’s Horshoe Bat EN +
60 Rhinolophus ziama EN + +
61 Sousa teuszii Atlantic Humpback Dolphin VU +
62 Sylvisorex camerunensis VU + +
63 Sylvisorex isabellae EN +
64 Sylvisorex morio Mount Cameroon Forest Shrew EN +
65 Trichechus senegalensis West African Manatee VU + + + + + + + + + +
BIRDS 48 10 23 20 5 17 18 13 18 13 14 10
66 Agelastes meleagrides White-breasted Guineafowl VU + + + +
67 Amaurocichla bocagei São Tomé Short-tail VU +
68 Balearica pavonina Black Crowned-crane VU + + + + + +
69 Bostrychia bocagei Dwarf Olive Ibis CR +
70 Bycanistes cylindricus Brown-cheeked Hornbill VU + + + + + +
71 Campephaga lobata Western Wattled Cuckooshrike VU + + + + +
72 Ceratogymna elata Yellow-casqued Hornbill VU + + + + + + + +

315
No. Scientific Name Common Name
Glo
ba
l T
hre
at
Sta
tus
Ben
in
Cam
ero
on
Cô
te d
’Iv
oir
e
Eq
ua
tori
al
Gu
ine
a1
Gh
an
a
Gu
ine
a
Lib
eri
a
Nig
eri
a
Sa
o T
om
é
an
d P
rín
cip
e
Sie
rra
Le
on
e
To
go
73 Circaetus beaudouini Beaudouin’s Snake-eagle VU + + + + +
74 Criniger olivaceus Yellow-bearded Greenbul VU + + + + +
75 Estrilda poliopareia Anambra Waxbill VU + +
76 Francolinus camerunensis Mount Cameroon Francolin EN +
77 Gyps africanus White-backed Vulture EN + + + + + + + +
78 Gyps rueppellii Rueppell’s Vulture EN + + + + + + +
79 Kupeornis gilberti White-throated Mountain-babbler EN + +
80 Lanius newtoni São Tomé Fiscal CR +
81 Malaconotus gladiator Green-breasted Bush-shrike VU + +
82 Malimbus ballmanni Gola Malimbe EN + + + +
83 Malimbus ibadanensis Ibadan Malimbe EN +
84 Melaenornis annamarulae Nimba Flycatcher VU + + + + +
85 Morus capensis Cape Gannet VU + + + +
86 Necrosyrtes monachus Hooded Vulture EN + + + + + + + + +
87 Nectarinia thomensis Giant Sunbird VU +
88 Neophron percnopterus Egyptian Vulture EN + + + + + +
89 Neospiza concolor São Tomé Grosbeak CR +
90 Oriolus crassirostris São Tomé Oriole VU +
91 Otus hartlaubi São Tomé Scops-owl VU +
92 Phyllastrephus leucolepis Liberian Greenbul CR +
93 Picathartes gymnocephalus White-necked Picathartes VU + + + + +
94 Picathartes oreas Grey-necked Picathartes VU + + +
95 Platysteira laticincta Banded Wattle-eye EN +
96 Ploceus bannermani Bannerman’s Weaver VU + +
97 Ploceus batesi Bates’s Weaver EN +
98 Polemaetus bellicosus Martial Eagle VU + + + + + + + +

316
No. Scientific Name Common Name
Glo
ba
l T
hre
at
Sta
tus
Ben
in
Cam
ero
on
Cô
te d
’Iv
oir
e
Eq
ua
tori
al
Gu
ine
a1
Gh
an
a
Gu
ine
a
Lib
eri
a
Nig
eri
a
Sa
o T
om
é
an
d P
rín
cip
e
Sie
rra
Le
on
e
To
go
99 Prinia leontica White-eyed Prinia VU + + + +
100 Psittacus erithacus Grey Parrot VU + + + + + +
101 Psittacus timneh Timneh Parrot VU + + + +
102 Sagittarius serpentarius Secretarybird VU + + + + + +
103 Scotopelia ussheri Rufous Fishing-owl VU + + + + +
104 Speirops brunneus Fernando Po Speirops VU +
105 Speirops melanocephalus Mount Cameroon Speirops VU +
106 Tauraco bannermani Bannerman’s Turaco EN +
107 Telophorus kupeensis Mount Kupe Bush-shrike EN +
108 Torgos tracheliotos Lappet-faced Vulture VU + + +
109 Treron sanctithomae São Tomé Green-pigeon VU +
110 Trigonoceps occipitalis White-headed Vulture VU + + + + + + +
111 Turdus xanthorhynchus Príncipe Thrush CR +
112 Zosterops ficedulinus São Tomé White-eye VU +
113 Zosterops griseovirescens Annobón White-eye VU +
REPTILES 11 4 5 5 6 4 6 5 4 5 5 3
114 Afroablepharus africana VU +
115 Afroablepharus annobonensis Annobón Lidless Skink CR +
116 Chelonia mydas Green Turtle EN + + + +
117 Cnemaspis occidentalis EN + + + +
118 Cynisca leonina VU +
119 Dermochelys coriacea Leatherback VU + + + + + + + + + + +
120 Eretmochelys imbricata Hawksbill Turtle CR + +
121 Kinixys homeana VU + + + + + + +
122 Lepidochelys olivacea Olive Ridley Turtle VU + + + + + + + + + + +

317
No. Scientific Name Common Name
Glo
ba
l T
hre
at
Sta
tus
Ben
in
Cam
ero
on
Cô
te d
’Iv
oir
e
Eq
ua
tori
al
Gu
ine
a1
Gh
an
a
Gu
ine
a
Lib
eri
a
Nig
eri
a
Sa
o T
om
é
an
d P
rín
cip
e
Sie
rra
Le
on
e
To
go
123 Leptosiaphos pauliani EN +
124 Osteolaemus tetraspis West African Dwarf Crocodile VU + + + + + + + + +
AMPHIBIANS 77 0 52 14 1 11 5 4 13 3 2 1
125 Afrixalus lacteus EN +
126 Alexteroon jynx CR +
127 Amietophrynus djohongensis EN +
128 Amietophrynus perreti VU +
129 Amietophrynus taiensis CR +
130 Amietophrynus villiersi EN +
131 Arlequinus krebsi EN +
132 Arthroleptis crusculum EN +
133 Arthroleptis krokosua EN +
134 Arthroleptis perreti EN +
135 Astylosternus diadematus VU +
136 Astylosternus fallax EN +
137 Astylosternus laurenti EN +
138 Astylosternus nganhanus CR +
139 Astylosternus perreti EN +
140 Astylosternus ranoides EN +
141 Astylosternus rheophilus VU +
142 Astylosternus schioetzi EN +
143 Cardioglossa alsco CR +
144 Cardioglossa aureoli EN +
145 Cardioglossa melanogaster EN + +
146 Cardioglossa oreas EN +

318
No. Scientific Name Common Name
Glo
ba
l T
hre
at
Sta
tus
Ben
in
Cam
ero
on
Cô
te d
’Iv
oir
e
Eq
ua
tori
al
Gu
ine
a1
Gh
an
a
Gu
ine
a
Lib
eri
a
Nig
eri
a
Sa
o T
om
é
an
d P
rín
cip
e
Sie
rra
Le
on
e
To
go
147 Cardioglossa pulchra EN + +
148 Cardioglossa schioetzi EN + +
149 Cardioglossa trifasciata CR +
150 Cardioglossa venusta EN +
151 Conraua alleni VU + + + +
152 Conraua goliath EN +
153 Conraua robusta VU + +
154 Didynamipus sjostedti EN + + +
155 Hylarana asperrima EN + +
156 Hylarana longipes VU +
157 Hylarana occidentalis EN + + + +
158 Hyperolius bobirensis EN +
159 Hyperolius dintelmanni EN +
160 Hyperolius endjami VU +
161 Hyperolius laurenti VU + +
162 Hyperolius nienokouensis EN +
163 Hyperolius nimbae EN +
164 Hyperolius riggenbachi VU + +
165 Hyperolius thomensis EN +
166 Hyperolius torrentis EN + +
167 Hyperolius viridigulosus VU + +
168 Kassina arboricola VU + +
169 Kassina lamottei VU +
170 Leptodactylodon axillaris CR +
171 Leptodactylodon bicolor VU + +
172 Leptodactylodon boulengeri VU +

319
No. Scientific Name Common Name
Glo
ba
l T
hre
at
Sta
tus
Ben
in
Cam
ero
on
Cô
te d
’Iv
oir
e
Eq
ua
tori
al
Gu
ine
a1
Gh
an
a
Gu
ine
a
Lib
eri
a
Nig
eri
a
Sa
o T
om
é
an
d P
rín
cip
e
Sie
rra
Le
on
e
To
go
173 Leptodactylodon bueanus VU +
174 Leptodactylodon erythrogaster CR +
175 Leptodactylodon mertensi EN +
176 Leptodactylodon ornatus EN +
177 Leptodactylodon perreti EN +
178 Leptodactylodon polyacanthus VU + +
179 Leptodactylodon wildi EN +
180 Leptopelis palmatus VU +
181 Morerella cyanophthalma VU +
182 Nimbaphrynoides liberiensis CR +
183 Nimbaphrynoides occidentalis CR + +
184 Petropedetes perreti EN +
185 Phrynobatrachus annulatus EN + + + +
186 Phrynobatrachus chukuchuku CR +
187 Phrynobatrachus cricogaster VU + +
188 Phrynobatrachus ghanensis EN + +
189 Phrynobatrachus intermedius CR +
190 Phrynobatrachus steindachneri VU + +
191 Phrynobatrachus villiersi VU + +
192 Ptychadena newtoni EN +
193 Werneria bambutensis EN +
194 Werneria mertensiana EN +
195 Werneria preussi EN +
196 Werneria submontana EN +
197 Werneria tandyi EN +
198 Wolterstorffina chirioi CR +

320
No. Scientific Name Common Name
Glo
ba
l T
hre
at
Sta
tus
Ben
in
Cam
ero
on
Cô
te d
’Iv
oir
e
Eq
ua
tori
al
Gu
ine
a1
Gh
an
a
Gu
ine
a
Lib
eri
a
Nig
eri
a
Sa
o T
om
é
an
d P
rín
cip
e
Sie
rra
Le
on
e
To
go
199 Wolterstorffina mirei EN +
200 Wolterstorffina parvipalmata VU + +
201 Xenopus longipes CR +
BONY FISHES 172 10 72 24 11 21 39 31 31 6 27 7
202 Alestopetersius smykalai VU +
203 Amphilius kakrimensis VU +
204 Amphilius korupi EN +
205 Aphyosemion amoenum EN +
206 Aphyosemion bamilekorum EN +
207 Aphyosemion bivittatum VU + +
208 Aphyosemion bualanum EN + +
209 Aphyosemion dargei VU +
210 Aphyosemion edeanum VU +
211 Aphyosemion franzwerneri EN +
212 Aphyosemion poliaki EN +
213 Aphyosemion viride VU + +
214 Aphyosemion volcanum EN +
215 Aplocheilichthys keilhacki VU +
216 Archiaphyosemion jeanpoli EN + +
217 Arnoldichthys spilopterus VU +
218 Awaous bustamantei VU + +
219 Balistes vetula VU + + +
220 Barboides gracilis VU + + +
221 Barbus aliciae EN + +
222 Barbus anniae VU +

321
No. Scientific Name Common Name
Glo
ba
l T
hre
at
Sta
tus
Ben
in
Cam
ero
on
Cô
te d
’Iv
oir
e
Eq
ua
tori
al
Gu
ine
a1
Gh
an
a
Gu
ine
a
Lib
eri
a
Nig
eri
a
Sa
o T
om
é
an
d P
rín
cip
e
Sie
rra
Le
on
e
To
go
223 Barbus bagbwensis VU +
224 Barbus boboi CR +
225 Barbus bourdariei EN +
226 Barbus cadenati VU +
227 Barbus carcharhinoides CR +
228 Barbus dialonensis VU +
229 Barbus ditinensis VU +
230 Barbus eburneensis VU + + +
231 Barbus foutensis VU + +
232 Barbus gruveli VU +
233 Barbus huguenyi EN + +
234 Barbus kissiensis VU +
235 Barbus lauzannei EN + +
236 Barbus liberiensis EN + +
237 Barbus melanotaenia CR +
238 Barbus niokoloensis VU +
239 Barbus petitjeani VU +
240 Barbus raimbaulti VU +
241 Barbus salessei VU + +
242 Barbus subinensis EN +
243 Barbus sylvaticus EN + +
244 Barbus thysi EN + +
245 Barbus traorei EN +
246 Barbus walkeri VU + +
247 Barbus zalbiensis VU +
248 Benitochromis batesii VU + +

322
No. Scientific Name Common Name
Glo
ba
l T
hre
at
Sta
tus
Ben
in
Cam
ero
on
Cô
te d
’Iv
oir
e
Eq
ua
tori
al
Gu
ine
a1
Gh
an
a
Gu
ine
a
Lib
eri
a
Nig
eri
a
Sa
o T
om
é
an
d P
rín
cip
e
Sie
rra
Le
on
e
To
go
249 Benitochromis conjunctus EN +
250 Benitochromis finleyi EN +
251 Benitochromis nigrodorsalis EN +
252 Benitochromis ufermanni EN +
253 Brycinus brevis VU + +
254 Brycinus carolinae VU +
255 Brycinus derhami VU +
256 Callopanchax monroviae VU +
257 Chiloglanis benuensis VU + +
258 Chiloglanis disneyi VU +
259 Chiloglanis polyodon CR +
260 Chromidotilapia cavalliensis VU +
261 Chromidotilapia linkei EN +
262 Chrysichthys aluuensis VU + +
263 Chrysichthys longidorsalis VU +
264 Chrysichthys teugelsi EN + +
265 Chrysichthys walkeri EN +
266 Clarias maclareni CR +
267 Ctenopoma nebulosum VU +
268 Denticeps clupeoides VU + + +
269 Doumea chappuisi VU + + +
270 Doumea thysi VU + +
271 Epinephelus itajara CR + + + + + + + + + +
272 Epinephelus marginatus EN + + + + + + + + + +
273 Epiplatys biafranus EN +
274 Epiplatys coccinatus CR +

323
No. Scientific Name Common Name
Glo
ba
l T
hre
at
Sta
tus
Ben
in
Cam
ero
on
Cô
te d
’Iv
oir
e
Eq
ua
tori
al
Gu
ine
a1
Gh
an
a
Gu
ine
a
Lib
eri
a
Nig
eri
a
Sa
o T
om
é
an
d P
rín
cip
e
Sie
rra
Le
on
e
To
go
275 Epiplatys etzeli EN +
276 Epiplatys guineensis VU +
277 Epiplatys hildegardae VU +
278 Epiplatys lamottei VU + +
279 Epiplatys lokoensis EN +
280 Epiplatys longiventralis VU +
281 Epiplatys njalaensis EN +
282 Epiplatys roloffi EN + +
283 Epiplatys ruhkopfi CR +
284 Fundulopanchax amieti EN +
285 Fundulopanchax arnoldi EN +
286 Fundulopanchax cinnamomeus EN +
287 Fundulopanchax fallax EN +
288 Fundulopanchax marmoratus EN +
289 Fundulopanchax oeseri EN +
290 Fundulopanchax rubrolabialis EN +
291 Fundulopanchax scheeli EN +
292 Garra allostoma VU +
293 Gobiocichla ethelwynnae EN +
294 Hippocampus algiricus VU + + + + + + + +
295 Irvineia voltae EN +
296 Kajikia albida VU + + + + + + + + + + +
297 Konia dikume CR +
298 Konia eisentrauti CR +
299 Kribia leonensis EN +
300 Labeo alluaudi EN + +

324
No. Scientific Name Common Name
Glo
ba
l T
hre
at
Sta
tus
Ben
in
Cam
ero
on
Cô
te d
’Iv
oir
e
Eq
ua
tori
al
Gu
ine
a1
Gh
an
a
Gu
ine
a
Lib
eri
a
Nig
eri
a
Sa
o T
om
é
an
d P
rín
cip
e
Sie
rra
Le
on
e
To
go
301 Labeo curriei CR +
302 Labeobarbus mbami EN +
303 Labeobarbus mungoensis EN +
304 Ladigesia roloffi EN +
305 Lepidarchus adonis VU + +
306 Leptocypris crossensis VU +
307 Leptocypris konkourensis VU +
308 Leptocypris taiaensis VU +
309 Liauchenoglanis maculatus EN +
310 Limbochromis robertsi EN +
311 Makaira nigricans VU + + + + + + + +
312 Malapterurus murrayi EN +
313 Marcusenius brucii VU + +
314 Marcusenius meronai EN +
315 Marcusenius sanagaensis VU +
316 Mastacembelus taiaensis VU + +
317 Megalops atlanticus VU + + + + + + + + + + +
318 Micralestes comoensis VU +
319 Micropanchax bracheti VU +
320 Mormyrus subundulatus EN + +
321 Myaka myaka CR +
322 Nannocharax latifasciatus VU + +
323 Nannocharax rubrolabiatus VU +
324 Neolebias axelrodi EN + +
325 Neolebias powelli CR +
326 Nimbapanchax petersi VU + +

325
No. Scientific Name Common Name
Glo
ba
l T
hre
at
Sta
tus
Ben
in
Cam
ero
on
Cô
te d
’Iv
oir
e
Eq
ua
tori
al
Gu
ine
a1
Gh
an
a
Gu
ine
a
Lib
eri
a
Nig
eri
a
Sa
o T
om
é
an
d P
rín
cip
e
Sie
rra
Le
on
e
To
go
327 Notoglanidium thomasi EN +
328 Notoglanidium walkeri VU + +
329 Pagrus pagrus EN +
330 Paramphilius firestonei EN +
331 Paramphilius teugelsi VU + +
332 Parauchenoglanis akiri EN +
333 Procatopus nimbaensis VU + +
334 Pungu maclareni CR +
335 Rhexipanchax kabae VU +
336 Rhexipanchax lamberti VU +
337 Sarotherodon caroli CR +
338 Sarotherodon linnellii CR +
339 Sarotherodon lohbergeri CR +
340 Sarotherodon steinbachi CR +
341 Scriptaphyosemion bertholdi EN +
342 Scriptaphyosemion brueningi EN + +
343 Scriptaphyosemion cauveti CR +
344 Scriptaphyosemion etzeli CR +
345 Scriptaphyosemion schmitti VU +
346 Stomatepia mariae CR +
347 Stomatepia mongo CR +
348 Stomatepia pindu CR +
349 Synodontis guttatus EN +
350 Synodontis macrophthalmus VU + +
351 Synodontis robbianus VU +
352 Tetraodon pustulatus VU + +

326
No. Scientific Name Common Name
Glo
ba
l T
hre
at
Sta
tus
Ben
in
Cam
ero
on
Cô
te d
’Iv
oir
e
Eq
ua
tori
al
Gu
ine
a1
Gh
an
a
Gu
ine
a
Lib
eri
a
Nig
eri
a
Sa
o T
om
é
an
d P
rín
cip
e
Sie
rra
Le
on
e
To
go
353 Thunnus obesus VU + + + + + + +
354 Tilapia bakossiorum CR +
355 Tilapia bemini CR +
356 Tilapia busumana VU + +
357 Tilapia bythobates CR +
358 Tilapia camerunensis VU +
359 Tilapia cessiana CR +
360 Tilapia coffea CR +
361 Tilapia deckerti CR +
362 Tilapia discolor VU + +
363 Tilapia flava CR +
364 Tilapia gutturosa CR +
365 Tilapia imbriferna CR +
366 Tilapia joka VU + +
367 Tilapia kottae EN +
368 Tilapia snyderae CR +
369 Tilapia sp. nov. ‘jewel’ VU +
370 Tilapia sp. nov. ‘little black’ VU +
371 Tilapia sp. nov. ‘yellow-green’ VU +
372 Tilapia spongotroktis CR +
373 Tilapia thysi CR +
SHARKS AND RAYS 33 16 20 20 13 20 24 21 24 7 21 15
374 Alopias superciliosus VU + +
375 Alopias vulpinus VU + + + + + + +
376 Carcharhinus longimanus VU + + + + + + + + + +

327
No. Scientific Name Common Name
Glo
ba
l T
hre
at
Sta
tus
Ben
in
Cam
ero
on
Cô
te d
’Iv
oir
e
Eq
ua
tori
al
Gu
ine
a1
Gh
an
a
Gu
ine
a
Lib
eri
a
Nig
eri
a
Sa
o T
om
é
an
d P
rín
cip
e
Sie
rra
Le
on
e
To
go
377 Carcharhinus obscurus VU +
378 Carcharhinus plumbeus VU + + + + + + + + + +
379 Carcharhinus signatus VU + + + + + + + + +
380 Carcharias taurus VU + + + + + +
381 Centrophorus granulosus VU + + + +
382 Centrophorus lusitanicus VU + + + + +
383 Dasyatis garouaensis VU + + + +
384 Dasyatis margarita EN + + + + + + + + +
385 Galeorhinus galeus VU + +
386 Glaucostegus cemiculus EN + + + + + + + +
387 Gymnura altavela VU + + + + + + + + +
388 Isurus oxyrinchus VU + + + + + + + + +
389 Isurus paucus VU + +
390 Manta birostris VU +
391 Mobula rochebrunei VU +
392 Mustelus mustelus VU + + + + + + + + + + +
393 Oxynotus centrina VU + + +
394 Pristis pectinata CR +
395 Pristis pristis CR +
396 Raja undulata EN + + + + + + + + +
397 Rhincodon typus VU + + + + + + + + + + +
398 Rhinobatos albomaculatus VU + + + + + + + + +
399 Rhinobatos irvinei VU + + + + + + + + + +
400 Rhinobatos rhinobatos EN + + + + + + + + + +
401 Rhynchobatus luebberti EN + + + + + + + + + +
402 Rostroraja alba EN + + + + + + + + + + +

328
No. Scientific Name Common Name
Glo
ba
l T
hre
at
Sta
tus
Ben
in
Cam
ero
on
Cô
te d
’Iv
oir
e
Eq
ua
tori
al
Gu
ine
a1
Gh
an
a
Gu
ine
a
Lib
eri
a
Nig
eri
a
Sa
o T
om
é
an
d P
rín
cip
e
Sie
rra
Le
on
e
To
go
403 Sphyrna lewini EN + + + + + + + + + + +
404 Squatina aculeata CR +
405 Squatina oculata CR + + +
406 Urogymnus ukpam EN +
BUTTERFLIES 2 0 0 0 0 2 0 0 0 0 0 0
407 Liptena tiassale VU +
408 Mylothris atewa VU +
ODONATES 16 1 10 0 2 0 0 2 7 1 3 0
409 Africocypha lacuselephantum VU + +
410 Agriocnemis angustirami VU + +
411 Ceriagrion citrinum VU + +
412 Chlorocnemis sp. nov. A EN + +
413 Chlorocypha centripunctata VU + +
414 Elattoneura dorsalis VU +
415 Mesocnemis tisi EN +
416 Neodythemis takamandensis CR +
417 Nesolestes nigeriensis CR + +
418 Nubiolestes diotima VU + +
419 Pentaphlebia stahli VU + +
420 Pseudagrion mascagnii CR +
421 Sapho puella EN + +
422 Trithemis nigra CR +
423 Umma mesumbei EN +
424 Umma purpurea VU + +

329
No. Scientific Name Common Name
Glo
ba
l T
hre
at
Sta
tus
Ben
in
Cam
ero
on
Cô
te d
’Iv
oir
e
Eq
ua
tori
al
Gu
ine
a1
Gh
an
a
Gu
ine
a
Lib
eri
a
Nig
eri
a
Sa
o T
om
é
an
d P
rín
cip
e
Sie
rra
Le
on
e
To
go
CRABS AND SHRIMPS 16 0 4 0 1 1 3 6 5 1 0 0
425 Atya intermedia EN + +
426 Caridina sodenensis VU +
427 Desmocaris bislineata EN +
428 Euryrhynchina edingtonae EN +
429 Globonautes macropus EN + +
430 Liberonautes grandbassa CR +
431 Liberonautes lugbe CR +
432 Liberonautes nanoides EN +
433 Liberonautes nimba VU + +
434 Liberonautes rubigimanus EN + +
435 Louisea balssi EN +
436 Louisea edeaensis EN +
437 Potamalpheops haugi EN +
438 Potamonautes reidi VU +
439 Potamonautes triangulus VU +
440 Potamonemus sachsi VU + +
MOLLUSKS 13 0 6 2 0 0 0 1 0 1 3 0
441 Archachatina bicarinata VU +
442 Bellamya liberiana CR +
443 Bulinus camerunensis EN +
444 Coelatura lobensis VU +
445 Hydrobia guyenoti EN +
446 Potadoma angulata EN +

330
No. Scientific Name Common Name
Glo
ba
l T
hre
at
Sta
tus
Ben
in
Cam
ero
on
Cô
te d
’Iv
oir
e
Eq
ua
tori
al
Gu
ine
a1
Gh
an
a
Gu
ine
a
Lib
eri
a
Nig
eri
a
Sa
o T
om
é
an
d P
rín
cip
e
Sie
rra
Le
on
e
To
go
447 Potadoma nyongensis EN +
448 Potadoma trochiformis EN +
449 Potadoma vogeli VU +
450 Potadoma zenkeri EN +
451 Sierraia expansilabrum VU +
452 Sierraia leonensis VU +
453 Sierraia outambensis CR +
PLANTS 483 14 341 104 54 113 25 48 164 36 52 10
454 Acanthopale decempedalis VU + + +
455 Achyranthes talbotii VU + +
456 Acioa dichotoma CR +
457 Acioa eketensis CR +
458 Afrocarpus mannii VU +
459 Afrofittonia silvestris VU + + +
460 Afrostyrax lepidophyllus VU + +
461 Afrothismia pachyantha CR +
462 Afrothismia winkleri CR +
463 Afzelia africana VU + + + + + + + +
464 Afzelia bipindensis VU + +
465 Afzelia pachyloba VU + +
466 Albizia ferruginea VU + + + + + + + +
467 Allanblackia gabonensis VU +
468 Allexis cauliflora VU + +
469 Allexis obanensis VU + +
470 Allophylus bullatus VU + + +

331
No. Scientific Name Common Name
Glo
ba
l T
hre
at
Sta
tus
Ben
in
Cam
ero
on
Cô
te d
’Iv
oir
e
Eq
ua
tori
al
Gu
ine
a1
Gh
an
a
Gu
ine
a
Lib
eri
a
Nig
eri
a
Sa
o T
om
é
an
d P
rín
cip
e
Sie
rra
Le
on
e
To
go
471 Amanoa bracteosa VU + + + +
472 Amanoa strobilacea VU + + +
473 Amorphophallus preussii VU +
474 Amphiblemma amoenum EN +
475 Aneilema silvaticum VU + +
476 Angraecopsis cryptantha VU +
477 Angraecopsis tridens VU + +
478 Angraecum pyriforme VU + + +
479 Angraecum sanfordii EN +
480 Angylocalyx talbotii VU + +
481 Anisophyllea cabole VU +
482 Anopyxis klaineana VU + + + + + +
483 Ansellia africana VU + + + + + + + + +
484 Anthocleista microphylla VU + + + + +
485 Anthocleista scandens VU + + + +
486 Anthonotha nigerica VU +
487 Anthonotha obanensis VU +
488 Anthonotha vignei VU + + + +
489 Antrocaryon micraster VU + + + + +
490 Ardisia koupensis EN +
491 Asystasia glandulifera VU +
492 Asystasia lindauiana VU +
493 Aubregrinia taiensis CR + +
494 Autranella congolensis CR + +
495 Bafodeya benna VU + +
496 Baillonella toxisperma VU + +

332
No. Scientific Name Common Name
Glo
ba
l T
hre
at
Sta
tus
Ben
in
Cam
ero
on
Cô
te d
’Iv
oir
e
Eq
ua
tori
al
Gu
ine
a1
Gh
an
a
Gu
ine
a
Lib
eri
a
Nig
eri
a
Sa
o T
om
é
an
d P
rín
cip
e
Sie
rra
Le
on
e
To
go
497 Balthasaria mannii VU +
498 Baphia dewildeana VU + +
499 Baphia latiloi VU + +
500 Baphia obanensis VU + +
501 Begonia adpressa VU +
502 Begonia bonus-henricus VU +
503 Begonia duncan-thomasii VU +
504 Begonia furfuracea VU + +
505 Begonia oxyanthera VU + +
506 Begonia pelargoniiflora CR + +
507 Begonia preussii VU + + +
508 Begonia pseudoviola VU + +
509 Begonia schaeferi VU + +
510 Belonophora ongensis CR + +
511 Berlinia hollandii EN +
512 Berlinia occidentalis VU + + + +
513 Bidens mannii VU +
514 Boutiquea platypetala EN +
515 Brachystegia kennedyi VU + +
516 Brachystegia nigerica VU + +
517 Brachystephanus giganteus VU + +
518 Brachystephanus kupeensis CR +
519 Brachystephanus longiflorus VU + + +
520 Brachystephanus nimbae VU + + + + +
521 Brillantaisia lancifolia VU +
522 Bulbophyllum bifarium VU +

333
No. Scientific Name Common Name
Glo
ba
l T
hre
at
Sta
tus
Ben
in
Cam
ero
on
Cô
te d
’Iv
oir
e
Eq
ua
tori
al
Gu
ine
a1
Gh
an
a
Gu
ine
a
Lib
eri
a
Nig
eri
a
Sa
o T
om
é
an
d P
rín
cip
e
Sie
rra
Le
on
e
To
go
523 Bulbophyllum filiforme CR + +
524 Bulbophyllum gravidum VU + +
525 Bulbophyllum jaapii VU +
526 Bulbophyllum kupense CR +
527 Bulbophyllum nigericum VU + +
528 Bulbophyllum pandanetorum EN +
529 Calochone acuminata VU +
530 Calpocalyx cauliflorus VU + +
531 Calpocalyx klainei VU +
532 Calpocalyx ngouiensis VU +
533 Calycosiphonia macrochlamys VU + + +
534 Campylospermum letouzeyi VU +
535 Casearia mannii VU +
536 Cassia aubrevillei VU +
537 Cassia fikifiki EN +
538 Cassipourea acuminata EN +
539 Cassipourea eketensis CR +
540 Cassipourea hiotou VU + +
541 Chassalia laikomensis CR + +
542 Chassalia petitiana VU +
543 Chazaliella obanensis VU + +
544 Chlorophytum petrophilum CR +
545 Chrysophyllum azaguieanum EN + +
546 Citropsis gabunensis VU +
547 Cleistopholis staudtii VU + +
548 Clerodendrum anomalum VU +

334
No. Scientific Name Common Name
Glo
ba
l T
hre
at
Sta
tus
Ben
in
Cam
ero
on
Cô
te d
’Iv
oir
e
Eq
ua
tori
al
Gu
ine
a1
Gh
an
a
Gu
ine
a
Lib
eri
a
Nig
eri
a
Sa
o T
om
é
an
d P
rín
cip
e
Sie
rra
Le
on
e
To
go
549 Coffea bakossii EN +
550 Coffea togoensis VU + +
551 Cola attiensis EN +
552 Cola boxiana EN +
553 Cola cecidiifolia CR +
554 Cola gigas VU +
555 Cola glabra VU +
556 Cola hypochrysea VU + +
557 Cola lourougnonis EN + +
558 Cola metallica CR +
559 Cola nigerica CR +
560 Cola philipi-jonesii EN +
561 Cola praeacuta CR +
562 Cola reticulata VU + + +
563 Cola suboppositifolia VU +
564 Cola umbratilis VU + +
565 Copaifera salikounda VU + + + + +
566 Cordia platythyrsa VU + + + + + +
567 Craibia atlantica VU + + + +
568 Crassocephalum bauchiense VU + + +
569 Crateranthus talbotii VU + +
570 Craterispermum montanum VU +
571 Crotalaria bamendae VU + +
572 Crotalaria ledermannii VU + +
573 Croton aubrevillei VU + + +
574 Croton stellulifer VU +

335
No. Scientific Name Common Name
Glo
ba
l T
hre
at
Sta
tus
Ben
in
Cam
ero
on
Cô
te d
’Iv
oir
e
Eq
ua
tori
al
Gu
ine
a1
Gh
an
a
Gu
ine
a
Lib
eri
a
Nig
eri
a
Sa
o T
om
é
an
d P
rín
cip
e
Sie
rra
Le
on
e
To
go
575 Crotonogyne impedita CR +
576 Crotonogyne strigosa VU + +
577 Crotonogyne zenkeri VU +
578 Cryptosepalum diphyllum EN +
579 Cryptosepalum tetraphyllum VU + + + + +
580 Culcasia sanagensis VU +
581 Cussonia bancoensis VU +
582 Cuviera talbotii VU + +
583 Cyathula fernando-poensis VU + +
584 Cylicomorpha solmsii VU +
585 Cyperus microcristatus CR +
586 Cyperus rheophytorum VU +
587 Dactyladenia dinklagei VU + + +
588 Dactyladenia hirsuta EN + +
589 Dactyladenia johnstonei CR +
590 Dactyladenia mannii CR + +
591 Dalbergia oligophylla EN +
592 Dalbergia setifera EN +
593 Daniellia oblonga VU + + + +
594 Deinbollia insignis VU +
595 Deinbollia maxima VU + + +
596 Deinbollia molliuscula VU +
597 Deinbollia saligna VU + + +
598 Desmostachys vogelii VU + + +
599 Diaphananthe bueae EN +
600 Diaphananthe polydactyla VU +

336
No. Scientific Name Common Name
Glo
ba
l T
hre
at
Sta
tus
Ben
in
Cam
ero
on
Cô
te d
’Iv
oir
e
Eq
ua
tori
al
Gu
ine
a1
Gh
an
a
Gu
ine
a
Lib
eri
a
Nig
eri
a
Sa
o T
om
é
an
d P
rín
cip
e
Sie
rra
Le
on
e
To
go
601 Dichapetalum bocageanum VU +
602 Dicliptera silvestris VU +
603 Dicraeanthus zehnderi CR +
604 Dicranolepis polygaloides VU +
605 Dielsantha galeopsoides EN + + +
606 Dinklageella scandens VU +
607 Diospyros barteri VU + + +
608 Diospyros crassiflora EN + +
609 Diospyros kupensis VU +
610 Dipsacus narcisseanus VU + +
611 Disperis mildbraedii VU + + +
612 Disperis nitida EN +
613 Dombeya ledermannii CR + +
614 Dorstenia astyanactis EN + +
615 Dorstenia prorepens VU + + +
616 Dracaena viridiflora VU + +
617 Drypetes afzelii VU + + + +
618 Drypetes glabra VU +
619 Drypetes henriquesii VU +
620 Drypetes magnistipula EN +
621 Drypetes molundana VU + +
622 Drypetes obanensis VU +
623 Drypetes pellegrinii VU + +
624 Drypetes preussii VU + +
625 Drypetes singroboensis VU + +
626 Drypetes staudtii VU + +

337
No. Scientific Name Common Name
Glo
ba
l T
hre
at
Sta
tus
Ben
in
Cam
ero
on
Cô
te d
’Iv
oir
e
Eq
ua
tori
al
Gu
ine
a1
Gh
an
a
Gu
ine
a
Lib
eri
a
Nig
eri
a
Sa
o T
om
é
an
d P
rín
cip
e
Sie
rra
Le
on
e
To
go
627 Duguetia barteri VU + +
628 Ehretia scrobiculata VU +
629 Entandrophragma angolense VU + + + + + + + +
630 Entandrophragma candollei VU + + + + + +
631 Entandrophragma cylindricum VU + + + + + +
632 Entandrophragma utile VU + + + + + +
633 Eribroma oblonga VU + + + + + + +
634 Eriocaulon asteroides VU + +
635 Eriocaulon bamendae VU + +
636 Eriocaulon parvulum VU +
637 Eriocaulon stipantepalum EN +
638 Erythrococca columnaris VU +
639 Eugenia fernandopoana VU + +
640 Eugenia gilgii CR + +
641 Eugenia tabouensis VU +
642 Eurypetalum unijugum VU +
643 Fagara mezoneurospinosa EN +
644 Fleurydora felicis VU +
645 Floscopa mannii EN + +
646 Garcinia afzelii VU + +
647 Garcinia brevipedicellata VU + +
648 Garcinia epunctata VU +
649 Garcinia kola VU + + + + + +
650 Garcinia staudtii VU + +
651 Genyorchis macrantha VU +
652 Genyorchis micropetala EN + +

338
No. Scientific Name Common Name
Glo
ba
l T
hre
at
Sta
tus
Ben
in
Cam
ero
on
Cô
te d
’Iv
oir
e
Eq
ua
tori
al
Gu
ine
a1
Gh
an
a
Gu
ine
a
Lib
eri
a
Nig
eri
a
Sa
o T
om
é
an
d P
rín
cip
e
Sie
rra
Le
on
e
To
go
653 Genyorchis platybulbon CR +
654 Gilbertiodendron bilineatum VU + + + +
655 Gilbertiodendron robynsianum VU +
656 Gilbertiodendron splendidum VU + + +
657 Gluema ivorensis VU + + +
658 Gossweilerodendron balsamiferum EN + +
659 Gossweilerodendron joveri VU +
660 Grossera elongata VU +
661 Guarea cedrata VU + + + + + +
662 Guarea thompsonii VU + + + + +
663 Gymnostemon zaizou VU +
664 Habenaria batesii EN +
665 Habenaria nigrescens VU + +
666 Habenaria obovata VU +
667 Habenaria thomana VU + + +
668 Hallea ledermannii VU + + + + + + +
669 Hallea stipulosa VU + + + + +
670 Hamilcoa zenkeri VU +
671 Haplormosia monophylla VU + + + + +
672 Helichrysum biafranum VU +
673 Hemandradenia chevalieri EN + +
674 Heritiera utilis VU + + + +
675 Hexalobus salicifolius EN + +
676 Homalium dalzielii VU + +
677 Homalium hypolasium EN +
678 Homalium patoklaense VU +

339
No. Scientific Name Common Name
Glo
ba
l T
hre
at
Sta
tus
Ben
in
Cam
ero
on
Cô
te d
’Iv
oir
e
Eq
ua
tori
al
Gu
ine
a1
Gh
an
a
Gu
ine
a
Lib
eri
a
Nig
eri
a
Sa
o T
om
é
an
d P
rín
cip
e
Sie
rra
Le
on
e
To
go
679 Homalium smythei VU + + + +
680 Hugonia macrophylla VU +
681 Hugonia micans VU +
682 Hunteria ghanensis EN +
683 Hymenocoleus glaber VU +
684 Hymenostegia bakeriana VU + +
685 Hymenostegia gracilipes EN +
686 Hymenostegia talbotii CR +
687 Hypolytrum pseudomapanioides EN +
688 Hypolytrum subcompositus CR +
689 Hypseochloa cameroonensis VU +
690 Impatiens etindensis VU +
691 Impatiens frithii EN +
692 Impatiens letouzeyi EN +
693 Impatiens sakeriana VU + +
694 Isoglossa nervosa VU +
695 Isolona deightonii VU + +
696 Isolona zenkeri VU +
697 Ixora degemensis EN +
698 Ixora foliosa VU + +
699 Ixora nigerica VU +
700 Jollydora glandulosa VU + +
701 Justicia camerunensis VU + +
702 Justicia leucoxiphos EN +
703 Justicia orbicularis VU + +
704 Keetia bakossii CR +

340
No. Scientific Name Common Name
Glo
ba
l T
hre
at
Sta
tus
Ben
in
Cam
ero
on
Cô
te d
’Iv
oir
e
Eq
ua
tori
al
Gu
ine
a1
Gh
an
a
Gu
ine
a
Lib
eri
a
Nig
eri
a
Sa
o T
om
é
an
d P
rín
cip
e
Sie
rra
Le
on
e
To
go
705 Khaya anthotheca VU + + + + + +
706 Khaya grandifoliola VU + + + + + +
707 Khaya ivorensis VU + + + + +
708 Khaya senegalensis VU + + + + + + + +
709 Kniphofia reflexa EN +
710 Korupodendron songweanum EN +
711 Kupea martinetugei CR +
712 Lasiodiscus rozeirae VU +
713 Lecaniodiscus punctatus EN + +
714 Ledermanniella aloides VU + + +
715 Ledermanniella annithomae EN +
716 Ledermanniella batangensis CR +
717 Ledermanniella bifurcata VU +
718 Ledermanniella boumiensis VU +
719 Ledermanniella cristata VU +
720 Ledermanniella kamerunensis VU +
721 Ledermanniella keayi CR +
722 Ledermanniella letouzeyi EN +
723 Ledermanniella linearifolia EN +
724 Ledermanniella onanae EN +
725 Ledermanniella schlechteri VU +
726 Ledermanniella thalloidea EN +
727 Ledermanniella variabilis EN +
728 Lefebvrea camerunensis EN +
729 Lefebvrea kupense VU +
730 Leiothylax quangensis EN +

341
No. Scientific Name Common Name
Glo
ba
l T
hre
at
Sta
tus
Ben
in
Cam
ero
on
Cô
te d
’Iv
oir
e
Eq
ua
tori
al
Gu
ine
a1
Gh
an
a
Gu
ine
a
Lib
eri
a
Nig
eri
a
Sa
o T
om
é
an
d P
rín
cip
e
Sie
rra
Le
on
e
To
go
731 Limnophyton fluitans VU + +
732 Liparis goodyeroides CR + +
733 Loesenera kalantha VU + +
734 Loesenera talbotii VU + +
735 Lophira alata VU + + + + + + +
736 Lovoa trichilioides VU + + + + + +
737 Luzula mannii VU + +
738 Macaranga beillei VU +
739 Macaranga paxii VU + +
740 Macropodiella heteromorpha VU + +
741 Macropodiella pellucida EN +
742 Magnistipula conrauana EN +
743 Magnistipula cuneatifolia CR +
744 Manniella cypripedioides EN + +
745 Mapania ferruginea VU + +
746 Marantochloa mildbraedii EN +
747 Marsdenia exellii EN + +
748 Medusandra richardsiana VU +
749 Memecylon candidum VU + +
750 Memecylon dasyanthum VU +
751 Microberlinia bisulcata CR +
752 Mikaniopsis maitlandii VU + + +
753 Mikaniopsis vitalba VU +
754 Milicia regia VU + + + + + +
755 Millettia conraui VU + +
756 Millettia macrophylla VU + + +

342
No. Scientific Name Common Name
Glo
ba
l T
hre
at
Sta
tus
Ben
in
Cam
ero
on
Cô
te d
’Iv
oir
e
Eq
ua
tori
al
Gu
ine
a1
Gh
an
a
Gu
ine
a
Lib
eri
a
Nig
eri
a
Sa
o T
om
é
an
d P
rín
cip
e
Sie
rra
Le
on
e
To
go
757 Millettia warneckei VU + + + + +
758 Mitrostigma barteri EN +
759 Momordica enneaphylla VU +
760 Monocyclanthus vignei EN + +
761 Monodora unwinii VU +
762 Monopetalanthus compactus VU + + +
763 Monopetalanthus hedinii CR +
764 Morella arborea VU +
765 Napoleonaea egertonii VU + +
766 Napoleonaea lutea CR +
767 Napoleonaea reptans CR +
768 Nauclea diderrichii VU + + + + + +
769 Neolemonniera clitandrifolia EN + + + +
770 Neoschumannia kamerunensis CR + +
771 Neostenanthera hamata VU + + + +
772 Nesogordonia papaverifera VU + + + + + + +
773 Nodonema lineatum VU + +
774 Nothospondias staudtii VU + + + +
775 Oncoba lophocarpa VU +
776 Ossiculum aurantiacum CR +
777 Ouratea amplectens VU + +
778 Ouratea quintasii VU +
779 Oxyanthus montanus VU + +
780 Oxyanthus okuensis CR +
781 Palisota preussiana VU + +
782 Pandanus thomensis VU +

343
No. Scientific Name Common Name
Glo
ba
l T
hre
at
Sta
tus
Ben
in
Cam
ero
on
Cô
te d
’Iv
oir
e
Eq
ua
tori
al
Gu
ine
a1
Gh
an
a
Gu
ine
a
Lib
eri
a
Nig
eri
a
Sa
o T
om
é
an
d P
rín
cip
e
Sie
rra
Le
on
e
To
go
783 Pararistolochia ceropegioides VU +
784 Pararistolochia goldieana VU + + + +
785 Pararistolochia preussii CR +
786 Pauridiantha divaricata VU +
787 Pauridiantha insularis VU +
788 Pauridiantha venusta VU +
789 Pavetta brachycalyx EN +
790 Pavetta kupensis CR +
791 Pavetta lasioclada VU + + + + + +
792 Pavetta mollissima VU +
793 Pavetta monticola VU + +
794 Pavetta muiriana EN +
795 Pavetta rubentifolia CR +
796 Pentas ledermannii VU + +
797 Peperomia kamerunana EN + +
798 Pericopsis elata EN + + + +
799 Phyllanthus caesiifolius CR +
800 Phyllanthus nyale CR +
801 Phyllanthus profusus VU + + +
802 Pierreodendron kerstingii VU + + + +
803 Piptostigma calophyllum VU +
804 Piptostigma fugax VU + + +
805 Piptostigma giganteum VU +
806 Placodiscus attenuatus EN + +
807 Placodiscus bancoensis VU + +
808 Placodiscus boya VU + +

344
No. Scientific Name Common Name
Glo
ba
l T
hre
at
Sta
tus
Ben
in
Cam
ero
on
Cô
te d
’Iv
oir
e
Eq
ua
tori
al
Gu
ine
a1
Gh
an
a
Gu
ine
a
Lib
eri
a
Nig
eri
a
Sa
o T
om
é
an
d P
rín
cip
e
Sie
rra
Le
on
e
To
go
809 Placodiscus bracteosus VU + +
810 Placodiscus caudatus EN +
811 Placodiscus oblongifolius VU +
812 Placodiscus opacus VU +
813 Placodiscus pseudostipularis EN + + + +
814 Plagiosiphon longitubus CR +
815 Plectranthus cataractarum VU + +
816 Polyscias quintasii EN +
817 Polystachya bicalcarata VU + +
818 Polystachya cooperi EN + +
819 Polystachya farinosa EN + +
820 Polystachya geniculata EN +
821 Polystachya kupensis CR +
822 Polystachya superposita EN +
823 Polystachya victoriae CR +
824 Premna grandifolia VU +
825 Prunus africana VU + + +
826 Pseudagrostistachys africana VU + + + + +
827 Pseuderanthemum dispersum VU + +
828 Pseudosabicea batesii VU +
829 Pseudosabicea medusula VU +
830 Pseudosabicea pedicellata VU + +
831 Psychotria bimbiensis CR +
832 Psychotria camerunensis VU +
833 Psychotria densinervia EN +
834 Psychotria guerkeana VU +

345
No. Scientific Name Common Name
Glo
ba
l T
hre
at
Sta
tus
Ben
in
Cam
ero
on
Cô
te d
’Iv
oir
e
Eq
ua
tori
al
Gu
ine
a1
Gh
an
a
Gu
ine
a
Lib
eri
a
Nig
eri
a
Sa
o T
om
é
an
d P
rín
cip
e
Sie
rra
Le
on
e
To
go
835 Psychotria hierniana VU +
836 Psychotria lanceifolia VU +
837 Psychotria minimicalyx CR +
838 Psychotria moliwensis CR +
839 Psychotria moseskemei CR + +
840 Psychotria podocarpa VU + +
841 Psydrax bridsoniana EN +
842 Pterygota bequaertii VU + + + +
843 Pterygota macrocarpa VU + + + + +
844 Pyrenacantha cordicula EN + + + +
845 Quassia sanguinea VU + +
846 Raphia regalis VU + +
847 Raphionacme caerulea EN + +
848 Rhabdotosperma ledermannii VU + +
849 Rhaphidophora pusilla VU +
850 Rhodognaphalon brevicuspe VU + + + + +
851 Rhytachne furtiva VU +
852 Rhytachne glabra VU + +
853 Rinorea fausteana EN +
854 Rinorea thomasii VU +
855 Rinorea thomensis VU +
856 Robynsia glabrata VU + + +
857 Rothmannia ebamutensis EN +
858 Rutidea nigerica VU + + +
859 Sabicea xanthotricha EN + +
860 Salacia fimbrisepala CR + +

346
No. Scientific Name Common Name
Glo
ba
l T
hre
at
Sta
tus
Ben
in
Cam
ero
on
Cô
te d
’Iv
oir
e
Eq
ua
tori
al
Gu
ine
a1
Gh
an
a
Gu
ine
a
Lib
eri
a
Nig
eri
a
Sa
o T
om
é
an
d P
rín
cip
e
Sie
rra
Le
on
e
To
go
861 Salacia mamba VU +
862 Salacia miegei VU +
863 Sapium aubrevillei VU + +
864 Sarcophrynium villosum EN +
865 Saxicolella laciniata VU +
866 Saxicolella marginalis CR + +
867 Scaphopetalum parvifolium VU +
868 Schefflera hierniana VU + +
869 Schefflera mannii VU + + + +
870 Schumanniophyton problematicum VU + + +
871 Scleria afroreflexa EN +
872 Sclerochiton preussii EN + +
873 Secamone racemosa VU + +
874 Sericanthe toupetou EN + +
875 Silene biafrae VU +
876 Soyauxia talbotii EN +
877 Spathandra barteri VU +
878 Staudtia pterocarpa VU +
879 Staurogyne bicolor VU +
880 Stelechantha arcuata CR +
881 Strychnos elaeocarpa VU +
882 Strychnos millepunctata VU +
883 Strychnos staudtii VU +
884 Stylochaeton pilosus EN + +
885 Synsepalum aubrevillei VU + +
886 Synsepalum glycydora VU +

347
No. Scientific Name Common Name
Glo
ba
l T
hre
at
Sta
tus
Ben
in
Cam
ero
on
Cô
te d
’Iv
oir
e
Eq
ua
tori
al
Gu
ine
a1
Gh
an
a
Gu
ine
a
Lib
eri
a
Nig
eri
a
Sa
o T
om
é
an
d P
rín
cip
e
Sie
rra
Le
on
e
To
go
887 Synsepalum tsounkpe EN +
888 Talbotiella eketensis EN +
889 Talbotiella gentii CR +
890 Tapinanthus letouzeyi VU +
891 Tapinanthus preussii VU + +
892 Tapura ivorensis VU + +
893 Tarenna hutchinsonii CR + +
894 Teclea carpopunctifera VU +
895 Terminalia ivorensis VU + + + + + + +
896 Testulea gabonensis EN +
897 Tetraberlinia tubmaniana VU +
898 Thecacoris annobonae EN + +
899 Tieghemella africana EN + +
900 Tieghemella heckelii EN + + + + + +
901 Tiliacora lehmbachii EN +
902 Tricalysia atherura VU +
903 Tricalysia lejolyana EN +
904 Tricalysia talbotii VU + +
905 Trichilia ornithothera VU + +
906 Trichoscypha cavalliensis VU + + +
907 Trichoscypha mannii VU + + + + +
908 Trichostachys interrupta VU + +
909 Triclisia lanceolata EN +
910 Triclisia macrophylla CR + + +
911 Turraea adjanohounii VU +
912 Turraeanthus africanus VU + + + + + + +

348
No. Scientific Name Common Name
Glo
ba
l T
hre
at
Sta
tus
Ben
in
Cam
ero
on
Cô
te d
’Iv
oir
e
Eq
ua
tori
al
Gu
ine
a1
Gh
an
a
Gu
ine
a
Lib
eri
a
Nig
eri
a
Sa
o T
om
é
an
d P
rín
cip
e
Sie
rra
Le
on
e
To
go
913 Tylophora urceolata VU + +
914 Uvariastrum zenkeri VU + +
915 Uvariodendron giganteum VU +
916 Uvariodendron occidentale VU + + + + +
917 Uvariopsis submontana EN +
918 Uvariopsis tripetala VU + +
919 Uvariopsis vanderystii EN +
920 Vepris heterophylla EN + +
921 Vepris lecomteana VU + +
922 Vepris trifoliolata VU +
923 Vernonia bamendae VU + +
924 Vincentella densiflora VU +
925 Vitex lehmbachii EN +
926 Vitex yaundensis CR +
927 Warneckea memecyloides VU + + + +
928 Whitfieldia preussii VU + +
929 Winklerella dichotoma CR +
930 Xylopia africana VU + + +
931 Xylopia elliotii VU +
932 Xylopia talbotii VU +
933 Zanthoxylum atchoum VU +
934 Zanthoxylum chevalieri VU +
935 Zanthoxylum psammophilum EN +
936 Zehnderia microgyna CR +
Total 936 65 567 209 106 202 140 149 287 78 141 54
Source: IUCN Red List version 2013.
Note: 1 - species listed for Equatorial Guinea only include those recorded on the islands of Annobón and Bioko.

349
Appendix 5: Site Outcomes for the Guinean Forests of West Africa Hotspot
Map Code
Key Biodiversity Area Realm Conservation Corridor Area in Hectares
Ov
erl
ap
wit
h
Pro
tec
ted
Are
as
1 (
%)
Bio
log
ical
Pri
ori
ty S
co
re
CE
PF
Pri
ori
ty
BENIN
BEN1 Lake Nokoué Terrestrial none 98,403 0 3
CAMEROON
CMR1 Bakossi Mountains Terrestrial Korupmba-Obachap 75,581 38 1 Yes
CMR2 Bali-Ngemba Forest Reserve Terrestrial Korupmba-Obachap 899 0 2 Yes
CMR3 Bamboutos Mountains Terrestrial Korupmba-Obachap 7,396 0 1 Yes
CMR4 Banyang Mbo Wildlife Sanctuary Terrestrial Korupmba-Obachap 69,145 100 4
CMR5 Korup National Park Terrestrial Korupmba-Obachap 129,115 100 3
CMR6 Mbi Crater Faunal Reserve - Mbingo forest Terrestrial Korupmba-Obachap 3,233 0 1 Yes
CMR7 Mont Bana Terrestrial Korupmba-Obachap 159 0 2
CMR8 Mont Kupe Integral Ecological Reserve Terrestrial Korupmba-Obachap 428 0 1
CMR9 Mont Manengouba Terrestrial Korupmba-Obachap 8,740 0 1
CMR10 Mont Nganha Terrestrial none 16,930 0 1
CMR11 Mont Nlonako Terrestrial Korupmba-Obachap 64,124 0 1
CMR12 Mount Cameroon and Mokoko-Onge Terrestrial Korupmba-Obachap 107,143 54 1 Yes
CMR13 Mount Lefo Terrestrial Korupmba-Obachap 1,649 0 1
CMR14 Mount Mbam Terrestrial Korupmba-Obachap 13,221 0 2
CMR15 Mount Oku Terrestrial Korupmba-Obachap 16,353 0 1 Yes
CMR16 Mount Rata and Rumpi Hills Forest Reserve Terrestrial Korupmba-Obachap 45,200 0 1 Yes
CMR17 Santchou Faunal Reserve Terrestrial Korupmba-Obachap 9,506 100 4
CMR18 Tchabal Mbabo Terrestrial Korupmba-Obachap 312,347 0 1 Yes
CMR19 Yabassi Terrestrial Korupmba-Obachap 264,867 0 2 Yes

350
Map Code
Key Biodiversity Area Realm Conservation Corridor Area in Hectares
Ov
erl
ap
wit
h
Pro
tec
ted
Are
as
1 (
%)
Bio
log
ical
Pri
ori
ty S
co
re
CE
PF
Pri
ori
ty
CÔTE D’IVOIRE
CIV1 Adiopodoume Terrestrial Forest Reserves of Southeastern Côte d’Ivoire & Southwestern Ghana 1,939 0 2
CIV2 Forêt Classée de Bossematié Terrestrial Forest Reserves of Southeastern Côte d’Ivoire & Southwestern Ghana 21,976 0 2
CIV3 Forêt Classée de Cavally et Goin - Débé Terrestrial Cestos-Sapo-Grebo-Taï-Cavally Corridor 197,925 0 2 Yes
CIV4 Forêt Classée de Mabi Terrestrial Forest Reserves of Southeastern Côte d’Ivoire & Southwestern Ghana 62,095 0 4
CIV5 Forêt Classée de Mopri Terrestrial Bandama River Catchment 32,459 0 3
CIV6 Forêt Classée de Yapo et Mambo Terrestrial Forest Reserves of Southeastern Côte d’Ivoire & Southwestern Ghana 30,598 0 2
CIV7 Forêt Classée des Mont Guéoulé et Mont Glo Réserves Terrestrial Mount Nimba Complex 49,019 0 2
CIV8 Mount Nimba (part of Mount Nimba transboundary AZE) Terrestrial Mount Nimba Complex 27,035 17 2
CIV9 Parc National d’ Azagny Terrestrial Bandama River Catchment 18,865 93 4
CIV10 Parc National de Marahoué Terrestrial none 87,526 100 4
CIV11 Parc National de Taï et Réserve de Faune du N’Zo Terrestrial Cestos-Sapo-Grebo-Taï-Cavally Corridor 539,376 100 3
CIV12 Parc National du Mont Péko Terrestrial none 29,330 0 4
CIV13 Parc National du Mont Sangbé Terrestrial none 75,029 100 4
CIV14 Réserve Intégrale du Mont Nimba Terrestrial Mount Nimba Complex 6,480 83 4
CIV15 Station de recherche écologique de Lamto Terrestrial Bandama River Catchment 2,721 80 4
EQUATORIAL GUINEA
GNQ1 Annobón Terrestrial none 2,871 0 1 Yes
GNQ2 Reserva Cientifica de la Caldera de Lubá Terrestrial none 51,075 100 3 Yes
GNQ3 Parque Nacional del Pico de Basilé Terrestrial none 32,256 100 1 Yes

351
Map Code
Key Biodiversity Area Realm Conservation Corridor Area in Hectares
Ov
erl
ap
wit
h
Pro
tec
ted
Are
as
1 (
%)
Bio
log
ical
Pri
ori
ty S
co
re
CE
PF
Pri
ori
ty
GHANA
GHA1 Amansuri wetland Terrestrial Forest Reserves of Southeastern Côte d’Ivoire & Southwestern Ghana 26,751 0 2
GHA2 Ankasa Resource Reserve - Nini-Sushien National Park Terrestrial Forest Reserves of Southeastern Côte d’Ivoire & Southwestern Ghana 47,444 95 4
GHA3 Atewa Range Forest Reserve Terrestrial Forest Reserves of Southeastern Côte d’Ivoire & Southwestern Ghana 21,111 0 2 Yes
GHA4 Bia National Park and Resource Reserve Terrestrial Forest Reserves of Southeastern Côte d’Ivoire & Southwestern Ghana 34,115 87 4
GHA5 Boin River Forest Reserve Terrestrial Forest Reserves of Southeastern Côte d’Ivoire & Southwestern Ghana 30,530 0 5
GHA6 Boin Tano Forest Reserve Terrestrial Forest Reserves of Southeastern Côte d’Ivoire & Southwestern Ghana 12,181 0 2
GHA7 Bosomtwe Range Forest Reserve Terrestrial Forest Reserves of Southeastern Côte d’Ivoire & Southwestern Ghana 7,546 0 3
GHA8 Bura River Forest Reserve Terrestrial Forest Reserves of Southeastern Côte d’Ivoire & Southwestern Ghana 9,996 0 4
GHA9 Cape Three Points Forest Reserve Terrestrial Forest Reserves of Southeastern Côte d’Ivoire & Southwestern Ghana 4,545 0 2 Yes
GHA10 Dadieso Forest Reserve Terrestrial Forest Reserves of Southeastern Côte d’Ivoire & Southwestern Ghana 15,031 0 4
GHA11 Draw River Forest Reserve Terrestrial Forest Reserves of Southeastern Côte d’Ivoire & Southwestern Ghana 19,391 0 2
GHA12 Ebi River Shelterbelt Forest Reserve Terrestrial Forest Reserves of Southeastern Côte d’Ivoire & Southwestern Ghana 1,756 0 3
GHA13 Fure River Forest Reserve Terrestrial Forest Reserves of Southeastern Côte d’Ivoire & Southwestern Ghana 14,046 0 4
GHA14 Jema-Asemkrom Forest Reserve Terrestrial Forest Reserves of Southeastern Côte d’Ivoire & Southwestern Ghana 6,756 0 2
GHA15 Kakum National Park - Assin Attandaso Resource Reserve Terrestrial
Forest Reserves of Southeastern Côte d’Ivoire & Southwestern Ghana 31,783 55 3
GHA16 Kyabobo (proposed) National Park Terrestrial Togo Highlands 21,882 0 2
GHA17 Mamiri Forest Reserve Terrestrial Forest Reserves of Southeastern Côte d’Ivoire & Southwestern Ghana 4,815 0 5
GHA18 Mount Afadjato - Agumatsa Range Forest Terrestrial none 2,185 0 5

352
Map Code
Key Biodiversity Area Realm Conservation Corridor Area in Hectares
Ov
erl
ap
wit
h
Pro
tec
ted
Are
as
1 (
%)
Bio
log
ical
Pri
ori
ty S
co
re
CE
PF
Pri
ori
ty
GHA19 Neung South Forest Reserve Terrestrial Forest Reserves of Southeastern Côte d’Ivoire & Southwestern Ghana 11,974 0 2
GHA20 Nsuensa Forest Reserve Terrestrial Forest Reserves of Southeastern Côte d’Ivoire & Southwestern Ghana 6,330 0 5
GHA21 Pra-Sushien Forest Reserve Terrestrial Forest Reserves of Southeastern Côte d’Ivoire & Southwestern Ghana 18,721 0 3
GHA22 Sapawsu Forest Reserve Terrestrial none 922 0 2
GHA23 Shai Hills Game Production Reserve Terrestrial none 343 0 3
GHA24 Southern Scarp Forest Reserve Terrestrial Forest Reserves of Southeastern Côte d’Ivoire & Southwestern Ghana 24,882 0 2
GHA25 Subri River Forest Reserve Terrestrial Forest Reserves of Southeastern Côte d’Ivoire & Southwestern Ghana 55,930 0 2
GHA26 Tano-Anwia Forest Reserve Terrestrial Forest Reserves of Southeastern Côte d’Ivoire & Southwestern Ghana 14,105 0 5
GHA27 Tano-Ehuro Forest Reserve Terrestrial Forest Reserves of Southeastern Côte d’Ivoire & Southwestern Ghana 20,787 0 5
GHA28 Tano-Nimiri Forest Reserve Terrestrial Forest Reserves of Southeastern Côte d’Ivoire & Southwestern Ghana 19,026 0 4
GHA29 Tano-Offin Forest Reserve Terrestrial Forest Reserves of Southeastern Côte d’Ivoire & Southwestern Ghana 43,061 0 2 Yes
GHA30 Yoyo River Forest Reserve Terrestrial Forest Reserves of Southeastern Côte d’Ivoire & Southwestern Ghana 21,139 0 4
GUINEA
GIN1 Chutes de la Sala Terrestrial none 1,440 0 4
GIN2 Diécké Terrestrial Mount Nimba Complex 59,232 0 3
GIN3 Forêt Classée de Balayan Souroumba Terrestrial none 22,479 0 2
GIN4 Forêt Classée de Mont Bero Terrestrial Lofa-Gola-Mano Complex 27,483 0 3
GIN5 Kabitaï Terrestrial none 4,970 0 3
GIN6 Konkouré Terrestrial none 45,744 0 1 Yes
GIN7 Kounounkan Terrestrial none 10,644 0 4
GIN8 Massif du Ziama Terrestrial Lofa-Gola-Mano Complex 91,481 0 2

353
Map Code
Key Biodiversity Area Realm Conservation Corridor Area in Hectares
Ov
erl
ap
wit
h
Pro
tec
ted
Are
as
1 (
%)
Bio
log
ical
Pri
ori
ty S
co
re
CE
PF
Pri
ori
ty
GIN9 Monts Nimba Terrestrial Mount Nimba Complex 14,562 100 3
GIN10 Pic de Fon Terrestrial Lofa-Gola-Mano Complex 32,117 0 3
GIN11 Sincery Oursa Terrestrial none 15,859 0 3
LIBERIA
LBR1 Cestos - Senkwen Terrestrial Cestos-Sapo-Grebo-Taï-Cavally Corridor 350,405 0 2 Yes
LBR2 Cestos/Gbi Area Terrestrial Cestos-Sapo-Grebo-Taï-Cavally Corridor 316,490 0 4 Yes
LBR3 Cestos-Sapo North Corridor forest blocks Terrestrial Cestos-Sapo-Grebo-Taï-Cavally Corridor 81,401 0 4
LBR4 Gio National Forest Terrestrial Cestos-Sapo-Grebo-Taï-Cavally Corridor 48,826 0 4
LBR5 Grand Kru SouthEast Forest blocks Terrestrial Cestos-Sapo-Grebo-Taï-Cavally Corridor 90,191 0 4
LBR6 Grand Kru SouthWest blocks Terrestrial Cestos-Sapo-Grebo-Taï-Cavally Corridor 55,111 0 4
LBR7 Grebo Terrestrial Cestos-Sapo-Grebo-Taï-Cavally Corridor 282,195 0 2 Yes
LBR8 Kpelle Forest Terrestrial Lofa-Gola-Mano Complex 216,898 0 3
LBR9 Krahn Bassa South Terrestrial Cestos-Sapo-Grebo-Taï-Cavally Corridor 203,020 0 3
LBR10 Lake Piso Terrestrial None 24,859 0 4
LBR11 Lofa-Mano Complex Terrestrial Lofa-Gola-Mano Complex 437,854 0 2 Yes
LBR12 Nimba mountains Terrestrial Mount Nimba Complex 13,254 0 2 Yes
LBR13 Sapo - Grebo Corridor Terrestrial Cestos-Sapo-Grebo-Taï-Cavally Corridor 197,421 0 3
LBR14 Sapo National Park Terrestrial Cestos-Sapo-Grebo-Taï-Cavally Corridor 155,084 0 2 Yes
LBR15 West Nimba Terrestrial none 11,625 0 3
LBR16 Wologizi mountains Terrestrial Lofa-Gola-Mano Complex 167,985 0 2
LBR17 Wonegizi mountains Terrestrial Lofa-Gola-Mano Complex 28,868 0 2 Yes

354
Map Code
Key Biodiversity Area Realm Conservation Corridor Area in Hectares
Ov
erl
ap
wit
h
Pro
tec
ted
Are
as
1 (
%)
Bio
log
ical
Pri
ori
ty S
co
re
CE
PF
Pri
ori
ty
LBR18 Zwedru Terrestrial Cestos-Sapo-Grebo-Taï-Cavally Corridor 64,458 0 1 Yes
NIGERIA
NGA1 Afi River Forest Reserve Terrestrial Korupmba-Obachap 51,975 0 2
NGA2 Akassa Forests Terrestrial Lower Niger Delta 8,333 0 5
NGA3 Biseni forests Terrestrial Lower Niger Delta 21,619 0 3
NGA4 Cross River National Park: Oban Division Terrestrial Korupmba-Obachap 268,952 100 3 Yes
NGA5 Gashaka-Gumti National Park Terrestrial Korupmba-Obachap 586,803 100 4 Yes
NGA6 IITA Forest Reserve, Ibadan Terrestrial none 327 0 2
NGA7 Mbe Mountains and Cross River National Park: Okwangwo Division Terrestrial Korupmba-Obachap 95,288 54 2 Yes
NGA8 Ngel-Nyaka Forest Reserve Terrestrial Korupmba-Obachap 3,004 0 2
NGA9 Obudu Plateau Terrestrial Korupmba-Obachap 70,743 0 2 Yes
NGA10 Okomu National Park Terrestrial Lower Niger Delta 111,626 100 4
NGA11 Omo Forest Reserve Terrestrial none 131,908 0 2
NGA12 Upper Orashi forests Terrestrial Lower Niger Delta 9,883 0 3
SÃO TOMÉ AND PRÍNCIPE
STP1 Parque Natural Obô do Príncipe Terrestrial none 5,670 0 1 Yes
STP2 Parque Natural Obô de São Tomé e Zona Tampão Terrestrial none 44,830 0 1 Yes
STP3 Zona Ecológica dos Mangais do Rio Malanza Terrestrial none 229 0 1 Yes
STP4 Zona Ecológica da Praia das Conchas Terrestrial none 522 0 1 Yes
SIERRA LEONE
SLE1 Gola Forest Reserve Terrestrial Lofa-Gola-Mano Complex 74,612 100 1
SLE2 Kambui Hills Forest Reserve Terrestrial Lofa-Gola-Mano Complex 14,012 0 2

355
Map Code
Key Biodiversity Area Realm Conservation Corridor Area in Hectares
Ov
erl
ap
wit
h
Pro
tec
ted
Are
as
1 (
%)
Bio
log
ical
Pri
ori
ty S
co
re
CE
PF
Pri
ori
ty
SLE3 Kangari Hills Non-hunting Forest Reserve Terrestrial none 11,743 0 3
SLE4 Loma Mountains Non-hunting Forest Reserve Terrestrial none 26,782 100 4
SLE5 Sierra Leone River Estuary Terrestrial Sierra Leone Coastal Corridor 55,823 0 2
SLE6 Tingi Hills Non-hunting Forest Reserve Terrestrial none 14,293 100 4
SLE7 Tiwai Island Game Sanctuary/Non-hunting Forest Reserve Terrestrial none 1,251 0 2
SLE8 Western Area Peninsula Non-hunting Forest Reserve Terrestrial Sierra Leone Coastal Corridor 16,414 100 1 Yes
SLE9 Yawri Bay Terrestrial Sierra Leone Coastal Corridor 54,674 0 2 Yes
TOGO
TGO1 Fazao-Malfakassa National Park Terrestrial Togo Highlands 215,337 100 4
TGO2 Missahoe Forest Reserve Terrestrial none 1,225 0 2
FRESHWATER KBAS
fw1 Lake Barombi Mbo and surrounding catchments Freshwater Korupmba-Obachap 176,536 100 1 Yes
fw2 Lake Bermin and surrounding catchments Freshwater Korupmba-Obachap 152,302 0 1
fw3 Lower Bandama River Freshwater Bandama River Catchment 315,998 0 2
fw4 Lower reaches of St Paul River Freshwater Lofa-Gola-Mano Complex 444,939 0 2
fw5 Lower Volta eastern catchment Freshwater none 91,184 0 2
fw6 Gbangbaia River Basin Freshwater Sierra Leone Coastal Corridor 266,478 0 2 Yes
fw7 Middle reaches of St Paul River Freshwater Lofa-Gola-Mano Complex 226,000 0 1
fw8 Rhombe Swamp and Mouth of Little and Great Scarcies Rivers Freshwater Sierra Leone Coastal Corridor 88,460 0 1 Yes
fw9 São Tomé Freshwater none 90,467 0 1
fw10 South East Niger Delta - near Calabar Freshwater Korupmba-Obachap 269,451 0 2 Yes
fw11 Upper reaches of St Paul River Freshwater Lofa-Gola-Mano Complex 366,131 0 2
fw12 Weeni creek - Grand Bassa County Freshwater Cestos-Sapo-Grebo-Taï-Cavally Corridor 104,738 0 1

356
Map Code
Key Biodiversity Area Realm Conservation Corridor Area in Hectares
Ov
erl
ap
wit
h
Pro
tec
ted
Are
as
1 (
%)
Bio
log
ical
Pri
ori
ty S
co
re
CE
PF
Pri
ori
ty
fw13 West Niger Delta Freshwater Lower Niger Delta 493,149 0 2 Yes 1 Overlap with protected areas is calculated as the percentage of the total KBA area that spatially overlaps IUCN Category I-IV Protected Areas.

357
Appendix 6: Additional Socio-economic Data Key Demographic + Ecological Footprint Measures for the Guinean Forests of West Africa Hotspot Countries
Country Land area
in sq. km (2008)
1
Population density (no. of people per sq. km, 2011 popn. data)
2
Population in 2012 (millions)**
Projected population in 2030 (millions)**
Annual population growth rate (%)** 2000-2005
Annual population growth rate (%)** estimate 2010-2015
Ecological Footprint of Consumption ++ (global ha. per capita, 2010)
Total biocapacity ++ (global ha. per capita, 2010)
Ecological (Deficit) or Reserve ++ (global ha. per capita, 2010)
Benin 112,622 87 9.4 14.6 3.2 2.7 1.2 0.8 (0.4)
Cameroon 475,442 45 20.5 28.8 2.3 2.1 1.0 1.9 0.8
Côte d’Ivoire 322,463 61 20.6 29.8 1.7 2.2 1.0 1.7 0.7
Equatorial
Guinea
28,051 26 0.7 1.1 3.1 2.7 2.4 approx.
(read off
graph: 2009)
4.2 approx.
(read off
graph: 2009)
1.8?
Ghana 238,553 109 25.5 36.5 2.4 2.3 1.8 1.2 (0.6)
Guinea 245,857 45 10.5 15.9 1.6 2.5 1.7 2.8 1.1
Liberia 111,369 42 4.2 6.5 2.2 2.6 1.3 2.5 1.2
Nigeria 923,768 180 166.6 257.8 2.5 2.5 1.4 1.1 (0.3)
São Tomé e
Príncipe
964 191 0.2 0.2 1.6 2.0 1.7 approx.
(read off
graph; 2009)
0.75 approx.
(read off
graph; 2009)
(0.95)?
Sierra Leone 71,740 82 6.1 8.5 4.4 2.1 1.1 1.2 0.1
Togo 56,785 119 6.3 8.7 2.4 2.0 1.0 0.6 (0.4)
++ Global Footprint Network: National Ecological Footprint Account (NFA) Tables 2010 Results: (http://www.footprintnetwork.org/en/index.php/GFN/page/footprint_for_nations/) Footprint Global average: 2.7; African average: 1.4 global ha. per capita.
Ecological Footprint: A measure of how much area of biologically productive land and water an individual, population or activity requires to produce all the
resources it consumes and to absorb the waste it generates, using prevailing technology and resource management practices. The Ecological Footprint is usually
measured in global hectares, which makes data and results globally comparable. For a city or a nation, it is simply the sum of the Ecological Footprint of all the
residents of that city or nation. Because trade is global, an individual or country’s Footprint includes land or sea from all over the world. Ecological Footprint is
often referred to in short form as Footprint. Footprint varies each year with consumption and production efficiency.
1 UNEP (2008): “Africa: Atlas of our Changing Environment”
2 World Bank (2013) The World Bank – World Development Indicators: Table 1.1 Size of the Economy http://wdi.worldbank.org/table/1.1
**UNDP (2013) Human Development Report 2013 – The Rise of the South: Human Progress in a Diverse World. Table 14: Population trends

358
Biological Capacity or Biocapacity: The capacity of ecosystems to produce useful biological materials and to absorb waste materials generated by humans,
using current management schemes and extraction technologies. “Useful biological materials” are defined as those demanded by the human economy. Hence
what is considered “useful” can change from year to year. The biocapacity of an area is calculated by multiplying the actual physical area by the yield factor and
the appropriate equivalence factor. Biocapacity is usually expressed in global hectares. Biocapacity varies each year with ecosystem management, agricultural
practices (such as fertilizer use and irrigation), ecosystem degradation, weather and population size.
Importance of Agricultural Sector in Hotspot Countries, 2000 to 2013
Country Rural popn. as % of total popn.
3 (%)
(2012)
% Land under agriculture (arable land + permanent crops)
4
% Total labour force in agriculture
5
(2013)
Females as % of total labour force in agric.
6
(2013)
Total GDP (2000)
7
($ billions)
Total GDP (2012)
5
($ billions)
Agriculture share of GDP (2000)
5
(%)
Agriculture share of GDP (2012)
5
(%)
Benin 54.4 25.5 41.5 40.1 2.4 7.6 35 32
Cameroon 47.3 16.1 43.9 46.8 9.3 25.3 22 nd
Côte d’Ivoire 48.0
23.0 34.8 35.7 10.4 24.7 24 nd
Equatorial
Guinea
60.4 7.1 62.8 42.8 1.2 17.7 10 nd
Ghana 47.4 33.4 53.6 45.3 5.0 40.7 39 23
Guinea 64.1 14.4 78.5 50.2 3.0 5.6 22 21
Liberia 51.5 6.5 60.3 43.7 0.5 1.7 76 39
Nigeria 49.7 43.0 22.7 40.6 46.4 262.6 26 33
São Tomé and
Príncipe
36.6 49.7 55.9 50.0 0.1 0.3 12 nd
Sierra Leone 60.4 17.2 58.2 61.6 0.6 3.8 58 57
Togo 61.5 50.0 51.6 42.2 1.3 3.8 35 31
Notes: nd = no data.
3 UNDP (2013) Human Development Report 2013 – The Rise of the South: Human Progress in a Diverse World. Table 14: Population trends.
4 FAOSTAT accessed February 2014 – 2011 data
5 FAOSTAT Country Profiles accessed February 2014 –data 2013- http://www.fao.org/countryprofiles/index/en/?lang=en
6 FAOSTAT Country Profiles accessed February 2014 – data 2013- http://www.fao.org/countryprofiles/index/en/?lang=en
7 http://wdi.worldbank.org/table/4.2 The World Bank 2013 World View 4.2 World Development Indicators: structure of output

359
Primary Designated Functions of Forest and proportion of Forest in Protected Areas in Hotspot Countries in 2010
8
Country Total forest area (1000 ha)
(2010)
Primary designated function (%) (2010) Forest within protected areas (% of total forest area)
(2010)
Production Water and soil protection
Conservation of biodiversity
Social services
Multiple use Other None or unknown
Benin 4,561 31 0 28 n.s. 40 0 0 28
Cameroon 19,916 73 3 17 1 6 n.s. 0 46
Côte d’Ivoire 10,403 89 3 8 n.s. 0 0 0 8
Equatorial
Guinea
1,626 5 0 36 3 53 3 0 36
Ghana 4,940 23 7 1 1 0 0 68 1
Guinea 6,544 2 9 46 0 7 0 36 4
Liberia 4,329 25 0 4 0 0 0 71 4
Nigeria 9,041 29 0 28 0 0 0 43 28
São Tomé e
Príncipe
27 - - - - - - - -
Sierra Leone 2,726 9 0 7 0 0 0 84 7
Togo 287 68 16 16 0 0 0 0 -
Notes: ns = ‘not significant’ (i.e., very small value).
8 FAO (2012) Global Forest Resources Assessment (FRA): Main Report and Global Tables 2010. FAO Forestry Paper 163. FAO Rome.
http://www.fao.org/forestry/fra/fra2010/en/

360
Forest Cover and Trends 1990-20109
Country Total forest cover
(1,000 ha)
(2010)
Forest cover as % of total land
area (%)
(2010)
Annual change rate – forest area Planted forest (1,000
ha)
(2010)
Forest within protected areas
(2010) 1990-2000 2000-2005 2005-2010
1,000 ha/ year
% 1,000 ha/ year
% 1,000 ha/ year
% (1,000 ha)
(% total forest area)
Benin 4,561 41 -70 -1.29 -50 -1.01 -50 -1.06 19 1,263 28
Cameroon 19,916 42 -220 -0.94 -220 -1.02 -220 -1.07 - 9,105 46
Côte d’Ivoire 10,403 33 11 0.10 15 0.15 n.s. n.s. 337 808 8
Equatorial
Guinea
1,626 58 -12 -0.65 -12 -0.67 -12 -0.71 n.s. 586 36
Ghana 4,940 22 -135 -1.99 -115 -1.97 -115 2.19 260 43 1
Guinea 6,544 27 -36 -0.51 -36 -0.53 -36 -0.54 93 242 4
Liberia 4,329 45 -30 -0.63 -30 -0.66 -30 -0.68 8 194 4
Nigeria 9,041 10 -410 -2.68 -410 -3.33 -410 -4.00 382 2,509 28
São Tomé e
Príncipe
27 28 0 0 0 0 0 0 0 - -
Sierra Leone 2,726 38 -20 -0.65 -20 -0.68 -20 -0.70 15 187 7
Togo 287 5 -20 -3.37 -20 -4.50 -20 -5.75 42 - -
Notes: ns = ‘not significant’ (i.e., very small value).
9 FAO (2012) Global Forest Resources Assessment (FRA): Main Report and Global Tables 2010. FAO Forestry Paper 163. FAO Rome.
http://www.fao.org/forestry/fra/fra2010/en/

361
Major commodities grown in Hotspot countries: area harvested (ha) by country in 201210
Benin Cameroon Côte d’Ivoire Equatorial Guinea Ghana
Maize
Cashew nuts,
with shell
Cassava
Groundnuts,
with shell
Coconuts
938,846
468,000
247,754
140,014
130,000
Cacao, beans
Beans, dry
Cassava
Cow peas, dry
Coffee, green
Bananas
670,000
300,000
290,000
285,000
210,000
85,000
Cacao, beans
Cashew nuts,
with shell
Cassava
Coffee, green
Beans, dry
Coconuts
2,500,000
900,000
360,000
160,000
39,000
38,000
Cassava
Sweet
potatoes
Coffee,
green
Plantains
Bananas
23,000
18,000
12,500
7,100
6,000
Cacao, beans
Cassava
Groundnuts, with
shell
Cashew nuts, with
shell
Coconuts
Karite (shea) nuts
1,600,300
868,550
345,186
1,000
60,000
30,500
Guinea Liberia Nigeria São Tomé e Príncipe Sierra Leone Togo
Maize
Millet
Fonio
Groundnuts,
with shell
Maize, green
Cassava
490,000
315,000
300,000
218,000
132,000
128,000
Rice, paddy
Rubber,
natural
Cacao, beans
Cassava
Plantains
Oil palm
250,000
76,000
70,500
63,000
21,500
17,000
Cassava
Cow peas,
dry
Groundnu
ts +shell
Cacao,
beans
Fruit,
citrus
Fonio
3,850,000
3,200,000
2,420,000
1,196,000
800,000
165,000
Cacao,
beans
Coconuts
Bananas
Taro
(cocoyam)
Oil palm
20,000
13,500
5,300
3,700
1,670
Cassava
Groundnuts,
with shell
Cacao, beans
Maize
Millet
Oil palm
490,000
125,000
50,000
47,000
33,500
27,000
Maize
Beans, dry
Cassava
Groundnuts,
with shell
Coffee,
green
576,000
360,000
155,000
66,000
27,000
10
(all data for 2012; FAOSTAT – accessed Feb 18, 2014)

362
Appendix 7: Details of Governance Structures in Each Hotspot Country
Benin
Formerly Dahomey, the officially termed Republic of Benin is a presidential representative
democratic republic, with the president comprising the head of state, government and of a
multi-party system. The primary legislative body in Benin is the National Assembly, for
which deputies are elected every four years. Absolute majority presidential elections are held
every five years, and individual presidents can serve for up to two terms. The government
exercises executive power, whereas legislative power is conferred on the government and
legislature. The current political system replaced the People’s Republic of Benin (1975–1990)
and is derived from the 1990 Constitution of Benin. While this constitution has been
beneficial to the country’s economy, several problems are still present, most notably the non-
successful separation of the political from the judiciary system. The Economist Intelligence
Unit refers to the country’s political system as a hybrid regime, with an appointed democracy
index of 5.65 – ranging from 1.00 (authoritarian regime) to 9.99 (full democracy). For
administration purposes, Benin is divided into twelve departments, which in turn are
subdivided into 77 communes.
Cameroon
The Republic of Cameroon is a unitary presidential republic, whereby the president is head of
the state, the government and a multi-party system. Executive power is exercised by the
government, and legislative power by the government and the National Assembly of
Cameroon. This power lies in effect decidedly in the hands of authoritarian President Paul
Biya and his Cameroon People’s Democratic Movement party since 1982. The 1972
constitution of the republic (reformed in 1996) allows for a powerful central government: The
president is in full control, whereby he is not required to take counsel from the National
Assembly in order to among others appoint or dismiss members of cabinet, generals,
provincial governors, prefects, subprefects, and approve or veto regulations. A constitutional
amendment that eliminated presidential term limits has been passed in 2008. Although
Cameroon has experienced high social and political stability, poverty is still serious for many
people and the human rights record remains flawed. The Economist Intelligence Unit lists the
government as an authoritarian regime, with a democracy index of 3.41.
Cameroon is divided into ten semi-autonomous regions, each administrated by an elected
Regional Council. The president also appoints a governor with broad powers to execute his
will at each region and to control smaller administrative units. The regions are split into 58
divisions headed by presidentially appointed divisional officers (prefects); these comprise in
turn subdivisions, headed by subprefects. The smallest administrative units are the districts,
managed by district heads. Some regions of the country have grown increasingly distanced
from the government, and politicians have requested greater decentralization of power and
even secession.
Côte d’Ivoire The Republic of Côte d’Ivoire (previously also Ivory Coast) is a presidential representative
democratic republic. The government exercises executive power while legislative power is
held by the government and parliament. Civil wars, the second of which ended in 2011, have
hindered the election process in the country, as well as having caused significant human
rights problems. The constitution of 1959 provides for a strong presidency within a separation
of powers framework. The president, who is elected by popular vote for a five-year term (last

363
elections held in 2000), selects members of the cabinet as well as the prime minister,
discusses and ratifies treaties, and submits bills to the National Assembly. This assembly
comprises 225 members – each elected for five years in constituencies of single seats – and
agrees on legislation typically introduced by the president. A single party is dominant in Côte
d’Ivoire, the Ivorian People’s Front. Some proposed changes include the extension of term to
seven years and the formation of a senate. Côte d’Ivoire holds a democracy index of 3.53,
ranked by the Economist Intelligence Unit as an authoritarian regime.
Legislative power is exerted onto the 58 departments of Côte d’Ivoire, each appointed a
prefect by the central government. These are split into 196 communes; each is headed by an
elected mayor, with the city of Abidjan, the economic capital, having ten mayors.
Equatorial Guinea Politics in the Republic of Equatorial Guinea take place within a presidential republic
framework, in which the president is head of both the state and government. Executive power
lies with the government, while legislative power is vested in both the government and the
Chamber of People’s Representatives. Since the country’s independence from Spain in 1968,
Equatorial Guinea has had two presidents. The latest is still in power – Teodoro Obiang
Nguema Mbasogo assumed presidency in 1979 after a coup d’état and the execution of
former president Francisco Macías Nguema, his uncle; he is elected to a seven-year term by
popular vote. Obiang receives significant powers from the 1982 constitution, including:
Calling of elections, dissolution of the Chamber of Representatives, choice of cabinet
members, appointing and control of the prime minister, treaty negotiation and ratification,
and decree of laws. One hundred members form the Chamber of People’s Representatives,
which are elected for five years in multi-member constituencies. Only one political party, the
Democratic Party of Equatorial Guinea, holds effective power. The country holds one of the
lowest democracy indices globally, 1.66, being characterized as an authoritarian regime.
The government administers the country through seven provinces, for which the president
appoints governors. For administration purposes, each province is split into districts and
municipalities.
Ghana
Like most countries in West Africa, the political system in the Republic of Ghana is described
as a presidential representative democratic republic, with the President of Ghana being head
of state and government and of a multi-party system. Executive power is exercised by the
government at Golden Jubilee House. Legislative power is conferred upon the government
and Parliament. Judiciary power acts independently of the executive and the legislature. The
Fourth Republic of Ghana was established with a constitution that provides a framework for a
republican democratic government, aiming at power sharing, and the prevention of coups,
dictatorial government and single-party systems. It declares Ghana a unitary republic and
intends for power to be shared between the president, a unicameral parliament, a state council
and an independent judiciary. The 275-member Parliament controls legislative functions and
agrees with the president on the formation of laws. Members are elected by simple majority
vote for four years in single-seat constituencies, in 275 electoral constituencies. Ghana has
two dominant political parties. The country holds one of the highest democracy indices in the
region, 6.33, termed a flawed democracy by the Economist Intelligence Unit.
The country is divided into ten administrative regions, split into six metropolitan assemblies:
55 municipal assemblies and 216 districts, each with a district assembly. Various types of

364
councils exist in lower levels, including 58 town or area councils, 108 zonal councils and 626
area councils. On the lowest level, 16,000 unit committees are present.
Guinea
The Republic of Guinea is a presidential representative democratic republic, where the
President is head of both the state and the government. The government exercises executive
power, while legislative power is exercised by the government and the National Assembly,
however the latter has not met since 2008 after its dissolution following the 2008 coup d’état.
The President, who governs the country with the council of 25 presidentially appointed
civilian ministers is typically elected for seven years by popular vote. Elections in Guinea
have been postponed multiple times, and in 2012, the President of Guinea postponed them
indefinitely, stating the need for them to be “transparent and democratic”. The political
system of the country has been ranked as an authoritarian regime, with a democracy index of
3.01.
Guinea is divided into seven regions (eight with the capital, Conakry, which is a special
zone), 33 prefectures, over 100 subprefectures, and many districts. The president appoints
officials for every level of a highly centralized administration, except for district-level
leaders, who are elected.
Liberia
The Republic of Liberia is a presidential representative democratic republic, with the
President being head of state and of government. Liberia’s political system is under an
ongoing transition from civil war and dictatorship to democracy. It has been modeled on that
of the United States with three branches of government, however unlike the US and much
like most countries of West Africa, Liberia is a unitary state with a multi-party system, rather
than a federation with a two-party system. The President of Liberia typically exerts the most
control on the country’s politics; the government exercises executive and legislative power,
while the Senate and the House of Representatives exert legislative power. The president is
elected for six years (renewable term) by popular vote, and appoints a cabinet, which is
confirmed by the Senate. The latter has 30 seats, with members serving nine-year terms and
elections taking place by popular vote. The House of Representatives has 64 seats (popular
vote and six-year terms). Liberia is ranked by the Economist Intelligence Unit as a hybrid
regime, with a democracy index of 4.95.
The town chief comprises the basic unit of Liberian local government. Also present are clan
chiefs, paramount chiefs, and district commissioners. The 15 counties of Liberia are governed
by presidentially appointed superintendents.
Nigeria
Nigeria is a federal republic whose political system is modeled, like Liberia, on that of the
United States, where the president, who is elected through universal suffrage, exercises
executive power. The governing structure of Nigeria has also been influenced by the
Westminster Parliamentary system. Nonetheless, the president comprises the head of
government, state and of a multi-party system. The Nigerian governmental framework is a
federal, presidential, representative democratic republic, where legislative power is vested on
the government and the two legislature chambers, namely, the House of Representatives (360
members; four-year terms) and the Senate (109 members; four-year terms). Together these
form the National Assembly, responsible for law making in the country. The Supreme Court
of Nigeria holds the highest judiciary power in Nigeria. The country practices the theory of

365
the separation of powers. The Nigerian legal system’s basis is on the rule of law, the
independence of the judiciary, and British common law. It is comparable to the English and
Welsh legal system. The legal framework for this system is provided by the Constitution of
Nigeria. Nigeria has a very low democracy index, 3.75, and is considered an authoritarian
regime.
Administratively, the country is split into 36 states and one territory, with each state divided
into Local Government Areas, of which 774 exist.
São Tomé and Príncipe Unlike other countries of the hotspot, the Democratic Republic of São Tomé and Príncipe is a
unitary semi-presidential representative democratic republic, in which the President is head of
state, while the Prime Minister is head of government, and of a multi-party system. The
government exercises executive power, whereas legislative power is held by both the
government and the National Assembly. The Judiciary is independent of both the executive
and the legislature. The president of the republic is elected by a majority popular vote and a
ballot for five-year terms (maximum two consecutive). The president appoints the prime
minister, who must be ratified by the majority party, and who in turn names 14 cabinet
members. The National Assembly has 55 members, elected for four years, and is the highest
state organ and legislative body.
For administration purposes, the country is divided into seven municipal districts. The
governing councils in these districts, which are reelected every five years, hold a limited
degree of autonomous power. Príncipe, comprising its own district, has been self-governed
since 1995.
Sierra Leone The governing authority of the Republic of Sierra Leone is established by the Sierra Leone
Constitution, which describes the country as a presidential representative democratic
republic, where the President is head of state and government, and of a multi-party system.
The government is split into the executive, legislative and judicial, the latter being
independent of the former two, whereby the president exercises executive power, while
legislative power is conferred on the Parliament. The President is elected by popular vote for
five years and names the Ministers of State, who are approved by the House of
Representatives of 124 members (112 elected for four-year terms, and 12 Paramount chiefs).
Civil rights are respected by the Sierra Leonean government. Sierra Leone is considered to be
a hybrid regime, holding a democracy index of 4.56.
The country is split into provinces, districts, and chiefdoms. There are three rural provinces,
in addition to the capital city administrative province. Fourteen districts exist: Twelve rural
and two for Freetown, the capital. Sierra Leone is further divided into 149 chiefdoms, which
comprise local governance as tribal and hereditary units.
Togo
The Togolese Republic is a presidential republic, with the president being head of both state
and government. Executive power is vested in the government, while legislative power is
conferred upon the government and parliament. Since independence from France in 1960, the
political system of the country has been dominated by the authoritarian party Rally for the
Togolese People, making Togo a one party dominant state. While opposition parties are not
forbidden, they are thought to be extremely unlikely to gain power. The President of Togo is

366
elected for a five-year term by popular vote, and names the prime minister, as well as the
Council of Ministers (on the prime minister’s advise). The National Assembly comprises 81
single-seat constituencies, members for which are elected for five years. The country’s
judiciary is modeled on the French system, comprising the Court of Appeal and Supreme
Court. The African Union considers the current president’s rise to power a military coup
d’état, while the political system of the country has been described as an authoritarian regime
by the Economist Intelligence Unit, giving it a democracy index of 3.45 out of 10.
Administratively, Togo is divided in five regions and 30 prefectures, each having an
appointed prefect.

367
Appendix 8: Details of the NBSAP Process in Each Hotspot Country The NBSAP for Benin was developed through a long consultative and iterative process and
was published in 2002. It provides a strategic roadmap for sustainable development over the
period from 2002 to the next five years, while the 2014 fifth national report evaluates
progress for the period of 2011 to 2020 (Republic of Benin 2002; 2014). The NBSAP lists the
following main goals:
Capacity development of structures and stakeholders in the management of biological
diversity;
Promotion of research;
Promotion of values and relevant endogenous know-how;
Valuation of genetic resources;
The development of cooperation at the national, regional and international level in
science, technology and biotechnology.
Cameroon published its first NBSAP in 1999, which was later revised in 2012 (NBSAP II). It
is the fruit of valuable contributions from key actors involved in the protection of the nation’s
biodiversity and national and international experts in biodiversity protection and acts within
the 2035 Cameroon’s national Vision for Development and its Growth and Employment
Strategy (Republic of Cameroon 1999; 2012). The NBSAP lists the following main strategic
objectives:
Increasing awareness on the value of biodiversity to ensure a change in human
behavior and attitudes that today favor biodiversity loss;
Strengthening efforts in mitigating or restoring degraded ecosystems and species to
redress the consequences of biodiversity loss;
Focus on human wellbeing for more proactive measures to generate wealth from
biodiversity and the services offered by the ecosystems;
Recognizing mainstreaming as the most appropriate approach to ensure the effective
appropriation of NBSAP II by key sectors and decentralized authorities.
The NBSAP for Côte d’Ivoire, published in 2002, was the result of evaluation, analysis and
consultation conducted during regional and national workshops for formulation and
validation that took place in 2000, 2001 and 2002, aimed at improved management by 2025
(Republic of Côte d’Ivoire 2002). It lists the following eight fundamental themes:
Conservation of biological diversity;
Use and enhancement of biodiversity;
Education and information;
Awareness and participation of the population;
Training and research for the integration of spiritual values and traditional knowledge in
the conservation of biological diversity;
Improvement of the legislative and institutional framework;
Fair and equitable sharing of benefits from the exploitation of biological resources;
Management of biotechnology and biosafety.
Equatorial Guinea published its NBSAP in 2005 (Republic of Equatorial Guinea 2005). It
lists, among other aspects, the following goals:
Concrete content and appropriate legal and practical development to constitutionally
guarantee the right to live in a sustainable environment to all persons;
Establishment of an institutional framework to promote at a national level the solution of

368
environmental problems that have been generated from a global approach;
Creation of tools for efficient environmental management that allows for adequate
protection of natural resources;
A general legal body that can serve as reference for any other sectoral environmental
legislation.
The NBSAP of the Republic of Ghana, published in 2002, proposes among others the
following actions (Republic of Ghana 2002):
Capacity building to ensure in-depth assessment of biological resources;
Promotion of community participation in sustainable management of biodiversity;
Strengthening of the management of forests and protected areas as well as other off-reserve
biological resources.
Guinea published an NBSAP in 2002, for which 13 national and regional experts were
consulted (Republic of Guinea 2002). It proposes the following main goals and objectives:
Conservation of terrestrial and aquatic ecosystems and their biodiversity;
Access to resources and equitable sharing of revenues from their exploitation;
Valuation of ecosystems and their biodiversity;
Strengthening the institutional and legal framework.
Liberia’s NBSAP was published in 2004 and focused on the 2010 target for reversing
biodiversity loss as called for by the Johannesburg Plan of Implementation. It comprises the
work of fully participatory national and international actors (Republic of Liberia 2004). The
country has since embarked on a medium-term economic growth and development strategy,
“The Agenda for Transformation”, in order to guide development activities over the years
2012 to 2017, publishing its Fifth National Report (Republic of Liberia 2014). The NBSAP
lists the following five goals, namely to:
Maintain ecosystems and ecological processes essential for the functioning of the
biosphere;
Ensure sound management of the natural resources and the environment;
Adequately protect humans, flora, fauna, and their biological communities and habitats
against harmful impacts, and preserve biological diversity;
Integrate environmental considerations in sectoral and socio-economic planning at all
levels throughout the nation;
Find common solutions to environmental problems at regional and international levels.
The Nigerian NBSAP was published in 2006, with the participation of various agencies of the
Federal and State governments, academia, non-governmental agencies and local communities
through national and regional level consultative workshops (Republic of Nigeria 2006). It
states four main objectives:
Expansion and improvement of the information base on the biodiversity of Nigeria;
Development and institutionalization of systems to monitor key elements of biodiversity;
Institutionalization of an environmental resource accounting system to monitor key
elements of biodiversity;
Establishment of local evaluation and assessment of forest resources.
The Democratic Republic of São Tomé and Príncipe published its NBSAP in 2005, following
a participatory and interactive process (Democratic Republic of São Tomé and Príncipe
2005). The NBSAP lists among others the following goals:

369
Strengthening of in situ and ex situ conservation;
Valuation of biodiversity;
Creation of mechanisms for access, and fair and equitable sharing of biological resources at
the national and international level;
Conservation of marine and coastal ecosystems, forest ecosystems and agro-ecosystems;
Strengthening of institutional and legal framework, working as a transverse theme.
The Sierra Leonean NBSAP was published in 2006 with a vision towards the reconstruction
and development of the country by the end of 2025 (Republic of Sierra Leone 2006). It is
intended to:
Provide a framework for setting priority policies and actions for the conservation and
sustainable use of biological diversity in Sierra Leone;
Catalyze and provide guidance for legal policy and institutional reforms necessary to
achieve effective conservation and sustainable use of biological diversity;
Enhance the planning and coordination of national efforts aimed at the conservation and
sustainable use of biological diversity;
Guide the investment and capacity building programs for the conservation and sustainable
use of biodiversity;
Facilitate information sharing and coordinated action among the various stakeholders at the
national level and foster scientific and technical cooperation with other countries and
international organization.
Togo published its NBSAP in 2007 through a process initiated by the Ministry of
Environment and Forest Resources and supported by national consultants and scientific and
steering committees. It proposes the following main goals:
Legal capacity building for conservation and sustainable use of biodiversity;
Capacity building of institutions and technical stakeholders;
Strengthening national capacity for characterization and monitoring of biological diversity;
Consolidation of conservation priority protected areas within the national system of
protected areas;
Increasing representation of Togolese Afromontane ecosystems within the national system
of protected areas;
Increasing representation of wetland ecosystems in Togo;
Development of conservation initiatives in rural and urban areas through a micro-reserve
network;
Sustainable management of natural forest and savanna formations allocated to production
targets and/or protection.

370
Appendix 9: Overview of Conservation Approaches Linked to Threats in the Guinean Forests of West Africa Hotspot Threats/drivers Examples of key actors Approaches for
mitigation Current/previous examples of approaches
Hunting for bushmeat/wildlife trade Overexploitation of fisheries
Communities and specific user groups – harvesting for own use/ consumption Communities – traders/ small enterprise Industry/ private sector/ national and multi-nationals (logging, offshore fisheries, oil) and knock-on effects (e.g. increased bushmeat demand around logging camps) Urban/ international markets and traders Artisanal fisheries Industrial fisheries including national and international trawler fleets e.g. from the European Union, Korea and Japan
Regional partnerships (to govern marine/wildlife resources)
- Canary Current Large Marine Ecosystem (CCLME) initiative
- Guinea Current Large Marine Ecosystem (GCLME) project
Creation/extension of protected areas
- WWF ‘s West African Marine Ecoregion program
Community-based natural resource management (CBNRM) (of areas and wildlife)
- Marine Protected Areas (MPA) co-management(Sierra Leone and Liberia) - Bushmeat hunting and trade in the Nimba Mountains project (Guinea)
- Community wildlife sanctuaries (e.g. Ghana) - Co-management of Pendjari Biosphere Reserve (Benin)
Alternative livelihoods
- Guinea Eco-Development Project (Guinea) - Conservation and Sustainable Use of the Ngoyla-Mintom Forest Project (Cameroon)
Research and policy/strategy development
- Addressing the Threat of the Bushmeat Trade to Wildlife in the Upper Guinea Forest (Ghana) - Rural Bushmeat and Public Opinion survey (Liberia)
Demand-side measures and awareness raising
- Awareness Campaign on the Bushmeat Crisis (Ghana) - Campaigns in China, Vietnam etc (Traffic, WildAID)
Unsustainable logging/timber trade Fuelwood collection Charcoal production
Communities and specific user groups – harvesting for own use/ consumption Urban/international markets and traders Chainsaw operators/ illegal and black market trade Some large-scale logging companies, e.g. inCameroon: GRUMCAM(a subsidiary of Italian owned ALPI), PALLISCO (a subsidiary of French PASQUET Group), CFCandCUF(bothCameroonian) Small-scale and large scale wood processing businesses
Sustainable forest management/RIL
- Wildlife Wood Project (Cameroon)
- FSC certification: 20 certificates (COC and FM) in Cameroon; 16 certificates (COV and FM) in Ghana; 1 certificate (COC) in Nigeria;
Forest Law Enforcement Governance and Trade (FLEG and FLEGT)
- Convergence Plan for the Sustainable Management and Conservation of Forest Ecosystems in West Africa (Draft) (ECOWAS) - FLEGT Voluntary Partnership Agreements (VPA) (VPAs being implemented with Cameroon, Ghana, Liberia; under negotiation with: Côte d’Ivoire)
Community forestry/participatory forest management
- Community forestry by-laws and Forest Management Committees (Nigeria) - County Forest Forums (Liberia)
Wood processing/industry sustainability
- Developing alternatives for illegal CSM (chain saw milling) through Multi- Stakeholder Dialogue (MSD) (Ghana) - Competitive value chains project (Cameroon)
Fuel wood/charcoal
- Efficient Fuel Wood Stoves for Nigeria (CDM project,)

371
Threats/drivers Examples of key actors Approaches for mitigation
Current/previous examples of approaches
sustainability - International Biochar initiative (e.g. Ghana) - International Network for Bamboo and Rattan (INBAR) bamboo charcoal (Ghana)
Agricultural expansion (including commercial plantations) Insecure land tenure/lack of investment in land
National and international companies: Rubber - Firestone, Liberia Agricultural Company, Guthrie, and Liberia Company Palm Oil - Presco Plc, Okomu Oil Palm Company Plc. (in Nigeria), Dekel Oil (in Côte d’Ivoire), Ghana Oil Palm Development Company Ltd., Twifo Oil Palm Plantations Ltd., Benso Oil Palm Plantations Ltd. (Ghana), SOCAPALM, SAFACAM, Swiss Farm, CDC and PAMOL (Cameroon) Affected communities/farmer organisations Government agencies responsible for land-use planning, agricultural investment, approvals Bilateral and multilateral partnerships/initiatives in the agricultural sector, e.g. RSPO, G8 New Alliance for Food Security and Nutrition
Landscape/regional approaches
- WWF Kudu-Zombo Programme, Campo Ma’an National Park (Cameroon) - Conservation of the Western Area Peninsula Forest Reserve (WAPFoR) and its Watersheds (Sierra Leone)
Improvement of PA management
- Strengthening the Conservation Role of Togo’s National System of Protected Areas - Protected Area Project for Comoe National Park (Côte d’Ivoire)
- Biodiversity and Protected Area Management Programme (BIOPAMA) (regional)
Establishment of conservation corridors and transboundary PAs
- Gola Peace Park/Across the River project (Sierra Leone, Liberia) - Sapo-Tai Forest Complex: Transboundary Conservation Area for Environmental Cooperation and Sustainable Development (Côte d’Ivoire, Liberia)
- Development of a trans-frontier conservation area linking forest reserves and protected areas in Ghana and Côte d’Ivoire
Sustainable agriculture and land management guidelines/certification
- Community-based Management of On-farm Plant Genetic Resources in Arid and Semi-Arid Areas of Sub-Saharan Africa - West Africa Fair Fruit (NGO providing support for smallholder and company capacity building, RSPO certification) - Unilever/Solidaridadsustainability initiative in West Africa (including hotspot subregions) - RSPO certified plantations include the Siat GroupandBenso OilPalmPlantation inGhana.Upper East Region Land Conservation and Smallholder Rehabilitation Project (LACOSREP) (Ghana) - Chinese Government issued voluntary guidelines for overseas investment (plantations); FAO plantation guidelines
Impacts from mining, oil and gas
International Oil producers - Shell, Total, Addax petroleum, ExxonMobil and Chevron Gold mining companies (Ghana) - Gold Fields
Transparency and reporting initiatives
- Liberia (EITI-compliant countries also include Cameroon, Côte d’Ivoire, Ghana, Nigeria and Togo)
- Publish What You Pay (affiliated coalitions in most countries in hotspot)

372
Threats/drivers Examples of key actors Approaches for mitigation
Current/previous examples of approaches
Limited, AngloGold Ashanti Ltd. And Golden Star Resources Ltd. Affected communities and CSOs working in sector Government agencies responsible for mining, oil and gas policy, planning and approvals
Sustainability certification
- Property Rights and Artisanal Diamond Development (PRADD) project
Ecosystem restoration
- Mangrove restoration in The Gulf of Guinea Large Marine Ecosystem project funded by Global Environmental Facility (GEF)
- Mangroves for the Future (MFF) (Sierra Leone) - Sustainable Livelihoods and Biodiversity Project to sustain and restore wetlands in the Niger Delta
Private sector partnerships / offsets
- Niger Delta Shell-Wetlands International wetlands programme (Nigeria) - AML/East Nimba Nature Reserve and Biodiversity Conservation Programme (Liberia)
Hydropower Unsustainable water resource management
Hydropower projects/developers
- Bui Hydropower Project (Ghana) - AkosomboDam (Lake Volta (Ghana)
- The Nangbéto Hydroelectric Dam (Togo) - Mabilla Hydropower project (Nigeria) Affected communities, CSOs working in the sector Government agencies responsible for hydropower/water reosurcesplanning and approvals Regional organisations: ECOWAS Permanent Forum for the Coordination and Monitoring of the Integrated Management of Water Resources in West Africa; river basin authorities
Integrated water resources management/ catchment management
- River Basin Committees (e.g. Volta Basin Authority, Lake Chad Basin Commission) - Senegal River Basin Water and Environmental Management Program
- Reversing Land and Water Degradation Trends in the Niger River Basin
Resource efficiency/sustainable consumption and production
- Hydropower Sustainability Assessment Protocol (Ghana)
Infrastructure development standards /safeguards
- ECOWAS draft guideline on water infrastructure
- Safeguard policies for infrastructure development/investment projects (eg IFC, World Bank, national ESIA requirements)
Economic corridors and infrastructure development
Infrastructure development companies Investors and loan provides, e.g. World Bank, African Development Bank, China Exim Bank Infrastructure promotion programs, e.g. PIDA Government agencies
Infrastructure development standards /safeguards
- Safeguard policies for infrastructure development/investment projects (eg IFC, World Bank, national ESIA requirements) - Chinese Government issued voluntary guidelines for overseas investment (general)

373
Threats/drivers Examples of key actors Approaches for mitigation
Current/previous examples of approaches
responsible for infrastructure development, investments, approvals (including EIAs)
Residential and commercial development - Coastal development - Urban/industrial expansion - Waste/pollution
Developers of coastal tourism; resorts Sand and gravel miners (for building materials) Rural-urban migrants Land-use/town planners Commercial developers
Integrated land-use planning / coastal zone management
There are no Integrated Coastal Zone Management Initiatives in a formal sense in the hotspot. However, there are several regional and international organizations that are working to build collaborative and interdisciplinary marine resource management in the region:
- The FAO in terms of fishing areas/data collection (CECAF is the West Africa region corresponding to FAO Fishing area 34). - The Regional Coastal and Marine Conservation Programme for West Africa (PRCM) which is a regional political/economic management body for West African coastal areas.
- The UNDP project “Adaptation to climate change: responding to shoreline change and its human dimensions in West Africa through integrated coastal area management”
Sustainable consumption and production
- West and Central Africa Subregional Workshop on Better Air Quality (BAQ), held on 20 -21 July (Policy Session) and 22 July 2009 (Ministerial Session) in Abidjan, Côte d’Ivoire.
Mangrove protection, restoration and afforestation
- Mangrove in West Africa Initiative (Guinea, Sierra Leone) - Building Mangrove Resilience to Climate Change – Douala-Edea, Ntem, and Rio del Rey Estuaries (Cameroon)
Waste treatment/disposal
- The ‘Integrated waste management in western Africa’ (IWWA) project (Ghana, CôteD’ivoire, Nigeria)
Climate change - Climate change offices/agencies (e.g. in charge of adaptation and mitigation planning)
- Land-use/town planners - REDD+/CDM project developers - Transport and energy sector
Renewable energy/energy efficiency /CDM
- SANIA fuel switching from natural gas to renewable biomass project (CDM, Côte d’Ivoire) - Efficient Fuel Wood Stoves for Nigeria (CDM)
REDD+/ forest carbon related/reforestation and afforestation
- Gola Rainforest REDD+ project (Sierra Leone)
- Nigeria/Cross River State REDD+ initiative (Nigeria Readiness Programme) - Greenpeace-TFT-Golden Agri-Resources Ltd collaboration on methodology to identify High Carbon Stock forest (Indonesia)
- National Council on

374
Threats/drivers Examples of key actors Approaches for mitigation
Current/previous examples of approaches
Shelterbelt and Afforestation/national afforestation programme (Nigeria)
Adaptation/resilience
- Adaptation to climate change in vulnerable coastal communities (SãoToméand Príncipe) - Building Mangrove Resilience to Climate Change – Douala-Edea, Ntem, and Rio del Rey Estuaries (Cameroon) - Protected Areas Resilient to Climate Change (PARCC) in West Africa (PARCC) (regional)
Invasive and other problematic species and genes, and diseases
- Agriculture and fisheries agencies - Vetinary/health agencies and research institutes - Forecasting initiatives for disease
Removal of invasive species
- Ministry in charge of Environment project to manage the water hyacinth and other invasive species (Cameroon) - Biological control of water hyacinth (Benin)
Disease prevention
- Ebola vaccine trial for wild chimpanzee conservation- New Iberia Research Center

375
Appendix 10: Additional Details on Climate-change-related Projects in the Hotspot
Active Climate Change Mitigation Projects in the Hotspot Countries
Country REDD+ Programmes Clean Development Mechanism (CDM) projects
Benin UN-REDD: Partner country since 2011. FCPF: None Other: None
None active; project idea listed on CDM Bazaar.
Cameroon UN-REDD: Partner country since 2011; National REDD
Steering Committee established; Regional GEF-REDD programme supporting communications strategy. FCPF: Readiness Preparation Proposal (RPP) to FCPF in
2012, finalised early 2013. Grant agreement in Nov. 2013 to support development of National REDD+ Strategy. Other:
REDD Desk notes ca. 20 REDD+ initiatives by a variety of actors, incl. COMIFAC, WWF, WCS.
Voluntary REDD+ Database (VRD) notes 28 arrangements and flows of $10.67m.
Two landfill gas projects registered.
Cote d’Ivoire
UN-REDD: Partner country since 2011. Receiving support for
the preparation of a National REDD+ Strategy. FCPF: Requested support in 2012. Recently accepted as
partner country. Other:
VRD notes 13 REDD+ arrangements, $4.73m in flows.
UK Forest Governance, Markets and Climate Programme (FGMC) also active.
Five registered projects including/: • 1 x landfill gas recovery and
flaring, • 1 x fuel switch, • 1 x waste-to-energy, • 1 x conversion to combined
cycle, • 1 x biomass-to-energy.
Equatorial Guinea
UN-REDD: Selected as a participant country but not agreed. FCPF: Submitted R-PIN in 2008. Not a partner/candidate
country. Other: None
Ghana UN-REDD: Partner country since 2011. National REDD+
Secretariat established. FCPF: R-PIN approved in July 2008 R-PP signed in August
2009. Readiness Grant in 2011, with launch of Ghana’s REDD+ Readiness programme in 2012. National REDD+ Strategy under development. Other:
VRD notes 16 REDD+ arrangements, $54.4m in flows.
Japanese Funded Forest Preservation Programme (FPP) Technology Transfer and Support for trend analysis of forest land change, forest resource map, biomass and C-Stock estimation and Capacity building ($7.8m).
IUCN private investment in restoration to advance REDD+
UK Forest Governance, Markets and Climate Programme (FGMC).
Two registered projects: • 1 x landfill gas utilization, • 1 x municipal waste
composting.
Guinea UN-REDD: None FCPF: None Other: None
Liberia UN-REDD: None FCPF: R-PP approved in March 2012 and preparation grant
signed in June 2012 to prepare elements of a National REDD+ Strategy ($0,2m). Other:
• RRI Tenure and Governance Reform for REDD+ project UK FG
Bilateral agreement with Norway (NOK 1 billion), Sept. 2014.

376
Country REDD+ Programmes Clean Development Mechanism (CDM) projects
Nigeria UN-REDD: Partner country since 2010, with a National
Programme, with focus on Cross River State. $4m approved for NP in 2011 for 2012-2014. Here pilot sites identified in CRS (Ekuri-Iko Esai-Okokori-Etara Eyeyeng-Owai Ukpon River Forest Reserve Mbe mountain-Afi River Project; new mangrove forest reserve. FCPF: Submitted interest to join in 2009. Recently accepted
as partner country. Other:
VRD lists 6 arrangements with $3m in national funding.
GCF support network for REDD+ project.
Other oganisations involved in pilot sites include NCRC/Katoomba Group, WCS
10 registered projects including: • 1 x gas utilisation, • 3 x gas recovery, • 1 x fuel substitution, • 1 x hydropower
rehabilitation, • 1 x municipal waste
composting, • 1 x landfill gas, • 1 x efficient fuelwood
stoves, • 1 x combined cycle.
São Tomé and Príncipe
UN-REDD: None FCPF: None Other: VRD notes 3 REDD arrangements with $0.11m in
flows.
Several CDM capacity building activities for CDM, for e.g.:
ACP-CD4CDM Project,
EC Programme for Capacity Building for MEAs in African, Caribbean and Pacific countries.
CDM hydropower project submitted for initial consideration in Aug 2012.
Sierra Leone
UN-REDD: None FCPF: In 2011 a private company presented Govt. of Sierra
Leone with a FCPF R-PP proposing licensing agreement for c. 488,000 ha to the company; no consultation was conducted and later revealed as a carbon scam. National process has since been revived with support from EC. Other:
‘Gola Rainforest REDD+ project’ being implemented by RSPB, MAFFS and the Conservation Society of Sierra Leone (CSSL), currently seeking CCB and VCS validation
Bumbuna Hydroelectric Environmental and Social Management Project developing REDD+ feasibility studies
Western Area Peninsula National Park developing a PDD for VCS.
GCCA ‘REDD+ Capacity Building in Sierra Leone’ project.
1 registered project: Makeni power project; Also first sugarcane-based power project for ethanol production to be registered in Africa.
Togo UN-REDD: None FCPF: R-PP revised in Nov 2013 and June 2014, after
expression of interest in joining in Jan 2013. Other: ITTO support on REDD+
Notes: ACP: African, Caribbean and Pacific countries; CCB: Climate, Community and Biodiversity Standards;
CRS: Cross River State (Nigeria); COMIFAC: Central African Forest Commission (Commission des Forêts
d’Afrique Centrale) ; EC: European Commission; GCCA: Global Climate Change Alliance; ITTO: International
Tropical Timber Organisation; MEA: Multilateral Environmental Agreement; NCRC: Nature Conservation
Research Centre; NP: National Programme; PDD: Project Design Document; R-PIN: Readiness Project Idea
Note; R-PP: Readiness Preparation Proposal; RRI: Rights and Resources Initiative; RSPB: Royal Society for
Protection of Birds; VCS: Verified Carbon Standard; VRD: Voluntary REDD Database; WCS: Wildlife
Conservation Society.

377
Active Climate Change Adaptation Projects in the Hotspot Countries
Country Examples of Climate Change Adaptation Projects in the Hotspot
Benin Emergency Urban Environment Project, DRR and floods in Cotonou Agglomeration, 2011-2015;
Lagoon ecosystems project in AF pipeline.
GCCA: DRR through gallery forest conservation.
Flood control and agricultural infrastructure resilience in Oueme Valley (AfDB, $7.2m)
Cameroon Flood Emergency Project in north Cameroon, 2013-2017 (World Bank, $108m).
Ghana Sustainable Land and Water Management Project, under Green Wall/SAWAP, 2010-2016 (GEF, $8.5m).
LEDS/Climate Compatible Development project, CDKN, 2011-2012.
Request to AF for funding for increasing resilience in Northern Ghana.
Guinea CCLME mangroves project.
World Bank/GEF projects Senegal River Basin Multi-Purpose Water Resources Development Project 2 and the Senegal River Basin Climate Change Resilience Development Project: include IWRM as well as water resources development, management of dams in context of improving climate resilience.
Nigeria Erosion and Watershed Management Project (under SAWAP/Green Wall), 2012-2020 (GEF)
São Tomé and Príncipe
Increase the adaptive capacity of vulnerable coastal communities, 2011-2016 (GEF).
GCCA support for reducing vulnerability.
UNDP/GEF project to promote sustainable and climate-resilient grid-based hydroelectric electricity in São Tomé and Príncipe
World Bank/GEF São Tomé - Adaptation to Climate Change project, which includes an early warning system, coastal protection works, and CBA-EBA measures
Sierra Leone
National Sea-Level Observing System has been established.
Climate change resilience in WATSAN sector (AfDB, $4m)
PARCC participating country
CCLME mangroves project.
Togo Integrated Disaster and Land Management Project (under SAWAP/Green Wall), 2013-2016 (GEF, $17.3m?);
PARCC participating country
Notes: AfDB African Development Bank; CBACommunity-based adaptation; CDKNClimate and Development
Knowledge Network; DRRDisaster risk reduction; EBAEcosystem-based adaptation; GEFGlobal Environment
Facility; GCCAGlobal Climate Change Alliance; IWRMIntegrated Water Resources Management; LEDSLow-
emission Development Strategy; PARCC Protected Areas Resilient to Climate Change; SAWAP Sahel and
West Africa Program; UNDP United Nations Development Programme; WATSAN Water and Sanitation

378
Examples of Local and Regional Civil Society Organizations Operating in the Hotspot
Level Key actors Description Links to biodiversity Link/ref Language
Ghana Hatof Foundation
Promotes Biodiversity Conservation and Integrated Coastal Zone Management-ICZM, climate change (policy, legal, mitigation and adaptation activities), sustainable land management, and technology based solutions to problems facing local communities in Ghana. Established in 1999. Accreditation from the United Nations Framework Convention on Climate (for what?); currently the Focal Point for West Africa Global Environment Facility (GEF) NGO Network and is the host secretariat for Climate Action Network (CAN) Ghana. “The approach is to develop projects with community groups – especially the youth and women – to meet their development challenges, and to enhance community‐based adaptation to climate change and other environmental
issues” (Project Coordinator). Hatof is engaged in restoring some mangrove areas along the coast, encouraging the use of renewable energy, planting of sunflower crops for use in bio fuel production, tree‐planting initiatives, and collaborating with government agencies and other NGOs.
Yes; works on biodiversity conservation.
http://www.hatof.org/ Ang
Ghana Green Earth Organization (GEO)
Began in 1989. The mission of the organization is to ensure the conservation, preservation, protection and restoration of natural resources on earth. Engaged in issues associated with forests, biodiversity, CC, water resources, women’s empowerment, etc. It has been instrumental in the formation of over 175 Green Earth Clubs in primary secondary and tertiary institutions in Ghana.
Works in biodiversity relevant themes/areas.
http://www.greenactorswestafrica.org/organisations/geo/
Ang
Nigeria All Farmers Association of Nigeria (AFAN)
National Platform for farmers in Nigeria; network of affiliates based on commodity associations. Mission: “To enhance the skills of farmers and other related stakeholders through modern technology and agribusiness approach focused on wealth and job creation.” Considered a potential platform/channel for engaging farmers in CC activities.
Limited. http://allfarmersassociationofnig.gnbo.com.ng/ http://afanplaza.com/
Ang
Nigeria Nigerian Conservation Foundation (NCF)
Mission to preserve the full range of Nigeria’s biodiversity which includes species, ecosystems and genetic biodiversity; promote the sustainable use of natural resources for the benefit of present and future generations; and advocate actions that minimise pollution and wasteful utilisation of renewable resources. Member of IUCN and working with major international environmental NGOs e.g. WWF, Birdlife, etc. Numerous biodiversity/forest projects, with field offices. Has a CC programme, with a CC strategy (2009); plans to engage in awareness raising, mitigation, adaptation, climate finance, policy advocacy. NCF has had input in fora to develop the REDD strategy for Nigeria. No current CC projects but active in Cross River State
Yes; works on biodiversity conservation.
http://ncfnigeria.org/ Ang

379
Level Key actors Description Links to biodiversity Link/ref Language
Nigeria Pro-Natura International (PNI)
PNI has experience in implementing projects on sustainable community development with environmental protection particularly in various locations in the Niger Delta. They are developing a REDD pilot project for a new protected area in Ogun, Ondo and Osun States. PNI and NCF began working with the state governments on a project to establish a new protected area consisting of the remaining 40% of natural forest (about 100,000 ha) found in the reserves. The project hopes to establish a REDD pilot to market the carbon credits from the regenerating forests in order to provide sustainable finance for the protection of these forests and the livelihoods of the people that depend on them in perpetuity.
Works in biodiversity relevant themes/areas.
Nigeria REDD Assessment, 2010; http://www.fundsforngos.org/all-listings/pro-natura-international-nigeria/
Ang
Nigeria NigeriaCAN (Climate Action Network)
A coalition (public and private sectors, CSOs, international development organisations and individuals in Nigeria working to promote government and individual actions to combat climate change. Members work to achieve this goal through the coordination of information exchange and civil society strategy on national and international issues. Coalition’s activities are organised around three focus groups: a) Climate Change Policy and Institutional Change Group, b) Climate Change Information Access Group and c) Climate Change International Participation Group. NigeriaCAN seeks to create arenas where stakeholders in civil society can engage with private sector and decision-makers at both National Assembly and the Executive around the process of climate change institution-building.
Limited; focus is on CC.
http://nigeriacan.org/web/index.php
Ang
Liberia Action Against Climate Change (AACC)
Established in 2009, aims “To protect our environment, natural resources management and benefit sharing given its flagrant abuse by many, and the damaging effects on the future of our people thereby helping to forestall the country’s propelling climate change, miss-management of the natural resources and environmental degradation.” Strong media use, with radio shows, TV, blog, Facebook page etc., school awareness programs.
~ http://aaccliberia.blogspot.co.uk/
Ang
Nigeria African Radio Drama Association
Climate Change Adaptation in Northern Nigeria - collaborative project, headed by ARDA, aims to improve the capacity of smallholder farmers in Northern Nigeria to the effects of climate change. With sponsorship from IDRC Canada, and ARDA’s joint organization with Farm Radio International (FRI), Women Farmers Action Network (WOFAN), and the University of Guelph, a 26 episode radio drama will air in 5 provinces in Northern Nigeria.
~ Nigeria REDD Assessment, 2010
Ang

380
Level Key actors Description Links to biodiversity Link/ref Language
Togo Les Compagnons Ruraux
NGO de conservation de la biodiversité, de lutte contre la désertification et de promotion du Tourisme Durable; Contribuer à la pérennisation des programmes de conservation de la biodiversité et de lutte contre la désertification des Associations de protection de l’environnement; Œuvrer pour une meilleure prise en compte des problèmes de désertification au Togo.
Works in biodiversity relevant themes/areas.
http://www.greenactorswestafrica.org/organisations/les-compagnons-ruraux/; http://www.lcr.tg/index.shtml
Fr
Regional/ Nigeria
International Centre for Energy, Environment and Development (ICEED)
Provider of expertise in energy access policy reform, renewable energy technical assistance and climate change and clean energy financing. ICEED provides policy research, policy development support, programme design, project management, capacity building, monitoring and evaluation and advocacy to a wide range of Nigerian and international organisations. Involved in energy efficient wood stoves project; has CC programme with no. of activities, including work on CDM, building of the Nigeria Climate Action Network coalition, development of CC related agricultural insurance scheme, developing indicators for measuring energy sector vulnerability to climate change, providing policy advice.
Indirect. E.g. wood stoves project.
http://www.iceednigeria.org/
Ang
Regional AGRHYMET Interstate public institute with a legal status and financial autonomy, based in Niamey, Niger. UGF members: Benin, Cote d’Ivoire, Guinea, Togo. Its main objectives are contribution to achieving food security and increased agricultural production in the CILSS member States and improvement of NRM in the Sahelian region. Involved in several CC projects, e.g. disseminating agro-meteorological information to reduce vulnerability to current climate variability; provide seasonal forecasts and information on current climate variability to farmers.
Limited. Biodiversity not part of mission/goals/activities, but data may be relevant.
http://www.agrhymet.ne/
Ang/Fr
Regional Green Actors of West Africa (GAWA)
Group of environmental organisations across the region with a goal to develop ways of enhancing cooperation and coordination between and among the various donors and environmental actors in the subregion. Covers UGF countries: Benin, Cote d’Ivoire, Ghana, Guinea, Liberia, Nigeria, Sierra Leone, Togo. Core issues: 1.Forests; 2.Marine and Coastal Resources; 3.Mining; 4.Renewable Energy; 5.Waste Management / Pollution; 6.Water Resources and River Basins.
Works in biodiversity relevant themes/areas.
http://www.greenactorswestafrica.org/
Ang/Fr
Regional L’Observatoire du Sahara et du Sahel (OSS)
Based in Tunisia; to improve early warning and monitoring systems for agriculture, food security and drought in Africa, covering arid, semi-arid and subhumid areas of the Sahara and Sahel. Early warning and monitoring systems for agriculture, food security and drought. Provides member countries and organisations with a forum where they can share experiences and harmonise the ways in which data is collected and processed to feed into decision support tools. Initiator and facilitator of partnerships around common challenges related to shared water resources and implementation of MEAS, including those on desertification, biodiversity and climate change climate. UGF members: Cote d’Ivoire.
Limited. Biodiversity not part of mission/goals/activities, but data may be relevant. Limited coverage of UGF region.
http://www.oss-online.org/
Fr

381
Level Key actors Description Links to biodiversity Link/ref Language
Regional Volta Basin Authority
The 1st Assembly of the Heads of State of the riparian countries of the Volta Basin held on 19 January 2007, signed a Convention for the establishment of the Volta Basin Authority (VBA). Member states: Benin, Burkina Faso, Cote d’Ivoire, Ghana, Mali, Togo. The mandate of the VBA is to: Promote permanent consultation tools among the parties for the development of the basin; Promote the implementation of integrated water resources management and the equitable distribution of the benefits resulting from their various utilizations; Authorize the development of infrastructure and projects planned by the stakeholders and which could have substantial impact on the water resources of the basin; Develop joint projects and works; Contribute to poverty alleviation, the sustainable development of the Parties in the Volta basin, and for better socioeconomic integration in the subregion. Has range of IWRM/sustainable development projects, including an arm of Challenge Program on Water and Food (CPWF), plus observatory.
Not explicit, but relevant; access to data on river basin?
http://www.abv-volta.org:10000/abv2/
Ang/Fr
Regional IPACC - Indigenous Peoples of Africa Coordinating Committee
Network of 150 indigenous peoples organisations in 20 African countries. IPACC is accredited with the UN Economic and Social Council, the UN Environment Programme, the Global Environment Facility, UNESCO and the African Commission on Human and Peoples’ Rights. It has regional representatives; for West Africa (2012-2014): Sada ALBACHIR, Tuareg, Niger. Carries out training and awareness raising on CC and adaptation, and is active at UN conferences, e.g. facilitated global indigenous dialogue on climate adaptation at COP18
Indirect, eg participation in forums, events, statements on international policy.
http://www.ipacc.org.za/eng/default.asp
All
Regional NGO Climate and Development Network
Made up of 70 NGOs from Francophone countries in Europe and Africa, including some from UGF countries: Benin, Cameroon, Cote d’Ivoire, Guinea, Togo. Conducts advocacy, awareness, capacity building for NGOs from South and North on issues related to negotiations within UNFCCC, integration of CC into development plans.
Some; works mainly on CC but links to other conventions support.
http://ressourcesclimatdeveloppement.jimdo.com/
Ang/Fr

382
Appendix 11: Medium- and Full-sized GEF Projects within the Hotspot
Country Project/Programme Title Location Total
Project Cost (USD)
Total GEF Grant (USD)
Additional Donor(s) Start Date
End Date
Benin SPWA - Incorporation of Sacred Forests into the Protected Areas System of Benin
6,500,000 5,380,000 UNDP; Local governments
2010 2014
Benin Forests and Adjacent Lands Management Project
6,000,000 6,000,000
World Bank /International Development Association
2011 2013
Benin AF-Forest and Adjacent Land MGMT (PSG)
3,560,000 3,560,000
World Bank /International Development Association
2013 2016
Benin Community-Based Coastal and Marine Biodiversity Management Project
Coastal and Marine Area
4,300,000 4,300,000
World Bank /International Development Association
2011 2014
Benin Support to the Protected Areas Management Project
2,300,000 1,900,000
World Bank /International Development
Association; German government (KFW)
2011 2016
Cameroon Cameroon Forest and Environment Sector Program (FESP)
10,000,000 10,000,000 2006 2011
Cameroon Sustainable Agro-Pastoral and Land Management Promotion under the PNDP
6,000,000 6,000,000 2006 2012
Côte d’Ivoire
Ivory Coast Protected Area Project Comoe National Park
2,540,000 2,540,000 2009 2014
Côte d’Ivoire
Protected Areas Management Project (PCGAP)
Various PAs 12,340,596 11,624,000
G; German government( KFW/GTZ);
EU; UNESCO; NGOs
2009 2012
Equatorial Guinea
CBSP - Sustainable forest management in Equatorial Guinea for the conservation of representative ecosystems and globally significant biodiversity
Three pilot sites (2 at Rio Muni and 1 in Bioko Island)
7,195,000 4,745,000 UNDP; EU;
Conservation International; G
2010 2013

383
Country Project/Programme Title Location Total
Project Cost (USD)
Total GEF Grant (USD)
Additional Donor(s) Start Date
End Date
Ghana Ghana - West Africa Regional Fisheries Program
Coastal and marine
3,500,000 3,500,000
World Bank /International Development Association
2011 2017
Guinea Community-Based Land Management Project
(selected subcatchments)
14,500,000 9,500,000
International Fund for Agricultural
Development; LC; World Bank
/International Development Association; G
2006 2014
Guinea Coastal Marine and Biodiversity Management
Guinean coastal priority sites
11,830,000 6,630,000
International Fund for Agricultural
Development , OTH; LC; International
Development Association; G
2006 2013
Liberia Expansion of Protected Areas Network - II Nation-wide 2,000,000 1,000,000 G 2011 2015
Liberia Establishment of Protected Areas Network 7,280,000 750,000 GEF+WBFP; NGO/B 2008 2012
Nigeria SPWA-Niger Delta Biodiversity Project Niger Delta 4,610,000 4,610,000 UNDP/TRAC 2011 2015
Nigeria Nigeria Erosion and Watershed Management Project
8,592,593 8,590,000
World Bank /International Development Association
2012 2020
Sierra Leone
Wetlands Conservation Project Wetland areas in Sierra Leone
1,800,000 1,800,000 2011 2015
Sierra Leone
SL-GEF Biodiversity Conservation Project
Selected priority biodiversity conservation sites (CSs)
21,800,000 20,800,000
International Development
Association; B; Foreign M; G
2010 2015

384
Country Project/Programme Title Location Total
Project Cost (USD)
Total GEF Grant (USD)
Additional Donor(s) Start Date
End Date
São Tomé and Príncipe
São Tomé - Adaptation to Climate Change
les districts de Caué, Cantagalo, Me-Zochi, Lemba, Lobata et la Région Autonome de Príncipe
4,150,000 4,150,000 2013 2018
Togo Renforcement de capacités pour la gestion de l’environnement (PRCGE)
Nationwide 1,000,000 1,000,000 World Band; Europenan
Commission 2010 2013
Togo SPWA - Strengthening the conservation role of Togo’s national System of Protected Areas (PA)
4,369,727 1,272,727 UEMOA;
UNDP/TRAC; G 2011 2015
Regional Evolution of PA Systems with Regard to Climate Change ing West Africa Region (under SPWA-BD Programme)
Sierra Leone and Togo (within hotspot)
13,636,364 3,636,364
Regional Integrated Development for Increased Rural Climate Resilience in the Niger Basin
Benin, Cameroon, Côte d’Ivoire, Guinea, Nigeria (within hotspot)
73,014,800 12,014,800
Note: Only projects that can be linked to biodiversity conservation within the hotspot have been included.

385
Appendix 12: Expected Contributions of the CEPF Investment Portfolio in the Hotspot to the Sustainable Development Goals and the Aichi Targets
Objective / Outcome Targets / Indicators Relevant Sustainable Development Goals Relevant Aichi Targets
Objective
Engage civil society in the conservation of globally threatened biodiversity through targeted investments with maximum impact on the highest conservation priorities.
At least 60 local communities are empowered to engage in the sustainable management of priority sites and/or consolidate ecological connectivity at the landscape scale.
Goal 16
Promote peaceful and inclusive societies for sustainable development, provide access to justice for all and build effective, accountable and inclusive institutions at all levels
Target 18
By 2020, the traditional knowledge, innovations and practices of indigenous and local communities relevant for the conservation and sustainable use of biodiversity, and their customary use of biological resources, are respected, subject to national legislation and relevant international obligations, and fully integrated and reflected in the implementation of the Convention with the full and effective participation of indigenous and local communities, at all relevant levels
At least 20 Key Biodiversity Areas targeted by CEPF grants have new or strengthened protection and management.
Goal 15
Protect, restore and promote sustainable use of terrestrial ecosystems, sustainably manage forests, combat desertification, and halt and reverse land degradation and biodiversity loss
Target 11
By 2020, at least 17 per cent of terrestrial and inland water, and 10 per cent of coastal and marine areas, especially areas of particular importance for biodiversity and ecosystem services, are conserved through effectively and equitably managed, ecologically representative and well-connected systems of protected areas and other effective area-based conservation measures, and integrated into the wider landscapes and seascapes
At least 100,000 hectares within production landscapes are managed for biodiversity conservation or sustainable use.
Goal 12
Ensure sustainable consumption and production patterns
Target 7
By 2020 areas under agriculture, aquaculture and forestry are managed sustainably, ensuring conservation of biodiversity

386
Objective / Outcome Targets / Indicators Relevant Sustainable Development Goals Relevant Aichi Targets
Public policies and/or private sector business practices in at least 6 conservation corridors incorporate provisions for biodiversity conservation.
Goal 12
Ensure sustainable consumption and production patterns
Target 3
By 2020, at the latest, incentives, including subsidies, harmful to biodiversity are eliminated, phased out or reformed in order to minimize or avoid negative impacts, and positive incentives for the conservation and sustainable use of biodiversity are developed and applied, consistent and in harmony with the Convention and other relevant international obligations, taking into account national socio economic conditions
Populations of at least 30 globally threatened species targeted by CEPF grants are stable or increasing.
Goal 15
Protect, restore and promote sustainable use of terrestrial ecosystems, sustainably manage forests, combat desertification, and halt and reverse land degradation and biodiversity loss
Target 12
By 2020 the extinction of known threatened species has been prevented and their conservation status, particularly of those most in decline, has been improved and sustained
At least 15 networks are formed among civil society, government and private sector actors to facilitate capacity building, avoid duplication of effort and maximize impact.
Goal 16
Promote peaceful and inclusive societies for sustainable development, provide access to justice for all and build effective, accountable and inclusive institutions at all levels
Target 18
By 2020, the traditional knowledge, innovations and practices of indigenous and local communities relevant for the conservation and sustainable use of biodiversity, and their customary use of biological resources, are respected, subject to national legislation and relevant international obligations, and fully integrated and reflected in the implementation of the Convention with the full and effective participation of indigenous and local communities, at all relevant levels

387
Objective / Outcome Targets / Indicators Relevant Sustainable Development Goals Relevant Aichi Targets
At least 50 civil society organizations, including at least 10 Indigenous People’s, women’s and/or youth groups, demonstrate improvements in organizational capacity.
Goal 5
Achieve gender equality and empower all women and girls
Goal 16
Promote peaceful and inclusive societies for sustainable development, provide access to justice for all and build effective, accountable and inclusive institutions at all levels
Target 18
By 2020, the traditional knowledge, innovations and practices of indigenous and local communities relevant for the conservation and sustainable use of biodiversity, and their customary use of biological resources, are respected, subject to national legislation and relevant international obligations, and fully integrated and reflected in the implementation of the Convention with the full and effective participation of indigenous and local communities, at all relevant levels
Investment strategies of at least 2 other donors active in the Guinean Forests incorporate geographic and/or thematic priorities from the ecosystem profile.
Goal 17
Revitalize the global partnership for sustainable development
Target 20
By 2020, at the latest, the mobilization of financial resources for effectively implementing the Strategic Plan for Biodiversity 2011-2020 from all sources, and in accordance with the consolidated and agreed process in the Strategy for Resource Mobilization, should increase substantially from the current levels. This target will be subject to changes contingent to resource needs assessments to be developed and reported by Parties

388
Objective / Outcome Targets / Indicators Relevant Sustainable Development Goals Relevant Aichi Targets
Outcome 1
Local communities are empowered to engage in sustainable management of 40 priority sites and consolidate ecological connectivity at the landscape scale.
At least 15 local land-use plans elaborated and implemented to facilitate good governance in the management of community and private reserves and concessions.
Goal 2
End hunger, achieve food security and improved nutrition and promote sustainable agriculture
Target 14
By 2020, ecosystems that provide essential services, including services related to water, and contribute to health, livelihoods and well-being, are restored and safeguarded, taking into account the needs of women, indigenous and local communities, and the poor and vulnerable
At least 10 local and indigenous communities are trained to initiate and advocate for land tenure and forestry reforms in relation to management of community and private reserves and concessions.
Goal 4
Ensure inclusive and equitable quality education and promote lifelong learning opportunities for all
Target 5
By 2020, the rate of loss of all natural habitats, including forests, is at least halved and where feasible brought close to zero, and degradation and fragmentation is significantly reduced
At least 10 participatory management plans that support stakeholder collaboration in Protected Area management are prepared and implemented.
Goal 16
Promote peaceful and inclusive societies for sustainable development, provide access to justice for all and build effective, accountable and inclusive institutions at all levels
Target 11
By 2020, at least 17 per cent of terrestrial and inland water, and 10 per cent of coastal and marine areas, especially areas of particular importance for biodiversity and ecosystem services, are conserved through effectively and equitably managed, ecologically representative and well-connected systems of protected areas and other effective area-based conservation measures, and integrated into the wider landscapes and seascapes
At least 30 local communities targeted by sustainable livelihood/job creation activities or benefit-sharing mechanisms show tangible wellbeing benefits.
Goal 1
End poverty in all its forms everywhere
Goal 8
Promote sustained, inclusive and sustainable economic growth, full and productive employment and decent work for all
Target 16
By 2015, the Nagoya Protocol on Access to Genetic Resources and the Fair and Equitable Sharing of Benefits Arising from their Utilization is in force and operational, consistent with national legislation

389
Objective / Outcome Targets / Indicators Relevant Sustainable Development Goals Relevant Aichi Targets
Outcome 2
Biodiversity conservation mainstreamed into public policy and private sector practice in the nine conservation corridors, at local, sub-national and national levels.
At least 5 conservation-related policies of national governments are informed or influenced by research, analysis and outreach supported by CEPF grants.
Goal 9
Build resilient infrastructure, promote sustainable industrialization and foster innovation
Goal 13
Take urgent action to combat climate change and its impacts
Target 3
By 2020, at the latest, incentives, including subsidies, harmful to biodiversity are eliminated, phased out or reformed in order to minimize or avoid negative impacts, and positive incentives for the conservation and sustainable use of biodiversity are developed and applied, consistent and in harmony with the Convention and other relevant international obligations, taking into account national socio economic conditions
Locally-relevant information on natural ecosystems is generated for at least 20 key biodiversity areas and used to influence political and economic decision-making in favor of their conservation
Goal 15
Protect, restore and promote sustainable use of terrestrial ecosystems, sustainably manage forests, combat desertification, and halt and reverse land degradation and biodiversity loss
Target 2
By 2020, at the latest, biodiversity values have been integrated into national and local development and poverty reduction strategies and planning processes and are being incorporated into national accounting, as appropriate, and reporting systems
At least 20 partnerships are formed or strengthened among civil society, government, private sector and communities to promote best practices in mining, sustainable forestry and agriculture by private companies.
Goal 12
Ensure sustainable consumption and production patterns
Goal 17
Revitalize the global partnership for sustainable development
Target 4
By 2020, at the latest, Governments, business and stakeholders at all levels have taken steps to achieve or have implemented plans for sustainable production and consumption and have kept the impacts of use of natural resources well within safe ecological limits
At least 5 private companies adopt new management practices consistent with biodiversity conservation at operations in the conservation corridors.
Goal 9
Build resilient infrastructure, promote sustainable industrialization and foster innovation
Goal 12
Ensure sustainable consumption and production patterns
Target 7
By 2020 areas under agriculture, aquaculture and forestry are managed sustainably, ensuring conservation of biodiversity

390
Objective / Outcome Targets / Indicators Relevant Sustainable Development Goals Relevant Aichi Targets
Outcome 3
Priority globally threatened species are safeguarded by identifying and addressing major threats and information gaps.
Priority actions identified in Conservation Action Plans are implemented for at least 15 Critically Endangered and Endangered species.
Goal 15
Protect, restore and promote sustainable use of terrestrial ecosystems, sustainably manage forests, combat desertification, and halt and reverse land degradation and biodiversity loss
Target 12
By 2020 the extinction of known threatened species has been prevented and their conservation status, particularly of those most in decline, has been improved and sustained
The inventory of Key Biodiversity Areas in the hotspot is updated to fill critical information gaps, particularly with regard to the Lower Guinean Forests subregion, and freshwater ecosystems.
Goal 15
Protect, restore and promote sustainable use of terrestrial ecosystems, sustainably manage forests, combat desertification, and halt and reverse land degradation and biodiversity loss
Target 19
By 2020, knowledge, the science base and technologies relating to biodiversity, its values, functioning, status and trends, and the consequences of its loss, are improved, widely shared and transferred, and applied
The global conservation status of at least 100 species from poorly assessed taxonomic groups is updated or assessed for the first time on the IUCN Red List.
Goal 15
Protect, restore and promote sustainable use of terrestrial ecosystems, sustainably manage forests, combat desertification, and halt and reverse land degradation and biodiversity loss
Target 19
By 2020, knowledge, the science base and technologies relating to biodiversity, its values, functioning, status and trends, and the consequences of its loss, are improved, widely shared and transferred, and applied

391
Objective / Outcome Targets / Indicators Relevant Sustainable Development Goals Relevant Aichi Targets
Outcome 4
Capacity of local civil society organizations, including Indigenous People’s, women’s and youth groups built to conserve and manage globally important biodiversity.
At least 50 local civil society organizations, including at least 10 Indigenous People’s organizations, demonstrate strengthened capacity with regard to financial, institutional and project management, organizational governance, and fundraising.
Goal 4
Ensure inclusive and equitable quality education and promote lifelong learning opportunities for all
Goal 16
Promote peaceful and inclusive societies for sustainable development, provide access to justice for all and build effective, accountable and inclusive institutions at all levels
Target 18
By 2020, the traditional knowledge, innovations and practices of indigenous and local communities relevant for the conservation and sustainable use of biodiversity, and their customary use of biological resources, are respected, subject to national legislation and relevant international obligations, and fully integrated and reflected in the implementation of the Convention with the full and effective participation of indigenous and local communities, at all relevant levels
At least 20 women-led conservation and development organizations, associations and networks are established and strengthened to foster gender equality in natural resource management and benefit sharing.
Goal 5
Achieve gender equality and empower all women and girls
Goal 16
Promote peaceful and inclusive societies for sustainable development, provide access to justice for all and build effective, accountable and inclusive institutions at all levels
Target 18
By 2020, the traditional knowledge, innovations and practices of indigenous and local communities relevant for the conservation and sustainable use of biodiversity, and their customary use of biological resources, are respected, subject to national legislation and relevant international obligations, and fully integrated and reflected in the implementation of the Convention with the full and effective participation of indigenous and local communities, at all relevant levels
At least 20 local civil society organizations demonstrate increased communication capacity in ways that support the delivery of their mission.
Goal 16
Promote peaceful and inclusive societies for sustainable development, provide access to justice for all and build effective, accountable and inclusive institutions at all levels
Target 1
By 2020, at the latest, people are aware of the values of biodiversity and the steps they can take to conserve and use it sustainably

392
Objective / Outcome Targets / Indicators Relevant Sustainable Development Goals Relevant Aichi Targets
Outcome 5
A Regional Implementation Team provides strategic leadership and effective coordination of CEPF conservation investment in the Guinean Forests Hotspot.
At least 60 civil society organizations, including at least 30 local and indigenous NGOs actively participate in conservation actions guided by the ecosystems profile.
Goal 16
Promote peaceful and inclusive societies for sustainable development, provide access to justice for all and build effective, accountable and inclusive institutions at all levels
Target 18
By 2020, the traditional knowledge, innovations and practices of indigenous and local communities relevant for the conservation and sustainable use of biodiversity, and their customary use of biological resources, are respected, subject to national legislation and relevant international obligations, and fully integrated and reflected in the implementation of the Convention with the full and effective participation of indigenous and local communities, at all relevant levels.
At least 85 percent of local NGOs receiving grants demonstrate more effective capacity to design and implement conservation actions.
Goal 16
Promote peaceful and inclusive societies for sustainable development, provide access to justice for all and build effective, accountable and inclusive institutions at all levels
Target 18
By 2020, the traditional knowledge, innovations and practices of indigenous and local communities relevant for the conservation and sustainable use of biodiversity, and their customary use of biological resources, are respected, subject to national legislation and relevant international obligations, and fully integrated and reflected in the implementation of the Convention with the full and effective participation of indigenous and local communities, at all relevant levels
At least 5 civil society organizations supported by CEPF secure follow-up funding to promote the sustainability of their CEPF grants.
Goal 16
Promote peaceful and inclusive societies for sustainable development, provide access to justice for all and build effective, accountable and inclusive institutions at all levels
Target 18
By 2020, the traditional knowledge, innovations and practices of indigenous and local communities relevant for the conservation and sustainable use of biodiversity, and their customary use of biological resources, are respected, subject to national legislation and relevant international obligations, and fully integrated and reflected in the implementation of the Convention with the full and effective participation of indigenous and local communities, at all relevant levels

393
Objective / Outcome Targets / Indicators Relevant Sustainable Development Goals Relevant Aichi Targets
At least $1 million in additional funding is leveraged from other donors towards the priorities set in the ecosystem profile.
Goal 17
Revitalize the global partnership for sustainable development
Target 20
By 2020, at the latest, the mobilization of financial resources for effectively implementing the Strategic Plan for Biodiversity 2011-2020 from all sources, and in accordance with the consolidated and agreed process in the Strategy for Resource Mobilization, should increase substantially from the current levels. This target will be subject to changes contingent to resource needs assessments to be developed and reported by Parties
At least 2 participatory assessments are undertaken and documented.


