HAL Id: tel-00553893 https://tel.archives-ouvertes.fr/tel-00553893 Submitted on 10 Jan 2011 HAL is a multi-disciplinary open access archive for the deposit and dissemination of sci- entific research documents, whether they are pub- lished or not. The documents may come from teaching and research institutions in France or abroad, or from public or private research centers. L’archive ouverte pluridisciplinaire HAL, est destinée au dépôt et à la diffusion de documents scientifiques de niveau recherche, publiés ou non, émanant des établissements d’enseignement et de recherche français ou étrangers, des laboratoires publics ou privés. Ecosystème fromager : de l’étude du métabolisme du soufre chez Kluyveromyces lactis et Yarrowia lipolytica à l’interaction entre Kluyveromyces lactis et Brevibacterium aurantiacum Agnès Hébert To cite this version: Agnès Hébert. Ecosystème fromager : de l’étude du métabolisme du soufre chez Kluyveromyces lactis et Yarrowia lipolytica à l’interaction entre Kluyveromyces lactis et Brevibacterium aurantiacum. Biochimie [q-bio.BM]. AgroParisTech, 2010. Français. <tel-00553893>
Transcript
HAL Id: tel-00553893https://tel.archives-ouvertes.fr/tel-00553893
Submitted on 10 Jan 2011
HAL is a multi-disciplinary open accessarchive for the deposit and dissemination of sci-entific research documents, whether they are pub-lished or not. The documents may come fromteaching and research institutions in France orabroad, or from public or private research centers.
L’archive ouverte pluridisciplinaire HAL, estdestinée au dépôt et à la diffusion de documentsscientifiques de niveau recherche, publiés ou non,émanant des établissements d’enseignement et derecherche français ou étrangers, des laboratoirespublics ou privés.
Ecosystème fromager : de l’étude du métabolisme dusoufre chez Kluyveromyces lactis et Yarrowia lipolytica
à l’interaction entre Kluyveromyces lactis etBrevibacterium aurantiacum
Agnès Hébert
To cite this version:Agnès Hébert. Ecosystème fromager : de l’étude du métabolisme du soufre chez Kluyveromyceslactis et Yarrowia lipolytica à l’interaction entre Kluyveromyces lactis et Brevibacterium aurantiacum.Biochimie [q-bio.BM]. AgroParisTech, 2010. Français. <tel-00553893>
Julien Rondeau, et les associés au fil des ans David Viatgé, Stéphanie Salmann,
Julien Guernon sans oublier Aude-Justine Fontenoy et la petite bidulette.
Un grand merci à mes parents, pour tout, pour m’avoir permis de faire des
études et d’avoir cru en moi. A ma grand-mère, un doctorat ça compensera le fait
de ne pas avoir eu de mention au bac ! A ma grand-mère, encore, ainsi qu’à ma
grand-tante, merci de m’avoir appris à lire, à écrire, à faire du vélo et des
gâteaux… Merci pour votre complémentarité explosive, qui nous faisait parfois
bien rire. Merci, toujours à ma grand-mère, pour toutes ses histoires de jeunesse.
Merci aux frangins, on s’est bien chamaillé petits! Merci à Tante Claudie et
Oncle William, à Tonton Danny ainsi que Pénélope et Steven pour leur affection
et toutes leurs attentions.
Et pour finir bien sûr, à mon cher et tendre, Jean Formigé, qui a su me
supporter et me soutenir pendant ces trois années de thèse. Je me demande si je
n’ai pas passé plus de temps que toi derrière mon ordinateur pendant ces trois
années… Merci d’avoir accepté ma non disponibilité, ma fatigue et mes
humeurs. Je t’aime…
Un dernier merci à tous ceux que j’ai connu grâce à toi et qui m’ont accueilli
les bras ouverts, ta maman Flo, Cédric et Marie-Pierre (et maintenant Mathieu),
aux amis et à tous les autres que je n’ai pas cité mais qui sont chers à mon
cœur…
9
Publications-Communications orales
Publication dans des revues à comité de lecture
Interactions between Kluyveromyces lactis and Brevibacterium aurantiacum, two cheese-ripening micro-organisms Forquin M P and Hébert A, Aubert J, Landaud S, Martin-Verstraete I, Bonnarme P, Beckerich J M. (En rédaction) An extensive investigation of sulfur metabolism in the yeast Yarrowia lipolytica Hébert A, Forquin M P, Roux A, Aubert J, Junot C, Heilier J F, Landaud S, Bonnarme P, Beckerich J M. (Version 1) Exploration of sulfur metabolism in the yeast Kluyveromyces lactis Hébert A, Forquin M P, Roux A, Aubert J, Junot C, Loux V, Heilier J F, Bonnarme P, Beckerich J M, Landaud S. (Eukaryotic Cell, Soumis) Biodiversity in the sulfur metabolism in hemiascomycetous yeasts Hébert A, Casaregola S, Beckerich J M. (FEMS Yeast Research, Soumis) Global regulation in response to sulfur availability in the cheese-related bacterium, Brevibacterium aurantiacum Forquin M P, Hébert A, Roux A, Aubert J, Proux C, Heilier J F, Landaud S, Junot C, Bonnarme P and Martin-Verstraete I. (Appl. Environ. Microbiol., Soumis) Sulphur metabolism of the cheese-ripening yeast Yarrowia lipolytica Hébert A, Beckerich J M, Landaud S, Bonnarme P. (Microbiology Monographs, Sous presse) Transcriptional analysis of L-methionine catabolism in the cheese-ripening yeast Yarrowia lipolytica in relation to volatile sulfur compound biosynthesis Cholet O, Hénaut A, Hébert A, Bonnarme P. (Appl. Environ. Microbiol. 2008)
Communications orales
Kluyveromyces lactis : une levure de l’écosystème fromager. JMI 2010 (Congrès Journées des microbiologistes de l'INRA, du 5 au 7 mai 2010). Poster. An integrative picture of the sulphur metabolism in the yeasts K. lactis and Y. lipolytica. (Séminaire externe IBPC UPR 9073, 25 novembre 2009). Conférence. An integrative picture of the sulphur metabolism in the yeasts K. lactis and Y. lipolytica. Congrès ISSY27 (International Specialized Symposium on Yeast, du 26 au 29 août 2009). Poster. Biologie intégrative du métabolisme du soufre et affinage des fromages. LMO8 (Congrès Levures Modèles et Outils VIII, du 26 au 29 octobre 2008). Conférence.
I. Métabolisme du soufre chez les levures hémiascomycètes ..............................................93
I. A. Introduction ...........................................................................................................................................93
I. B. Article n°1 : Métabolisme du soufre chez la levure d’affinage Yarrowia lipolytica .............................94
I. C. Article n°2 : Biodiversité du métabolisme du soufre chez les levures hémiascomycètes ...................117
I. D. Conclusion ..........................................................................................................................................154
II. Influence de l’apport soufré sur le métabolisme du soufre chez les levures Kluyveromyces lactis et Yarrowia lipolytica ................................................................................................................155
II. A. Introduction .........................................................................................................................................155
II. B. Article n°3 : Exploration du métabolisme du soufre chez la levure Kluyveromyces lactis .................158
15
II. C. Article n°4 : Etude approfondie du métabolisme du soufre chez la levure Yarrowia lipolytica .........187
II. D. Conclusion ..........................................................................................................................................218
III. Etude de l’interaction entre Kluyveromyces lactis et Brevibacterium aurantiacum .....221
III. A. Introduction .........................................................................................................................................221
III. B. Résultats-Discussion : Interaction entre K. lactis et B. aurantiacum ..................................................222
III. C. Conclusion ..........................................................................................................................................237
Figure 2. Composés soufrés organiques et inorganiques. ..................................................................... 28
Figure 3. Structure des transporteurs de la famille SulP. ...................................................................... 30
Figure 4. Assimilation du sulfate. ......................................................................................................... 32
Figure 5. Synthèse du sirohème. ........................................................................................................... 33
Figure 6. Synthèse de l’homosérine. ..................................................................................................... 34
Figure 7. Synthèse de la cystéine. ......................................................................................................... 36
Figure 8. Métabolisme du glutathion. ................................................................................................... 40
Figure 9. Système glutathion/glutaredoxine et système thioredoxine. .................................................. 41
Figure 10. Détoxification du cadmium. ................................................................................................. 42
Figure 11. Cycle du méthyle. ................................................................................................................ 47
Figure 12. Métabolisme du folate, origine du groupe méthyle. ............................................................ 48
Figure 13. Synhtèse des polyamines et cycle du méthylthioadénosine. ................................................ 52
Figure 14. Principales étapes de la fabrication fromagère..................................................................... 57
Figure 15. Répartition des 45 fromages AOC Français. ....................................................................... 63
Figure 16. Les 75 descripteurs d’arômes utilisés pour décrire les fromages. ........................................ 64
Figure 17. Voies de synthèse des composés soufrés à partir de la méthionine et de la cystéine. .......... 75
Figure 18. Surproduction de sulfite chez S. cerevisiae. ........................................................................ 77
Figure 19. Gènes impliqués dans la production d’H2S chez S. cerevisiae. ........................................... 78
Figure 20. Exemple de mutualisme entre S. thermophilus et L. delbrueckii subsp. bulgaricus. ........... 84
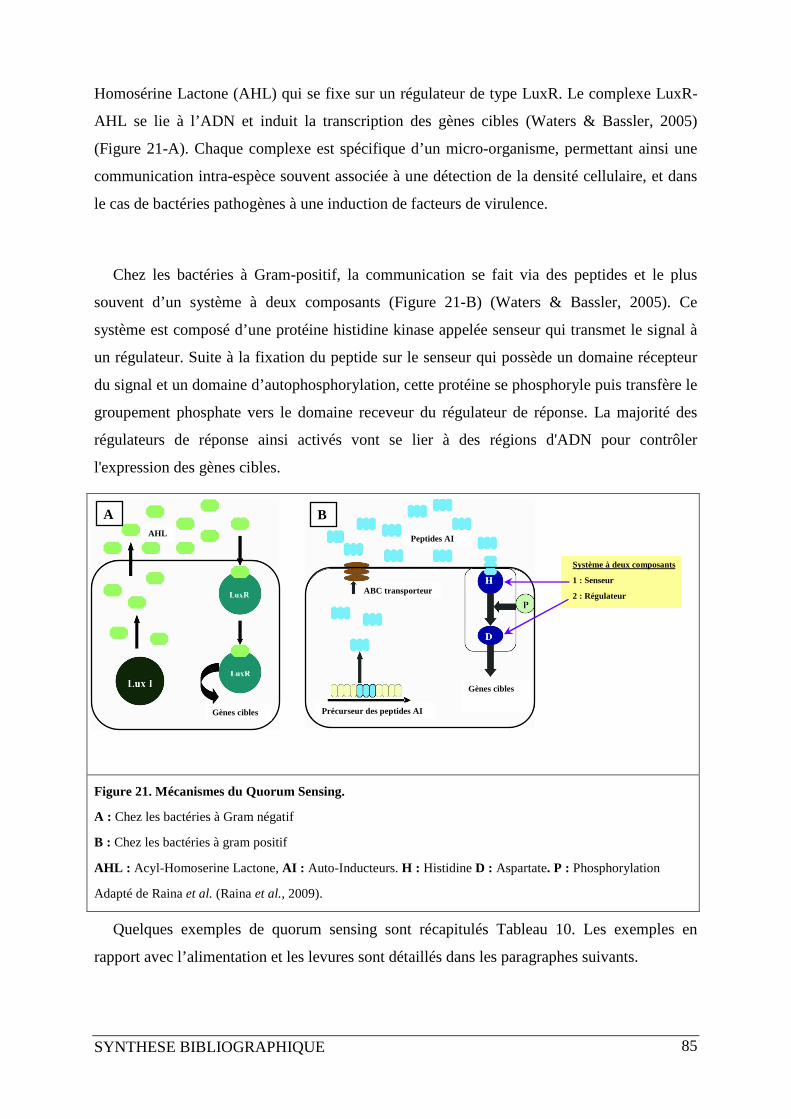
Figure 21. Mécanismes du Quorum Sensing. ........................................................................................ 85
Figure 22. Communication intra- et inter-espèces. ............................................................................... 88
Figure 23. Métabolisme du soufre chez K. lactis et Y. lipolytica : effet d’une forte concentration en méthionine comparée à une faible concentration en méthionine. ....................................................... 220
Figure 24. Analyses physiologiques et biochimiques des cultures pures et de la co-culture. ............. 224
Figure 25. Evolution du pH, consommation du lactose et biomasse de K. lactis en culture pure et co-culture. ................................................................................................................................................. 225
17
Figure 26. Interaction entre K. lactis et B. aurantiacum : métabolisme carboné. ............................... 230
Figure 27. Interaction entre K. lactis et B. aurantiacum : métabolisme de la biotine. ........................ 231
Figure 28. Coloration de K. lactis au calcofluor white à 92h. ............................................................. 233
Figure 29. Observation microscopique de K. lactis à 92h. .................................................................. 233
Figure 30. Les deux voies de synthèse de la cystéine. ........................................................................ 241
TABLEAUX
Tableau 1. Stress H2O2 et arsenite. ........................................................................................................ 43
Tableau 3. Métabolisme du soufre, effets des apports nutritionnels. .................................................... 54
Tableau 4. Composition moyenne du lait (g/L)..................................................................................... 56
Tableau 5. Principales transformations biochimiques au cours de l'affinage. ....................................... 60
Tableau 6. Représentation des 45 fromages AOC Français par catégorie fromagère. .......................... 62
Tableau 7. Les composés soufrés volatils couramment retrouvés dans le fromage .............................. 71
Tableau 8. Gènes impliqués dans catabolisme méthionine chez les levures technologiques. ............... 74
Tableau 9. Interactions microbiennes dans les produits laitiers ............................................................ 80
Tableau 10. Exemples de Quorum Sensing. .......................................................................................... 86
Tableau 11. Consommation des acides aminés par la co-culture et les cultures pures (%). ............... 223
Tableau 12. Rendements de biomasse et de production d’éthanol chez K. lactis en culture pure et co-culture. ................................................................................................................................................. 225
Tableau 13. Catégorie fonctionnelle des gènes différentiellement exprimés chez K. lactis. .............. 233
Tableau 14. Gènes différentiellement exprimés chez K. lactis discutés dans ce travail. .................... 234
Tableau 15.Catégorie fonctionnelle des gènes différentiellement exprimés chez B. aurantiacum. ... 236
Tableau 16. Gènes différentiellement exprimés chez B. aurantiacum discutés dans ce travail. ......... 236
INTRODUCTION
INTRODUCTION 21
INTRODUCTION
Les procédés de fermentations alimentaires sont utilisés depuis plusieurs milliers d'années
dans le monde entier. Ils permettent non seulement de conserver de nombreuses matières
premières périssables (lait, céréales, viande…), d’augmenter leur valeur nutritionnelle mais
aussi de développer d'intéressantes qualités organoleptiques. Ainsi, ces produits ont perduré
au cours de l'Histoire, donnant lieu à des spécialités culinaires particulières selon les régions
du monde, dépendantes des produits locaux. Cette richesse a été évaluée à 5000 produits
fermentés. Les produits représentatifs de la France sont essentiellement le vin, le pain et le
fromage.
Après la phase de coagulation du lait, la fabrication fromagère est constituée de plusieurs
étapes qui, par la variété de leur mode de conduite, ont rendu possible la grande diversité
fromagère que nous connaissons actuellement. Les fromages à pâte molle et à croûte lavée
sont des produits typiques (Livarot, Munster, Epoisses, Langres…) aux qualités
organoleptiques remarquables et pour lesquels la formation de composés soufrés volatils
(CSVs) lors de l’affinage est primordiale. Ces composés clefs sont produits par les micro-
organismes d’affinage (bactéries, levures) qui se développent lors de cette dernière étape.
Cependant, le métabolisme du soufre est encore peu connu chez les micro-organismes de
cet écosystème, notamment chez les levures d’affinage, dont font partie Kluyveromyces lactis
et Yarrowia lipolytica.
Ces levures appartiennent au phylum des hémiascomycètes, au même rang que la levure
modèle Saccharomyces cerevisiae, chez qui le métabolisme du soufre possède une place
centrale et a donc été largement étudié. En effet, ce métabolisme intervient notamment dans le
cycle cellulaire (Iida & Yahara, 1984; Drebot et al., 1990; Patton et al., 2000), la défense
contre le stress oxydatif (Penninckx, 2002; Pócsi et al., 2004) et la synthèse de cofacteurs
indispensables (Marobbio et al., 2003). Par ailleurs, S. cerevisiae est le premier organisme
eucaryote dont le génome a été séquencé (en 1996). Depuis, le séquençage de nombreux
autres organismes de ce phylum a pu être réalisé (Feldmann, 2000)
(http://www.genolevures.org/), créant une situation unique pour l’étude de l’évolution des
eucaryotes.
Nous avons donc décidé d’étudier de façon exhaustive le métabolisme du soufre chez les
levures fromagères Kluyveromyces lactis et Yarrowia lipolytica en nous appuyant sur les
connaissances de S. cerevisiae. Cependant les micro-organismes du phylum des
INTRODUCTION 22
hémiascomycètes sont séparés par d’importantes distances évolutives (Dujon, 2006), et S.
cerevisiae est très désaxée dans cette phylogénie (Figure 1). Il est donc possible que le
métabolisme du soufre chez S. cerevisiae ne soit pas représentatif de celui de tous les
hémiascomycètes. Nous avons donc choisi de nous appuyer sur d’autres organismes modèles
eucaryotes unicellulaires : Neurospora crassa, Aspergillus nidulans et Schizosaccharomyces
pombe (Figure 1).
S. cerevisiae est non seulement la levure modèle du phylum des hémiascomycètes, mais
elle est aussi une levure technologique, au même titre que Kluyveromyces lactis et Yarrowia
lipolytica. Cependant, ces deux dernières sont impliquées dans l’affinage fromager alors que
S. cerevisiae est majoritairement impliquée dans la fabrication du pain, du vin et de la bière.
La production de composés soufrés volatils a été étudiée chez S. cerevisiae, lors de son
utilisation pour la fabrication de ces produits. En effet, les composés soufrés volatils
participent pleinement aux qualités organoleptiques du vin et de la bière, ainsi qu’à celles du
fromage. Il est important de noter que ces molécules soufrées peuvent être intéressantes dans
certains aliments (fromage) alors qu’elles peuvent avoir un impact organoleptique néfaste
dans d’autres produits (vin, bière) si leur concentration dépasse un certain seuil. Par ailleurs,
ces matrices alimentaires ont des compositions très différentes et des caractéristiques physico-
chimiques spécifiques (pH, potentiel d’oxydo-réduction…), orientant les réactions chimiques
et biochimiques d’une manière spécifique. La chimie/biochimie du soufre est donc
particulière dans chaque produit et non directement transposable d’un produit à l’autre.
Il est aussi important de garder à l’esprit que l’affinage fromager est réalisé par un
écosystème complexe, pas uniquement composé de levures. Les partenaires de cet écosystème
sont facilement cultivables, ouvrant d’intéressantes perspectives sur des études d’interactions
microbiennes.
Ainsi, après avoir étudié de façon fondamentale et technologique le métabolisme du soufre
chez K. lactis et Y. lipolytica, nous avons choisi d’étudier le comportement de K. lactis cultivé
en association avec Brevibacterium aurantiacum, une bactérie d’affinage d’intérêt majeur
pour les fromages à pâte molle à croûte lavée. Ces données participeront à la construction
d’une base solide pour la compréhension de l’écosystème fromager.
Nous présenterons tout d’abord, sous forme d’une synthèse bibliographique, les
connaissances actuelles concernant le métabolisme du soufre chez les levures
hémiascomycètes, les grands principes de la fabrication fromagère ainsi que le rôle de
l’écosystème fromager dans cette fabrication.
INTRODUCTION 23
Ensuite, nous développerons les résultats obtenus selon trois axes : l’analyse in silico du
métabolisme du soufre chez les levures hémiascomycètes, le métabolisme du soufre et la
production de composés soufrés volatils en culture pure chez K. lactis et Y. lipolytica et enfin
les conclusions concernant les cultures en association de K. lactis avec B. aurantiacum.
Candida albicans
Pichia stipitis
Debaryomyces hansenii
Yarrowia lipolytica
Lachancea kluyveri
Kluyveromyces thermotolerans
Kluyveromyces lactis
Eremothecium gossypii
Saccharomyces cerevisiae
Candida glabrata
Zygosaccharomyces rouxii
Schizosacharomyces pombe
Neurospora crassa
Emericella nidulans
Figure 1. Phylogénie.
En bleu : La phylogénie des levures hémiascomycètes.
En noir : Les quatre principales levures technologiques dont le génome est disponible.
En violet : La levure archeascomycète modèle ;
En rose : Les deux champignons ascomycètes modèles.
Le champignon Aspergillus nidulans a récemment été renommé Emericella nidulans.
SYNTHESE BIBLIOGRAPHIQUE
SYNTHESE BIBLIOGRAPHIQUE 27
SYNTHESE BIBLIOGRAPHIQUE
I. METABOLISME DU SOUFRE CHEZ LES LEVURES
HEMIASCOMYCETES
Le soufre est indispensable à la vie. Il permet en outre de produire la méthionine et la
cystéine, les acides aminés soufrés essentiels, ainsi que de synthétiser des molécules clefs
pour la cellule, telles que le glutathion et la S-adénosylméthionine (SAM), qui seront décrites
par la suite (en I. C et I. D respectivement). Les principaux intermédiaires soufrés abordés
dans cette partie sont représentés dans la Figure 2. Pour se développer, les levures peuvent
incorporer du soufre sous différentes formes, inorganiques (sulfate, sulfite, sulfure) et
sulfonates) (Uria-Nickelsen et al., 1993; Thomas & Surdin-Kerjan, 1997).
Le sulfate, qui est une source de soufre présente en abondance dans l’environnent, est
assimilable par de nombreux organismes (plantes, bactéries, champignons et levures), excepté
les mammifères. Il permet de synthétiser toutes les molécules soufrées organiques
indispensables. Nous allons donc commencer par décrire son assimilation par la cellule.
SYNTHESE BIBLIOGRAPHIQUE 28
Sulfate Sulfite Sulfure
APS PAPS
Cystathionine
Cystéine
Gammaglutamylcystéine
Glutathion Cystéinylglycine
S-adénosylméthionine S-adénosylhomocystéine
Méthionine
5-méthylthioadénosine
KMBA
Taurine
Homocystéine
Hypotaurine
Figure 2. Composés soufrés organiques et inorganiques.
Structure des principaux intermédiaires soufrés organiques et inorganiques discutés dans ce travail.
SYNTHESE BIBLIOGRAPHIQUE 29
I. A. Assimilation du sulfate inorganique
Le soufre possède différents degrés d’oxydation, le sulfate étant la forme la plus oxydée et
le sulfure la forme la plus réduite. Après son transport, le sulfate doit être transformé en
sulfite puis en sulfure pour être utilisé par la cellule. Cependant, la stabilité du couple
sulfate/sulfite est telle que la cellule ne peut pas effectuer cette réduction directement, et doit
tout d’abord activer le sulfate avant de le réduire. Les molécules générées lors de
l’assimilation du sulfate sont indispensables, mais aussi très toxiques pour la cellule. Cette
voie est par conséquent très régulée, de manière à éviter tout risque d’accumulation de ces
composés.
Les différentes étapes du métabolisme du sulfate, de son transport à son intégration dans
une chaîne carbonée, sont décrites par la suite.
I. A. 1. Transport
Le transport actif du sulfate a été mis en évidence chez la levure modèle S. cerevisiae par
McCready (McCready & Din, 1974). Les deux perméases impliquées dans ce transport ont
ensuite été identifiées (Breton & Surdin-Kerjan, 1977). Elles sont codées par les gènes SUL1
(Smith et al., 1995) et SUL2 (Jin et al., 1995). Ces deux transporteurs sulfate, qui ont été
décrits comme perméases à haute affinité (Cherest et al., 1997), appartiennent à la famille des
sulfate perméases SulP. Cette famille ne regroupe pas uniquement des transporteurs sulfate.
En effet, certains membres de cette famille transportent d’autres anions (Price et al., 2004;
Tejada-Jiménez et al., 2007). Les perméases de la famille SulP sont retrouvées chez de
nombreux organismes (bactéries, levures, champignons, plantes), et semblent être
ubiquitaires. Ces transporteurs sont organisés en 12 segments transmembranaires (Figure 3).
Il a été mis en évidence que les deux premières hélices jouent un rôle primordial dans le
transport du sulfate (Leves et al., 2008).
Il a récemment été montré que le chromate provoque une carence en soufre chez S.
cerevisiae (Pereira et al., 2008). Ce polluant hautement toxique entre en effet en compétition
avec le sulfate au niveau du transport, mais pourrait aussi interagir au niveau de son
métabolisme. En effet, des mutants dans la voie d’assimilation du sulfate (activation et
première étape de réduction) sont résistants au chromate. Ceci peut-être dû à l’absence de
synthèse d’un composé toxique ou à l’inhibition indirecte des transporteurs sulfate par
l’accumulation d’un intermédiaire métabolique.
SYNTHESE BIBLIOGRAPHIQUE 30
Figure 3. Structure des transporteurs de la famille SulP.
Les transporteurs de la famille SulP sont organisés en 12 segments transmembranaires. Cette figure représente la structure prédite du transporteur sulfate de la plante Stylosanthes hamata. L’analyse de la conservation des acides aminés des deux premières hélices a été faite à partir de 12 séquences de transporteurs eucaryotes. La taille globale de chaque position indique le niveau de conservation, et la taille de chaque lettre à une position donnée indique la fréquence à laquelle l’acide aminé a été retrouvé. Adapté de Leves et al. (Leves et al., 2008).
Deux perméases présentant des similarités de séquence avec celles de S. cerevisiae ont été
identifiées chez Neurospora crassa (Marzluf, 1997). Cependant, ces perméases, codées par
CYS13 et CYS14, sont régulés différemment. En effet, la mutation de l’ATP sulfurylase chez
Neurospora crassa ne modifie pas le transport du sulfate alors que la mutation de cette même
enzyme chez Saccharomyces cerevisiae provoque l’arrêt du transport du sulfate (Marzluf,
1974; Logan et al., 1996).
Chez Aspergillus nidulans le transporteur sulfate est codé par sB (Arst, 1968). Il a été
montré que la mutation du gene sB peut être complémenté par le gène sutB (van de Kamp et
al., 2000), qui code pour l’un des deux transporteurs sulfate de Penicillium chrysogenum (van
de Kamp et al., 1999). Récemment un nouveau transporteur sulfate a été décrit chez
Aspergillus nidulans (Piłsyk et al., 2007). Cependant, contrairement à tous les gènes décrits
SYNTHESE BIBLIOGRAPHIQUE 31
jusqu’à présent, ce transporteur sulfate n’appartient pas à la famille SulP. Ce transporteur,
codé par le gène astA, est apparenté à une famille complexe de transporteurs dont les
spécificités sont encore peu définies (Hellborg et al., 2008).
La connaissance des transporteurs sulfate chez les hémiascomycètes peut encore être
approfondie, notamment par l’étude de leurs mécanismes de régulation ainsi que par une
investigation plus approfondie de cette nouvelle famille de transporteurs.
I. A. 2. Activation
Le potentiel d’oxydoréduction du couple sulfate/sulfite est tellement faible que la réduction
directe du sulfate ne peut pas avoir lieu. Par conséquent, le sulfate va subir deux étapes
d’activation avant d’être réduit (Figure 4). Chacune de ces étapes nécessite l’utilisation d’une
molécule d’ATP.
Le sulfate est tout d’abord transformé en adénosine 5'-phosphosulfate (APS) par une ATP-
sulfurylase, puis en adénosine 3'-phosphate 5'-phosphosulfate (PAPS) par une APS-kinase.
Chez S. cerevisiae, ces enzymes sont codées par les gènes MET3 et MET14 respectivement.
Tous les gènes « MET » ont été identifiés comme étant impliqués dans la biosynthèse de la
méthionine par Masselot et al (Masselot & De Robichon-Szulmajster, 1975).
Un mutant met3 de S. cerevisiae, peut être complémenté par le gène codant pour l’ATP
sulfurylase d’Arabidopsis thaliana (Leustek et al., 1994). L’analyse de la structure de l’ATP
sulfurylase de S. cerevisiae a révélé une organisation sous forme d’hexamère, ainsi qu’un
nouveau mode de fixation de l’ATP (Ullrich et al., 2001). Le domaine responsable de
l’oligomérisation a récemment été identifié (Lalor et al., 2003). L’ATP sulfurylase de graines
de soja, présente une structure différente de celle de S. cerevisiae. En effet, celle-ci se trouve
sous forme de dimère (Phartiyal et al., 2006).
Le gène MET22 de S. cerevisiae code pour une bisphosphate-3'-nucléotidase. Cette
enzyme régule le pool de PAPS, qui est très toxique pour la cellule, en effectuant la réaction
inverse de l’APS-kinase (Peng & Verma, 1995). Cependant, le rôle de cette enzyme ne
semble pas se limiter à cette action. En effet, la délétion du gène MET22 provoque une
auxotrophie non seulement pour le sulfate mais aussi pour le sulfite et le sulfure, qui sont
situés en aval du PAPS. Pourtant, toutes les enzymes de la voie d’assimilation du sulfate sont
présentes et actives (Thomas et al., 1990, 1992). Ceci relève la question du rôle de cette
enzyme dans l’assimilation du sulfate. Il a été supposé que les enzymes de la voie
SYNTHESE BIBLIOGRAPHIQUE 32
d’assimilation du sulfate pourraient former un complexe, déstabilisé par l’absence de la
En rose : Activation du sulfate. (1) ATP-sulfurylase, (2) APS-kinase, (3) bisphosphate-3'-nucléotidase.
En bleu : Etapes de réduction. (4) 3'-phosphoadénylsulfate réductase, (5) et (6) sulfite réductase, (7) uroporphyrinogène III transméthylase, (8) précorrine II déshydrogénase et ferrochélatase, (9) glucose-6-phosphate déshydrogénase.
En violet : Incorporation du sulfure dans une chaine carbonée. (10) homosérine-O-acetyltransférase, (11) O-acétylhomosérine sulfurylase, (12) aspartate kinase, (13) ß-aspartyl semi-aldéhyde déshydrogénase, (14) homosérine déshydrogénase.
I. A. 3. Réduction
L’activation du sulfate est suivie par deux étapes de réduction (Figure 4), nécessitant
l’intervention d’un coenzyme d’oxydoréduction, le nicotinamide adénine dinucléotide
phosphate, nommé NADP sous sa forme oxydée et NAPDH sous sa forme réduite. Ces étapes
utilisent respectivement une et trois molécules de NADPH. Cette voie a donc un coût
énergétique important pour la cellule. Tout d’abord, le PAPS est réduit en sulfite, par une 3'-
phosphoadénylsulfate réductase. Le sulfite est ensuite réduit en sulfure par une sulfite
réductase.
SYNTHESE BIBLIOGRAPHIQUE 33
La 3'-phosphoadénylsulfate (PAPS) réductase de S. cerevisiae est codée par le gène
MET16 (Thomas et al., 1990). La fonction de ce gène a été identifiée lors de l’étude de 6 loci
(MET4, MET1, MET8, MET16, MET22 et MET251) dont la mutation a pour effet l’absence
d’activité PAPS réductase. Cependant, après avoir affiné leur technique de dosage
enzymatique, Thomas et al (Thomas et al., 1992) ont confirmé la perte d’activité PAPS
réductase uniquement pour les loci MET16 et MET4, codant respectivement pour la PAPS
réductase et l’activateur transcriptionnel des gènes « MET », qui sera décrit par la suite (I. F).
La sulfite réductase de S. cerevisiae est un hétérodimère, dont les sous-unités sont codées
par les gènes MET5 et MET10. Pour être active, cette enzyme nécessite la présence de
sirohème comme groupe prosthétique. Cette molécule particulière de hème rend possible la
réduction du sulfite en sulfure (Murphy et al., 1974). Chez S. cerevisiae, elle est synthétisée
par deux enzymes codées par les gènes MET1 et MET8 (Hansen et al., 1997; Raux et al.,
1999). Tout d’abord, l’uroporphyrinogène III va être méthylé par une uroporphyrinogène III
transméthylase codée par le gène MET1. La précorrine II ainsi produite va ensuite subir deux
autres réactions, dont les activités sont codées par le gène MET8, pour enfin former le
sirohème. La structure de cette enzyme bifonctionnelle (activités précorrine II déshydrogénase
et ferrochélatase) a été définie par Schubert et al (Schubert et al., 2002). L’étude de mutants
de cette protéine bifonctionnelle a permis à Schubert et al (Schubert et al., 2002) d’identifier
un site actif commun à ces deux activités enzymatiques.
Uroporphyrinogène III précorrine II sirohydrochlorine Sirohème(2)(1) (2)
Figure 5. Synthèse du sirohème.
(1) uroporphyrinogène III transméthylase, (2) précorrine II déshydrogénase et ferrochélatase.
Chez S. cerevisiae, le gène MET192 code pour une glucose-6-phosphate déshydrogénase,
qui est la première enzyme de la voie des pentoses phosphate. Cependant, MET19 avait été
défini comme un gène impliqué dans le métabolisme du soufre (Masselot & De Robichon-
Szulmajster, 1975), car sa mutation provoquait une auxotrophie pour la méthionine. En effet,
un mutant met19 n’est pas capable de croître en sulfate (Thomas et al., 1991). La cause de
l’interaction d’une enzyme de la voie des pentoses phosphate avec le métabolisme du soufre a
1 Met25 a été renommé MET17
2 MET19 a été renommé ZWF1
SYNTHESE BIBLIOGRAPHIQUE 34
été identifiée. Lors de son activité de glucose-6-phosphate déshydrogénase, l’enzyme codée
par MET19, réduit du NADP en NADPH. Comme la voie d’assimilation du sulfate est très
consommatrice de ce cofacteur sous sa forme réduite, l’absence d’une enzyme permettant de
régénérer ce cofacteur a un fort impact sur le métabolisme du soufre.
I. A. 4. Intégration du soufre dans une chaine carbonée
Le sulfure produit va ensuite être incorporé dans une chaine carbonée (homosérine),
fournie par le métabolisme de l’aspartate. Cette réaction va conduire à la formation
d’homocystéine, qui est le premier acide aminé soufré synthétisé chez S. cerevisiae (Figure
4). Ainsi, l’homocystéine possède une place centrale dans le métabolisme du soufre, car cet
acide aminé est le point de départ de la biosynthèse de toutes les molécules soufrées
organiques de la cellule.
La synthèse de l’homosérine à partir de l’aspartate a lieu en trois étapes successives
(Figure 6) (Robichon-Szulmajster et al., 1966). Chez S. cerevisiae, une aspartate kinase,
codée par HOM3, conduit à la formation d’aspartyl-4-P. La deuxième réaction, réalisée par
une ß-aspartyl semi-aldéhyde déshydrogénase codée par HOM2, permet la formation
d’aspartate semi-aldéhyde. Ce dernier intermédiaire va finalement permettre la synthèse
d’homosérine, sous l’action d’une homosérine déshydrogénase codée par HOM6. Cette voie
métabolique est indispensable à la synthèse de la méthionine et de la thréonine.
En rose : Sulfhydration. (5) O-acétyl-sérine sulfurylase, (6) cystéine synthase.
Chez S. cerevisiae, la synthèse de cystéine à partir de l’homocystéine est réalisée en deux
étapes. Cette voie est appelée transsulfuration inverse. Tout d’abord, l’homocystéine va réagir
avec de la sérine pour former de la cystathionine, sous l’action d’une cystathionine ß-synthase
codée par CYS4. La cystéine va ensuite être synthétisée à partir de la cystathionine par une
cystathionine γ-lyase, codée par CYS3. Le site actif de la cystathionine ß-synthase a
récemment été étudié par mutagénèse dirigée, permettant l’identification de résidus
indispensables au maintien de la conformation du site actif (Lodha et al., 2009).
S. cerevisiae possède aussi la voie de transsulfuration directe, qui permet de synthétiser de
l’homocystéine à partir de la cystéine. Cette voie confère à la cellule la faculté de croître sur
cystéine. La première étape de cette voie, qui est réalisée par une cystathionine γ-synthase
codée par STR2, conduit à la production de cystathionine à partir de la cystéine.
SYNTHESE BIBLIOGRAPHIQUE 37
L’homocystéine va ensuite être produite à partir de la cystathionine sous l’action d’une
cystathionine ß-lyase, codée par le gène STR3. Ces deux voies sont conservées chez
Aspergillus nidulans (Marzluf, 1997). La cystathionine ß-lyase codée par metG a été
caractérisée par complémentation (Sieńko & Paszewski, 1999).
Au contraire, Schizosaccharomyces pombe possède uniquement la voie de transsulfuration
directe (Brzywczy & Paszewski, 1994; Brzywczy et al., 2002). La synthèse de la cystéine se
fait donc par une autre voie chez ce micro-organisme. Cette voie, nommée sulfhydration est
décrite ci-dessous.
I. B. 3. Sulfhydration
La voie de sulhydration consiste en l’incorporation du sulfure dans une autre chaîne
carbonée, l’O-acétyl-sérine. Cette molécule est obtenue par l’activation de la sérine par une
sérine-O-acétyltransférase. L’O-acétyl-sérine réagit ensuite avec le sulfure, sous l’action
d’une cystéine synthase, pour produire de la cystéine (Figure 7).
Cette voie de sulfhydration n’est pas spécifique à S. pombe. Elle a en effet été identifiée
chez A. nidulans, où elle est décrite comme voie principale pour la synthèse de cystéine
(Marzluf, 1997). Grynberg et al. ont défini un nouveau type de sérine-O-acétyltransférase
chez A. nidulans (Grynberg et al., 2000). En effet, la séquence de cette enzyme est très
différente des sérine-O-acétyltransférases bactériennes connues, et présente une forte
similarité de séquence avec les homosérine-O-acétyltransférases. Plusieurs cystéine synthases
ont été mises en évidence chez A. nidulans (Brzywczy et al., 2007) et S. pombe (Fujita &
Takegawa, 2004). La redondance de ces enzymes suggère l’importance de la voie de
sulfhydration pour la cellule. La fonctionnalité de la voie de transsulfuration inverse et de la
voie de sulfhydration a été démontrée chez A. nidulans (Brzywczy et al., 2007). En effet, seul
un mutant affecté dans les deux voies présente une auxotrophie à la cystéine. La coexistence
de ces deux voies a aussi été observée chez Yarrowia lipolytica (Morzycka & Paszewski,
1979).
Chez S. cerevisiae la voie de sulfhydration semble être incomplète. Une mutation au
niveau de la voie de transsulfuration est suffisante pour provoquer une auxotrophie à la
méthionine (Cherest & Surdin-Kerjan, 1992). De plus, il a récemment été montré que
l’expression d’une sérine-O-acétyltransférase de plante chez une souche de S. cerevisiae peut
rendre fonctionnelle la voie alternative de synthèse de cystéine (Mulet et al., 2004).
SYNTHESE BIBLIOGRAPHIQUE 38
Une activité sérine-O-actétyltransférase a été décrite chez certaines souches de S.
cerevisiae. Cependant, le gène codant cette activité n’a jamais été identifié et cette voie ne
permet pas la synthèse de cystéine in vivo (Ono et al., 1999). Chez S. cerevisiae l’activité
cystéine synthase a été décrite comme due à l’homosérine-O-acétyltransférase, codée par
MET17. Il serait intéressant de déterminer si S. cerevisiae possède une ou plusieurs cystéine
synthase et, le cas échéant, déterminer quelle enzyme est responsable de la synthèse de
cystéine in vivo.
Ces différentes observations conduisent à s’interroger sur la présence de la voie de
sulfhydration chez les levures hémiascomycètes situées entre S. cerevisiae et Y. lipolytica.
I. C. Métabolisme du glutathion
Le glutathion est un tripeptide formé par la condensation d’acide glutamique, de cystéine et
de glycine. Cette molécule particulière joue un rôle important au niveau cellulaire, en lui
conférant une protection contre le stress oxydatif et les métaux lourds.
I. C. 1. Transport
Le transport du glutathion a récemment été mis en évidence. Le premier transporteur à
haute affinité, codé par HGT13, a été caractérisé chez S. cerevisiae (Bourbouloux et al.,
2000). La délétion de HGT1 abolit le transport de glutathion, suggérant que ce gène code pour
le principal transporteur du glutathion. La structure de ce transporteur n’a pas encore été
caractérisée, cependant les trauvaux de Kaur et al. ont montré que deux résidus cystéine libres
jouent un rôle primordial dans le transport du glutathion (Kaur et al., 2009). Par ailleurs, la
présence de deux glutamines, localisées respectivement dans les segments transmembranaires
TMD4 et TMD9, semble indispensable à la spécificité du transporteur de glutathion chez S.
cerevisiae (Kaur & Bachhawat, 2009). Le gène codant pour ce transporteur est induit en
carence en soufre et réprimé en cystéine (Miyake et al., 2002).
Le transport du glutathion a aussi été étudié chez Oryza sativa (riz) (Zhang et al., 2004) et
S. pombe (Dworeck et al., 2009). Le clonage du gène d’Oryza sativa (OsGT1) chez S.
cerevisiae complémente l’absence de HGT1. Cependant, ce transporteur présente une
spécificité de substrat moins importante que celui de S. cerevisiae. Comme chez S. cerevisiae, 3 HGT1 a aussi été décrit comme le gène OPT1 codant pour un transporteur d’oligopeptides
SYNTHESE BIBLIOGRAPHIQUE 39
la délétion du gène de S. pombe (SpOPT1) conduit à l’absence de croissance sur glutathion
comme seule source de soufre.
I. C. 2. Synthèse
Le glutathion est synthétisé à partir de la cystéine, via le γ-glutamyl-cystéine. Le
métabolisme du glutathion a été caractérisé chez de nombreuses levures et champignons
(Pócsi et al., 2004). Chez S. cerevisiae, le glutathion est synthétisé en deux étapes, par une γ-
glutamylcystéine synthétase codée par GSH1, et une glutathion synthétase codée par GSH2
(Figure 8). Chez S. cerevisiae, une mutation ∆gsh1 est létale en milieu non supplémenté en
glutathion, contrairement à une mutation ∆gsh2. Il a en effet été observé que le γ-glutamyl-
cystéine possède aussi des propriétés anti-oxydantes, pouvant compenser partiellement
l’absence de glutathion (Grant et al., 1997). La glutathion synthase d’Arabidopsis thaliana a
été caractérisée. Le clonage du gène d’A. thaliana complémente une souche ∆gsh2 de S.
cerevisiae (Ullmann et al., 1996). Le glutathion régule sa propre synthèse en réprimant le
gène GSH1 (Wheeler et al., 2002).
Le glutathion possède de nombreux rôles au niveau cellulaire (Penninckx, 2002; Pócsi et
al., 2004). L’implication du glutathion dans l’homéostasie redox et dans la détoxification
(cadmium, arsenite) est décrite dans la section suivante.
SYNTHESE BIBLIOGRAPHIQUE 40
Catabolisme
Cystéine Glutathionγ-glutamyl-cystéine(1) (2)
Cystéinyl-glycine
Glutamate Glycine
(3)Glutamate(6)
(4)
(5)
Homéostasie Red/Ox Détoxification
(6)(5)
GlutamateCystéine
GlycineCystéine
Glutamate(4)(4)
Figure 8. Métabolisme du glutathion.
En bleu : Synthèse du glutathion. (1) γ-glutamylcystéine synthétase, (2) glutathion synthétase.
En violet : Catabolisme du glutathion. (3) γ-glutamyltranspeptidase.
En rose : Catabolisme, voie alternative. (4) Cys-Gly métallo-di-peptidase, (5) probable di- et tri-peptidase, (6) probable glutamine amidotransferase.
I. C. 3. Protection
Le maintien de l’homéostasie redox est primordial. En effet, la perturbation de cet
équilibre par un stress oxydatif provoque des dommages cellulaires irréversibles, qui peuvent
même induire l’apoptose. Ainsi, pour contrecarrer les stress oxydatifs de nombreux systèmes
coexistent dans la cellule. Chez S. cerevisiae, deux de ces systèmes sont reliés au glutathion :
le système glutathion/glutaredoxine et le système thioredoxine (Figure 9) (Carmel-Harel &
Storz, 2000; Grant, 2001; Toledano et al., 2007).
Ce sont les fonctions –SH (cystéine libre) du glutathion, des glutaredoxines et des
thioredoxines qui permettent le maintien de l’homéostasie redox par réduction des radicaux
oxydés libres. Ces réactions sont effectuées par des glutathion peroxidases et des thioredoxine
peroxidases (Figure 9). Le glutathion, les glutaredoxines et les thioredoxines sont ensuite
régénérés par réduction. Le système thioredoxine est fortement impliqué dans la défense
contre le stress oxydatif (O2, H2O2) (Tableau 1).
La réduction des glutaredoxines et des thioredoxines est respectivement dépendante et
indépendante du glutathion. Ainsi, les thioredoxines sont réduites de manière analogue au
SYNTHESE BIBLIOGRAPHIQUE 41
glutathion, par une réductase spécifique dépendante du NADPH (codée par GLR1 pour le
glutathion et par TRR1 et TRR2 pour les thioredoxines). Il a été montré que le système
thioredoxine est capable de réduire le glutathion in vivo (Tan et al., 2010).
Le glutathion peut prévenir l’oxydation irréversible de protéines possédant des cystéines
libres par glutathionylation. Le glutathion forme en effet un pont di-sulfure avec les protéines,
les protégeant ainsi du stress oxydatif. Les protéines et le glutathion sont ensuite régénérés par
le système thioredoxine (Greetham et al., 2010).
A
GRX ox H2O2
H2O
(1)
NADPH
NADP
(2)
GS-SG
2 GSH
GS-SG
2 GSHGRX red
(3)
B
GSH + PSH
GS-SP
TRX red
H2O2
H2O
(1)
NADPH
NADP
(2)
TRX ox
TRX red
TRX ox
(3)
2 GSH
GS-SG
Figure 9. Système glutathion/glutaredoxine et système thioredoxine.
A. Système glutathion/glutaredoxine. (1) glutathion peroxidase, (2) glutathion réductase, (3) réactions red/ox.
B. Système thioredoxine. (1) thioredoxine peroxidase, (2) thioredoxine réductase, (3) glutathion transférase.
Le glutathion est aussi impliqué dans la détoxification du cadmium, système très étudié
notamment chez S. cerevisiae (Tableau 2) (Mendoza-Cozatl et al., 2005; Baudouin-Cornu &
Labarre, 2006).
SYNTHESE BIBLIOGRAPHIQUE 42
Chez S. cerevisiae, le cadmium entre dans la cellule par le transporteur zinc (Figure 10)
(Gomes et al., 2002), ainsi que par les transporteurs de cations divalents (Gardarin et al.,
2010). La présence du cadmium induit des changements radicaux dans l’utilisation du soufre.
Les flux sont augmentés et redirigés vers la synthèse de glutathion. En parallèle, les protéines
riches en soufre sont remplacées par des isoenzymes pauvres en soufre (Fauchon et al., 2002).
Ainsi, le soufre économisé est disponible pour la synthèse du glutathion. Le pool de
glutathion doit en effet être important pour lutter contre le stress cadmium. La détoxification
commence par la neutralisation d’une molécule de cadmium par deux molécules de
glutathion. Ce complexe est ensuite transporté dans la vacuole par un transporteur spécifique
codé par YCF1. L’assimilation du cadmium est régulée par le pool cytoplasmique de
glutathion-cadmium. En effet, si le transport vacuolaire est non fonctionnel, ce complexe
s’accumule et réprime le transporteur zinc (Gomes et al., 2002).
La détoxification de l’arsenite a aussi été étudiée chez S. cerevisiae (Tableau 1). Comme
pour le cadmium, le métabolisme du soufre est induit et les pools d’intermédiaires soufrés
sont augmentés. Il a aussi été observé que l’incorporation du soufre dans les protéines
diminue en présence d’arsenite.
Dans la section suivante, nous discuterons des mécanismes de dégradation du glutathion et
de ses conjugués.
2 GSH
GS-Cadmium-SG
Vacuole
Redirection du flux de sulfate
Cadmium
Réduction du soufre dans les protéines
(3)
(1)
Transporteur
Zinc
(2)
Figure 10. Détoxification du cadmium.
(1) glutathion transférase, (2) transporteur vacuolaire des molécules complexées au glutathion, (3) γ-glutamyltranspeptidase.
SYNTHESE BIBLIOGRAPHIQUE 43
Tableau 1. Stress H2O2 et arsenite.
Etude Stress Gènes Techniques
globales
Observations-Conclusions
(Godon et al., 1998) H2O2 - Protéomique L’exposition à l’ H2O2 induit de nombreuses protéines antioxydantes, dont le système
thioredoxine.
(Delaunay et al., 2000) H2O2 YAP1 -
L’activateur transcriptionnel codé par YAP1 est autorégulé.
Cette molécule est activée sous l’effet oxydatif de l’ H2O2, qui provoque la formation
d’un pont disulfure entre deux cystéines. Ceci induit un changement de la
conformation protéique et par conséquent son accumulation nucléaire, permettant
ainsi l’activation des gènes qu’il contrôle, dont le système thioredoxine qui le
régulera par réduction.
(Le Moan et al., 2006) O2
H2O2 - Protéomique
Mise en évidence des protéines possédant des thiols oxydés en croissance en
oxygène. Un stress oxydatif par de l’H2O2 induit une augmentation de l’oxydation de
ces mêmes protéines mais pas l’apparition de nouvelles protéines oxydées.
(Thorsen et al., 2007) Arsenite YAP1
MET4
Transcriptomique
Protéomique
Métabolomique
En présence d’arsenite, le métabolisme du soufre est induit (augmentation des
transcrits et des protéines). Les pools des intermédiaires soufrés augmentent et
l’incorporation du soufre dans les protéines diminue en présence d’arsenite. La
réponse induite par l’arsenite dépend des facteurs de transcription codés par YAP1 et
MET4.
SYNTHESE BIBLIOGRAPHIQUE 44
Tableau 2. Stress cadmium.
Etude Gènes Techniques
globales Observations-Conclusions
(Wemmie et al., 1994) YCF1 - Le transporteur vacuolaire codé par YCF1 transporte le complexe cadmium-glutathion.
(Dormer et al., 2000) MET4
GSH1 -
L’induction de l’expression de GSH1 en cadmium implique le complexe régulateur du métabolisme du soufre.
(Vido et al., 2001)
YAP1
GSH1
CYS3
Protéomique
Protéines induites : assimilation du sulfate, synthèse du glutathion, protéines de stress et antioxydantes, dont le système thioredoxine qui est sous contrôle de l’activateur transcriptionnel codé par YAP1.
Le glutathion et le système thioredoxine sont importants dans la réponse au cadmium.
(Fauchon et al., 2002) MET4 Transcriptomique
Protéomique
En présence de cadmium, le flux de soufre est redirigé vers la synthèse du glutathion. Les protéines riches en soufre sont remplacées par des isozymes pauvres en soufre. Le régulateur codé par MET4 joue un rôle important dans cette réponse.
(Gomes et al., 2002)
ZRT1
GSH1
YAP1
- L’assimilation du cadmium est régulée par le pool cytoplasmique de complexe cadmium-glutathion. Le cadmium entre dans la cellule en partie par le transporteur zinc codé par ZRT1.
(Barbey et al., 2005) MET4 - Le régulateur codé par MET4 est nécessaire pour la mise en place de la défense contre le cadmium.
Le cadmium interagit avec le complexe régulateur de MET4, permettant une réponse rapide à ce stress.
(Lafaye et al., 2005) - Protéomique
Métabolomique
En présence de cadmium, le flux de soufre est redirigé vers la synthèse du glutathion, ce qui est corrélé avec une augmentation du pool de glutathion.
(Adamis et al., 2009)
GTT2
YCF1
ECM38
- La compartimentation vacuole / cytosol est importante dans la résistance au cadmium.
SYNTHESE BIBLIOGRAPHIQUE 45
I. C. 4. Dégradation
Le glutathion, qui est un métabolite présent en grande quantité au niveau cellulaire, peut
servir comme réserve de soufre. La dégradation du glutathion est aussi nécessaire lors du
processus de détoxification des xénobiotiques. Chez S. cerevisiae, le glutathion peut être
dégradé par une γ-glutamyltranspeptidase vacuolaire, codée par ECM38 (Jaspers &
Penninckx, 1984; Mehdi et al., 2001).
Kumar et al ont montré qu’il existe une autre voie de dégradation du glutathion (Kumar et
al., 2003). En effet, une souche déficiente en γ-glutamyltranspeptidase est capable de croître
sur glutathion comme seule source de soufre. La voie alternative de dégradation du glutathion
a récemment été mise en évidence par Ganguli et al. (Ganguli et al., 2007). Cette voie
implique trois enzymes, une cys-gly métallo-di-peptidase, une probable di- et tri-peptidase et
une probable glutamine amidotransférase, codées par les gènes DUG1, DUG2 et DUG3
respectivement.
La cys-gly métallo-di-peptidase est suffisante pour dégrader l’α-glutathion et le cystéinyl-
glycine. Par contre la présence des trois enzymes est indispensable à la dégradation du γ-
glutamyl-cystéine et du γ- glutathion. La haute affinité de la cys-gly métallo-di-peptidase pour
le cystéinyl-glycine a été confirmée. L’orthologue de S. pombe est la seule enzyme
responsable de la dégradation du cystéinyl-glycine (Kaur et al., 2009). Cette cys-gly métallo-
di-peptidase est aussi impliquée dans la détoxification des xénobiotiques (Ubiyvovk et al.,
2006).
I. D. Biosynthèse de la méthionine
I. D. 1. Transport
La méthionine est un acide aminé essentiel qui peut être directement prélevé du milieu
extérieur par différents transporteurs soit synthétisé par le micro-organisme. Chez
Saccharomyces cerevisiae, il existe deux transporteurs spécifiques de la méthionine. Ces
transporteurs à forte et à faible affinité sont codés par MUP1 et MUP3 respectivement (Isnard
et al., 1996).
La méthionine peut aussi être transportée par des perméases moins spécifiques, telles que
la perméase générale codée par GAP1 (Grenson et al., 1970). Lors de l’analyse de quinze
perméases à acides aminés chez S. cerevisiae, Regenberg et al ont montré que quatre de ces
SYNTHESE BIBLIOGRAPHIQUE 46
perméases (codées par GNP1, BAP2, BAP3 et AGP1) sont impliquées dans le transport de la
méthionine. En effet, la surexpression de ces gènes a pour conséquence une augmentation de
l’assimilation de méthionine d’un facteur entre deux et six (Regenberg et al., 1999).
Le transport de la forme activée de la méthionine, la S-adénosylméthionine, a été mis en
évidence chez S. cerevisiae. Rouillon et al. ont caractérisé une S-adénosylméthionine
perméase à haute affinité, codée par le gène SAM3 (Rouillon et al., 1999).
I. D. 2. Cycle du méthyle
Le cycle du méthyle (Figure 11) conduit à la formation de méthionine et de sa forme
activée la S-adénosylméthionine (SAM). Cette dernière molécule possède une place
importante dans le métabolisme cellulaire global, en intervenant dans de nombreuses
réactions, en tant que donneur de méthyle, de méthylène, de ribosyl, de groupe amine,
d’aminopropyl et de radical 5’-désoxyadénosyl (Fontecave et al., 2004). La SAM est le
premier donneur de méthyle, et son rôle est certainement encore sous-estimé (Katz et al.,
2003).
Il existe deux familles d’enzymes permettant la formation de méthionine par la méthylation
de l’homocystéine : les méthionine synthases dépendantes de la cobalamine (vitamine B12) et
les méthionine synthases indépendantes de la cobalamine. Les mammifères ne possèdent que
des méthionine synthases dépendantes de la cobalamine, tandis que les plantes, les
champignons et certaines bactéries ne possèdent que des méthionine synthases indépendantes
de la cobalamine. Les micro-organismes possédant uniquement une enzyme indépendante à la
cobalamine évoluent souvent dans des milieux où la disponibilité en cobalamine est faible, ou
n’ont pas la capacité de l’assimiler ou de la synthétiser. Ces deux familles d’enzymes ne
présentent pas de similarité de séquence, suggérant un mécanisme d’évolution convergente
(González et al., 1992). L’étude de ces deux familles a été facilitée par la coexistence de ces
enzymes chez Escherichia coli.
SYNTHESE BIBLIOGRAPHIQUE 47
(1)
(2)
(3)
Méthyltransférases(7)
Homocystéine
S-adénosyl-méthionine
S-adénosyl-homocystéine
Méthionine
Figure 11. Cycle du méthyle.
En rose : Cycle du méthyle. (1) méthionine synthase, (2) S-adénosylméthionine synthétase, (3) S-adénosylhomcystéine hydrolase.
En violet : Métabolisme du folate, origine du groupe méthyle. (4) dihydrofolate synthétase, (5) méthylènetétrahydrofolate réductase, (6) folylpolyglutamate synthétase.
En bleu : Voie de régulation du ratio Méthionine/SAM. (7) S-adénosylméthionine-homocystéine méthyltransférase.
La méthionine synthase indépendante de la cobalamine (codée par MET6) a été
caractérisée chez les levures S. cerevisiae et Candida albicans (Suliman et al., 2005). Il a été
démontré que ces enzymes transfèrent le groupement méthyle du méthyltétrahydrofolate-
polyglutamate à l’homocystéine pour former la méthionine.
Le méthyle transféré par la méthionine synthase provient du métabolisme du folate (Figure
12). La dihydrofolate synthétase fixe le premier glutamate sur le dihydropteroate, conduisant
à la production de dihydrofolate. Le méthylène-tétrahydrofolate (méthylène-THF) est
synthétisé après plusieurs étapes, dirigeant le métabolisme du folate vers le celui de la
méthionine. Cette molécule est ensuite réduite en méthyl-THF sous l’action d’une méthylène-
tétrahydrofolate réductase. Plusieurs résidus glutamate seront ensuite fixés sur le méthyl-THF
par une folylpolyglutamate synthétase, pour enfin former le méthyltétrahydrofolate-
polyglutamate. Cette voie a été décrite chez S. cerevisiae, où les rôles de la dihydrofolate
synthétase et de la folylpolyglutamate synthétase, codées par FOL3 et MET7 respectivement,
ont été caractérisés (Cherest et al., 2000). Il a été mis en évidence que S. cerevisiae possède
deux méthylène-tétrahydrofolate réductases, codées par MET12 et MET13 (Raymond et al.,
SYNTHESE BIBLIOGRAPHIQUE 48
1999). L’enzyme codée par MET13 serait la méthylène-tétrahydrofolate réductase principale,
car la délétion de MET13 cause une auxotrophie à la méthionine, tandis que celle de MET12
n’induit pas de phénotype particulier.
Dihydropteroate Dihydrofolate(1)
Méthyl-THF
Glutamate
Glutamate
Méthylène-THF
Méthyl-THF(glu) n
Méthyl-THF(glu) n+1
(2)
(3)
Figure 12. Métabolisme du folate, origine du groupe méthyle.
(nisine) Protéine d’immunité, mort des cellules cible
Gram-positif Staphylococcus aureus Peptide Population faible : adhérence et colonisation
Population forte : toxines et protéases
Levure Candida albicans (1) Tyrosol
(2) Farnesol
Population faible : (1) filamentation
Population forte : (2) sporulation
Levure Saccharomyces cerevisiae Phényléthanol
Tryptophol Morphologie cellulaire
Tableau 10. Exemples de Quorum Sensing.
Le quorum sensing a été observé chez certaines souches de L. lactis ssp. lactis. Cette
bactérie alimentaire produit une bactériocine du genre lantibiotique : la nisine. Les
lantibiotiques sont des peptides qui contiennent des acides aminés inhabituels généralement
soufrés modifiés post-traductionnellement comme la lanthionine et la β-méthyl lanthionine
(McAuliffe et al., 2001). La nisine est à la fois la molécule du quorum sensing, contrôlant
ainsi son transport, sa propre régulation ainsi que celle des gènes impliqués dans l’immunité,
mais aussi la réponse au quorum sensing par son rôle de bactériocine. La nisine tue les micro-
organismes ne possédant pas le système d’immunité en formant des pores dans leur
membrane cellulaire (Entian & de Vos, 1996; Kleerebezem, 2004).
Candida albicans est la levure la plus étudiée pour les phénomènes de quorum sensing.
Cette levure est un champignon pathogène humain dimorphique (mycélium et spores). Deux
molécules de « quorum sensing » contrôlent sa morphogenèse (Figure 22-A et -B). Le tyrosol
active la croissance et induit la formation du mycélium à faible densité cellulaire, tandis que
le farnesol inhibe la forme filamenteuse à haute densité cellulaire. Le farnesol est sécrété
proportionnellement à la quantité de cellules dans le milieu, ce qui permet au micro-
organisme d’évaluer sa concentration cellulaire (Hornby et al., 2001; Nickerson et al., 2006).
Un ajout de tyrosol dans le milieu réduit la phase de latence et induit la forme filamenteuse
(Chen et al., 2004). La réponse de C. albicans face au farnesol a été étudié en parallèle
morphologiquement et transcriptonnellement, ouvrant de nouvelles perspectives sur la
compréhension de ce phénomène (Cao et al., 2005).
S. cerevisiae produit deux alcools aromatiques impliqués dans le quorum sensing : le
SYNTHESE BIBLIOGRAPHIQUE 87
phényléthanol et le tryptophol. La production de ces molécules, qui exercent un rétrocontrôle
sur leur production respective, semble être dépendante de la densité cellulaire (Chen & Fink,
2006). Le phényléthanol et le tryptophol sont induits lors d’une carence en azote, provoquant
des changements morphologiques ainsi que l’induction du gène FLO11, impliqué dans le
phénomène de floculation. Le tryptophol et le tyrosol sont des molécules produites par la voie
d’Ehrlich, lors de la dégradation du tryptophane et de la tyrosine respectivement (Hazelwood
et al., 2008).
L’ammoniac pourrait aussi être une molécule du quorum sensing chez les levures (Palková
& Váchová, 2003). En cas de carence azotée, on observe une augmentation du pH en
corrélation avec la production d’ammoniac. Cette alcalinisation induit une inhibition de la
croissance des levures qui rentrent ainsi en phase de latence, permettant aux levures de
minimiser leur consommation d’énergie et donc d’être plus résistantes face au stress
nutritionnel. Une fois la carence azotée levée la production d’ammoniac se réduit, provoquant
une chute de pH et une induction de la croissance des levures (Palková & Váchová, 2003). De
plus, l’inhibition de l’expansion des mycéliums de G. candidum dans un caillé modèle
pourrait être due à la production d’ammoniac par Y. lipolytica (Mounier et al., 2008).
L’ammoniac jouerait aussi un rôle dans la mort cellulaire programmée des levures. Ce
système, surprenant chez des organismes unicellulaires, prend tout son sens via le quorum
sensing. En cas de carence nutritionnelle chez S. cerevisiae, les levures situées au cœur de la
colonie meurent, libérant ainsi des nutriments, au profit du reste de la colonie. Il a été mis en
évidence que les colonies formées par des levures incapables de produire de l’ammoniac
meurent plus rapidement (Váchová & Palková, 2005).
Communication inter-espèces
La communication inter-espèces impliquant des signaux chimiques entre les bactéries et
les levures est très peu connue. Certaines molécules de « quorum sensing » comme des
bactériocines jouent un rôle indirect sur cette interaction mais d’autres sont capables d’agir
directement sur le « quorum sensing » d’une autre espèce. Le cas le mieux étudié est
l’interaction entre P. aeruginosa et C. albicans. Ces micro-organismes sont des pathogènes
opportunistes généralement présents dans les systèmes respiratoires de personnes
immunodéprimées.
P. aeruginosa produit une Acyl-Homosérine Lactone (AHL) qui induit la production de
facteurs de virulence dont des protéines responsables de son adhésion aux cellules. Ces
SYNTHESE BIBLIOGRAPHIQUE 88
protéines confèrent à P. aeruginosa la capacité de se fixer uniquement sur la forme
filamenteuse de C. albicans et peut tuer la levure grâce à ses facteurs de virulence. Mais la
levure est capable d’intercepter l’AHL produite par P. aeruginosa et, pour se défendre, C.
albicans va favoriser la formation de spores par la production de farnesol (Hogan et al.,
2004). De plus, la production de farnesol par la levure réprime les gènes impliqués dans le
« quorum sensing » de P. aeruginosa. Ces deux micro-organismes ont donc mis en place un
système complexe via une signalétique moléculaire qui leur assure une co-existence au sein
d’un environnement donné (Figure 22-C). Cet exemple montre la complexité qui existe dans
les phénomènes de communication inter-espèces via des molécules chimiques (De Sordi &
Mühlschlegel, 2009).
Mort deC. albicans (filament)
A/ Interaction intra-espèce chez C. albicans
Farnesol
B/ Interaction intra-espèce chez P. aeruginosa
QSTyrosol
Farnesol
Filament
Spore
Temps
Densité cellulaire
QS
Temps
Densité cellulaire
AHL
AHL
AHLInhibition du QS chez P. aeruginosa
C/ Interaction inter-espèces
Farnesol
(1)
(2)
(3)
(4)(5)
(6)
(7)
Pseudomonas aeruginosa
Candida albicans
Virulence
Figure 22. Communication intra- et inter-espèces.
QS : Quorum Sensing. AHL : Acyl-Homosérine Lactone.
(1) (2) : Equilibre entre la forme filament (basse densité cellulaire) sous l’action du tyrosol et la forme spore (haute densité cellulaire) de C. albicans sous l’action respective du tyrosol et du farnesol.
(3) : Stimulation des facteurs de virulence de P. aeruginosa sous l’action de l’AHL. (4) : P. aeruginosa activé par l’AHL tue C. albicans sous forme filament.
(5) : C. abicans capte l’AHL produit par P. aeruginosa. (6) : La détection de l’AHL provoque le production de farnesol par C. abicans, déplaçant l’équilibre vers la forme spore. (7) : Le farnesol inhibe le quorum sensing de P. aeruginosa.
SYNTHESE BIBLIOGRAPHIQUE 89
Pour conclure, la transformation du lait en fromage résulte de nombreux savoir-faire ainsi
que du développement d’un écosystème microbien complexe. Chaque partenaire de cet
écosystème joue un rôle important dans la genèse des qualités organoleptiques fromagères,
notamment par la modification des propriétés physico-chimiques (lait ; caillé ; fromage) et par
la production de composés aromatiques. Parmi ces molécules, les composés soufrés volatils
jouent un rôle primordial dans la flaveur des fromages à pâte molle à croûte lavée. La
complexité du milieu (lait), des procédés de fabrication et de l’écosystème rend l’étude des
micro-organismes difficile.
Afin d’obtenir des données génériques sur les micro-organismes d’affinage, leur
interaction, ainsi que sur la genèse des composés soufrés volatils, nous avons choisi de
structurer ce travail en trois temps :
- Réalisation d’un bilan de l’état des connaissances et reconstitution des voies du
métabolisme du soufre chez les levures hémiascomycètes par analyse in silico.
- Etude approfondie du métabolisme du soufre chez deux levures hémiascomycètes,
Kluyveromyces lactis et Yarrowia lipolytica, par une combinaison de techniques
exploratoires (Transcriptome, Métabolome, Chromatographie en phase Gazeuse
coupée à la Spectrométrie de Masse (GC-MS)).
- Etude de l’interaction entre deux micro-organismes d’affinages, Kluyveromyces lactis
et Brevibacterium aurantiacum, par une approche transcriptomique couplée à l’analyse
des modifications physiologiques et biochimiques.
RESULTATS-DISCUSSION
RESULTATS-DISCUSSION_PARTIE I 93
RESULTATS-DISCUSSION
I. Métabolisme du soufre chez les levures hémiascomycètes
I. A. Introduction
Les levures du phylum des hémiascomycètes sont séparées par de grandes distances
évolutives. Ces organismes eucaryotes unicellulaires, possédant une organisation et un niveau
de complexité similaires, sont une ressource intéressante pour l’étude de l’évolution du
métabolisme notamment grâce à la disponibilité de nombreux génomes séquencés.
Nous avons tout d’abord choisi de faire un bilan des connaissances du métabolisme du
soufre chez Yarrowia lipolytica, la levure étudiée la plus divergente de la levure modèle
Saccharomyces cerevisiae. Cette levure est étudiée notamment pour ces capacités à produire
des composés soufrés volatils via le catabolisme des acides aminés soufrés. Ces données sont
présentées dans la section I. B.
Les connaissances des voies de biosynthèse des acides aminés et autres intermédiaires
soufrés chez Y. lipolytica s’appuient essentiellement sur celles générées par l’étude de S.
cerevisiae. Cependant Y. lipolytica est phylogénétiquement plus proche des champignons
filamenteux. Nous avons donc réalisé une étude phylogénétique du phylum des
hémiascomycètes (sur 11 levures dont les génomes sont séquencés et annotés) en nous
appuyant sur les connaissances du métabolisme du soufre chez S. cerevisiae mais aussi sur
d’autres micro-organismes modèles : Schizosaccharomyces pombe, Neurospora crassa et
Emericella nidulans. Les résultats de cette étude, qui nous a permis d’avoir une vision du
métabolisme du soufre à travers le phylum entier, sont présentés dans la section I. C.
RESULTATS-DISCUSSION_PARTIE I 94
I. B. Article n°1 : Métabolisme du soufre chez la levure d’affinage Yarrowia lipolytica
Sulphur metabolism of the cheese-ripening yeast Yarrowia lipolytica.
Agnès Hébert1,2, Jean Marie Beckerich2, Sophie Landaud1, Pascal Bonnarme1*
1AgroParisTech-INRA, UMR782 Génie et Microbiologie des Procédés Alimentaires,
2AgroParisTech-INRA, UMR1319 Micalis, 78850 Thiverval Grignon, France
Table 1: Genes involved in sulphur metabolism in Yarrowia lipolytica. The genes were identified by an in silico comparison with the yeast model Saccharomyces cerevisiae. The databases utilized are the Saccharomyces Genome Database (http://www.yeastgenome.org/) and Genolevures (http://www.genolevures.org/).
Extracellular sulphate
Intracellular sulphate
APS
PAPS
sulphite
sulphide
Homoserine
O-acetylhomoserine
Cysteine Cystathionine Homocysteine
Serine
Methionine S-adenosylmethionine
S-adenosylhomocysteine
Glutathione
γ-glutamyl-cysteine
YALI0B17930g
YALI0B08184g
YALI0E00418g
YALI0B08140g
YALI0D11176gYALI0E16368g
YALI0F11759g
YALI0B14509g
YALI0E12683g
YALI0E00836g
YALI0D25168g
YALI0D00605gYALI0D17402g
YALI0E09108g
YALI0E30129g
YALI0C17831g
YALI0F05874g
Methyltransferases
Figure 1: Survey of sulphur metabolism in Yarrowia lipolytica. Sulphate assimilation: black arrows.Transsulphuration pathway: grey arrows. Methyl cycle: black arrows intermittent line. Glutathione synthesis: black arrows dotted line.
RESULTATS-DISCUSSION_PARTIE I 100
3 Yarrowia lipolytica in cheese ecosystems
Y. lipolytica occurs frequently in milk products and, owing to its high catabolic activities
(eg: proteolytic and lipolytic activities), this species can play an important role in the
formation of aroma precursors such as aminoacids, fatty acids and esters, as well as their
subsequent conversion to aroma-active or other bio-active compounds (Guerzoni et al. 2001;
van den Tempel and Jakobsen 2000). Strains of the yeasts D. hansenii and Y. lipolytica,
isolated from blue mould cheeses were examined for their technological characteristics and
potential use as starter cultures in cheese ripening. Y. lipolytica was more sensitive to NaCl
and did not assimilate lactose, contrary to D. hansenii. Furthermore, Y. lipolytica strains were
much more lipolytic and proteolytic than D. hansenii (van den Tempel and Jakobsen 2000).
Due to its catabolic activities, Y. lipolytica can therefore strongly influence the
organoleptic properties of cheese through the production of precursors from the cheese curd,
leading to aroma compounds biosynthesis during the ripening process. For instance, chemico-
physical parameters of major importance for cheese ripening (eg: pH, NaCl, milk fat)
markedly influenced the lipolytic activity of Y. lipolytica strains with substantial changes in
the free fatty acids (FFA) production profiles. Such FFA are known as potential aroma
precursors (Guerzoni et al. 2001).
Y. lipolytica has been identified in many cheeses. For instance, in Camembert and Brie
cheeses, although a broad spectrum of yeasts was isolated from both cheeses, Y. lipolytica and
D. hansenii were the most abundant yeast species isolated (Viljoen et al. 2003). In the red-
smear cheese, Livarot cheese, the microbial diversity of the cheese surface ecosystem was
studied using culture-dependent and culture-independent approaches. It was found that Y.
lipolytica accounted for 7.5% of the total culturable yeast microbiota (Mounier et al. 2009).
Microbial interactions occurring within a cheese microbial community has been investigated
using the Lotka-Volterra model and yeasts omissions studies to evaluate species interactions
(Mounier et al. 2008). It was shown that negative interactions occurred between yeasts.
Although mechanisms involved in such interactions still remained to be elucidated, the
authors found that Y. lipolytica inhibited mycelial expansion of the yeast G. candidum a yeast
of great importance in numerous soft cheeses such as Camembert or Livarot cheeses (Mounier
et al. 2008).
The growth of Y. lipolytica can also be dramatically affected by the presence of other
microorganisms of the ecosystem, especially the bacterium Staphylococcus xylosus (Mansour
et al. 2009b). The presence of S. xylosus C2a resulted in a 100-fold decrease in the Y.
RESULTATS-DISCUSSION_PARTIE I 101
lipolytica cell count compared to the pure culture. It was postulated that competition for
amino acids between Y. lipolytica and S. xylosus may explain this phenomenon, since the
amino acids were dramatically consumed in Y. lipolytica - S. xylosus coculture compared to Y.
lipolytica or S. xylosus mono-culture. As a result of the low amino acid concentration in the
medium, the expression of Y. lipolytica genes involved in amino acid catabolism (GDH2,
BAT1, KAD) was downregulated in the presence of S. xylosus compared to the yeast
monoculture.
Gene expression and biochemical analyses were performed in a coculture of the yeasts D.
hansenii, Kluyveromyces marxianus, and Y. lipolytica (Cholet et al. 2007). The time-course
expression of target genes possibly involved in lactose/lactate catabolism and the biosynthesis
of sulphur-flavoured compounds were studied in pure cultures of each yeast, as well as in
coculture, and compared to biochemical data. A high expression of the LAC genes was
observed in K. marxianus, a yeast which degrades lactose. Several lactate dehydrogenase
encoding genes were also expressed essentially in D. hansenii and K. marxianus, which are
two efficient deacidifying yeasts in cheese ripening. Contrary to D. hansenii and K.
marxianus, several genes involved in L-methionine catabolism were highly expressed in Y.
lipolytica. Biochemical analyses revealed that this yeast efficiently assimilates L-methionine,
and also exhibited a high expression of the S. cerevisiae orthologs BAT2 and ARO8, which are
involved in the L-methionine degradation pathway (Cholet et al. 2007).
4 Importance of volatile sulphur compounds on the quality of cheeses
Due to their high reactivity, thiols such as MTL or H2S are common precursors for a
variety of other VSCs. Both thiols arise from the degradation of the sulphur aminoacids L-
methionine and L-cysteine which are present in high amounts in the cheese matrix. VSCs are
key compounds for the typicity and quality of ripened cheeses, giving various flavour notes to
the product. However, owing to their reactivity, these thiols are not always easy to quantify in
the cheese matrix. MTL is the first volatile degradation product of L-methionine (see § 5) and
can be found to high amounts in numerous cheeses among others camembert, vintage
cheddar, parmesan, pecorino, grana padano and blue cheese. Furthermore, works have
reported a good correlation between cheese flavour intensity and MTL concentration,
suggesting that MTL alone could be a key contributor of the cheese flavour (Landaud et al.
2008).
RESULTATS-DISCUSSION_PARTIE I 102
Another possible VSCs precursor is H2S which is considered as the primary degradation
product of L-cysteine. This thiol has the unpleasant odour of "rotten eggs", and has been
reported in several cheeses including limburger and cheddar (Landaud et al. 2008).
MTL (and possibly H2S) are subsequently oxidized to form other VSCs such as sulphides
and thioesters (Figure 2) giving cheeses various flavour notes. For instance DMS was
reported in several types of cheeses such as camembert, cheddar or parmesan. Its aroma
descriptor was found to be "boiled cabbage, sulphurous", and its odour threshold is quite low
(~1ppb), suggesting that this compound could be a contributor to the cheese aroma (Landaud
et al. 2008). The most commonly sulphide reported in ripened cheese aroma is DMDS.
DMDS has a low odour threshold (~20 ppb) and a typical "garlic" odour which is desired in
the final aroma of numerous cheeses among others camembert, cheddar, parmesan, grana
padano, maroilles, livarot, pont-l’évêque, langres, and époisses. Although present in very low
amounts but, owing to their much lower detection threshold than DMDS, other sulphides like
DMTS and dimethyl tetrasulphide (DMQS) are probably more important than DMDS for the
cheese aroma (Landaud et al. 2008). It has been reported by Frank et al. (2004) that DMTS
had a "strong" to "extremely strong" perceived intensity in vintage cheddar, parmesan,
pecorino, grana padano and blue cheese. DMQS is less frequently detected in cheeses but,
due to its much lower detection threshold (~1 ppb) compared to DMTS (~8 ppb) and DMDS
(~23 ppb; Martin et al. 2004), it probably significantly influences cheese aroma, as reported
in parmesan or grana padano (Frank et al. 2004).
Another family of VSCs, S-methylthioesters, has also been reported in several cheeses and
extensively studied with respect to their detection thresholds - which ranged from 1 to 3 ppb -
and flavour notes descriptors such as "cabbage", "garlic", "cheesy" (Martin et al. 2004;
Landaud et al. 2008). For instance, S-methylthioacetate (MTAc) which has been detected in
vacherin, pont-l’évêque, langres and époisses, has flavour descriptors such as "cabbage",
"cheesy" and "crab".
Another VSC found in numerous cheeses including camembert, cheddar, blue cheese,
parmesan, grana padano, pecorino, is methional (methylthio-propionaldehyde). It arises from
the Erhlich degradation of L-methionine (see § 5 and Figure 2). It has a typical "boiled
potato" note and could probably play an important role in the typical cheesy aroma in the
cheeses where it is present (Frank et al. 2004).
Among the above cited CSV, namely MTL, H2S, DMS, DMDS, DMTS, MTAc and
methional, have been shown to be produced to some extent by Yarrowia lipolytica depending
RESULTATS-DISCUSSION_PARTIE I 103
on culture media, precursors added and strain (Cholet et al. 2008 ; Spinnler et al. 2001 ; Arfi
et al. 2002 ; Bonnarme et al. 2001). The production of MTL, DMS, DMDS, DMTS, MTAc
and methional was induced by L-methionine supplementation to the culture medium. The
effect of low (LM) or high (HM) concentration of L-methionine was studied for Y. lipolytica
cultivated in a cheese-like medium with respect to VSCs production (Cholet et al. 2008). It
was found that, in the HM medium, L-methionine consumption was accompanied by a
transient accumulation of the transamination product of L-methionine, α-keto γ-
methylthiobutyrate (KMBA), the latter being subsequently degraded to VSCs. MTL, DMS,
DMDS and DMTS – methional being detected as traces - were detected only in the HM
medium, which suggests a strong relationship between VSCs production and KMBA
disappearance. Other results have shown that, using a medium supplemented with L-
methionine, Y. lipolytica could also produce MTAc and consistent amounts (350 ppb) of
methional together with MTL, DMDS and DMTS (Arfi et al. 2002). Substituting precursor L-
methionine for S-methylmethionine, resulted in the production of only DMS by Y. lipolytica
(Spinnler et al. 2001). In this case, it was speculated that enzymatic biosynthesis of DMS
most probably proceeded through a demethiolation of S-methylmethionine. Nevertheless, the
presence of S-methylmethionine in cheese still remains controversial. Another example of the
importance of the precursor for VSCs production profile is illustrated by L-cysteine. In Y.
lipolytica, it was found that H2S was the major VSCs produced from L-cysteine degradation,
relative importance of H2S production being essentially strain-dependent (López del Castillo-
Lozano et al. 2007a).
RESULTATS-DISCUSSION_PARTIE I 104
Methionine
H2N CH C
CH2
OH
O
CH2
S
CH3
C C
CH2
OH
O
CH2
S
CH3
O
C C
CH2
OH
O
CH3
O
SH3C S CH3
DMDS
DMTS
CH C
CH2
OH
O
CH2
S
CH3
HO S
CH3
H Acyl-CoA
CH3-S-CO-R
S-methylthioesters
KMBA
ααααKG
Glu
GDH
O C
CH2
CH2
S
CH3
H
ATase
NH4+
+α-ketobutyric acid (αKB)
Methanethiol (MTL)MTL
αKB + NH4+
Demethiolation
Demethiolation ?
Demethiolation
αHB + NH4+
AA, FFA, Sugars
Chem
ical/e
nzym
atic
?
Propionaldehyde
Dec
arbo
xyla
tion
CO2
Methylthio-propionaldehyde
(methional)
Chemical/enzymatic
DMS
Alternative pathway involving SMM?SH3C CH3
OCH
CH2
CH2
S
CH3
H
Methylthio-propanol
(methionol)
Reduction?
O C
CH2
CH2
S
CH3
OH
Methylthio-propionic acid
Oxidation?
Methionine
H2N CH C
CH2
OH
O
CH2
S
CH3
C C
CH2
OH
O
CH2
S
CH3
O
C C
CH2
OH
O
CH3
O
SH3C S CH3
DMDS
DMTS
CH C
CH2
OH
O
CH2
S
CH3
HO S
CH3
H Acyl-CoA
CH3-S-CO-R
S-methylthioesters
KMBA
ααααKG
Glu
GDH
O C
CH2
CH2
S
CH3
H
ATase
NH4+
+α-ketobutyric acid (αKB)
Methanethiol (MTL)MTL
αKB + NH4+
Demethiolation
Demethiolation ?
Demethiolation
αHB + NH4+
AA, FFA, Sugars
Chem
ical/e
nzym
atic
?
Propionaldehyde
Dec
arbo
xyla
tion
CO2
Methylthio-propionaldehyde
(methional)
Chemical/enzymatic
DMS
Alternative pathway involving SMM?SH3C CH3
OCH
CH2
CH2
S
CH3
HOCH
CH2
CH2
S
CH3
H
Methylthio-propanol
(methionol)
Reduction?
O C
CH2
CH2
S
CH3
OH
Methylthio-propionic acid
Oxidation?
Figure 2: Likely pathways of L-methionine catabolism to volatile sulphur compounds in Y. lipolytica. ATase: aminotransferase; α-KG: alpha ketoglutarate; Glu: glutamate; GDH: glutamate dehydrogenase; SMM: S-methylmethionine; MTL: methanethiol; KMBA: α-keto γ-methylthiobutyrate; AA: amino acid; FFA: free fatty acid; DMS: dimethyl sulphide; DMDS: dimethyl disulphide; DMTS: dimethyl trisulphide. Dashed lines are for hypothetical routes
5 L-methionine and L-cysteine catabolisms and volatile sulphur compounds
biosynthesis in Y. lipolytica
5.1 L-cysteine catabolism
The catabolism of L-cysteine has been investigated in several yeasts and bacteria from
cheese origin (López del Castillo-Lozano et al. 2007a). It was found that hydrogen sulphide
(H2S) production was dramatically enhanced in media supplemented with L-cysteine.
Although H2S production capabilities greatly varied depending on strain, it clearly appeared
that yeast strains, especially Y. lipolytica YL200 (53.00 µg ml-1 ±1.37), were greater
producers of H2S than bacteria. Furthermore, a linear relation was found between L-cysteine
consumption and H2S production for all yeasts producing large amounts of H2S (López del
Castillo-Lozano et al. 2007a). However, in some cases including Y. lipolytica strains, L-
cysteine was consumed without H2S production, suggesting that γ-elimination is perhaps not
RESULTATS-DISCUSSION_PARTIE I 105
the only catabolic pathway for L-cysteine. It has been hypothesized that a transamination step
could be involved in the first step of L-cysteine catabolism leading to the formation mercapto-
pyruvate (Figure 3). The transamination product mercapto-pyruvate i) could be converted to
H2S and pyruvate by a chemical reaction, or ii) could be reduced to the corresponding
aldehyde (mercapto-ethanal) as suggested in the yeast S. cerevisiae (Vermeulen et al. 2006)
through the Ehrlich pathway (Figure 3). However, the transsulphuration pathway and
glutathion synthesis cannot be ruled out in Y. lipolytica, this pathway being quite active in the
yeast S. cerevisiae as demonstrated by a combined metabolome and proteome approach
(Lafaye et al. 2005).
In an attempt to study the possible effect of L-cysteine on aroma compounds production,
VSCs biosynthesis was studied in culture media supplemented with L-methionine or L-
methionine/L-cysteine mixtures, using five cheese-ripening yeasts (López del Castillo-Lozano
et al. 2007b). It was found that Y. lipolytica YL200 produced DMDS and trace amounts of
DMTS, 2-methyl-tetrahydrothiophen-3-one and S-methylthioacetate were also produced to
some extent by Y. lipolytica. However, VSCs production diminished in a strain-dependent
behaviour when L-cysteine was supplemented, even at a low concentration (0.2 g l-1). This
effect was attributed to a significant decrease in L-methionine consumption in all the yeasts
except YL200, for cultures supplemented with L-cysteine. Hydrogen sulphide produced
through L-cysteine catabolism did not seem to contribute to VSCs generation at the acid pH
5.2 Evidence of transamination as a key step for L-methionine degradation to volatile
sulphur compounds
In several microorganisms isolated from cheese, the degradation of aminoacids is initiated
by an aminotransferase in which the amino group of an aminoacid is transferred to an α-keto
acid (e.g., α-ketoglutarate), resulting in the formation of the corresponding aminoacid (e.g.,
glutamate) and keto acids, which are degraded to flavour compounds (Yvon and Rijnen, 2001;
Landaud et al. 2008). Evidence of a transamination as the initial degradation step of L-
methionine to VSCs was first demonstrated in the yeast G. candidum (Bonnarme et al. 2001).
In this yeast, L-methionine transamination leads to the transient accumulation of the
transamination product α-keto γ-methylthiobutyrate (KMBA) which is subsequently
converted to MTL and its direct oxidation products (eg: DMDS, DMTS) as well as thioesters
(Figure 2). Several yeasts, among which Y. lipolytica, G. candidum, S. cerevisiae, K. lactis, D.
hansenii, were compared with respect to their ability to degrade L-methionine to VSCs (Arfi
et al. 2002). It was found that all yeasts could produce VSCs to some extent while degrading
L-methionine. Apart from S. cerevisiae cultures where L-methionine was poorly consumed
(9–10%), all strains had consumed almost all (≥85%) of the L-methionine after 48 h.
However, although KMBA was produced by all the yeasts, it was much more significantly
accumulated by Y. lipolytica than did the other four yeasts; this strongly suggests that L-
methionine transamination is of major importance in this yeast. Quite interestingly, while Y.
lipolytica produced substantial amounts (350 ppb) of methional, this compound was not
detected or poorly produced in the other yeasts. Methional has been detected in various types
of cheeses, including cheddar and camembert (Dunn and Lindsay 1985; Kubickova and
Grosch 1998). It was generally associated with a broth-like or potato odour. The production of
methional by Y. lipolytica is likely to result from the enzymatic decarboxylation of the KMBA
via the Ehrlich pathway. This suggests the occurrence of a decarboxylase activity in this yeast
which converts KMBA to methional.
The availability of the genome sequence of Y. lipolytica enabled to carry out the functional
analysis of genes putatively involved in L-methionine catabolism. However, due to the wide
specificity of substrates of aminotransferases, the functional analysis of genes possibly
involved in L-methionine transamination has been initiated. For instance, the enzymatic
properties of the purified aromatic aminotransferase Aro8 of Y. lipolytica have been
investigated. Its Kms for several aminoacid substrates ranged from 2.6 mM for L-
phenylalanine to 12.1 mM for L-methionine and to 61.4 mM for L-cysteine. Attempt for
RESULTATS-DISCUSSION_PARTIE I 107
heterologous production of other putative aminotransferases of Y. lipolytica has been carried
out but without success until now (Nathalie Merault, personal communication). In this yeast,
it has been found that L-methionine degradation via transamination, by a branched-chain
aminotransferase (BAT1), could be involved in VSCs formation. In Y. lipolytica, the
functional analysis of a branched-chain aminotransferase gene (YlBCA1) has shown that the
corresponding enzyme was able to convert L-methionine to KMBA, this compound being
degraded to VSCs (Cernat Bondar et al. 2005). The YlBCA1 gene was overexpressed in a
BCA1 transformant for which the ability to degrade L-methionine to VSCs was compared to
the parental strain. A 62% increase in KMBA biosynthesis, which is in agreement with an
increase in aminotransferase activity, was obtained in the BCA1 transformant as compared to
the parental strain. This is consistent with a 55% increase in VSCs production in the modified
strain. Furthermore, the thiol-producing-activity was increased 2.5 fold on L-methionine in
the transformant strain as compared to the parental one (Cernat Bondar et al. 2005).
Concerning the decarboxylation of KMBA to methional in Y. lipolytica, gene
YALI0D06930g putatively assigned asYlPDC6 (pyruvate decarboxylase) has been renamed
YlARO10 (phenylpuryvate decarboxylase), and could be a good candidate for this degradation
step. In agreement with this, it was found that YlARO10 was highly expressed at late
stationary phase in a medium supplemented with a high concentration of L-methionine
(Cholet et al. 2008). A combined proteome and transcriptome analysis of Y. lipolytica has
been performed in response to aminoacids supplementation (Mansour et al. 2009a). Following
aminoacids addition, yeast cells reorganize their metabolism towards aminoacids catabolism.
In this process, the expression of YlGAP1 gene encoding a membrane protein involved in
aminoacids transport was highly (72-fold) induced. Furthermore, the comparison of the
proteome and the transcriptome data revealed a concordance of the observed effect for
YlARO10 and YlBAT2 which were both highly induced in response to aminoacids
supplementation. Production of DMDS following aminoacids adition, is an indicator of L-
methionine catabolism.
5.3 In silico analyses of genes encoding branched-chain aminoacid aminotransferases
(BAT) or aromatic acid aminotransferases (ARO)
A search for genes encoding aminotransferases in the full genome of Y. lipolytica
(Génolevures: Genomic Exploration of the Hemiascomycete Yeasts –
http://www.genolevures.org/) has been done.
RESULTATS-DISCUSSION_PARTIE I 108
In yeasts, aminoacid aminotransferases are able to catalyse the first step of the catabolism
of most of the aminoacids. Aminotransferases are pyridoxal phosphate (PLP)-dependent
enzymes catalysing the transfer of the amino group of the aminoacid to α-keto glutarate
generating the corresponding α-ketoacid. The biochemical structure and functioning of
several aminotransferases have been well studied and classified. BATs essentially catalyse the
transamination of the branched-chain aminoacids leucine, isoleucine, and valine. Except for
the Escherichia coli and Salmonella proteins, which are homohexamers arranged as a double
trimer, BATs are homodimers. Structurally, the BATs belong to the fold type IV class of PLP
enzymes. Catalysis is on the re face of the PLP cofactor, whereas in other classes, catalysis
occurs from the si face of PLP. Crystal structures of the fold type IV proteins show that they
are distinct from the fold type I aspartate aminotransferase family and represent a new protein
fold. Because the fold type IV enzymes catalyze diverse reactions, it is not surprising that the
greatest structural similarities involve residues that participate in PLP binding rather than
residues involved in substrate binding (Hutson 2001). Since these enzymes have a wide
specificity of substrates, several enzymes can perform the transamination of the same
aminoacid. This is the case for L-methionine which has no specific aminotransferase to be
catabolized but relies on branched-chain aminoacid aminotransferases (BATs) or aromatic
acid aminotransferases (AROs).
BATs are widely distributed in the microbial kingdom, where they are involved in the
synthesis/degradation of branched-chain aminoacids. However, bacteria contain one single
BAT whereas, in eukaryotes, there are generally two isozymes, one is mitochondrial and the
other is cytosolic. In Y. lipolytica, two gene products belonging to the BAT protein family are
found as already shown in the yeast Saccharomyces cerevisiae. BAT1 encodes a protein with a
mitochondrial targeting sequence, whereas BAT2 encodes a cytoplasmic protein (Figure 4). In
S. cerevisiae, BAT1 and BAT2 have been reported as an ohnolog pair, which means that they
would result from a whole genome duplication (Byrne and Wolfe 2005).The ohnologs that
have undergone functional divergence are particularly interesting because they may indicate
the adaptation of a species to a certain environment or ecological niche.
RESULTATS-DISCUSSION_PARTIE I 109
A
E* R*
K* Y* E* N* v*t*R *
T*
E* R*
K* Y* E* N* v*t*R *
T*
B
Bat1-sace
Bat1-klla
Bat2-sace
Bat1-yali
Bat1-caal
Bat1-deha
Bat2-caal
Bat1-necr
Bca1-scpo
Bat2-yali
Bat2-necr
99
100
10092
9799
61
87
0,1
Figure 4: A: Alignments of branched-chain aminoacid aminotransferases. The sequences are as follows: Bat1-Sace (S. cerevisiae YHR208W); Bat2-sace (S. cerevisiae YJR148W); Bat1-klla (KLLA0A10307g); Bat1-yali (YALI0D01265g); Bat2-yali (YALI0F19910g); Bat1-caal (CaO19.797); Bat2-caal (CaO19.6994); Bat1-deha (DEHA2D06952p); Bca1-scpo (SPBC428.02c); Bat1-necr (NCU04754); Bat2-necr (NCU04292). The alignment created with clustalX was formatted using Genedoc 2.6. The positions interacting with the pyridoxal phosphate are indicated underneath in red. B: A tree of the selected BAT sequences built using the clustalX v1.81 software and the MEGA 3.1 package. The test of phylogeny was a bootstrap of the neighbour-joining test using the default values.
RESULTATS-DISCUSSION_PARTIE I 110
The mitochondrial location of BATs from Y. lipolytica was deduced from the presence of
an N-terminal extension enriched in serine, threonine and polar aminoacids. The aminoacid
sequences alignment of these genes with those of several other organisms has been performed
using the ClustalX multiple sequence alignment program. Residues identical or similar in all
proteins of these sequences are dashed in black (Figure 4A). Some species such as S.
cerevisiae or Y. lipolytica have two BAT genes, one with a mitochondrial targeting signal and
the second which is cytoplasmic. In other species, there is only one BAT gene and it has
either cytoplasmic features as in D. hansenii or mitochondrial features as in K. lactis,
suggesting that there is no preferential compartmentation for BAT. More precisely, it was
found that both Y. lipolytica BAT genes exhibited in conserved positions, all the aminoacid
residues interacting with the pyridoxal-phosphate attachment site deduced from structural
studies carried out on crystallized enzymes such as human BCAT1 and BCAT2 (Yennawar et
al. 2001). This was highlighted in the alignment. In ylBAT1, the residue Lys235 is involved in
the formation of the Schiff base intermediate with pyridoxal phosphate (Kispal et al. 1996).
Contrary to the aromatic aminoacid aminotransferases (see below), there is no BAT1 and
BAT2 aminotransferase subfamilies but one single family of branched aminoacid
aminotransferase. This was shown in the tree (Figure 4B) where the BAT sequences are
interspersed. For instance, several yeast species such as K. lactis, D. hansenii, Saccharomyces
kluyveri or Zygosaccharomyces rouxi having only a mitochondrial homologue are not
clustered, but species displaying this feature are dispersed along the clade of the
hemiascomycetous yeasts (Figure 4).
Concerning aromatic aminoacid aminotransferases, there is one homologue of ScARO8
and one homologue of ScARO9 in Y. lipolytica. In the euascomycetes clade, both genes can
be clustered in two subfamilies as shown on the tree (Figure 5B). Neither ARO8, nor ARO9
display any targeting signals. Their differences are scattered along the sequences (Figure 5A).
Moreover, ARO9 partners have a short N-terminal extension without identifiable function. In
S. cerevisiae, both ARO8 and ARO9 control aromatic aminoacid catabolism. In the case of D.
hansenii, only an ARO8 ortholog can be identified (Figure 5). According to Jensen and Wei
Gu (1996), they belong to the family I of the aminotransferases superfamily and anchor
residues involved mainly in pyridoxal phosphate binding can be easily identified and are
indicated on Figure 5.
RESULTATS-DISCUSSION_PARTIE I 111
A
Y* G N*P*tG
D* Y* SK* G R* g
R
Y* G N*P*tG
D* Y* SK* G R* g
RR
B
Aro8-sace
Aro8-cagl
Aro8-1-klla
Aro8-caal
Aro8-deha
Aro8-yali
Aro8-2-klla
Aro8-asni
Aro9-asni
Aro9-sace
Aro9-cagl
Aro9-klla
Aro9-caal
Aro9-yali
100
100
81
100
100
98
100
99
75
50
93
0.1
Figure 5: A: Alignments of the aromatic acid aminotransferases. The sequences are as follows: Aro8-sace (S. cerevisiae YGL202w); Aro9-sace (S. cerevisiae YHR137w); Aro8-cagl (CAGL0G01254g); Aro9-cagl (CAGL0G06028g); Aro8-1-klla (KLLA0F10021g); Aro8-2-klla (KLLA0A04906g); Aro9-klla (KLLA0D11110g); Aro8-deha (DEHA2A06886g); Aro8-caal (CaO19.9645); Aro9-caal (CaO19.1237); Aro8-yali (YALI0E20977g); Aro9-yali (YALI0C05258g); Aro8-asni (An02g05540); Aro9-asni (An09g05080). The alignment created with clustalX was formatted using Genedoc 2.6. The positions interacting with the pyridoxal phosphate are indicated underneath in red. R boxed in RED indicates a residue interacting with the substrate according Jensen et al.. B: A tree of the selected ARO sequences built using the clustalX v1.81 software and the MEGA 3.1 package. The test of phylogeny was a bootstrap of the neighbour-joining test using the default values.
RESULTATS-DISCUSSION_PARTIE I 112
5.4 Y. lipolytica transcriptome analysis in response to various sulphur sources.
The regulation of genes related to sulphur metabolism has been carried out in Y. lipolytica
in response to various sulphur sources, among others L-methionine which is the main sulphur
source in casein. Expression levels of several genes predicted to be associated with L-
methionine catabolism and pyruvate metabolism were simultaneously investigated at
transcriptional level in Y. lipolytica. Gene expression profilings were analyzed and compared
when Y. lipolytica cells were grown in a cheese-like medium under high L-methionine (HM)
or low L-methionine (LM) concentration (Cholet et al. 2008). In Cholet’s experiments, gene
expression was measured in late stationary phase when L-methionine was largely consumed.
A rearrangement in the expression of some genes was observed when the L-methionine
concentration was changed in the growth medium. Among them, the YlARO8, YlBAT1 and
YlBAT2 genes (predicted to be involved in amino acid transamination pathway) were found to
be modulated by L-methionine concentration, strongly suggesting their involvement in the L-
methionine transamination step in Y. lipolytica. The YlARO8 gene is the most strongly
modulated in HM medium. Furthermore, YlARO8 gene product has been overproduced in
Escherichia coli and purified. It was found that YlAro8p had transaminase activity and was
highly active on L-methionine.
Cholet et al. (2008) also reported that the YlBAT1 gene was highly induced by L-
methionine: it is in good agreement with results showing that the overexpression of the
YlBAT1 gene significantly increased L-methionine transamination as well as VSCs
production (Cernat Bondar et al. 2005). In contrast, the expression levels of YlARO9 gene
were hardly modulated by L-methionine concentration. However, the observation that the L-
methionine transamination step is highly active in Y. lipolytica was confirmed. A transient
accumulation of the transamination product − KMBA − was measured in HM medium, which
coincides with the maximum rate of L-methionine consumption and VSCs production.
In other experiments in progress in our laboratory (A. Hébert, PhD work), the regulation of
sulphur metabolism in response to various sulphur sources (eg: L-methionine, cystine,
sulphate) is being studied using an ORFeomic microarray containing the probes of all the
identified ORFs from the Y. lipolytica genome. The growth conditions were different from
Cholet’s experiments for which cells were grown on a cheese-like medium supplemented with
6.7 mM (LM) or 40.3 mM (HM) L-methionine in late stationary phase. The work of A.
Hébert was focused on the identification of the genes possibly induced by an excess of
sulphur substrates. The cells were grown on a chemically defined medium mimicking a
RESULTATS-DISCUSSION_PARTIE I 113
technological cheese medium and optimized to control its sulphur content. In this case, the
high L-methionine concentration was fixed to 10 mM and the low L-methionine concentration
was 10µM. The same concentrations ratios were used when comparing cystine and sulphate
as sulphur source. These concentrations allowed the same growth rate and the cultures were
kept to exponential phase for at least ten generations in order to get a steady state expression
level. Under such conditions, a few genes have their expression modified under high and low
sulphur concentration. However, ylBAT1 appeared the only aminotransferase to be induced
on L-methionine as well as on cystine although the BAT1 gene product should not be very
active on cystine.
6 Future perspectives
Owing to its metabolic features, the non-conventional yeast Y. lipolytica represents a
unique model microorganism which is also of great technological interest. This review shows
that the unique metabolism of Y. lipolytica - especially well adapted to milk derived media
such as cheese - is currently being investigated. This is now well established that this species
is a very efficient VSC producer compared to other yeasts (Cholet et al. 2007; Cholet et al.
2008).
A next step would be to study sulphur metabolism in an integrated way in pure culture by
comparative genomics (e.g., conservation of pathways, regulation), functional genomics using
the tools of molecular biology (eg gene expression), proteomics (eg synthesis of the
corresponding enzyme), and metabolomics (eg identification of metabolic intermediates). A
more in depth knowledge of sulphur metabolism and its regulation is currently under
investigation in this yeast. This will probably provide a better understanding of the metabolic
machinery of this atypical yeast and could be of great interest for the understanding of sulphur
metabolism in other microorganisms. Preliminary data strongly suggest that Y. lipolytica
obeys quite distinct regulation mechanisms – compared to other yeasts such as S. cerevisiae,
K. lactis or D. hansenii – when supplemented with various sulphur sources (eg L-methionine,
L-cysteine, sulphate). It may also be questioned whether VSCs are only secondary products
arising from sulphur aminoacids catabolism produced under conditions of relative abundance
of these amino-acids, or possess a still unidentified role in the cell life. Owing to the reductive
effect of many sulphur compounds, especially thiols, a possible role of VSCs could be a
regulative effect of the redox balance of the cell.
RESULTATS-DISCUSSION_PARTIE I 114
Another important step towards a better knowledge of the adaptative metabolism of Y.
lipolytica is to study this yeast in the presence of many other species of the cheese ecosystem.
It is therefore to be expected that its behaviour and metabolic adaptation may be dramatically
influenced by other microbial species, including other yeasts and bacteria (Mansour et al.
are emerging and surely will provide answers for the functional analysis of complex microbial
ecosystems in which Y. lipolytica is involved.
References
Arfi K, Landaud S, Bonnarme P (2006) Evidence for distinct L-methionine catabolic pathways in the yeast Geotrichum candidum and the bacterium Brevibacterium linens. Appl Environ Microbiol 72:2155-2162
Arfi K, Spinnler HE, Tâche R, Bonnarme P (2002) Production of volatile compounds by cheese-ripening yeasts: requirement for a methanethiol donor for S-methyl thioacetate synthesis by Kluyveromyces lactis. Appl Microbiol Biotechnol 58:503-510
Barnett JA, Payne RW, Yarrow D (2000) Yarrowia lipolytica in: Barnett JA, Payne RW, Yarrow D (ed) Yeasts: characteristics and identification, Third edition. Cambridge University Press, Cambridge, UK, pp 785-786
Barth G, Gaillardin C (1997) Physiology and genetics of the dimorphic fungus Yarrowia lipolytica. FEMS Microbiol. Rev. 19:219-237
Berger C, Martin N, Collin S, Gijs L, Khan JA, Piraprez G, Spinnler HE, Vulfson EN (1999) Combinatorial approach to flavor analysis: II. Olfactory investigation of a library of S-methylthioesters and sensory evaluation of selected components. J Agric Food Chem 47:3247-3279
Boelans MH, van Gemert LJ (1993) Sensory properties of optical isomers. Perfumer Flavorist 18:2-16
Bonnarme P, Amarita F, Chambellon E, Semon E, Spinnler HE, Yvon M (2004) Methylthioacetaldehyde, a possible intermediate metabolite for the production of volatile sulphur compounds from L-methionine by Lactococcus lactis. FEMS Microbiol Lett 236:85-90
Bonnarme P, Lapadatescu C, Yvon M, Spinnler HE (2001) L-methionine degradation potentialities of cheese-ripening microorganisms. J Dairy Res 68:663-674
Bonnarme P, Psoni L, Spinnler HE (2000) Diversity of L-methionine catabolism pathways in cheese-ripening bacteria. Appl Environ Microbiol 66 : 5514-5517
Byrne KP, Wolfe KH (2005) The Yeast Gene Order Browser: Combining curated homology and syntenic context reveals gene fate in polyploid species. Genome Res 15:1456-1461
Cernat Bondar D, Beckerich JM, Bonnarme P (2005) Involvement of a branched-chain aminotransferase in production of volatile sulfur compounds in Yarrowia lipolytica. Appl Environ Microbiol 71:4585-4591
RESULTATS-DISCUSSION_PARTIE I 115
Cholet O, Henaut A, Casaregola S, Bonnarme P (2007) Gene expression and biochemical analysis of cheese-ripening yeasts: focus on catabolism of L-methionine, lactate, and lactose. Appl Environ Microbiol 73:2561-2570
Cholet O, Henaut A, Hebert A, Bonnarme P (2008) Transcriptional analysis of L-methionine catabolism in the cheese-ripening yeast Yarrowia lipolytica in relation to volatile sulfur compound biosynthesis. Appl Environ Microbiol 74 :3356-3367
Corsetti A, Rossi J, Gobbetti M (2001) Interactions between yeasts and bacteria in the smear surface-ripened cheeses. Int J Food Microbiol 69:1-10
Cosentino S, Fadda ME, Deplano M, Mulargia AF, Palmas F. (2001) Yeasts associated with Sardinian ewe's dairy products. Int J Food Microbiol 69:53-58
Dujon B, Sherman D, Fischer C, Durrens P, Casaregola S, Lafontaine I, De Montigny J, Marck C, Neuveglise C, Talla E, Goffard N, Frangeul L, Aigle M, Anthouard V, Babour A, Barbe V, Barnay S, Blanchin S, Beckerich JM, Beyne E, Bleykasten C, Boisrame A, Boyer J, Cattolico L, Confanioleri F, De Daruvar A, Despons L, Fabre E, Fairhead C, Ferry-Dumazet H, Groppi A, Hantraye F, Hennequin C, Jauniaux N, Joyet P, Kachouri R, Kerrest A, Koszul R, Lemaire M, Lesur I, Ma L, Muller H, Nicaud JM, Nikolski M, Oztas S, Ozier-Kalogeropoulos O, Pellenz S, Potier S, Richard GF, Straub ML, Suleau A, Swennen D, Tekaia F, Wesolowski-Louvel M, Westhof E, Wirth B, Zeniou-Meyer M, Zivanovic I, Bolotin-Fukuhara M, Thierry A, Bouchier C, Caudron B, Scarpelli C, Gaillardin C, Weissenbach J, Wincker P, Souciet JL (2004) Genome evolution in yeasts. Nature 430:35-44
Dunn HC, Lindsay RC (1985) Evaluation of the role of microbial Strecker-derived aroma compounds in unclean-type flavors of cheddar cheese. J Dairy Sci 68: 2859-2874
for production of Danablu. Int Dairy J 10:263-270
Frank DC, Owen CM, Patterson J (2004) Solid phase microextraction (SPME) combined with gas-chromatography and olfactory-mass spectrometry for characterization of cheese aroma compounds. Lebensm Wiss u Technol 37:139-154
Guerzoni ME, Lanciotti R, Vannini L, Galgano F, Favati F, Gardini F, Suzzi G (2001) Variability of the lipolytic activity in Yarrowia lipolytica and its dependence on environmental conditions. Int J Food Microbiol 69:79-89
Hutson S (2001) Structure and function of branched chain aminotransferases. Progress in Nucleic Acids Research and Molecular Biology. 70:175-206.
Jensen RA, Wei Gu (1996) Evolutionary recruitment of biochemically specialized subdivisions of family I within the protein superfamily of aminotransferases. J Bacteriol 178:2161-2171
Kispal G, Steiner H, Courts DA, Rolinski B, Lill R (1996) Mitochondrial and cytosolic branched-chain amino acid transaminases from yeast, homologs of the myc oncogene-regulated Eca39 protein. J Biol Chem 271:24458-24464
Kubickova J, Grosch W (1998) Quantification of potent odorants in camembert cheese and calculation of their odour activity values. Int Dairy J 8:17-23
Lafaye A, Junot C, Pereira Y, Lagniel G, Tabet JC, Ezan E, Labarre J (2005) Combined proteome and metabolite-profiling analyses reveal surprising insights into yeast sulfur metabolism. J Biol Chem 280:24723–24730
RESULTATS-DISCUSSION_PARTIE I 116
Landaud S., Helinck S, Bonnarme P (2008) Formation of volatile sulfur compounds and metabolism of methionine and other sulfur compounds in fermented food. Appl Microbiol Biotechnol 77:1191-1205
López del Castillo-Lozano M, Tâche R, Bonnarme P, Landaud S (2007a) Evaluation of a quantitative screening method for hydrogen sulfide production by cheese-ripening microorganisms: the first step towards L-cysteine catabolism. J Microbiol Meth 69:70-77
López del Castillo-Lozano M, Delile A, Spinnler HE, Bonnarme P, Landaud S (2007b) Comparison of volatile sulphur compound production by cheese-ripening yeasts from methionine and methionine–cysteine mixtures. Appl Microbiol Biotechnol 75:1447-1454
Mansour S, Bailly J, Delettre J, Bonnarme P (2009a) A proteomic and transcriptomic view of amino acids catabolism in the yeast Yarrowia lipolytica. Proteomics 9:4714-4725
Mansour S, Bailly J, Landaud S, Monnet C, Sarthou AS, Cocaign-Bousquet M, Leroy S, Irlinger F, Bonnarme P (2009b) Investigation of associations of Yarrowia lipolytica, Staphylococcus xylosus, and Lactococcus lactis in culture as a first step in microbial interaction analysis. Appl Environ Microbiol 75:6422-6430
Martin N, Neelz V, Spinnler HE (2004) Suprathreshold intensity and odour quality of sulphides and thioesters. Food Qual Pref 15:247-257
Mounier J, Goerges S, Gelsomino R, Vancanneyt M, Vandemeulebroecke K, Hoste B, Brennan NM, Scherer S, Swings J, Fitzgerald GF, Cogan TM (2006) Sources of the adventitious microflora of a smear-ripened cheese. J Appl Microbiol 101:668-681
Mounier J, Monnet C, Jacques N, Antoinette A, Irlinger F (2009) Assessment of the microbial diversity at the surface of Livarot cheese using culture-dependent and independent approaches. Int J Food Microbiol 133:31-37
Mounier J, Monnet C, Vallaeys T, Arditi R, Sarthou AS, Helias A, Irlinger F (2008) Microbial interactions within a cheese microbial community. Appl Environ Microbiol 74:172-181
Spinnler HE, Berger C, Lapadatescu C, Bonnarme P (2001) Production of sulfur compounds by several yeasts of technological interest for cheese ripening. Int Dairy J 11:245-252
van den Tempel T, and Jakobsen M (2000) The technological characteristics of Debaryomyces hansenii and Yarrowia lipolytica and their potential as starter cultures for production of Danablu. Int Dairy J 10:263-270
Vermeulen C, Lejeune I, Tran T.T.H, Collin S (2006) Occurrence of polyfunctional thiols in fresh lager beers. J Agric Food Chem 54:5061-5068
Viljoen BC, Khoury AR, Hattingh A (2003) Seasonal diversity of yeasts associated with white-surface mould-ripened cheeses. Food Res Int 36:275-283
Wood AF, Aston JW, Douglas GK (1985) The determination of free aminoacids in cheese by capillary column gas liquid chromatography. Aust J Dairy Technol 40:166-169
Yennawar NH, Dunbar J, Conway ME, Hutson SM, Farber GK (2001) The structure of human mitochondrial branched-chain aminotransferase. Acta Crystallogr D 57:506-515
Yvon M, Rijnen L (2001) Cheese flavour formation by amino acid catabolism. Int Dairy J 11:185-201
RESULTATS-DISCUSSION_PARTIE I 117
I. C. Article n°2 : Biodiversité du métabolisme du soufre chez les levures
hémiascomycètes
Biodiversity in the sulfur metabolism in hemiascomycetous yeasts
Agnès Hébert, Serge Casaregola, Jean-Marie Beckerich§
UMR MICALIS, AgroParisTech-INRA, CBAI, BP 01, 78850 Thiverval Grignon, France
albicans. We also searched for genes involved in sulfur metabolism in two euascomycetes
Neurospora crassa and Emericella nidulans (Fitzpatrick et al, 2006). The genes of these two
RESULTATS-DISCUSSION_PARTIE I 119
fialamenous fungi were used both as outgroups and as internal controls of the distribution of
sulfur metabolism genes in ascomycetes, S. pombe being somewhat distantly related to the
hemiascomycetes.
Unless otherwise stated, genes and proteins names refer to S. cerevisiae. For each gene
studied, information on orthologues is available in additional file 1, ‘List of genes involved in
sulfur metabolism’, and additional file 2, ‘Table of proteins studied’. It is necessary to take
into account that the ancestor of S. cerevisiae and C. glabrata has undergone a whole genome
duplication (WGD), followed by massive differential gene loss. The genes duplicated during
this event are called ohnologues (Byrne & Wolfe, 2005). Since Candida albicans is a diploid
yeast, only one allele was utilized in order not to destabilize the phylogenetic trees obtained.
In this paper, we primarily deal with the following three topics: (1) sulfur metabolism on
the basis of three axes (sulfate assimilation, sulfur amino acid biosynthesis, the methionine
salvage pathway); (2) the sulfur amino acid catabolic pathway; and (3) regulatory proteins.
Candida albicans
Pichia stipitis
Debaryomyces hansenii
Yarrowia lipolytica
Lachancea kluyveri
Kluyveromyces thermotolerans
Kluyveromyces lactis
Eremothecium gossypii
Saccharomyces cerevisiae
Candida glabrata
Zygosaccharomyces rouxii
Figure 1 - Accepted phylogeny of the 11 hemiascomycetous yeasts
The tree was derived from Dujon (Dujon, 2006). The yeasts in the boxes are the three cheese ripening yeasts.
RESULTATS-DISCUSSION_PARTIE I 120
Sulfate assimilation
The first steps of sulfate assimilation: In S. cerevisiae, when sulfate is assimilated, it
cannot be directly used (Thomas & Surdin-Kerjan, 1997). Instead, sulfate needs to be
transformed into sulfide to be incorporated into a carbon chain. However, this reaction
requires several steps. In fact, the electropotential of sulfate is too strong to be directly
reduced by NADPH, therefore sulfate has to be activated in two steps by the ATP sulfurylase,
and the APS kinase (Fig. 2). The first enzyme (encoded by MET3) catalyzes the formation of
adenylyl sulfate (APS) from ATP and sulfate and the second (encoded by MET14) carries out
the phosphorylation of APS to yield PAPS. The latter compound has a sufficient
electropotential to be reduced by NADPH. Although the ATP sulfurylase sequences are
tightly conserved among the considered species, Y. lipolytica ATP sulfurylase displays a
divergent C-terminal end (from Gly426 to the end Asn572) from the other yeasts. The APS
kinase-related genes are highly conserved.
The reduction of PAPS involves two enzymes that act successively. These enzymes (Fig.
2) are the PAPS reductase (encoded by MET16), which produces sulfite, and the sulfite
reductase, which finally leads to the production of sulfide. The fungal PAPS reductase
enzymes present a divergent N-terminal sequence compared to that of yeasts, including an
insertion of about 30 amino acids. The sulfite reductase is composed of two subunits (encoded
by MET5 and MET10) (Fig. 2). Since PAPS is toxic when it is accumulated in the cell, its
concentration is regulated by the reverse reaction (Fig. 2) and catalyzed by the bisphosphate-
3'-nucleotidase (encoded by MET22). The characteristics of the D. hansenii orthologue were
extensively studied by Aggarwal et al. (Aggarwal et al., 2008), who linked this enzyme to the
high halotolerance of D. hansenii. C. albicans displays a duplication of the gene MET22.
Besides these peculiarities, all these genes could be found in the studied species, underlining
the importance of this system for yeasts.
The production of homocysteine: Homoserine corresponds to a crossroads between
sulfur and threonine metabolism. Three enzymes lead to homoserine production from
aspartate (Fig. 2): the aspartate kinase (encoded by HOM3), the aspartic semi-aldehyde
dehydrogenase (encoded by HOM2) and the homoserine dehydrogenase (encoded by HOM6).
The synthesis of homocysteine from homoserine requires the action of two enzymes. First, the
L-homoserine-O-acetyltransferase (encoded by MET2) synthesizes O-acetyl-homoserine.
Then, the O-acetyl homoserine sulphydrylase (encoded by MET17) catalyzes the reaction
between O-acetyl-homoserine and sulfide, which leads to the production of homocysteine
RESULTATS-DISCUSSION_PARTIE I 121
(Fig. 2). The good conservation of this pathway in all the organisms studied demonstrates the
importance of homocysteine, which is the base of the biosynthesis of sulfur amino acids. Only
C. albicans displays a duplication of the gene HOM3.
PAPS
SO42- int
APS
Sulfite
Sulfide
Siroheme
Uroporphyrinogen III
O-acetyl Homoserine
3 NADPH
MET19 (pentose P)
Homocysteine
Homoserine
Aspartate MET3
MET14 MET22
MET16
MET10MET5
MET17
MET2
NADPH
Figure 2 - Sulfate assimilation in hemiascomycetous yeasts
The gene names indicated in this figure are those of S. cerevisiae. The function of these genes is indicated in additional file 2: ‘Table of proteins studied’. This figure depicts the essential steps for the incorporation of sulfate into a carbon chain, leading to homocysteine production.
Siroheme biosynthesis: Met10p/Met5p sulfite reductase requires the synthesis of
siroheme to function (Hansen et al., 1997), since this heme is the only molecule known to
react with sulfite. In fact, siroheme possesses the exceptional capacity to perform the six-
electron reduction of sulfite to obtain sulfide (Murphy et al., 1974). The enzymes (Fig. 2)
involved in siroheme biosynthesis act on uroporphyrinogen III to produce siroheme in three
successive steps (Raux et al., 1999). First, MET1, which encodes the S-adenosyl-L-
methionine uroporphyrinogen III transmethylase activity, produces precorrin-2. Secondly,
MET8, which encodes the dehydrogenase and chelatase activities, produces sirohydrochlorin
and, finally, siroheme. All the genes coding for these enzymes were found in our species of
interest, MET1 being duplicated in D. hansenii.
NADPH supply: The glucose-6-phosphate dehydrogenase (encoded by MET19) (Fig. 2),
which is the first enzyme of the pentose-phosphate pathway, was previously described as an
enzyme involved in methionine metabolism (Masselot & De Robichon-Szulmajster, 1975). A
RESULTATS-DISCUSSION_PARTIE I 122
met19 mutant strain of S. cerevisiae requires an organic sulfur source such as methionine, S-
adenosylmethionine, cysteine, glutathione or homocysteine. The Met19p glucose-6-phosphate
dehydrogenase produces reduced NADPH, which is essential to the function of Met16p and
Met5-10p enzymes (Thomas et al., 1991). This key enzyme of the pentose phosphate pathway
and sulfur activation is highly conserved in the species tested. It is noteworthy that S. pombe
displays three glucose-6-phosphate dehydrogenases.
Sulfur amino acid biosynthesis
In S. cerevisiae, homocysteine is the central molecule in the biosynthesis of sulfur amino
acids, since it is (i) the starting point of the synthesis of cysteine by the transsulfuration
pathway and (ii) the substrate of cobalamin-independent methionine synthase (Suliman et al.,
2005), which produces methionine (Fig. 3).
Homocysteine
MethionineS-adenosyl methionine
S-adenosyl homocysteine
CystathionineCysteine
O-acetyl serine
Sulfide
Serine
MET6
STR3STR2
CYS3 CYS4
YGR012w
GlutathioneSAM1
SAM2
SAH1
γ-glutamylcysteine
GSH1
GSH2
MethyltransferasesMHT1
SAM4
Figure 3 - Methionine and cysteine synthesis in hemiascomycetous yeasts: similarities and divergences
The gene names indicated in this figure are those of S. cerevisiae. The function of these genes is indicated in additional file 2: ‘Table of proteins studied’. This figure represents methionine biosynthesis via the methyl cycle and cysteine biosynthesis via the transsulfuration pathway. The pathway that leads to glutathione production is also indicated. The enzyme of the OAS pathway that is absent in S. cerevisiae and C. glabrata is represented in gray.
RESULTATS-DISCUSSION_PARTIE I 123
The transsulfuration pathway: Two major pathways lead to cysteine: the transsulfuration
pathway and the O-acetyl-serine (OAS) pathway. S. pombe has an incomplete transsulfuration
pathway (Brzywczy et al., 2002). Only the synthesis of homocysteine from cysteine takes
place in this organism, but not the reverse reaction. Therefore, the supply of cysteine in S.
pombe relies on the OAS pathway. The OAS pathway (Fig. 3, in gray) is composed of two
enzymes, the cysteine synthase (encoded by YGR012w) and the serine-O-acetyltransferase.
There are two cysteine synthases in all of the organisms studied, but D. hansenii, C. glabrata
and S. cerevisiae have only one. The cysteine synthases can be separated into two groups. The
first, which is present in all the organisms studied, and the second, which is less conserved
(Brzywczy et al., 2007). Interestingly, the gene coding for the serine-O-acetyltransferase
enzyme is present in all the organisms studied, except S. cerevisiae and C. glabrata, the two
species that underwent WGD. This could be the result of a concerted loss as, for example,
already observed for specific pathways in C. glabrata (Dujon et al., 2004). This enzyme is
very different from serine-O-acetyltransferases with homology to the bacterial enzymes and
presents a strong sequence similarity with homoserine-O-acetyltransferases (Fig. 4)
(Grynberg et al., 2000). Phylogenetic analysis performed on the two groups of enzymes
strengthens our observations. This result indicates that the only functional pathway for the
cysteine synthesis in S. cerevisiae and C. glabrata is the transsulfuration pathway. To
reinforce this result, we searched for this gene in the 37 strains of S. cerevisiae and the 37
strains of Saccharomyces paradoxus, which were sequenced by the Saccharomyces
resequencing project at the Sanger Institute (Liti et al., 2009). We did not find orthologues in
any of these strains. There is a great deal of literature concerning this hypothetical pathway in
S. cerevisiae, with controversial results. A serine-O-acetyltransferase activity was described in
S. cerevisiae (Ono et al., 1999) in whole cell extract and was, consequently, not associated
with a gene. Furthermore, the genes CYS1 and CYS2, which are reported to encode the serine-
O-acetyl transferase activity, are not mapped in the S. cerevisiae genome, and Cherest et al.
(Cherest & Surdin-Kerjan, 1992) demonstrated that the OAS pathway is not functional in S.
cerevisiae.
RESULTATS-DISCUSSION_PARTIE I 124
Figure 4 - Phylogram of homoserine-O-acetyltransferases and of serine-O-acetyltransferases in hemiascomycetous yeasts.
The gene tree was constructed as described in Materials and methods. All positions containing gaps and missing data were eliminated from the dataset. The S. cerevisiae and C. glabrata homoserine-o-acetyltransferase genes are boxed. The branch length linking the families is shortened. Bar, 0.5 substitutions per site.
RESULTATS-DISCUSSION_PARTIE I 125
The transsulfuration pathway leads to the production of cysteine from homocysteine and
the reverse reaction, via cystathionine synthesis (Fig. 3). The two enzymes involved in
cysteine biosynthesis are the cystathionine beta-synthase (encoded by CYS4) and the
cystathionine gamma-lyase (encoded by CYS3). These enzymes are very well conserved in all
of the organisms studied, except S. pombe, as already shown.
The reverse reactions are successively due to a cystathionine gamma-synthase (encoded by
STR2) and a cystathionine beta-lyase (encoded by STR3). These genes are all present in the
studied species and interestingly, the STR2-like gene is duplicated in several species; there are
two orthologues in Kluyveromyces thermotolerans and three in N. crassa. C. glabrata
contains two STR2 ohnologues, whereas S. cerevisiae presents three orthologues of STR2, of
which YJR130C and YML082W are ohnologues. Two STR3 onhologues can be found in S.
cerevisiae.
This group of genes belongs to a protein family sharing a common motif linked to the use
of pyridoxal-5’-phosphate as a cofactor which is widespread from bacteria to higher
eukaryotes (see additional file 2: ‘Table of proteins studied’). In S. cerevisiae, this group is
composed of four genes involved in sulfur metabolism (MET17, CYS3, STR2 and STR3) and
one ORF with no associated function YHR112c (see additional file 1: ‘List of genes involved
in sulfur metabolism’). The YHR112c gene family is well conserved, with a sequence
similarity comprised between 43% and 73% over 98% of the sequence length, and it can
therefore be inferred that it is subjected to a strong selection pressure. This gene is not
essential in S. cerevisiae, but it could be involved in sulfur metabolism under as yet
unidentified growth conditions. This gene is duplicated in C. glabrata, Z. rouxii, D. hansenii
and E. nidulans further stressing its importance in the cell.
Gluthatione synthesis: Sulfur metabolism leads to the production of a key molecule
involved in the defense against oxidative stress, glutathione, from cysteine by way of γ-
glutamylcysteine (Fig. 3). This pathway is composed of the γ-glutamylcysteine synthetase
(encoded by GSH1) and the glutathione synthetase (encoded by GSH2), both present in the
studied organisms.
Methionine synthesis: Methionine is synthesized by cobalamin-independent methionine
synthase (encoded by MET6). To be functional, this enzyme needs the presence of
polyglutamate on the methyltetrahydrofolate. The acquisition of polyglutamate on
methyltetrahydrofolate involves four enzymes: the dihydrofolate reductase, two methylene
RESULTATS-DISCUSSION_PARTIE I 126
tetrahydrofolate reductases and the folylpolyglutamate reductase encoded respectively by
FOL3, MET12, MET13 and MET7 (Fig. 3) (Cherest et al., 2000).
Another important feature of sulfur metabolism is that methionine belongs to the methyl
cycle (Fig. 3), which produces S-adenosylmethionine (SAM ), the major donor of methyl in S.
cerevisiae (Katz et al., 2003). In S. cerevisiae, the methionine/SAM ratio is regulated
(Thomas et al., 2000) by MHT1 encoding the S-methylmethionine-homocysteine
methyltransferase and SAM4 encoding the S-adenosylmethionine-homocysteine
methyltransferase, which have been described as ohnologues. During methyl transfer
reactions, S-adenosylmethionine is transformed into S-adenosylhomocysteine. The latter
molecule is transformed into homocysteine by S-adenosyl-L-homocysteine hydrolase
(encoded by SAH1), ending the methyl cycle. The ensemble of these genes can be found in
one copy in the fungal species tested. However, S. cerevisiae carries two FOL3 ohnologues. S.
cerevisae and C. glabrata have two onhologues encoding S-adenosylmethionine synthetases.
C. glabrata does not possess the regulators MHT1 and SAM4.
Methionine salvage pathway
SAM is involved in polyamine biosynthesis (Fig.5). It is decarboxylated by the S-
adenosylmethionine decarboxylase (encoded by SPE2) to yield S-adenosylmethioninamine
which will be transformed into spermidine and spermine by the spermidine synthase and the
spermine synthase encoded by SPE3 and SPE4, respectively. Orthologues of SPE3 are present
in all the microorganisms studied, although SPE4 was not found in Eremothecium gossypii, S.
pombe, N. crassa or E. nidulans. In S. cerevisiae, spermidine is a polyamine essential for
growth (Hamasaki-Katagiri et al., 1997). In addition to the production of spermidine and
spermine, Spe3p and Spe4p produce methylthioadenosine, which is recycled into methionine
by the methionine salvage pathway.
The enzymes of this pathway were recently studied in detail by Pirkov et al. (Pirkov et al.,
2008) in S. cerevisiae (Fig. 5). The methionine salvage pathway is composed of five enzymes
(encoded by MEU1, MRI1, MDE1, UTR4 and ADI1), leading to the production of keto-methyl
thio butyrate (KMBA) from 5-methylthioadenosine. Each species has orthologues for each
reaction of the cycle except E. nidulans, which lacks the enzyme encoded by UTR4.
The last step of the methionine salvage pathway, which produces methionine from KMBA,
is carried out by a non-specific transaminase. On the basis of the results of Pirkov et al.
RESULTATS-DISCUSSION_PARTIE I 127
(Pirkov et al., 2008), the branched-chain amino acid aminotransferases and aromatic amino
acid aminotransferases are involved in this biosynthetic step as well as in the methionine
catabolic pathway. Since all the enzymes of the methionine salvage pathway have a
cytoplasmic location, the cytoplasmic aminotransferases should be involved in this
metabolism but not the mitochondrial ones.
MethionineS-adenosyl methionine
S-methyl 5 thio D-ribose 1-P
S-methyl 5 thio D-ribulose 1-P
SPE2
SPE3
MEU1
MRI1
MDE1
ADI1
S-adenosyl methionineamine
S-methyl 5 thioadenosine
2,3-Diketo-5-methyl-thiopentyl-
1-phosphate
1,2-Dihydroxy-3-keto-5-methyl-
thiopteneKMBA
UTR4
BAT1
BAT2
ARO8
ARO9
CSVs
Methanethiol
MethionalMethionolARO10
Thioesters
SAM1
SAM2
?
?
?
?
?
SPE4
Spermidine
Putrescine Spermidine
Spermine
Figure 5 - Methionine salvage pathway and production of volatile sulfur compounds in yeasts
The right side of this figure represents the methionine salvage pathway. On the left, we retrieve the first steps of volatile sulfur compound production. The arrows on the dotted line indicate steps for which no enzymes have yet to be attributed.
Sulfur amino acid catabolism/VSC production
The catabolism of sulfur amino acids has been less extensively studied, nevertheless, it
produces volatile sulfur compounds that are often important “character impact” compounds in
many fermented foods such as beer, wine and smear ripened cheese. Previous studies were
mainly focused on the identification and aromatic characterization of the sulfur compounds
involved in the aroma of these products. However, their biosynthetic pathways are far from
being understood (Fig. 5). Moreover, some steps seem to be purely spontaneous. A
comprehensive review of these aspects has been recently published (Landaud et al., 2008).
Despite our lack of knowledge, it is generally accepted that the catabolism of sulfur amino
acids is initiated by a transamination step. Nevertheless, no specific aminotransferase for
methionine has been identified in yeasts. This amino acid is therefore a substrate of enzymes
RESULTATS-DISCUSSION_PARTIE I 128
with a fuzzy specificity. Consequently, the effects of various transaminases were previously
studied in our laboratory (Bondar et al., 2005; Kagkli et al., 2006; Cholet et al., 2008). It was
demonstrated that methionine can be a substrate for branched-chain amino acid
aminotransferases and aromatic amino acid aminotransferases, and that an overexpression of
some of these genes leads to an increased production of volatile sulfur compounds.
In S. cerevisiae, two branched-chain amino acid aminotransferases, the mitochondrial
Bat1p and the cytoplasmic Bat2p, were described. Phylogenetic analysis of the all the Bat1p
and Bat2p could not differentiate two clear groups (data not shown). We consequently took
advantage of the presence/absence of the mitochondrial targeting sequence in this protein
family to classify these proteins. Like S. cerevisiae, C. glabrata, C. albicans and Y. lipolytica
display two enzymes with a different putative location. K. thermotolerans, K. lactis,
Zygosaccharomyces rouxii, D. hansenii and Lachancea kluyveri only have a single enzyme
with a mitochondrial targeting sequence. BAT2 of S. kluyveri was annotated as a pseudogene.
E. gossypii, D. hansenii and Pichia stipitis only have the cytoplasmic enzyme Bat2p, the latter
species carrying a duplication of this gene. The evolution of these genes in fungi is complex
and needs to be extensively explored in relation with the functions they are associated with.
In S. cerevisiae, there are two cytoplasmic aromatic amino acid aminotransferases, Aro8p
and Aro9p. Phylogenetic analysis of aromatic aminotransferases differentiated three groups of
proteins, one of them being associated to the S. cerevisiae ORF with no known function
YER152c. This group may be constituted of potential aromatic amino acids aminotransferases.
This gene is well conserved with one copy in each genome and a duplication in K.
thermotolerans. The strong conservation of this gene leads us to infer that this gene might
play an important role under specific conditions. All these aromatic transaminases seem to be
cytoplasmic except the Aro9p enzyme in Y. lipolytica, which presents a putative signal
sequence for mitochondrial location. In the ARO8 group, a duplication event apparently
occurred after the divergence of the group constituted of E. gossypii, K. lactis, K.
thermotolerans and L. kluyveri, but just before the divergence of these species from each
other, since there are two ARO8 orthologues in each of them (Fig. 6). At least one copy of
ARO8 is in fact present in all the tested species. The presence of the gene ARO9 seems to
follow different routes. In fact, this gene has been lost in two species, E. gossypii and D.
hansenii, and has been duplicated in P. stipitis.
RESULTATS-DISCUSSION_PARTIE I 129
Figure 6 - Phylogram of the aminotransferases of the Aro8p and Aro9p families and of the related Yer152cp-like family in hemiascomycetous yeasts.
The gene tree was constructed as described in Material and methods. All positions containing gaps and missing data were eliminated from the dataset. The S. cerevisiae proteins are boxed. Bar, 0.5 substitutions per site.
We identified three combinations of the five enzymes described above (Bat1p, Bat2p,
Aro8p, Aro9p, Yer152cp) in the hemiascomycetes. The first, which has all five of these
enzymes, is found in S. cerevisiae, C. glabrata, P. stipitis, C. albicans and Y. lipolytica. The
second, observed in Z. rouxii, K. thermotolerans, L. kluyveri and K. lactis, has all the enzymes
except Bat2p. The third lacks Bat1 and Aro9 and is found in E. gossypii and D. hansenii. .
RESULTATS-DISCUSSION_PARTIE I 130
This reveals that two enzymes are always present in all these yeasts: Aro8p and Yer152cp,
stressing the importance of the aminotransferase, Aro8p, and of the protein of unknown
function, Yer152cp. We observed that each of the three technological yeasts, K. lactis, D.
hansenii and Y. lipolytica, have a different profile for aminotransferases. This could be
indicative of different potentialities for the biosynthesis of volatile sulfur compounds in these
three yeasts.
Methional is an important molecule for cheese flavor. This sulfur compound is a product of
methionine degradation from KMBA, the first intermediary of methionine catabolism. In S.
cerevisiae, the phenylpyruvate decarboxylase encoded by ARO10 is thought to be responsible
for this reaction (Vuralhan et al., 2003, 2005). The phenylpyruvate decarboxylase is
conserved in the 14 fungi of this study. The gene that we identified as ARO10 in Y. lipolytica
has been previously annotated as a PDC6 orthologue. However, in light of our results, it
seems that the gene YALI0D6930g is not the orthologue of the minor isoenzyme of pyruvate
decarboxylase PDC6, but of the phenylpyruvate decarboxylase ARO10. Y. lipolytica
possesses one ORF YALI0D10131g that produces a good alignment with the three genes of
the pyruvate decarboxylases of S. cerevisiae (PDC1, PDC5 and PDC6). This enzyme has
been described as an orthologue of PDC1, but seems to be closer to PDC6 according to this
study (data not shown).
Regulatory proteins
In S. cerevisiae, the main regulator of transcription Met4p is regulated by the methionine
and cysteine pools. This regulator not only plays a central role in the regulation of the sulfur
amino acid biosynthetic pathway, but in the cell cycle as well. It is assisted in its functions by
a number of regulatory cofactors: Met28p, Met31p/Met32p, Cbf1p and SCFMet30. The latter is
an ubiquitination complex composed of Skp1p, Cdc53p, Cdc34p, Rbx1p and Met30p as
specific components. Models of regulation of cell metabolism by Met4p and its partners have
been proposed (Chandrasekaran & Skowyra, 2008).
The majority components of the SCFMet30 complex are highly conserved. It can be
observed that there is no orthologue of RBX1 in the N. crassa genome. CDC53 is slightly less
conserved than other components of the SCFMet30 complex, with sequence similarities in the
same range as that of MET31/MET32. MET31 and MET32 are ohnologues and are also
retrieved in C. glabrata. It can be observed that MET31/MET32 appears to be absent or too
RESULTATS-DISCUSSION_PARTIE I 131
divergent in the S. pombe genome. CBF1 is conserved in all of the species studied, but the
BlastP analysis reveals a sequence alignment only in the C-terminal region.
In S. cerevisiae, Met4p is a 672 amino acid-long polypeptide that can be split into
functional domains (Kuras & Thomas, 1995). These domains are involved in transcriptional
activation, ubiquitinylation, interaction with the negative regulator Met30p, interaction with
the Met31p/Met32p dimer and interaction with Met28p. The Met4p sequence also presents a
degenerated leucine zipper (BZIP). This BZIP motif is not canonical since it is disrupted by a
large insertion (D504 to Q599).
Met4p orthologues display large differences among the species studied. The family of
MET4-related genes can be separated into two sub-families: a family of large polypeptides
related to S. cerevisiae Met4p of about 670 to 710 amino acids, and a family of shorter
polypeptides ranging from 319 to 371 amino acids, including D. hansenii and Y. lipolytica.
This second family is related to fungal regulators such as CYS3 and METR from N. crassa and
E. nidulans, respectively. We can ask whether or not these orthologues carry all the
interaction domains such as Met4p from S. cerevisiae.
One argument for the conservation of these interactions is that the partners of Met4p are
globally conserved except for Met28p, which appeared to be absent in the clade of the short-
length Met4p sub-family (see additional file 3: ‘Summary of regulatory proteins studied’).
However, the shorter Met4p sequences display a canonical BZIP motif with a basic region,
allowing direct interaction with DNA, and a leucine zipper required for dimerization. It can be
hypothesized that the shorter Met4p homologues with a complete B-ZIP domain can directly
interact with DNA but do not depend on Met28p function. Therefore, Met28p which is not
conserved in the studied species appeared to play an ancillary function.
The activation motif of S. cerevisiae (D82 to F100), which is highly conserved in neighbor
species, is retrieved in D. hansenii (D23 to L41) but not in Y. lipolytica. On the contrary, the
motif upstream from the ubiquitinylated lysine (K163 in S. cerevisiae) appeared to be well
conserved among yeast species by homology and by hydrophobic cluster analysis (data not
shown). The Met31p/Met32p binding domain of S. cerevisiae (L376 to H397) relatively well
matches the L182 to Q203 region of D. hansenii. However, it is difficult to identify the sites of
interaction with these regulators when distant Met4p orthologues are analyzed. For instance,
in Y. lipolytica, it only can be hypothesized that the domain from Q193 to Q205 is related to the
domain from Q191 to Q203 in D. hansenii.
RESULTATS-DISCUSSION_PARTIE I 132
In conclusion, it seems that the co-regulation network depicted in S. cerevisiae is
conserved in all the yeast species although there is a very large variation in size and a wide
divergence in the main component Met4p. It is clear that these hypotheses should be validated
by mutagenesis experiments.
Conclusions
An overview of the sulfur amino acid pathways in hemiascomycetous yeasts was
generated. It was important to investigate if the wealth of data accumulated in the model yeast
Saccharomyces cerevisiae can be extended to species as distant of S. cerevisiae as Yarrowia
lipolytica which have diverged from their common ancestor more than 600 million years ago.
By and large, the pathways appeared to be conserved even beyond the yeast world in the
whole phylum of fungi. This is probably foreseeable as this pathway plays a central role in the
general metabolism and in the homeostasis of the cell.
Moreover, we propose that the regulation network in charge of the sulphur amino acids
biosynthesis and its central component Met4p are conserved from S. cerevisiae to fungi. The
Kluyveromyces clade and the Saccharomyces senso lato have undergone a genetic event
leading to the impairment of the B-ZIP motif of the regulator and need therefore the
mediation of a B-ZIP partner of the MET28p family to bind the Met4p DNA targets. All the
other partners appeared to be conserved along the evolutionary tree, especially MET31 and
MET30 which are playing a central role in the specificity of the regulation.
The majority of the studied species possess two pathways leading to cysteine production,
the transsulfuration pathway and the OAS pathway, except S. cerevisiae and C. glabrata that
only display the transsulfuration pathway, and S. pombe that only has the OAS pathway
(Table 1).
Sulfate activation pathway
Transsulfuration pathway from
homocysteine to cysteine
Transsulfuration pathway from
cysteine to homocysteine
O-acetyl-serine pathway
WGD group (S. cerevisiae/C. glabrata) + + + - Other hemiascomycetes + + + + Ascomycetes fungi + + + + Schizosaccharomyces pombe + - + +
Table 1. Summary of the components of the sulphur aminoacids pathway highlighting the differences in the cysteine synthesis according to the clades of yeast.
RESULTATS-DISCUSSION_PARTIE I 133
The study of the gene families involved in this metabolism conducted to the identification
of well conserved gene families without described function although they are highly
conserved and that they diverge at the same speed as the essential genes of the pathway. This
is the case for YHR112c gene family belonging to the family of the PLP dependent enzymes
such as the CYS3, STR2, STR3 and MET17 gene families. This is also the case in the catabolic
pathway for the YER152c gene family related to the aromatic amino acid aminotransferase
families without identified function in S. cerevisiae. Their conservation during the evolution
leads to propose for them an important role in the metabolism of the sulfur compounds.
Concerning the catabolism of sulfur amino acids that leads to the production of VSC, the
technological yeasts, K. lactis, D. hansenii and Y. lipolytica, have different sets of enzymes
which should account for the difference in aroma production observed between these species.
The results of this work remain to be confirmed by genetic and molecular studies.
Methods
Sulfur metabolism data
Data on sulfur metabolism from several databases including the Saccharomyces Genome
Database (SGD: http://www.yeastgenome.org/) for S. cerevisiae and the KEGG database
(http://www.genome.jp/kegg/) that regroups enzymatic activities of various species were
combined.
Search for orthologues
Orthologues were searched for in complete genome databases using the BLASTP
algorithm with the S. cerevisiae and the S. pombe protein sequences of interest as bait.
Searches were completed using sequences from other genomes as bait. Further searches were
performed on complete genome sequences using TBLASTN. The sources of complete
sequences were SGD (http://www.yeastgenome.org/) for S. cerevisiae, Genolevures
(http://www.genolevures.org/) for Yarrowia lipolytica, Kluyveromyces lactis,
Additional files Additional file 1 –List of genes involved in sulfur metabolism in each species studied
A: table of gene names involved in sulfur metabolism
B: table of Swissprot accession numbers for proteins involved in sulfur metabolism
N.D.: not determined.
Additional file 2 –Table of proteins studied
This table regroups the function of each protein of sulfur metabolism included in this study and the description of the pfam motif, if any, contained in each sequence. Minimum: indicates the frequency of the motif in the genome in which it is the least represented. Maximum: indicates the frequency of the motif in the genome in which it is the most represented.
Additional file 3 –Summary of regulatory proteins studied
This table represents the sequence similarity percentages for each regulatory protein studied, in comparison with S. cerevisiae. The percentages indicated for the MET31/MET32 column were generated using the Met31p sequence.
RESULTATS-DISCUSSION_PARTIE I 135
List of genes involved in sulfur metabolism in each species studiedA (1/7)
S. cerevisiae gene name LOCUS Prefix MET 3 MET 14 MET 22 MET 16 MET5 MET 10 MET 17 MET 2
S. cerevisiae YJR010W YKL001C YOL064C YPR167C YJR137C YFR030W YLR303W YNL277W
Aggarwal M, Mondal AK & Kishan KVR (2008) Creation of salt-insensitive 3'(2'),5'-bisphosphate nucleotidase by modeling and mutagenesis approach. Arch. Biochem. Biophys. 469: 174-183.
Baudouin-Cornu P & Labarre J (2006) Regulation of the cadmium stress response through SCF-like ubiquitin ligases: comparison between Saccharomyces cerevisiae, Schizosaccharomyces pombe and mammalian cells. Biochimie 88: 1673-85.
Bonaïti C, Irlinger F, Spinnler HE & Engel E (2005) An iterative sensory procedure to select odor-active associations in complex consortia of microorganisms: application to the construction of a cheese model. J. Dairy Sci. 88: 1671-84.
Bondar DC, Beckerich JM & Bonnarme P (2005) Involvement of a branched-chain aminotransferase in production of volatile sulfur compounds in Yarrowia lipolytica. Appl. Environ. Microbiol. 71: 4585-91.
Brzywczy J, Natorff R, Sieńko M & Paszewski A (2007) Multiple fungal enzymes possess cysteine synthase activity in vitro. Res. Microbiol. 158: 428-36.
Brzywczy J, Sieńko M, Kucharska A & Paszewski A (2002) Sulphur amino acid synthesis in Schizosaccharomyces pombe represents a specific variant of sulphur metabolism in fungi. Yeast 19: 29-35.
Byrne KP & Wolfe KH (2005) The Yeast Gene Order Browser: combining curated homology and syntenic context reveals gene fate in polyploid species. Genome Res. 15: 1456-1461.
Chandrasekaran S & Skowyra D (2008) The emerging regulatory potential of SCFMet30 -mediated polyubiquitination and proteolysis of the Met4 transcriptional activator. Cell Div. 3: 11.
Cherest H & Surdin-Kerjan Y (1992) Genetic analysis of a new mutation conferring cysteine auxotrophy in Saccharomyces cerevisiae: updating of the sulfur metabolism pathway. Genetics 130: 51-8.
Cherest H, Thomas D & Surdin-Kerjan Y (2000) Polyglutamylation of folate coenzymes is necessary for methionine biosynthesis and maintenance of intact mitochondrial genome in Saccharomyces cerevisiae. J. Biol. Chem. 275: 14056-63.
Cholet O, Hénaut A, Hébert A & Bonnarme P (2008) Transcriptional analysis of L-methionine catabolism in the cheese-ripening yeast Yarrowia lipolytica in relation to volatile sulfur compound biosynthesis. Appl. Environ. Microbiol. 74: 3356-67.
Dereeper A et al. (2008) Phylogeny.fr: robust phylogenetic analysis for the non-specialist. Nucleic Acids Res 36: W465-469.
Dujon B (2006) Yeasts illustrate the molecular mechanisms of eukaryotic genome evolution. Trends. Genet. 22: 375-87.
Dujon B et al. (2004) Genome evolution in yeasts. Nature 430: 35-44.
Edgar RC (2004) MUSCLE: multiple sequence alignment with high accuracy and high throughput. Nucleic Acids Res 32: 1792-1797.
Fauchon M et al. (2002) Sulfur sparing in the yeast proteome in response to sulfur demand. Mol. Cell 9: 713-23.
Fitzpatrick DA, Logue ME, Stajich JE & Butler G (2006) A fungal phylogeny based on 42 complete genomes derived from supertree and combined gene analysis. BMC Evol. Biol.
RESULTATS-DISCUSSION_PARTIE I 152
6: 99.
Fontecave M, Atta M & Mulliez E (2004) S-adenosylmethionine: nothing goes to waste. Trends. Biochem. Sci. 29: 243-9.
Grynberg M, Topczewski J, Godzik A & Paszewski A (2000) The Aspergillus nidulans cysA gene encodes a novel type of serine O-acetyltransferase which is homologous to homoserine O-acetyltransferases. Microbiology 146 ( Pt 10): 2695-703.
Guindon S & Gascuel O (2003) A simple, fast, and accurate algorithm to estimate large phylogenies by maximum likelihood. Syst. Biol 52: 696-704.
Hamasaki-Katagiri N, Tabor CW & Tabor H (1997) Spermidine biosynthesis in Saccharomyces cerevisae: polyamine requirement of a null mutant of the SPE3 gene (spermidine synthase). Gene 187: 35-43.
Hansen J, Muldbjerg M, Chérest H & Surdin-Kerjan Y (1997) Siroheme biosynthesis in Saccharomyces cerevisiae requires the products of both the MET1 and MET8 genes. FEBS Lett. 401: 20-24.
Kagkli DM, Bonnarme P, Neuvéglise C, Cogan TM & Casaregola S (2006) L-methionine degradation pathway in Kluyveromyces lactis: identification and functional analysis of the genes encoding L-methionine aminotransferase. Appl. Environ. Microbiol. 72: 3330-5.
Katz JE, Dlakić M & Clarke S (2003) Automated identification of putative methyltransferases from genomic open reading frames. Mol. Cell. Proteomics 2: 525-40.
Kuras L & Thomas D (1995) Functional analysis of Met4, a yeast transcriptional activator responsive to S-adenosylmethionine. Mol. Cell. Biol. 15: 208-216.
Landaud S, Helinck S & Bonnarme P (2008) Formation of volatile sulfur compounds and metabolism of methionine and other sulfur compounds in fermented food. Appl. Microbiol. Biotechnol. 77: 1191-205.
Liti G et al. (2009) Population genomics of domestic and wild yeasts. Nature 458: 337-341.
Masselot M & De Robichon-Szulmajster H (1975) Methionine biosynthesis in Saccharomyces cerevisiae. I. Genetical analysis of auxotrophic mutants. Mol. Gen. Genet. 139: 121-132.
Murphy MJ, Siegel LM, Tove SR & Kamin H (1974) Siroheme: A New Prosthetic Group Participating in Six-Electron Reduction Reactions Catalyzed by Both Sulfite and Nitrite Reductases. Proceedings of the National Academy of Sciences of the United States of America 71: 612-616.
Ono BI, Hazu T, Yoshida S, Kawato T, Shinoda S, Brzvwczy J & Paszewski A (1999) Cysteine biosynthesis in Saccharomyces cerevisiae: a new outlook on pathway and regulation. Yeast 15: 1365-75.
Perpète P, Duthoit O, De Maeyer S, Imray L, Lawton AI, Stavropoulos KE, Gitonga VW, Hewlins MJE & Dickinson JR (2006) Methionine catabolism in Saccharomyces cerevisiae. FEMS Yeast Res. 6: 48-56.
Perrière G & Gouy M (1996) WWW-query: an on-line retrieval system for biological sequence banks. Biochimie 78: 364-369.
Pirkov I, Norbeck J, Gustafsson L & Albers E (2008) A complete inventory of all enzymes in the eukaryotic methionine salvage pathway. FEBS J. 275: 4111-20.
RESULTATS-DISCUSSION_PARTIE I 153
Raux E, McVeigh T, Peters SE, Leustek T & Warren MJ (1999) The role of Saccharomyces cerevisiae Met1p and Met8p in sirohaem and cobalamin biosynthesis. Biochem. J. 338 ( Pt 3): 701-8.
Suliman HS, Sawyer GM, Appling DR & Robertus JD (2005) Purification and properties of cobalamin-independent methionine synthase from Candida albicans and Saccharomyces cerevisiae. Archives of Biochemistry and Biophysics 441: 56-63.
Thomas D, Becker A & Surdin-Kerjan Y (2000) Reverse methionine biosynthesis from S-adenosylmethionine in eukaryotic cells. J. Biol. Chem. 275: 40718-24.
Thomas D, Cherest H & Surdin-Kerjan Y (1991) Identification of the structural gene for glucose-6-phosphate dehydrogenase in yeast. Inactivation leads to a nutritional requirement for organic sulfur. EMBO J. 10: 547–553.
Thomas D & Surdin-Kerjan Y (1997) Metabolism of sulfur amino acids in Saccharomyces cerevisiae. Microbiol. Mol. Biol. Rev. 61: 503-32.
Vuralhan Z et al. (2005) Physiological characterization of the ARO10-dependent, broad-substrate-specificity 2-oxo acid decarboxylase activity of Saccharomyces cerevisiae. Appl. Environ. Microbiol. 71: 3276-84.
Vuralhan Z, Morais MA, Tai S, Piper MDW & Pronk JT (2003) Identification and characterization of phenylpyruvate decarboxylase genes in Saccharomyces cerevisiae. Appl. Environ. Microbiol. 69: 4534-41.
Authors' contributions AH was responsible for the initial phylogenetic studies, tree analysis, manuscript and
figure preparation. JMB generated and analyzed the results concerning regulatory proteins, and participated in the writing of the manuscript. SC provided his expertise for the data analysis and the manuscript editing. All authors read and approved the manuscript.
Acknowledgements We would like to thank Sophie Landaud for helpful comments on the manuscript, and the
PNRA (French National Research Agency: www.agence-nationale-recherche.fr) for the financing of the EcoMet project (ANR-06-PNRA-014).
RESULTATS-DISCUSSION_PARTIE I 154
I. D. Conclusion
Nous avons étudié l’évolution du métabolisme du soufre à travers le phylum des levures
hémiascomycètes. Lors de la reconstruction des voies métaboliques, nous avons constaté que
ce métabolisme est bien conservé chez les micro-organismes étudiés.
Cependant, nous avons pu identifier des différences majeures, notamment au niveau de la
biosynthèse de la cystéine. Comme les champignons E. nidulans et N. crassa, la plupart des
espèces de levure possèdent deux voies menant à la production de cystéine, la voie de
transsulfuration inverse et la voie de l’O-acétyl-sérine (OAS). Seules les levures étudiées
ayant effectué la Whole Genome Duplication (WGD), S. cerevisiae et C. glabrata, ne
présentent que la voie de transsulfuration inverse. S. pombe, qui possède seulement la voie de
l’OAS, reste une exception isolée.
Bien que l’activateur transcriptionnel du métabolisme du soufre Met4p soit présent dans
tous les micro-organismes étudiés, son interaction à l’ADN semble se faire soit directement,
soit via Met28p. Hormis cette différence, tous les partenaires de Met4p et ainsi que leur
domaines d’interaction semblent être conservés, suggérant le maintien des mécanismes de
régulation dans la totalité du phylum.
Nous avons mis en évidence deux familles de gènes conservés de fonction non définie chez
S. cerevisiae mais présentant des similarités de séquence avec des gènes de la biosynthèse et
du catabolisme des acides aminés respectivement. La découverte de ces gènes,
potentiellement impliqués dans le métabolisme du soufre, ouvre de nouvelles perspectives
pour l’étude de ce métabolisme.
Nous avons réalisé pour la première fois une étude phylogénétique du catabolisme des
acides aminés soufrés. Nous avons constaté que, bien que ce phénomène soit conservé, le set
d’enzymes impliquées diverge d’un micro-organisme à l’autre. Ceci pourrait être une piste
pour expliquer les différentes capacités aromatiques des espèces de levures possédant un
intérêt technologique.
RESULTATS-DISCUSSION_PARTIE II 155
II. Influence de l’apport soufré sur le métabolisme du soufre chez les
levures Kluyveromyces lactis et Yarrowia lipolytica
II. A. Introduction
L’analyse in silico nous a permis de reconstruire les voies du métabolisme du soufre chez
les levures hémiascomycètes, nous donnant ainsi accès à une base solide pour poursuivre
notre étude. Nous avons choisi d’étudier le métabolisme du soufre chez deux levures
technologiques phylogénétiquement éloignées et possédant un métabolisme global très
différent : Kluyveromyces lactis et Yarrowia lipolytica. Lors de cette étude, nous avons
combiné plusieurs approches exploratoires :
Le transcriptome : Après avoir identifié les gènes du métabolisme du soufre, nous avons
souhaité observer leur expression. En commençant cette étude, nous disposions déjà d’une
puce à ADN du génome de Y. lipolytica (Eurogentec). Il nous manquait cependant une puce
complète du génome de K. lactis. Ce travail de thèse a été réalisé dans le cadre du projet
« Ecosystème fromager étude du Métabolisme du soufre » (EcoMet) financé par l’Agence
Nationale de la Recherche (ANR). Par conséquent, ce projet a impliqué de nombreux
partenaires, dont Valentin LOUX (INRA, Unité MIG) qui a mis au point le set
d’oligonucléotides du génome de K. lactis nécessaire à la fabrication des puces (Agilent),
ainsi que Julie AUBERT (AgroParisTech-INRA, Unité MIA) avec qui nous avons collaboré
lors de l’analyse statistique des résultats transcriptomiques. Les résultats transcriptomiques
ont été validés par PCR quantitative.
Le métabolome : Nous avons choisi d’associer l’étude du métabolome à celle du
transcriptome, afin d’estimer les variations des concentrations intracellulaires de métabolites
en relation avec le métabolisme du soufre. Cette étude a été réalisée dans un but exploratoire
afin de mettre en évidence le maximum de molécules soufrées. Nous avons donc choisi
d’utiliser un analyseur de type Orbitrap, qui permet d'accéder à la mesure de masse précise de
chaque composé et par conséquent à sa composition élémentaire. Le plan d’expérience utilisé
dans ce travail (voir ci-dessous) étant basé sur la comparaison relative entre différentes
conditions, nous n’avons pas réalisé de quantification absolue.
La colonne utilisée favorise la séparation des composés polaires, dont font partie les
RESULTATS-DISCUSSION_PARTIE II 156
composés soufrés recherchés. Nous nous sommes confrontés au problème des molécules
isomères, de même composition élémentaire mais de structure différente. Nous avons
cependant pu distinguer le glutamate de l’O-acétylsérine ainsi que l’O-acétylhomosérine de
l’acide aminoadipique par MSn, grâce à l’absence et à la présence du fragment discriminant
acétyl respectivement. Ainsi, nous avons pu confirmer l’absence d’O-acétylsérine et la
présence d’O-acétylhomosérine dans les échantillons étudiés.
La validation de l’identification des molécules a été faite selon plusieurs critères : (i) la
masse précise et la détection des composés isobares, (ii) la concordance avec la base de
données spectrales du laboratoire (iii) l’identification dans les banques publiques (iiii) la
réalisation d'expériences complémentaire de fragmentations séquentielles de type MSn. Ces
études ont été réalisées sous la direction de notre partenaire Christophe JUNOT (CEA,
DSV/iBiTec-S/SPI).
Nous avons constaté que l’ionisation en mode positif, qui génère des ions pseudo-
moléculaires protonés, était plus favorable à la détection des molécules soufrées que
l’ionisation en mode négatif, qui génère des ions pseudo-moléculaires déprotonés dans les
conditions utilisées. Nous présenterons donc uniquement les résultats obtenus lors de
l’ionisation en mode positif.
Parmi les 4252 signaux détectés, nous avons recherché les molécules connues liées au
métabolisme du soufre. Nous avons ensuite analysé les résultats en réalisant des analyses en
composantes principales (ACP). Lors de cette étude, 382 signaux étaient significatifs pour au
moins une des conditions utilisées. Lors de l’analyse de ces 382 signaux, nous avons identifié
268 composés, parmi lesquels nous avons retrouvé tous les composés liés au soufre. La
grande majorité des 268 composés reste encore non identifiée. Nous avons cependant constaté
la présence de nombreux acides aminés parmi ces composés discriminants. Au sein des
composés inconnus, nous avons recherché les molécules soufrées en recherchant la présence
de l’isotope S34 (défaut de masse de 1.9959, 4.43% du pic principal) au niveau des spectres de
masse. Nous avons retrouvé deux composés soufrés, le premier étant non identifiable par des
expériences de type MSn, le deuxième pouvant être du glutathion oxydé par une fonction –
SH, comme le suggère la masse et la perte deS2H.
Le résultat le plus remarquable de cette analyse est la détection de deux composés soufrés
uniquement chez Y. lipolytica : la taurine et l’hypotaurine. Ceci révèle d’importantes
différences métaboliques entre les deux levures étudiées.
RESULTATS-DISCUSSION_PARTIE II 157
La détection des composés soufrés volatils : L’analyse par Chromatographie en phase
Gazeuse couplée à la Spectrométrie de Masse (GC-MS) nous a permis de compléter les
données métabolomiques par la détection des composés soufrés volatils produits dans chaque
condition étudiée. Le principal obstacle que nous avons rencontré lors de cette analyse est la
production d’éthanol par K. lactis. En effet, la colonne capillaire utilisée pour ce genre
d’analyse n’est pas adaptée à la présence de composés volatils en concentration supérieure au
g/L. Le pic d’éthanol s’étend donc sur une partie du spectre et masque probablement les pics
de certaines molécules d’intérêt.
Cette analyse par GC-MS a été complétée par l’utilisation d’un protocole spécifique à la
détection de l’H2S. En effet, cette molécule, d’un intérêt non négligeable pour nos travaux,
n’est pas détectable par les équipements de GC-MS disponibles au laboratoire.
Plan d’expérience : Pour réaliser cette étude nous avons fixé avec précision les conditions
expérimentales. Tout d’abord, nous avons choisi d’utiliser un milieu chimiquement défini
(MCD, ou SM en anglais) plutôt que la matrice fromagère de manière à : (i) maîtriser la
composition du milieu, (ii) faciliter l’extraction des ARN et des métabolites, (iii) avoir une
grande souplesse au niveau de l’apport en soufre. La composition du milieu MCD est décrite
dans la Fiche n°1 : Milieu Chimiquement Défini (MCD)
Notre plan d’expérience consiste à utiliser indépendamment trois sources de soufre
(méthionine, cystine et sulfate d’ammonium) en comparant l’effet de leur présence à une
concentration élevée versus une concentration faible (facteur 1000), afin de mettre en
évidence les voies du catabolisme versus de la biosynthèse des acides aminés soufrés. Nous
avons maintenu les levures en début de phase exponentielle durant 10 générations par
repiquage pour les stabiliser dans un état physiologique précis et ainsi obtenir des conditions
répétables et sans stress.
Les résultats obtenus sont présentés en deux publications distinctes, la première portant sur
K. lactis et la seconde sur Y. lipolytica.
RESULTATS-DISCUSSION_PARTIE II 158
II. B. Article n°3 : Exploration du métabolisme du soufre chez la levure
Kluyveromyces lactis
Exploration of sulfur metabolism in the yeast Kluyveromyces lactis
1UMR MICALIS, AgroParisTech-INRA, CBAI, BP 01, 78850 Thiverval Grignon, France.
2INRA-AgroParisTech, UMR 782 Génie et Microbiologie des Procédés Alimentaires, Centre de Biotechnologies Agro-Industrielles, 78850, Thiverval-Grignon, France.
3CEA, Service de Pharmacologie et d’Immunoanalyse, DSV/iBiTec-S, CEA/Saclay, 91191 Gif-sur-Yvette Cedex, France.
4UMR 518 Mathématiques et Informatiques Appliquées, AgroParisTech-INRA, 16 rue Claude Bernard 75231 Paris Cedex 05, France.
5INRA, Unité Mathématique, Informatique et Génome UR1077, 78352 Jouy-en-Josas, France.
6Université Catholique de Louvain, Louvain Center for Toxicology and Applied Pharmacology (LTAP), 1200 Brussels, Belgium.
*Corresponding author:
Jean-Marie Beckerich, UMR MICALIS, AgroParisTech-INRA, CBAI, BP 01, 78850 Thiverval Grignon, France. Phone: 33 1 30 81 54 43. Fax: 33 1 30 81 54 57. E-mail: [email protected]
RESULTATS-DISCUSSION_PARTIE II 159
Abstract
Hemiascomycetes are separated by considerable evolutionary distances and, as a
consequence, the mechanisms involved in sulfur metabolism in the extensively studied yeast,
S. cerevisiae, could be different from those of other species of the phylum. This is the first
time that a global vision of sulfur metabolism in the technological yeast Kluyveromyces lactis
has been reported. It uses combined approaches based on DNA microarrays, liquid
chromatography coupled to electrospray mass spectrometry-based metabolite profiling, and
analysis of volatile sulfur compounds (VSCs). A comparison between high and low sulfur
source supplies, i.e., sulfate, methionine or cystine, was carried out in order to identify key
steps in the biosynthetic and catabolic pathways of the sulfur amino acids. When
complementary data of transcriptomic and metabolic analyses were combined, our study
provided relevant results. Firstly, the sulfur metabolism of K. lactis is mainly modulated by
methionine, depending on its availability. Furthermore, since sulfur assimilation is highly
regulated, genes coding for numerous transporters, key enzymes involved in sulfate
assimilation and the interconversion of cysteine to methionine pathways are repressed under
conditions of high sulfur supply. Consequently, as highlighted by metabolomic results,
intracellular pools of homocysteine and cysteine are maintained at very low concentrations,
while the cystathionine pool is highly expandable.
Moreover, our results suggest a new catabolic pathway for methionine to VSCs in this
yeast: methionine is transaminated by the ARO8 gene product into 4-methylthio-oxobutyric
acid (KMBA), which could be exported outside of the cell by the transporter encoded by
PDR12 and demethiolated by a spontaneous reaction into methanethiol and its derivatives.
RESULTATS-DISCUSSION_PARTIE II 160
Introduction
Sulfur metabolism has been extensively investigated at the genetic, enzymatic and
regulatory levels in Saccharomyces cerevisiae due to its central role in many cellular
processes (43). This metabolism is closely linked to the cell cycle since the regulation of the
transcriptional activator of sulfur metabolism, encoded by MET4, is essential for G1-S
transition (33). Some essential molecules are produced via sulfur metabolism. The first
important organic sulfur molecule is homocysteine, which is at the crossroads of the reverse
transsulfuration pathway that leads to cysteine, and the methyl cycle that leads to methionine
and its activated form, S-adenosylmethionine (SAM). SAM is a key molecule in the cell due
to its various functions and interactions with many metabolisms. SAM is a methyl donor in
numerous transmethylation reactions of nucleic acids, proteins and lipids, and is also used as a
precursor for the biosynthesis of polyamines, vitamins and modified nucleotides (13).
Moreover, cysteine is the sensor of the metabolic state in the sulfur amino acid pathway (17)
and is required for the synthesis of glutathione (GSH), an essential antioxidant molecule
involved in oxidative stress response and detoxification (12).
Concerning the technological aspects, sulfur metabolism is also responsible for the
generation of volatile sulfur compounds (VSCs). Owing to their low detection thresholds and
their strong reactivity, VSCs significantly contribute to the quality and the typicity of many
foodstuffs, particularly fermented products (wine, cheese, beer). Furthermore, some VSCs
such as thiols have antioxidant properties that could also have an impact on the overall quality
of the final product. Previous studies were mainly focused on the identification and aromatic
characterization of the sulfur compounds involved in the flavor of these products. Meanwhile,
their biosynthetic pathways are still not understood and some steps seem to be non-enzymatic.
A comprehensive review of these aspects has recently been published (27).
Interest in Kluyveromyces lactis arose from its distinctive physiological properties
compared to S. cerevisiae. Its “Crabtree negative” phenotype makes it as a good candidate for
respiration studies and oxygen-linked regulation (37). Moreover, the ability of this species to
use lactose as a carbon source has led to many studies with fundamental as well as applied
objectives. K. lactis is one of the major yeasts in cheese. It plays a central role during the early
steps of cheese making by modifying the pH of the curd and also contributes to the aromatic
quality of numerous cheeses, particularly through VSC production (22, 23). Because of its
important role in cheese ripening and VSC production, metabolic studies concerning the first
step of methionine catabolism in K. lactis have been carried out. Tracing experiments done
RESULTATS-DISCUSSION_PARTIE II 161
with labeled methionine have confirmed that methionine transamination was the major
pathway for the initial breakdown of methionine in Geotrichum candidum (2). Since there is
no specific methionine aminotransferase, the expressions of branched-chain and aromatic
aminotransferase-encoding genes from the Kluyveromyces genus were studied using a
transcriptomic approach (7). Moreover, all the putative aminotransferase-encoding genes from
K. lactis were cloned in an over-producing vector, and their effects on the production of VSCs
were analyzed. K. lactis ARO8.1 (KLLA0F10021g) and ARO8.2 (KLLA0A04906g), the
orthologues of the S. cerevisiae ARO8 gene, encode enzymes that were found to be
responsible for methionine aminotransferase activity. Transformants carrying these genes
produced three times the amount of VSC as the control strain (22).
Despite the growing scientific literature concerning K. lactis, a general study of its sulfur
metabolism is not available. Moreover, even if the catabolism of methionine by yeasts has
been extensively studied using complementary approaches (biochemical (2), transcriptomic
(8), gene overexpression (22)), it has never been analyzed using an industrial cheese-ripening
strain of K. lactis.
A transcriptomic study of the carbon metabolism was carried out with a microarray
containing an incomplete set of oligonucleotides to compare the properties of a lab strain to
those of a cheese strain (40). The salient result was that despite the conservation of the genes
studied, outstanding differences in gene expression were observed between these strains. We
therefore chose to use a technological strain used in cheese manufacturing in order to obtain
results potentially extendable to studies concerning cheese ecosystems.
Since hemiascomycetous yeasts are separated by considerable evolutionary distances (11),
we carried out an in silico study of 11 organisms of this phylum beforehand so as to highlight
variations in sulfur metabolism pathways (A. Hébert, S. Casaregola, and J. M. Beckerich,
submitted for publication). This previous work gave us solid bases to perform a complete
inventory of sulfur metabolism in K. lactis. To obtain a global vision of sulfur metabolism, we
developed a complete DNA-microarray of K. lactis, as well as a new metabolomic approach.
To our knowledge, this is the first time that an overview of sulfur metabolism in K. lactis,
combining transcriptomic, metabolite profiling, and volatile compounds measurement (GC-
MS), has been presented. This study provides the first global vision of sulfur metabolism in
another member of the hemiascomycetous phylum.
RESULTATS-DISCUSSION_PARTIE II 162
Materials and Methods
Strain and culture conditions
The Kluyveromyces lactis strain (strain KL3550) supplied by Danisco (Dangé St Romain,
France) was chosen for its interesting technological properties during cheese ripening. This
strain was grown in a defined synthetic medium, adapted from the one described by Mansour
et al. (31). We added NaCl at 20 g/L and pyridoxal phosphate at 0.6 mg/L. The concentrations
of KH2PO4 and K2HPO4 were modified to obtain an initial pH of 7.0 (7.9 g/L and 16 g/L,
respectively). To obtain a sulfur-free medium (SM), we removed methionine and cysteine.
This SM was supplemented with sulfur sources as stated: 10 mM L-methionine, 1 mM L-
cystine or 0.1 mM NH3SO4 for high concentrations, and 10 µM L-methionine, 1 µM L-
cystine or 0.1µM NH3SO4 for low concentrations. Cysteine, which is very reactive, can
spontaneously dimerize and form cystine. We consequently used cystine instead of cysteine to
improve the control of sulfur supply.
One hundred mL of the SM, supplied by sulfur substrate, were inoculated from a
preculture carried out in the same medium (inoculation size = 3x10⁶ UFC.ml-1). To avoid
differences in the growth stage and stress inductions or limitations, we maintained the cells in
an exponential phase for ten generations in a defined medium by seeding the cells in a fresh
medium after two generations. Since the cells were harvested during exponential growth and
at low cell density (~1.107 UFC.ml-1), we could thus consider that changes in medium
composition were minimal during cell culture and that cells were harvested in a steady state of
exponential growth. Under these conditions, the specific growth rate (0.23 h-1 ± 0.014, 12
repetitions) is close to the maximum for this cheese-ripening yeast in comparison with
published results (40). These precautions ensured highly reproducible growth conditions (16).
All the cultures were carried out in 500-mL flasks at 25°C with an orbital agitation (150
rpm). Three independent cultures were made for each sulfur condition. Samples for
transcriptomic, metabolomic and GC-MS experiments were taken from these cultures and
then stored at -80°C.
RNA isolation and labeling
Exponentially grown cells were collected and broken with glass beads in a Fastprep
apparatus (Bio 101). Total RNA was then extracted by Trizol treatment (Invitrogen, Carlsbad,
CA, USA). RNA quality was assessed with an Agilent 2100 Bioanalyser. RNA was labeled
with either Alexa 555 or Alexa 647 fluorescent dye (Invitrogen) using the SuperScript
RESULTATS-DISCUSSION_PARTIE II 163
Indirect cDNA labeling system kit (Invitrogen) with anchored Oligo(dT)20 primer, according
to the manufacturer’s recommendations. The levels of Alexa 555 and Alexa 647 incorporation
were quantified by absorbance measurement.
Kluyveromyces lactis microarray design
K. lactis NRRL Y-1140 genome version 3 (S. Casaregola, personal communication) was
used as a reference for microarray design. Probe design was performed using ROSO (35)
completed with in-house scripts. ROSO takes a number of parameters into account to design
effective oligonucleotide probes: (i) uniqueness among the genomes and lack of cross-
hybridization against exclusion genomes; (ii) melting temperature (Tm); (iii) lack of
secondary structures; and (iv) distance from the 3' end of the gene. ROSO was run on the
5,270 candidate target genes. Our objective was to obtain one probe with a length of between
40 and 60 nucleotides per target gene. Probes have to be in exons and are preferably located at
the 3' end of the gene. The genomes of Arthrobacter aurescens TC1, Arthrobacter sp. (strain
KMBA: keto-methyl thio butyrate. detected: +, not detected: -, product not commercially available: /.
Results
Experimental design
In order to study sulfur metabolism in the cheese-ripening yeast Kluyveromyces lactis, we
hypothesized that, in excess of sulfur, the yeast metabolism could be oriented towards sulfur
amino acid catabolism, whereas under lower sulfur concentration, biosynthesis of sulfur
amino acids could be observed. Consequently, the studied yeast was grown with the different
sulfur sources, methionine (M), cystine (C) and sulfate (S), at high (H) or low (L)
concentrations, using the ratio 1000/1. High concentrations of methionine and cystine are
close to their theoretical maximal concentrations in cheese caseins (48). Although there is no
sulfate in milk, we completed this work by studying ammonium sulfate supplies in order to
obtain a more complete picture of sulfur metabolism in this yeast. Because the growth of the
studied strain was very weak with 10 mM of ammonium sulfate, we set the high sulfate
concentration at 100 µM while maintaining the high/low ratio (i.e., 1000/1) constant. The
growth parameters appeared very similar under all the tested conditions.
This experimental design was used throughout this study for transcriptomic, metabolomic
and VSC studies. To make the reading easier, we used the gene names of S. cerevisiae in the
text, instead of the K. lactis orthologues. The “low level” sample was taken as the control to
compare gene expression between sulfur catabolism versus anabolism by calculating the
HM/LM, HC/LC or HS/LS ratios. These notations were used in the following text.
RESULTATS-DISCUSSION_PARTIE II 168
Modulation of gene expression according to sulfur supply
Regardless of the sulfur source, genes involved in sulfur metabolism represent 19.8% of
the less expressed genes under high sulfur conditions (Supplementary Material 2). This result
indicates that the yeast restricts sulfur assimilation and anabolism under conditions of sulfur
excess. It is essential to note that one third of the genes differentially expressed in this study
encodes for unknown or poorly defined functions in K. lactis, like in the model yeast S.
cerevisiae. Since growth of Kluyveromyces lactis is the same in all the experiments (see
Materials and Methods, Strain and culture conditions), we can reasonably assume that this
yeast was not in conditions of limitation or inhibition. Table 2 provides a summary of all the
sulfur metabolism genes, including the sulfur related genes, differentially expressed under at
least one of our experimental conditions. We can see on Table 2 that the main effect is
obtained with methionine. Thirty-one sulfur metabolism genes are differentially expressed in
methionine, compared to 13 and 8 genes in sulfate and cystine, respectively. We therefore
first focused the presentation of our results on methionine conditions. The validation of the
transcriptomic experiment by qPCR is available in Supplementary Material 1.
Methionine (HM/LM)
Under high methionine (HM) supplementation conditions, numerous genes encoding
transporters are highly repressed (Table 2), especially high affinity transporters of methionine
(MUP1), cysteine (YCT1) and sulfate (SUL1-SUL2). Furthermore, genes of less specific
transporters (GAP1 and OPT1), which are a general amino acid transporter and an
oligopeptide/glutathione transporter, respectively, are also repressed. DUR3, a gene encoding
a transporter of urea and polyamines is also repressed.
We also observed that under HM supplementation conditions, numerous genes involved in
sulfate assimilation are repressed (Table 2). Concerning the first step of sulfate activation, the
two genes, MET3 and MET14, encoding an ATP sulfurylase and an APS kinase, respectively,
are strongly repressed. Moreover, the MET22 gene encoding the enzyme responsible for the
inverse reaction of APS kinase is also repressed to a lesser extent. Regarding the following
sulfate reduction stage, the MET16 gene encoding a PAPS reductase is repressed. The next
enzymatic step is carried out by a sulfite reductase, which is a heterodimer encoded by
MET5/MET10. Only MET10 is repressed in HM. We can also observe that sulfite reductase
requires siroheme to be functional, and that MET1, whose product is involved in siroheme
biosynthesis, is repressed in HM. The sulfur metabolism interacts with aspartate metabolism
RESULTATS-DISCUSSION_PARTIE II 169
through homoserine production, which is the last common intermediate of sulfur and
threonine metabolism. HOM2, the second of the three genes involved in homoserine
production, is repressed in HM, just like MET2 that encodes a homoserine-O-
acetyltransferase. This last enzyme synthesizes O-acetyl-homoserine (OAH). The next
reaction, leading to homocysteine production (precursor of methionine and cysteine), is not
under transcriptional regulation under our conditions.
Methionine leads to the production of S-adenosyl-methionine (SAM) via the methyl cycle.
The two genes involved in the synthesis of these two compounds are repressed in HM (MET6
and SAM1-SAM2, respectively). Moreover, we observed the repression of ADI1, encoding an
enzyme of the methionine salvage pathway. This pathway was recently extensively defined in
S. cerevisiae by Pirkov et al. (26).
We observed that CYS3 and STR3, involved in reverse and direct transsulfuration,
respectively, are repressed in HM. These two genes encode enzymes that catalyze the
conversion of cystathionine to cysteine (CYS3) or homocysteine (STR3), respectively.
Cysteine and homocysteine are reactive molecules that are involved in sulfur metabolism
regulation as well. We also observed the repression of two genes involved in serine
biosynthesis, SER33 and SER1. Serine is required for cysteine synthesis via two described
pathways (transsulfuration and the OAS pathway). The transsulfuration pathway plays an
important role, modulating the fluxes to the methyl cycle and to glutathione metabolism.
GSH1, encoding a gamma glutamylcysteine synthetase, is repressed in HM. This enzyme is
responsible for the first step of glutathione synthesis. This is in agreement with our
observations of CYS3 regulation. A novel complex (encoded by DUG1, DUG2 and DUG3)
involved in the catabolism of intermediates of the glutathione pathway has recently been
identified (15, 24). DUG2 and DUG3, which are repressed in HM, are necessary for γ-
glutamylcysteine utilization as a sulfur source, together with DUG1. On the contrary, DUG1,
which is not regulated in HM, is involved in glutathione and cysteinylglycine catabolism,
without the intervention of DUG2 and DUG3.
We observed that the genes involved in sulfur metabolism are mainly repressed. We
investigated the overexpression of aminotransferases possibly involved in methionine
catabolism. In light of our results, only one of all the candidate genes seems to be particularly
interesting. This gene (KLLA0A04906g), encoding an aromatic amino acid aminotransferase,
is overexpressed in HM (Table 2).
RESULTATS-DISCUSSION_PARTIE II 170
S. cerevisae gene name
K.lactis gene name
Ratio Met
p value Met
Ratio Sul
p value Sul
Ratio Cys
p value Cys Function
TRANSPORTERS RELATED TO SULFUR METABOLISM MUP1 KLLA0B13233g 0.16 0 0.45 5.13E-04 - - High affinity methionine permease YCT1 KLLA0C18678g 0.29 5.66E-09 0.40 2.80E-05 - - High-affinity cysteine-specific transporter with similarity to the Dal5p family
SUL1-SUL2 KLLA0F19338g 0.08 0 0.31 1.05E-06 - - High affinity sulfate permease DUR3 KLLA0C18909g 0.12 0 0.24 2.48E-09 - - Plasma membrane transporter for both urea and polyamines GAP1 KLLA0A06886g 0.47 1.41E-03 - - - - General amino acid permease OPT1 KLLA0E00397g 0.21 8.72E-14 - - - - Oligopeptide transporter. Also transport glutathione. OPT2 KLLA0D15378g - - - - 0.34 4.67E-05 Oligopeptide transporter SEO1 KLLA0D12716g - - - - 2.40 2.57E-03 Putative allantoate permease, mutation confers resistance to ethionine sulfoxide
DUG2 KLLA0F01991g 0.49 1.72E-03 - - - - Probable di- and tri- peptidase, forms a complex with Dug1p and Dug3p to degrade glutathione and others peptides containing a gamma-glu-X bond
DUG3 KLLA0D08668g 0.33 1.37E-06 - - - - Probable glutamine amidotransferase, forms a complex with Dug1p and Dug2p to degrade glutathione and others peptides containing a gamma-glu-X bond
SULFUR RELATED GENES YIL166C KLLA0F09405g 0.26 1.07E-09 0.25 2.01E-09 - - similarity to the allantoate permease YHR112c KLLA0E21319g 0.23 4.67E-12 0.42 3.28E-04 0.49 1.44E-02 Protein of unknown function, similarity with CYS3, STR3, MET17 and STR2
FMO1 KLLA0B14619g 0.15 0 0.39 9.57E-05 - - Flavin-containing monooxygenase, catalyses oxidation of biological thiols to maintain the ER redox ratio for correct folding of disulfide-bonded proteins
GTT3 KLLA0A11396g - - - - 0.40 1.13E-03 Protein of unknown function, possible role in glutathione metabolism
Ratio Met: High/Low Methionine; Ratio Sul: High/Low Sulfate; Ratio Cys: High /Low Cystine TABLE 2. Transcriptomic response of K. lactis to sulfur supply
RESULTATS-DISCUSSION_PARTIE II 171
Sulfate (HS/LS)
Under sulfate supplementation conditions, we observed an expression pattern of genes
involved in sulfur metabolism that was quite similar to the one observed under methionine
supplementation conditions. In fact, less genes involved in sulfur metabolism are repressed
and with a lower intensity. With the exception of the less specific transporters encoded by
OPT1 and GAP1, the same genes encoding transporters are repressed. We also observed a
repression of two genes involved in sulfate activation (MET3, MET14), while others are not
differentially expressed. This regulation could be necessary to reduce the production of toxic
molecules (APS, PAPS) in HS. The only gene involved in sulfur metabolism that is regulated
in sulfate and not in methionine is CYS4, encoding a cystathionine ß-synthase. This gene is
repressed in HS, together with GSH1, suggesting a regulation of the sulfur flux directed
towards cysteine and glutathione.
Cystine (HC/LC)
The cystine supplementation condition presents an expression pattern of genes involved in
sulfur metabolism that is very different from methionine and sulfate. Contrary to the two other
sulfur sources, we observed an overexpression of MET14 and MET2 in HC. MET2 could be
overexpressed to increase the flux of O-acetyl-homoserine and, consequently, the sulfur flux
towards homocysteine and/or cystathionine. SAH1, encoding the last enzyme of the methyl
cycle, is also repressed in HC. The transporters regulated in cystine are different from those
regulated in methionine and sulfate. OPT2, encoding an oligopeptide transporter, is repressed
in HC, while SEO1, encoding a poorly defined transporter of the allantoate family, is
overexpressed. It is surprising to observe the lack of regulation concerning genes encoding
specific sulfur transporters. This could be due to a poor assimilation of cystine by the cell.
Volatile sulfur compounds and intracellular sulfur metabolites
The production of VSCs was quantified using gas chromatography coupled to mass
spectrometry. The major VSC observed is dimethyl disulfide (DMDS), which is produced
under all of the tested conditions. However, its production is on average 27-fold higher in
HM. In accordance with this result, we only observed dimethyl trisulfide (DMTS) and
H: high; L: low; M: methionine; S:sulfate; C: cystine. Ratio Met: HM/LM; Ratio Sul: HS/LS; Ratio Cys: HC/LC. The areas indicated are means of three independent experiments. Extreme values are indicated in bracket.
TABLE 4. Metabolomic response of K. lactis to sulfur supply
RESULTATS-DISCUSSION_PARTIE II 174
Methionine
Under HM supplementation conditions, some sulfur intermediates are highly accumulated,
of which cystathionine is the major one (HM/LM ratio: 22.5) (Table 4).
We observed that the intracellular pool of methionine is six-fold higher in HM than in LM.
The concentrations of intermediates of glutathione metabolism are also increased by factors of
1.6 to 4 in HM (4.24 for cysteine, 3.66 for γ-glutamylcysteine, 1.65 for glutathione and 2.16
for cysteinylglycine), compared to LM supplementation conditions. Furthermore, pools of 5-
methylthioadenosine and spermine, which are produced during polyamine biosynthesis, were
significantly increased under HM supplementation conditions by factors of 8.09 and 13.62,
respectively. It can be observed that spermine is only detected under methionine
supplementation conditions. On the contrary, the concentrations of O-acetyl-homoserine and
serine pools, which are related to sulfur metabolism, are decreased in HM.
By taking the differences of electrospray ionization recoveries observed for the sulfur
reference compounds of interest (data not shown) into account, we can assume that under HM
conditions, the intracellular concentration of cystathionine in our samples is considerably
higher than that of all of the other sulfur compounds detected, except for glutathione.
Furthermore, even if the cysteine pool increased under HM conditions, its concentration
remained lower than that of methionine, cystathionine and glutathione.
Sulfate and cystine
Metabolomic results clearly demonstrate that the intracellular concentrations of sulfur
intermediates were less modified in cystine and sulfate than under methionine
supplementation conditions (Table 4). Finally, the variations of metabolite concentrations
observed under these conditions are less pronounced that those obtained with the two others
supplementation conditions (i.e., HC/LC and HS/LS ratios < 1), highlighting the particular
state of sulfur metabolism induced by methionine supply.
Discussion
Methionine supply deeply modifies sulfur metabolism in K. lactis
In order to provide a global vision of sulfur metabolism of the yeast K. lactis, we have
summarized the results obtained in methionine (HM/LM) in two diagrams (Fig. 1 and Fig. 2).
RESULTATS-DISCUSSION_PARTIE II 175
JLP1
PAPS
SO42- int
APS
Sulfite
Sulfide
Siroheme
Uroporphyrinogen III
3 NADPH
MET 19 (pentose P)
Homoserine
Aspartate
MET16
MET5
MET17
NADPH
Homocysteine
MET3
MET14 MET22
MET10
MET2
YCT1MUP1
OPT1
GAP1 SUL1SUL2
SO42-extMethionineCysteine Oligopeptides
Glutathione
Amino acids
Sulfonates
FIGURE 2
O-acetyl-homoserine
HM LM0
2.0××××106
4.0××××106
6.0××××106
8.0××××106
Genes underlined in gray are repressed in high methionine
Genes in black boxes and underlined in gray are overexpressed in high methionine Error bars in histograms represent extremes values
FIGURE 1. Overview of sulfur metabolism in K. lactis in high versus low methionine (part 1: transport and sulfur sources utilization)
(1) Serine-O-acetyl-transferase. The gene encoding this enzyme is absent in S. cerevisiae. Genes underlined in gray are repressed in high methionine ; Genes in black boxes and underlined in gray are overexpressed in high methionine
The reactions realized by not identified or an assortment of enzymes are indicated with dotted arrows. VSCs more produced in high methionine are surrounded in black and underlined in gray. Values and error bars in histograms represent means with extremes values
FIGURE 2. Overview of sulfur metabolism in K. lactis in high versus low methionine (part 2: organic and volatile sulfur compounds synthesis)
RESULTATS-DISCUSSION_PARTIE II 177
The genes represented in these diagrams that are not differentially expressed under at least
one of our six conditions are listed in Supplementary Material 3. As shown in Fig. 1, genes
involved in the transport and utilization of many sulfur sources (sulfate, cysteine, methionine,
glutathione, sulfonates) are repressed in HM. In the well-studied yeast S. cerevisiae, it was
determined that the genes involved in sulfur metabolism are mainly regulated by the cell's
cysteine pool (17). In our case, the intracellular pools of various sulfur intermediates,
including cysteine, increased in HM (Fig. 2), leading us to look for one or several effectors of
the observed transcriptomic repression.
It was surprising to observe repression of the genes, MET14 and MET22, involved in the
APS-PAPS cycle (Fig. 1), since these two genes encode opposite activities. It is known that
this cycle is necessary to regulate PAPS production, which is toxic when accumulated (34).
When MET22 is deleted, S. cerevisiae cannot use sulfate, sulfite or sulfide as sulfur sources.
However, the mutant has wild-type activities of the enzymes involved in sulfate assimilation
and sulfur uptake (41, 42). The absence of sulfite utilization in the met22 mutant is difficult to
explain. However, the hypothesis of a protein complex involved in sulfate assimilation could
explain both the absence of growth in sulfite for the met22 mutant and the repression of two
genes encoding opposite activities (32). The fact that MET14 is more repressed than MET22
in HM could be due to co-regulation of the APS-PAPS cycle and regulation of the proportion
of the partners involved in the hypothetical complex.
The dramatic decrease in the intracellular pool of O-acetyl-homoserine in HM could be
related to the repression of MET2 and HOM2 (Fig. 1). We observed that the serine pool is
particularly low in HM compared to all other tested conditions. This can be logically related
to the repression of genes involved in serine biosynthesis (Fig. 2).
Considering the reverse and direct transsulfuration, the considerable accumulation of
cystathionine should be noted since it correlates perfectly with the repression of CYS3 and
STR3 genes. Furthermore, since its concentration is somewhat higher than the other sulfur
compounds (except for glutathione), its accumulation could be due to the fact that it is less
reactive and less toxic for microbial cells in comparison with its direct products, i.e., cysteine
and homocysteine. Consequently, cystathionine could be the sulfur reservoir in the event of
sulfur “flood”, at no risk to the cell.
As a result of the ESI efficiencies obtained with reference products, we can assume that the
glutathione pool is the biggest sulfur pool, regardless of the conditions. Meanwhile, if the
glutathione pool is increased under HM conditions, its concentration remains relatively stable.
RESULTATS-DISCUSSION_PARTIE II 178
It is known that this pool is strongly regulated in S. cerevisiae. The regulation of glutathione
synthesis, mediated through GSH1 expression, depends on the gene regulator involved in
sulfur metabolism encoded by MET4, as well as on a regulator that mediates the response to
oxidative stress (encoded by YAP1) (47). It was also shown that the glutathione pool directly
represses GSH1 expression (46). This accurate regulation system leads to an adapted
production of glutathione in response to oxidative or toxic metal stress (44). The stability of
the glutathione pool under our conditions suggests that the cells are neither stressed nor in
sulfur starvation conditions.
Concerning sulfate and cystine, we observed that many genes encoding ribosomal proteins
are repressed in LS and LC, indicating a dramatic reduction in translation. Therefore, the
transcriptomic analysis revealed that, despite the same exponential growth rate, the cells seem
to anticipate a hypothetical starvation stress that slowed down their protein synthesis
apparatus. This observation reinforces the view that the K. lactis strain 3550 would not be
adapted to these two sulfur substrates. This could be a specific adaptation of this
technological strain to milk where sulfate is absent and cystine is poorly accessible.
The catabolism of methionine and, consequently, VSC production is discussed in the next
section.
Metabolism of KMBA and VSC production
The catabolism of methionine in K. lactis seems to be closely linked to the overexpression
of the gene ARO8-2 (KLLA0A04906g) encoding aminotransferase. This result is in good
agreement with data from Kagli et al. (22), although the strain used and the culture conditions
were different. In their study, all the putative aminotransferase-encoding genes from K. lactis
were cloned and their effects on the production of VSCs were analyzed. Two genes,
KlARO8.1 and KlARO8.2, were found to be responsible for L-methionine aminotransferase
activity and their overexpression led to a three-fold increase in VSC production.
Methionine catabolism has also been investigated in the yeast Yarrowia lipolytica (8). The
BAT1, BAT2 and ARO8 genes, encoding aminotransferases, are overexpressed in high
methionine concentrations. In our experiment, the branched-chain amino acid
aminotransferase expression levels were not modified in K. lactis.
Considering the following pathways, the transamination of methionine leads to KMBA
whose pool is never accumulated in the cells under our culture conditions. Meanwhile, we
RESULTATS-DISCUSSION_PARTIE II 179
observed the high production of VSCs, the main products of KMBA degradation in yeasts,
under HM conditions.
Extracellular accumulation of KMBA was largely observed in previous works (23). In our
case, the overexpression of the gene KLLA0B9702g (PDR12 in S. cerevisiae), coding for a
carrier of long-chain acids (18), leads us to suppose that KMBA, which is potentially toxic,
would be actively exported. KMBA can then be degraded on different VSCs, depending on
the physicochemical properties of the extracellular medium (pH, redox, ionic strength). Under
our conditions, KMBA was mainly degraded into methanethiol and DMDS. KMBA could
then be converted into methional and methionol, like in beer, or into 3-methylthiopropionic
acid, like in wine (27). The importance of microbial versus chemical reaction in the
degradation of KMBA has not yet been determined. In our case, the absence of the
accumulation of KMBA in cells and the overexpression of KLLA0B9702g has given us new
insights into VSC production by K. lactis. In this yeast, the first transamination step of
methionine and KMBA excretion should be the main microbial steps for VSC production.
Taken together, these results suggest that ARO8-2 and KLLA0B9702g could consequently
be good candidates to evaluate the capacity of K. lactis strains to produce VSCs using, for
example, Quantitative RT-PCR.
It has been demonstrated that cysteine catabolism was important for H2S production (28)
and VSC diversity (29). In our case, cystine instead of cysteine supply gives very different
results. It could be interesting to investigate and compare the mechanisms of cysteine and
cystine assimilation and catabolism.
This study also revealed other genes that could be involved in sulfur metabolism. The
whys and wherefores are discussed below.
Genes potentially related to sulfur metabolism
This global study of sulfur metabolism has revealed the repression of YIL166C, encoding a
poorly defined transporter. This transporter belongs to the complex allantoate transporter
family, including the recently defined high-affinity cysteine transporter (encoded by YCT1)
(19, 25). These results are in agreement with those of Boer et al. (5), who identified YIL166c
in S. cerevisiae as a gene induced under sulfur limitation. These observations suggest that this
transporter could be linked to sulfur metabolism.
We observed the repression of a poorly defined gene in high sulfur concentrations
RESULTATS-DISCUSSION_PARTIE II 180
(KLLA0E21319g). The S. cerevisiae orthologue, which has been poorly studied up until now,
presents sequence similarities with other genes related to sulfur metabolism (CYS3, MET17,
STR2 and STR3). Its sequence similarity with genes involved in sulfur metabolism suggests its
involvement in sulfur metabolism. Hansen et al. (17) have already disrupted this gene in S.
cerevisiae. The mutant strain is able to grow on methionine, glutathione or cystathionine. No
function has yet been attributed to the product of this gene. These difficulties may be due to
the high sequence similarities with four other genes involved in sulfur metabolism. The
overexpression of this gene could provide new insights into sulfur metabolism, as was the
case for branched-chain and aromatic amino acid aminotransferase studies (22).
In S. cerevisiae, JLP1 encodes a sulfonate/alpha-ketoglutarate dioxygenase (20) involved
in sulfonates catabolism (45), which is overexpressed in sulfur starvation (50). Our results
support these observations since the two orthologues of JPL1 in K. lactis are repressed in HM.
Three poorly studied genes in S. cerevisiae are regulated in K. lactis: (i) FMO1, which is
repressed in HM and HS; and (ii) GTT3 and GRX1, which are repressed and overexpressed,
respectively, in HC (Table 2). The enzymes encoded by GTT3, GRX1 and FMO1 are involved
in glutathione metabolism (36), defense against oxidative stress (30) and folding of disulfide-
bond proteins in endoplasmic reticulum (39), respectively. Their precise role in sulfur
metabolism remains to be determined.
Regulation of sulfur metabolism in yeasts
Under sulfur limitation, Boer et al. (5) observed the induction of numerous sulfur-related
transporters in S. cerevisiae, as well as the induction of genes involved in sulfate and
sulfonate utilization. The investigation of the transcriptional response of S. cerevisiae to six
nitrogen sources (4) has revealed that genes involved in sulfur metabolism (sulfate
assimilation, transporters and regulators) are specifically repressed in methionine. Three
amino acids, including methionine, induce the expression of genes involved in the Ehrlich
pathway (ARO9, ARO10) and the export of long-chain acids produced (PDR12). An overview
of S. cerevisiae metabolism, combining 170 chemostats and 55 cultures conditions, has been
investigated by transcriptomics (26). In this study, results demonstrate that sulfur starvation
leads to strong overexpression of sulfur assimilation genes, while methionine supply leads to
the repression of these genes. These results, as well as ours, suggest that a similar sulfur
regulation system could exist in S. cerevisiae and K. lactis. However, it should be noted that
the set of genes regulated in S. cerevisiae and K. lactis are slightly different. For example, the
RESULTATS-DISCUSSION_PARTIE II 181
genes HOM3 and HOM6 of the homoserine synthesis pathway from aspartate are regulated in
S. cerevisiae, while the target gene is HOM2 in K. lactis.
Considering the specific behavior of the yeast K. lactis, its defective growth under high
sulfate concentrations could indicate a weak regulation of sulfate assimilation and an
accumulation of toxic intermediates such as PAPS or sulfite. Despite the fact that enzymes
involved in this pathway are highly conserved in yeasts, Cordente et al. (9) established that
punctual mutations are sufficient to modify sulfite reductase activity. This implies that one
enzyme of the sulfate assimilation pathway could have a modified activity that leads to toxic
intermediate accumulation. Aranda et al. (1) demonstrated that sulfite resistance in the wine
yeast S. cerevisiae is related to both sulfur and adenine metabolism. The sensitivity to sulfur
of K. lactis could be explained by a non-functional exporter of sulfite, which is of primary
importance in S. cerevisiae (3).
It could be interesting to determine if this phenomenon is due to an adaptation of our
technological strain to its environment. In fact, due to the lack of sulfate in milk and cheeses,
there is no selective pressure that would allow the conservation of active enzymes involved in
sulfate utilization. This could consequently lead to a defective sulfate assimilation pathway in
K. lactis strains isolated from cheeses.
Finally, it is important to keep in mind that transcriptomic studies exclude all genes with
constitutive expression. Since genes involved in sulfur amino acid catabolism could not be
related to sulfur metabolism (22), their regulation by sulfur supply remains hypothetical. The
study of QTL characters would be a good strategy to investigate genes involved in VSC
production.
Acknowledgments
This work was supported by the EcoMet program (ANR-06-PNRA-014) funded by the
French National Research Agency (ANR). AH and MPF are grateful to the ANR (French
National Research Agency: www.agence-nationale-recherche.fr <http://www.agence-
nationale-recherche.fr/>) f or a PhD scholarship. We would also like to thank Armelle Delile,
Roselyne Tâche and Emmanuelle Rebours for their helpful technical assistance.
(1) Serine-O-acetyl-transferase. The gene encoding this enzyme is absent in S. cerevisiae.
SUPPLEMENTARY MATERIAL 3. Genes involved in sulfur metabolism not regulated in our experimental conditions
References
1. Aranda A., E. Jimenez-Marti, H. Orozco, E. Matallana, and M. del Olmo. 2006. Sulfur and adenine metabolisms are linked, and both modulate sulfite resistance in wine yeast. J. Agric. Food Chem. 54:5839-5846.
2. Arfi K., S. Landaud, and P. Bonnarme. 2006. Evidence for distinct L-methionine catabolic pathways in the yeast Geotrichum candidum and the bacterium Brevibacterium linens. Appl. Environ. Microbiol. 72:2155-62.
3. Avram D., and A. T. Bakalinsky. 1997. SSU1 encodes a plasma membrane protein with a central role in a network of proteins conferring sulfite tolerance in Saccharomyces
RESULTATS-DISCUSSION_PARTIE II 184
cerevisiae. J. Bacteriol. 179:5971-5974. 4. Boer V. M., S. L. Tai, Z. Vuralhan, Y. Arifin, M. C. Walsh, M. D. W. Piper, J. H. de
Winde, J. T. Pronk, and J. M. Daran. 2007. Transcriptional responses of Saccharomyces cerevisiae to preferred and nonpreferred nitrogen sources in glucose-limited chemostat cultures. FEMS Yeast Res. 7:604-620.
5. Boer V. M., J. H. de Winde, J. T. Pronk, and M. D. W. Piper. 2003. The genome-wide transcriptional responses of Saccharomyces cerevisiae grown on glucose in aerobic chemostat cultures limited for carbon, nitrogen, phosphorus, or sulfur. J. Biol. Chem. 278:3265-74.
6. Chan S. Y., and D. R. Appling. 2003. Regulation of S-adenosylmethionine levels in Saccharomyces cerevisiae. J. Biol. Chem. 278:43051-9.
7. Cholet O., A. Hénaut, S. Casaregola, and P. Bonnarme. 2007. Gene expression and biochemical analysis of cheese-ripening yeasts: focus on catabolism of L-methionine, lactate, and lactose. Appl. Environ. Microbiol. 73:2561-70.
8. Cholet O., A. Hénaut, A. Hébert, and P. Bonnarme. 2008. Transcriptional analysis of L-methionine catabolism in the cheese-ripening yeast Yarrowia lipolytica in relation to volatile sulfur compound biosynthesis. Appl. Environ. Microbiol. 74:3356-67.
9. Cordente A. G., A. Heinrich, I. S. Pretorius, and J. H. Swiegers. 2009. Isolation of sulfite reductase variants of a commercial wine yeast with significantly reduced hydrogen sulfide production. FEMS Yeast Res. 9:446-459.
10. Delmar P., S. Robin, and J. J. Daudin. 2005. VarMixt: efficient variance modelling for the differential analysis of replicated gene expression data. Bioinformatics 21:502-508.
11. Dujon B. 2006. Yeasts illustrate the molecular mechanisms of eukaryotic genome evolution. Trends. Genet. 22:375-87.
12. Fauchon M., G. Lagniel, J. C. Aude, L. Lombardia, P. Soularue, C. Petat, G. Marguerie, A. Sentenac, M. Werner, and J. Labarre. 2002. Sulfur sparing in the yeast proteome in response to sulfur demand. Mol. Cell 9:713-23.
13. Fontecave M., M. Atta, and E. Mulliez. 2004. S-adenosylmethionine: nothing goes to waste. Trends. Biochem. Sci. 29:243-9.
14. Forquin M., H. Duvergey, C. Proux, V. Loux, J. Mounier, S. Landaud, J. Coppée, J. Gibrat, P. Bonnarme, I. Martin-Verstraete, and T. Vallaeys. 2009. Identification of brevibacteriaceae by multilocus sequence typing and comparative genomic hybridization analyses. Appl. Environ. Microbiol 75:6406-6409.
15. Ganguli D., C. Kumar, and A. K. Bachhawat. 2007. The alternative pathway of glutathione degradation is mediated by a novel protein complex involving three new genes in Saccharomyces cerevisiae. Genetics 175:1137-1151.
16. Godard P., A. Urrestarazu, S. Vissers, K. Kontos, G. Bontempi, J. van Helden, and B. Andre. 2007. Effect of 21 different nitrogen sources on global gene expression in the yeast Saccharomyces cerevisiae. Mol. Cell. Biol. 27:3065-3086.
17. Hansen J., and P. F. Johannesen. 2000. Cysteine is essential for transcriptional regulation of the sulfur assimilation genes in Saccharomyces cerevisiae. Mol. Gen. Genet. 263:535-542.
18. Hazelwood L. A., S. L. Tai, V. M. Boer, J. H. de Winde, J. T. Pronk, and J. M. Daran. 2006. A new physiological role for Pdr12p in Saccharomyces cerevisiae: export of aromatic and branched-chain organic acids produced in amino acid catabolism. FEMS Yeast Res. 6:937-45.
19. Hellborg L., M. Woolfit, M. Arthursson-Hellborg, and J. Piskur. 2008. Complex evolution of the DAL5 transporter family. BMC Genomics 9:164.
RESULTATS-DISCUSSION_PARTIE II 185
20. Hogan D. A., T. A. Auchtung, and R. P. Hausinger. 1999. Cloning and characterization of a sulfonate/alpha-ketoglutarate dioxygenase from Saccharomyces cerevisiae. J. Bacteriol. 181:5876-5879.
21. Jacquemin-Faure I., D. Thomas, J. Laporte, C. Cibert, and Y. Surdin-Kerjan. 1994. The vacuolar compartment is required for sulfur amino acid homeostasis in Saccharomyces cerevisiae. Mol. Gen. Genet 244:519-529.
22. Kagkli D. M., P. Bonnarme, C. Neuvéglise, T. M. Cogan, and S. Casaregola. 2006. L-methionine degradation pathway in Kluyveromyces lactis: identification and functional analysis of the genes encoding L-methionine aminotransferase. Appl. Environ. Microbiol. 72:3330-5.
23. Kagkli D. M., R. Tâche, T. M. Cogan, C. Hill, S. Casaregola, and P. Bonnarme. 2006. Kluyveromyces lactis and Saccharomyces cerevisiae, two potent deacidifying and volatile-sulphur-aroma-producing microorganisms of the cheese ecosystem. Appl. Microbiol. Biotechnol. 73:434-42.
24. Kaur H., C. Kumar, C. Junot, M. B. Toledano, and A. K. Bachhawat. 2009. Dug1p Is a Cys-Gly peptidase of the gamma-glutamyl cycle of Saccharomyces cerevisiae and represents a novel family of Cys-Gly peptidases. J. Biol. Chem. 284:14493-14502.
25. Kaur J., and A. K. Bachhawat. 2007. Yct1p, a novel, high-affinity, cysteine-specific transporter from the yeast Saccharomyces cerevisiae. Genetics 176:877-90.
26. Knijnenburg T. A., J. M. G. Daran, M. A. van den Broek, P. A. Daran-Lapujade, J. H. de Winde, J. T. Pronk, M. J. T. Reinders, and L. F. A. Wessels. 2009. Combinatorial effects of environmental parameters on transcriptional regulation in Saccharomyces cerevisiae: a quantitative analysis of a compendium of chemostat-based transcriptome data. BMC Genomics 10:53.
27. Landaud S., S. Helinck, and P. Bonnarme. 2008. Formation of volatile sulfur compounds and metabolism of methionine and other sulfur compounds in fermented food. Appl. Microbiol. Biotechnol. 77:1191-205.
28. Lopez del Castillo Lozano M., R. Tâche, P. Bonnarme, and S. Landaud. 2007. Evaluation of a quantitative screening method for hydrogen sulfide production by cheese-ripening microorganisms: the first step towards l-cysteine catabolism. J. Microbiol. Methods 69:70-7.
29. López Del Castillo-Lozano M., A. Delile, H. E. Spinnler, P. Bonnarme, and S. Landaud. 2007. Comparison of volatile sulphur compound production by cheese-ripening yeasts from methionine and methionine-cysteine mixtures. Appl. Microbiol. Biotechnol. 75:1447-54.
30. Luikenhuis S., G. Perrone, I. W. Dawes, and C. M. Grant. 1998. The yeast Saccharomyces cerevisiae contains two glutaredoxin genes that are required for protection against reactive oxygen species. Mol. Biol. Cell 9:1081-1091.
31. Mansour S., J. M. Beckerich, and P. Bonnarme. 2008. Lactate and amino acid catabolism in the cheese-ripening yeast Yarrowia lipolytica. Appl. Environ. Microbiol. 74:6505-6512.
32. Masselot M., and Y. Surdin-Kerjan. 1977. Methionine biosynthesis in Saccharomyces cerevisiae. II. Gene-enzyme relationships in the sulfate assimilation pathway. Mol. Gen. Genet. 154:23-30.
33. Patton E. E., C. Peyraud, A. Rouillon, Y. Surdin-Kerjan, M. Tyers, and D. Thomas. 2000. SCF(Met30)-mediated control of the transcriptional activator Met4 is required for the G(1)-S transition. EMBO J. 19:1613-1624.
34. Peng Z., and D. P. Verma. 1995. A rice HAL2-like gene encodes a Ca(2+)-sensitive 3'(2'),5'-diphosphonucleoside 3'(2')-phosphohydrolase and complements yeast met22
RESULTATS-DISCUSSION_PARTIE II 186
and Escherichia coli cysQ mutations. J. Biol. Chem. 270:29105-29110. 35. Reymond N., H. Charles, L. Duret, F. Calevro, G. Beslon, and J. M. Fayard. 2004. ROSO:
optimizing oligonucleotide probes for microarrays. Bioinformatics 20:271-273. 36. Samanta M. P., and S. Liang. 2003. Predicting protein functions from redundancies in
large-scale protein interaction networks. Proc. Natl. Acad. Sci. U.S.A. 100:12579-12583.
37. Schaffrath R., and K. D. Breunig. 2000. Genetics and molecular physiology of the yeast Kluyveromyces lactis. Fungal Genet. Biol. 30:173-190.
38. Smith C. A., E. J. Want, G. O'Maille, R. Abagyan, and G. Siuzdak. 2006. XCMS: processing mass spectrometry data for metabolite profiling using nonlinear peak alignment, matching, and identification. Anal. Chem. 78:779-787.
39. Suh J. K., L. L. Poulsen, D. M. Ziegler, and J. D. Robertus. 1999. Yeast flavin-containing monooxygenase generates oxidizing equivalents that control protein folding in the endoplasmic reticulum. Proc. Natl. Acad. Sci. U.S.A. 96:2687-2691.
40. Suleau A., P. Gourdon, J. Reitz-Ausseur, and S. Casaregola. 2006. Transcriptomic analysis of extensive changes in metabolic regulation in Kluyveromyces lactis strains. Eukaryot. Cell 5:1360-1370.
41. Thomas D., R. Barbey, D. Henry, and Y. Surdin-Kerjan. 1992. Physiological analysis of mutants of Saccharomyces cerevisiae impaired in sulphate assimilation. J. Gen. Microbiol. 138:2021-2028.
42. Thomas D., R. Barbey, and Y. Surdin-Kerjan. 1990. Gene-enzyme relationship in the sulfate assimilation pathway of Saccharomyces cerevisiae. Study of the 3'-phosphoadenylylsulfate reductase structural gene. J. Biol. Chem. 265:15518-15524.
43. Thomas D., and Y. Surdin-Kerjan. 1997. Metabolism of sulfur amino acids in Saccharomyces cerevisiae. Microbiol. Mol. Biol. Rev. 61:503-32.
44. Thorsen M., G. Lagniel, E. Kristiansson, C. Junot, O. Nerman, J. Labarre, and M. J. Tamás. 2007. Quantitative transcriptome, proteome, and sulfur metabolite profiling of the Saccharomyces cerevisiae response to arsenite. Physiol. Genomics 30:35-43.
45. Uria-Nickelsen M. R., E. R. Leadbetter, and W. Godchaux. 1993. Sulfonate-sulfur assimilation by yeasts resembles that of bacteria. FEMS Microbiol. Lett. 114:73-77.
46. Wheeler G. L., K. A. Quinn, G. Perrone, I. W. Dawes, and C. M. Grant. 2002. Glutathione regulates the expression of gamma-glutamylcysteine synthetase via the Met4 transcription factor. Mol. Microbiol. 46:545-56.
47. Wheeler G. L., E. W. Trotter, I. W. Dawes, and C. M. Grant. 2003. Coupling of the transcriptional regulation of glutathione biosynthesis to the availability of glutathione and methionine via the Met4 and Yap1 transcription factors. J. Biol. Chem. 278:49920-49928.
48. Wood A. F., J. W. Aston, and G. K. Douglas. 1985. The determination of free aminoacids in cheese by capillary column gas liquid chromatography. Aust. J. Dairy Technol. 40:166-169.
49. Yang Y. H., S. Dudoit, P. Luu, D. M. Lin, V. Peng, J. Ngai, and T. P. Speed. 2002. Normalization for cDNA microarray data: a robust composite method addressing single and multiple slide systematic variation. Nucleic Acids Res. 30:e15.
50. Zhang N., C. Merlotti, J. Wu, T. Ismail, A. N. El-Moghazy, S. A. Khan, A. Butt, D. C. Gardner, P. F. Sims, and S. G. Oliver. 2001. Functional Analysis of six novel ORFs on the left arm of Chromosome XII of Saccharomyces cerevisiae reveals three of them responding to S-starvation. Yeast 18:325-334.
RESULTATS-DISCUSSION_PARTIE II 187
II. C. Article n°4 : Etude approfondie du métabolisme du soufre chez la
levure Yarrowia lipolytica
An extensive investigation of sulfur metabolism in the yeast Y. lipolytica
Ratio Met: High/Low Methionine; Ratio Cys: High /Low Cystine ; Ratio Sul: High/Low Sulfate
TABLE 3. Transcriptomic response of Y. lipolytica to sulfur supply (part 1: transporters)
RESULTATS-DISCUSSION_PARTIE II 199
S. cerevisae gene name
Y. lipolytica gene name
Ratio Met
p value Met
Ratio Cys
p value Cys
Ratio Sul
p value Sul
Function
SULFUR METABOLISM
MET 3 YALI0B08184g 0.03 0 0.15 9.89 E -12 0.29 7.35 E -04 ATP sulfurylase MET 16 YALI0B08140g 0.02 4.17 E -12 0.12 1.41 E -12 0.16 1.42 E -12 3'-phosphoadenylsulfate reductase GSH2 YALI0C17831g 0.34 5.23 E -07 0.32 1.62 E -05 0.37 3.38 E -05 Glutathione synthetase SPE3 YALI0E33143g 2.63 2.03 E -05 2.66 2.60 E -04 2.32 1.59 E -02 Spermidine synthase ADI1 YALI0A14498g 0.26 9.32 E -11 0.34 2.12 E -05 0.41 5.09 E -03 Acireductone dioxygenease ARO9 YALI0C05258g 0.21 0 0.16 0 0.28 2.31 E -07 Aromatic aminotransferase II
MET10 YALI0E16368g 0.18 0 0.33 2.49 E -05 - - Subunit alpha of assimilatory sulfite
H: high; L: low; M: methionine; C: cystine; S: sulfate. Ratio Met: HM/LM; Ratio Cys: HC/LC; Ratio Sul: HS/LS. The areas indicated are means of three independent experiments.
Extreme values are indicated in bracket.
TABLE 6. Metabolomic response of Y. lipoytica to sulfur supply
RESULTATS-DISCUSSION_PARTIE II 205
Methionine (HM/LM)
In HM supplementation condition, some sulfur intermediates are highly accumulated. We
observed that the intracellular pool of cystathionine and methionine are 10.67 fold and 6.75
fold higher in HM than in LM respectively. The pools of 5-methylthioadenosine, cysteine and
spermidine are also higher in HM than in LM, but in a lesser extent (ratio of 3.32, 1.94 and
1.23 respectively).
On the contrary, the pools of γ-glutamylcysteine and serine are lower in HM than in LM
(ratios of 0.61 and 0.37 respectively).
Moreover, we observed pools of two specific sulfur compounds: hypotaurine and taurine.
Their pools are higher in HM than in LM (ratios of 19.91 and 4.41 respectively).
Cystine (HC/LC)
In HC versus LC, we have observed a slightly increase of hypotaurine and taurine (ratios
of 2.97 and 2.39 respectively). On the contrary, pools of 5-methiothioadenosine, cystathionine
and spermidine are lower in HC than in LC (ratios of 0.16, 0.22 and 0.87 respectively).
Sulfate (HS/LS)
In HS versus LS, all the pools of glutathione pathway intermediates are decreased (ratios
of 0.04 for cysteine, 0.57 for cystathionine, 0.11 for γ-glutamylcysteine, 0.44 for glutathione
and 0.06 for cysteinylglycine). The pool of 5-methylthioadenosine is also lower in HS than in
LS (ratio of 0.28).
Discussion
Considering the three sulfur sources tested, we observed that Yarrowia lipolytica develops
a specific response to each substrate. Consequently, we will discuss in a first part the effects
of each sulfur source using three summary diagrams. In a second part, the VSCs production
and the related genes will be considered. Finally, we will conclude with the regulation of
sulfur metabolism regulation in hemiascomycetous yeasts.
The genes represented in the diagrams which are not differentially expressed under at least
one of our six conditions are listed in supplementary material 3.
RESULTATS-DISCUSSION_PARTIE II 206
Accumulation of sulfur intermediates in methionine supply
In high methionine supply we observed an expected repression of sulfate assimilation
pathway (Figure 1). The intracellular excess of sulfur is distributed between numerous sulfur
intermediates, such as methionine, 5-methylthioadenosine, cystathionine and cysteine pools.
Meanwhile, in high methionine supply, the serine and γ-glutamylcysteine pools are decreased.
The decrease of serine pool could be a consequence of the methionine pool increase. As the
indirect transsulfuration pathway leading to cysteine biosynthesis is not regulated, the
increase of methionine pool could provoke a sulfur flux toward cysteine synthesis. As serine
is involved in cysteine synthesis, the flux modification could be the cause of serine pool
decrease.
Considering the two cysteine biosynthesis pathways (transsulfuration inverse and OAS
pathways), only OAS pathway is regulated in high methionine. Interestingly, this pathway is
absent in S. cerevisiae. K. lactis, a hemiascomycetous yeast closer to S. cerevisiae, also
possess these two pathways. Meanwhile, we have observed in K. lactis the absence of
regulation of OAS pathway and a regulation of transsulfuration pathway identical to that
observed in S. cerevisiae (A. Hébert et al., submitted for publication) (26). This suggests that
cysteine biosynthesis could be differently regulated in Y. lipolytica.
We also observed another important metabolic difference between Y. lipolytica and S.
cerevisiae. The metabolomic analysis has revealed that Y. lipolytica is able to produce
hypotaurine and taurine. We performed an in silico study, which leads to the identification of
the biosynthesis pathway of these compounds which is complete in Y. lipolytica but
incomplete in S. cerevisiae (Figure 2). The pools of hypotaurine and taurine, which are
increased in high methionine, could serve as reservoir of sulfur. Furthermore, the slight
decrease of γ-glutamylcysteine in high methionine supply could be due to this sulfur flux
modification toward taurine and hypotaurine. Meanwhile, as glutathione pool is not modified
in these two conditions, this mechanism could also preserve glutathione concentration and
availability.
Maintain of a steady state of sulfur metabolism in cystine supply
In high cystine supply, we observed a logical repression of sulfate assimilation pathway
(Figure 3). The intracellular pools are rather stable, suggesting that cystine metabolism is
highly regulated. In the well-studied yeast S. cerevisiae, it was determined that the genes
RESULTATS-DISCUSSION_PARTIE II 207
involved in sulfur metabolism are mainly regulated by the cysteine pool (18). Excess of sulfur
seems to be directed to hypotaurine and taurine synthesis, thus protecting the steady state of
intermediate of glutathione synthesis.
Drastic decrease of glutathione intermediates in sulfate supply
In high sulfate supply (Figure 4), we observed repression of genes involved in sulfite
production, as well as overexpression of an exporter of sulfite. The produced sulfite seems to
provoke an important stress, as all pools of intermediates of glutathione pathway are
decreased in high sulfate. It has been demonstrated that exporter of sulfite is of first
importance for sulfite resistance in S. cerevisiae (3).
Methionine catabolism and VSCs production conditions
VSCs production was mainly observed in high methionine supply. Concerning
aminotransferases genes possibly involved in methionine catabolism (ARO8 and ARO9
aromatic aminotransferase genes and BAT1 and BAT2 branched-chain
aminotransferasesaminotransferase genes), only BAT1 is overexpressed in high methionine.
Thus, this gene could be a good candidate for methionine catabolism. Bondar et al. has
demonstrated that overexpression of BAT1 in Y. lipolytica is correlated with an increase of
VSCs produced (6). BAT1 is also overexpressed in high cystine without increase of VSCs
production. However, this gene, which is not principally involved in sulfur metabolism, could
be overexpressed due to other metabolic regulations.
As methionine pool is increased only in high methionine, we hypothesized that methionine
accumulation is associated with BAT1 overexpression and VSCs production. Furthermore, as
we did not observe an intracellular pool of KMBA, we have hypothesized it could be actively
exported because of its toxic potential. We propose that the transporter YALI0C15488g,
overexpressed in high methionine could be responsible for KMBA export. This hypothesis is
supported by the previous observation of extracellular KMBA accumulation (24).This
phenomenon has been suggested in K. lactis, where PDR12, encoding a carrier of long-chain
acids, was overexpressed in high methionine supply (A. Hébert et al., submitted for
publication) (19).
KMBA can then be degraded on different VSCs, depending on the physicochemical
properties of the extracellular medium (pH, redox, ionic strength).
RESULTATS-DISCUSSION_PARTIE II 208
We observed the production of H2S only in high methionine and high sulfate. We suppose
that this production in high methionine supply is due to cysteine catabolism, such as
previously described (30), according to the increase of cysteine pool, whereas the production
in high sulfate supply could result from sulfate assimilation pathway. The H2S production
from sulfate could be the consequence of a high sulfur flux in the sulfur assimilation pathway,
leading to a H2S leak before its incorporation into a carbon chain. These two phenomena have
already been described, in cheese and wine respectively. We confirm here that H2S production
strongly depends on sulfur supply and not on differences in biosynthesis pathway. In wine,
where sulfate is predominant, the H2S will be produced through sulfate assimilation pathway
(11) (28). On the contrary, in cheese, where sulfur is mainly retrieved in methionine and
cysteine, the production of H2S could arise from cysteine catabolism (27) (29).
Finally, the absence of H2S production in high cystine was quite surprising because
addition of cysteine is strictly correlated to H2S production in several yeasts (30). As a
consequence, we can postulate that cystine assimilation and/or catabolism are different from
those of its reduced form cysteine.
New insights concerning genes related to sulfur metabolism
Transporters
This global study has revealed the repression of genes presenting sequence similarities
with YIL166C and SEO1, encoding poorly defined transporters (Table 3). These transporters
belong to the complex allantoate transporter family, including the recently defined high
affinity cysteine transporter (encoded by YCT1) (20, 25). These results are in agreement with
those of Boer et al (5), who have identified YIL166c in S. cerevisiae as a gene induced under
sulfur limitation. These observations suggest that this transporter could be linked to sulfur
metabolism. However, the specificity of Yarrowia lipolytica transporters are far to be
understood because of phylogenetic divergences and multiplicity of transporters.
Sulfonates catabolism
In S. cerevisiae, JLP1 encodes a sulfonate/alpha-ketoglutarate dioxygenase (21) involved
in sulfonates catabolism which is overexpressed in sulphur starvation (37). In Y. lipolytica, six
homologues of JLP1 belonging to the TauD protein family (Pfam Pf02668) have been
identified. All of them of them are repressed by the high sulphur conditions (Methionine,
cystine and sulphate). This multiplicity of genes and their strong regulation by the sulphur
RESULTATS-DISCUSSION_PARTIE II 209
supply indicate that Y. lipolytica rely on the sulfonates metabolism as sulphur source. This is
coherent with the existence of taurine and hypotaurine pools which appeared to be modulated
by the sulphur source. This is the first time to our knowledge that such pools have been
described. They could contribute to the adaptation to the milk environment which is relatively
rich in taurine.
Gene related to transsulfuration pathway
We noticed the repression of a poorly defined gene in H/L(MC) (YALI0C22088g; Table 4).
The S. cerevisiae orthologue, which was poorly studied, presents sequence similarity with
other genes related to sulfur metabolism (CYS3, MET17, STR2 and STR3) that suggests its
involvement in sulfur metabolism. Hansen et al (18) have already disrupted this gene in S.
cerevisiae. The mutant strain is able to growth on methionine, glutathione or cystathionine.
No function was attributed to the product of this gene yet. These difficulties may be
attributable to the high sequences similarities with four other genes involved in sulfur
metabolism. The overexpression of this gene could give interesting insight, as it was the case
for branched chain and aromatic amino acid aminotransferases investigations (23).
Genes involved in “oxidoreduction” homeostasie via sulfur metabolism
Genes encoding glutathione transferases, orthologues to fungi genes, are repressed in
H/L(MCS). PRX1, TSA1, TRX1, encoding thioredoxin peroxidases, are essentially repressed
in H/L(M). Genes poorly studied in S. cerevisiae are regulated in Y. lipolytica: FMO1 and
MXR1, repressed in H/L(MCS) and in H/L(M) respectively. The enzymes encoded by FMO1
and MXR1 are respectively involved in folding of disulfide-bond proteins in endoplasmic
reticulum (33) and response to oxidative stress. Their precise role in sulfur metabolism
remains to be determined.
Regulation of sulfur metabolism in yeasts
Under sulfur limitation, Boer et al (5) have observed the induction of numerous sulfur
related transporters in S. cerevisiae as well as the induction of genes involved in sulfate and
sulfonate utilization. The investigation of transcriptional response of S. cerevisiae to six
nitrogen sources (4) have bring to light that genes involved in sulfur metabolism (sulfate
RESULTATS-DISCUSSION_PARTIE II 210
assimilation, transporters and regulators) are specifically repressed in methionine. An
overview of S. cerevisiae metabolism, combining 170 chemostats and 55 cultures conditions,
has been investigated by transcriptomics (26). This demonstrates that sulfur starvation leads to
strong overexpression of sulfur assimilation genes while methionine supply leads to the
repression of these genes. Our results confirm the specific position of Y. lipolytica, between
the yeast model S. cerevisiae and fungi. Our study concerning the sulfur metabolism of the
yeast Kluyveromyces lactis (A. Hébert et al., submitted for publication) has confirmed these
results. In fact, cysteine biosynthesis in K. lactis seems to be closer to the one of S. cerevisiae,
while Y. lipolytica seems to be more similar to fungi. Meanwhile K. lactis also possesses the
two cysteine pathways like Y. lipolytica and fungi, and contrary to S. cerevisiae (A. Hébert, S.
Casaregola, and J. M. Beckerich, submitted for publication). Finally, Yarrowia lipolytica is of
first interest for studies related to the evolution of metabolisms.
It is important to keep in mind that transcriptomic studies exclude all genes with
constitutive expression. As genes involved in sulfur amino acid catabolism are possibly not
related to sulfur metabolism, their regulation by sulfur supply remain hypothetical. The study
of QTL characters would be a good strategy to investigate genes involved in VSCs
production.
Candida albicans
Pichia stipitis
Debaryomyces hansenii
Yarrowia lipolytica
Lachancea kluyveri
Kluyveromyces thermotolerans
Kluyveromyces lactis
Eremothecium gossypii
Saccharomyces cerevisiae
Candida glabrata
Zygosaccharomyces rouxii
Neurospora crassa
Emericella nidulans
In grey: yeast with complete taurine and hypotaurine pathway
(1) Serine-O-acetyl-transferase. (2) Cysteine dioxygenase. The genes encoding these two enzymes are absent in S. cerevisiae. (3) Methionine salvage pathway. Genes underlined in gray are repressed in high methionine. Genes in black boxes and underlined in gray are overexpressed in high methionine. The reactions realized by not identified or an assortment of enzymes are indicated with dotted arrows. Pools of intermediates in light gray
are not modified. VSCs more produced in high methionine are surrounded in black and underlined in gray. Values and error bars in histograms represent means with extremes values.
Figure 1: Overview of sulfur metabolism in Y. lipolytica in high versus low methionine
RESULTATS-DISCUSSION_PARTIE II 212
Cystathionine
HC LC
0
5.0××××10 6
1.0××××10 7
1.5××××10 7
PAPS
SO42- int
APS
Sulfite
Sulfide
Siroheme
Uroporphyrinogen III
MET5
MET3
MET22
MET10
O-acetylomoserine
S-adenosyl methionine
S-adenosyl homocysteine
STR2
CYS4
1,2-Dihydroxy-3-keto-5-methyl-thioptene
KMBA
Methanethiol
MethionalMethionol
ARO10
STR3
CYS3
S-adenosyl methionineamine
Glutathione
Cysteinylglycine
Putrescine
Homocysteine
Homoserine
O-acetyl erine
Sulfide
3-sulfino-L-alanineCysteate
MET16
GSH2
SPE3
ADI1
ARO9
MET17
MET2
MET14
SAM1 SAM2
YGR012w
GSH1
ECM38
SPE2
SAH1
MET6
BAT1
(2)
(1)
GAD1GAD1
DMDS
Spermidine
HC LC
01.0××××10 8
2.0××××10 8
3.0××××10 8
4.0××××10 8
Hypotaurine
HC LC
01.0××××1062.0××××1063.0××××1064.0××××106
Taurine
HC LC
0
1.0××××106
2.0××××106
3.0××××106
5-methylthioadenosine
HC LC
01.0××××108
2.0××××108
3.0××××108
4.0××××108
(3)
Cysteine
Methionine
γ-glutamylcysteine
Serine
Sulfonates
JLP1
(1) Serine-O-acetyl-transferase. (2) Cysteine dioxygenase. The genes encoding these two enzymes are absent in S. cerevisiae. (3) Methionine salvage pathway. Genes underlined in gray are repressed in high methionine ; Genes in black boxes and underlined in gray are overexpressed in high methionine
The reactions realized by not identified or an assortment of enzymes are indicated with dotted arrows. Pools of intermediates in light gray are not modified.
Figure 3: Overview of sulfur metabolism in Y. lipolytica in high versus low cystine
(1) Serine-O-acetyl-transferase. (2) Cysteine dioxygenase. The genes encoding these two enzymes are absent in S. cerevisiae. (3) Methionine salvage pathway. Genes underlined in gray are repressed in high methionine ; Genes in black boxes and underlined in gray are overexpressed in high methionine
The reactions realized by not identified or an assortment of enzymes are indicated with dotted arrows. Pools of intermediates in light gray are not modified.
Figure 4: Overview of sulfur metabolism in Y. lipolytica in high versus low sulfate
RESULTATS-DISCUSSION_PARTIE II 214
Supplementary material
Supplementary material 1. Validation of transcriptomic results by quantitative PCR
Oligonucleotides S. cerevisiae gene name
Y. lipolytica gene name Ratio Met Ratio Cys Ratio Sul
1. Wood A. F., J. W. Aston, and G. K. Douglas. 1985. The determination of free aminoacids in cheese by capillary column gas liquid chromatography.Aust. J. Dairy Technol.
2. Arfi K., S. Landaud, and P. Bonnarme. 2006. Evidence for distinct L-methionine catabolic pathways in the yeast Geotrichum candidum and the bacterium Brevibacterium linens. Appl. Environ. Microbiol. 72:2155-62.
3. Avram D., and A. T. Bakalinsky. 1997. SSU1 encodes a plasma membrane protein with a central role in a network of proteins conferring sulfite tolerance in Saccharomyces cerevisiae. J. Bacteriol. 179:5971-5974.
4. Boer V. M., S. L. Tai, Z. Vuralhan, Y. Arifin, M. C . Walsh, M. D. W. Piper, J. H. de Winde, J. T. Pronk, and J. M. Daran. 2007. Transcriptional responses of Saccharomyces cerevisiae to preferred and nonpreferred nitrogen sources in glucose-limited chemostat cultures. FEMS Yeast Res. 7:604-620.
5. Boer V. M., J. H. de Winde, J. T. Pronk, and M. D. W. Piper. 2003. The genome-wide transcriptional responses of Saccharomyces cerevisiae grown on glucose in aerobic chemostat cultures limited for carbon, nitrogen, phosphorus, or sulfur. J. Biol. Chem. 278:3265-74.
6. Bondar D. C., J. M. Beckerich, and P. Bonnarme. 2005. Involvement of a branched-chain aminotransferase in production of volatile sulfur compounds in Yarrowia lipolytica. Appl. Environ. Microbiol. 71:4585-91.
7. Bonnarme P., C. Lapadatescu, M. Yvon, and H. E. Spinnler. 2001. L-methionine degradation potentialities of cheese-ripening microorganisms. J. Dairy Res 68:663-674.
RESULTATS-DISCUSSION_PARTIE II 216
8. Bonnarme P., L. Psoni, and H. E. Spinnler. 2000. Diversity of L-methionine catabolism pathways in cheese-ripening bacteria. Appl. Environ. Microbiol 66:5514-5517.
9. Chan S. Y., and D. R. Appling. 2003. Regulation of S-adenosylmethionine levels in Saccharomyces cerevisiae. J. Biol. Chem. 278:43051-9.
10. Cholet O., A. Hénaut, S. Casaregola, and P. Bonnarme. 2007. Gene expression and biochemical analysis of cheese-ripening yeasts: focus on catabolism of L-methionine, lactate, and lactose. Appl. Environ. Microbiol. 73:2561-70.
11. Cordente A. G., A. Heinrich, I. S. Pretorius, and J. H. Swiegers. 2009. Isolation of sulfite reductase variants of a commercial wine yeast with significantly reduced hydrogen sulfide production. FEMS Yeast Res. 9:446-459.
12. Corsetti A., J. Rossi, and M. Gobbetti. 2001. Interactions between yeasts and bacteria in the smear surface-ripened cheeses. Int. J. Food Microbiol. 69:1-10.
13. Delmar P., S. Robin, and J. J. Daudin. 2005. VarMixt: efficient variance modelling for the differential analysis of replicated gene expression data. Bioinformatics 21:502-508.
14. Dujon B. 2006. Yeasts illustrate the molecular mechanisms of eukaryotic genome evolution. Trends. Genet. 22:375-87.
15. Godard P., A. Urrestarazu, S. Vissers, K. Kontos, G. Bontempi, J. van Helden, and B. Andre. 2007. Effect of 21 different nitrogen sources on global gene expression in the yeast Saccharomyces cerevisiae. Mol. Cell. Biol. 27:3065-3086.
16. Gonzalez-Lopez C. I., R. Szabo, S. Blanchin-Roland, and C. Gaillardin. 2002. Genetic control of extracellular protease synthesis in the yeast Yarrowia lipolytica. Genetics 160:417-427.
17. Guerzoni M. E., R. Lanciotti, L. Vannini, F. Galgano, F. Favati, F. Gardini, and G. Suzzi. 2001. Variability of the lipolytic activity in Yarrowia lipolytica and its dependence on environmental conditions. Int. J. Food Microbiol 69:79-89.
18. Hansen J., and P. F. Johannesen. 2000. Cysteine is essential for transcriptional regulation of the sulfur assimilation genes in Saccharomyces cerevisiae. Mol. Gen. Genet. 263:535-542.
19. Hazelwood L. A., S. L. Tai, V. M. Boer, J. H. de Winde, J. T. Pronk, and J. M. Daran. 2006. A new physiological role for Pdr12p in Saccharomyces cerevisiae: export of aromatic and branched-chain organic acids produced in amino acid catabolism. FEMS Yeast Res. 6:937-45.
20. Hellborg L., M. Woolfit, M. Arthursson-Hellborg, an d J. Piskur. 2008. Complex evolution of the DAL5 transporter family. BMC Genomics 9:164.
21. Hogan D. A., T. A. Auchtung, and R. P. Hausinger. 1999. Cloning and characterization of a sulfonate/alpha-ketoglutarate dioxygenase from Saccharomyces cerevisiae. J. Bacteriol. 181:5876-5879.
22. Jacquemin-Faure I., D. Thomas, J. Laporte, C. Cibert, and Y. Surdin-Kerjan . 1994. The vacuolar compartment is required for sulfur amino acid homeostasis in Saccharomyces cerevisiae. Mol. Gen. Genet. 244:519-529.
23. Kagkli D. M., P. Bonnarme, C. Neuvéglise, T. M. Cogan, and S. Casaregola. 2006. L-methionine degradation pathway in Kluyveromyces lactis: identification and functional analysis of the genes encoding L-methionine aminotransferase. Appl. Environ. Microbiol. 72:3330-5.
24. Kagkli D. M., R. Tâche, T. M. Cogan, C. Hill, S. Casaregola, and P. Bonnarme. 2006. Kluyveromyces lactis and Saccharomyces cerevisiae, two potent deacidifying and volatile-sulphur-aroma-producing microorganisms of the cheese ecosystem. Appl. Microbiol. Biotechnol. 73:434-42.
25. Kaur J., and A. K. Bachhawat. 2007. Yct1p, a novel, high-affinity, cysteine-specific transporter from the yeast Saccharomyces cerevisiae. Genetics 176:877-90.
26. Knijnenburg T. A., J. M. G. Daran, M. A. van den Broek, P. A. Daran-Lapujade, J.
RESULTATS-DISCUSSION_PARTIE II 217
H. de Winde, J. T. Pronk, M. J. T. Reinders, and L. F. A. Wessels. 2009. Combinatorial effects of environmental parameters on transcriptional regulation in Saccharomyces cerevisiae: a quantitative analysis of a compendium of chemostat-based transcriptome data. BMC Genomics 10:53.
27. Landaud S., S. Helinck, and P. Bonnarme. 2008. Formation of volatile sulfur compounds and metabolism of methionine and other sulfur compounds in fermented food. Appl. Microbiol. Biotechnol. 77:1191-205.
28. Linderholm A. L., C. L. Findleton, G. Kumar, Y. Hon g, and L. F. Bisson. 2008. Identification of genes affecting hydrogen sulfide formation in Saccharomyces cerevisiae. Appl. Environ. Microbiol. 74:1418-27.
29. Lopez del Castillo Lozano M., R. Tâche, P. Bonnarme, and S. Landaud. 2007. Evaluation of a quantitative screening method for hydrogen sulfide production by cheese-ripening microorganisms: the first step towards l-cysteine catabolism. J. Microbiol. Methods 69:70-7.
30. Lopez del Castillo-Lozano M., A. Delile, H. E. Spinnler, P. Bonnarme, and S. Landaud. 2007. Comparison of volatile sulphur compound production by cheese-ripening yeasts from methionine and methionine-cysteine mixtures. Appl. Microbiol. Biotechnol. 75:1447-54.
31. Mansour S., J. M. Beckerich, and P. Bonnarme. 2008. Lactate and amino acid catabolism in the cheese-ripening yeast Yarrowia lipolytica. Appl. Environ. Microbiol. 74:6505-6512.
32. Smith C. A., E. J. Want, G. O'Maille, R. Abagyan, and G. Siuzdak. 2006. XCMS: processing mass spectrometry data for metabolite profiling using nonlinear peak alignment, matching, and identification. Anal. Chem. 78:779-787.
33. Suh J. K., L. L. Poulsen, D. M. Ziegler, and J. D. Robertus. 1999. Yeast flavin-containing monooxygenase generates oxidizing equivalents that control protein folding in the endoplasmic reticulum. Proc. Natl. Acad. Sci. U.S.A. 96:2687-2691.
34. Suzzi G., M. T. Lanorte, F. Galgano, C. Andrighetto, A. Lombardi, R. Lanciotti, and M. E. Guerzoni. 2001. Proteolytic, lipolytic and molecular characterisation of Yarrowia lipolytica isolated from cheese. Int. J. Food Microbiol 69:69-77.
35. Wood A. F., J. W. Aston, and G. K. Douglas. 1985. The determination of free aminoacids in cheese by capillary column gas liquid chromatography. Aust. J. Dairy Technol. 40:166-169.
36. Yang Y. H., S. Dudoit, P. Luu, D. M. Lin, V. Peng, J. Ngai, and T. P. Speed. 2002. Normalization for cDNA microarray data: a robust composite method addressing single and multiple slide systematic variation. Nucleic Acids Res. 30:e15.
37. Zhang N., C. Merlotti, J. Wu, T. Ismail, A. N. El-Moghazy, S. A. Khan, A. Butt, D. C. Gardner, P. F. Sims, and S. G. Oliver. 2001. Functional Analysis of six novel ORFs on the left arm of Chromosome XII of Saccharomyces cerevisiae reveals three of them responding to S-starvation. Yeast 18:325-334.
Acknowledgments
This work was supported by the EcoMet program (ANR-06-PNRA-014) funded by the French National Research Agency (ANR). AH and MPF are grateful to the ANR (French National Research Agency: www.agence-nationale-recherche.fr <http://www.agence-nationale-recherche.fr/>) for a PhD scholarship. We would also like to thank Armelle Delile, Roselyne Tâche and Emmanuelle Rebours for their helpful technical assistance.
RESULTATS-DISCUSSION_PARTIE II 218
II. D. Conclusion
La présentation de ces résultats sous forme d’articles séparés nous a conduit à étudier de
façon approfondie le métabolisme du soufre de chaque levure. Nous n’avons cependant pas eu
l’occasion de réaliser une étude comparative du métabolisme du soufre chez K. lactis et Y.
lipolytica. Nous allons donc nous y employer à travers cette conclusion.
Chez Y. lipolytica, nous observons une forte diminution des pools des intermédiaires de la
voie du glutathion lors d’un apport élevé en sulfate d’ammonium. Concernant K. lactis, même
si les concentrations de sulfate utilisées sont beaucoup plus faibles, nous observons également
une baisse de la concentration des pools des intermédiaires de la voie du glutathion
(concentration élevée versus faible). Ceci suggère que le sulfate d’ammonium génèrerait un
stress chez les deux levures. Ce stress pourrait être dû à une production de sulfite trop
importante. La surexpression d’un exportateur de sulfite chez Y. lipolytica va dans le sens de
cette hypothèse.
La réponse des deux levures aux concentrations de cystine utilisées est totalement
différente. Actuellement, nous n’avons pas d’hypothèse pertinente pour expliquer ce
phénomène. Nous ne nous attarderons donc pas sur cette condition.
Nous avons constaté que la comparaison la plus pertinente est celle de K. lactis et Y.
lipolytica dans les conditions d’apport en méthionine (concentration élevée versus faible)
(Figure 23). En effet, de nombreux gènes sont différentiellement exprimés de manière
similaire chez les deux levures, notamment au niveau de la voie d’assimilation du sulfate
(activation et réduction) et de l’utilisation des sulfonates. Les pools de la majorité des
intermédiaires soufrés discutés dans ce travail fluctuent aussi de la même manière chez K.
lactis et Y. lipolytica, ainsi que la production de composés soufrés volatils.
Il existe cependant des différences flagrantes au niveau du métabolisme du soufre chez ces
deux levures. Nous avons identifié précédemment deux voies de synthèse de la cystéine chez
les levures K. lactis et Y. lipolytica (I. D). Cependant, nous avons observé que seule la voie de
transsulfuration (directe et inverse) est régulée chez K. lactis, conduisant à une forte
accumulation de cystathionine, ainsi qu’une augmentation plus modérée, des intermédiaires
de la voie du glutathion. Chez Y. lipolytica, seule la voie de l’O-acétylsérine est régulée. Nous
observons une accumulation de cystathionine, mais plus faible que chez K. lactis. Chez Y.
lipolytica, le flux de soufre est dirigé vers la synthèse d’hypotaurine et de taurine, limitant la
modification des pools des intermédiaires de la voie du glutathion. Nous avons déterminé
RESULTATS-DISCUSSION_PARTIE II 219
précédemment que cette voie de synthèse est incomplète chez K. lactis.
Nous avons aussi observé des différences au niveau de l’expression des gènes codant pour
les aminotransférases potentiellement impliquées dans le catabolisme de la méthionine et
donc de la production de composés soufrés volatils. En effet, nous avons observé la
surexpression des gènes codant pour une aminotransférase à acides aminés aromatiques chez
K. lactis (ARO8-2) et respectivement à acides aminés branchés chez Y. lipolytica (BAT1).
Ceci pourrait être une piste pour l’étude des différentes capacités aromatiques de ces levures.
De plus, nous avons constaté que l’augmentation du pool de méthionine serait indispensable à
la production des CSVs. Nous avons aussi émis l’hypothèse que le KMBA, formé lors de la
première étape de dégradation de la méthionine, pourrait être exporté dans le milieu
extracellulaire puis transformé en composés soufrés volatils.
Nous avons mis en évidence les différents effets de 3 sources de soufres chez chaque
levure, mais aussi les différents effets d’une même source de soufre selon la levure étudiée.
Ce travail montre qu’il est intéressant d’avoir des outils de comparaison inter-espèces pour
avoir une vision affinée d’un métabolisme donné.
RESULTATS-DISCUSSION_PARTIE II 220
PAPS
SO42- int
APS
Sulfite
Sulfure
Sirohème
Uroporphyrinogène III
MET5
MET3
MET22
MET10O-acétylomosérine
S-adénosyl méthionine
S-adénosyl homocystéine
STR2
CYS4
1,2-Dihydroxy-3-keto-5-methyl-thioptene
KMBA (nd)
Méthanethiol
MéthionalMéthionol
ARO10
STR3
CYS3
S-adénosyl méthioninamine
DMDS
Glutathion
Cysteinylglycine
Putrescine
Homocystéine (nd)
Homosérine
O-acétyl sérine
Sulfure
3-sulfino-L-alanineCysteate
MET16
GSH2
SPE3
ADI1
ARO9
MET17
MET2
MET14
SAM1 SAM2
YGR012w
GSH1
ECM38
SPE2
SAH1
MET6
BAT1
(2)
(1)
GAD1GAD1
(3)
JLP1
SulfonatesAspartate
SER1SER33
Métabolisme de la sérine
DUG2DUG3
Catabolisme
ARO8-2
Taurine Hypotaurine
Cystathionine Cystéine
Méthionine
5-méthylthioadénosine
SPE4
Spermidine
Spermidine
Sérine
γ-glutamylcystéine
En rose : résultats identiques entre K. lactiset Y. lipolytica
En bleu : résultats spécifiques à K. lactis
En violet : résultats spécifiques à Y. lipolytica
Augmentation de l’expression ou du pool
Diminution de l’expression ou du pool
nd : pool non détecté dans nos conditions
Figure 23. Métabolisme du soufre chez K. lactis et Y. lipolytica : effet d’une forte concentration en méthionine comparée à une faible concentration en méthionine.
(1) Cystéine synthase (2) Cystéine dioxygenase (3) Voie de recyclage de la méthionine.
RESULTATS-DISCUSSION_PARTIE III 221
III. Etude de l’interaction entre Kluyveromyces lactis et
Brevibacterium aurantiacum
III. A. Introduction
Nous avons étudié le métabolisme du soufre chez deux levures d’affinage, notamment pour
acquérir de nouvelles connaissances sur la production de composés soufrés volatils
indispensables à la flaveur des fromages. Cependant, dans les conditions fromagères, les
micro-organismes constituent un écosystème complexe en évolution constante. La croissance
de chaque partenaire de cet écosystème influe sur celle des autres, ainsi que sur leur
métabolisme. La richesse de l’écosystème fromager rend ces interactions microbiennes
difficiles à analyser. Cependant, cet aspect ne doit pas être négligé.
Nous avons donc choisi d’étudier l’interaction entre deux micro-organismes d’affinage,
Kluyveromyces lactis et Brevibacterium aurantiacum, dans un milieu chimiquement défini
(MCD) supplémenté en méthionine et en cystine. Le métabolisme du soufre de la bactérie
d’affinage Brevibacterium aurantiacum a lui aussi été amplement étudié lors de la thèse de
Marie-Pierre FORQUIN (Forquin, 2010). Notre partenaire, Valentin LOUX, qui a mis au
point les sets d’oligonucléotides pour la création des puces à ADN de K. lactis et B.
aurantiacum, a veillé à ce que l’étude de micro-organismes en association par
transcriptomique puisse être réalisée. Pour cela, chaque oligonucléotide a été réalisé de
manière à éviter les hybridations croisées avec le génome de l’autre espèce.
Nous avons ainsi pu étudier cette interaction à un niveau transcriptionnel, mais aussi par la
mesure de paramètres physiologiques et biochimiques. Ces travaux sont réalisés en miroir
avec ceux de la thèse de Marie-Pierre FORQUIN. Nous avons respectivement comparé les
cultures pures de K. lactis et B. aurantiacum à la co- culture afin de mettre en évidence les
possibles interactions métaboliques.
RESULTATS-DISCUSSION_PARTIE III 222
III. B. Résultats-Discussion : Interaction entre K. lactis et B. aurantiacum
Croissances de K. lactis et B. aurantiacum
Nous avons suivi la croissance en MCD, supplémenté en méthionine (10 mM) et en cystine
(1mM), de chaque micro-organisme en culture pure ainsi qu’en association par
dénombrement (Figure 24-A).
Nous avons observé que la croissance de K. lactis n’est pas affectée par celle de B.
aurantiacum. K. lactis se développe exponentiellement de 0h à 58h de culture, avec un temps
de doublement de 3h20’ dans la monoculture et la coculture, jusqu’à une biomasse d’environ
6.108 UFC/ml. Sa croissance est alors fortement ralentie jusqu’à 78h de culture (X78h=109
UFC/ml). Nous pouvons souligner que K. lactis possède une remarquable capacité
d’adaptation à son environnement.
Au contraire, la croissance de K. lactis influence fortement celle de B. aurantiacum. Lors
des 30 premières heures de culture, la croissance de B. aurantiacum est stimulée en présence
de K. lactis. En effet, le temps de doublement passe de 5h en culture pure à 3h en co-culture.
Cette observation suggère une interaction de type commensalisme en faveur de la bactérie.
Cependant, la phase exponentielle de B. aurantiacum est plus courte en co-culture (30h) qu’en
culture pure (58h), suggérant un phénomène de limitation et/ou d’inhibition à partir de 30h en
co-culture. Cette hypothèse est renforcée par une chute des UFC/ml en co-culture, au-delà de
58h de culture. Ceci nous indique la présence d’interactions complexes entre les deux micro-
organismes, se traduisant par une première phase de commensalisme suivie par une phase de
compétition et/ou d’amensalisme affectant uniquement B. aurantiacum.
Evolution du pH
Nous avons mesuré le pH dans les deux cultures pures ainsi que dans la culture en
association (Figure 24-B). Le pH initial de chaque culture est proche de 7,0. Nous avons
constaté que le pH est stable jusqu’à 30 heures dans les cultures pures ainsi que dans la co-
culture. Nous avons observé que le pH est assez stable (varie entre 6,8 et 7,2) lors de la
croissance de K. lactis, avec une légère chute suivie d’une remontée. Au contraire, le pH
augmente lors de la croissance de B. aurantiacum (jusque 7,8). Durant la croissance de la co-
culture, le pH est assez stable (varie entre 6,8 et 7,2), avec un profil inverse de celui de K.
lactis en culture pure (une augmentation suivie d’une chute).
RESULTATS-DISCUSSION_PARTIE III 223
Consommation des sources de carbone et des acides aminés.
Nous avons dosé la présence résiduelle des deux sources de carbone, le lactose et le lactate
(Figure 24-C et -D respectivement), ainsi que des acides aminés dans le milieu (Tableau 11).
Le dosage du lactose et du lactate a révélé que, dans nos conditions, K. lactis et B.
aurantiacum consomment respectivement le lactose et le lactate. Nous avons constaté que la
consommation de lactate est corrélée à l’augmentation du pH lors de la croissance de B.
aurantiacum en culture pure.
K. lactis consomme moins rapidement le lactose en co-culture qu’en culture pure. De plus,
il n’y a pas de corrélation entre la consommation du lactate et le pH en co-culture. Ceci
suggère des changements drastiques au niveau du métabolisme carboné. La croissance de B.
aurantiacum, étant stimulée en co-culture jusqu’à 30h de culture nous pouvons émettre
l’hypothèse que la levure synthétiserait au minimum un produit stimulant la bactérie en tant
que substrat alternatif ou complément métabolique.
to the cytosol for lysine metabolism 0.47 3.20E-02
Arginine KLLA0F03190g CPA2, Large subunit of carbamoyl phosphate synthetase 0.32 6.88E-04 KLLA0C04037g ARG1, Arginosuccinate synthetase 0.38 6.60E-03 Métabolisme des vitamines (Biotine) (L) *KLLA0B00385g BIO5, uptake of 7-keto 8-aminopelargonic acid 2.80 5.00E-03 (M) KLLA0B00407g BIO4, Dethiobiotin synthetase 2.33 1.21E-02
*Transporteurs classés avec le métabolisme associé. **Gènes validés par RT-qPCR
Tableau 14. Gènes différentiellement exprimés chez K. lactis discutés dans ce travail.
(A)… : gènes de K. lactis représentés Figure 26 et Figure 27.
RESULTATS-DISCUSSION_PARTIE III 235
Gènes Fonctions/similarités K. lactis
Co/Kl P value Transporteurs KLLA0D15378g OPT2, Oligopeptide transporter 3.99 1.31E-03 KLLA0D02970g DAL5, Allantoate permease, also transports dipeptides 2.09 4.47E-02 KLLA0E02905g ATO3, possible role in export of ammonia from the cell 0.20 4.86E-06
KLLA0A06644g ZRT3, transports zinc from storage in the vacuole to the
cytoplasm 4.72 1.71E-04 KLLA0D00253g MAL11, Maltose permease 0.13 1.23E-10 KLLA0B00264g MAL11, Maltose permease 0.12 2.82E-07 KLLA0C08283g FCY2, Purine-cytosine permease 0.24 3.29E-04 Signal KLLA0E19207g SCY1, Putative kinase, suppressor of GTPase mutant 48.08 0 KLLA0E10539g FUS3, Mitogen-activated serine/threonine protein kinase 2.52 2.78E-02 KLLA0D11990g PHO85, Cyclin-dependent kinase 6.22 3.47E-09 KLLA0F12496g GLC7, Serine/threonine protein phosphatase catalytic subunit 2.61 3.23E-02 KLLA0F03597g MSG5, Dual-specificity protein phosphatase 2.53 5.67E-03 KLLA0F06490g CLN1, G1 cyclin involved in regulation of the cell cycle 5.40 5.84E-07 KLLA0C01386g STE50, Protein involved in mating response 5.10 3.79E-06
Organisation cellulaire Bourgeonnement KLLA0C18359g BUD6, involved in actin cable nucleation and polarized cell growth 58.98 2.15E-12 KLLA0D05621g BUD20, involved in bud-site selection 7.10 4.47E-06 Paroi cellulaire KLLA0A06468g KRE9, Glycoprotein involved in cell wall beta-glucan assembly 5.57 3.07E-05 KLLA0A03201g SCW10, Cell wall protein with similarity to glucanases 4.50 1.08E-02 KLLA0E21671g SBE22, involved in the transport of cell wall components from the
Golgi to the cell surface 4.16 4.63E-03 KLLA0C14091g GAS1, ß-1,3-glucanosyltransferase, required for cell wall assembly 4.04 1.52E-04 KLLA0A07315g TOS6, Glycosylphosphatidylinositol-dependent cell wall protein 3.72 3.94E-05 KLLA0C05324g EXG1, Major exo-1,3-beta-glucanase of the cell wall 3.59 3.15E-04 KLLA0A03179g MID2, O-glycosylated plasma membrane protein that acts as a
sensor for cell wall integrity 3.25 4.56E-04 Floculation KLLA0E14543g FLO5, Lectin-like cell wall protein involved in flocculation 8.26 8.60E-12 **KLLA0C19316g FLO9, Lectin-like protein with similarity to Flo1p 5.11 6.21E-07 KLLA0D00264g FLO9, Lectin-like protein with similarity to Flo1p 2.99 1.71E-02 Trafic intracellulaire KLLA0D16654g ENT5, involved in traffic between the Golgi and endosomes 87.04 1.08E-12 Méiose KLLA0E05963g IME1, Master regulator of meiosis 0.29 8.11E-03 Mitose KLLA0B00759g KIP1, Required for mitotic spindle assembly 4.66 1.23E-06 KLLA0F06534g BBP1, required for mitotic functions of Cdc5p 3.61 1.62E-02 Sporulation KLLA0B10010g AQY1, Spore-specific water channel 0.09 1.08E-12 Epissage KLLA0B00979g NPL3, required for pre-mRNA splicing 52.47 2.15E-12 KLLA0F18018g MSL5, Component of the commitment complex 18.28 2.15E-12 KLLA0C07304g CEF1, Essential splicing factor 12.68 0
*Transporteurs classés avec le métabolisme associé. **Gènes validés par RT-qPCR
Composé Concentration 1X (g/l) Concentration 1X (mM) Acétate de sodium 1 12,19 Citrate d’ammonium 0,6 2,65 KH2PO4 7,9 58 K2HPO4 16 91,8 NaCl 20 342 (Ajout du NaCl petit à petit après dissolution des autres composés)
dimethylaniline) sont déposés sur l’agar piège. Le flacon est incubé 10min, puis 400µl de
Chlorure de Fer (250ml final : 24,8ml HCl 37% + 225,2ml H2O + 7,462g FeCl3) sont ajoutés.
Le flacon est à nouveau incubé, pendant 20min.
Mesure de l’H2S
Les réactions sont diluées dans de l’eau au 1/8ème. L’absorbance à 670nm est ensuite mesurée.
L’absorbance zéro est faite à partir d’un flacon ayant contenu du milieu non ensemencé. La
quantification se fait à partir d’une gamme réalisée avec du Na2S.
BIBLIOGRAPHIE
BIBLIOGRAPHIE 267
BIBLIOGRAPHIE
Abu-Tarboush, H. M. (1996). Comparison of Associative Growth and Proteolytic Activity of Yogurt Starters in Whole Milk from Camels and Cows. J. Dairy Sci. 79(3), 366-371.
Adamis, P. D. B., Mannarino, S. C. & Eleutherio, E. C. A. (2009). Glutathione and gamma-glutamyl transferases are involved in the formation of cadmium-glutathione complex. FEBS Letters 583(9), 1489-1492.
Adamitsch, B. F., Karner, F. & Hampel, W. A. (2003). High cell density cultivation of Brevibacterium linens and formation of proteinases and lipase. Biotechnology Letters 25(9), 705-708.
Addis, E., Fleet, G. H., Cox, J. M., Kolak, D. & Leung, T. (2001). The growth, properties and interactions of yeasts and bacteria associated with the maturation of Camembert and blue-veined cheeses. International Journal of Food Microbiology 69(1-2), 25-36.
Amarita, F., Yvon, M., Nardi, M., Chambellon, E., Delettre, J. & Bonnarme, P. (2004). Identification and functional analysis of the gene encoding methionine-gamma-lyase in Brevibacterium linens. Applied and Environmental Microbiology 70(12), 7348-7354.
Amoroso, M. J., Manca de Nadra, M. C. & Oliver, G. (1989). The growth and sugar utilization by Lactobacillus delbrueckii ssp. bulgaricus and Streptococcus salivarius ssp. thermophilus isolated from market yogurt. Le Lait 69(6), 519-528.
Arfi, K., Amárita, F., Spinnler, H. E. & Bonnarme, P. (2003). Catabolism of volatile sulfur compounds precursors by Brevibacterium linens and Geotrichum candidum, two microorganisms of the cheese ecosystem. Journal of Biotechnology 105(3), 245-53.
Arfi, K., Landaud, S. & Bonnarme, P. (2006). Evidence for distinct L-methionine catabolic pathways in the yeast Geotrichum candidum and the bacterium Brevibacterium linens. Applied and Environmental Microbiology 72(3), 2155-62.
Arfi, K., Spinnler, H. E., Tache, R. & Bonnarme, P. (2002). Production of volatile compounds by cheese-ripening yeasts: requirement for a methanethiol donor for S-methyl thioacetate synthesis by Kluyveromyces lactis. Applied Microbiology and Biotechnology 58(4), 503-10.
Arst, H. N. (1968). Genetic analysis of the first steps of sulphate metabolism in Aspergillus nidulans. Nature 219(5151), 268-270.
Ascon-Reyes, D. B., Ascon-Cabrera, M. A., Cochet, N. & Lebeault, J. M. (1995). Indirect Conductance for Measurements of Carbon Dioxide Produced by Streptococcus salivarius ssp. thermophilus TJ 160 in Pure and Mixed Cultures. J. Dairy Sci. 78(1), 8-16.
Avram, D. & Bakalinsky, A. T. (1997). SSU1 encodes a plasma membrane protein with a central role in a network of proteins conferring sulfite tolerance in Saccharomyces cerevisiae. Journal of Bacteriology 179(18), 5971-5974.
Balasubramanyam, B. V. & Varadaraj, M. C. (1998). Cultural conditions for the production of bacteriocin by a native isolate of Lactobacillus delbruecki ssp. bulgaricus CFR 2028 in milk medium. Journal of Applied Microbiology 84(1), 97-102.
Balasundaram, D., Tabor, C. W. & Tabor, H. (1993). Oxygen toxicity in a polyamine-depleted spe2 delta mutant of Saccharomyces cerevisiae. Proceedings of the National Academy of Sciences of the United States of America 90(10), 4693-4697.
Balasundaram, D., Tabor, C. W. & Tabor, H. (1996). Sensitivity of polyamine-deficient Saccharomyces cerevisiae to elevated temperatures. Journal of Bacteriology 178(9), 2721-2724.
BIBLIOGRAPHIE 268
Balasundaram, D., Tabor, C. W. & Tabor, H. (1991). Spermidine or spermine is essential for the aerobic growth of Saccharomyces cerevisiae. Proceedings of the National Academy of Sciences of the United States of America 88(13), 5872-5876.
Barbey, R., Baudouin-Cornu, P., Lee, T. A., Rouillon, A., Zarzov, P., Tyers, M. & Thomas, D. (2005). Inducible dissociation of SCF(Met30) ubiquitin ligase mediates a rapid transcriptional response to cadmium. The EMBO Journal 24(3), 521-32.
Baudouin-Cornu, P. & Labarre, J. (2006). Regulation of the cadmium stress response through SCF-like ubiquitin ligases: comparison between Saccharomyces cerevisiae, Schizosaccharomyces pombe and mammalian cells. Biochimie 88(11), 1673-85.
Baudouin-Cornu, P., Surdin-Kerjan, Y., Marlière, P. & Thomas, D. (2001). Molecular evolution of protein atomic composition. Science (New York, N.Y.) 293(5528), 297-300.
Benkerroum, N., Oubel, H. & Ben Mimoun, L. (2002). Behavior of Listeria monocytogenes and Staphylococcus aureus in yogurt fermented with a bacteriocin-producing thermophilic starter. Journal of food protection 65(5), 799-805.
Berard, L. & Marchenay, P. (2004). Produits de terroir, fromages, normes et biodiversité.
Bérodier, F., Lavanchy, P., Zannoni, M., Casals, J., Herrero, L. & Adamo, C. (1997). Guide d'Évaluation Olfacto-Gustative des Fromages à Pâte Dure et Semi-dure. Lebensmittel-Wissenschaft und-Technologie 30(7), 653-664.
Besançon, X., Smet, C., Chabalier, C., Rivemale, M., Reverbel, J. P., Ratomahenina, R. & Galzy, P. (1992). Study of surface yeast flora of Roquefort cheese. International Journal of Food Microbiology 17(1), 9-18.
Blaiseau, P. L., Isnard, A. D., Surdin-Kerjan, Y. & Thomas, D. (1997). Met31p and Met32p, two related zinc finger proteins, are involved in transcriptional regulation of yeast sulfur amino acid metabolism. Molecular and Cellular Biology 17(7), 3640-8.
Blaiseau, P. L. & Thomas, D. (1998). Multiple transcriptional activation complexes tether the yeast activator Met4 to DNA. The EMBO Journal 17(21), 6327-36.
Boer, V. M., Tai, S. L., Vuralhan, Z., Arifin, Y., Walsh, M. C., Piper, M. D. W., de Winde, J. H., Pronk, J. T. & Daran, J. M. (2007). Transcriptional responses of Saccharomyces cerevisiae to preferred and nonpreferred nitrogen sources in glucose-limited chemostat cultures. Fems Yeast Research 7(4), 604-620.
Boer, V. M., de Winde, J. H., Pronk, J. T. & Piper, M. D. W. (2003). The genome-wide transcriptional responses of Saccharomyces cerevisiae grown on glucose in aerobic chemostat cultures limited for carbon, nitrogen, phosphorus, or sulfur. The Journal of Biological Chemistry 278(5), 3265-74.
Bonaïti, C., Irlinger, F., Spinnler, H. E. & Engel, E. (2005). An iterative sensory procedure to select odor-active associations in complex consortia of microorganisms: application to the construction of a cheese model. Journal of Dairy Science 88(5), 1671-84.
Bondar, D. C., Beckerich, J. M. & Bonnarme, P. (2005). Involvement of a branched-chain aminotransferase in production of volatile sulfur compounds in Yarrowia lipolytica. Applied and Environmental Microbiology 71(8), 4585-91.
Bonnarme, P., Lapadatescu, C., Yvon, M. & Spinnler, H. E. (2001). L-methionine degradation potentialities of cheese-ripening microorganisms. The Journal of Dairy Research 68(4), 663-674.
Bonnarme, P., Psoni, L. & Spinnler, H. E. (2000). Diversity of L-methionine catabolism pathways in cheese-ripening bacteria. Applied and Environmental Microbiology 66(12), 5514-5517.
BIBLIOGRAPHIE 269
Bourbouloux, A., Shahi, P., Chakladar, A., Delrot, S. & Bachhawat, A. K. (2000). Hgt1p, a high affinity glutathione transporter from the yeast Saccharomyces cerevisiae. The Journal of Biological Chemistry 275(18), 13259-13265.
Boutrou, R. & Guéguen, M. (2005). Interests in Geotrichum candidum for cheese technology. International Journal of Food Microbiology 102(1), 1-20.
Breton, A. & Surdin-Kerjan, Y. (1977). Sulfate Uptake in Saccharomyces cerevisiae: Biochemical and Genetic Study. Journal of Bacteriology 132(1), 224-232.
Breunig, Bolotin-Fukuhara, Bianchi, Bourgarel, Falcone, Ferrero, Frontali, Goffrini, Krijger, Mazzoni, Milkowski, Steensma, Wésolowski-Louvel & Zeeman (2000). Regulation of primary carbon metabolism in Kluyveromyces lactis. Enzyme and Microbial Technology 26(9-10), 771-780.
Brussow, H. (2001). Phages of dairy bacteria. Annual Review of Microbiology 55, 283-303.
Brzywczy, J. & Paszewski, A. (1994). Sulfur amino acid metabolism in Schizosaccharomyces pombe: occurrence of two O-acetylhomoserine sulfhydrylases and the lack of the reverse transsulfuration pathway. FEMS Microbiology Letters 121(2), 171-174.
Brzywczy, J., Natorff, R., Sieńko, M. & Paszewski, A. (2007). Multiple fungal enzymes possess cysteine synthase activity in vitro. Research in Microbiology 158(5), 428-36.
Brzywczy, J. & Paszewski, A. (1999). Cloning and characterization of the Kluyveromyces lactis homocysteine synthase gene. Yeast (Chichester, England) 15(13), 1403-9.
Brzywczy, J., Sieńko, M., Kucharska, A. & Paszewski, A. (2002). Sulphur amino acid synthesis in Schizosaccharomyces pombe represents a specific variant of sulphur metabolism in fungi. Yeast (Chichester, England) 19(1), 29-35.
Cao, Y. Y., Cao, Y. B., Xu, Z., Ying, K., Li, Y., Xie, Y., Zhu, Z. Y., Chen, W. S. & Jiang, Y. Y. (2005). cDNA microarray analysis of differential gene expression in Candida albicans biofilm exposed to farnesol. Antimicrobial Agents and Chemotherapy 49(2), 584-9.
Caplice, E. & Fitzgerald, G. F. (1999). Food fermentations: role of microorganisms in food production and preservation. International Journal of Food Microbiology 50(1-2), 131-149.
Carmel-Harel, O. & Storz, G. (2000). Roles of the glutathione- and thioredoxin-dependent reduction systems in the Escherichia coli and saccharomyces cerevisiae responses to oxidative stress. Annual Review of Microbiology 54, 439-461.
Chattopadhyay, M. K., Chen, W., Poy, G., Cam, M., Stiles, D. & Tabor, H. (2009). Microarray studies on the genes responsive to the addition of spermidine or spermine to a Saccharomyces cerevisiae spermidine synthase mutant. Yeast (Chichester, England) 26(10), 531-544.
Chattopadhyay, M. K., Tabor, C. W. & Tabor, H. (2006). Polyamine deficiency leads to accumulation of reactive oxygen species in a spe2Delta mutant of Saccharomyces cerevisiae. Yeast (Chichester, England) 23(10), 751-761.
Chaves-López, C., De Angelis, M., Martuscelli, M., Serio, A., Paparella, A. & Suzzi, G. (2006). Characterization of the Enterobacteriaceae isolated from an artisanal Italian ewe's cheese (Pecorino Abruzzese). Journal of Applied Microbiology 101(2), 353-360.
Chen, H. & Fink, G. R. (2006). Feedback control of morphogenesis in fungi by aromatic alcohols. Genes & Development 20(9), 1150-1161.
Chen, H., Fujita, M., Feng, Q., Clardy, J. & Fink, G. R. (2004). Tyrosol is a quorum-sensing molecule in Candida albicans. Proceedings of the National Academy of Sciences of the United States of America 101(14), 5048-5052.
BIBLIOGRAPHIE 270
Cherest, H., Surdin-Kerjan, Y., Antoniewski, J. & de Robichon-Szulmajster, H. (1973). Effects of regulatory mutations upon methionine biosynthesis in Saccharomyces cerevisiae: loci eth2-eth3-eth10. Journal of Bacteriology 115(3), 1084-1093.
Cherest, H., Davidian, J. C., Thomas, D., Benes, V., Ansorge, W. & Surdin-Kerjan, Y. (1997). Molecular characterization of two high affinity sulfate transporters in Saccharomyces cerevisiae. Genetics 145(3), 627-635.
Cherest, H. & Surdin-Kerjan, Y. (1978). S-adenosyl methionine requiring mutants in Saccharomyces cerevisiae: evidences for the existence of two methionine adenosyl transferases. Molecular & General Genetics: MGG 163(2), 153-167.
Cherest, H. & Surdin-Kerjan, Y. (1981). The two methionine adenosyl transferases in Saccharomyces cerevisiae: evidence for the existence of dimeric enzymes. Molecular & General Genetics: MGG 182(1), 65-69.
Cherest, H. & Surdin-Kerjan, Y. (1992). Genetic analysis of a new mutation conferring cysteine auxotrophy in Saccharomyces cerevisiae: updating of the sulfur metabolism pathway. Genetics 130(1), 51-8.
Cherest, H., Thomas, D. & Surdin-Kerjan, Y. (1993). Cysteine biosynthesis in Saccharomyces cerevisiae occurs through the transsulfuration pathway which has been built up by enzyme recruitment. Journal of Bacteriology 175(17), 5366-5374.
Cherest, H., Thomas, D. & Surdin-Kerjan, Y. (2000). Polyglutamylation of folate coenzymes is necessary for methionine biosynthesis and maintenance of intact mitochondrial genome in Saccharomyces cerevisiae. The Journal of Biological Chemistry 275(19), 14056-63.
Chiang, P. K. & Cantoni, G. L. (1977). Activation of methionine for transmethylation. Purification of the S-adenosylmethionine synthetase of bakers' yeast and its separation into two forms. The Journal of Biological Chemistry 252(13), 4506-4513.
Cholet, O., Hénaut, A., Casaregola, S. & Bonnarme, P. (2007). Gene expression and biochemical analysis of cheese-ripening yeasts: focus on catabolism of L-methionine, lactate, and lactose. Applied and Environmental Microbiology 73(8), 2561-70.
Cholet, O., Hénaut, A., Hébert, A. & Bonnarme, P. (2008). Transcriptional analysis of L-methionine catabolism in the cheese-ripening yeast Yarrowia lipolytica in relation to volatile sulfur compound biosynthesis. Applied and Environmental Microbiology 74(11), 3356-67.
Cone, M. C., Marchitto, K., Zehfus, B. & Ferro, A. J. (1982). Utilization by Saccharomyces cerevisiae of 5'-methylthioadenosine as a source of both purine and methionine. Journal of Bacteriology 151(1), 510-515.
Cordente, A. G., Heinrich, A., Pretorius, I. S. & Swiegers, J. H. (2009). Isolation of sulfite reductase variants of a commercial wine yeast with significantly reduced hydrogen sulfide production. FEMS Yeast Research 9(3), 446-459.
Corsetti, A., Rossi, J. & Gobbetti, M. (2001). Interactions between yeasts and bacteria in the smear surface-ripened cheeses. International Journal of Food Microbiology 69(1-2), 1-10.
Coulon, J. B. (2000). Etude du lien entre terroir et produit dans le cas des fromages AOC : influence de la composition floristique des fourrages sur les caractéristiques chimiques et sensorielles des fromages affinés.
Courtin, P. & Rul, F. (2004). Interactions between microorganisms in a simple ecosystem: yogurt bacteria as a study model. Le Lait 84(1-2), 10.
Curtin, A. C., Gobbetti, M. & McSweeney, P. L. H. (2002). Peptidolytic, esterolytic and amino acid catabolic activities of selected bacterial strains from the surface of smear
BIBLIOGRAPHIE 271
cheese. International Journal of Food Microbiology 76(3), 231-240.
Dahl, S., Tavaria, F. K. & Xavier Malcata, F. (2000). Relationships between flavour and microbiological profiles in Serra da Estrela cheese throughout ripening. International Dairy Journal 10(4), 255-262.
De Sordi, L. & Mühlschlegel, F. A. (2009). Quorum sensing and fungal-bacterial interactions in Candida albicans: a communicative network regulating microbial coexistence and virulence. FEMS Yeast Research 9(7), 990-999.
Deetae, P., Bonnarme, P., Spinnler, H. E. & Helinck, S. (2007). Production of volatile aroma compounds by bacterial strains isolated from different surface-ripened French cheeses. Applied Microbiology and Biotechnology 76(5), 1161-1171.
Deetae, P., Mounier, J., Bonnarme, P., Spinnler, H. E., Irlinger, F. & Helinck, S. (2009a). Effects of Proteus vulgaris growth on the establishment of a cheese microbial community and on the production of volatile aroma compounds in a model cheese. Journal of Applied Microbiology 107(4), 1404-1413.
Deetae, P., Spinnler, H. E., Bonnarme, P. & Helinck, S. (2009b). Growth and aroma contribution of Microbacterium foliorum, Proteus vulgaris and Psychrobacter sp. during ripening in a cheese model medium. Applied Microbiology and Biotechnology 82(1), 169-177.
Delaunay, A., Isnard, A. D. & Toledano, M. B. (2000). H2O2 sensing through oxidation of the Yap1 transcription factor. The EMBO Journal 19(19), 5157-5166.
Dias & Weimer (1998a). Conversion of methionine to thiols by lactococci, lactobacilli, and brevibacteria. Applied and Environmental Microbiology 64(9), 3320-3326.
Dias & Weimer (1998b). Purification and characterization of L-methionine gamma-lyase from brevibacterium linens BL2. Applied and Environmental Microbiology 64(9), 3327-3331.
Donalies, U. E. B. & Stahl, U. (2002). Increasing sulphite formation in Saccharomyces cerevisiae by overexpression of MET14 and SSU1. Yeast (Chichester, England) 19(6), 475-484.
Dormer, U. H., Westwater, J., McLaren, N. F., Kent, N. A., Mellor, J. & Jamieson, D. J. (2000). Cadmium-inducible expression of the yeast GSH1 gene requires a functional sulfur-amino acid regulatory network. The Journal of Biological Chemistry 275(42), 32611-32616.
Drebot, M. A., Barnes, C. A., Singer, R. A. & Johnston, G. C. (1990). Genetic assessment of stationary phase for cells of the yeast Saccharomyces cerevisiae. Journal of Bacteriology 172(7), 3584-9.
Düring-Olsen, L., Regenberg, B., Gjermansen, C., Kielland-Brandt, M. C. & Hansen, J. (1999). Cysteine uptake by Saccharomyces cerevisiae is accomplished by multiple permeases. Current Genetics 35(6), 609-617.
Dufossé, L., Mabon, P. & Binet, A. (2001). Assessment of the coloring strength of brevibacterium linens strains: spectrocolorimetry versus total carotenoid extraction/quantification. Journal of Dairy Science 84(2), 354-360.
Dufour, J. P. (1991). Influence of industrial brewing and fermentation working conditions on beer SO2 level and flavour stability. In: Proceedings of , Lisbon, 1991. pp. 209–216. Lisbon: IRL Press at Oxford University Press: Oxford, UK.
Dugravot, S., Mondy, N., Mandon, N. & Thibout, E. (2005). Increased sulfur precursors and volatiles production by the leek Allium porrum in response to specialist insect attack.
BIBLIOGRAPHIE 272
Journal of Chemical Ecology 31(6), 1299-314.
Dujon, B. (2006). Yeasts illustrate the molecular mechanisms of eukaryotic genome evolution. Trends in Genetics: TIG 22(7), 375-87.
Dworeck, T., Wolf, K. & Zimmermann, M. (2009). SpOPT1, a member of the oligopeptide family (OPT) of the fission yeast Schizosaccharomyces pombe, is involved in the transport of glutathione through the outer membrane of the cell. Yeast (Chichester, England) 26(1), 67-73.
Entian, K. D. & de Vos, W. M. (1996). Genetics of subtilin and nisin biosyntheses: biosynthesis of lantibiotics. Antonie Van Leeuwenhoek 69(2), 109-117.
Fauchon, M., Lagniel, G., Aude, J. C., Lombardia, L., Soularue, P., Petat, C., Marguerie, G., Sentenac, A., Werner, M. & Labarre, J. (2002). Sulfur sparing in the yeast proteome in response to sulfur demand. Molecular Cell 9(4), 713-23.
Feldmann, H. (2000). Génolevures--a novel approach to 'evolutionary genomics'. FEBS Letters 487(1), 1-2.
Ferchichi, M., Hemme, D., Nardi, M. & Pamboukdjian, N. (1985). Production of Methanethiol from Methionine by Brevibacterium linens CNRZ 918. J Gen Microbiol 131(4), 715-723.
Fleet, G. H. (1990). Yeasts in dairy products. The Journal of Applied Bacteriology 68(3), 199-211.
Fleet, G. H. (1999). Microorganisms in food ecosystems. International Journal of Food Microbiology 50(1-2), 101-117.
Fleet, G. H. (2003). Yeast interactions and wine flavour. International Journal of Food Microbiology 86(1-2), 11-22.
Flick, K., Ouni, I., Wohlschlegel, J. A., Capati, C., McDonald, W. H., Yates, J. R. & Kaiser, P. (2004). Proteolysis-independent regulation of the transcription factor Met4 by a single Lys 48-linked ubiquitin chain. Nature Cell Biology 6(7), 634-41.
Fontecave, M., Atta, M. & Mulliez, E. (2004). S-adenosylmethionine: nothing goes to waste. Trends in Biochemical Sciences 29(5), 243-9.
Forquin, M. P. (2010). Étude de Brevibacterium aurantiacum, une bactérie d’affinage de fromage : de son métabolisme du soufre à son interaction avec Kluyveromyces lactis. Diss. Thiverval Grignon: INRA-AgroParisTech.
Forquin, M., Duvergey, H., Proux, C., Loux, V., Mounier, J., Landaud, S., Coppée, J., Gibrat, J., Bonnarme, P., Martin-Verstraete, I. & Vallaeys, T. (2009). Identification of brevibacteriaceae by multilocus sequence typing and comparative genomic hybridization analyses. Applied and Environmental Microbiology 75(19), 6406-6409.
Fujita, Y. & Takegawa, K. (2004). Characterization of two genes encoding putative cysteine synthase required for cysteine biosynthesis in Schizosaccharomyces pombe. Bioscience Biotechnology and Biochemistry 68(2), 306-311.
Gadaga, T. H., Mutukumira, A. N. & Narvhus, J. A. (2001). The growth and interaction of yeasts and lactic acid bacteria isolated from Zimbabwean naturally fermented milk in UHT milk. International Journal of Food Microbiology 68(1-2), 21-32.
Ganguli, D., Kumar, C. & Bachhawat, A. K. (2007). The alternative pathway of glutathione degradation is mediated by a novel protein complex involving three new genes in Saccharomyces cerevisiae. Genetics 175(3), 1137-1151.
Gardarin, A., Chédin, S., Lagniel, G., Aude, J., Godat, E., Catty, P. & Labarre, J. (2010). Endoplasmic reticulum is a major target of cadmium toxicity in yeast. Molecular
BIBLIOGRAPHIE 273
Microbiology 76(4), 1034-1048.
Gaucheron F. (2000). Iron fortification in dairy industry. Trends in Food Science and Technology 11, 403-409.
Godon, C., Lagniel, G., Lee, J., Buhler, J. M., Kieffer, S., Perrot, M., Boucherie, H., Toledano, M. B. & Labarre, J. (1998). The H2O2 stimulon in Saccharomyces cerevisiae. The Journal of Biological Chemistry 273(35), 22480-22489.
Goerges, S., Aigner, U., Silakowski, B. & Scherer, S. (2006). Inhibition of Listeria monocytogenes by food-borne yeasts. Applied and Environmental Microbiology 72(1), 313-8.
Goerges, S., Mounier, J., Rea, M. C., Gelsomino, R., Heise, V., Beduhn, R., Cogan, T. M., Vancanneyt, M. & Scherer, S. (2008). Commercial ripening starter microorganisms inoculated into cheese milk do not successfully establish themselves in the resident microbial ripening consortia of a South german red smear cheese. Applied and Environmental Microbiology 74(7), 2210-7.
Gomes, D. S., Fragoso, L. C., Riger, C. J., Panek, A. D. & Eleutherio, E. C. A. (2002). Regulation of cadmium uptake by Saccharomyces cerevisiae. Biochimica Et Biophysica Acta 1573(1), 21-25.
González, J. C., Banerjee, R. V., Huang, S., Sumner, J. S. & Matthews, R. G. (1992). Comparison of cobalamin-independent and cobalamin-dependent methionine synthases from Escherichia coli: two solutions to the same chemical problem. Biochemistry 31(26), 6045-6056.
Gonzalez-Lopez, C. I., Szabo, R., Blanchin-Roland, S. & Gaillardin, C. (2002). Genetic control of extracellular protease synthesis in the yeast Yarrowia lipolytica. Genetics 160(2), 417-427.
González-Siso, Freire-Picos, Ramil, González-Domínguez, Rodríguez Torres A & Cerdán (2000). Respirofermentative metabolism in Kluyveromyces lactis: Insights and perspectives. Enzyme and Microbial Technology 26(9-10), 699-705.
Grant, C. M. (2001). Role of the glutathione/glutaredoxin and thioredoxin systems in yeast growth and response to stress conditions. Molecular Microbiology 39(3), 533-541.
Grant, C. M., MacIver, F. H. & Dawes, I. W. (1997). Glutathione synthetase is dispensable for growth under both normal and oxidative stress conditions in the yeast Saccharomyces cerevisiae due to an accumulation of the dipeptide gamma-glutamylcysteine. Molecular Biology of the Cell 8(9), 1699-1707.
Greetham, D., Vickerstaff, J., Shenton, D., Perrone, G. G., Dawes, I. W. & Grant, C. M. (2010). Thioredoxins function as deglutathionylase enzymes in the yeast Saccharomyces cerevisiae. BMC Biochemistry 11, 3.
Grenson, M., Hou, C. & Crabeel, M. (1970). Multiplicity of the amino acid permeases in Saccharomyces cerevisiae. IV. Evidence for a general amino acid permease. Journal of Bacteriology 103(3), 770-777.
Grynberg, M., Piotrowska, M., Pizzinini, E., Turner, G. & Paszewski, A. (2001). The Aspergillus nidulans metE gene is regulated by a second system independent from sulphur metabolite repression. Biochimica Et Biophysica Acta 1519(1-2), 78-84.
Grynberg, M., Topczewski, J., Godzik, A. & Paszewski, A. (2000). The Aspergillus nidulans cysA gene encodes a novel type of serine O-acetyltransferase which is homologous to homoserine O-acetyltransferases. Microbiology (Reading, England) 146 ( Pt 10), 2695-703.
BIBLIOGRAPHIE 274
van de Guchte, M., Ehrlich, S. D. & Maguin, E. (2001). Production of growth-inhibiting factors by Lactobacillus delbrueckii. Journal of Applied Microbiology 91(1), 147-153.
Gueguen, M. & Lenoir, J. (1975). Aptitude de l'espèce Geotrichum candidum à la production d'enzymes protéolytiques. Note complementaire. Le Lait 55(549-550), 9 pages.
Gueguen, M. & Schmidt, M. (1992). Les levures et Geotrichum candidum. In: Les groupes microbiens d’intérêt laitier. CEPIL., pp. 165-219. Paris: Hermier, J., Lenoir, J., Weber, F.
Guerzoni, M. E., Lanciotti, R., Vannini, L., Galgano, F., Favati, F., Gardini, F. & Suzzi, G. (2001). Variability of the lipolytic activity in Yarrowia lipolytica and its dependence on environmental conditions. International Journal of Food Microbiology 69(1-2), 79-89.
Hamasaki-Katagiri, N., Katagiri, Y., Tabor, C. W. & Tabor, H. (1998). Spermine is not essential for growth of Saccharomyces cerevisiae: identification of the SPE4 gene (spermine synthase) and characterization of a spe4 deletion mutant. Gene 210(2), 195-201.
Hamasaki-Katagiri, N., Tabor, C. W. & Tabor, H. (1997). Spermidine biosynthesis in Saccharomyces cerevisae: polyamine requirement of a null mutant of the SPE3 gene (spermidine synthase). Gene 187(1), 35-43.
Hansen, J. & Johannesen, P. F. (2000). Cysteine is essential for transcriptional regulation of the sulfur assimilation genes in Saccharomyces cerevisiae. Molecular and General Genetics 263(3), 535-542.
Hansen, J., Muldbjerg, M., Chérest, H. & Surdin-Kerjan, Y. (1997). Siroheme biosynthesis in Saccharomyces cerevisiae requires the products of both the MET1 and MET8 genes. FEBS Letters 401(1), 20-24.
Hansen, T. K. & Jakobsen, M. (2001). Taxonomical and technological characteristics of Saccharomyces spp. associated with blue veined cheese. International Journal of Food Microbiology 69(1-2), 59-68.
Hazelwood, L. A., Daran, J., van Maris, A. J. A., Pronk, J. T. & Dickinson, J. R. (2008). The Ehrlich pathway for fusel alcohol production: a century of research on Saccharomyces cerevisiae metabolism. Applied and Environmental Microbiology 74(8), 2259-66.
Helinck, S., Spinnler, H. E., Parayre, S., Dame-Cahagne, M. & Bonnarme, P. (2000). Enzymatic versus spontaneous S-methyl thioester synthesis in Geotrichum candidum. FEMS Microbiology Letters 193(2), 237-41.
Hellborg, L., Woolfit, M., Arthursson-Hellborg, M. & Piskur, J. (2008). Complex evolution of the DAL5 transporter family. BMC Genomics 9, 164.
Herve-Jimenez, L., Guillouard, I., Guedon, E., Boudebbouze, S., Hols, P., Monnet, V., Maguin, E. & Rul, F. (2009). Postgenomic analysis of streptococcus thermophilus cocultivated in milk with Lactobacillus delbrueckii subsp. bulgaricus: involvement of nitrogen, purine, and iron metabolism. Applied and Environmental Microbiology 75(7), 2062-2073.
Herve-Jimenez, L., Guillouard, I., Guedon, E., Gautier, C., Boudebbouze, S., Hols, P., Monnet, V., Rul, F. & Maguin, E. (2008). Physiology of Streptococcus thermophilus during the late stage of milk fermentation with special regard to sulfur amino-acid metabolism. Proteomics 8(20), 4273-86.
Hogan, D. A., Vik, A. & Kolter, R. (2004). A Pseudomonas aeruginosa quorum-sensing molecule influences Candida albicans morphology. Molecular Microbiology 54(5), 1212-23.
Holzapfel, W. H., Geisen, R. & Schillinger, U. (1995). Biological preservation of foods with reference to protective cultures, bacteriocins and food-grade enzymes. International
BIBLIOGRAPHIE 275
Journal of Food Microbiology 24(3), 343-362.
Hoppe-Seyler, T. S., Jaeger, B., Bockelmann, W., Noordman, W. H., Geis, A. & Heller, K. J. (2004). Molecular identification and differentiation of Staphylococcus species and strains of cheese origin. Systematic and Applied Microbiology 27(2), 211-218.
Hornby, J. M., Jensen, E. C., Lisec, A. D., Tasto, J. J., Jahnke, B., Shoemaker, R., Dussault, P. & Nickerson, K. W. (2001). Quorum sensing in the dimorphic fungus Candida albicans is mediated by farnesol. Applied and Environmental Microbiology 67(7), 2982-2992.
Howell, K. S., Cozzolino, D., Bartowsky, E. J., Fleet, G. H. & Henschke, P. A. (2006). Metabolic profiling as a tool for revealing Saccharomyces interactions during wine fermentation. FEMS Yeast Research 6(1), 91-101.
Igarashi, K. & Kashiwagi, K. (2010). Characteristics of cellular polyamine transport in prokaryotes and eukaryotes. Plant Physiology and Biochemistry: PPB / Societe Francaise De Physiologie Vegetale [online], Available from: http://www.ncbi.nlm.nih.gov/pubmed/20159658. [Accessed 2010-03-25].
Iida, H. & Yahara, I. (1984). Specific early-G1 blocks accompanied with stringent response in Saccharomyces cerevisiae lead to growth arrest in resting state similar to the G0 of higher eucaryotes. The Journal of Cell Biology 98(4), 1185-93.
Irlinger, F., Morvan, A., Solh, N. E. & Bergère, J. L. (1997). Taxonomic characterization of coagulase-negative staphylococci in ripening flora from traditional French cheeses. Systematic and applied microbiology 20(2), 319-329.
Irlinger, F. (2008). Safety assessment of dairy microorganisms: coagulase-negative staphylococci. International Journal of Food Microbiology 126(3), 302-310.
Isnard, A. D., Thomas, D. & Surdin-Kerjan, Y. (1996). The study of methionine uptake in Saccharomyces cerevisiae reveals a new family of amino acid permeases. Journal of Molecular Biology 262(4), 473-84.
Jaspers, C. J. & Penninckx, M. J. (1984). Glutathione metabolism in yeast Saccharomyces cerevisiae. Evidence that gamma-glutamyltranspeptidase is a vacuolar enzyme. Biochimie 66(1), 71-74.
Jin, Y. H., Jang, Y. K., Kim, M. J., Rad, M. R., Kirchrath, L., Seong, R. H., Hong, S. H., Hollenberg, C. P. & Park, S. D. (1995). Characterization of SFP2, a putative sulfate permease gene of Saccharomyces cerevisiae. Biochemical and Biophysical Research Communications 214(2), 709-715.
Jones, D., Watkins, J. & Erickson, S. K. (1973). Taxonomically significant colour changes in Brevibacterium linens probably associated with a carotenoid-like pigment. Journal of General Microbiology 77(1), 145-150.
Juillard, V., Le Bars, D., Kunji, E. R., Konings, W. N., Gripon, J. C. & Richard, J. (1995). Oligopeptides are the main source of nitrogen for Lactococcus lactis during growth in milk. Applied and Environmental Microbiology 61(8), 3024-3030.
Juillard, V., Foucaud, C., Desmazeaud, M. & Richard, J. (1996). Utilization of nitrogen sources during growth of Lactococcus lactis in milk. Le Lait 76(1-2), 12.
Kagkli, D. M., Bonnarme, P., Neuvéglise, C., Cogan, T. M. & Casaregola, S. (2006a). L-methionine degradation pathway in Kluyveromyces lactis: identification and functional analysis of the genes encoding L-methionine aminotransferase. Applied and Environmental Microbiology 72(5), 3330-5.
Kagkli, D. M., Tâche, R., Cogan, T. M., Hill, C., Casaregola, S. & Bonnarme, P. (2006b). Kluyveromyces lactis and Saccharomyces cerevisiae, two potent deacidifying and volatile-
BIBLIOGRAPHIE 276
sulphur-aroma-producing microorganisms of the cheese ecosystem. Applied Microbiology and Biotechnology 73(2), 434-42.
Kaiser, P., Flick, K., Wittenberg, C. & Reed, S. I. (2000). Regulation of transcription by ubiquitination without proteolysis: Cdc34/SCF(Met30)-mediated inactivation of the transcription factor Met4. Cell 102(3), 303-14.
van de Kamp, M., Schuurs, T. A., Vos, A., van der Lende, T. R., Konings, W. N. & Driessen, A. J. (2000). Sulfur regulation of the sulfate transporter genes sutA and sutB in Penicillium chrysogenum. Applied and Environmental Microbiology 66(10), 4536-8.
van de Kamp, M., Pizzinini, E., Vos, A., van der Lende, T. R., Schuurs, T. A., Newbert, R. W., Turner, G., Konings, W. N. & Driessen, A. J. M. (1999). Sulfate transport in Penicillium chrysogenum: Cloning and characterization of the sutA and sutB genes. Journal of Bacteriology 181(23), 7228-7234.
Katz, J. E., Dlakić, M. & Clarke, S. (2003). Automated identification of putative methyltransferases from genomic open reading frames. Molecular & Cellular Proteomics: MCP 2(8), 525-40.
Kaur, H., Kumar, C., Junot, C., Toledano, M. B. & Bachhawat, A. K. (2009). Dug1p Is a Cys-Gly peptidase of the gamma-glutamyl cycle of Saccharomyces cerevisiae and represents a novel family of Cys-Gly peptidases. The Journal of Biological Chemistry 284(21), 14493-14502.
Kaur, J. & Bachhawat, A. K. (2007). Yct1p, a novel, high-affinity, cysteine-specific transporter from the yeast Saccharomyces cerevisiae. Genetics 176(2), 877-90.
Kaur, J. & Bachhawat, A. K. (2009). Gln-222 in transmembrane domain 4 and Gln-526 in transmembrane domain 9 are critical for substrate recognition in the yeast high affinity glutathione transporter, Hgt1p. The Journal of Biological Chemistry 284(35), 23872-23884.
Kaur, J., Srikanth, C. V. & Bachhawat, A. K. (2009). Differential roles played by the native cysteine residues of the yeast glutathione transporter, Hgt1p. FEMS Yeast Research 9(6), 849-866.
Kleerebezem, M. (2004). Quorum sensing control of lantibiotic production; nisin and subtilin autoregulate their own biosynthesis. Peptides 25(9), 1405-1414.
Kodaki, T., Tsuji, S., Otani, N., Yamamoto, D., Rao, K. S., Watanabe, S., Tsukatsune, M. & Makino, K. (2003). Differential transcriptional regulation of two distinct S-adenosylmethionine synthetase genes (SAM1 and SAM2) of Saccharomyces cerevisiae. Nucleic Acids Research. Supplement (2001) (3), 303-304.
Kosugi, A., Koizumi, Y., Yanagida, F. & Udaka, S. (2001). MUP1, high affinity methionine permease, is involved in cysteine uptake by Saccharomyces cerevisiae. Bioscience, Biotechnology, and Biochemistry 65(3), 728-31.
Kumar, C., Sharma, R. & Bachhawat, A. K. (2003). Utilization of glutathione as an exogenous sulfur source is independent of gamma-glutamyl transpeptidase in the yeast Saccharomyces cerevisiae: evidence for an alternative gluathione degradation pathway. FEMS Microbiology Letters 219(2), 187-194.
Kuras, L., Rouillon, A., Lee, T., Barbey, R., Tyers, M. & Thomas, D. (2002). Dual regulation of the met4 transcription factor by ubiquitin-dependent degradation and inhibition of promoter recruitment. Molecular Cell 10(1), 69-80.
Kuras, L. & Thomas, D. (1995). Identification of the yeast methionine biosynthetic genes that require the centromere binding factor 1 for their transcriptional activation. FEBS Letters 367(1), 15-18.
BIBLIOGRAPHIE 277
Lachance, M. (2007). Current status of Kluyveromyces systematics. FEMS Yeast Research 7(5), 642-5.
Lafaye, A., Junot, C., Pereira, Y., Lagniel, G., Tabet, J. C., Ezan, E. & Labarre, J. (2005). Combined proteome and metabolite-profiling analyses reveal surprising insights into yeast sulfur metabolism. Journal of Biological Chemistry 280(26), 24723-24730.
Lalor, D. J., Schnyder, T., Saridakis, V., Pilloff, D. E., Dong, A., Tang, H., Leyh, T. S. & Pai, E. F. (2003). Structural and functional analysis of a truncated form of Saccharomyces cerevisiae ATP sulfurylase: C-terminal domain essential for oligomer formation but not for activity. Protein Engineering 16(12), 1071-1079.
Lambrechts, C., Escudero, J. & Galzy, P. (1995). Purification and properties of three esterases from Brevibacterium sp. R312. Journal of applied bacteriology 78(2), 180-188.
Lambrechts, C. & Galzy, P. (1995). Esterase activities of Brevibacterium sp. R312 and Brevibacterium linens 62. Bioscience, biotechnology, and biochemistry 59(8), 1464-1471.
Lanciotti, R., Vannini, L., Lopez, C. C., Gobbetti, M. & Guerzoni, M. E. (2005). Evaluation of the ability of Yarrowia lipolytica to impart strain-dependent characteristics to cheese when used as a ripening adjunct. International Journal of Dairy Technology 58(2), 89-99.
Landaud, S., Helinck, S. & Bonnarme, P. (2008). Formation of volatile sulfur compounds and metabolism of methionine and other sulfur compounds in fermented food. Applied Microbiology and Biotechnology 77(6), 1191-205.
Le Moan, N., Clement, G., Le Maout, S., Tacnet, F. & Toledano, M. B. (2006). The Saccharomyces cerevisiae proteome of oxidized protein thiols: contrasted functions for the thioredoxin and glutathione pathways. The Journal of Biological Chemistry 281(15), 10420-10430.
Lechenne, B., Reichard, U., Zaugg, C., Fratti, M., Kunert, J., Boulat, O. & Monod, M. (2007). Sulphite efflux pumps in Aspergillus fumigatus and dermatophytes. Microbiology-Sgm 153, 905-913.
Lee, T. A., Jorgensen, P., Bognar, A. L., Peyraud, C., Thomas, D. & Tyers, M. (2010). Dissection of combinatorial control by the Met4 transcriptional complex. Molecular Biology of the Cell 21(3), 456-469.
Lenoir, J., Lamberet, G., Schmidt, J. & Tourneur, C. (1985). La maitrise du bioreacteur fromage. Biofutur (12), 23-50.
Leroy, C., Cormier, L. & Kuras, L. (2006). Independent recruitment of mediator and SAGA by the activator Met4. Molecular and Cellular Biology 26(8), 3149-63.
Leustek, T., Murillo, M. & Cervantes, M. (1994). Cloning of a cDNA encoding ATP sulfurylase from Arabidopsis thaliana by functional expression in Saccharomyces cerevisiae. Plant Physiology 105(3), 897-902.
Leves, F. P., Tierney, M. L. & Howitt, S. M. (2008). Polar residues in a conserved motif spanning helices 1 and 2 are functionally important in the SulP transporter family. The International Journal of Biochemistry & Cell Biology 40(11), 2596-2605.
Linderholm, A. L., Findleton, C. L., Kumar, G., Hong, Y. & Bisson, L. F. (2008). Identification of genes affecting hydrogen sulfide formation in Saccharomyces cerevisiae. Applied and Environmental Microbiology 74(5), 1418-27.
Lodha, P. H., Shadnia, H., Woodhouse, C. M., Wright, J. S. & Aitken, S. M. (2009). Investigation of residues Lys112, Glu136, His138, Gly247, Tyr248, and Asp249 in the active site of yeast cystathionine beta-synthase. Biochemistry and Cell Biology = Biochimie Et Biologie Cellulaire 87(3), 531-540.
BIBLIOGRAPHIE 278
Loessner, M., Guenther, S., Steffan, S. & Scherer, S. (2003). A pediocin-producing Lactobacillus plantarum strain inhibits Listeria monocytogenes in a multispecies cheese surface microbial ripening consortium. Applied and Environmental Microbiology 69(3), 1854-1857.
Logan, H. M., Cathala, N., Grignon, C. & Davidian, J. C. (1996). Cloning of a cDNA encoded by a member of the Arabidopsis thaliana ATP sulfurylase multigene family. Expression studies in yeast and in relation to plant sulfur nutrition. The Journal of Biological Chemistry 271(21), 12227-12233.
Lopez del Castillo Lozano, M., Tâche, R., Bonnarme, P. & Landaud, S. (2007). Evaluation of a quantitative screening method for hydrogen sulfide production by cheese-ripening microorganisms: the first step towards l-cysteine catabolism. Journal of Microbiological Methods 69(1), 70-7.
Lopez del Castillo-Lozano, M. (2007). Production d’arômes soufrés par les flores d’affinage: Catabolisme de la L-cystéine. Diss. AgroParisTech.
Mansour, S., Bailly, J., Landaud, S., Monnet, C., Sarthou, A. S., Cocaign-Bousquet, M., Leroy, S., Irlinger, F. & Bonnarme, P. (2009). Investigation of associations of Yarrowia lipolytica, Staphylococcus xylosus, and Lactococcus lactis in culture as a first step in microbial interaction analysis. Applied and Environmental Microbiology 75(20), 6422-6430.
Mansour, S., Beckerich, J. M. & Bonnarme, P. (2008). Lactate and amino acid catabolism in the cheese-ripening yeast Yarrowia lipolytica. Applied and Environmental Microbiology 74(21), 6505-6512.
Marobbio, C. M. T., Agrimi, G., Lasorsa, F. M. & Palmieri, F. (2003). Identification and functional reconstitution of yeast mitochondrial carrier for S-adenosylmethionine. The EMBO Journal 22(22), 5975-5982.
Martin, B., BUCHIN, S. & HURTAUD, C. (2003). Conditions de production du lait et qualités sensorielles des fromages. Productions Animales.
Marzluf, G. A. (1974). Uptake and efflux of sulfate in Neurospora crassa. Biochimica Et Biophysica Acta 339(3), 374-381.
Marzluf, G. A. (1997). Molecular genetics of sulfur assimilation in filamentous fungi and yeast. Annual Review of Microbiology 51, 73-96.
Masselot, M. & De Robichon-Szulmajster, H. (1975). Methionine biosynthesis in Saccharomyces cerevisiae. I. Genetical analysis of auxotrophic mutants. Molecular & General Genetics: MGG 139(2), 121-132.
Masselot, M. & Surdin-Kerjan, Y. (1977). Methionine biosynthesis in Saccharomyces cerevisiae. II. Gene-enzyme relationships in the sulfate assimilation pathway. Molecular & General Genetics: MGG 154(1), 23-30.
Mautino, M. R., Barra, J. L. & Rosa, A. L. (1996). eth-1, the Neurospora crassa locus encoding S-adenosylmethionine synthetase: molecular cloning, sequence analysis and in vivo overexpression. Genetics 142(3), 789-800.
McAuliffe, O., Ross, R. P. & Hill, C. (2001). Lantibiotics: structure, biosynthesis and mode of action. FEMS Microbiology Reviews 25(3), 285-308.
McCready, R. G. L. & Din, G. A. (1974). Active sulfate transport in Saccharomyces cerevisiae. FEBS Letters 38(3), 361-363.
Mehdi, K., Thierie, J. & Penninckx, M. J. (2001). gamma-Glutamyl transpeptidase in the yeast Saccharomyces cerevisiae and its role in the vacuolar transport and metabolism of
BIBLIOGRAPHIE 279
glutathione. The Biochemical Journal 359(Pt 3), 631-637.
Menant, A., Baudouin-Cornu, P., Peyraud, C., Tyers, M. & Thomas, D. (2006). Determinants of the ubiquitin-mediated degradation of the Met4 transcription factor. The Journal of Biological Chemistry 281(17), 11744-54.
Mendoza-Cozatl, D., Loza-Tavera, H., Hernandez-Navarro, A. & Moreno-Sanchez, R. (2005). Sulfur assimilation and glutathione metabolism under cadmium stress in yeast, protists and plants. Fems Microbiology Reviews 29(4), 653-671.
Miyake, T., Kanayama, M., Sammoto, H. & Ono, B. (2002). A novel cis-acting cysteine-responsive regulatory element of the gene for the high-affinity glutathione transporter of Saccharomyces cerevisiae. Molecular Genetics and Genomics: MGG 266(6), 1004-1011.
Monds, R. D. & O'Toole, G. A. (2009). The developmental model of microbial biofilms: ten years of a paradigm up for review. Trends in Microbiology 17(2), 73-87.
Morales, P., Fernández-García, E. & Nuñez, M. (2003). Caseinolysis in cheese by Enterobacteriaceae strains of dairy origin. Letters in Applied Microbiology 37(5), 410-414.
Moreau, A., Filion, M., Truong-meyer, X. M., Pingaud, H. & Strehaiano, P. (1998). Study of lactic acid and amino acid catabolism of Brevibacterium linens. Microbiologie, aliments, nutrition 16(4), 251-258.
Morzycka, E. & Paszewski, A. (1979). Two pathways of cysteine biosynthesis in Saccharomycopsis lipolytica. FEBS Letters 101(1), 97-100.
Mounier, J., Monnet, C., Jacques, N., Antoinette, A. & Irlinger, F. (2009). Assessment of the microbial diversity at the surface of Livarot cheese using culture-dependent and independent approaches. International Journal of Food Microbiology 133(1-2), 31-37.
Mounier, J., Rea, M. C., O'Connor, P. M., Fitzgerald, G. F. & Cogan, T. M. (2007). Growth characteristics of Brevibacterium, Corynebacterium, Microbacterium, and Staphylococcus spp. isolated from surface-ripened cheese. Applied and Environmental Microbiology 73(23), 7732-7739.
Mounier, J., Gelsomino, R., Goerges, S., Vancanneyt, M., Vandemeulebroecke, K., Hoste, B., Scherer, S., Swings, J., Fitzgerald, G. F. & Cogan, T. M. (2005). Surface microflora of four smear-ripened cheeses. Applied and Environmental Microbiology 71(11), 6489-500.
Mounier, J., Monnet, C., Vallaeys, T., Arditi, R., Sarthou, A., Hélias, A. & Irlinger, F. (2008). Microbial interactions within a cheese microbial community. Applied and Environmental Microbiology 74(1), 172-81.
Mulet, J. M., Alemany, B., Ros, R., Calvete, J. J. & Serrano, R. (2004). Expression of a plant serine O-acetyltransferase in Saccharomyces cerevisiae confers osmotic tolerance and creates an alternative pathway for cysteine biosynthesis. Yeast (Chichester, England) 21(4), 303-12.
Murphy, M. J., Siegel, L. M., Tove, S. R. & Kamin, H. (1974). Siroheme: A New Prosthetic Group Participating in Six-Electron Reduction Reactions Catalyzed by Both Sulfite and Nitrite Reductases. Proceedings of the National Academy of Sciences of the United States of America 71(3), 612-616.
Narvhus, J. A. & Gadaga, T. H. (2003). The role of interaction between yeasts and lactic acid bacteria in African fermented milks: a review. International Journal of Food Microbiology 86(1-2), 51-60.
Natarajan, K., Meyer, M. R., Jackson, B. M., Slade, D., Roberts, C., Hinnebusch, A. G. & Marton, M. J. (2001). Transcriptional profiling shows that Gcn4p is a master regulator of gene expression during amino acid starvation in yeast. Molecular and Cellular Biology
BIBLIOGRAPHIE 280
21(13), 4347-4368.
Nickerson, K. W., Atkin, A. L. & Hornby, J. M. (2006). Quorum sensing in dimorphic fungi: farnesol and beyond. Applied and Environmental Microbiology 72(6), 3805-3813.
Noordman, W. H., Reissbrodt, R., Bongers, R. S., Rademaker, J. L. W., Bockelmann, W. & Smit, G. (2006). Growth stimulation of Brevibacterium sp. by siderophores. Journal of Applied Microbiology 101(3), 637-646.
Nouaille, S., Even, S., Charlier, C., Le Loir, Y., Cocaign-Bousquet, M. & Loubière, P. (2009). Transcriptomic response of Lactococcus lactis in mixed culture with Staphylococcus aureus. Applied and Environmental Microbiology 75(13), 4473-4482.
Oh, D. H. & Marshall, D. L. (1993). Antimicrobial activity of ethanol, glycerol monolaurate or lactic acid against Listeria monocytogenes. International Journal of Food Microbiology 20(4), 239-246.
Ono, B. I., Hazu, T., Yoshida, S., Kawato, T., Shinoda, S., Brzvwczy, J. & Paszewski, A. (1999). Cysteine biosynthesis in Saccharomyces cerevisiae: a new outlook on pathway and regulation. Yeast (Chichester, England) 15(13), 1365-75.
Palková, Z. & Váchová, L. (2003). Ammonia signaling in yeast colony formation. In: A Survey of Cell Biology. pp. 229-272. Academic Press. (Volume 225). ISBN 0074-7696.
Park, H. & Bakalinsky, A. T. (2000). SSU1 mediates sulphite efflux in Saccharomyces cerevisiae. Yeast 16(10), 881-888.
Patton, E. E., Peyraud, C., Rouillon, A., Surdin-Kerjan, Y., Tyers, M. & Thomas, D. (2000). SCF(Met30)-mediated control of the transcriptional activator Met4 is required for the G(1)-S transition. The EMBO Journal 19(7), 1613-1624.
Peng, Z. & Verma, D. P. (1995). A rice HAL2-like gene encodes a Ca(2+)-sensitive 3'(2'),5'-diphosphonucleoside 3'(2')-phosphohydrolase and complements yeast met22 and Escherichia coli cysQ mutations. The Journal of Biological Chemistry 270(49), 29105-29110.
Penninckx, M. J. (2002). An overview on glutathione in Saccharomyces versus non-conventional yeasts. FEMS Yeast Research 2(3), 295-305.
Pereira, Y., Lagniel, G., Godat, E., Baudouin-Cornu, P., Junot, C. & Labarre, J. (2008). Chromate causes sulfur starvation in yeast. Toxicological Sciences: An Official Journal of the Society of Toxicology 106(2), 400-412.
Perlstein, E. O., De Bivort, B. L., Kunes, S. & Schreiber, S. L. (2007). Evolutionarily conserved optimization of amino acid biosynthesis. Journal of Molecular Evolution 65(2), 186-196.
Perpète, P., Duthoit, O., De Maeyer, S., Imray, L., Lawton, A. I., Stavropoulos, K. E., Gitonga, V. W., Hewlins, M. J. E. & Dickinson, J. R. (2006). Methionine catabolism in Saccharomyces cerevisiae. FEMS Yeast Research 6(1), 48-56.
Phartiyal, P., Kim, W., Cahoon, R. E., Jez, J. M. & Krishnan, H. B. (2006). Soybean ATP sulfurylase, a homodimeric enzyme involved in sulfur assimilation, is abundantly expressed in roots and induced by cold treatment. Archives of Biochemistry and Biophysics 450(1), 20-29.
Piłsyk, S., Natorff, R., Sieńko, M. & Paszewski, A. (2007). Sulfate transport in Aspergillus nidulans: a novel gene encoding alternative sulfate transporter. Fungal Genetics and Biology: FG & B 44(8), 715-25.
Pirkov, I., Norbeck, J., Gustafsson, L. & Albers, E. (2008). A complete inventory of all enzymes in the eukaryotic methionine salvage pathway. The FEBS Journal 275(16), 4111-
BIBLIOGRAPHIE 281
20.
Pócsi, I., Prade, R. A. & Penninckx, M. J. (2004). Glutathione, altruistic metabolite in fungi. Advances in Microbial Physiology 49, 1-76.
Price, G. D., Woodger, F. J., Badger, M. R., Howitt, S. M. & Tucker, L. (2004). Identification of a SulP-type bicarbonate transporter in marine cyanobacteria. Proceedings of the National Academy of Sciences of the United States of America 101(52), 18228-18233.
Raina, S., De Vizio, D., Odell, M., Clements, M., Vanhulle, S. & Keshavarz, T. (2009). Microbial quorum sensing: a tool or a target for antimicrobial therapy? Biotechnology and Applied Biochemistry 54(2), 65-84.
Ramet, J. P. (1997). Technologie comparée des différents types de caillés. In: Le fromage. Technique & Documentation, Lavoisier., pp. 333-364. Paris: A. Eck & J. C. Gillis.
Raux, E., McVeigh, T., Peters, S. E., Leustek, T. & Warren, M. J. (1999). The role of Saccharomyces cerevisiae Met1p and Met8p in sirohaem and cobalamin biosynthesis. The Biochemical Journal 338 ( Pt 3), 701-8.
Raymond, R. K., Kastanos, E. K. & Appling, D. R. (1999). Saccharomyces cerevisiae expresses two genes encoding isozymes of methylenetetrahydrofolate reductase. Archives of Biochemistry and Biophysics 372(2), 300-308.
Regenberg, B., Düring-Olsen, L., Kielland-Brandt, M. C. & Holmberg, S. (1999). Substrate specificity and gene expression of the amino-acid permeases in Saccharomyces cerevisiae. Current Genetics 36(6), 317-328.
Robichon-Szulmajster, H., Surdin, Y. & Mortimer, R. K. (1966). Genetic and biochemical studies of genes controlling the synthesis of threonine and methionine in Saccharomyces. Genetics 53(3), 609-619.
Romano, P., Ricciardi, A., Salzano, G. & Suzzi, G. (2001). Yeasts from Water Buffalo Mozzarella, a traditional cheese of the Mediterranean area. International Journal of Food Microbiology 69(1-2), 45-51.
Roostita, R. & Fleet, G. H. (1996a). The occurrence and growth of yeasts in Camembert and blue-veined cheeses. International Journal of Food Microbiology 28(3), 393-404.
Roostita, R. & Fleet, G. H. (1996b). Growth of yeasts in milk and associated changes to milk composition. International Journal of Food Microbiology 31(1-3), 205-219.
Rouillon, A., Surdin-Kerjan, Y. & Thomas, D. (1999). Transport of sulfonium compounds. Characterization of the s-adenosylmethionine and s-methylmethionine permeases from the yeast Saccharomyces cerevisiae. The Journal of Biological Chemistry 274(40), 28096-105.
Schaffrath, R. & Breunig, K. D. (2000). Genetics and molecular physiology of the yeast Kluyveromyces lactis. Fungal Genetics and Biology: FG & B 30(3), 173-190.
Scheibel, T., Bell, S. & Walke, S. (1997). S. cerevisiae and sulfur: a unique way to deal with the environment. The FASEB Journal: Official Publication of the Federation of American Societies for Experimental Biology 11(11), 917-921.
Schubert, H. L., Raux, E., Brindley, A. A., Leech, H. K., Wilson, K. S., Hill, C. P. & Warren, M. J. (2002). The structure of Saccharomyces cerevisiae Met8p, a bifunctional dehydrogenase and ferrochelatase. The EMBO Journal 21(9), 2068-2075.
Sekowska, A., Dénervaud, V., Ashida, H., Michoud, K., Haas, D., Yokota, A. & Danchin, A. (2004). Bacterial variations on the methionine salvage pathway. BMC Microbiology 4, 9.
Sieńko, M. & Paszewski, A. (1999). The metG gene of Aspergillus nidulans encoding cystathionine beta-lyase: cloning and analysis. Current Genetics 35(6), 638-46.
Sieńko, M., Topczewski, J. & Paszewski, A. (1998). Structure and regulation of cysD, the
BIBLIOGRAPHIE 282
homocysteine synthase gene of Aspergillus nidulans. Current Genetics 33(2), 136-44.
Sieuwerts, S., de Bok, F. A. M., Hugenholtz, J. & van Hylckama Vlieg, J. E. T. (2008). Unraveling microbial interactions in food fermentations: from classical to genomics approaches. Applied and Environmental Microbiology 74(16), 4997-5007.
Smith, F. W., Hawkesford, M. J., Prosser, I. M. & Clarkson, D. T. (1995). Isolation of a cDNA from Saccharomyces cerevisiae that encodes a high affinity sulphate transporter at the plasma membrane. Molecular & General Genetics: MGG 247(6), 709-715.
Snoek, I. S. I. & Steensma, H. Y. (2006). Why does Kluyveromyces lactis not grow under anaerobic conditions? Comparison of essential anaerobic genes of Saccharomyces cerevisiae with the Kluyveromyces lactis genome. FEMS Yeast Research 6(3), 393-403.
Soulignac, L. (1995). Propriétés des levures fromagères : Influence des sources de carbones utilisées sur leur aptitudes a désacidifier les caillés et à former des composés d’arôme. Diss. Paris: Institut National Agronomique Paris-Grignon.
Sourabié, A. M., Spinnler, H., Bonnarme, P., Saint-Eve, A. & Landaud, S. (2008). Identification of a powerful aroma compound in munster and camembert cheeses: ethyl 3-mercaptopropionate. Journal of Agricultural and Food Chemistry 56(12), 4674-4680.
Spinnler, H. E., Berger, C., Lapadatescu, C. & Bonnarme, P. (2001). Production of sulfur compounds by several yeasts of technological interest for cheese ripening. International dairy journal 11, 245-252.
Spinnler, H. E. & Corrieu, G. (1989). Automatic Method to Quantify Starter Activity Based on pH Measurement. Journal of Dairy Research 56(05), 755-764.
Sprague, G. F. & Winans, S. C. (2006). Eukaryotes learn how to count: quorum sensing by yeast. Genes & Development 20(9), 1045-9.
Sturino, J. M. & Klaenhammer, T. R. (2004). Bacteriophage defense systems and strategies for lactic acid bacteria. Advances in Applied Microbiology 56, 331-378.
Suleau, A., Gourdon, P., Reitz-Ausseur, J. & Casaregola, S. (2006). Transcriptomic analysis of extensive changes in metabolic regulation in Kluyveromyces lactis strains. Eukaryotic Cell 5(8), 1360-1370.
Suliman, H. S., Sawyer, G. M., Appling, D. R. & Robertus, J. D. (2005). Purification and properties of cobalamin-independent methionine synthase from Candida albicans and Saccharomyces cerevisiae. Archives of Biochemistry and Biophysics 441(1), 56-63.
Suzzi, G., Lanorte, M. T., Galgano, F., Andrighetto, C., Lombardi, A., Lanciotti, R. & Guerzoni, M. E. (2001). Proteolytic, lipolytic and molecular characterisation of Yarrowia lipolytica isolated from cheese. International Journal of Food Microbiology 69(1-2), 69-77.
Tai, S. L., Boer, V. M., Daran-Lapujade, P., Walsh, M. C., de Winde, J. H., Daran, J. M. & Pronk, J. T. (2005). Two-dimensional transcriptome analysis in chemostat cultures. Combinatorial effects of oxygen availability and macronutrient limitation in Saccharomyces cerevisiae. The Journal of Biological Chemistry 280(1), 437-47.
Tan, S., Greetham, D., Raeth, S., Grant, C. M., Dawes, I. W. & Perrone, G. G. (2010). The thioredoxin-thioredoxin reductase system can function in vivo as an alternative system to reduce oxidized glutathione in Saccharomyces cerevisiae. The Journal of Biological Chemistry 285(9), 6118-6126.
Tehlivets, O., Hasslacher, M. & Kohlwein, S. D. (2004). S-adenosyl-L-homocysteine hydrolase in yeast: key enzyme of methylation metabolism and coordinated regulation with phospholipid synthesis. FEBS Letters 577(3), 501-6.
BIBLIOGRAPHIE 283
Tejada-Jiménez, M., Llamas, A., Sanz-Luque, E., Galván, A. & Fernández, E. (2007). A high-affinity molybdate transporter in eukaryotes. Proceedings of the National Academy of Sciences of the United States of America 104(50), 20126-20130.
Thomas, D., Barbey, R., Henry, D. & Surdin-Kerjan, Y. (1992). Physiological analysis of mutants of Saccharomyces cerevisiae impaired in sulphate assimilation. Journal of General Microbiology 138(10), 2021-2028.
Thomas, D., Barbey, R. & Surdin-Kerjan, Y. (1990). Gene-enzyme relationship in the sulfate assimilation pathway of Saccharomyces cerevisiae. Study of the 3'-phosphoadenylylsulfate reductase structural gene. The Journal of Biological Chemistry 265(26), 15518-15524.
Thomas, D., Becker, A. & Surdin-Kerjan, Y. (2000). Reverse methionine biosynthesis from S-adenosylmethionine in eukaryotic cells. The Journal of Biological Chemistry 275(52), 40718-24.
Thomas, D., Cherest, H. & Surdin-Kerjan, Y. (1991). Identification of the structural gene for glucose-6-phosphate dehydrogenase in yeast. Inactivation leads to a nutritional requirement for organic sulfur. The EMBO Journal 10(3), 547–553.
Thomas, D., Rothstein, R., Rosenberg, N. & Surdin-Kerjan, Y. (1988). SAM2 encodes the second methionine S-adenosyl transferase in Saccharomyces cerevisiae: physiology and regulation of both enzymes. Molecular and Cellular Biology 8(12), 5132–5139.
Thomas, D. & Surdin-Kerjan, Y. (1991). The synthesis of the two S-adenosyl-methionine synthetases is differently regulated in Saccharomyces cerevisiae. Molecular & General Genetics: MGG 226(1-2), 224-32.
Thomas, D. & Surdin-Kerjan, Y. (1997). Metabolism of sulfur amino acids in Saccharomyces cerevisiae. Microbiology and Molecular Biology Reviews: MMBR 61(4), 503-32.
Thorsen, M., Lagniel, G., Kristiansson, E., Junot, C., Nerman, O., Labarre, J. & Tamás, M. J. (2007). Quantitative transcriptome, proteome, and sulfur metabolite profiling of the Saccharomyces cerevisiae response to arsenite. Physiological Genomics 30(1), 35-43.
Toelstede, S. & Hofmann, T. (2009). Kokumi-active glutamyl peptides in cheeses and their biogeneration by Penicillium roquefortii. Journal of Agricultural and Food Chemistry 57(9), 3738-3748.
Toledano, M. B., Kumar, C., Le Moan, N., Spector, D. & Tacnet, F. (2007). The system biology of thiol redox system in Escherichia coli and yeast: differential functions in oxidative stress, iron metabolism and DNA synthesis. FEBS Letters 581(19), 3598-3607.
Ubiyvovk, V. M., Blazhenko, O. V., Gigot, D., Penninckx, M. J. & Sibirny, A. A. (2006). Role of gamma-glutamyltranspeptidase in detoxification of xenobiotics in the yeasts Hansenula polymorpha and Saccharomyces cerevisiae. Cell Biology International 30(8), 665-671.
Uemura, T., Kashiwagi, K. & Igarashi, K. (2007). Polyamine uptake by DUR3 and SAM3 in Saccharomyces cerevisiae. The Journal of Biological Chemistry 282(10), 7733-7741.
Ullmann, P., Gondet, L., Potier, S. & Bach, T. J. (1996). Cloning of Arabidopsis thaliana glutathione synthetase (GSH2) by functional complementation of a yeast gsh2 mutant. European Journal of Biochemistry / FEBS 236(2), 662-669.
Ullrich, T. C., Blaesse, M. & Huber, R. (2001). Crystal structure of ATP sulfurylase from Saccharomyces cerevisiae, a key enzyme in sulfate activation. The EMBO Journal 20(3), 316–329.
Uria-Nickelsen, M. R., Leadbetter, E. R. & Godchaux, W. (1993). Sulfonate-sulfur assimilation by yeasts resembles that of bacteria. FEMS Microbiology Letters 114(1), 73-
BIBLIOGRAPHIE 284
77.
Váchová, L. & Palková, Z. (2005). Physiological regulation of yeast cell death in multicellular colonies is triggered by ammonia. The Journal of Cell Biology 169(5), 711-7.
Vido, K., Spector, D., Lagniel, G., Lopez, S., Toledano, M. B. & Labarre, J. (2001). A proteome analysis of the cadmium response in Saccharomyces cerevisiae. The Journal of Biological Chemistry 276(11), 8469-8474.
Viljoen, B. C. (2001). The interaction between yeasts and bacteria in dairy environments. International Journal of Food Microbiology 69(1-2), 37-44.
Viljoen, B. C. & Greyling, T. (1995). Yeasts associated with Cheddar and Gouda making. International Journal of Food Microbiology 28(1), 79-88.
Vinci, C. R. & Clarke, S. G. (2007). Recognition of age-damaged (R,S)-adenosyl-L-methionine by two methyltransferases in the yeast Saccharomyces cerevisiae. The Journal of Biological Chemistry 282(12), 8604-12.
Waters, C. M. & Bassler, B. L. (2005). Quorum sensing: cell-to-cell communication in bacteria. Annual Review of Cell and Developmental Biology 21, 319-346.
Weinbauer, M. G. (2004). Ecology of prokaryotic viruses. FEMS Microbiology Reviews 28(2), 127-181.
Weinbauer, M. G. & Rassoulzadegan, F. (2004). Are viruses driving microbial diversification and diversity? Environmental Microbiology 6(1), 1-11.
Wemmie, J. A., Szczypka, M. S., Thiele, D. J. & Moye-Rowley, W. S. (1994). Cadmium tolerance mediated by the yeast AP-1 protein requires the presence of an ATP-binding cassette transporter-encoding gene, YCF1. The Journal of Biological Chemistry 269(51), 32592-32597.
Wheeler, G. L., Quinn, K. A., Perrone, G., Dawes, I. W. & Grant, C. M. (2002). Glutathione regulates the expression of gamma-glutamylcysteine synthetase via the Met4 transcription factor. Molecular Microbiology 46(2), 545-56.
Wheeler, G. L., Trotter, E. W., Dawes, I. W. & Grant, C. M. (2003). Coupling of the transcriptional regulation of glutathione biosynthesis to the availability of glutathione and methionine via the Met4 and Yap1 transcription factors. The Journal of Biological Chemistry 278(50), 49920-49928.
Xu, S., Boylston, T. D. & Glatz, B. A. (2005). Conjugated linoleic acid content and organoleptic attributes of fermented milk products produced with probiotic bacteria. Journal of Agricultural and Food Chemistry 53(23), 9064-9072.
Zhang, M. Y., Bourbouloux, A., Cagnac, O., Srikanth, C. V., Rentsch, D., Bachhawat, A. K. & Delrot, S. (2004). A novel family of transporters mediating the transport of glutathione derivatives in plants. Plant Physiology 134(1), 482-491.
Zourari, A., Accolas, J. & Desmazeaud, M. (1992). Metabolism and biochemical characteristics of yogurt bacteria. A review. Le Lait 72(1), 34.
ABSTRACT
Sulphur metabolism, which has a central role in the cell, is also important during the
manufacturing of smear ripened cheeses. The cheese ecosystem degrades sulphur amino
acids, producing volatile sulphur compounds (VSCs) indispensable for the flavour of these
products.
We studied sulphur metabolism in two cheese-ripening microorganisms, the
hemiascomycetous yeasts Kluyveromyces lactis and Yarrowia lipolytica. The in silico analysis
of the phylum of hemiascomycetes gave us for the first time an evolutionary vision of this
metabolism. We found fundamental differences at the level of cysteine synthesis, but also at
the level of the enzymes involved in the production of VSCs. This analysis constitutes a solid
basis for the study of sulphur metabolism.
Thus, we combined several exploratory approaches (transcriptome, metabolome, VSCs
measurement) to have a global vision of this metabolism in K. lactis and Y. lipolytica. Major
differences are observed in particular at the level of cysteine and taurine biosynthesis
pathways. VSCs production seems to be connected to the surexpression of species-specific
transaminases combined with the accumulation of intracellular methionine.
Cheese ripening being dependent on a whole ecosystem, we also studied the interaction
between two cheese-ripening microorganisms, K. lactis and Brevibacterium aurantiacum, by
a transcriptomic approach comparing the genes expression of a co-culture to that of the pure
cultures. We observed profound metabolic modifications especially with respect to carbon