+ All Categories
Home > Documents > Ecotoxicology of Antimicrobial PPCPs in IL Rivers and Streams · •Low level PPCP release to...

Ecotoxicology of Antimicrobial PPCPs in IL Rivers and Streams · •Low level PPCP release to...

Date post: 13-Nov-2018
Category:
Upload: trinhkhanh
View: 216 times
Download: 0 times
Share this document with a friend
28
Ecological Impacts of Pharmaceutical and Personal Care Products in Illinois Rivers and Streams John Kelly Loyola University Chicago Department of Biology Emma Rosi-Marshall Cary Institute for Ecosystem Studies Teresa Chow / Monte Wilcoxon Illinois Sustainable Technology Center
Transcript

Ecological Impacts of Pharmaceutical

and Personal Care Products in Illinois

Rivers and Streams

John Kelly

Loyola University Chicago

Department of Biology

Emma Rosi-Marshall

Cary Institute for Ecosystem Studies

Teresa Chow / Monte Wilcoxon

Illinois Sustainable Technology Center

Pharmaceutical and Personal Care

Products (PPCPs)

• Prescription and non-prescription drugs:

• Antibiotics

• Analgesics

• Antihistamines

• Antacids

• Hormones

• Caffeine

• Household Products

• Antibacterials / Antimicrobials

Release of PPCPs to Environment

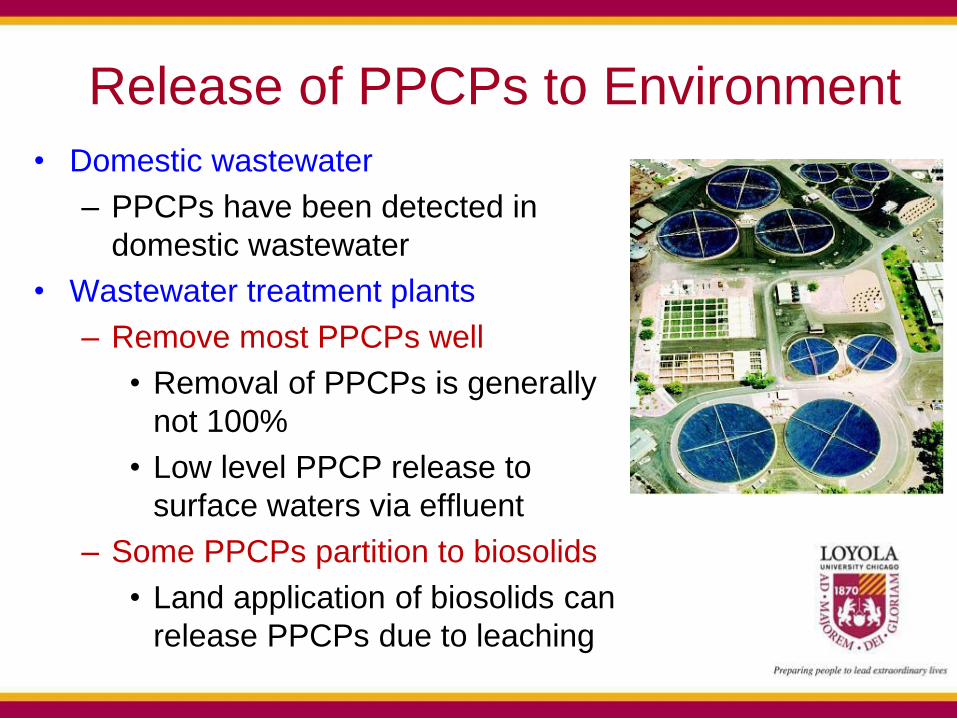
• Domestic wastewater

– PPCPs have been detected in

domestic wastewater

• Wastewater treatment plants

– Remove most PPCPs well

• Removal of PPCPs is generally

not 100%

• Low level PPCP release to

surface waters via effluent

– Some PPCPs partition to biosolids

• Land application of biosolids can

release PPCPs due to leaching

PPCPs have been detected in U.S.

rivers and streams • Kolpin et al. 2002 (USGS)

– Suite of 95 contaminants

– Surveyed 139 streams in 30 states

• Biased toward streams susceptible

to contamination

• Analyzed water only

– Found 82 of the 95 contaminants

– Contaminants in 80% of streams

– Concentrations were generally low

• 95% of the concentrations

measured were below 1 mg/L

Ecological effects of most PPCPs

are unknown

• PPCPs are biologically active

• PPCPs are likely to have

ecological effects:

• Classes of organisms

• Acute vs. Chronic effects

• Community composition

• Ecosystem processes

Triclosan

• 5-chloro-2-(2,4-dichlorophenoxy) phenol

• Potent antibacterial compound

• Discovered in 1960s

• Mode of action

– Blocks synthesis of lipids in bacteria

– Inhibits enoyl-acyl carrier protein reductase

• Used primarily in hospitals as an antiseptic and

disinfectant

• Between 1992 and 1999 700 products containing triclosan entered the consumer market in the US

• Currently found in:

– Soap

– Detergents

– Cleaning Products

– Toothpaste / Mouthwash

– Paint

• Has been embedded in

– Plastics

– Textiles

Triclosan

Triclosan has been detected in U.S.

rivers and streams

• Kolpin et al. 2002 (USGS)

– The most frequently detected compounds

were:

• Diethyltoluamide (insect repellant)

• Caffeine

• Triclosan (58% of streams)

• Trichloroethylphosphate (fire retardant)

– Concentrations in water were generally low

• Triclosan high 2.3 ug/L

• Triclosan median 0.14 ug/L

Why should we be concerned about

triclosan in streams ?
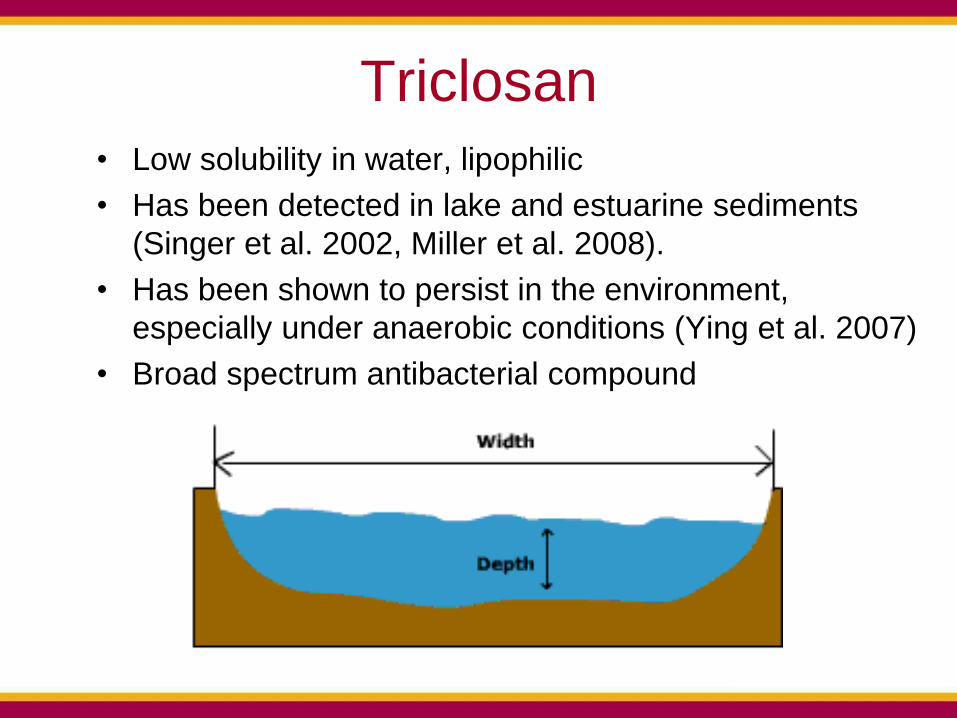
Triclosan

• Low solubility in water, lipophilic

• Has been detected in lake and estuarine sediments

(Singer et al. 2002, Miller et al. 2008).

• Has been shown to persist in the environment,

especially under anaerobic conditions (Ying et al. 2007)

• Broad spectrum antibacterial compound

Bacteria are significant contributors to

stream ecosystems

• Organic matter decomposition

– Nutrient release

• Nutrient Cycling

– Nitrogen

• Biomass production

– Base of stream food webs

• Denitrification

– Ameliorates nitrogen pollution

• Growth of triclosan sensitive E. coli for 200 generations in presence of low levels of triclosan produced triclosan resistant mutants (George and Levy, 1983)

• Molecular analysis of mutants revealed mutation in gene fabI (which encodes enoyl acyl carrier protein reductase) (McMurry, Oethinger, and Levy 1998)

Bacteria can develop

triclosan resistance

Escherichia coli

Possible links between triclosan

resistance and antibiotic resistance

• Triclosan exposure has been

shown to increase resistance to

antibiotics in

– Pseudomonas aeruginosa

• (Chuanchuen et al., 2001)

– Escherichia coli

• (Braoudaki and Hilton, 2004). Pseudomonas

aeruginosa

• Are there detectable levels of triclosan in waters and sediments of Illinois rivers and streams?

• Are the levels of triclosan in Illinois rivers and streams impacting the resident bacterial communities?

• How does triclosan impact the composition and function of sediment bacterial communities?

Questions to be addressed by our project

Experimental Design

Artificial Streams Field Survey

Artificial Streams: Pilot Study

• Two streams received:

• Sand and pea gravel (4:1)

• 200g of shredded leaves

• 100g sediment from Nippersink Creek

• Monitored weekly:

• Bacterial community size

• Heterotrophic plate counts

• Triclosan resistance

• Growth on triclosan amended plates

• Triclosan added week 8 (16ug/L)

0

50000

100000

150000

200000

250000

300000

350000

400000

450000

3 4 5 6 7 8 9 10 11

Ba

cte

ria

l C

ells

/ G

Dry

Se

dim

en

t

Week

Stream 1

Stream 2

Triclosan Addition

Artificial Streams: Plate Counts

0.00%

0.50%

1.00%

1.50%

2.00%

2.50%

3.00%

3.50%

4.00%

8 9 10 11

Pe

rce

nt T

ric

los

an

Re

sis

tan

ce

Week

Stream 1

Stream 2

Artificial Streams: Triclosan Resistance

Triclosan Addition

Artificial Streams: Next Steps

• Replicated experiment

– 5 streams per treatment

• Three treatments

– No triclosan

– Low triclosan

– High triclosan

• We will monitor

– Bacterial community size

– Triclosan resistance

– Activity

• Respiration, denitrification

– Community composition

Field Survey • Sites sampled to date

– Non-impacted site

• Nippersink Creek, McHenry

County IL

– Heavily Impacted: Urban WWTP

• North Shore Channel

– Moderately Impacted: Suburban

WWTP

• West Branch Dupage River

• Assays completed

– Bacterial community size

– Triclosan resistance

• Assay in progress

– Microbial activity

– Respiration

– Denitrification

– Community

composition

– Triclosan

concentration

• Total cell counts 3.7 x 10⁵

cfu / g dry sediment

• Triclosan resistance 0.66%

Field Survey: Nippersink Creek

Field Survey: North Shore Channel

• Receives effluent from the North

Side WWTP

• Serves over 1.3 million people

• Residing in a 141 square mile

area including the City of

Chicago north of Fullerton

Avenue and the northern

Cook County suburbs.

• The Plant has a design

capacity of 333 million gallons

per day

Field Survey: North Shore Channel

0

25,000

50,000

75,000

100,000

125,000

150,000

175,000

200,000

Upstream Downstream

CF

U g

-1d

ry s

ed

ime

nt

0.0%

0.5%

1.0%

1.5%

2.0%

2.5%

3.0%

3.5%

Upstream DownstreamT

ric

los

an

Re

sis

tan

ce

Bacterial Counts Triclosan Resistance

Field Survey: West Branch DuPage River

• Receives effluent from the West

Chicago WWTP

• The Plant has a design capacity

of 20 million gallons per day

Field Survey: West Branch DuPage River

0

50,000

100,000

150,000

200,000

250,000

Upstream Downstream

CF

U g

-1d

ry s

ed

ime

nt

0.0%

0.2%

0.4%

0.6%

0.8%

1.0%

1.2%

1.4%

1.6%

1.8%

2.0%

Upstream DownstreamT

ric

los

an

Re

sis

tan

ce

Bacterial Counts Triclosan Resistance

Field Survey • Sites sampled to date

– Non-impacted site

• Nippersink Creek, McHenry

County IL

– Heavily Impacted: Urban WWTP

• North Shore Channel

– Moderately Impacted: Suburban

WWTP

• West Branch Dupage River

• Assays completed

– Bacterial community size

– Triclosan resistance

• Assay in progress

– Microbial activity

– Respiration

– Denitrification

– Community

composition

– Triclosan

concentration

Field Survey: Next Steps

• Additional Field Sites

–Moderately Impacted: Suburban WWTP

–East Branch DuPage River

–Agricultural Sites

–Sites receiving biosolids

amendments

Acknowledgements

• Collaborators

• Emma Rosi-Marshall

• Teresa Chow

• Monte Wilcoxon

• Students

• Brad Drury

• Diana Deavila

• Funding

• Illinois Sustainable Technology Center


Recommended