Report No. 00000-EC Ecuador Country Economic Memorandum: Promoting Stable and Robust Economic Growth May 15, 2006 Economic Policy Group Poverty Reduction and Economic Management Sector Unit Bolivia-Ecuador-Peru-Venezuela Country Management Unit Latin America and the Caribbean Region Document of the World Bank
Transcript
Report No. 00000-EC
Ecuador Country Economic Memorandum:
Promoting Stable and Robust Economic Growth
May 15, 2006
Economic Policy Group Poverty Reduction and Economic Management Sector Unit Bolivia-Ecuador-Peru-Venezuela Country Management Unit Latin America and the Caribbean Region
Document of the World Bank
REPUBLIC OF ECUADOR–FISCAL YEARJanuary 1 – December 31
CURRENCY EQUIVALENTS(Exchange Rate Effective as of 05/12/2006)
Currency Unit = US dollar US$1.00 = US$1.00
WEIGHTS AND MEASURESMetric System
ABBREVIATIONS AND ACRONYMS
AAAR Environmental Authority of Responsible Application (Autoridad Ambiental de Aplicación Responsable)
AGD Deposit Guarantee Agency (Agencia de Garantía de Depósitos)
ALADI Latin American Integration Association (Asociación Latinoamericana de Integración)
ALCA/FTAA Free Trade Agreement of the Americas (Acuerdo de Libre Comercio de las Americas)
ATPDEA Andean Trade Promotion and Drug Eradication Act (Agencia de Promoción Comercial Andina y Erradicación de Droga)
BCE Central Bank of Ecuador (Banco Central de Ecuador) BEDE Development State Bank (Banco Del Estado) bpd Barrels per day CAE Country Assistance Evaluation CAE Ecuadorian Customs Administration (Corporación Aduanera
Ecuatoriana) CAF Andean Corporation (Corporación Andina de Fomento) CAN Andean Community of Nations (Comunidad Andina de
Naciones) CAS Country Assistance Strategy CCCC Civic Anti-Corruption Commission (Comisión de Control
Cívico de la Corrupción) CDES Center for Social and Economic Rights (Centro de
Derechos Económicos y Sociales) CEIREP National Commission for Stabilization, Social and
Productive Investment and Reduction of Public Debt (Comisión de Estabilización, Inversión Social y Productiva y Reducción del Endeudamiento Público)
CENACE National Center for Energy Control (Corporación Centro Nacional de Control de Energía)
CETES Treasury Certificates (Certificados de Tesorería) CFFA Country Financial and Accountability Assessment CFN National Finance Corporation (Corporación Financiera
Nacional) CG Central Government COMEXI Foreign Trade and Investment Council (Consejo de Comercio
Exterior e Inversiones) CONADES National Council of Wages (Consejo Nacional de Salarios) CONAM National Council for Modernization of the State (Consejo
Nacional de Modernización del Estado) CONAREM National Commission of Remunerations (Consejo Nacional
de Remuneraciones) CONATEL Telecom National Council (Consejo Nacional de
Telecomunicaciones) CONELEC National Electricity Council (Consejo Nacional de
Electricidad) CPAR Country Procurement Assessment Report CSO Civil society organizations DPLs Development Policy Lending DRP Debt Reduction Plan DSA Debt Sustainablility Analysis
ECORAE Fund for the Development of the Amazon Region (Ecodesarrollo de la Región Amazónica Ecuatoriana)
ECV Living Standards Measurement Survey (Encuesta Sobre Las Condiciones de Vida)
EMBI+ Emerging Market Bonds Index Plus FCCGL Fiscal Consolidation and Competitive Growth Loan FEIREP Fund for Stabilization, Investment, and Public Debt
Reduction (Fondo de Estabilización, Inversión Social y Productiva y Reducción de Endeudamiento)
FISE Social Emergency Investment Fund (Fondo de Inversión Social de Emergencia)
FONSEL Electricity Sector Fund FS Solidarity Fund (Fondos de Solidaridad) FTA Free Trade Agreement FTAA Free Trade Area of the Americas FTSRL Fiscal Transparency, Stabilization and Responsibility Law GDP Gross Domestic Product GNFS Goods and Non-Factor Services GOE Government of Ecuador GTZ Gesselschaft fuer Technische Zusammenarbeit, German
technical Cooperation IBRD International Bank for Reconstruction and Development ICA Investment Climate Assessment ICE Special Consumption Tax (Impuesto a los Consumos Especiales) ICR Implementation Completion Report IDB Inter-American Development Bank IESS Ecuadorian Social Security Institute (Instituto Ecuatoriano de
Seguridad Social) IMF International Monetary Fund INEC National Statistics Institute (Instituto Nacional de Estadísticas y
Censos) INNFA National Institute for Chindren and Families (Instituto
Nacional de la Niñez y la Familia) IPS Inter-banking payment system IRS/SRI Internal Revenue Service (Servicio de Rentas Internas) ISM Intensified Surveillance Mechanism ISR Income tax (Impuesto Sobre la Renta) JSDF Japan Social Development Fund LAC Latin America and the Caribbean Region LOAFYC Statutory Law of Financial Administration and Control
(Ley Orgánica de Administración Financiera y Control) LOCGE Organic Control Law (Ley Orgánica de la Contraloría General
del Estado) MDGs Millennium Development Goals MEF Ministry of Economy and Finance MEM Ministry of Energy and Mines MET Multiyear Program and Policy Reform MICIP Ministry of Commerce, Industry and Fishing (Ministerio de
Comercio Exterior, Industrializacion, Pesca y Competitividad) MIDUVI Ministry of Urban Development and Housing (Ministerio de
Desarrollo Urbano y Vivienda) ML Ministry of Labor NFPS Non-Financial Public Sector NTBs Non-tariff barriers OCP Heavy crude oil pipeline (Oleoducto de Crudo Pesado) OECD Organization for Economic Co-operation and
Development OED Operational Evaluation Department PA Poverty Assessment PANN National Program of Feeding and Nutrition (Programa de
Nutrición y Alimentación a la Niñez) PER Public Expenditure Review PERHD Program for Economic Restructuring and Human
Development Petroecuador State-owned Petroleum Company (Empresa Estatal Petróleos
del Ecuador) PFM Public Financial Management PHRD Public Human Resources Development PIB Gross domestic product (GDP) (Producto Interno Bruto) PRG Reference Price for Power Generation (Precio de Referencia
para Generadores)�PRSP Poverty Reduction Strategy Paper
RDOs Regional Development Organizations RER Real exchange rate ROSC Report on the Observance of Standard and Codes SAL Structural Adjustment Loan SAPRI Structural Adjustment Participatory Review Initiative SAPSRS Subsecretariat for Water Supply, Basic Sanitation and
Solid Waste (Subsecretaria de Agua Potable, Saneamiento y Residuos Sólidos)
SBA Stand-By Arrangement SCL Single Currency Loan SECAL Sectoral Expenditure Credit and Adjustment Loans SEDs Socio-Environmental Diagnostics SENRES National Secretariat for Remunerations (Secretaria Nacional
Técnica de Desarrollo de Recursos Humanos y Remuneraciones) SIGEF Integrated Government Financial Management System
(Sistema Integrado de Gerencia Económica y Financiera) SIISE Integrated System of Ecuadorian Social Indicators
(Sistema Integrado de Indicadores Sociales del Ecuador)
SPA Subsecretary for Environmental Protection (Subsecretaria de Protección Ambiental)
SRI/IRS Internal Revenue Service (Servicio de Rentas Internas) SSI Social Security Institute (Instituto de Seguridad Social) SUMA Unified System of Environmental Management (Sistema
Único de Manejo Ambiental) TAL Technical Assistance Loan TFSSED Trust Fund for the Social Sectors and Environment TRSL Tax Rationalization and Simplification Law UNDP United Nations Development Program UNICEF United Nations Children’s Fund USAID United States Agency for International Development VAT Value-added tax WB World Bank WTO World Trade Organization WTI West Texas Intermediate
Vice President: Pamela Cox Country Director: Marcelo Giugale Sector Director: Ernesto May Sector Manager Mauricio Carrizosa Lead Economist: Vicente Fretes-Cibils Task Team Leader: Carolina Sanchez-Paramo
Acknowledgements The Ecuador Country Economic Memorandum was prepared by a team led by Carolina Sanchez-Paramo and including Ramon Espinasa (consultant), Jorge Gallardo (consultant), Fernando Hernandez-Casquet (World Bank), Leonid Koryukin (World Bank), Martha Denisse Pierola (World Bank), and Raimundo Soto (consultant). Many thanks are due to:
• Carlos Silva-Jauregui, Augusto de la Torre, and Roberto Zagha are peer reviewers, and to Federico Sturzenegger as Quality Enhancing Advisor.
• Sara Calvo, Mauricio Carrizosa, Pablo Fajnzylber, Vicente Fretes, Conrado Garcia, Eduardo Somensatto and Elaine Tinsley for valuable inputs and comments.
• Galo Arias and his team from the Instituto Nacional de Estadistica y Censos del Ecuador (INEC); Diego Mancheno and his team in the Banco Central del Ecuador; and Paula Suarez in the Ministewrio de Economia y Finanzas for granting the team access to the data and other documents used for the analysis.
• Members of the Ecuador Country Team and staff at the World Bank office in Quito for assistance in Washington and Ecuador.
• Michael Geller for support in the preparation of the final document.
TABLE OF CONTENTS INTRODUCTION................................................................................................................................................... i EXECUTIVE SUMMARY ........................................................................................................................................ 1. ECUADOR’S ECONOMIC PERFORMANCE: TAKING STOCK .....................................................
Sources of Economic Growth: A Macroeconomic Perspective...................................................................................... Sources of Economic Growth................................................................................................................................................ Long-term Growth: Determinants and Prospects.............................................................................................................. Conclusions ................................................................................................................................................................................ 2. GROWTH AND JOBS .......................................................................................................................... Aggregate Economic Growth and Employment Creation.............................................................................................. Microeconomic Constraints to Employment Creation ..................................................................................................... Conclusions ................................................................................................................................................................................ 3. PROMOTING STABLE ECONOMIC GROWTH ..............................................................................
Fiscal Policy and Debt Management ..................................................................................................................................... Evolution of the Fiscal Panorama and Fiscal Policy.......................................................................................................... Debt Performance and Sustainability.................................................................................................................................... Conclusions and Policy Recommendations for Fiscal Stability and Debt Sustainability............................................ 4. FINANCIAL MANAGEMENT AND THE BANKING SECTOR...................................................... Recent Performance of the Banking Sector......................................................................................................................... The Banking Sector in a Dollarized Context: A Simple Comparison Exercise............................................................ Moving Forward: The Importance of Liquidity Management......................................................................................... Conclusions and Policy Recommendations ......................................................................................................................... 5. PROMOTING ROBUST ECONOMIC GROWTH: AN INTRODUCTION ..................................... Performance of the Oil Sector, 1990–2024 ......................................................................................................................... .......................................................................................................................................................................................... .......................................................................................................................................................................................... 6. TRADE AND OPENNESS AND ECONOMIC GROWTH................................................................ Evolution of Trade in Ecuador: Recent Trends ................................................................................................................. Why Should Ecuador Care about Trade? Trade, Productivity and Economic Growth ............................................. What is Behind Ecuador’s Poor Trade Performance? An Overview of Ecuador’s Trade, Structure, Institutions and Trade Policy................................................................................................................... Ecuador’s Free Trade Agreement with the US and Overall Trade Prospects .............................................................. Conclusions and Policy Recommendations ......................................................................................................................... BIBLIOGRAPHY...................................................................................................................................................... MAP................................................................................................................................................inside back cover ANNEXES Annex 1: Data Sources and Definitions in Chapter 1................................................................................................................................. Annex 2: Advantages and Disadvantages of Various Labor Reform Options ...................................................................................... Annex 3: A Snapshot of Ecuador’s Business Environment...................................................................................................................... Annex 4: An Evaluation of the Ley de Rehabilitacion Productiva and Its Potential Impact on the Banking Sector ............................ TABLES Table 1.1: Sources of Aggregate Growth, 1960–2004 ................................................................................................................................ Table 1.2: Sectoral Decomposition of Aggregate Growth, 1990–2004 .................................................................................................. Table 1.3: Determinants of Growth , 1960–2003........................................................................................................................................ Table 1.4: Contribution of Growth Determinants to Long-term Growth, 1960–2003....................................................................... Table 1.5: Potential Growth Estimates.......................................................................................................................................................... Table 2.1: Capital Goods Imports and Foreign Direct Investment......................................................................................................... Table 2.2: Education Levels Among the Adult Population....................................................................................................................... Table 2.3: Employment Protection Legislation............................................................................................................................................
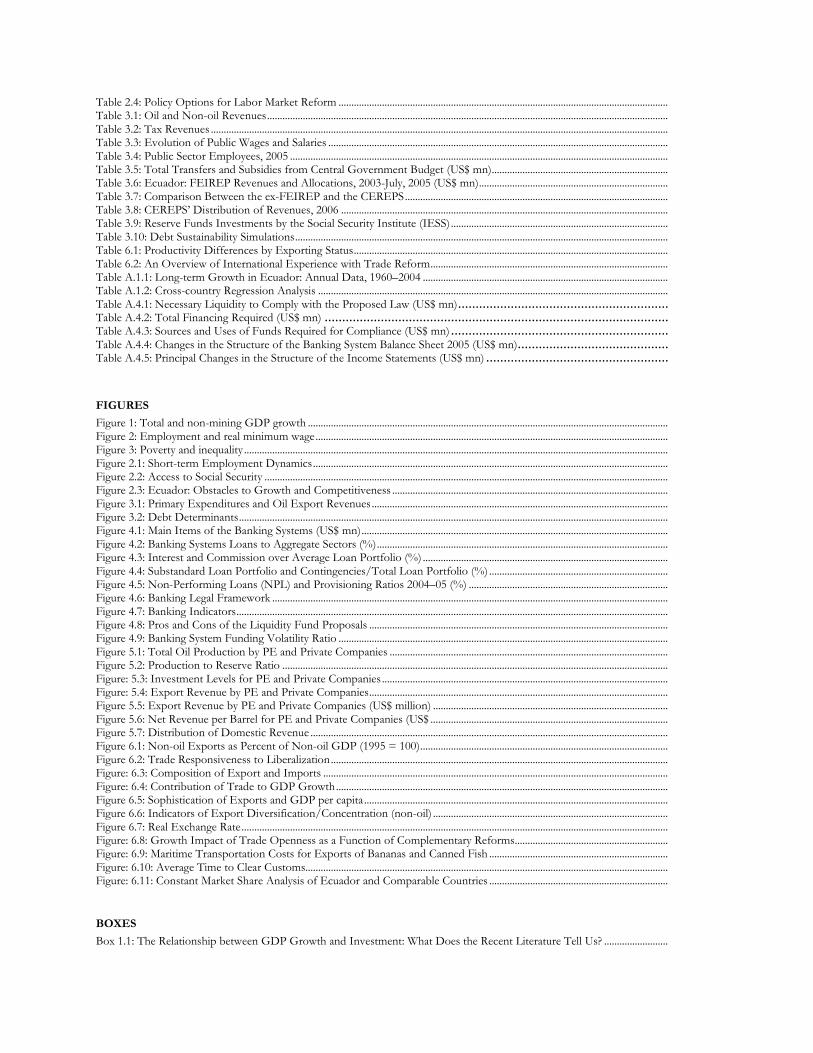
Table 2.4: Policy Options for Labor Market Reform ................................................................................................................................. Table 3.1: Oil and Non-oil Revenues............................................................................................................................................................. Table 3.2: Tax Revenues ................................................................................................................................................................................... Table 3.3: Evolution of Public Wages and Salaries ..................................................................................................................................... Table 3.4: Public Sector Employees, 2005 .................................................................................................................................................... Table 3.5: Total Transfers and Subsidies from Central Government Budget (US$ mn)..................................................................... Table 3.6: Ecuador: FEIREP Revenues and Allocations, 2003-July, 2005 (US$ mn).......................................................................... Table 3.7: Comparison Between the ex-FEIREP and the CEREPS....................................................................................................... Table 3.8: CEREPS’ Distribution of Revenues, 2006 ................................................................................................................................ Table 3.9: Reserve Funds Investments by the Social Security Institute (IESS)..................................................................................... Table 3.10: Debt Sustainability Simulations.................................................................................................................................................. Table 6.1: Productivity Differences by Exporting Status........................................................................................................................... Table 6.2: An Overview of International Experience with Trade Reform............................................................................................. Table A.1.1: Long-term Growth in Ecuador: Annual Data, 1960–2004 ................................................................................................ Table A.1.2: Cross-country Regression Analysis ......................................................................................................................................... Table A.4.1: Necessary Liquidity to Comply with the Proposed Law (US$ mn)............................................................ Table A.4.2: Total Financing Required (US$ mn) .................................................................................................. Table A.4.3: Sources and Uses of Funds Required for Compliance (US$ mn) .............................................................. Table A.4.4: Changes in the Structure of the Banking System Balance Sheet 2005 (US$ mn)........................................... Table A.4.5: Principal Changes in the Structure of the Income Statements (US$ mn) ....................................................
FIGURES Figure 1: Total and non-mining GDP growth ............................................................................................................................................. Figure 2: Employment and real minimum wage.......................................................................................................................................... Figure 3: Poverty and inequality ...................................................................................................................................................................... Figure 2.1: Short-term Employment Dynamics........................................................................................................................................... Figure 2.2: Access to Social Security .............................................................................................................................................................. Figure 2.3: Ecuador: Obstacles to Growth and Competitiveness ............................................................................................................ Figure 3.1: Primary Expenditures and Oil Export Revenues .................................................................................................................... Figure 3.2: Debt Determinants........................................................................................................................................................................ Figure 4.1: Main Items of the Banking Systems (US$ mn)........................................................................................................................ Figure 4.2: Banking Systems Loans to Aggregate Sectors (%).................................................................................................................. Figure 4.3: Interest and Commission over Average Loan Portfolio (%) ................................................................................................ Figure 4.4: Substandard Loan Portfolio and Contingencies/Total Loan Portfolio (%) ...................................................................... Figure 4.5: Non-Performing Loans (NPL) and Provisioning Ratios 2004–05 (%) .............................................................................. Figure 4.6: Banking Legal Framework ........................................................................................................................................................... Figure 4.7: Banking Indicators......................................................................................................................................................................... Figure 4.8: Pros and Cons of the Liquidity Fund Proposals ..................................................................................................................... Figure 4.9: Banking System Funding Volatility Ratio ................................................................................................................................. Figure 5.1: Total Oil Production by PE and Private Companies ............................................................................................................. Figure 5.2: Production to Reserve Ratio ....................................................................................................................................................... Figure: 5.3: Investment Levels for PE and Private Companies ................................................................................................................ Figure: 5.4: Export Revenue by PE and Private Companies..................................................................................................................... Figure 5.5: Export Revenue by PE and Private Companies (US$ million) ............................................................................................ Figure 5.6: Net Revenue per Barrel for PE and Private Companies (US$ ............................................................................................. Figure 5.7: Distribution of Domestic Revenue ............................................................................................................................................ Figure 6.1: Non-oil Exports as Percent of Non-oil GDP (1995 = 100)................................................................................................. Figure 6.2: Trade Responsiveness to Liberalization.................................................................................................................................... Figure: 6.3: Composition of Export and Imports ....................................................................................................................................... Figure: 6.4: Contribution of Trade to GDP Growth.................................................................................................................................. Figure 6.5: Sophistication of Exports and GDP per capita....................................................................................................................... Figure 6.6: Indicators of Export Diversification/Concentration (non-oil) ............................................................................................ Figure 6.7: Real Exchange Rate....................................................................................................................................................................... Figure: 6.8: Growth Impact of Trade Openness as a Function of Complementary Reforms............................................................ Figure: 6.9: Maritime Transportation Costs for Exports of Bananas and Canned Fish ...................................................................... Figure: 6.10: Average Time to Clear Customs.............................................................................................................................................. Figure: 6.11: Constant Market Share Analysis of Ecuador and Comparable Countries ......................................................................
BOXES Box 1.1: The Relationship between GDP Growth and Investment: What Does the Recent Literature Tell Us? .........................
Box 3.1: Actual Allocation of FEIREP Revenues....................................................................................................................................... Box 3.2: Tax Incentives Law........................................................................................................................................................................... . Box 4.1: Deposit Guarantee Agency-AGD .................................................................................................................................................. Box 5.1: Price and Tax Distortions in Ecuador’s Oil Sector..................................................................................................................... Box 5.2: Contractual Uncertainty in the Oil Sector..................................................................................................................................... Box 5.3: The Case of the ITT Fields.............................................................................................................................................................. Box 6.1: Trade and Economic Growth—A Review of the Literature .................................................................................................... Box 6.2: Imports of Inputs and Capital Goods and Productivity ............................................................................................................ Box 6.3: Costs in the Supply Chain of Broccoli........................................................................................................................................... Box 6.4: Measuring the Effects of the FTA with the US...........................................................................................................................
i
PROMOTING STABLE AND ROBUST ECONOMIC GROWTH IN ECUADOR
EXECUTIVE SUMMARY
ES.1 Ecuador’s disappointing performance in terms of economic growth over the past few decades can be explained by political instability, which results in volatile economic policy and poor governance, and by the low quality of the country’s institutional framework and, more broadly, its investment climate. These factors severely constrain Ecuador’s capacity to transform human and physical capital accumulation, and increased access to international markets into higher growth and employment creation. Interventions aimed at lifting some of these constraints hold significant promise in terms of helping Ecuador tap into unrealized growth opportunities.
ES.2 Ecuador’s GDP (and GDP per capita) growth has been low and extremely volatile over the last four decades, despite significant investment efforts, a relative abundance of labor and, more recently, increases in trade openness. As a consequence aggregate economic growth has failed to translate into higher employment and, ultimately, lower poverty rates.
ES.3 Poor economic performance during this period is the result of slow and volatile productivity growth, where productivity is measured as Total Factor Productivity (TFP), domestic policy mismanagement and external shocks (i.e. terms-of-trade shocks). For the purpose of the analysis, TFP is interpreted as a comprehensive measure of both the quality of labor and capital, as well as the quality of the economic environment in which production, and hence growth, takes place. Similarly domestic policy encompasses fiscal, monetary and exchange rate policy.
ES.4 Understanding the nature and impact of existing constraints to economic growth and providing concrete and actionable recommendations aimed at easing or fully eliminating them constitutes the primary objective of this report. These constraints range from overall country conditions, such as political instability and institutional weaknesses, to factors that can be considered more economic in nature, such as the quality of domestic policy or the country’s investment climate. Although there is no doubt that the first set of constraints (i.e. primary or fundamental constraints) has enormous bearing on the second (i.e. secondary or sectoral constraints), a detailed analysis of their nature and impact is beyond the scope of this report. Rather the report will examine the second set of constraints, in themselves necessary conditions for sustained economic growth, with the understanding that the effectiveness of the proposed policy reforms is to some extent a function of deeper political and institutional issues.
ES.5 The material is organized around three complementary topics or areas for discussion: (i) Ecuador’s long-term growth patterns (Part I); (ii) pre-conditions for stable growth, which we understand to be fiscal solvency and a healthy financial system (Part II); and (iii) potential engines of robust growth, which we identify as the oil sector and trade openness (Part III).
ES.6 A brief summary of the report’s main results and conclusions is presented below and a synthetic reform agenda that highlights the report’s main recommendations is provided at the end of this executive summary.
A. Ecuador’s economic performance: Taking stock
ES.7 Positive economic growth and welfare improvements in the early 1990s were replaced by slow growth and the deterioration of economic performance during the second half of the decade. The 1998-9 crisis and its dramatic effects on GDP and inflation triggered the adoption of the US dollar in 2000. This measure helped control inflation and stabilize the economy and, as a result, positive, yet still sluggish, economic growth resumed in 2001 and 2002. The post-dollarization recovery was also fueled by a significant hike in the international price of oil and, in 2004, by the entry into operation of the new crude oil pipeline (Oleoducto de Crudos Pesados, OCP), which allowed for a substantial increase in oil exports.
ii
ES.8 Recent aggregate GDP growth rates, however, mask important differences between the performance of the oil and non-oil sectors. After growing rapidly in 2001 and 2002, economic growth in the non-oil sector has fallen dramatically. In addition, aggregate economic growth has failed to translate into higher employment and, eventually, lower poverty levels. Understanding Ecuador’s long-term growth patterns can provide important insights into the country’s more recent performance.
Sources of economic growth: A macroeconomic perspective
ES.9 Ecuador’s economic growth during 1960-2004, measured by GDP per working-age adult, was slow and volatile—i.e. the average growth rate for the period was 1.2 percent per year. Only during the 1970s and, to a lesser extent, after the adoption of the dollar in 2000 did Ecuador enjoy a period of substantial and sustained economic growth. The 1960s and the 1980s, on the other hand, were marked by instability and protracted slow growth, with GDP per working age adult declining at 0.8 percent per year.
ES.10 Economic growth during this period was largely fueled by productivity gains, while the contributions of physical capital accumulation and employment growth were more modest. These results are robust to the inclusion of human capital as a factor of production. TFP growth is the main driving force behind positive economic growth in the 1970s and, to a lesser extent, the 1960s and the years since dollarization. Similarly negative TFP growth has often translated into negative economic growth, as was the case in the 1980s. In contrast capital accumulation during the 1980s and, to a lesser extent, the 1990s did not necessarily translate into increases in productivity and GDP. The weak relationship between investment and economic growth can be attributed to (i) most new investment being concentrated in the oils sector and thus having little impact on the functioning of the rest of the economy, combined with (ii) the existence of macro and microeconomic constraints that dampened the potential productivity of new investments.
ES.11 A close examination of the determinants of long-term economic growth in Ecuador shows that the country’s economic performance during 1960-2004 was below what would have been expected given its endowments, and economic and social conditions and institutions. In particular Ecuador underperformed in terms of economic growth in 25 out of the 43 years considered for the analysis (i.e. mostly during the 1960s, the second half of the 1980s and the 1990s), while, higher than expected growth during 1970-1985 was largely driven by positive terms-of-trade shocks associated with the oil price hikes of 1973 and 1978, as well as by conditional convergence factors.
ES.12 The main reasons behind this disappointing outcome are unstable domestic policies (fiscal, monetary and exchange rate policy) and financial shocks. Policy mismanagement, captured through the government burden and the inflation rate, affected economic growth negatively. This is consistent with the discussion in the recent Ecuador Poverty Assessment (World Bank, 2004a), which showed that economic growth would have been higher and the unemployment and poverty rates lower had Ecuador operated under a full stabilization scenario during 1960-2003. Similarly external and domestic financial crisis were associated with lower levels of predicted growth. The former played an important role in explaining negative potential growth rates during 1980-84, while the latter significant diminished predicted growth levels in 1995-99 and 2000-2003.
ES.13 In addition, Ecuador’s poor investment climate may have limited the potential positive impact of physical and capital accumulation and of trade openness. A comparison of Ecuador’s actual performance to that of two counterfactual scenarios, in which Ecuador’s endowments, policies and institutions are made equal to those of the average developed and the average developing countries respectively, shows that improvements in the country’s investment climate, proxied by measures of infrastructure, financial depth and governance, hold significant promise in unleashing its growth potential. In particular reforms leading to expansions in infrastructure would have a potential upper bound impact of an additional 1.2 and 0.2 percentage points of growth when compared to the levels of the developed and developing countries respectively. Similarly, although Ecuador's current levels of credit to the private sector are similar to those of other developing economies, there is potential for an additional 0.5 percentage point of
iii
growth if access to credit is expanded to reach the levels of more developed economies. Finally Ecuador lags notoriously behind developed economies in terms of governance. The country has suffered from significant political and economic instability during the last decade. Even when compared to developing countries, Ecuador displays a very negative record: governance was among the lowest in the world in the 2000-2003 period and crises followed one another. Ecuador's governance level is similar to that of Bolivia (a case of chronic instability) and second only to countries in a state of virtual civil war, such as Colombia. This is an area where reforms, though difficult, could yield substantial benefits in terms of economic growth and, more importantly, welfare.
Growth and jobs
ES.14 Recent economic growth has failed to translate into higher employment creation. Employment recovered slightly after the crisis but this recovery has been short-lived, while unemployment levels have remained stubbornly around 10-11 percent since 2000.
ES.15 Lack of dynamism in aggregate labor demand and employment creation is the result of slow economic growth and of changes in relative prices brought about by the dollarization. The estimated long-term output elasticity of employment for 1990-2004 is slightly smaller than 1—i.e. a 1 percentage point increase in GDP growth leads to a 0.8 percent point increase in employment levels. Considering that the average annual growth rate for the Ecuadorian economy during 1990-2004 was approximately 1.6 percent and that minimum real wages increased by approximately 60 percent in the same period, lack of dynamism in labor demand should come as no surprise. In addition changes in relative prices brought about by the dollarization process have played against employment creation. Since 2000 real wages have increased by about 30 percent (significantly above labor productivity) while the real cost of domestic and imported capital has declined steadily. Together these changes imply that labor is becoming a more expensive factor of production and, thus, generate incentives for employers to substitute away from labor.
ES.16 At the micro level employment creation is correlated with productivity growth, which in turn is a function of education, and access to technology and markets. According to data from the Ecuador Investment Climate Survey, firms that created employment in recent years are generally more productive than their competitors due to higher education levels among their workers, more intense use of foreign technology (presumably more advanced than domestic technology), and higher exposure to international competition (World Bank, 2004a).
ES.17 Unfortunately Ecuador presents serious deficiencies in terms of both labor force education levels and access to technology and international markets (see more on the latter below). Ecuador exhibits an important deficit of secondary educated workers. Only 18 percent of all adults have secondary studies, compared to 28 percent in Peru and 46 percent in Bolivia, while secondary enrolment rates are, at 46 percent, 8 percentage points below what would be expected given Ecuador’s income level. Access to foreign technology is also limited. Although foreign direct investment grew from 0.5 percent of GDP in 1980 to 5.9 of GDP in 2000, surpassing the regional average, most of the increase was concentrated in the oil sector, thus generating almost no externalities. In addition, the levels of both imports of capital goods and expenditures in R&D, needed to successfully adapt the technology embedded in those goods, are low (De Ferranti at al, 2003).
ES.18 Moreover increases in productivity may fail to translate into higher employment creation in the presence of certain barriers. Firms interviewed in the Ecuador Investment Climate Survey identify three types of barriers: labor legislation – in particular, that regarding non-wage and firing costs -, economic uncertainty, and the quality of the institutional and investment climate.
ES.19 As a result stable and sound fiscal policy and a healthy banking and financial system, combined with productivity-enhancing reforms, such as improvements in education, access to technology and markets, and the country’ investment climate, could go a long way in promoting
iv
stable and robust economic growth and employment creation in Ecuador. Some of these reforms may require additional resource and significant political will, but they payoffs associated with them are substantial.
B. Foundations of stable economic growth
ES.20 Fiscal solvency, debt sustainability, and well-functioning financial and banking systems are among the key preconditions needed for a dollarized economy to function successfully. As dollarization precludes the use of monetary and exchange rate policies, fiscal policy is the only economic tool the government has to guide the economy. Debt sustainability, on the other hand, monitors the profligacy of fiscal policy and keeps government finances in check, thereby lowering the country’s risk and uncertainty. Finally, a healthy banking system with an adequate institutional and regulatory framework is necessary for efficient intermediation and functioning of the payment system.
Fiscal policy and debt management
ES.21 Ecuador’s fiscal performance has improved and the debt-to-GDP ratio has declined significantly following dollarization. The Non-Financial Public Sector (NFPS) overall balance went from a deficit of 3.3 percent of GDP to a surplus of 1.3 percent of GDP between 1995-99 and 2000-2005, while primary surplus increased from 1.2 to 4.6 of GDP during the same period. These improvements were mainly the result of increases in total revenues, particularly oil revenues and taxes. In addition recent economic growth, fueled to a large extent by high international oil prices, has helped Ecuador reduce its debt-to-GDP ratio to approximately 40 percent, down from 70 percent in 2001, and hence curtail the country’s vulnerability.
ES.22 However important structural fiscal management problems remain, including high dependency of the NFPS and Central Government (CG) budgets on oil revenues, rapid growth of recurrent expenditures (especially wages and salaries and debt service), and significant budgetary rigidity associated with earmarking. In recent years (primary) expenditures have grown hand in hand with growth oil revenues. This increases budgetary dependency on oil revenues, as evidenced by the deterioration of the non-oil NFPS deficit from -2.4 to -5.0 percent of GDP between 2003 and 2005, and it creates new permanent obligations that will have to be honored in future budgets regardless of actual revenues. The main sources of expenditure growth during this period are increases in public wages and salaries payments, resulting from both higher monthly salaries and growing numbers of public employees, and higher debt service payments, resulting from increased gross financial needs associated with the use of domestic short-term debt to manage liquidity mismatches. Finally earmarking of non-oil and oil revenues and an array of subsidies continue to erode budget flexibility and encumber the efficient allocation of fiscal resources. The 2006 Central Government budget is allocating 77.5 percent of total revenues, net of public financing, to subsidies and earmarked expenditures. These represent significant resources that are poorly targeted and therefore should be gradually reduced to improve fiscal allocation and also to restore an already rigid budget situation.
ES.23 In addition, recent legislative changes have substantially undermined the integrity of the existing fiscal management framework regarding revenue and expenditure management, as well as Treasury liquidity and public debt management. The amendment of the Ley de Responsabilidad y Transparencia Fiscal (FRTL), together with the introduction of new legislation to promote investment through tax incentives and the approval of the devolution of the Social Security reserve funds to individual beneficiaries, undermine the fiscal management framework in a number of ways. They lift limitations on expenditure growth, modify the allocation of oil revenues in a manner that discourage public savings and aggravate existing short-term liquidity management problems, with the end result of an economy that is more vulnerable to adverse international conditions and/or a natural disaster.
v
ES.24 The combination of an overall weaker fiscal management framework and the mounting pressures generally associated with election years, such as 2006, pose important risks in terms of fiscal solvency whose impact could extend well beyond this fiscal year. Although recent actions by MEF to continue to reduce the debt-to-GDP ratio taking advantage of favorable conditions in international financial markets are a step in the right direction, further efforts are needed to strengthen the country’s fiscal stance and to ensure that fiscal policy remains on solid and stable grounds going forward. Some of these efforts will have to be directed at reversing or minimizing the impact of recent legislative changes, as discussed above. This will be a difficult task, but one that cannot be postponed.
Financial management and the banking sector
ES.25 Ecuador’s commercial banking system has recovered significant since the 1998-1999 crisis, as evidenced by the steady increase and growing diversification in the sector’s assets and the subsequent decline in portfolio-related risks and rise in profitability. Both banking assets and liabilities doubled during 2000-2005 signaling a dynamic recovery in the sector’s business volume as well as on the public’s confidence in the sector. Growth in the loan portfolio has been accompanied by increased diversification as the share of housing loans and micro credit have grown over time at the expense of commercial credit, which has fallen from 61.7 to 54.3 percent of total loans between 2002 and 2005. In addition the quality of the loan portfolio has improved significantly as the share of substandard and non-performing loans declined from 15.3 to 4.7 percent of the total loan portfolio between 2001 and 2005. As a result the banking system risk ratio has declined from 10.2 to 3.8 percent, credit ratings of Ecuadorian banks have improved, and profitability levels have grown during 2000-2005.
ES.26 Some challenges remain, however, regarding liquidity management and capitalization levels that increase the system’s vulnerability and could potential amplify the risk that a banking shock translates into an economy-wide financial shock. Liquidity management remains problematic for Ecuador since the Deposit Guarantee Agency is bankrupt and has no liquidity to honor its obligations, and current proposals to reform the Liquidity Fund are too expensive and fall short of providing adequate insurance against a systemic liquidity risk based on results from stress tests. Banking sector vulnerabilities are also exacerbated by an investment portfolio heavily concentrated in Ecuadorian government bonds and by the country’s volatile economic and political environment. Given this, a mandated CAR ratio higher than the current 9 percent may be desirable.
ES.27 In addition a comparison between Ecuador’s banking system and that of Panama, considered to be a more “mature” system operating under dollarization, suggests that higher levels of integration between the domestic and international banking system could actually provide a buffer cushion against systemic liquidity shocks. Higher levels of international integration should allow banks operating in the domestic market to accommodate for changes in the demand for liquidity more easily, hence smoothing out any disruptions that may be associated with such changes while minimizing the cost of maintaining high levels of precautionary liquidity in the system.
ES.28 As a result, strengthening the existing institutional structure for liquidity management, particularly the Liquidity Fund, and improving the sector’s legal and institutional framework so as to promote higher integration with international market may contribute to reducing the system’s vulnerabilities. Unfortunately the proposal currently under discussion in Congress to regulate credit allocation and pricing does not constitute a step in the right direction.
C. Engines of robust economic growth
ES.29 Ecuador is a small, relatively open economy operating under a dollarized regime. It is also an oil rich economy. In this context the combination of a productive, well-managed oil sector and a competitive,
vi
internationally integrated non-oil sector has the potential to be the engine for sustainable and robust economic growth. Many factors contribute to achieving such a combination. Some of them have already been discussed above, while those that are more specific to the oil and trade sectors are attended to below.
The oil sector
ES.30 The importance of the oil sector within the Ecuadorian economy cannot be overstated. The sector produces approximately 24 percent of GDP and accounts for 30 percent of the Non-Financial Public Sector (NFPS) revenues and 60 percent of total exports. The sector, however, underperforms compared to international standards and given existing levels of reserves. Low productivity levels in the oil sector are particularly worrisome at the present moment when oil prices in international markets are hitting record highs. In this environment the opportunity cost of producing below potential is particularly high, given the relative importance of the oil sector within the Ecuadorian economy and, particularly, given the fact that oil revenues constitute one of the main sources of revenue for the central government.
ES.31 Since the first Law on Hydrocarbons was passed in 1972, the state has played a major role in the management and operation of the oil sector through PetroEcuador (PE), the publicly owned company. PE controls approximately 75 percent of all proven reserves (estimated at 4.6 billion barrels), including the majority of light crude oil fields, and maintains a monopoly over wholesale industrialization and the commercialization of derivatives in the domestic market. In addition PE acts as the main counterpart for private companies participating in exploration and production activities. Private companies operate marginal, less productive fields under three different regimes: participation contracts, service contracts and marginal fields’ contracts.
ES.32 Despite the significant improvements in transportation infrastructure capacity brought about by the entry into operation of the OCP pipeline in the second half of 2003, PE continues to underperform. Oil production has increased significantly over the last 15 years, from 286 million barrels per day (mbd) in 1990 to 528 mbd in 2004. Important differences exist, however, between the performance of PE and that of private companies during this period. PetroEcuador’s production levels grew during the early 1990s, as new fields were opened up for exploitation, but has declined by almost 30 percent since. In contrast production levels among private companies grew steadily between 1990 and 2003 and accelerated afterwards as a consequence of the opening of the Oleoducto de Crudos Pesados—OCP, the new oil trans-Andean pipeline.
ES.33 The basic reason for this can be found in the lack of investment by PE in petroleum exploration and production, which prevents its production and exports from increasing even after the bottleneck to transport crude oil across the Andes, from the fields in the Amazon to the ports in the Pacific, has been eliminated. Investment levels in the oil sector have increased significantly over the last 10 years, but this increase has been completely driven by private companies. Overall investment levels in the sector grew from US$356 to US$945 million over 1995-2004. During this period the share of total investments accounted for by private companies climbed from 75 to 95 percent as their investment levels increased from US$263 to US$919 million, while those of PE fluctuated between US$25 and US$90.
ES.34 Low levels of investment in production can be attributed to the fact that PE, without savings to invest, operates the most productive fields, while the private companies, with the muscle to invest, have access only to marginal fields with a high institutional risk factor. Approximately 70 percent of PE’s total revenues accrue to the government. Of this share, more than 90 percent goes to the Central Government while the rest is distributed among other entities in the NFPS. In contrast private companies retain all export revenues. As a result net revenue per barrel is significantly higher for private companies than for PE. This severely limits PE’s savings capacity and negatively impacts the company’s ability to develop and implement a long-term investment strategy aimed at increasing both production and exploration activities.
ES.35 A reform of the sector’s institutional frame geared towards the separation of the regulatory and the production functions, as well as towards granting PE higher financial independence from
vii
the government could go a long way in increasing investment and production levels in the sector, while having a positive fiscal impact. If the sector continues to operate under the current institutional framework, characterized by PE dual role as an operator in the sector and as the main government counterpart for private operators, by the fact that planning and investment decisions are heavily dominated by fiscal considerations, and by high levels of contractual uncertainty it will be extremely difficult to increase production given existing technical and financial restrictions. Under the proposed new framework the regulatory function would be assumed by a specialized agency or ministry, independent of PE and to be modeled after Norway’s Petroleum Directorate or Colombia and Brazil’s National Hydrocarbons Agencies, while exploration and production activities in these areas can be undertaken by public and/or private operators.
Trade openness and economic growth
ES.36 Ecuador’s trade openness is similar to that of other countries in the region as well as countries with similar levels of income, but falls short of the levels exhibited by other fast-growing economies. Trade openness, measured by the ratio of exports plus imports to GDP, is close 60 percent in Ecuador, compared to 140 percent among the Asian tigers.
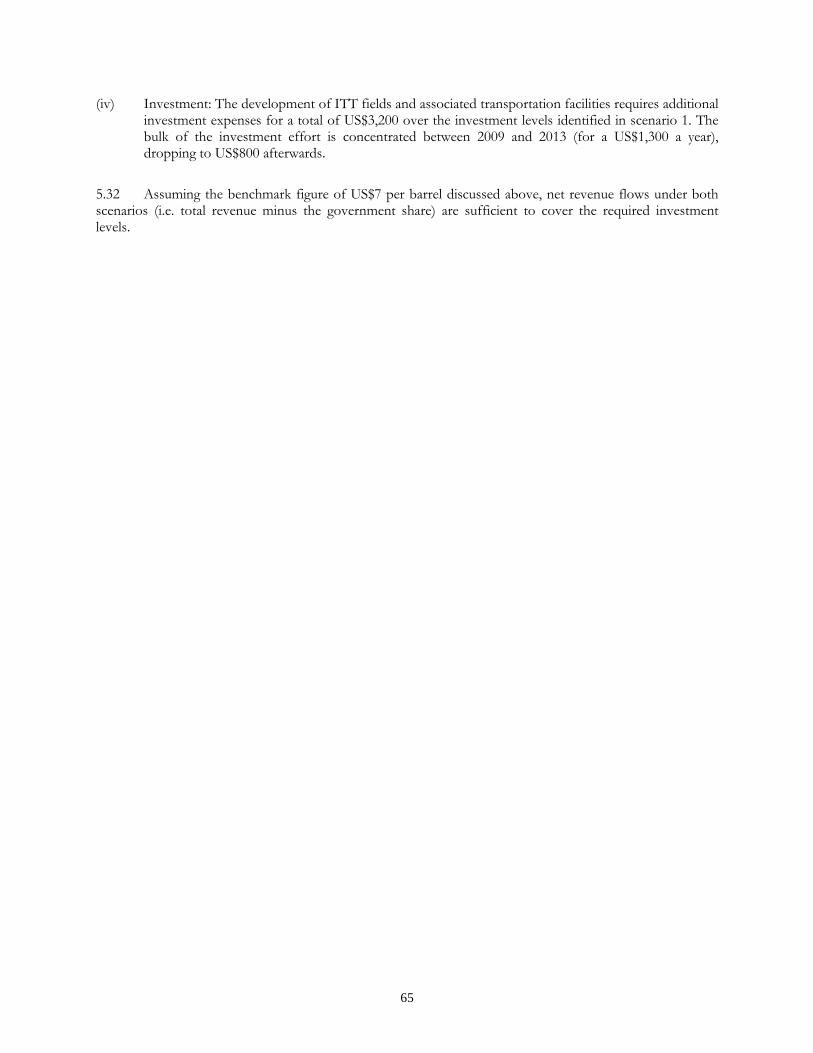
ES.37 Moreover Ecuador’s performance is significantly weaker when only non-oil exports are taken into account, and trade volumes have not been very responsive to trade liberation efforts in the early 1990s. The ratio of non-oil exports to non-oil GDP has declined from 24.8 percent in 1990-1994 to 20.8 percent in 2000-2004, and currently falls below the regional average. This decline, combined with strong import growth, has resulted in rising current account deficits as coverage of imports by exports fell to 85 percent in the period 2001 to 2003. Growth of trade volumes as a percentage of GDP was similar during the 8 years prior to the reforms than during the 8 years following them. In contrast other countries that have recently opened their economies to trade exhibit rapid increases in trade volumes following these changes
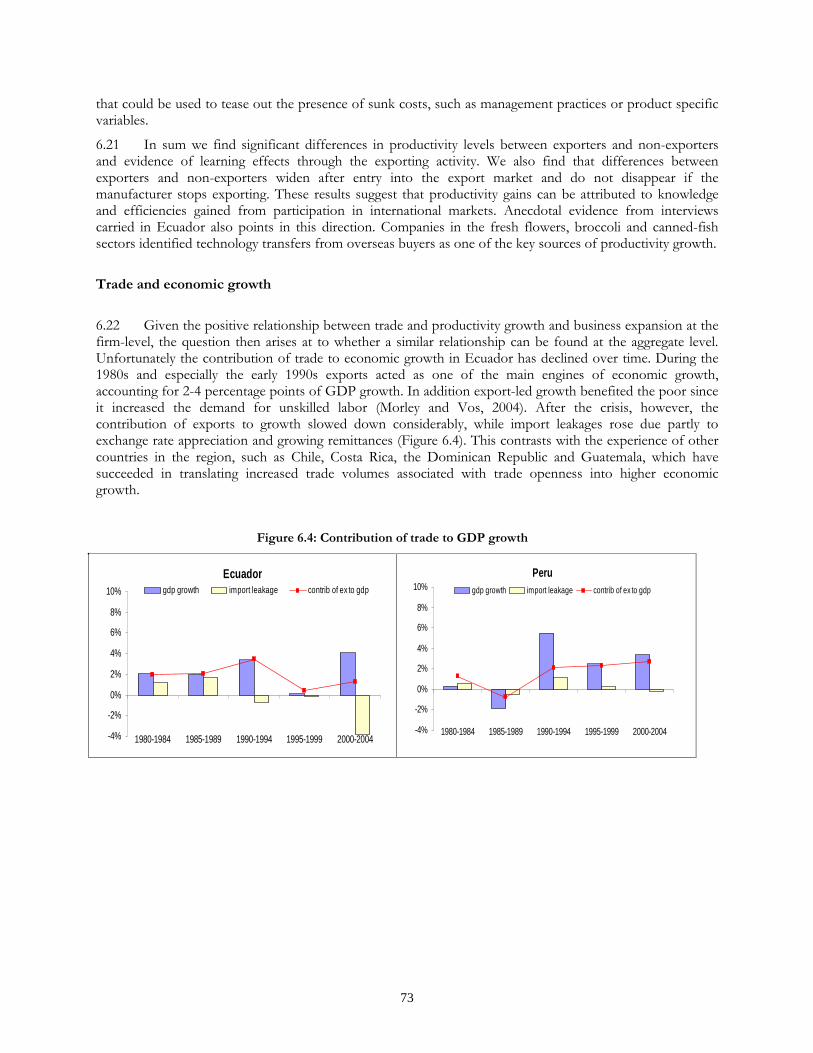
ES.38 Ecuador’s mixed performance in terms of trade, combined with important barriers to entry in exports markets, have had a high price in terms of productivity and economic growth. Ecuadorian exporters appear to be more productive than non-exporters as a result higher competition, economies of scale and learning associated with access to export markets. Furthermore differences between exporters and non-exporters widen after entry into the export market and do not disappear if the manufacturer stops exporting. These results suggest that productivity gains can be attributed to knowledge and efficiencies gained from participation in international markets. Anecdotal evidence from interviews carried in Ecuador also points in this direction. Companies in the fresh flowers, broccoli and canned-fish sectors identified technology transfers from overseas buyers as one of the key sources of productivity growth. Entry into exports markets is low, however, despite its potential positive impact on productivity (and ultimately profitability). This suggests that there may be entry costs (i.e. sunk costs) associated with becoming an exporter. These costs could be due to, among others, investment in market research, changes in product specification, and the need to comply with foreign markets requirements. The end result is that the contribution of trade to economic growth in Ecuador has declined over time. During the 1980s and especially the early 1990s exports acted as one of the main engines of economic growth, accounting for 2-4 percentage points of GDP growth. After the crisis, however, the contribution of exports to growth slowed down considerably, while import leakages rose due partly to exchange rate appreciation and growing remittances.
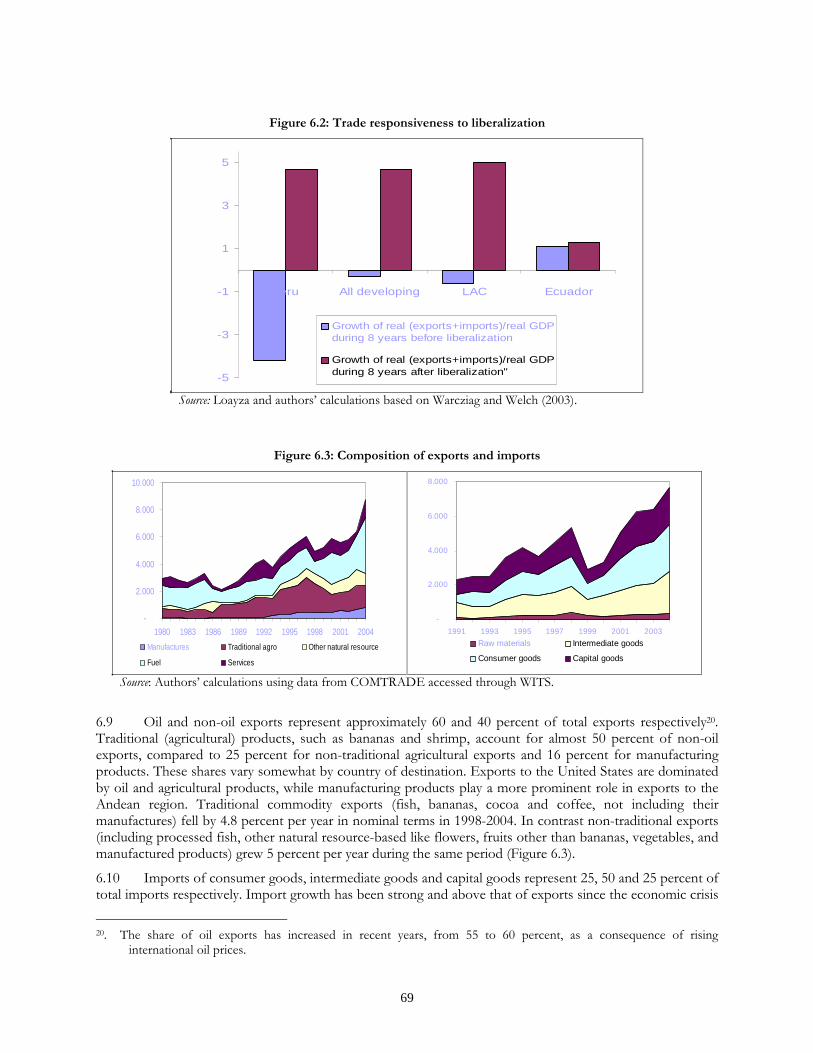
ES.39 Limited trade growth is the result of the structure of Ecuador’s exports (high concentration on oil and traditional agricultural products), and inadequate trade and other policies. Export concentration is significantly higher than that of its regional competitors, with ninety-five percent of all non-oil exports being accounted for by only 24 products, and the speed of diversification is slow. Moreover exports are much less sophisticated than those of countries with similar levels of income per capita as a result exports relative bias towards extractive and low-value added activities. Finally high tariffs on imported intermediate and capital goods and extensive use of non-tariffs instruments, together with deficient transport
viii
infrastructure and ineffective customs services, have increased the cost of accessing foreign technology and, more generally, curtailed the international competitiveness of Ecuadorian firms.
ES.40 Unfavorable conditions in international markets and the country’s inability to diversify its exports base have also contributed to hamper trade growth. In recent years demand for Ecuadorian products has been weak, mainly as a result of the decline in the demand for traditional commodities (banana, fish, crustaceans, cocoa, coffee and textiles), and competitiveness gains non-existent—in fact Ecuador’s international competitive position in the US market has deteriorated over the last few years. In addition Ecuador has failed to adapt its export basket to changing conditions in international markets; and particularly in the US, Ecuador main market. This contrasts with the experience of Eastern European and African countries, which have pursued an aggressive policy of export diversification targeted to strengthened economic integration with the European Union. More importantly both increased diversification and higher degree of similarity appear to be correlated with economic growth, suggesting that Ecuador is forgoing an opportunity for higher economic growth through further trade integration with the US.
ES.41 Not all if bleak, however, according to results from trade gravity models, which suggest that there may be trade gains still to be exploited by Ecuador. During the 1990s Ecuador’s foreign trade volumes were 26 percent smaller than what gravity models would have predicted based on Ecuador’s and its trade partners’ characteristics, including geography, distance, population, territory, and oil-exporter status. In other words there is significant untapped potential for Ecuador’s exports to grow. Room for growth can be found in manufacturing (namely apparel, leather, chemicals, rubber and plastics, transport equipment and other manufacturing products) in reference to the US market, in agricultural products in reference to Latin America, and in forestry, fishing and food products in reference to Europe.
ES.42 To take advantage of these unrealized opportunities will require an active role on the part of the GoE to promote export diversification, improve trade policy and strengthen existing institutions. Further trade liberalization, combined with an adequate complementary agenda that tackles institutional constraints should contribute to long term economic growth. In designing this agenda Ecuador could learn from the Chilean experience, a country that not only has managed to avoid the “natural resource curse” but has used its natural endowments as a platform for broad-based growth.
C. Proposed reform agenda
ES.43 As we mentioned above, there are multiple constraints to economic growth in Ecuador, raging from primary or fundamental constraints, such as political instability and institutional fragmentation, to secondary or sectoral constraints, such as unstable domestic policy and poor quality of the business environment. This report has been concerned with the latter, with the understanding that the effectiveness of any reform policy agenda will be ultimately a function of the former.
ES.44 Placing Ecuador on the path to sustained and robust growth will require the implementation of a comprehensive reform agenda. The pillars of this agenda are fiscal solvency and financial stability, while the engines for future growth are increased productivity in the oil sector and, particularly, further trade openness and integration. Achieving these objectives will involve strengthening Ecuador’s investment climate, including the legal and institutional framework, as well as sustaining ongoing efforts to increase the country’s physical and human capital stocks. We have argued that these measures are complementary to each other in that to the end product of the package is larger than the sum of its individual pieces.
ES.45 Finally the proposed agenda distinguishes between policies that could and should be implemented within the next 6 to 18 months, taking advantage of the arrival to office of a new administration with the necessary support to see some of these key (but potentially difficult) measures through, and long-term policies.
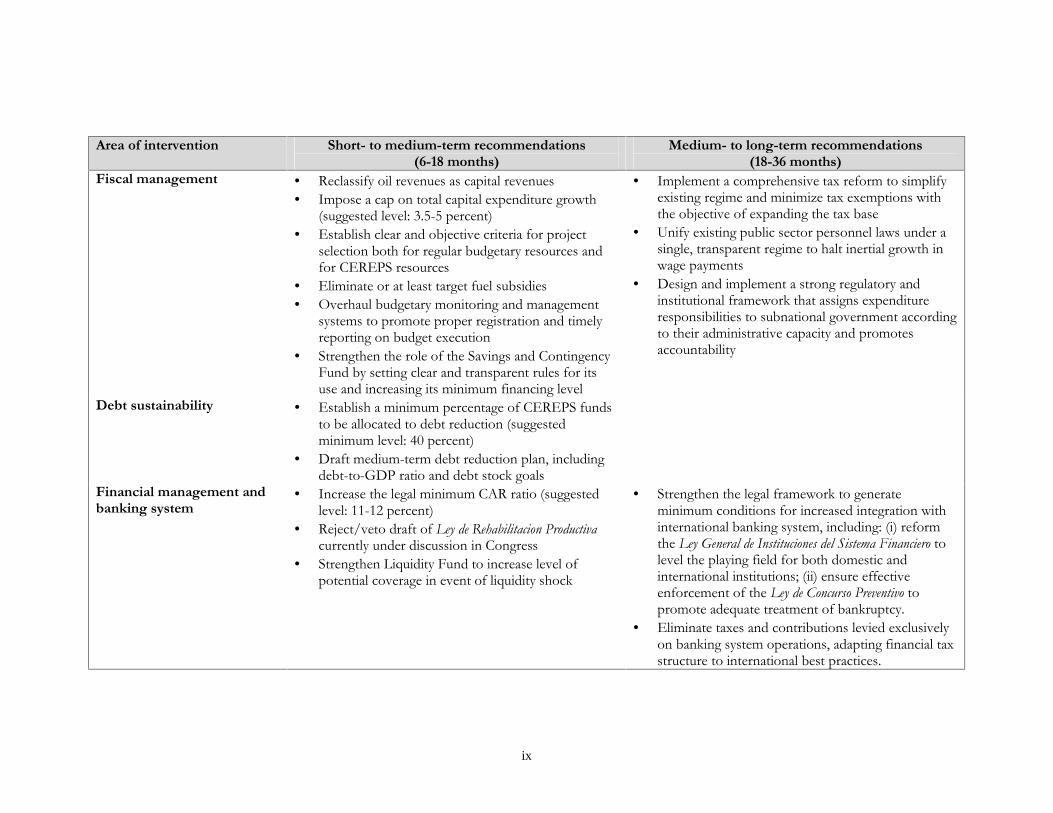
ix
Area of intervention Short- to medium-term recommendations
(6-18 months) Medium- to long-term recommendations
(18-36 months) Fiscal management • Reclassify oil revenues as capital revenues
• Impose a cap on total capital expenditure growth (suggested level: 3.5-5 percent)
• Establish clear and objective criteria for project selection both for regular budgetary resources and for CEREPS resources
• Eliminate or at least target fuel subsidies • Overhaul budgetary monitoring and management
systems to promote proper registration and timely reporting on budget execution
• Strengthen the role of the Savings and Contingency Fund by setting clear and transparent rules for its use and increasing its minimum financing level
• Implement a comprehensive tax reform to simplify existing regime and minimize tax exemptions with the objective of expanding the tax base
• Unify existing public sector personnel laws under a single, transparent regime to halt inertial growth in wage payments
• Design and implement a strong regulatory and institutional framework that assigns expenditure responsibilities to subnational government according to their administrative capacity and promotes accountability
Debt sustainability • Establish a minimum percentage of CEREPS funds to be allocated to debt reduction (suggested minimum level: 40 percent)
• Draft medium-term debt reduction plan, including debt-to-GDP ratio and debt stock goals
Financial management and banking system
• Increase the legal minimum CAR ratio (suggested level: 11-12 percent)
• Reject/veto draft of Ley de Rehabilitacion Productiva currently under discussion in Congress
• Strengthen Liquidity Fund to increase level of potential coverage in event of liquidity shock
• Strengthen the legal framework to generate minimum conditions for increased integration with international banking system, including: (i) reform the Ley General de Instituciones del Sistema Financiero to level the playing field for both domestic and international institutions; (ii) ensure effective enforcement of the Ley de Concurso Preventivo to promote adequate treatment of bankruptcy.
• Eliminate taxes and contributions levied exclusively on banking system operations, adapting financial tax structure to international best practices.
x
Area of intervention Short- to medium-term recommendations
(6-18 months) Medium- to long-term recommendations
(18-36 months) Human capital accumulation • Implement BDH education co-responsibility among
beneficiaries ages 12 to 16 to ensure transition to and continuity of secondary education.
• Ensure adequate implementation of current reform of training system to promote competition in the sectors
• Consider tailoring of BDH benefits to opportunity costs of secondary schooling.
• Ensure adequate supply of secondary teachers/schools and/or alternative schooling methods (i.e. distance learning) to provide coverage in rural areas.
• Further reform training system to extent coverage to micro and small firms and informal workers
Access to technology and innovation
• Simplify licensing procedures and promote FDI outside the oil sector
• Strengthen property and intellectual rights protection.
• Lower tariffs on intermediate and capital goods imports, particularly those not produced in Ecuador.
• Create service centers that facilitate new technology adoption by micro and small firms
• Promote R&D through agreements between domestic and foreign firms, or through licensing
Investment climate Governance • Continue to simplify business registration and
operating procedures. • Promote greater efficiency and transparency in
public procurement by strengthening role of CONTRATANET, transforming it into a transactional procurement system
• Improve monitoring and reporting of spending by subnational governments
xi
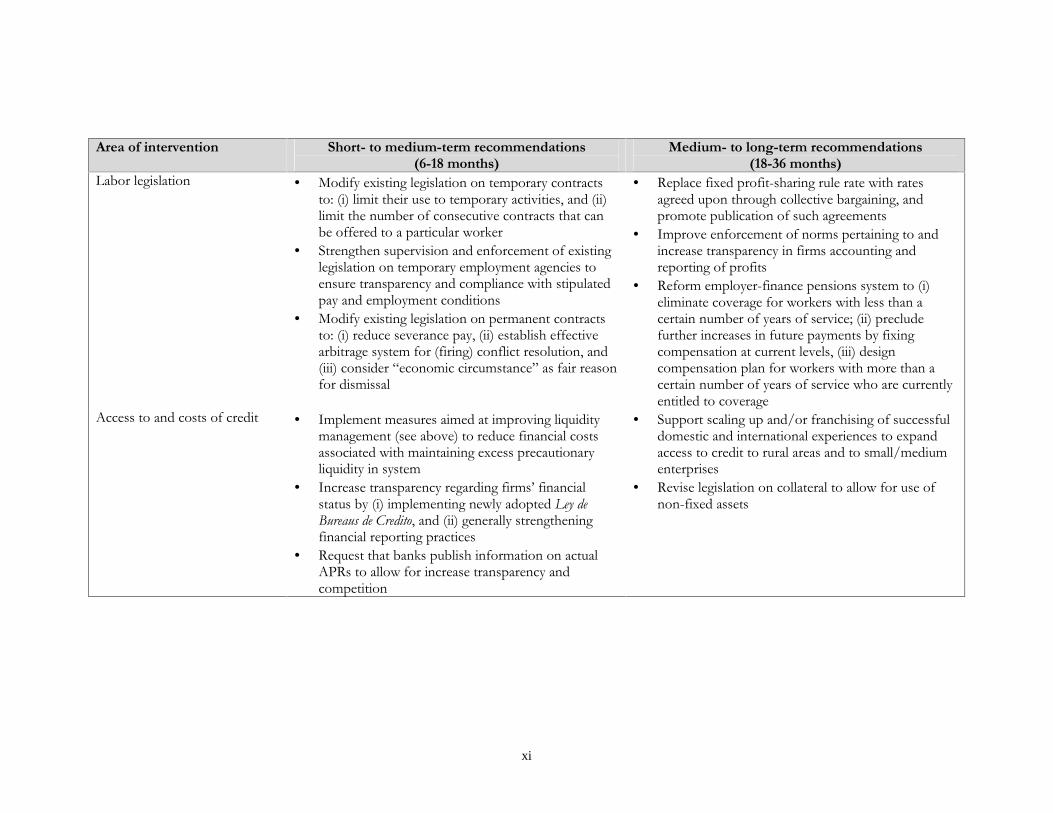
Area of intervention Short- to medium-term recommendations
(6-18 months) Medium- to long-term recommendations
to: (i) limit their use to temporary activities, and (ii) limit the number of consecutive contracts that can be offered to a particular worker
• Strengthen supervision and enforcement of existing legislation on temporary employment agencies to ensure transparency and compliance with stipulated pay and employment conditions
• Modify existing legislation on permanent contracts to: (i) reduce severance pay, (ii) establish effective arbitrage system for (firing) conflict resolution, and (iii) consider “economic circumstance” as fair reason for dismissal
• Replace fixed profit-sharing rule rate with rates agreed upon through collective bargaining, and promote publication of such agreements
• Improve enforcement of norms pertaining to and increase transparency in firms accounting and reporting of profits
• Reform employer-finance pensions system to (i) eliminate coverage for workers with less than a certain number of years of service; (ii) preclude further increases in future payments by fixing compensation at current levels, (iii) design compensation plan for workers with more than a certain number of years of service who are currently entitled to coverage
Access to and costs of credit • Implement measures aimed at improving liquidity management (see above) to reduce financial costs associated with maintaining excess precautionary liquidity in system
• Increase transparency regarding firms’ financial status by (i) implementing newly adopted Ley de Bureaus de Credito, and (ii) generally strengthening financial reporting practices
• Request that banks publish information on actual APRs to allow for increase transparency and competition
• Support scaling up and/or franchising of successful domestic and international experiences to expand access to credit to rural areas and to small/medium enterprises
• Revise legislation on collateral to allow for use of non-fixed assets
xii
Area of intervention Short- to medium-term recommendations
(6-18 months) Medium- to long-term recommendations
(18-36 months) Infrastructure • Introduce legislation to allow for public-private
partnerships in infrastructure development • Establish clear rules and responsibilities for use of
investment funds by subnational governments
• Implement comprehensive reform of telecommunications sector, including: (i) allowing private participation and management of existing companies, (ii) rebalancing tariffs to eliminate cross-subsidies and reflect true costs of phone calls, (iii) introducing legislation that enable effective competition in the sector.
• Implement comprehensive reform of ports, including: (i) adopting of regulatory framework that enables competition, (ii) allowing for private management, (iii) introducing modern cargo handling and port management techniques
Customs • Reduce processing and clearing time by: (i) supporting comprehensive review and evaluation of customs procedures and performance, (ii) improving cargo inspection system
Oil sector • Modify sector’s legal and institutional framework to (i) effectively separate regulatory and development functions, (ii) promote independence of PE finances from overall government budgetary needs, and (iii) strengthen competition and collaboration between public and private operators in sector
Trade policy and export promotion
• Sign FTA with US • Revise tariffs to reduce average level and decrease
dispersion (see above) • Reduce non-tariff and other forms of effective
protection, especially for low value-added goods • Strengthen institutional framework for control of
quality and standards
• Support export promotion through: (i) creation of business associations and incubator programs, (ii) funding of R&D in agriculture and food activities, (iii) provision of fiscal incentives to export and export diversification (e.g. FTZ and others)
xiii
xiv
INTRODUCTION
The last Country Economic Memorandum (CEM) for Ecuador was written in 1987-8. At that time the country was in the midst of a severe economic crisis as a consequence of the impact that low international oil prices and significant disruptions to oil production and exports brought about by earthquake-related damage to the crude oil pipeline had on the fiscal and external accounts. As a result the focus of the CEM was on the adjustment measures required to cope with the crisis.
Much has happened in the country since. And although some of the problems that Ecuador faces today are similar to those of the 1980s (e.g. high fiscal dependency on oil revenues, unstable political system), new challenges have arisen as a consequence of the decision to dollarized the economy in 2000. Similarly new opportunities lie ahead as the Government of Ecuador (GoE) negotiates a Free Trade Agreement (FTA) with the United States (U.S.).
Recent changes have been documented by the World Bank and others. Work by the World Bank over the last few years includes a set of Policy Notes for the new administration that took office in early 2003 (World Bank, 2003a), a Public Expenditure Review (World Bank, 2003b), a Development Policy Review (2003c), a Poverty Assessment (World Bank, 2004a), an Investment Climate Assessment (World Bank, 2004b), and a Labor Market Study (World Bank, 2005). Similarly there are numerous studies and papers by the Government of Ecuador and/or independent researchers dealing with issues ranging from the effect of dollarization, to labor market performance, to the role social policy and the impact of social expenditures.
Previous work by the World Bank shows that the two main determinants of Ecuador’s economic performance are productivity growth, where productivity is measured as Total Factor Productivity (TFP), and the quality of economic management (World Bank, 2004a). The connection between productivity and economic growth has become even more relevant in recent years, after Ecuador decided to adopt the US dollar as the national currency in 2000, hence forgoing the option of using exchange rate policy to generate temporary increases in competitiveness and growth. Although the decision to dollarize undoubtedly improved the investment climate, reassured potential investors and hence, potentially increased the capacity of the economy to create employment and reduce poverty, sustained increases in productivity will be required to maintain positive growth rates and declining poverty rates in the future.
Similarly sound fiscal policy and public debt management are the foundation of stable economic management, once the option of using monetary policy to stabilize the economy has been foregone. Finally Ecuador’s capacity to successfully compete in international markets and, thus, to fully take advantage of the opportunities generated by the elimination of trade barriers with the US (and potentially with others, such as the European Union) will also require significant and sustained improvements in productivity and competitiveness.
As a consequence, this report focuses on the promotion of stable and robust economic growth in Ecuador with the objective of providing the GoE with concrete, actionable policy recommendations aimed at achieving sustainable economic growth in a dollarized, open economy. The report is structured as follows. Part I takes stock of Ecuador’s economic performance since the 1960s in order to identify long-term growth patterns and provide a benchmark against which to examine more recent trends and developments. A discussion on growth and jobs is also included in this section, with a focus on employment creation and the business environment. Part II focuses on the main pre-conditions for stable growth: fiscal solvency and a health financial system. Finally Part III provides an overview examines what we considered the main potential engines of future robust growth: the oil sector and trade openness.
This report will build on and complement this work, relying on existing knowledge when still relevant and applicable and combining it with original work commissioned for the report. This work comprises 5 background papers in growth (Soto, 2006), fiscal and banking issues (Gallardo, 2006), productivity and employment in the non-oil sector (Koryukin, 2006), productivity in the oil sector (Espinaza, 2006), and trade (Hernandez and Pierola, 2006).
xv
1
I. ECUADOR’S ECONOMIC PERFORMANCE: TAKING STOCK
1.1 Positive economic growth and welfare improvements in the early 1990s were replaced by slow growth and the deterioration of economic performance during the second half of the decade. The 1998-9 crisis and its dramatic effects on GDP and inflation triggered the adoption of the US dollar in 2000. This measure helped control inflation and stabilize the economy and, as a result, positive, yet still sluggish, economic growth resumed in 2001 and 2002. The post-dollarization recovery was also fueled by a significant hike in the international price of oil and, in 2004, by the entry into operation of the new crude oil pipeline (Oleoducto de Crudos Pesados, OCP), which allowed for a substantial increase in oil exports.
1.2 Recent aggregate GDP growth rates, however, mask important differences between the performance of the oil and non-oil sectors. After growing rapidly in 2001 and 2002, economic growth in the non-oil sector has fallen dramatically. In addition, aggregate economic growth has failed to translate into higher employment and, eventually, lower poverty levels. Understanding Ecuador’s long-term growth patterns can provide important insights into the country’s more recent performance.
1. Sources of Economic Growth: A Macroeconomic Perspective1
1.3 Ecuador’s economic history over the last 40 years is marked by two elements: the unstable and slow path of economic growth, and the contrasting—and sometimes conflicting—dual nature of its economy. Ecuador suffered seven episodes of negative annual growth in per-capita GDP in the 1985-2003 period (Solimano and Soto, 2005), or the equivalent to a recession that induces an absolute decline in income levels every 2.5 years. In contrast more stable and dynamic Latin American economies, such as the Dominican Republic or Chile, suffered 2 or fewer crisis during the same period. In addition to–and likely as a result of– instability, economic growth has been very slow: on average, per-capita GDP grew at only 0.5 percent in the 1985-2003 period, compared to at least 3.5 percent among the more stable economies mentioned above. Finally the economy and, especially, the public sector, continue to be highly dependent on oil export revenues, despite the increasing contribution of other sources of income (e.g., international remittances and non-traditional exports). Consequently, the oil sector has been one of the key determinants of aggregate business cycles, either directly or through fiscal policies.
1.4 One of the necessary conditions for sustained growth is capital accumulation. In fact investment levels were relatively high in Ecuador during 1970-2004—21 percent of GDP on average, compared to 15 percent in the region—mainly as a result of private investment, which grew from around 13 to 19 percent during this period. High and sustained investment rates, however, were not sufficient to place Ecuador in the path to higher growth.
1.5 This chapter explores the reasons behind this development, as well as other issues related to Ecuador’s long-term growth. In doing so the chapter provides a framework from which to explore the material presented in the rest of the report. The main findings of the chapter can be summarized as follows:
• Economic growth in Ecuador during 1960-2004 was largely fueled by productivity gains, while the contributions of capital accumulation and employment growth were more modest. From a sectoral perspective, the main contributors to Ecuador’s long-term economic growth during 1960-2004 were the service and the oil sectors, while fluctuations in economic growth reflect mainly the ups and downs of the oil and financial sectors.
• Ecuador’s economic performance during 1960-2004 fell below what would have been expected given the country’s economic and social conditions and institutions. The main reasons behind this disappointing outcome are unstable domestic policies, combined with financial shocks. In addition, Ecuador’s poor
1. This chapter draws from work presented in World Bank (2004a) and original work prepared for this report (Soto,
2006).
2
investment climate and governance may have limited the potential positive impact on growth of physical and human capital accumulation and of trade openness.
• Stable and sound fiscal policy, combined with further reforms, particular in the areas of infrastructure, financial management and governance could help untapped some of Ecuador’s unrealized growth potential. Some of these reforms may require additional resources and significant political will, but the payoffs associated with them are substantial.
1.6 The rest of the chapter is structured as follows. The first section examines the sources of long-term economic growth using growth accounting techniques. Both aggregate and sectoral data are used for this purpose and special attention is paid to the relationship between productivity and economic growth. The second section analyzes the role of economic policy and other determinants of long-term economic growth using economic techniques (i.e. growth regressions).
A. Sources of economic growth2
1.7 Ecuador’s economic growth during 1960-2004, measured by GDP per working-age adult, was slow and volatile3--i.e. the average growth rate for the period was 1.2 percent per year. Only during the 1970s and, to a lesser extent, after the adoption of the dollar in 2000 did Ecuador enjoy a period of substantial and sustained economic growth. The 1960s and the 1980s, on the other hand, were marked by instability and protracted slow growth, with GDP per working age adult declining at 0.8 percent per year.
1.8 This section uses growth accounting techniques to examine the main forces behind these patterns. Two different approaches are used for this purpose. First the contribution of the basic factors of production, labor and capital, and of productivity to long-term economic growth is analyzed. Second the contribution of different economic sectors, such as agriculture, manufacturing and services, to long-term economic growth is described. The section also provides a short discussion on the role of these same forces in explaining growth in a more dynamic context using econometric techniques, including causality tests.
Decomposing aggregate long-term growth: A simple growth accounting exercise The role of labor, capital and productivity
1.9 Economic growth is modeled using an aggregate Cobb-Douglas production function:
ααµ −= 1
tttttt LeKAY where tY is output (value added); te is an indicator of the efficiency of hours worked, measured by tL ; and
tµ is the occupation rate of capital, measured by tK . Finally tA is an indicator of the technical efficiency in the use of factors. Our measure of productivity will be Total Factor Productivity (TFP), and will encompass not only technical efficiency but also the efficiency of labor and the degree of use of the capital stock as follows:
2. A detailed description of the data used in this chapter is provided in Annex 1. 3. The use of GDP per working-age adult instead of GDP per capita, a more traditional choice, is justified on the basis
of this variable’s relative insensitivity to both demographic changes associated with economic development and transient labor market changes.
3
( ) ααµ −=1
,,tt
ttttt LK
YeATFP
1.10 In other words TFP will capture the impact that, say, education and training policies or poor government regulation leading to lower use of capital have on economic growth. More broadly it will reflect the quality of macro and microeconomic policies, as well as transient phenomena such as an earthquake, and temporary fluctuations in terms of trade or workers remittances. This interpretation of TFP provides a direct link with the analysis of the determinants of long-term economic growth presented in section B below, in which the role of economic policy and other factors is considered explicitly.
1.11 Under this formulation, and after some algebraic manipulation, changes in GDP per working age adult can be decomposed into (i) changes in the capital-output ratio; (ii) changes in effective employment, measured as hours worked per working age adult; and (iii) changes in TFP4.
1.12 A simple interpretation of the contribution of elements (i) to (iii) to economic growth can be derived from the assumption that on the balanced growth path (i.e. long-term trend) output per worker and capital per worker would grow at the same rate, and, as a result, the capital-output ratio and the number of hours worked per working-age adult would remain constant—i.e. all economic growth is attributed to changes in TFP on the balance path, while deviations from this path are attributed to changes in the investment rate and changes in work effort.
1.13 Applying the model to the data shows that during 1960-2004 economic growth in Ecuador was largely fueled by productivity gains. TFP growth is the main driving force behind positive economic growth in the 1970s5 and, to a lesser extent, the 1960s and the years since dollarization. Similarly negative TFP growth has often translated into negative economic growth, as was the case in the 1980s. In contrast the contribution of capital accumulation and employment growth has been more modest, with the former playing a positive role during the 1980s and 1990s, despite negative productivity growth, and the later growing significantly in recent years (Table 1.1).
Table 1.1: Sources of aggregate growth, 1960-2004
Observed change in value added per
working age person
Contribution of changes in effective
employment
Contribution of changes in capital-
output ratio
Contribution of changes in TFP
1960-2004 1.2 -0.1 0.3 1.1
1960-1969 0.9 -0.1 -0.6 1.6
1970-1979 4.7 -0.4 -0.2 5.3
1980-1989 -1.3 0.0 1.2 -2.4
1990-1999 -0.6 -0.8 0.7 -0.5
2000-2004 1.9 0.9 -0.5 1.5
Source: Authors’ calculations using data from the BCE.
1.14 These results are robust to the inclusion of human capital as a factor of production. TFP changes continue to drive GDP growth and GDP fluctuations, while the contribution of human capital to growth is
4. A detailed description of the methodological approach used in this chapter is provided in Soto (2006). 5. Oil was discovered in Ecuador during the 1970s. It is therefore possible that part of the changes attributed to TFP
during this period is truly the result of the structural changes associated with the development of the oil industry.
4
quite stable during 1960-2004, at around 0.5 percentage points per year (not shown), reflecting the steady growth in average education levels.
1.15 Two main conclusions can be derived from the analysis presented so far. First capital accumulation during the 1980s and, to a lesser extent, the 1990s did not necessarily translate into increases in productivity, which is consistent with the observation that high investment levels did not lead to high economic growth. This could be due to a number of reasons. It is possible for most new investment to have been concentrated in the oil sector and thus to have had little impact on the functioning of the rest of the economy. It is also possible for existing macro and microeconomic constraints to have dampened the potential productivity of new investments (see discussion on this below).
1.16 Second investments in human capital are an important component of economic growth and, consequently, efforts to improve education and training policies should continue. The contribution of such investments to aggregate economic growth, however, tends to be relatively small and quite stable over time. Thus, one cannot expect education to be the key to fast economic growth and, much less, focus primarily on public education expenditures to be the main policy to achieve such growth. Human capital formation is one of several necessary ingredients for faster economic growth but if others are missing, investment in human capital would be unproductive.
1.17 Is the Ecuadorian experience different from that of other countries in the region during the period under analysis? Solimano and Soto (2006) run a similar exercise for the main 12 Latin American economies in the 1960-2004 period and rank countries according to the annual growth of GDP and TFP. Only 2 out of the 12 countries, Chile and the Dominican Republic, managed to grow systematically in the last 25 years and in both cases high TFP growth was the key determinant of economic growth. In contrast other countries, including Ecuador, exhibited relatively low TFP growth despite significant investment efforts and abundant labor. Interestingly the main difference between Chile and the Dominican Republic and the rest of the countries considered in the analysis lies in their ability to implement far reaching and well-designed policy reforms and, more importantly, to ensure that these policies are coherent and maintained in time. We will return to the issue of policy management in the next section.
The role of sectoral factors
1.18 A similar exercise to the one presented above can be performed to measure the contribution of various sectors to total growth. Due to data availability, however, this exercise is limited to 1990-2004. The structure of Ecuador’s production has gradually changed in the 1960-2004 period as the economy developed. In particular the importance of resource-based activities, such as agriculture, fishing and mining, declined over time (from 20 to 12 percent of GDP), while the industrial (including oil) and, especially, the service sectors grew and now account for 38 and 50 percent of total GDP respectively.
1.19 The contribution of resource-based and industrial activities to aggregate economic growth fluctuated significantly over time, while the contribution of the service sector remained positive. Stagnation in agriculture and a severe decline in fishing in 1993 led to a negative contribution of these sectors to economic growth in 1990-1994, while the recovery in agriculture translated into positive contributions in subsequent periods. Within the industrial sector, the oil sector acted as the engine of growth, leading to strong growth contributions in 1990-1994 and 2000-2004, while both manufacturing and construction exhibited a more erratic behavior. Finally the service sector has consistently accounted for almost 50 percent of economic growth throughout the period (Table 1.2).
5
Table 1.2: Sectoral decomposition of aggregate growth, 1990-2004
1990-1994 1995-1999 2000-2004 Average annual GDP growth 2.9 0.8 4.2 Agriculture and fishing -0.4 0.5 0.2 Industry Manufacturing Oil sector Construction Other sectors
1.8 1.2 1.4 -0.4 -0.4
-0.5 0.4 0.0 -0.3 -0.6
1.8 0.1 1.5 0.5 -0.3
Services Commerce Financial services Communications, hotels Other services
1.5 0.6 0.4 0.4 0.1
0.8 0.0 -0.3 0.5 0.6
2.2 0.6 0.3 0.5 0.8
Source: Authors’ calculations using data from the BCE.
1.20 In sum, the main contributors behind Ecuador’s aggregate economic growth appear to be the service and the oil sectors, while fluctuations in economic growth seems to reflect the ups and downs of the oil and financial sectors.
Growth dynamics: Leading and lagging factors and sectors
1.21 The simple accounting exercise presented above provides a mechanical decomposition of the accumulation of factors and their contribution to economic growth, but sheds no light on the issue of what factors actually affect or drive growth in a dynamic context. A potential way to get at this question is to explore the causal (interpreted as temporal precedence) relationship between economic growth and the various factors considered above. We then use Granger tests to examine the relationship between aggregate economic growth, TFP growth and investment on the one hand, and between aggregate economic growth and sectoral growth on the other.
1.22 We find that TFP Granger-causes GDP and that GDP Granger-causes investment (particularly public investment6), while there is no evidence of reverse causality in neither case7. The first result confirms what was discussed above regarding the crucial role of productivity as the driver of sustained economic growth. The second result, however, appears to contradict the premise that investment is a necessary pre-condition to growth. Two potential explanations have been put forward in the literature for this (see Box 1.1 for a more extensive discussion on the issue). First it is possible for firms to use idle capacity to expand output in the short run as a mechanism to recover from downturns. Second it is the expectation of future profits implicit in an expansion in GDP which calls for investment. These results have important policy implications; namely, investment alone may not lead to higher productivity or sustained growth. Rather it is those reforms that promote a more efficient use of resources—i.e. TFP-enhancing reforms—which are bound to create the expectation of future profits and, consequently, would call for entrepreneurs to produce more. In other words, without TFP-enhancing conditions, growth may not happen even if, as it is the case in Ecuador, investment ratios in the past were significant.
1.23 Similarly we find that certain sectors act as leaders, in that they Granger-cause GDP growth, while others act as laggards, in that they are Granger-caused by GDP. The financial sector is part of the first group8,
6. Granger tests were run separately for private and public investment. Granger causality from GDP to investment is
only significant in the case of the latter. 7. Results are significant at the 95 percent level. 8. This is not surprising considering that the period under study includes the 1999 financial crisis that led to
dollarization and its subsequent recovery. There is, however, an additional, more fundamental reason to expect
6
while commerce, government services, and manufacturing belong to the second. In addition we find simultaneous Granger-causality between GDP and the oil and fishing sectors. These results are consistent with those from the sectoral decomposition of growth presented above.
Box 1.1: The relationship between GDP growth and investment: What does the recent literature tell us?
Until the 1990s it was a dictum that the mechanics of growth would assign investment a leading role in development, while GDP and total factor productivity growth would be the inevitable result of capital accumulation. Recent research, however, tend to suggest that the causality is quite the opposite: the existence of unrealized TFP gains would lead to growth and investment. As discussed in Easterly and Levine (2001) “Available evidence, however, suggests that physical and human capital accumulation do not cause faster growth. For instance, Blomstrom, Lipsey, and Zejan (1996) show that output growth Granger-causes investment. Injections of capital do not seem to be the driving force of future growth. Evidence on human capital tells a similar story. Bils and Klenow (2000) argue that the direction of causality runs from growth to human capital, not from human capital to growth. Thus, in terms of both physical and human capital, the data do not provide strong support for the contention that factor accumulation ignites faster growth in output per worker.”
A crucial assumption in neoclassical models is that economic growth is determined by the savings rate, among other exogenous factors, and therefore feedback from economic growth to investment is absent (Mankiw et al.1992, and Barro and Sala i Martin, 1995). The empirical studies, however, tend to find the opposite result, that is causality running from economic growth to investment. An early study by Lipsey and Kravis (1987) found that, for five year periods, the rate of growth in the US was more closely related to capital formation rates in succeeding periods than to contemporary or preceding rates. Blomström et al. (1996) re-examine this issue for 101 countries in the 1965-85 period using more formal methods of studying the direction of causation, i.e., Granger causality tests. They found that per capita GDP growth is more related to subsequent capital formation than to current or past capital formation. Similar results are found by Carroll and Weil (1994). Podrecca and Carmeci (2001) re-examine this issue using advanced dynamic panel data techniques and show that investment shares Granger-cause growth rates and growth rates Granger-cause investment shares. However, Granger causality from investment shares to growth rates is found to be negative, contradicting the view that fixed investment is the key to long run growth. The result is, however, consistent with the predictions of Solow type growth models of exogenous savings where an increase in investment rates determines a contemporaneous increase in growth rates, which will thereafter gradually decrease over time towards steady state values, solely determined by the rate of technical progress.
Evidence on the “reverse” causality has been gathered by several other authors. Dollar and Easterly (1999) test causality between aid, investment and growth in 49 African countries in the 1970-1993 period and conclude that aid does not necessarily finance investment and investment does not necessarily promote growth. Differences in economic policies explain much of the difference in growth performance. Poor quality of public services, closed trade regimes, financial repression, and macroeconomic mismanagement explain Africa's poor record. Choe (2003) uses a panel VAR model for 80 countries over the period 1971 95 and find that gross domestic investment (GDI) does not Granger cause economic growth, but economic growth robustly Granger causes GDI. These findings led the author to conclude that high GDI rates do not necessarily lead to rapid economic growth.
Not all recent evidence points in this direction. Bond et al. (2004) present evidence that an increase in investment as a share of GDP predicts a higher growth rate of output per worker, not only temporarily, but also in the steady state. These results are robust to model specifications and estimation methods. The evidence that investment has a long-run effect on growth rates is consistent with the main implication of certain endogenous growth models, such as the AK model.
Source: Soto (2006)
B. Long-term growth: Determinants and prospects
1.24 The discussion presented in the previous section was based on the assumption that productivity, or TFP, can be treated as an exogenous factor. Although in the case of a small country, such as Ecuador, most
causality running from the financial sector to GDP. Granger tests measure time precedence and, hence, if agents anticipate a decline or boom in general economic activity, they will react accordingly in advance.
7
technological progress takes place in the form of new technology imbedded in imported capital goods and can therefore be considered as exogenous, other factors that influence productivity, such as the level of efficiency in the use of domestic resources, the quality of economic policy and institutions, and the endowment of renewable resources (especially human capital) are largely endogenous.
1.25 This section uses econometric techniques (i.e. growth regressions) to model economic growth as a function of country’s structural and social characteristics, economic policy, external shocks, and initial economic conditions. The estimated parameters are then used to quantify the relative contribution of each of these variables to the observed path of long-term economic growth in Ecuador, as well as to construct a counterfactual scenario to evaluate the potential impact of selected reforms. This analysis is based on cross-country panel data.
Determinants of long-term economic growth
1.26 The existing literature identifies a large set of economic and social variables that can potentially affect economic growth. We focus here on those that have received the most attention both in the literature and in policy circles. These variables can be divided into five groups: (i) initial economic conditions, (ii) deviations from long-term trends (cyclical reversion), (iii) structural policies and institutions, (iv) stabilization policies, and (v) external conditions (see the Annex 2 for details on definitions and data sources).
1.27 A brief discussion on each group follows:
• Initial conditions and transitional convergence. Classical growth models predict that growth rates depend on the initial position of the economy vis a vis its long-term equilibrium. In particular they predict that, other things being equal, poor countries should grow faster than rich ones because they are further from the long-term equilibrium and, hence, enjoy higher (though decreasing) returns to factors of production. This is commonly referred to as conditional or transitional convergence and can be accounted for by including the initial level of output as a regressor.
• Deviations from long-term trends or cyclical reversion. When analyzing long-term growth it is important to distinguish between transient phenomena and structural changes. One way to disentangle both is to use 5-year averages for the estimation. At these frequencies, however, cyclical effects are bound to play a role, so that a measure of the output gap (the distance between current output and the trend component) is included in the model as a correction factor.
• Structural policies and institutions. Despite disagreement on what policies are most conducive to growth or the sequence in which reforms must be undertaken, there is wide consensus in the literature and among policy makers that governments have the capacity to influence long-run growth through economic policy. For this reason a set of policy indicators or outcomes is included in the model. A distinction is made between structural and stabilization policies. This distinction is, of course, arbitrary but it helps distinguish between policies directed to growth in the long run and those that aimed at correcting cyclical fluctuations. Six different policy indicators are considered under the first group9: (i) human capital, measured as the rate of gross secondary-school enrollment; (ii) financial depth, measured by domestic credit allocated by private commercial banks to the private sector (in GDP percentage terms); (iii) international trade openness, measured by the ratio of imports plus exports to GDP, corrected for certain country characteristics that determine trade levels, such as its size (both area and population) and
9. An extensive discussion on the theoretical and empirical rationale for the choice of indicators and their measurement
is provided in Soto (2006).
8
transport costs (i.e. structure-adjusted trade intensity, SATI)10; (iv) government burden, measured by the ratio of government consumption to GDP; (v) infrastructure, measured by the number of main telephone lines per capita (i.e. telecommunications capacity); and (vi) governance, measured by a combination of the four indicators reported by the International Country Risk Guide (ICRG). These indicators are prevalence of law and order, quality of the bureaucracy, absence of corruption, and accountability of public officials.
• Stabilization policies. The inclusion of stabilization policies in the model is important because of their double role in controlling or mitigating cyclical fluctuations and in promoting long-term growth. Two policy indicators are considered: (i) the inflation rate, which has proven to be a good summary measure of the quality of fiscal and monetary policies and is typically correlated with other indicators of poor macroeconomic policies such as fiscal deficits and the black-market premium on foreign exchange; and (ii) the prevalence of financial crises, measured by the fraction of years during which a country suffers a systemic banking crisis in a given period, as calculated by Caprio and Klingebiel (2003).
• External conditions. Economic growth is also shaped by external conditions, both in the short and long-term. Three additional variables are included in the model to account for this: (i) country-specific terms-of-trade shocks; (ii) period-specific shocks; and (iii) unrequited foreign transfers, measured by monetary transfers made by foreign governments (in the form of development assistance or ODA) and nationals migrants which may allow a country to sustain higher consumption levels than it would otherwise achieve.
Sample and methodology
1.28 For the purpose of the estimation output is measured as GDP per capita, rather than GDP per working-age adult (as above), due to data restrictions, and is modeled as a function of (i) the level of output per capita at the start of the period (to account for transitional convergence); (ii) a set of contemporary explanatory variables; and (iii) time- and country-specific effects to control for changing international conditions and/or unobserved, time-invariant country factors. We use (unbalanced) panel data for 75 countries representing all major world regions, aggregated in 5-year periods and spanning over 1960-2003, and present results based on (i) OLS estimation, (ii) within-group estimation and (iii) random effects, plus instrumental variables estimation11. The results are robust to the choice of econometric technique. Results 1.29 A brief summary of the results from model (iii) above follows (Table 1.3): • Transitional convergence. The estimated coefficient on the initial level of GDP per capita is significant and
consistent with conditional convergence. That is, holding constant other growth determinants, poorer countries grow faster than richer ones. Given the estimated coefficient, the implied speed of convergence is 1.3 percent per year, with a corresponding half-life of about 50 years.
• Cyclical reversion. The estimated coefficient on the initial output gap is negative and significant. This indicates that if an economy is undergoing a recession at the start of the period, it is expected to grow faster in the following years so as to close the output gap. The cyclical reversion effect is sizable and much larger than that estimated by Loayza et al. (2004). According to the point estimate, if initial output is at the median for all countries (3 percent below potential output), the economy is expected to grow about 1.7 percentage points faster in the following five years.
10. This indicator approximates the level of trade explained by trade policy, and therefore allows for comparisons
across countries with different structural characteristics. 11. Lagged values of the right-hand side variables as well as several additional indicators (e.g., lagged values of energy
generating capacities, foreign direct investment as share of GDP, growth in private credit, TFP, etc.) as used as instruments.
9
Table 1.3: Determinants of growth, 1960-2003
Pooled OLS estimator
Within Group estimator
Random Effects IV estimator
Transitional Convergence Initial GDP (in logs) -1.09
(0.22)** -2.07
(0.27)** -1.33
(0.22)** Cyclical Reversion Initial output gap (log of actual GDP to trend GDP) 0.56
(0.10)** 0.54
(0.09)** 0.55
(0.09)** Structural policies and institutions Education (Secondary enrollment, in logs) 0.77
(0.21)** -0.34 (0.33)
0.47 (0.24)*
Financial depth (Private credit as % of GDO, in logs) 0.46 (0.17)**
0.15 (0.23)
0.38 (0.19)*
Trade openness (Structure adjusted trade volume, in logs) 0.57 (0.21)**
1.53 (0.36)**
0.75 (0.26)**
Government burden (Government consumption as % GDP, logs)
-1.25 (0.32)**
-1.85 (0.47)**
-1.47 (0.37)**
Infrastructure (Phones per capita, in logs) 0.51 (0.17)**
0.04 (0.26)
0.69 (0.19)**
Governance (1st principal component of ICRG indices) 0.27 (0.09)**
(0.35)** External conditions Terms of trade fluctuations (growth of terms of trade index) 0.03
(0.02) 0.02
(0.01) 0.03
(0.01)** Unrequited foreign transfers (% of GDP, in logs) 0.03
(0.15) 1.76
(2.28) -0.01 (0.17)
Shift 1960-1964 1.17 (0.54)
0.54 (0.67)
0.62 (0.53)
Shift 1965-1969 0.73 (0.49)
0.15 (0.59)
0.27 (0.47)
Shift 1970-1974 0.99 (0.47)
0.91 (0.55)*
0.62 (0.43)
Shift 1970-1979 0.26 (0.40)
0.31 (0.45)
0.09 (0.35)
Shift 1980-1984 -0.95 (0.38)**
-1.03 (0.42)
-0.95 (0.33)**
Shift 1985-1989 -0.01 (0.38)
0.07 (0.43)
-0.03 (0.34)
Shift 1990-1994 -0.07 (0.40)
-0.72 (0.46)
-0.12 (0.35)
Shift 1995-1999 -0.40 (0.43)
-0.92 (0.51)*
-0.45 (0.38)
Intercept 6.91 (1.65)**
11.71 (2.27)*
10.07 (1.81)**
DW 1.59 2.29 1.99 Source: Authors’ calculations using data from the BCE. Note: * (**) significant at 95% (99%)
10
• Structural policies and institutions. All variables related to structural policies present coefficients with the expected signs and are statistically significant at conventional confidence levels. As reported in the majority of the studies, economic growth increases with improvements in education, financial depth, trade openness, and public infrastructure. It decreases when governments apply an excessive burden on the private sector, in the presence of macroeconomic instability, or in the presence of a financial crisis. The size of the coefficients is broadly consistent with the estimates in this literature, in particular those found by Loayza et al. (2005).
• Stabilization policies. All estimated coefficients carry the expected signs and are statistically significant at conventional confidence levels. In general, economic growth decreases when governments fail to implement policies conducive to macroeconomic stability or in the presence of external financial crises.
• External conditions. Negative terms-of-trade shocks slow down economic growth. This result is consistent with previous studies (Easterly et al., 1993). Regarding the period shifts (or time dummies), only the 1980s appear to have a significant impact on growth (most likely due to the debt crisis). Finally and somewhat surprisingly, remittances exhibit a negative sign and do not have a statistically significant impact on economic growth. This result is reversed, however, when the sample is restricted to developing countries only (not shown).
Growth decomposition 1.30 In this section we use the estimates from the exercised discussed above to quantify the contribution of different determinants to economic growth. A summary of the main results from this exercise follows (Table 1.4):
• Ecuador’s actual economic growth was below the levels predicted by the model during the 1960s, the second half of the 1980s and the 1990s. That is, Ecuador underperformed in terms of economic growth in 25 out of the 43 years considered for the analysis. In addition, higher than expected growth during 1970-1985 was largely driven by positive terms-of-trade shocks associated with the oil price hikes of 1973 and 1978, as well as by conditional convergence factors.
• Conditional convergence plays an important role in explaining high predicted growth levels during the 1960s and 1970s, but its effect wears out as Ecuador’s GDP grows, particularly during the 1970s as a result of the oil boom. In contrast changes in international conditions, measured by period-specific shifts do not appear to have a significant impact on predicted growth.
• Increases in education levels and improvements in financial depth and infrastructure are the primary contributors to predicted growth throughout the period. This observation provides an interesting counterpoint to the results discussed in the previous section, which suggested that, in the case of actual economic growth, the contribution of physical and human capital accumulation may have been smaller than expected due to existing macro and micro constraints.
• Domestic policy mismanagement, captured through the government burden and the inflation rate, affected economic growth negatively. This is consistent with the discussion in the recent Ecuador Poverty Assessment (World Bank, 2004a), which showed that economic growth would have been higher and the unemployment and poverty rates lower had Ecuador operated under a full stabilization scenario during 1960-2003.
• Insufficient trade openness appears to have somewhat hamper economic growth during the 1960s, 1970s and 1980s, while trade liberalization during the 1990s failed to have a significant positive impact suggesting, as was the case with capital accumulation above, that the presence of additional constraints makes it difficult for Ecuador to reap the benefits of trade openness. In addition the effect of terms-of-trade shocks varies over the period as the price of oil and other natural resources fluctuates in international markets.
• Although the impact of governance (or rather the lack thereof) on predicted growth is not sizeable, it is important to mention that Ecuador’s failure to produce improvements in this area constitutes a missed
11
opportunity to foster growth, as has been done by other more successful economies in and outside the region.
• External and domestic financial crisis are associated with lower levels of predicted growth. The former played an important role in explaining negative potential growth rates during 1980-84, while the latter significant diminished predicted growth levels in 1995-99 and 2000-2003.
Table 1.4: Contribution of growth determinants to long-term growth, 1960-2003
1.31 In sum Ecuador’s economic performance over 1960-2003 fell below what would have been expected given the country’s economic and social conditions and institutions. The main reasons behind this disappointing outcome are unstable domestic policies, combined with financial shocks. In addition our results suggest that poor investment climate and governance may have limited the potential positive impact of physical and human capital accumulation and of trade openness. An idea we will return to Part III of this report.
Prospects for growth: A walk in the world of “what if…?”
1.32 Given the discussion presented above the question then arises as to what Ecuador’s performance in terms of economic growth could have been had the country adopted different policies over the past few decades. In this section we attempt to answer this question by comparing Ecuador’s actual performance to that of a counterfactual scenario constructed using the growth model estimated earlier. In other words, we simulate the potential impact of various policy scenarios on economic growth under the assumption that reform efforts that lead to better policies and outcomes could and would translate into higher economic growth.
1.33 Before presenting out results, two aspects of the proposed exercise merit further discussion. First not all the determinants used to estimate the growth model can be directly connected to policy levers. For instance it is relatively easy to establish a direct connection between some of these indicators, say trade openness, and a certain policy intervention, say a reduction in tariffs, while this connection is more diffuse in
12
the case of some other indicators, say the prevalence of financial crisis. This has important implications when it comes to the interpretation of the simulation results and, particularly, when thinking about recommendations based on these results.
1.34 Second, in order for the exercise to produce meaningful results an adequate benchmark has to be selected. The data allows for two obvious candidates: the sample average for developed countries and the sample average for developing countries. Both of them have advantages and disadvantages. Evidently, the average OECD economy constitutes a very high standard for Ecuador to be compared with. Nevertheless, this standard represents an upper bound for the potential benefits of reforms. The average developing economy, on the other hand, may provide too low a reference point. Yet it helps exemplify the benefits associated with the (recent) implementation of certain growth-promoting policies and reforms in Ecuador. Given this we perform the comparison using both benchmarks calculated with data for 2000-2003. The main results from the simulations can be summarized as follows (Table 1.5).
1.35 Ecuador’s economic growth could have been 3.6 percentage points higher had the country share the characteristics of the average OECD country. Perhaps more surprisingly economic growth could have been 0.7 percentage points higher had Ecuador resembled the average developing country in the sample. It is worth noticing, however, that this last result is mainly driven by differences regarding the exposure to financial crises and hence driven by the 1998-9 crisis in Ecuador.
1.36 In terms of human capital accumulation Ecuador fares marginally better than other developing countries in secondary education. This, however, does not amount to much because the average secondary education in developing economies is influenced by African countries where levels are substantially low. In contrast, secondary enrollment is around 75 percent in Latin American countries, which is substantially higher than Ecuador's level of 57 percent. Naturally, there is ample space for improvement when compared to OECD countries: should Ecuador reach developed country status on education, its growth rate would be 0.3 percentage points higher. Again this shows that while education is important, it will provide no easy access to rapid growth in the short-term.
1.37 Similarly physical capital levels in Ecuador, measured in terms of telecommunications infrastructure, are below those of both the average developed and the average developing countries. Reforms leading to expansions in infrastructure would have a potential upper bound impact of an additional 1.2 and 0.2 percentage points of growth when compared to the levels of the former and the latter respectively. This is an area where reforms have to be substantial yet they are possible: other developing economies have developed infrastructure comparable to OECD countries in relatively short periods of time. Chile offers an interesting alternative to developing infrastructure when governments have limited funds: it has used extensively franchises that allow the private sector to invest in (and profit from) roads, ports, telecommunications, energy, and even schools and hospitals. In a matter of a decade, this scheme allowed Chile to triple phone lines and energy generation, and double paved roads. Naturally, franchising infrastructure to the private sector requires institutional capabilities and commitment levels that are not currently available in Ecuador. Yet, the payoff for developing such capabilities is substantial: by only reaching the average level of Latin American economies, Ecuador could grow at around 0.5 percentage points higher.
1.38 The financial sector plays an important role in fostering growth by allocating resources to profitable investment, diversifying risk, and facilitating the exchange of goods and services. Ecuador's current levels of credit to the private sector are similar to those of other developing economies. It is then important to keep these levels and, whenever possible, implement reforms aimed at expanding credit to areas not currently served by the financial sector. There is potential for an additional 0.5 percentage point of growth is the right reforms are implemented. In this regard, the proposal currently under discussion to allocate credit according to criteria other than market-based considerations is very worrisome.
1.39 The results pertaining to domestic policy variables are somewhat mixed. Ecuador’s government burden, measured by public consumption, is substantially lower than that of both developed and developing economies. Given that higher levels of government consumption are associated with lower levels of growth, Ecuador then appears to fare well on this particular front. This, however, ignores important issues such as the
13
quality of public expenditure and public expenditure management, which will be discussed in more depth in Part II of this report. Moreover recent changes relaxing Ecuador’s fiscal management framework signal that the country government may be moving in the wrong direction. On the other hand, the significant decline in inflation brought about by the dollarization places Ecuador closer to the average developed economy than to the average developing economy in this regard (notice that the average inflation reported in Table 1.5 is contaminated by high inflation in 2000 and 2001, while by 2004 inflation had reached 2 percent).
Source: Authors’ calculations using data from the BCE.
1.40 Finally Ecuador lags notoriously behind developed economies in terms of governance. The country has suffered from significant political and economic instability during the last decade. Even when compared to developing countries, Ecuador displays a very negative record: governance was among the lowest in the world in the 2000-2003 period and crises followed one another. Ecuador's governance level is similar to that of Bolivia (a case of chronic instability) and second only to countries in a state of virtual civil war, such as Colombia. This is an area where reforms, though difficult, could yield substantial benefits in terms of economic growth and, more importantly, welfare.
1.41 In sum further reforms, particularly in the areas of infrastructure, financial management and governance could help untapped some of Ecuador’s unrealized growth potential. Some of these reforms may require additional resource and significant political will, but they payoffs associated with them are substantial.
C. Conclusions
1.42 The evidence discussed in this chapter leads us to conclude that economic growth in Ecuador during 1960-2004 was largely fueled by productivity gains, while the contributions of capital accumulation and employment growth were more modest. During this period Ecuador’s economic performance fell below what would have been expected given the country’s economic and social conditions and institutions. The main reasons behind this disappointing outcome are unstable domestic policies, in particular fiscal and monetary policies, combined with financial shocks. In addition, Ecuador’s poor investment climate and governance may
14
have limited the potential positive impact on growth of physical and human capital accumulation and of trade openness. As a result stable and sound fiscal policy, combined with further reforms, particular in the areas of infrastructure, financial management and governance could help untapped some of Ecuador’s unrealized growth potential.
1.43 The rest of this report addresses these issues in more detail. Chapter 2 in Part I explores the connection between economic growth and employment creation and discusses the role of skills, technology, labor market institutions and, more broadly, the investment climate as determinants of growth. Part II provides a discussion on what we consider the two main pillar of stable growth: fiscal policy (Chapter 3) and financial management (Chapter 4). Finally Part III examines the potential of the oil sector (Chapter 5) and trade openness (Chapter 6) as engines of robust growth.
15
II. GROWTH AND JOBS12
2.1 Recent economic growth has been fueled by the oil sector, as discussed above, and by a boom in private consumption, which increased faster than GDP per-capita during 2000-2004. This boom is closely tied to international remittances and has been largely satisfied by an increase in imports of final goods. Although domestically higher consumption has generated an increase in activity in the construction sector, it has been the engine for a more broad-based recovery of the non-oil sector. Ecuador’s non-oil sector grew at 1.7 and 2.8 percent in 2003 and 2004 respectively, compared to 2.7 and 6.9 percent for the economy as a whole and to 6.5 and 23.5 percent for the oil sector. The sector then recovered in 2005 growing at 4.2 percent, compared to 3.9 percent for the economy as a whole. Economic growth, however, has failed to generate new jobs.
2.2 This chapter examines the connection between economic growth and employment creation in an attempt to understand what lies behind Ecuador’s disappointing employment record in recent years. Both macro and microeconomic factors are examined for this purpose. The main findings can be summarized as follows:
• At the aggregate level lack of dynamism in aggregate labor demand and employment creation are the result of slow economic growth and of changes in relative prices brought about by the dollarization. Since 2000 real wages have increased by about 30 percent (significantly above labor productivity growth) while the real cost of domestic and foreign capital has declined steadily. Combined these changes imply that labor is becoming a relatively more expensive, which generates incentives for employers to substitute away from labor.
• At the micro level employment creation is correlated with productivity growth, which in turn is a function of education, technology and the business environment in which firms operate. As a result serious deficiencies in term of labor force education levels and access to technology, together with the poor quality of Ecuador’s investment climate (including the country’s labor institutions and legislation) have negatively affected employment responsiveness to growth.
2.3 The rest of the chapter is structured as follows. The first section discusses the relationship between aggregate economic growth, wages and employment creation, distinguishing between long- and short-term transmission mechanisms. The second section examines the impact of education, technology, and the business environment, including the labor market’s institutional and legal framework, on employment creation.
A. Aggregate economic growth and employment creation
2.4 In this section we build a simple model to estimate labor demand in Ecuador using data for 1990-2004. The purpose of the exercise is to be able to quantify the relationship between employment creation on the one hand, and economic growth, productivity growth (approximated by a time trend), factor prices (labor and capital) and the cost of intermediate inputs (imported capital goods) on the other. In doing this we distinguish between long- and short-term impacts.13
2.5 The estimated long-term output elasticity of employment for the period under study is slightly smaller than 1—i.e. a 1 percentage point increase in GDP growth leads to a 0.8 percent point increase in employment levels. In addition the estimated long-term wage elasticity of employment is -0.75—i.e. a 1 percent increase in wages leads to a 0.75 percent decline in employment levels. The impact of capital on labor
12. This chapter draws from work by the World Bank (2004a, 2004b and 2005) and from original work commissioned
for this report (Soto, 2006; Koryukin, 2006). 13. Details on the model’s specification can be found in Soto (2006).
16
demand, measured using the cost of domestic and imported capital, is weaker than that of growth and wages, with long-term elasticity of 0.1 and 0.3 respectively. Considering that the average annual growth rate for the Ecuadorian economy during 1990-2004 was approximately 1.6 percent and that minimum real wages increased by approximately 60 percent in the same period, lack of dynamism in labor demand should come as no surprise. More recently, although economic growth has been relatively stronger following the dollarization, its potential positive impact on employment has been neutralized to a large extent by a 30 percent increase in real wages.
2.6 The short-term dynamics generated by the estimated model indicate that employment levels adjust relatively slowly to shocks. A simple impulse-response exercise shows that market forces will take three years to correct or fully adjust for a one-standard deviation change in one of the factors considered above, suggesting that labor markets in Ecuador are relatively inflexible (Figure 2.1). For instance a positive GDP shock takes approximately 7 to 8 quarters to start to materialize and an additional 8 quarters to fully unravel. Two potential reasons for such a slow response may be: (i) high hiring and firing costs and (ii) a weak investment climate; both of which could cause entrepreneurs to be reluctant to generate employment unless changes in GDP are perceived as permanent. We discuss these issues in more depth in the next section
Figure 2.1: Short-term employment dynamics
Source: Soto (2006).
17
2.7 Employment levels are also slow to react to changes in wages, although the speed of adjustment is faster than that observed in the case of GDP changes. It takes about a year for employment levels to start changing in response to a one-standard deviation change in wages, and an additional year for the full adjustment to take place. Moreover the impact of the change is long-lasting, expanding up to three years. In other words, increases in real wages can lead to significant and persistent increases in unemployment levels, as a consequence of both the decline in employment and the likely increase in participation rates incited by higher potential wages.
2.8 Finally employment levels appear to be fairly responsive to changes in the cost of capital. An increase in the real interest rate leads employers to substitute labor for capital, maybe through the use of more labor-intensive production methods. Similarly changes in real exchange rates signal for the relocation of resources between traded and non-traded goods sectors. Since these sectors have different labor intensities, changes in the real exchange rate may have an impact on the level of employment as long as they are perceived to be permanent.
2.9 In sum the empirical analysis suggests that there are two effects at work. On the one hand, the lack of dynamism in aggregate labor demand and employment creation is the result of slow economic growth. On the other, changes in relative prices brought about by the dollarization process have played against employment creation. Since 2000 real wages have increased by about 30 percent (significantly above labor productivity) while the real cost of domestic and imported capital has declined steadily. Together these changes imply that labor is becoming a more expensive factor of production and, thus, generate incentives for employers to substitute away from labor.
B. Microeconomic constraints to employment creation
2.10 The discussion in the previous section has concentrated on the determinants of employment creation from an aggregate or macroeconomic point of view. It is clear, however, that there are additional factors that influence employers’ decisions regarding employment creation beyond economic growth and the costs of production inputs. These factors may in fact determine how responsive employment levels are to growth and other aggregate forces.
2.11 One way to explore what these additional factors may be, as well as to quantify their impact on employment and on employment responsiveness to growth, is to use firm-level data. Timid net aggregate employment creation hides important differences between those firms that create employment and those that do not. In particular, firms that created employment in recent years are generally more productive than their competitors due to higher education levels among their workers, more intense use of foreign technology (presumably more advanced than domestic technology), and higher exposure to international competition (World Bank, 2004a).
2.12 Increases in productivity, however, may fail to translate into higher employment creation in the presence of certain barriers. Firms interviewed in the Ecuador Investment Climate Survey identify three types of barriers: labor legislation – in particular, that regarding non-wage and firing costs -, economic uncertainty, and the quality of the institutional and investment climate.
2.13 In this section we summarize previous work by the World Bank (World Bank, 2004a, 2004b and 2005) and combine it with original work commissioned for this report (Koryukin, 2006) to provide an overview on the impact that some of these factors may have on employment generation and, more broadly, on firm’s productivity. We focus on (i) education and technology, (ii) the institutional and legal framework of the labor market, and (iii) the business climate.
18
Promoting productivity growth and employment creation: The role of education and technology14
2.14 Most new technologies are developed in the industrialized countries and transmitted to developing countries via foreign direct investment, licensing, or capital goods imports. Access, however, is not enough to guarantee an efficient and effective use of these new technologies. Rather recipient countries must have a broad base of secondary educated workers to successfully adopt and adapt these technologies (de Ferranti et al, 2003). Unfortunately Ecuador presents serious deficiencies in terms of both access to technology and the education level of the labor force.
2.15 Access to foreign technology is limited. Although foreign direct investment grew from 0.5 percent of GDP in 1980 to 5.9 of GDP in 2000, surpassing the regional average, most of the increase was concentrated in the oil sector, thus generating almost no externalities. In addition, the levels of both imports of capital goods and expenditures in R&D, needed to successfully adapt the technology embedded in those goods, are low (Table 2.1).
Table 2.1: Capital goods imports and Foreign Direct Investment
14. This section summarizes the discussion on this issue presented in World Bank (2005).
19
2.16 Similarly, Ecuador exhibits an important deficit of secondary educated workers (Table 2.2). Only 18 percent of all adults have secondary studies, compared to 28 percent in Peru and 46 percent in Bolivia, while secondary enrolment rates are, at 46 percent, 8 percentage points below what would be expected given Ecuador’s income level (De Ferranti at al, 2003).
Table 2.2: Education levels among the adult population
2.17 In order to increase both access to foreign technology and domestic innovation capacity, the Government of Ecuador can: (i) simplify licensing procedures and promote foreign direct investment outside the oil sector, (ii) create service centers that facilitate new technology adoption by micro and small firms, and (iii) promote R&D through agreements between domestic and foreign firms, or through licensing. In order to increase the education level of the workforce, the Government of Ecuador can: (i) implement supply and demand interventions to increase coverage and retention rates in secondary schools, and (ii) modernize the current training system to make its services more competitive, and to increase its coverage to informal workers and employers.
Eliminating barriers to employment creation: The role of labor legislation15
2.18 The Ecuadorian labor legislation contemplates high levels of protection, with employment conditions and firing cost regulations comparable to those of some industrialized countries and well above the regional
15. Ibid.
20
average. For instance, the average cost of firing a worker in Ecuador is estimated to be equal to 14 monthly salaries, compared to 5.5 for the region.
Table 2.3: Employment protection legislation
Employment conditions
Protection against dismissal
Firing costs
0 (low protection) a 1 (high protection) Monthly wages
Ecuador 0.58 0.68 14
Latin America 0.75 0.50 5.5
Industrialized countries A 0.40A 0.12A 1.5
All countries 0.63 0.35
Note: A English-speaking countries. Source: Botero et alia (2003) and Heckman y Pages (2002).
2.19 However, because most of these regulations can be avoided through the use of temporary or informal contracts, protection levels are the facto low. In fact, the regulation of temporary employment in Ecuador is more flexible than that of other countries, and, although some level of protection is also stipulated for these contracts, non-compliance is prevalent. For instance, only 15 percent of all temporary workers are affiliated to the Social Security system, compared to 45 percent of all private-sector, permanent workers.
Figure 2.2: Access to Social Security
(Percentage of workers with NO access to Social Security)
Source: Pages and Martinez (2004).
0 10 20 30 40 50 60 70 80 90 100
Sin educacion
Educacion primaria
Edad 15-24
Contrato temporal
Educacion secundaria
Empresa con menos de 100 empleados
Hombres
Asalariados sector privado
Mujeres
Edad 25-34
Edad 55-64
Edad 35-44
Edad 45-54
Contrato indefinido
Educacion superior
Empresa con mas de 100 empleados
Asalaraiados sector publico
Promedio para los asalariados del sector privado
21
2.20 From the point of view of employers, the effect of labor legislation is mixed. On the one hand, temporary contracts allow for a more flexible management of the labor force over the business cycle, and lower the cost of innovation and risk taking. On the other hand, rigid legislation creates disincentives for micro and small firms to grow, and widespread use of temporary contracts may have a negative impact on training. Both factors have the potential to negatively affect productivity.
2.21 In sum, while the current labor legislation is intended to be very protective, in practice it generates enormous inequalities between permanent and temporary workers, and can negatively impact productivity. This situation is the result of the existing gap between the actual costs of permanent employment, on the one hand, and temporary and informal employment, on the other. Thus, any attempt to mitigate or eliminate the negative impact of existing legislation, must aim to close this gap.
2.22 The gap in the cost of permanent and temporary contracts is a function of differences in (i) wage levels, (ii) causes and cost of dismissal, (iii) entitlement to profit-sharing, and entitlement to employer-finance pensions between both types of contracts. As a consequence, attempts to close this gap must rely on (i) a reduction in the protection granted to permanent contract, (ii) a reduction in the flexibility granted to temporary contracts, or (iii) both. A brief summary of policy options in this regard is presented below (Table 2.4) and a detailed analysis of the advantages and disadvantages associated with each one of these options (or combinations thereof) is presented in Annex 2.
Table 2.4: Policy options for labor market reform Temporary contracts • Limit use of temporary contracts to temporary activities
• Limit number of consecutive contract that can be offered to a particular worker • Allow for pro-rating of Social Security contributions for temporary contracts
Permanent contracts Firing causes and cost • Reduce severance pay
• Establish private arbitrage system for (firing) conflict resolution • Consider “economic circumstance” as a fair reason for dismissal
Profit-sharing rules • Replace fixed profit-sharing rate with rates agreed upon through collective bargaining • Promote publication of collective bargaining agreements regarding profit-sharing • Increase transparency in firm accounting
Employer-financed pensions • Eliminate employer-financed pensions for workers with less than a certain number of years of service
• Preclude further increases in future payment by fixing compensation at current levels • Design a compensation plan for workers with more than a certain number of years of
service that are currently entitled to employer-financed pensions Improving the business environment: The role of investment climate constraints16
2.23 Sustained growth and competitiveness under dollarization require a wide set of structural reforms in order to promote faster productivity growth and employment creation. Measures to improve the investment climate are crucial for achieving those objectives. The quantity and quality of investment flowing into any specific region or country depend upon the risks and the expected returns faced by potential investors. Those risks and returns are in turn intrinsically associated with the policy, institutional, and behavioral environment in which investment decisions are made.
2.24 The poor quality of Ecuador’s investment climate is identified by most employers as one of the major constraints to business expansion and thus employment creation (World Bank, 2004b). Within the
16. This section summarizes the discussion on this issue presented in World Bank (2004b) and combines it with original
work prepared for this report.
22
investment climate, employers highlight corruption, political and economic uncertainty, access to and cost of financing and costly bureaucratic processes as the main obstacles (Figure 2.3). Domestic perceptions regarding the quality of Ecuador’s investment climate are confirmed when the country is compared to others in and outside the region. For instance The 2005 WEF Global Competitiveness Report placed Ecuador in position number 103 out of a total of 117 countries regarding “growth competitiveness”, position number 103 out of 110 countries regarding “business competitiveness”, and position number 104 out of 110 countries regarding “quality of business environment”. The main investment climate constraints identified by businesses as part of the WEF survey coincide with those mentioned as part of the World Bank Investment Climate Survey mentioned above. Similarly Ecuador scores poorly on labor legislation and business processes as part the 2006 World Bank Doing Business Report (see Annex 3 for details).
Figure 2.3: Investment climate constraints to business expansion and employment creation
Ecuador: Obstacles to growth and competitiveness (manufacturing sector)
8
11
13
14
18
22
25
25
28
28
28
38
43
47
49
54
56
61
0 20 40 60
Access to Land
T ransportation
Bus iness licens ing and operating permits
Labor regulations
T elecommunications
Skills and education of available workers
Customs and trade regulations
Legal sys tem/conflict resolution
Crime, theft and disorder
Electricity
T ax administration
T ax rates
Access to financing
Anti-competitive or informal practices
Corruption
Macroecomonic ins tability
Cost of F inancing
Regulatory and policy uncertainty
% respondents perceiving the obstacle as major or severe
Source: Investment Climate Survey (World Bank, 2004b).
2.25 Furthermore employers’ subjective perceptions regarding the negative impact that investment climate constraints have on their businesses’ productivity and capacity to compete and grow, are validated when econometric techniques are used to estimate the effect that these constraints have on productivity. In particular constraints related to red tape, labor regulation, and the quality of infrastructure have a negative and significant impact on firm-level productivity, measured by TFP (Koryukin, 2006).
2.26 A detailed discussion on the issues of governance and corruption, access to and cost of financing, and telecommunications infrastructure is provided in the recent Ecuador Investment Climate Assessment (World Bank, 2004b). We briefly summarize the report’s main messages and policy recommendations below and refer the interested reader to the original document for further details.
23
Governance and corruption
2.27 Ecuador ranks below most of its neighbors in indexes that measure government effectiveness and regulatory quality, while objective indicators based on plant-level data confirm that Ecuadorian businesses face a heavy regulatory burden. The weight of the regulatory burden varies by sector and region, and affects to a greater extent firms that are more productive and have a higher degree of international integration.
2.28 In addition all the available measures suggest that corruption in Ecuador ranks among the highest in Latin America and the world. The high frequency of government changes undermines the effectiveness of government programs, including those directed at combating corruption, and creates a chaotic environment which facilitates corrupt practices. Other causes of corruption include a high degree of political fragmentation, a complex and sometimes redundant body of laws and regulations, the existence of multiple government institutions with similar functions, a defective system of public procurement, lack of government transparency and impunity. Survey data confirms the existence of widespread corruption, which affects the day to day operation of most manufacturing firms. The direct costs of corruption are higher in Ecuador than in most countries for which comparable data is available, and firms that are objectively exposed to larger levels of corruption exhibit lower levels of productivity and capital per worker.
2.29 The prevalence of the rule of law and confidence in the judiciary are also lower in Ecuador than in most countries in the region. Problems in the justice system are seen as greater obstacles for the operations of publicly listed firms that have made larger investments. Given the low level of confidence in the judiciary, it is not surprising to find that a small fraction of commercial disputes are taken to the courts.
2.30 Finally more than one out of every three manufacturing firms has been victim to a criminal activity, with monetary losses amounting to 1.3 percent of total sales (including non-affected firms). Crime is more frequently seen as a severe obstacle by firms with high rates of investment per worker, as well as by firms with foreign ownership and a larger use of imported inputs.
2.31 In order to improve governance and reduce corruption, the GoE should continue its efforts to simplify business registration and operating procedures and take measures to promote greater transparency and efficiency in public procurement. Currently, the Contraloría General del Estado only controls contracts above US$ 112,000, which represents a small part of the overall public procurement. However, this massive lack of oversight is starting to be compensated by the initiation of CONTRATANET based on the Commission for Civic Control of Corruption (CCCC). To improve the current public procurement system the government could: expand the coverage of CONTRATANET by converting it from a purely informational to a transactional procurement system, including the use of revised procurement measures for key clients; link the system to the taxpayers identification database, incorporate sub-national procurement procedures, and initiate public sector customer training; support the enactment of key legislation, such as a revised Procurement Law, an electronic public transactions law and on this basis promote an overhaul of public procurement procedures; strengthen coordination between various agencies involved in procurement (CCCC, State Modernization Council, Comptroller General’s Office, National Connectivity Council, and MEF); and provide support to the CCC and other civil society institutions to strengthen their advocacy role in improving transparency and greater access to information.
2.32 In order to increase the efficiency of the legal and judicial system, the government should strengthen the National Judicial Council, improve internal oversight mechanisms within the judiciary and revamp the weak mechanisms of ethical oversight within the bar association. The overall management and administrative capabilities of the Council should be improved, encompassing the areas of budget management, court procedures, training of personnel, and infrastructure modernization. In addition, measures should be taken to improve transparency, promote independence and ensure the accountability of judges, including the adoption of an evaluation system for the assessment of judicial performance, the development of selection and disciplinary procedures for judges, and the strengthening of the Judicial Ethics Code. Finally, since corrupt lawyers pervert the judicial function and distort the rules of competition in the legal services´ market, improved disciplinary systems and sanctions for ethical misconduct should also involve attorneys.
24
Cost of and access to finance
2.33 Plant-level data on access to credit places Ecuador close to other Latin American countries. About 16 percent of surveyed firms can be considered to be credit-constrained. Firms rely on banks for only 25 percent of their working capital needs and 28 percent of investment financing. However the cost of credit is high, particularly for smaller firms, and high collateral is required to access credit. In addition the terms of the loans granted to Ecuadorian firms are much lower than in other Latin American countries.
2.34 In order to increase access to credit and lower its costs, especially among medium and small firms, the government should strengthen financial reporting practices, in order to create an environment of increased transparency, which facilitates access to foreign investment and credit. Small and medium enterprises should be encouraged to invest in external audits. From the commercial bank perspective, this step would lessen the burden and costs of reviewing credit applications, thus facilitating the access to finance of small and medium businesses. Banks, on the other hand, should be required to use and publish annual percentage rates (APRs) to enable clients to compare between financial institutions. The government should also analyze alternatives for improving the access to credit of small and medium enterprises, building on the experience of banks and finance companies from other Latin American countries, as well as Ecuadorian private banks that have been pioneers in providing credit to small businesses. The government should invite banks and finance companies from the region to present their experiences to the banking industry, in terms of market research, product design, as well as requirements and performance of a small and medium enterprises portfolio. By franchising their methodologies or creating alliances with local institutions, these banks could move into unattended or underserved markets. For instance, coverage is estimated at 40,000 micro and small firms in Guayaquil, but the demand for such services is close to 300,000 clients. One solution to consider is a competitively allocated short term subsidy to commercial banks and finance companies to defray the set-up costs of entering markets where there are concentrations of small and medium enterprises – covering market research and initial product design and testing, for instance.
Telecommunications infrastructure
2.35 The provision of fixed telephone services remains state-owned in Ecuador, which has one of the lowest rates of investment in telecommunications of the region – 0.22 percent of GDP between 1996 and 2000. The tariff regime is unbalanced and biased against commercial users. Due to the late introduction of mobile services, and the presence of only three operators in the market, Ecuador exhibited, until very recently, a relatively low density of cellular phones and tariffs that were high by international standards. In contrast, and despite a relatively low number of internet hosts, the use of information and communication technologies (ICT) is high among manufacturing firms. These firms, however, face long delays to obtain new phone lines and are likely to experience service interruptions after obtaining one.
2.36 In order to reduce waiting times, improve reliability, and realign the costs of telephone services, the government should increase the productivity and efficiency of ANDINATEL and PACIFICTEL. That implies four types of actions: (i) allowing private participation and management; (ii) rebalancing tariffs to eliminate cross-subsidies and reflect the true cost of telephone calls; (iii) making FONDETEL operational to reduce social and geographical disparities in access to the telecommunications services; and (iv) introducing a new sector legislation that enables the development of an effective competitive framework.
C. Conclusions
2.37 The evidence presented in this chapter suggests that Ecuador’s disappointing employment creation performance can be attributed to both macro and microeconomic factors. Low economic growth, combined
25
with wage growth above labor productivity growth and significant changes in relative prices of production inputs have dampened labor demand as employers substitute away from labor and into capital. In addition low employment creation responds to low firm-level productivity growth associated with limited access to adequate human and physical capital. Finally responsiveness of employment to economic and productivity growth is weak due to existing micro constraints, including rigid labor legislation and poor quality of investment climate. In this context reforms aimed at increasing access to adequate skills and technology, as well as to improve the country’s investment climate can go a long way in increasing both economic growth and its impact on employment creation.
26
27
III. PROMOTING STABLE ECONOMIC GROWTH
3.1 Fiscal solvency, debt sustainability, and well-functioning financial and banking systems are among the key preconditions needed for a dollarized economy to function successfully. The three factors are important elements for creating a stable macroeconomic environment conducive to productivity and economic growth and, ultimately, investment and employment generation. As dollarization precludes the use of monetary and exchange rate policies, fiscal policy is the only economic tool the government has to guide the economy. Debt sustainability, on the other hand, monitors the profligacy of fiscal policy and keeps government finances in check, thereby lowering the country’s risk and uncertainty. Finally, a healthy banking system with an adequate institutional and regulatory framework is necessary for efficient intermediation and function of the payment system.
Fiscal policy and debt management
3.2 Under dollarization the Central Bank can neither print money, nor adjust the exchange rate parity between national and foreign currency, nor act as the lender of last resort to resolve financial difficulties. Furthermore fiscal deficits cannot be monetized, though indebtedness could be increased to finance fiscal deficits. As a result in a dollarized economy the authorities are expected to maintain a strong fiscal stance and a level of public debt stock compatible with medium term fiscal sustainability and financial stability.
3.3 Recognizing the need to create a sound fiscal policy framework to buttress the economy, Congress approved the Fiscal Responsibility, Stabilization, and Transparency Organic Law (FRTL I) in 2002. Among the important features introduced by the law, two were of paramount importance for prudent fiscal management. First the law established fiscal rules to limit the expansion of real primary expenditures and of public debt, and to reduce the non-oil fiscal deficit. Second the law contemplated the creation of a new Petroleum Stabilization Fund (FEIREP), which would promote public savings, help reduce public debt to sustainable levels, and act as a stabilization tool to protect the economy against shocks. The enactment of the FRTL I, in combination with higher economic stability brought about by the dollarization, was followed by significant improvements in fiscal management.
3.4 Legislative changes introduced in 2005, however, have the potential to seriously undermine the fiscal management framework created under the FRTL I, and to increase fiscal policy volatility. This chapter builds upon the analysis presented in the recent Ecuador Public Expenditure Review (World Bank, 2003b) and discusses the impact of such changes, both on Ecuador’s fiscal stance and debt sustainability. The main findings of the chapter can be summarized as follows:
• Ecuador’s fiscal performance has improved significantly following dollarization. The Non-Financial Public Sector (NFPS) overall balance went from a deficit to a surplus between 1995-99 and 2000-2005, while primary surplus increased from 1.2 to 4.6 of GDP during the same period.
• These figures, however, mask important structural fiscal management problems that will have to be addressed if Ecuador is to succeed in creating an adequate and effective fiscal management framework under dollarization. These problems include high dependency of the NFPS and Central Government (CG) budgets on oil revenues, rapid growth of recurrent expenditures (especially wages and salaries and debt service), and significant budgetary rigidity associated with earmarking (especially in the form of subsidies).
• In addition, recent legislative changes have substantially undermined the integrity of the existing fiscal management framework regarding revenue and expenditure management, as well as Treasury liquidity and public debt management. The combination of an overall weaker fiscal management framework and the mounting pressures generally associated with election years, such as 2006, pose important risks in terms of fiscal solvency whose impact could extend well beyond this fiscal year. In this context policy
28
reforms aimed at preserving the sustainability of fiscal accounts and at strengthening public expenditure management could go a long way in minimizing these risks and their potential long-term impact.
• Finally recent economic growth, fueled to a large extent by high international oil prices, has helped Ecuador reduce its debt-to-GDP ratio to approximately 40 percent, down from 70 percent in 2001, and hence curtail the country’s vulnerability. Looking forward the government should continue to work towards further reductions in debt levels, as well as towards improving the management of its debt portfolio to minimize service payments and mitigate short-term liquidity problems.
3.5 The rest of the chapter is structured as follows. The first section presents recent fiscal trends, analyzes the legal changes mentioned above and proposes some corrective policy options aimed at mitigating the potentially adverse impact of theses changes on fiscal solvency. The second section discusses Ecuador’s debt performance and presents a series of debt sustainability scenarios under various assumptions.
A. Evolution of the fiscal panorama and fiscal policy
3.6 Ecuador’s fiscal performance has improved significantly following dollarization. The Non-Financial Public Sector (NFPS) overall balance went from a deficit of 3.3 percent of GDP to a surplus of 1.3 percent of GDP between 1995-99 and 2000-2005, while primary surplus increased from 1.2 to 4.6 of GDP during the same period. These improvements were mainly the result of increases in total revenues, particularly oil revenues and taxes.
3.7 These figures, however, mask important structural fiscal management problems that will have to be addressed if Ecuador is to succeed in creating an adequate and effective fiscal management framework under dollarization. These problems include high dependency of the NFPS and Central Government (CG) budgets on oil revenues, rapid growth of recurrent expenditures (especially wages and salaries and debt service), and significant budgetary rigidity associated with earmarking (especially in the form of subsidies).
Fiscal trends Revenues trends
3.8 Total revenues has increased and become less volatile in recent years, although oil revenues still remain a source of volatility within the budget. NFPS revenues increased from 23 to 28 percent of GDP between 1995 and 2005, while their volatility, measured by their standard deviation, declined from 2.1 to 1.7 between 1995-1999 and 2000-2005 (Table 3.1).
Non-oil revenue % of NFPS revenues 59.2 56.2 66.5 76.9 66.4 64.9 70.3 75.2 74.8 71.4 74.6 Oil revenue % of NFSP revenues 14.9 20.1 14.0 6.4 21.3 31.3 19.1 15.3 15.8 20.1 24.3 NFPS revenue % of GDP 22.8 21.9 20.0 17.3 21.1 25.9 23.6 26.2 25.4 26.9 28.0 Source: Banco Central del Ecuador. www.bce.fin.ec.
29
3.9 Higher economic growth and lower inflation had a positive impact on non-oil revenues, which increased from 65 to 72 percent of NFPS revenues between 2000 and 2005. Most of this increase can be traced down to improvements in tax collection, particularly regarding the income and value-added taxes, resulting from both higher economic stability and a stronger and more effective administration at the Internal Revenue Service (SRI). Tax revenues averaged 11.1 percent of GDP in 2000-2005, up from 6.4 percent in 1995-1999, the equivalent of an annual increase of 4.7 percent. In 2005 alone total tax revenues increased 16.0 percent in real terms, equivalent to 12.1 percent of GDP, the highest ever (Table 3.2).
3.10 Oil revenues remain an important share in total NFPS revenues, despite increases in non-oil revenues. From 2001-2005, oil export revenues averaged 18.9 percent of total NFPS revenues, up from 15.3 percent during 1995-1999. High oil prices over the past years pushed this ratio up even more, in 2005 oil revenues accounted for 24.3 percent of total revenues (Table 3.1).
3.11 Lower revenue volatility can be mainly attributed to lower non-oil revenue volatility. The standard deviation of non-oil revenues declined from 8.0 to 4.0 between 1995-1999 and 2000-2005, compared to no change in the standard deviation on oil revenues which equal 6.0 in both periods.
3.12 Given oil revenues innate volatility and their relative importance within total revenues, it is important to implement reforms aimed at buffering the budget from fluctuations in and reducing its overall dependency on oil revenues. This could be achieved through a combination of policies geared towards strengthening tax administration and collection, while promoting public savings out of oil revenues. Unfortunately recent legislative changes appear to have stirred fiscal management in the opposite direction.
Expenditure trends
3.13 Primary expenditures have increased in recent years and, contrary to what we observed concerning revenues, they have become more volatile. NFPS expenditures grew from 19 to 21.4 percent of GDP between 1995-1999 and 2000-2005. Expenditure growth has gone hand in hand with oil revenue increases—oil revenues and primary rose by 2.8 and 3.0 percent of GDP respectively between 2003 and 2005--suggesting that the government has expended the oil windfall instead of saving it as a precautionary measure (Figure 3.1). This development has two important consequences: it increases budgetary dependency on oil revenues, as evidenced by the deterioration of the non-oil NFPS deficit from -2.4 to -5.0 percent of GDP between 2003 and 2005, and it creates new permanent obligations that will have to be honored in future budgets regardless of actual revenues. Finally primary expenditures have become more volatile, with a standard deviation of 1.8 in 2000-2005 up from 1.2 in 1995-1999.
30
Figure 3.1: Primary expenditures and oil export revenues
0
5
10
15
20
25
2001 2002 2003 2004 2005
Per
cen
tag
e o
f G
DP
Primary Expenditures Oil Export Revenues Source: Banco Central del Ecuador. www.bce.fin.ec.
3.14 The main source of primary expenditure growth during this period is public wages and salaries payments. Over the past five years, NFPS wages and salaries have more than tripled in nominal terms, increasing from an average of 6.8 to 7.7 percent of GDP between 1995-99 and 2000-2005. And they are projected to go up to 8.9 of GDP in 2006. As a consequence the share of total and current expenditures accounted for by wages and salaries, as well as the share of total revenues needed to finance wages and salaries, has increased over time (Table 3.3).
Table 3.3: Evolution of public wages and salaries
Wages (% GDP)
Standard Deviation
Wages (% current exp)
Wages (% total exp)
1994-1998 7.0 0.26 38.3 27.9 1995-1999 6.8 0.56 37.6 28.5 2000-2005 7.7 1.62 41.2 31.6 2005-2006 (proj.) 8.9 49.7 36.6 Source: Ministerio de Economía y Finanzas.
3.15 Increases in the public wage bill are the result of both higher monthly salaries and growing numbers of public employees. Despite austerity decrees issued by different governments to prohibit hiring new employees, public employment has increased. Employees in the CG increased from 272,370 in 2000 to 303,896 in 2005—about 15,000 policemen and 11,000 new troops were hired, together with an additional 8,000 new public servants in other CG institutions. To bypass the austerity decrees, new workers were hired as “employees under contract”, effectively increasing these type of employees from 2,530 in 2001 to 12,421 in 2005.
3.16 The proliferation of public sector personnel laws only contributes to make the problem of controlling wage bill growth harder, since the co-existence of different laws and labor regimes precludes the implementation of a comprehensive and coherent wage policy—i.e. only 16 percent of public servants are covered under the civil service reform law passed in 2003 (Table 3.4). The public sector wage bill cannot continue to growth along the path of the last few years if Ecuador is to succeed in bringing fiscal accounts under reign. A labor reform to unify the different public sector personnel laws is needed.
31
Table 3.4: Public sector employees, 2005
Legal Arrangements Number of employees Percentage of total Legislative Personnel Law 341 0.1 Teacher’s Personnel Law 113,427 37.3 Arm Forces Personnel Law 67,313 22.2 Police Personnel Law 36,907 12.1 Civil Service Law 48,283 15.9 Foreign Service Personnel Law 278 0.1 Judiciary Personnel Law 4,916 1.6 Under the Labor Code 18,225 6.0 Under Contract 12,421 4.1 Other 1,785 0.6 Total 303,896 100.0 Source: Ministerio de Economía y Finanzas.
3.17 Debt service payments have also increased over the past few years, contributing to overall expenditure growth. This is the result of increased gross financial needs associated with the use of domestic short-term debt to manage liquidity mismatches. Amortization of domestic public debt climbed from US$403 to US$816 million between 2002 and 2005. And, as a result, gross financial needs increased from 5.5 to 7.5 percent of GDP in the same period. The mismatch between revenue and expenditure flows in and out of the Treasury account could be somewhat mitigated by increasing government savings to cope with the variability of revenues during the year. Another mitigating action could be the restructuring of the (domestic) debt profile to lengthen its maturity and hence reduce its costs. The GoE has recently taken steps in the direction of the latter option.
Budget Rigidities
3.18 Earmarking of non-oil and oil revenues and an array of subsidies continue to erode budget flexibility and encumber the efficient allocation of fiscal resources. In this respect, dollarization has had no impact on reversing this trend, which has been the norm in Ecuador for more than 30 years. On the contrary, the 2006 Central Government budget is allocating 77.5 percent of total revenues, net of public financing, to subsidies and earmarked expenditures (Table 3.5). For 2006, subsidies represent 5.5 percent of GDP. Of these, domestic oil subsidies account for 61.4 percent of total subsidies, or 3.6 percent of GDP. Pension subsidies account for 23.3 percent of total subsidies, or 1.3 percent of GDP. These represent significant resources that are poorly targeted and therefore should be gradually reduced to improve fiscal allocation and also to restore an already rigid budget situation.
3.19 Congress enacted laws that worsened budget rigidity for 2006 and forward. In a move to placate the regions and raise their resource allocation, Congress redefined current revenues to include revenues from oil exports, which were previously classified as capital income. As a result the size of current revenues increased, and with this, the 15 percent share of current revenues that local governments are entitled to. For 2006, this translates into an additional $139 million that gets pulled out from the central budget and into the regions. In the same direction, Congress also reassigned $208 million allocated to public debt service to other expenditures, thereby increasing the budget deficit. These two actions meant that the overall projected budget deficit for 2006 will increase from $430 million to $777 million, equivalent to 2.3 percent of GDP.
32
Table 3.5: Total transfers and subsidies from Central Government budget (US$ mn)
2003 2004 2005 2006 Total Transfers and Subsidies from CG 2,596.9 3,331.2 4,362.1 4,840.4 Earmarking created by law 1,419.6 1,491.7 1,635.5 2,133.4 Taxes 632.4 639.3 806.5 996.7 Universities 246.0 259.3 276.3 326.0 FODESEC 71.9 84.1 92.8 117.7 Municipalities and Provincial Councils 10.7 11.8 12.7 18.2 SRI and CAE 54.5 57.1 58.0 71.2 Cultural Salvage Fund 29.8 34.9 38.8 51.3 Municipal Potable Water Enterprises 61.4 71.3 79.5 97.5 Hydraulic Resources Board 13.9 14.4 12.9 18.2 Others 144.1 106.4 235.5 296.6 Oil 120.0 202.0 171.3 275.8 15% for Municipalities and Provincial Councils 667.2 650.4 657.7 860.9 Subsidies 948.0 1,218.5 1,837.0 1,928.6 Pensions 231.3 325.2 432.3 448.9 Social Security-IESS 166.8 230.5 332.1 343.0 Police Forces Social Security-ISSPOL 36.0 32.3 32.3 31.6 Armed Forces Social Security-ISSFA 28.6 62.4 67.8 74.4 Domestic Oil prices 487.8 666.5 1,121.7 1,183.8 GPL 208.6 290.6 326.0 337.1 Diesel for Electrical Enterprises 54.2 63.0 Diesel rest of the economy 279.2 375.9 741.5 783.7 Electrical Sector 15.0 80.0 80.0 Human Development Bond 197.0 200.0 192.0 192.0 Public Banks(BNF) 31.9 11.8 11.0 23.9 Other Transfers 229.4 620.8 889.6 778.4 Oil stabilization Fund 28.2 17.8 FEIREP transfer 359.1 604.0 Social Welfare 52.6 51.4 51.1 35.0 Defense Board 8.2 30.0 6.2 7.1 Universities 16.1 15.7 16.8 16.5 FODESEC-Parochial Boards 12.9 12.9 13.1 13.4 Other 139.7 123.5 180.5 189.7 CEREPS 526.7 Subsidies and Transfers/Total CG Revenues less public financing (%)
54.5 61.0 69.8 77.5
Source: Ministry of Economy and Finance. Pro-forma 2006.
Recent changes to fiscal policy
3.20 In 2005, Congress implemented several reforms which weakened and undermined the existing fiscal framework. These reforms are:
1. Amendment of the Fiscal Responsibility and Transparency Law (FRTL I) to (i) eliminate the oil stabilization fund (FEIREP), replacing it with an account under the control of the MEF (CEREPS); and (ii) remove capital expenditures from the ceiling of primary expenditure real growth;
2. Introduction of new legislation that grants generous tax incentives for investments in certain sectors; 3. Approval of a bill authorizing the return of the Social Security reserve funds to individual beneficiaries.
33
3.21 As we discuss in more detail below, these changes undermined the fiscal management framework in a number of ways. They lift limitations on expenditure growth, modify the allocation of oil revenues in a manner that discourage public savings and aggravate existing short-term liquidity management problems, with the end result of an economy that is more vulnerable to adverse international conditions and/or a natural disaster.
Changes to the Fiscal Responsibility and Transparency Law
3.22 In an attempt to strengthen fiscal management under dollarization, Congress approved the Fiscal Responsibility, Stabilization, and Transparency Organic Law (FRTL I) in 2002. Among the features introduced by the law, two were of paramount importance for prudent fiscal management. First the law established fiscal rules to limit the expansion of real primary expenditures and of public debt, and to reduce the non-oil fiscal deficit. Second the law contemplated the creation of a new Petroleum Stabilization Fund (FEIREP), which would promote public savings, help reduce public debt to sustainable levels, and act as a stabilization tool to protect the economy against shocks. As discussed in the previous section, the enactment of the FRTL I was followed by significant improvements in fiscal management.
Box 3.1: Actual Allocation of FEIREP Revenues
The FRL1 and its regulations established that 70 percent of the FEIREP revenues had to be used to repurchase public debt--either public external debt denominated in bonds, or public domestic debt denominated in bonds and treasury bills --at market prices. In the case of Ecuador, revenues accumulated in the FEIREP to buy back debt were used to pay domestic debt at due date, and to roll over the existing debt. No operations to buy back public external debt were executed. Even though $538 million were used to pay domestic debt (not to repurchase), the stock of domestic debt in the same period increased in $791 million, instead of decreasing as was the intention of the law. Furthermore, the stock of Treasury Bills-CETES, short term papers, rose to $488 million; medium-term bonds to $245 million, and $58 million in additional bonds to consolidate the government debt with the Social Security Institute. Regarding the external debt denominated in Global Bonds, nothing was repurchased. In essence, the 70 percent of accumulated revenues to buy back debt was used to finance the liquidity needs of the central government to pay back domestic debt.
Regarding the 20 percent of total revenues designated as a buffer for eventual shocks and to finance the repairs of damages caused by catastrophes and emergencies, the government also did not act according to the law. In 2004 and 2005, the price of oil was higher than the reference price used to calculate the oil export revenues for the budget. According to the law, there was no situation in which the government could legally use the funds for stabilization purposes nor for national emergencies (except for the emergency declared in two Amazon Provinces in 2005). Therefore, the 20 percent, as was the case for the 70 percent, was used to finance liquidity needs and pet projects. A total of $110 million were used, primarily, to finance health programs.
According to the FRL1, the remaining 10 percent of total revenues had to be allocated through the Ministries of Health and Education to finance different programs at the sole discretion of the President. A total of $40 million were used for these purposes. These expenditures were subject to the limitation of 3.5 percent real increase in primary expenditures. Therefore, FEIREP resources were not used as was established by FRL1, but rather to finance the liquidity needs of the government.
Source: Gallardo (2006).
3.23 During 19 months of its existence, FEIREP accumulated a total of US$1.1 billion in revenues, of which US$688 million were allocated according to the parameters established by the law and the remaining US$382.2 were accumulated under in the fund (Table 3.6). It must be mentioned, however, that the use of FEIREP funds, particularly those earmarked for debt repurchases, did not strictly follow the spirit of the law. Rather than using these funds to reduce the stock of existing debt, the GoE combined buy backs with purchases of new debt so as to be able to inject these moneys into the budget. As a result the FEIREP became the piggy bank to finance the liquidity needs of the central government (Box 3.1).
Percentage Revenues Allocations Difference Debt Buy Backs 70.0 percent 749.3 538.2 211.1 Stabilization and Emergencies 20.0 percent 214.1 109.8 104.3 Human Development 10.0 percent 107.0 40.2 66.8 100.0 percent 1,070.4 688.2 382.2 Source: Banco Central del Ecuador.
3.24 On July 14, 2005, less than two years after the FRTL I came into effect, Congress approved a reform that changed many of the objectives established in the original law. The amendments included the elimination of the oil stabilization fund (FEIREP), replacing it with an account under the control of the MEF (CEREPS), and the exception of capital expenditures from the ceiling of primary expenditure real growth.
Table 3.7: Comparison between the ex-FEIREP and the CEREPS
FEIREP: Allocation of Revenues CEREPS: Allocation of Revenues 70 percent to public debt buy backs, and to repay the government debt with the Ecuadorian Social Security Institute (IESS). To repay the debt of the Social Security, up to 15 percent of the resources accumulated in this tranche could be used for this purpose. The ratio of external and domestic debt, plus the government debt with the Social Security Institute were to reach a ceiling of 40 percent of GDP by January 15, 2007.
35 percent for economic reactivation and debt buyback: • Lines of credit with subsidized interest rates to finance
micro credit and small enterprises through CFN and BNF. • Servicing the government debt with the Social Security
Institute (IESS). • Up to 10 percent of the funds accumulated in this tranche
to be used for infrastructure to increase productivity. • Buying back public debt provided favorable market
conditions. Public debt to GDP ceiling of 40 percent remained in place as well as the time table to reach that goal. No specific percentage has been established for debt buy backs.
20 percent for stabilization, catastrophes and emergencies. The revenues accumulated to reach a ceiling of 2.5 percent of GDP, and to be maintained at this ratio thereafter. • Funds can be allocated for stabilization purposes
only if the international price of oil falls below the price used to estimate the budget export oil revenues.
• To avoid the depletion of the account, the funds accumulated cannot be used to finance damages caused by catastrophes or national emergencies in that fiscal year.
20 percent for stabilization, catastrophes and emergencies. The revenues accumulated to reach a ceiling of 2.5 percent of GDP, and to be maintained at this ratio thereafter. A Trust Fund must be created to administer the resources. • Funds can be allocated for stabilization purposes when oil
revenues fall below the revenues estimated for the Central Government Budget. (This is a subtle but important difference between the two laws.)
• To avoid the depletion of the account, the funds accumulated cannot be used to finance catastrophes and national emergencies in that fiscal year.
15 percent for Education and Culture (Ministry of Education and Culture). 15 percent for Health and Environment (Ministries of Public Health and Urban Development and Housing). 5 percent for Research and Development (INIAP, SENACYT, Ecuadorian Commission of Atomic Energy, and State Universities). 5 percent for repair and maintenance of highways (Ministry of Highways and Communications).
10 percent for Education and Health. The amounts allocated for these purposes are considered as primary expenditures and therefore are part of the macro fiscal rule that limit the increase of primary expenditures to a maximum of 3.5 percent in real terms.
5 percent to repair environmental damages caused by oil and mining state companies (Ministry of Environment).
35
3.25 The new FRTL II substitutes the FEIREP, a trust fund administered by the Central Bank, with the CEREPS, a government account administered by MEF, although separate from the Cuenta Unica. Oversight of the CEREPS will be the responsibility of a Board of Directors composed of the Vice-President of Ecuador; the Finance Minister; and the President of the Central Bank, making the administration and allocation of funds under the new law significantly more cumbersome. Up to 80 percent of CEREPS revenues are earmarked for various purposes and allocated through the budget, compared to 10 percent under FEIREP. The remaining 20 percent will feed a Savings and Contingency Fund, to be used for stabilization purposes and to finance catastrophes and national emergencies, in a similar fashion to what was stated under the FRTF I (Table 3.7). Finally the changes in the FRTL could have a particularly important effect on debt management, since the new allocation rules for CEREPS do not assign a fixed (or even a minimum) amount of resources to be devoted to debt repurchases. In 2006 CEREPS will accumulate US$567 million. Under the previous law, US$369 million out of this total would have been used for debt buy. In contrast under the amended law a maximum of US$184 million could be allocated to this purpose; and this only at the discretion of the MEF (Table 3.8).
Table 3.8: CEREPS’ Distribution of Revenues, 2006
Percentage Amount (US$ mn)
IMF Projections (US$ mn)
CEREPS Net 100.0 526.7 756.0 Lines of Credit 35.0 184.3 275.1 Stabilization of Oil Revenues 20.0 105.3 151.2 Human Development Projects 30.0 158.0 226.8 Education 15.0 79.0 113.4 Health 15.0 79.0 113.4 Highways Maintenance 5.0 26.3 37.8 Environmental Repair 5.0 26.3 37.8 Research & Development 5.0 26.3 37.8 Source: Ministry of Economic and Finance. Central Government Pro-forma 2006.
3.26 The FRTL II also modifies the fiscal rules governing expenditure growth to exempt capital expenditures from the 3.5 percent growth cap. Under the new law real capital expenditures are allowed to grow up to 5 percent per year. Increases beyond this limit can only be used for infrastructure and financial investments, which are considered to increase the government’s net worth. In practice the lack of a clear (and somewhat restricted) definition for infrastructure and financial investments means that there is significant room for discretionary increases in expenditures under this new framework. A particularly worrisome development at a moment when oil revenues are high and election-related pressure to spend is mounting up.
Introduction of tax incentives for investment activities
3.27 In November 2005, Congress approved a new tax incentive law that significantly undermines the product of efforts over the last 16 years to improve the efficiency and efficacy of the tax system. The law grants tax incentives to new investments, as well as to ongoing projects in selected “strategic” sectors, echoing the type of policies used when import substitution was believed to be an effective development strategy (Box 3.2).
3.28 The law will undoubtedly erode the tax base and reduce non-oil revenues, compounding the problem of high oil-revenue dependency within the budget discussed above. Moreover the law generates incentives for resource relocation across sectors that are unrelated to the productivity and growth potential of these sectors, and, in the worst case, scenario opens a window for tax fraud and evasion in the form of fictitious sector entry and exit associated with the definition of “new” investments.
36
Box 3.2: Tax Incentives Law
The Internal Tax Law was approved by Congress in December 1989, and was part of a comprehensive tax reform. The law eliminated all the special regimes that granted tax benefits to different activities. Those special regimes were part of the former development strategy known as import substitution. This framework, instead of promoting competition, actually fosters a rent seeking behavior detrimental to economic efficiency. In November 2005, Congress approved a law which gives hefty tax incentives to a variety of investments. Moreover, the law in its Article 12 gives a blanket authorization to the President, to grant at his sole discretion, tax incentives in less developed areas of the country with special emphasis in the Galápagos and the border provinces.
Activities that will benefit from tax exemptions are: • Hydroelectric generation projects; • Oil Refineries and production of petrochemical products; • Assembly of electronic products, such as microchips, optic fibers, laptops, development of software and
hardware; • Construction of regional and international airports; • Construction of ports in deep waters and areas to transfer international containers; • Assembly of equipment and machinery for agro-business; • Electricity generation projects that use renewable raw materials such as sugar cane; • Production of ethanol from renewable raw materials;
The law grants income tax exemption for 10 years for new investments and projects that are presently under
construction in the provinces of Guayas and Pichincha; and 12 years for investments in other provinces. A hundred percent exemption of import duties for the importation of machinery, equipment, new spare parts, and raw materials are also part of the law. Municipalities can exempt new investments, up to a maximum of 95 percent of county taxes, and grant total exemption of taxes and contributions levied on the creation of new companies. The approval of this law will erode the tax base in a moment which the country needs to increase the non-oil revenues. The law also opens a window of opportunities to powerful groups of interest to lobby to incorporate more activities within the scope of the law. Ecuador with this type of actions it’s going back to the 1950s without due regard of the impact that such decisions may have on the stability of the fiscal accounts and at last in the economy as a whole. Source: Ley de Beneficios Tributarios para Nuevas Inversiones Productivas, Generación de Empleo y Prestación de Servicios. November 18, 2005.
Devolution of Social Security reserve funds to beneficiaries
3.29 In 2005 Congress authorized the devolution of Social Security reserve funds to individual beneficiaries, at the same time that it stipulated a timetable for this devolution. At the time the law was enacted the Instituto Ecuatoriano de Seguridad Social (IESS) had US$735 million accumulated in reserve funds. Most of these funds were invested in public and private assets, and a small amount was deposited in a special account at the Central Bank of Ecuador (Table 3.9). In accordance with the approved scheduled IESS disbursed a total of US$365 million in 2005 and is expected to disburse an additional US$370 million in 2006.
3.30 In order to generate the liquidity necessary to proceed with the devolution, IESS has had to sell a significant amount of assets, including government bonds. This has not only affected the government’s financing strategy for 2005 and 2006, but will most likely have a long-term impact since these reserve funds constituted one of the main sources of financing for the NFPS and the CG. A source that will now have to be substituted with other types of domestic (and maybe, foreign) debt.
37
Table 3.9: Reserve Funds Investments by the Social Security Institute (IESS)
Investments Million US $ Participation Term Public Sector 385.0 52.4 1-4 years Private Financial Sector 77.0 10.5 134 days Private Non Financial Sector 8.0 1.1 470 days Central Bank of Ecuador 265.0 36.0 Liquidity Total 735.0 100.0 Source: Banco Central del Ecuador
B. Debt performance and sustainability
3.31 At the time of dollarization the Ecuadorian exchange rate was intentionally over-devalued, following an already sharp decline in the value of the sucre against the dollar. Because a large percentage of the country’s public debt was denominated in dollars and other foreign currencies, this translated into a significant increase in the debt-to-GDP ratio to 90 percent, from 65 percent in 1998. In the following years the combination of real exchange rate appreciation, positive economic growth and primary surpluses, helped bring this ratio down to 46 percent of GDP by 2004, and 43 percent in 2005. The contribution of real exchange adjustments was relatively more important in 2001 and, to a lesser extent, 2002, as inflation converged with international rates, while economic growth and primary surpluses played a more important role in recent years. Finally growth in real interest rates contributed to increase the debt-to-GDP ratio as it translated into more expensive debt and higher service payments (Figure 3.2).
Figure 3.2: Debt determinants
Ecuador: Debt Determinants
-30
-25
-20
-15
-10
-5
0
5
10
2001 2002 2003 2004 2005
P rimary Deficit (- s urplus ) Contribution from real GDP growth
Contribution from real interes t rate Contribution from real exchange rate change
R es idual Change in public s ector debt
Note: Each column represents the contribution of each factor on debt decomposition year on year change in the debt/GDP ratio. Items above the zero line contribute to an increase in the debt/GDP ratio, while items below the line contribute to a reduction in the debt/GDP ratio. Source: Authors’ calculations using data from BCE.
3.32 This positive panorama contrasts with the observation that Ecuador’s debt stock increased during that same period, particularly domestic debt as a consequence of the government’s growing financing needs and recurrent liquidity problems. An opportunity was been missed in this respect, since under the FRTL I, 70
38
percent of FEIREPS funds were allocated to debt repurchases, as discussed below. In reality these funds were used to roll-over existing debt rather than to reduce the debt stock. Debt management has not become any easier under the new fiscal framework resulting from the amendment of the RFTL, since there is no fixed or minimum allocation of resources for this purpose under CEREPS.
3.33 Going forward, the GoE should continue to work towards reducing both the debt-to-GDP ratio and the debt stock further. This will entail a combination of stable and robust growth, a strong fiscal stance, and some medium-term planning regarding debt management, particularly in what regards debt amortization and repurchases. The current administration has already taken some steps in this direction, and is working towards lengthening the maturity profile and reducing the costs of out-standing debt, which has resulted in a significant decline in Ecuador’s risk premium in international markets. These initiatives need to be given continuity, independently of political developments, for the strategy to pay off in the medium-term.
3.34 We present below a series of simulation exercises that aim at providing the GoE with benchmarks for debt management during 2006-2010 under various scenarios: a baseline scenario and a scenario with lower oil prices. Variations on the baseline scenario are also discussed as part of the sensitivity analysis.
Debt sustainability scenarios: A simulation exercise
3.35 The baseline scenario assumes that key economic indicators behave according to historical trends; namely, for the purpose of the exercise GDP growth, the primary balance and the real interest rate are set to their average value during 2000-2005—4.1 percent, 5.1 percent of GDP, and 3.5 respectively. Under these assumptions the debt-GDP ratio will go down from 41.9 percent in 2006 to 33.8 percent in 2010 (Table 3.10).17
3.36 The second scenario under consideration assumes that oil prices will decline below what is currently expected to US$35/barrel in 2006, US$25/barrel in 2007, and US$19/barrel from 2008 to 2010 (compared to US$35/per barrel in the baseline scenario). The primary balance will deteriorate as a result of falling oil revenues, but we assume that GDP and real interest rates remain the same as in the baseline case. Under this scenario, debt declines by 3.5 percentage points, to 38.4 percent of GDP in 2010, compared to 7 percentage points in the baseline scenario. Although it is unlikely that oil prices will undergo such a dramatic fall in the near future, the exercise undermines the importance of maintaining a primary balance of around 5.0 percent of GDP to achieve significant and sustainable reductions in the stock of public debt (Table 3.10).
3.37 Finally several changes in the baseline variables are considered and sensitivity analysis exercises are conducted. The first exercise assumes temporary two-year shocks to each of the structural variables in 2006-2007. The shocks equal two standard deviations (i.e the shock equal a reduction of 1.5 and 1.7 percentage points for GDP growth and the primary balance respectively, and an increase of 0.6 percentage points for the real interest rate). The second exercise assumes that shocks to key variables are permanent. The shocks are equal to a permanent 1-percentage point reduction for GDP growth and the primary balance, and a permanent 1-percentage point increase for the real interest rate.
3.38 The main results from both exercises can be summarized as follows (Table 3.10):
17. The IMF presents some debt sustainability scenarios as part of the Article IV Consultations report. The results are
similar, but not identical to those presented here. In particular two scenarios are considered: a baseline scenario and an active scenario were certain structural reforms are implemented resulting in higher economic growth and primary balances. Under the baseline scenario the debt-to-GDP ratio declines from 40.0 in 2006 to 32.8 percent in 2010, while under the active scenario it falls from 39.6 to 19.6 during the same period. The main differences regarding the assumptions underlying the IMF projections and those presented here can be summarized as follows: (i) the 2005 debt-to-ratio used by the IMF is 1.6 percentage points lower than they one used for this report, which corresponds to the figure reported by the BCE; (ii) projected GDP growth rates and primary balances are lower in the case of the IMF.
39
• The debt-to-GDP ratio is more responsive to changes in GDP growth and the primary balance than to changes in the real interest rate;
• Changes in the primary balance significantly increase the debt/GDP ratio compared to the baseline case—i.e. 5.7 and 4.9 percentage points increases under scenarios 3 and 7, respectively—underscoring the idea that fiscal discipline plays a key role in the reduction of the public debt;
• Temporary shocks (to GDP and the primary balance) have a higher impact on the debt-to-GDP ratio than a sustained deterioration in those variables, at least up to 2010. This implies that growth volatility or unstable fiscal policy have the potential to induce a more serious deterioration in the debt-to-GDP ratio than a more moderate, but permanent slide in these same variables.
• The combination of several permanent shocks has the most negative effect on the debt-to-GDP ratio. Table 3.10: Debt sustainability simulations
2001 2002 2003 2004 2005 Actual debt-to-GDP ratio 70.2 58.2 52.6 46.5 44.1 2006 2007 2008 2009 2010 Baseline scenario 41.9 39.8 37.8 35.8 33.8 Decline in oil prices Projected Average Oil Export Prices (US$ per barrel) 35.0 25.0 19.0 19.0 19.0 1. Real GDP growth and real interest rate are at historical averages in 2006-2010, but the primary balance is affected by the decrease in oil prices.
43.7 43.3 42.2 40.3 38.4
Sensitivity analysis Temporary shocks in 2006 and 2007 1. Real interest rate is at historical average plus two standard deviations in 2006 and 2007.
42.3 40.8 38.7 36.7 34.7
2. Real GDP growth is at historical average minus two standard deviations in 2006 and 2007.
43.3 42.7 40.6 38.6 36.6
3. Primary balance is at historical average minus two standard deviations in 2006 and 2007.
44.8 45.6 43.6 41.5 39.5
4. Combination of 2-4 using one standard deviation shocks. 44.3 44.6 42.6 40.5 38.5 Permanent shocks: Sustained shifts in key variables 5. Real interest rate is 1 percentage point higher than in baseline after 2005.
42.3 40.6 39.0 37.3 35.6
6. GDP growth is 1 percentage point lower than in baseline after 2005.
42.3 40.6 39.0 37.4 35.7
7. Primary balance is 1 percentage point lower than in the baseline. 42.9 41.8 40.8 39.7 38.7 8. Combination of 1-3 43.7 43.5 43.2 43.0 42.8 Source: Authors’ calculations using data from the BCE.
C. Conclusions and policy recommendations for fiscal stability and debt sustainability
3.39 We have argued in this chapter that, despite recent improvements in Ecuador’s fiscal stance and debt-to-GDP ratios, several structural deficiencies remain regarding the country’s fiscal management framework. These include high dependency of the NFPS and CG budgets on oil revenues, rapid growth of recurrent expenditures, and significant budget rigidities associated with extensive earmarking (especially in the form of subsidies). Moreover recent legislative changes have substantially undermined the integrity of the fiscal management system created under the FRTL I in 2003. The combination of a weaken fiscal
40
management framework and mounting spending pressures associated with the upcoming elections poses important risks in terms of fiscal solvency whose impact could extent well beyond this fiscal year.
3.40 Although recent actions by MEF to continue to reduce the debt-to-GDP ratio taking advantage of favorable conditions in international financial markets are a step in the right direction, further efforts are needed to strengthen the country’s fiscal stance and to ensure that fiscal policy remains on solid and stable grounds going forward. Some of these efforts will have to be directed at reversing or minimizing the impact of recent legislative changes, as discussed above. This will be a difficult task, but one that cannot be postponed. The economic authorities need to work with Congress and the economic teams of potential presidential candidates to garner political and public support for these reforms. Some of the reforms proposed below were already outlined in the Ecuador Public Expenditure Review (World Bank, 2003b), while others pertain to or are motivated by recent developments.
3.41 In order to decrease the budget’s dependency on oil revenues and improve expenditure management, the GoE could:
• Reclassify oil revenues as capital revenues for the purpose of the budget, hence minimizing the impact of earmarking on the allocation of these funds;
• Impose a cap on all capital expenditures, with no exception for infrastructure spending, at the same time that clear rules are established, and establish clear rules and objective criteria for project selection both for regular budgetary resources and for CEREPS resources;
• Implement a comprehensive tax reform to simplify the existing tax regime and minimize tax exceptions with the objective expanding the tax base;
• Eliminate or, at least, target, fuel and other subsidies (see Chapter 6 for a more detailed discussion on this issue) to allow for the financing of priority programs without increasing the budget envelope. A proposal to set domestic oil prices based on the opportunity cost of raw materials and the creation of a special consumption tax on fuels that would be paid for and collected at the refineries, could also constitute a step in the right direction;
• Unify the various public personnel laws under a single, transparent regime in order to halt wage bill growth. Also, to limit nominal wages growth, and as part of the fiscal rules, a cap on wage growth should be established in relation to GDP (a value in the neighborhood of 7.0 percent of GDP would seem adequate);
• Design and implement a strong regulatory and institutional framework that clearly assigns expenditure responsibilities to subnational governments in line their administrative capacity, and conditions resources transfers on timely and reliable reporting;
• Overhaul budgetary monitoring and management systems to promote proper registration and timely reporting on budget execution, making information access transparent. In this sense recent steps by MEF to strengthen the SIGEF using the Guatemalan experience are more than welcome.
3.42 In order to promote fiscal stability and debt sustainability, the GoE could:
• Decrease dependency on oil revenues and implement measures to revert inertial expenditure growth (see recommendations above);
• Strengthen the role of the Savings and Contingencies Fund by setting clear and transparent rules for its use and accelerating the accumulation of funds to take advantage of current positive conditions. A possible way to do this would be to channel a higher percentage of CEREPS funds to the fund until a certain limit is reached. In turn this limit should be higher than the actual 2.5 percent of GDP, since historically economic crisis have been associated with declines in NFPS revenue falls of up to 7 percent of GDP;
• Establish a minimum percentage of CEREP funds to be allocated to debt reduction, together with clear and realistic debt goal, in order to minimize discretion in debt management in the future.
41
IV. FINANCIAL MANAGEMENT AND THE BANKING SECTOR
4.1 A stable financial system and a well-functioning banking system constitute two of the fundamental pillar for stable and sustainable economic growth. (Recurrent) Financial crises, such as the one experienced in Ecuador during 1998-1999, are one of the main factors behind the country’s poor growth performance, as evidenced by the discussion presented in Chapter 1. Furthermore limited access to and the high cost of credit appear to be important constraints to productivity growth and ultimately employment creation and business expansion among Ecuadorian firms, according to the information presented in Chapter 2. The need for healthy financial and banking systems is only exacerbated under a dollarized system, where there is no lender of last resort and, as a result, adequate liquidity management becomes paramount.
4.2 Following the 1998-1999 crisis, Ecuador’s financial and banking sectors has recovered significantly, with key indicators exhibiting steady progress over the last few years. Structural problems remain, however; particularly in relation to liquidity management. These problems could be seriously aggravated if some of the reform options for the banking sector currently under discussion gain Congress approval. This chapter builds upon and complements the recent Financial Sector Assessment Program prepared by the Word Bank (World Bank, 2005b). The chapter documents the evolution of the banking system since dollarization, paying special attention to the sector’s institutional structure and to the potential impact of the proposed reforms. The main findings of the chapter can be summarized as follows:
• Ecuador’s commercial banking system has recovered significant since the 1998-1999 crisis, as evidenced
by the steady increase and growing diversification in the sector’s assets and the subsequent decline in portfolio-related risks. These developments have been accompanied by an expansion in credit (i.e. increased access) and a reduction in the costs of loans, as well as by rising profitability levels in the sector.
• Some challenges remain, however, regarding liquidity management and capitalization levels that increase the system’s vulnerability and could potential amplify the risk that a banking shock translates into an economy-wide financial shock. Unfortunately the proposal currently under discussion in Congress to regulate credit allocation and pricing does not constitute a step in the right direction.
• A comparison between Ecuador’s banking system and that of Panama, considered to be a more “mature” system operating under dollarization, suggests that higher levels of integration between the domestic and international banking system may actually provide a buffer cushion against systemic liquidity shocks.
• As a result, strengthening the existing institutional structure for liquidity management, particularly the Liquidity Fund, and improving the sector’s legal and institutional framework so as to promote higher integration with international market may contribute to reducing the system’s vulnerabilities.
4.3 The rest of the chapter is structured as follows. The first section examines the performance of the banking system since the dollarization, paying special attention to the evolution of the sector’s assets, liabilities and profit levels. The second section discusses some aspects of the sector’s institutional structure, with special focus on the role of the liquidity fund. The third section discusses the potential impact of the proposed legislative changes. The fourth concludes and presents some policy recommendations.
A. Recent performance of the banking sector
4.4 Ecuador’s commercial banking system has recovered significant since the 1998-1999 crisis, as evidenced by the steady increase and growing diversification in the sector’s assets and the subsequent decline in portfolio-related risks. These developments have been accompanied by an expansion in credit (i.e. increased access) and a reduction in the costs of this credit, as well as by rising profitability levels in the sector. In this section we present a brief overview of these trends.
42
Assets and liabilities
4.5 Both banking assets and liabilities doubled during 2000-2005 signaling a dynamic recovery in the sector’s business volume as well as on the public’s confidence in the sector. Total assets grew from US$4,493 to US$9,853 million, or from 28.2 to 30.2 percent of GDP, during this period, while liabilities grew from US$4,033 to US$9,853, or from 17.6 to 30.2 percent of GDP. Asset growth was driven by an increase in loans and liability growth reflected an increase in deposits, which were back to pre-crisis levels by 2005 (Table 4.1).
Table 4.1: Main Items of the Banking System (US$ mn)
2000 2001 2002 2003 2004 2005 Total Assets 4,493 4,928 5,789 6,666 8,142 9,853 Cash + Investment 1,528 1,809 2,034 2,599 3,103 3,648 Deposits Abroad 374 1,225 1,401 Loans Net 1,859 2,234 2,712 3,003 3,934 5,053 Total Liabilities 4,033 4,428 5,235 5,990 7,334 9,853 Total Deposits 2,808 3,474 4,310 5,111 6,377 7,750 Total Net Worth 460 499 554 677 784 785 Results -124 -26 5 92 120 162 GDP 15,934 21,024 24,311 27,201 30,282 32,667 Source: Superintendencia de Bancos y Seguros. Boletines Financieros (www.superban.gov.ec). The 2000 results include Banco del Pacífico losses of US$50.4 million, and Filanbanco losses of US $ 100.5 million. The 2001 results do not include Filanbanco’s losses of US$347.9 million, but includes Banco del Pacifico losses of US $ 85.4 million.
4.6 Growth in the loan portfolio has been accompanied by increased diversification as the share of housing loans and micro credit have grown over time at the expense of commercial credit, which has fallen from 61.7 to 54.3 percent of total loans between 2002 and 2005 (Table 4.2). There is however significant variation in degrees of diversification and/or specialization by bank size. Large and medium banks have more than 57.0 percent of their loan portfolio in commercial loans, while small banks have specialized in consumer lending and micro credit loans, both accounting for more than 50.0 percent of their total loan portfolio.
Table 4.2: Banking System Loans to Aggregate Sectors (%)
Micro-credit 1.8 3.0 4.0 6.5 Total 100.0 100.0 100.0 100.0
Source: Superintendencia de Bancos y Seguros
4.7 All in all a growing and more diverse portfolio is an indication of increased access to credit; a welcome development given that most firms interviewed as part of the Ecuador Investment Climate Survey (World Bank) identified limited access to credit as one of the main constraints for employment creation and, more broadly, business expansion.
43
Cost of credit
4.8 Despite steady declines, the cost of credit remains high, particularly taking into account Ecuador’s low inflation levels. The average cost of credit decreased from 17.1 to 14.3 percent between 2003 and 2005. This change is the end result of two opposing forces: declining interest rates and growing banking commission charges (Table 4.3).
Table 4.3: Interest and Commission over Average Loan Portfolio1 (%)
2003 2004 2005 Interest Income/Average Loan Portfolio 1 15.6 13.7 11.7 Commission Income/Average Loan Portfolio 1.5 2.0 2.6 Total 17.1 15.7 14.3 Note: 1 Average Loan Portfolio is equal to beginning of the year plus end of the year Net Loan Portfolio divided by two. Source: Superintendencia de Bancos y Seguros (www.superban.gov.ec). Portfolio quality and risk ratings
4.9 The quality of the loan portfolio has improved significantly as the share of substandard and non-performing loans declined and provisioning ratios increased. Substandard loans declined from 15.3 to 4.7 percent of the total loan portfolio between 2001 and 2005. Improvements were more pronounced in the case of commercial and housing loans, whereas the fraction of substandard loans has remained somewhat higher among consumer loans and micro credits (Table 4.4). Similarly the ratio of non-performing to total loans decreased from 6.4 to 4.9 percent between 2004 and 2005 alone, while provisioning ratios increased from 76 to 84 percent. Improvements were noticeable for all loan categories, except micro credit, and across banks of all sizes (Table 4.5).
Table 4.4: Substandard Loan Portfolio and Contingencies/Total Loan Portfolio (%)
4.10 These developments have resulted in a reduction of the banking system risk ratio and an improvement in the credit ratings of Ecuadorian banks. The risk ratio decreased from 10.2 to 3.8 percent during 2001-2005 (Table 4.4), while credit ratings improved or remained stable for both existing and newly-created banks. In fact only 1 out of 8 medium banks and 3 out of 11 small banks were downgraded most banks during this period. These changes indicate that conditions in the system are significantly better than those prevalent at the time of the 1998-1999 crisis.
Profitability
4.11 In a context of increasing business volume and higher quality portfolios, gross income and profitability levels have shown significant improvements. Gross profits increased from a negative US$554 million in 2000, immediate following the crisis, to a robust US$223 million in 2005, hand in hand with improvements in the RoE and RoA ratios. However a large part of the increase in profit levels can be traced back to improvements in extraordinary income, rather than to growth in net operating revenues. Extraordinary income resulting from the sale of foreclosed assets and reverse provisions amounted to a minimum of US$87 million and a maximum of US$207 million a year during 2001-2005. This reliance on extraordinary items to support profit levels is not sustainable in the medium-term.
4.12 Interestingly the public’s perceptions regarding profitability levels are slightly different from what we have just discussed. In fact the notion that profit levels are directly associated with high credit costs (particularly in the form of banking commissions) is widespread. In reality, although the cost of credit is indeed high, approximately 50 percent of banking profits in 2005 were accounted for by extraordinary income.
4.13 This belief, however, has proven particularly powerful in providing popular support for a legislative proposal to regulate banking costs currently under discussion in Congress. This proposal, which contemplates mandatory restrictions in the allocation and the cost of credit, could have an adverse impact on the banking sector and significantly undermine its stability. We briefly discuss this issue in Annex 4.
B. The banking sector in a dollarized context: A simple comparison exercise
4.14 The need for healthy financial and banking systems is only exacerbated under a dollarized system, where there is no lender of last resort and, as a result, adequate liquidity management becomes paramount. Although most banking sector indicators have exhibited positive improvements in recent years, some weaknesses remain. In this section we compare the Ecuadorian banking system to those of El Salvador and
45
Panama, which are also dollarized, in order to provide a benchmark with which to assess the potential risks associated with some of these weaknesses. Significant differences exist across the three countries in terms of the banking sector’s legal framework and structure, as well as its size and performance.
Legal framework and sectoral structure
4.15 The basic features of the banking legal framework differ somewhat across the three countries. The main differences can be summarized as follows (Table 4.6):
• Minimum capital requirements are a function of the license type, and are significantly higher in Panama and El Salvador tan in Ecuador.
• Minimum Capital to Risk-Weighted Asset ratios, established by the banking authority, are lowest in Panama (8 percent), followed by Ecuador (9 percent) and El Salvador (12 percent)
• All three countries have mandatory liquidity ratios, but only Ecuador and El Salvador have reserves mandatory requirements
• Similarly only Ecuador and El Salvador have deposit guarantee schemes
Table 4.6: Banking legal framework
Ecuador El Salvador Panama Number of banks as of December 2005
Domestic: 23 Foreign: 2
Domestic: 13 Foreign: 3
General: 37 International 27
International Reps: 6 Type of Licenses Domestic and Foreign Domestic and Foreign General and international Minimum Capital Requirements
US$2.6 mn, adjusted every year based on UVC
(Unidad de Valor Constante)
US$11.4 mn, adjusted every year based on CPI
General: US$10.0 mn International: US$3.0 mn
Capital to Weighted-Risk Assets
9.0% 12.0% 8.0%
Liquidity Ratios Established by Regulation
Established by Regulation
Established by Regulation
Reserve Requirements Yes, established by Regulation
Yes, established by Regulation
No
Deposit Guarantee Agencia de Garantía de Depósitos.
Deposits are guarantee up to a maximum of 4 times GDP per capita
(US$9,200). Banks contribute every year 0.65 per thousand of
total deposits.
Instituto de Garantía de Depósitos. Deposits are
guaranteed up to a maximum of US$6,700 CPI adjusted every year. Banks contribute with
0.10% of total deposits.
No
4.16 Panama adopted the dollar as its national currency more than 100 years ago, while Ecuador and El Salvador decided to dollarize their economies only recently. This implies that Panama’s banking system has enjoyed a longer maturity period under a dollarized regime than those of the other two countries. In fact the presence of international banks and/or their representatives is significantly higher in Panama than in Ecuador or El Salvador. Public banks, together with banks with general and international licenses, comprise the International Banking Center (IBC). The former account for 46 percent of the IBC’s total deposits and 48 percent of total assets, and foreign banks account for the remaining 54 of total deposits and 52 percent of total assets. In contrast, foreign banks in El Salvador hold 17.1 percent of total deposits and 16.8 percent of total assets, while in Ecuador these figures are 2.9 and 3.0 percent, respectively.
46
Business volume and sector performance
4.17 Beyond institutional and structural specificities, significant differences exist across the three countries in terms of the banking sector’s size and performance. Panama’s banking sector manages a much larger portfolio than those of Ecuador and El Salvador. Domestic deposits equal 101.4 percent of GDP and foreign deposits represent an additional 97.0 percent. Similarly domestic loans equal 98.0 percent of GDP and loans to foreigners represent an additional 73.6 percent. In contrast El Salvador’s total deposits and total loans equal 40.3 and 39.5 percent of GDP, respectively. And these figures are 23.7 and 15.5 for Ecuador (Table 4.7).
4.18 Liquidity ratios are high fairly similar across the three countries despite all other differences. The ratio of liquid assets plus investments to total deposits equals 47.1 percent, 47.4 percent, and 48.1 percent in Ecuador, El Salvador and Panama respectively. This has two important implications. First assessments by banks of the potential cost of a systemic liquidity shock are similar in the three countries. Second the lack of a lender of last resort forces banks to maintain large liquidity cushions, even in the presence of mandated insurance mechanisms, such as reserve requirements and deposit guarantees (Table 4.7).
Table 4.7: Banking indicators
Ecuador El Salvador Panama Deposits/GDP 23.7% 40.3% 198.3% Loans Net/GDP 15.5% 39.5% 98.0% (Only
Panamanian banks with
general license) Liquid Assets/Deposits 27.7% 17.1% 26.2% Investments/Deposits 19.4% 30.3% 21.9% Liquid Assets + Investments/Deposits 47.1% 47.4% 48.1% Liquid Assets + Investments/Assets 37.0% 30.4% 34.1% Loans Net/Assets 51.3% 62.9% 60.2% Net Worth/Assets 8.1% 8.1% 12.1% Average Prime Rate 8.4% 15.9% 8.2% Average Deposit Rate>90 days 4.4% 2.3% 4.4% Return on Equity 20.7% 10.3% 15.9% Return on Assets 1.6% 0.8% 1.9%
4.19 Finally interest rates in Panama and Ecuador seem to be converging towards international levels, while they remain high in El Salvador.
Potential vulnerabilities and the Capital to Risk-Weighted Assets (CAR) ratio
4.20 The need to put in place insurance mechanisms against shocks, such as a bank run or an external financial crisis, is partly a function of the perceived risks and the level of exposure of each country. We already discussed above that the lack of a lender of last resort poses an important risk in terms of potential liquidity shortages. A risk against which all three countries considered here seemed to have insured by keeping large amounts of liquids assets.
4.21 Another factor that may provide additional insurance if the level of integration between the domestic and the international banking system, in the sense that higher integration should allow banks operating in the
47
domestic market to smooth changes in liquidity demand more easily. If this is the case, we would expect to see a relationship between the level of integration, measured by the presence of international banks, and the CAR ratio (both the legally mandated level and the actual ratio).
4.22 While this is true for Panama, where the mandated CAR ratio equals that of the OECD and, to a lesser extent in El Salvador, with a mandated ratio of 12 percent, it does not appear to be the case in Ecuador. The mandated CAR ratio is 8 percent, and the actual ratio stands at 11.7 percent. Given Ecuador’s volatile economic and political environment, a higher ratio may be desirable. This conclusion is reinforced by the observation made in the recent FSAP (World Bank, 2005b) that capitalization levels in the banking system appear to be overstated and insufficient for a system operating under full dollarization.
C. Moving forward: The importance of liquidity management
4.23 The analysis presented in the previous two sections makes it clear that liquidity management and adequate capitalization are critical for the solvency of the banking sector in a dollarized economy. The recent FSAP provides an extensive discussion on the issue of liquidity management and proposes two alternatives to strengthen existing mechanisms in Ecuador: (i) the limitation of liquidity transformation operations, combined with an enhanced role of capital markets as a source of private sector financing; and (ii) the establishment of an effective liquidity fund. In this section we complement the discussion presented in the FSAP by examining two existing proposals for the reform of the Liquidity Fund and using stress test to evaluate their effectiveness in case of a liquidity shock.
4.24 Liquidity management in Ecuador relies on two institutions: (i) the Deposit Guarantee Agency (AGD) in charge of insuring the deposits in the banking system (see Box 4.1 for details), and (ii) the Liquidity Fund (LF). The LF was created in 2001 with contributions from the CG for a total of US$70 million, while banks were expected to contribute US$1 per thousand of deposits on an annual basis. At the end of 2005, the LF had accumulated US$147.5 million or 1.9 percent of total deposits in the banking system. This amount is equivalent to 3.3 percent of total deposits in the four largest banks; 5.0 percent of total deposits in medium banks deposits; and 57.4 percent of total deposits in small banks, suggesting that in the event of a liquidity shock the funds accumulated in the LF are insufficient to withstand a run on deposits.
48
Box 4.1: Deposit Guarantee Agency-AGD
On December 1, 1998 the Deposit Guarantee Agency (AGD) was created as an autonomous public institution with a legal mandate to grant a blanket guarantee to all the deposits held by the public in the banking system. This guarantee also extended to include 100 percent of the lines of credit granted by the international banking system for trade and working capital financing. The AGD was also authorized to capitalize banks that were handed over to it during the banking crisis. To finance its operations, financial institutions have to contribute 6.5 per thousand of its total deposits on an annual basis. Other income sources are deposits held idle in the banking system for more than ten years; credits authorized by the Board of Directors; donations; and asset liquidations. The day after the AGD began operating, Filanbanco, the number one bank in the system according to asset size, fell under the administration of the AGD.
The AGD was born without financial resources to comply with the law. During 1998-99, a systemic banking crisis of enormous proportions unfolded catching the new agency by surprise. The AGD had no money to payback deposits held by the public in the failed banks nor to honor the payments to the international banks. The Ministry of Finance had to issue government bonds on behalf of the new institution. At the same time, the AGD went to the Central Bank discount window to cash in the bonds, in order to have the liquidity to honor the deposit guarantee and the payments to the banks abroad.
Since January 1, 1999 to April 30, 2005 the AGD has received $195 million from the banking system, of which $166 million were used to pay the deposit guarantee and to cover the overhead costs. In 1999, The Ministry of Finance issued $1,340 million in government bonds of which 42 percent were used to finance the Filanbanco takeover, to pay the deposit guarantee, and to pay the Central Bank. In total, from January 1999 to 2005, the AGD has paid $1,210 million to depositors. Of the public funds channeled through the AGD, either to pay depositors or to capitalize failed banks, five banks (Filanbanco, Progreso, Popular, Prestamos and Azuay) out of 21 financial institutions under the AGD administration, received 86 percent of the total funds.
To honor its obligations with the foreign banks, the Government through the Minister of Economic and Finance, and as part of the comprehensive renegotiation of the Ecuadorian external debt in 2000, reached an agreement with the banks to restructure US$120.6 million.
As of September 30, 2005, $575 million in liabilities were pending to be paid. The total loan portfolio in the hands of the AGD amount to $1,245 million, of which $972 million is overdue and $237 million has been charged against the agency’s net worth.
At the verge of paying back the guaranteed deposits, the administration is proposing to the President to close the AGD and to structure a Trust Fund in charge of administering the remaining assets and liabilities. In January 28, 2002 the law that created the AGD was reformed to change the amounts and the beneficiaries of the guarantees. In this respect, lines of credit for trade and working capital financing were excluded. The threshold for the deposit guarantee was set at four times 2005 GDP per capita, or $ 9,300 per beneficiary. At the end of 2005, 37.5 percent of sight and term deposits1 were covered by the guarantee. The latter means that of a total of $7.1 billion potential guaranteed deposits, $2.7 billion were covered, constituting an AGD contingent liability with no resources to honor its obligations. Therefore, if the AGD is closed, the question arises as to which institution will cover the deposit guarantee? Answer: The Central Government.
Since its inception, the AGD never functioned as a deposit guarantee agency. Its main role has been to pay the deposits guaranteed of the failed banks, and to liquidate the closed banks that fell under its administration. The agency has been under fire on many occasions, it has been beset with cases of corruption, and its administration has lacked transparency and accountability, causes that has made the public suspicious of its activities. There is no easy fit to replace the agency and to altogether retire the deposit guarantee. Therefore, viable alternatives have to be explored to replace the AGD.
Note: 1 Sight deposits guaranteed are equal to item 2101 minus 210150. Term deposits guaranteed are equal to item 2103 minus item 210330. Source: Agencia Aseguradora de Depositos (www.agd.gov.ec).
4.25 As a result two proposals to reform this fund have been put forward in recent years by the Private Banking Association and Central Bank. The objective of the proposals is the same, to provide the banking system with an institutional framework to cope with systemic liquidity problems. However the financing and
49
operation of the proposals are totally different. There are pros and cons to both proposals that should be considered to reach an adequate decision (Table 4.8).
Table 4.8: Pros and Cons of the Liquidity Fund Proposals
Banking Association Central Bank Financing:
• The 4.0 percent reserve requirement will be transferred to the Liquidity Fund
• The resources of the actual Liquidity Fund. • A mandatory contribution of 9.0 percent of
total deposits held in each bank.
Financing: • A contingent line of credit with FLAR or other
international financial institutions in the amount of $400 million, or 5.2 percent of 2005 deposits.
• An increase in reserve requirement from 4.0 to 10.0 percent.
• No private contribution it’s contemplated on the project.
• The actual liquidity fund will be liquidated. Pros Pros
• Pooled banks liquidity to allocate it across banks
• No Moral Hazard • No Fiscal Cost • Assures confidentiality of liquidity
management
• Pooled banks liquidity to allocate it across banks
Cons Cons • Insufficient Liquidity to face a systemic
liquidity crisis. (See stress test) • High Private Cost • Transfer of the Payment System to the
Liquidity Fund
• Insufficient Liquidity to face a systemic liquidity crisis. (See stress test)
• Insufficient private sector funding stimulate moral hazard
• Do not assures confidentiality exposing banks to bad publicity
• Transfer of the payment system to the liquidity fund • Has Fiscal Costs
4.26 Both proposals envision a LF equivalent to approximately 15 percent of total deposits. In order to assess their feasibility, we perform systemic liquidity stress tests under different assumptions. In the 1998-99 banking crisis, depositors withdrew demand deposits above 6.5 percent of GDP and term deposits were reduced to half their pre-crisis level. Assuming that in a systemic banking crisis, depositors will withdraw sight deposits above 7 percent of GDP, and 50 percent of term deposits, three possible scenarios are constructed:
• The first scenario assumes that both government bonds and loans are completely illiquid; • The second scenario assumes 20 percent of government bonds and 10 percent of loans could be sold
quickly and without losses; • And the third scenario assumes 50 percent of government bonds and 20 percent of loans could be sold
quickly and without losses to repay depositors.
4.27 For 2005, under the first scenario, 36.6 percent of volatile liabilities (or 20 percent of deposits) cannot be covered with bank’s own liquidity. Under the second scenario, where investments in government bonds and loans to the private sector are somewhat liquid, 26.8 percent of volatile liabilities (14.7 percent of deposits) cannot be covered with bank’s own liquidity. Under the most optimistic scenario, whereby the bank can sell in the market with no losses, banks cannot cover only 9.2 percent of volatile liabilities—6.0 percent of total deposits (Table 4.9).
50
Table 4.9: Banking System Funding Volatility Ratio
US $ Millions 2004 2005 Volatile Liabilities 3,276 4,232 Sight Deposits in excess of 7 of GDP 2,318 3,047 50 percent of Time Deposits 958 1,185 Scenario I Liquid Assets 2,336 2,682 Available Funds + Investments in Private Securities 2,336 2,682 0% of Government Securities -0- -0- 0% of Loans to the private sector -0- -0- Non-Liquid Assets 5,806 7,171 Funding Volatility Ratio I 16.2% 21.6% Scenario II Liquid Assets 2,856 3,096 Available Funds + Investments in Private Securities 2,336 2.426 20% of Government Securities 126 164 10% of Loans to the private sector 394 506 Non-Liquid Assets 5,286 6,757 Funding Volatility Ratio II 8.0% 16.8% Scenario III Liquid Assets 3.437 3.844 Available Funds + Investments in private securities 2.336 2.426 50% of Government Securities 315 408 20% of Loans to the private sector 786 1,010 Non-Liquid Assets 5.098 6,514 Funding Volatility Ratio III total coverage 6.0% Source: Superintendencia de Bancos y Seguros
4.28 The stress test suggests that above the liquidity held by banks, extra funds in the order of 5-20 percent of deposits will be required to cover volatile liabilities. This is a costly decision, whereby banks in the aggregate would need to maintain approximately half of their deposits in liquid assets. The Banking Association and the Central Bank proposes a liquidity fund with resources equivalent to 15 percent of total deposits. To create a well funded liquidity fund, it should be recognized that there is a trade off between safety and profitability, and second that a LF does not replace the absence of a lender of last resort and a blanket deposit guarantee. Therefore, other alternatives should be explored to protect the banking system against the possibility of a systemic liquidity crisis.
4.29 In sum, liquidity management remains problematic for Ecuador. First, the Deposit Guarantee Agency is bankrupt and has no liquidity to honor its obligations. Therefore, the amount of deposits insured by the guarantee constitutes a contingent liability for the Central Government in the event of a bank failure, or in a systemic crisis scenario. Second, the creation of a Liquidity Fund with enough resources to withstand a systemic liquidity risk is too expensive and ineffective to fully insure the banking system of a systemic liquidity risk. On the other hand, the proposals made by the Central Bank, and the Banking Association envision a US$1.2 billion Liquidity Fund equivalent to 15.0 percent of deposits, but which would cover only 27.5 percent of volatile liabilities, which is completely insufficient. Alternatively, internationalizing the Ecuadorian banking system will eliminate the necessity of establishing a liquidity fund that poses operating restrictions on the banking system and a heavy burden on profits. By the same token, a deposit guarantee scheme also becomes less relevant a banking system that is well integrated into international money markets.
4.30 Banking sector vulnerabilities are also exacerbated by an investment portfolio heavily concentrated in Ecuadorian government bonds. In 2005, over $1 billion in government bonds were held in banks’ portfolios, accounting for 10.3 percent of total assets. Commercial banks are directly exposed to payment delays of government debt service that, if materialized, would undermine their balance sheet position. A government cash flow problem, which is seasonally very common, could have a direct impact in government deposits in
51
the financial system. Last but not least, without the buffer offered by monetary and exchange rate policies, adjustment to shocks will have a direct impact on the real sector and real income affecting the quality of the loan portfolio and profitability. Therefore, it is advisable that banks’ pursue an investment diversification strategy and avoid concentrating their holdings in government paper.
C. Conclusions and policy recommendations
4.31 We have argued in this chapter that, despite important improvements in several indicators, the Ecuadorian banking system remains vulnerable to a liquidity shock, which could then translate into another financial crisis. Moreover when compared to more mature system operating in a dollarized environment, such as Panama’s, two features of the Ecuadorian system call for attention: the limited presence of international banks, indicated of insufficient levels of integration with international banking markets, and the potentially low level of capitalization relative to risky assets, measured by the CAR ratio.
4.32 We propose a series of reforms below aimed at addressing the issues of liquidity management and capitalization levels, as well as at generating the minimum conditions necessary to foster higher levels of integration with the international banking system through the creation of an international banking center. In the end all proposals have one goal: to strengthen Ecuador’s banking system in order to minimize the likelihood of liquidity and/or financial shocks which could impact economic growth negatively. For this purpose the GoE should:
• Reinforce the banking supervision and regulation framework. In this regard, minimum capital requirements and the ratio of capital to weighted-risk assets must be revised upward to improve the solvency of the banking system. Regulators should consider increasing the minimum CAR to 12.0 percent;
• Reform the General Financial Institutions Law (Ley General de Instituciones del Sistema Financiero) to level the playing field between domestic and foreign institutions. In this regard, Ecuador should establish two type of banking licenses to distinguish between banks operating with headquarters in Ecuador, and those operating as branches of international banks. Both should operate by the same rules and regulations. Minimum capital requirements have to be revised upward to strengthen bank’s solvency;
• Effectively apply the bankruptcy law in Ecuador, (Ley de Concurso Preventivo) which has been subject to political influence, weakening its initial objective. A complete review of the law is necessary to resolve cases of temporary insolvencies in a timely and efficient manner.
• Define procedures to foreclose and dispose of an asset to speed up the recovery of funds that are tied to specific guarantees. In Ecuador, the foreclosure procedure is under the purview of the civil courts, which are influenced by powerful interest groups which translates into lengthy and costly procedures. A legal claim can last more than five years, until the court reaches a final verdict;
• Eliminate different taxes and contributions levied exclusively on the banking system operations, adapting the tax policy to the international best practices.
52
53
V. PROMOTING ROBUST ECONOMIC GROWTH: AN INTRODUCTION
5.1 Ecuador is a small, relatively open economy operating under a dollarized regime. It is also an oil rich economy. In this context the combination of a productive, well-managed oil sector and a competitive, internationally integrated non-oil sector has the potential to be the engine for sustainable and robust economic growth. Many factors contribute to achieving such a combination. Some of them have already been discussed above, while those that are more specific to the oil and trade sectors are attended to below.
Performance of the oil sector, 1990-2004
5.2 The importance of the oil sector within the Ecuadorian economy cannot be overstated. The sector produces approximately 24 percent of GDP and accounts for 30 percent of the Non-Financial Public Sector (NFPS) revenues and 60 percent of total exports. The sector, however, underperforms compared to international standards and given existing levels of reserves. Low productivity levels in the oil sector are particularly worrisome at the present moment when oil prices in international markets are hitting record highs. In this environment the opportunity cost of producing below potential is particularly high, given the relative importance of the oil sector within the Ecuadorian economy and, particularly, given the fact that oil revenues constitute one of the main sources of revenue for the central government.
5.3 This chapter explores the main reasons behind the oil sector’s relatively poor performance. In doing so the chapter builds upon and complements previous analysis done by the World Bank (World Bank, 2003), which identified three main challenges facing the oil sector: (i) transportation constraints, (ii) price and tax distortions, and (iii) a weak legal and institutional framework. The first constraint has been lifted since the analysis was performed thanks to the opening of the Oleoducto de Crudos Pesados (heavy crude pipeline, OCP) in 2003, but the other two challenges remain. Little can be said regarding price and tax distortions beyond what was already discussed as part of this early work, so this chapter will summarize this discussion (see Box 5.1). In contrast the discussion on the sector’s institutional framework can be expanded further to explore in more detail the impact that such framework has on the sector’s investment levels and thus on productivity. This constitutes the focus of the chapter.
5.4 The main findings of the chapter can be summarized as follows:
• Despite the significant improvements in transportation infrastructure capacity brought about by the entry into operation of the OCP pipeline in the second half of 2003, the oil sector in Ecuador continues to underperform. The basic reason for this can be found in the lack of investment in petroleum exploration and production, which prevents production and exports from increasing even after the bottleneck to transport crude oil across the Andes, from the fields in the Amazon to the ports in the Pacific, has been eliminated.
• Low levels of investment in production can be attributed to the fact that PetroEcuador (PE), without savings to invest, operates the most productive fields, while the private companies, with the muscle to invest, have access only to marginal fields with a high institutional risk factor.
• A reform of the sector’s institutional frame geared towards the separation of the regulatory and the production functions, as well as towards granting PE higher financial independence from the government could go a long way in increasing investment and production levels in the sector, while having a positive fiscal impact.
5.5 The rest of the chapter is structured as follows. The first section provides a brief overview of the sector’s legal and institutional framework. The second section presents data on the sector’s performance during 1990-2004, paying special attention to production and investment levels. The third section concludes by presenting some policy recommendations and discussing the results from a series of simulation exercises designed to measure the potential impact of these recommendations.
54
Box 5.1: Price and tax distortions in Ecuador’s oil sector
This box summarizes the discussion and policy recommendations regarding price and tax distortions in the oil sector presented in World Bank (2003).
Subsidy for oil derivatives. With the recent increase in oil prices and the prices of derivatives, fuel subsidies currently have an estimated fiscal cost of approximately 3 percent of GDP per year. This figure includes the general subsidy for gas (LPG), as well as minor subsidies for diesel and fuel oil. Gasoline is the only product being taxed effectively. In addition these subsidies suffer from poor targeting, with the bulk of the subsidy accruing to the rich rather than the poor.
An increase in the price of a cylinder to its estimated economic price is recommended; at the same time that a targeted direct subsidy for the poorest households should be established. No law is required for this adjustment since the fixing of fuel prices is the responsibility of the President of the Republic. There are two alternatives for the proposed compensation. The first consists in the creation of a gas cash payment that would be paid along with the Bono de Desarrollo Humano, a conditional cash transfer program. This payment would cover the increase in cost for gas usage equivalent to 21 cylinders annually per family (i.e. approx. US410/month). The second possibility is to hand out 21 coupons annually to these same families receiving the social cash payment, which would allow them to purchase a cylinder at the former price. The elimination of the subsidy would save at least US$150 million after subtracting the cost of the targeted gas cash payment. In addition the increase in the LPG price to its efficiency price would considerably reduce the utilization of this fuel for purposes other than cooking, such as running motors or heating water, for which other types of energy can be used (for instance, firewood), while reducing contraband to neighboring countries.
Price and tax policy and lack of competition in the derivatives market. The state monopoly and the fixing of fuel prices by decree are the main characteristics of the petroleum derivative market in Ecuador. The elimination of the LPG subsidy opens the doors to efficiently organizing the tax system for fuels. This can be done without substantially changing the prices for the public, since the correction needed on diesel prices and fuel oil could be staggered while waiting for the international market to stabilize. The fundamental objective is to eliminate price fixing by the state, and basically letting prices respond to international market variations. There are experiences with price adjustment mechanisms that allow the state to withdraw, and that absorb the inopportune price fluctuations on the international market, without affecting consumers.
Decision making on taxes and profit margins of commercialization are closely linked to decision making on prices. In Ecuador it is important to revise the value of the Special Consumption Tax (ICE) and liberalize the profit margins for product distribution and marketing in a way that permits the entry of private companies in a competitive manner. Commercialization activities of derivatives are carried out by Petrocomercial, with the private sector exclusively handling retail commercialization of derivatives at a fixed price established by the government. This is reflected in the absence of a competitive market, which forces the final user to accept rigid price and quality options.
The report recommends that the government make hidden taxes on products more transparent. This will require sending a legal reform to the National Congress to create a new tax on special consumption (ICE) in cents per gallon of the product.
After adjustments in prices and the tax regime, the government should continue with the liberalization of the market. Tariffs on imports should be eliminated, which means opening the market to private imports of derivatives, with the possibility that private companies have access to transport infrastructure and storage facilities. In the short term they would utilize installations owned by Petrocomercial, and later their own installations resulting from new investment. In order to make this proposal feasible, Petrocomercial must be forced to offer transport services via ducts, storage, and other means needed by firms interested in commercializing products. The Ministry of Energy and Mining would publish the transport and storage tariffs that Petrocomercial would charge, and these should be competitive. Given the size of the Ecuadorian market, and in order to avoid the establishment of private monopolies on distribution and commercialization, the qualification of firms interested in activities should not be too rigorous in terms of size. On the other hand, in no way should this easing of requirements mean noncompliance with operational and environmental standards. These must be followed and supervised by the National Directorates of Hydrocarbons and Environmental Protection respectively. Producers and commercial agents would increase with the reduction of entry barriers and opening to imports. In the medium term this would surely result in improvements in the quality of products and services offered, as well as a reduction in profit margins for distribution and marketing that are currently too high-oscillating between 10 and 18 percent.
Source: World Bank (2003).
55
The oil sector’s legal and institutional framework
5.6 Since the first Law on Hydrocarbons was passed in 1972, the state has played a major role in the management and operation of the oil sector through PetroEcuador (PE), the publicly owned company. PE controls approximately 75 percent of all proven reserves (estimated at 4.6 billion barrels), including the majority of light crude oil fields, and maintains a monopoly over wholesale industrialization and the commercialization of derivatives in the domestic market. In addition PE acts as the main counterpart for private companies participating in exploration and production activities.
5.7 Private companies operate marginal, less productive fields under three different regimes: participation contracts, service contracts and marginal fields’ contracts. Under participation contracts private companies assume all risks, investment expenses and other costs, and share their production with the state using a distribution rule that assigns 20 percent of total production to private companies and the rest to PE. Under service contracts private companies assume all risks and investment expenses associated with the exploration of a certain area. In case of success the company is reimbursed by PE for these expenses and then paid a fixed amount per barrel produced by PE. Under marginal fields’ contracts private companies are granted access to reserves discovered in small fields (i.e. fields representing less than 1 percent of total national production), provided they covered all operating expenses, and receive a fixed amount per barrel produced. Approximately 82 percent of all production by private companies occurs under participation contracts, with service and marginal fields’ contracts accounting for the remaining 10 and 8 percent, respectively.
5.8 Refining activities are managed exclusively by PE. Products are provided to vendors at a fixed price established by the President of the Republic, while consumer prices are allowed an additional margin of (at most) 18 percent, applied by nearly all distributors without price or margin competition. Actual production, however, does not completely meet domestic demand, forcing the government to import gasoline, diesel, and gas (LPG).
Performance of the oil sector, 1990-2004 Oil production
5.9 Oil production has increased significantly over the last 15 years, from 286 million barrels per day (mbd) in 1990 to 528 mbd in 2004. Important differences exist, however, between the performance of PE and that of private companies during this period. PetroEcuador’s production levels grew during the early 1990s, as new fields were opened up for exploitation, but has declined by almost 30 percent since. In contrast production levels among private companies grew steadily between 1990 and 2003 and accelerated afterwards as a consequence of the opening of the Oleoducto de Crudos Pesados—OCP, the new oil trans-Andean pipeline (Figure 5.1). In addition most of the increase in production by private companies has taken place under participation contracts, whose share of total private production grew from 0 to 80 percent between 1995 and 2004.
5.10 Changes in production levels were associated with changes in the intensity of exploitation in the sector, where intensity is measured as the ratio between the flow of production and the stock of reserves. This ratio equals 3.9 for the country as whole, compared to 16.7 percent in the United Kingdom or 10.3 in Argentina. Within Ecuador significant differences exist between PE (3.4) and private companies (9.4), as well as among different private companies (Figure 5.2) Given that the geologically sustainable rate is estimated to be between 7 and 8 percent, these figures indicate that PE could double its oil production while keeping reserves levels constant over time.
56
Figure 5.1: Total oil production by PE and private companies
5.11 Since most private companies already exhibit exploitation intensities equal or higher than those technically recommended, the question then arises as to what factors drive PE underperformance. This chapter argues that the intensity of exploitation is directly related to investment, via the number of wells drilled and under operation. The number of wells under operation by private companies in 2004 surpassed that of PE by a factor of 3 to 1, while the number of new wells drilled by private companies that same year was higher than that of PE by a factor of 5 to 1. Although the fact that private companies have access to the least productive fields could in part explain why higher levels of investment are required to produce a given
57
amount of oil, the rapid growth in oil production observed among these companies suggests a direct connection between investment and the intensity of exploitation.
Investment
5.12 Investment levels in the oil sector have increased significantly over the last 10 years, and this increase has been completely driven by private companies. Overall investment levels in the sector grew from US$356 to US$945 million over 1995-2004 (Figure 5.3). During this period the share of total investments accounted for by private companies climbed from 75 to 95 percent as their investment levels increased from US$263 to US$919 million, while those of PE fluctuated between US$25 and US$90. Eighty percent of all investments by private companies take place under participation contracts, 15 percent under service contracts and the remaining 5 percent under marginal fields’ contracts. Similarly 70 percent of investment expenses by private companies are devoted to production, 17 percent to exploration, 4 percent to transport and storage, and the rest is allocated to various activities ranging from pre-production to market research.
Figure 5.3: Investment levels for PE and private companies
Source: Authors’ calculations using data from BCE.
5.13 As argued above, growing disparities in terms of investment efforts have been mirrored by similar differences in production levels between PE and private companies. It is then important to understand how investment decisions are made and financed in the sector. The main source of financing for investment expenses for both PE and private companies is profits. Once operating and other costs are covered, private companies evaluate their investment needs according to their medium-term plans and allocate existing resources to such needs as required. In contrast PE investment decisions are made by MEF, which takes into consideration not only the company’s needs but also broader demands within the Non-Financial Public Sector (NFPS) and Central Government (CG) budgets. Moreover past initiatives to grant PE access to complementary investment resources to operate large fields through, for instance, joints ventures between PE and private companies gained Congress approval initially but were later declared unconstitutional. Given this the next section takes a close look at the distribution of PE revenues between the company and the government, as well as at PE cost structure as the main determinants of PE’s investment levels. Details are also provided on revenue accrued by private companies for comparison purposes.
58
Revenue distribution and costs in the oil sector
5.14 PE generates revenue both through oil sales in international markets (exports) and through sales of derivates in the domestic market, while private companies can only sell their production internationally. In addition, a fraction of the revenues generated by private companies are transferred to PE as per the contractual conditions. In particular, production under service and marginal fields’ contracts belongs to PE, after payment of a fixed amount per barrel, as does a share of production under participation contracts. Total revenue for PE then equals export revenues, minus the amount paid to private companies under service and marginal contracts, plus the royalties received from private companies under participation contracts, plus domestic revenues. Up to 1998 PE also received compensation payments from private companies. Private companies’ total revenues equal payments by PE, plus revenues generated under participation contracts, minus royalty payments.
Export revenue and its distribution
5.15 Export revenues are a function of export volumes times international oil prices. Since international prices are similar for PE and private companies, only data on volume and revenue is presented and discussed.
5.16 PE exports both crude oil and oil products. Total exports by the company have declined by about 40 percent between 1995 and 2000, driven by the overall decline in PE’s production levels and, to a lesser extent, by the cancellation of compensation payments and a reduction in royalty payments by private companies. As a result, PE export revenues have become more dependent over time on private companies’ production. Private companies’ export a fraction of what they produce under participation contracts, plus additional volume as established contractually. This additional volume almost fully compensates for the decrease in exports associated with royalty payments (Figure 5.4).
5.17 PE export revenues increased up to 1996 as a consequence of growing volume and prices, declined during the second half of the 1990s as direct sales dropped and finally increased dramatically due to increasing oil international prices in recent years; whereas private companies export revenues grew steadily throughout the period driven by increasing volumes and, as of late, growing prices (Figure 5.5).
Figure 5.4: Export revenue by PE and private companies
5.18 Export revenues generated by PE are distributed between the company and the government. The share of revenues accrued to the government has varied over time, growing in recent years (i.e. from 30 to 70 percent approximately) as the oil price considered for budget preparation has increased. Of this share, more than 90 percent goes to the Central Government while the rest is distributed among other entities in the NFPS. In contrast private companies retain all export revenues. As a result net revenue per exported barrel is significantly higher for private companies than for PE (Figure 5.6).
60
Figure 5.6: Net revenue per barrel for PE and private companies (US$)
0
5
10
15
20
25
2000 2001 2002 2003 2004
Private Companies
PetroEcuador
Source:
Domestic revenue and its distribution
5.19 PE has the monopoly to supply the domestic market. A fraction of domestic sales are refined in Ecuador out of PE production, and the rest is imported directly by PE. Fuel and other products are sold at prices set by the MEF, and PE receives a fixed amount per barrel. This amount is estimated by MEF on the basis PE production costs and government’s fiscal needs and has fluctuated around 70 percent of total price in recent years. The combination of increasing international prices and growing domestic demand that has to be served through imports, however, has led to a slightly decline in the government’s share of revenue, and the corresponding increase in PE’s share (Figure 5.7).
Figure 5.7: Distribution of domestic revenue
Distribution of domestic revenue per barrel (US$)
0
5
10
15
20
25
30
35
2000 2001 2002 2003 2004
Government
PetroEcuador
61
Distribution of total domestic revenue (US$ millions)
5.20 PE operational costs include wages and salaries, and purchases of operational services and goods, both for exporting and supplying the domestic market. According to the company’s own data, operational costs fluctuated between US$560 and US$830 millions between 2000 and 200418, or approximately US$4-5 per barrel. Services account for the bulk of total costs (approx. 60 percent in 2004), followed by wages and goods (approx. 20 percent each in 2004).
5.21 Are these costs high or low in the Ecuadorian context? Similar data on private companies operating in Ecuador is not available. Rough comparisons, however, can be performed using information from a recent study on competitiveness of the oil sector in the Andean countries. This study estimates average costs per barrel in Ecuador to be around US$7 per barrel, slightly above the cost reported by PE (IDB, 2006).
5.22 In sum, PE costs do not seem to be above those of other companies operating in Ecuador. Net revenue levels, however, are significantly lower than those obtained by private companies due to the fact that a large share of these revenues accrues to the government as part of the budget. This severely limits PE’s savings capacity and negatively impacts the company’s ability to develop and implement a long-term investment strategy aimed at increasing both production and exploration activities.
A proposal for a new institutional framework in the oil sector
5.23 This chapter has argued that the drop in PE’s production is not due to the geology of oil fields (which have sufficient reserves), but rather to the deficient management of an industry that is extremely technical. Political interference has been the norm, with an emphasis on short-term objectives, due mainly to fiscal needs and to pressure from various interest groups. As a result PE’s maintenance of its facilities is poor, access to new technologies is low and losses of technical personnel have increased in recent years.
5.24 In addition private companies, with the muscle to invest, have access only to marginal fields and face significant contractual uncertainty (see Box 5.2), which could make them reluctant to invest below their potential.
18. These calculations are based on PetroEcuador’s valuation of crude used for refining purposes and do not take into
account the value of this crude in international markets.
62
Box 5.2: Contractual uncertainty in the oil sector
During the last few months Ecuador’s companies operating in Ecuador’s oil sector have been subject to significant uncertainty associated with a possible revision of existing contracts. These contracts were negotiated at a time when international prices were low and oil production by private companies was limited by transportation constraints. Today production in the sector takes place under very different circumstances. Oil prices have climbed to record highs in recent years and a new heavy oil pipeline opened in 2004 that lifted existing constraints and allowed private companies to significantly increase production.
In this context pressure has mounted for the government to increase its share of oil production and revenues by private companies under participation contracts above the level stipulated in current contracts of 20 percent. In response a new law has been sent to and approved by Congress that contemplates a revised share of at least 50 percent. It is important to notice the government’s share in total revenues by private companies is higher than these shares suggest as a result of income taxes paid by private oil companies.
Irrespective of the adequacy of the government’s proposal, the whole process has been managed poorly as the discussion has often appeared to be dominated by political considerations rather than by technical criteria. This is detrimental to the industry since it undermines potential investors’ confidence in the Ecuadorian legal and contractual system and contributes to increase uncertainty regarding the viability/profitability of investments in the country. Finally the discussion has taken place at a time when other issues in the sector, such as the conflict between the government and Oxy and the financial troubles reported by PetroEcuador, had already contributed to increase uneasiness.
Add numbers with expected impact of new law
5.25 If the sector continues to operate under the current institutional framework, characterized by PE dual role as an operator in the sector and as the main government counterpart for private operators, by the fact that planning and investment decisions are heavily dominated by fiscal considerations, and by high levels of contractual uncertainty it will be extremely difficult to increase production given existing technical and financial restrictions.
5.26 This section proposes a new institutional framework for the sector, and briefly presents the results of a series of simulation exercises that assume that such framework is adopted. The departing point for the development of this framework is the recognition that the Ecuadorian state owns the country’s natural resources and, consequently, has the right and obligation to administer these resources. Adequate administration involves the design of sector policies that maximize social benefits for both the current and future generations, as well as the actual development and management of the resources, which can be done by both public and private operators.
A new institutional framework
5.27 The main objective of the proposed framework is to increase investment and, as a result, oil production up to technically sustainable levels by (i) separating the regulation and development functions within the oil sector and (ii) promoting the independence of PE finances from overall government budgetary needs. The regulation function would be assumed by a specialized agency or ministry, independent of PE. This agency could be modeled after Norway’s Petroleum Directorate or Colombia and Brazil’s National Hydrocarbons Agencies, and should have at least the two following characteristics: (i) adequate technical staffing, and (ii) high degree of independence from the Central Government. Moreover the agency’s main responsibilities can be summarized as:
• Administration of reserves, including among others the following tasks: assessing level and economic value of existing oil reserves; promoting the exploration for new reserves; publishing information on
63
reserves; and designing and implementing adequate policies regarding the management and exploitation of reserves.
• Supervision of exploitation of reserves, including among others the following tasks: supervising and enforcing existing contractual arrangements between the Ecuadorian state and the sector’s operators; collecting royalties and/or other payments (if applicable); minimizing political interference in the sector.
5.28 The development of the five areas currently under PE’s administration constitutes the core objective of the second function identified above. Exploration and production activities in these areas can be undertaken by public and/or private operators, so that two different scenarios can be considered. Under the first scenario, the public sector continues to play an active role through PE, while under the second scenario all exploration and production is done by private companies. In either case a combination of public and private investment is crucial to ensure that adequate levels of resources are available. A brief characterization of both options follows:
• Option 1, with public participation: In this scenario PE would have to be considered an equal player in a leveled field (i.e. PE and private operators would be subject to the same tax regimes and contractual arrangement with the regulating agency). In addition the sector’s legal framework would have to be revised to allow PE to partner up with private companies, using joint ventures or other types of arrangements. Mixed companies resulting from such partnerships would be charge a royalty or service fee per barrel produced, as it is currently done for private companies, and would be accountable to the regulating agency described above. Finally all operators would be expected to rely on net revenue, capital markets and/or Foreign Direct Investment to finance their investment expenses and other needs. Were the state to invest in PE under this scenario, such expenditures should be recorded as part of the budget as capital expenses.
• Option 2, without public participation: In this scenario PE would cease to exist, and its core technical personnel would be transferred to the regulating agency as required. Adjudication of existing reserves would be done on the basis of public biddings, and their exploitation would be supervised by the regulating agency. The same applies to refining activities.
Looking forward: Simulating the impact of the proposed reforms
5.29 The proposed reforms aim at increasing oil production to technically sustainable levels. Two different scenarios are developed to explore the impact of the reforms and their effects under different assumptions during 2006-2020. The first scenario assumes that all new investment is targeted to increase production in fields currently under (PE) exploitation, rather than to open new fields. In contrast the second scenario assumes that a share of new investment is devoted to the development and exploitation of the Ishpingo-Tambococha-Tiputini (ITT) fields, including construction of additional transportation capacity as needed (see Box 5.3 for a more detailed discussion on the ITT fields). In addition both scenarios assume the following: (i) prices remain constant so that changes in revenue respond only to changes in volume; and (ii) additional domestic demand, which is assumed to grow at a constant annual rate of 4 percent, is met exclusively through local production (i.e. exports equal production minus internal demand). Finally data on investment requirements, exports and domestic production and revenue levels, and the distribution of that revenue between operators and the government is provided under both scenarios.
64
Box 5.3: The case of the ITT fields
In 1993, PE discovered heavy crude reserves in several fields called Ishpingo-Tambococha-Tiputini (ITT), in the central part of the Amazon. Preliminary perforations and other studies indicate the existence of a significant volume of reserves (1.4 billion bbl.) in these areas. However the geographic and environmental situation of the ITT fields, combined with the quality of the crude, which exhibits elevated sulfur content, imply that high levels of investment over an extended period of time will be required to access these reserves. Considering that it takes 5 to 10 years for reserves to reach production stage, it is necessary to begin work in the ITT as soon as possible.
Source: World Bank (2003)
5.30 Scenario 1. This scenario assumes an increase in total oil production to 750 mbd by 2009 as a result of increasing use of the OCP to full capacity and smaller oil developments in the coastal fields. Aggregate changes in production translate into:
(i) Domestic production and revenue: Production for the domestic market increases from 136 mbd in 2006 to 255 mbd in 2020. As a result domestic revenues are expected to increase from US$2,000 to US$3,500 millions between 2006 and 2020.
(ii) Exports and revenue: The exportable surplus, after supplying the domestic market, reaches a maximum level of 585 mbd in 2009 and then drops to 495 mbd in 2020. As a result export revenues increase from US$5,100 million in 2006 to US$6,400 million in 2009, and then drop to US$5,400 million in 2020.
(iii) Fiscal impact through revenue distribution: The government share in domestic revenues is assumed to be equal to the historical average for the period 1990-2004, or 37 percent. Under this assumption, fiscal revenues increase from US$700 million in 2006 to US$1,300 in 2020. Similarly the government share in export revenue is assumed to equal the historical average of 50 percent for the period 1990-2004. This includes royalties, as well as regular and extraordinary taxes applicable to oil extracting industries. Under this assumption, fiscal revenues increase from US$1,600 to US$3,200 million between 2006 and 2009, and then decline to US$2,700 million by 2020. The overall impact on fiscal revenues is an increase from US$2,300 to US$4,000, equivalent to an annual increase of 4 percent.
(iv) Investment: Required expenses to maintain and increase existing capacity as needed are in the order of US$940 million a year over the five year period extending from 2005 to 2009, dropping to US$600 million a year afterwards.
5.31 Scenario 2. In addition to the increase in production to US$750 mbd in 2009 assumed under scenario 1, scenario 2 contemplates a further increase to US$950 mbd by 2020 as the ITT fields become active.
(i) Domestic production and revenue: Production for the domestic market increases from 136 mbd in 2006 to 255 mbd in 2020. As a result domestic revenues are expected to increase from US$2,000 to US$3,500 millions between 29006 and 2009.
(ii) Exports and revenue: The exportable surplus, after supplying the domestic market, increases to 695 mbd in 2020. As a result export revenues increase from US$5,100 million in 2006 to US$8,000 million in 2016, and then drop to US$7,600 million in 2020.
(iii) Fiscal impact through revenue distribution: The government share in domestic revenues is assumed to be equal to the historical average for the period 1990-2004, or 37 percent. Under this assumption, fiscal revenues increase from US$700 million in 2006 to US$1,300 in 2020. Similarly the government share in export revenue is assumed to equal the historical average of 50 percent for the period 1990-2004. This includes royalties, as well as regular and extraordinary taxes applicable to oil extracting industries. Under this assumption, fiscal revenues increase from US$1,600 to US$4,000 million between 2006 and 2014, and then decline slightly to US$3,800 million by 2020. The overall impact on fiscal revenues is an increase from US$2,300 to US$5,100, equivalent to an annual increase of 6 percent.
65
(iv) Investment: The development of ITT fields and associated transportation facilities requires additional investment expenses for a total of US$3,200 over the investment levels identified in scenario 1. The bulk of the investment effort is concentrated between 2009 and 2013 (for a US$1,300 a year), dropping to US$800 afterwards.
5.32 Assuming the benchmark figure of US$7 per barrel discussed above, net revenue flows under both scenarios (i.e. total revenue minus the government share) are sufficient to cover the required investment levels.
66
67
VI. TRADE OPENNESS AND ECONOMIC GROWTH19
6.1 Ecuador has not taken advantage of changes in the nature of world trade during the last few decades—namely, the rise in trade of manufactured and intermediate goods, the increase in specialization and the growing role of Foreign Direct Investment (FDI) in the integration process. As a consequence the country suffers from slow growth of merchandise and services exports, little diversification and low contribution of trade to GDP. This is true not only with respect to manufacturing exports, but also in what regards exports of natural resources where specialization and capitalization have proven to be a successful strategy in other countries.
6.2 In addition exports exhibit a strong degree of concentration and, as a result, trade performance is highly dependent on crude oil and a small number of other, mainly agricultural products. Ecuador’s high dependence on crude oil exports has a significant impact on the country’s terms of trade, which have declined in recent years, and increases the economy’s exposure to excess volatility associated with oil price fluctuations in international markets. A weakness that is exacerbated under an exchange-rate regime based in dollarization. In this context the design of an adequate incentive regime to promote export diversification and competitiveness should be a priority for Ecuador.
6.3 Finally regional trade integration does not appear to have had much of a corrective impact of the patterns identified above, while it has generated an increase in extra-regional imports. The Free Trade Agreement (FTA) with the United States presents a new opportunity to rethink the role of trade within the Ecuadorian economy.
6.4 Using data from the BCE and the ICS this chapter will analyze these and other issues, comparing Ecuador’s trade performance with those other countries. The chapter will also propose policy options for a more effective integration in the world economy. The main findings of the chapter can be summarized as follows:
• Ecuador’s trade openness, measured by the ratio of exports plus imports to GDP, is similar to that of other countries in the region as well as countries with similar levels of income. This performance, however, is significantly weaker when only non-oil exports are taken into account. Moreover trade volumes have not been very responsive to trade liberation efforts in the early 1990s.
• Ecuador’s mixed performance in terms of trade has had a high price in terms of productivity and economic growth. Ecuadorian exporters appear to be more productive than non-exporters as a result higher competition, economies of scale and learning associated with access to export markets. There appear to be, however, important barriers to entry in exports markets.
• Limited trade growth is the end product of the structure of Ecuador’s exports (high concentration on oil and traditional agricultural products), inadequate trade and other policies, unfavorable conditions in international markets and the country’s inability to diversify its exports base.
• Results from trade gravity models, however, suggest that there may be trade gains still to be exploited by Ecuador. Taking advantage of these unrealized opportunities, however, will require an active role on the part of the GoE to promote export diversification, improve trade policy and strengthen existing institutions.
6.5 The rest of the chapter is structured as follows. The first section presents recent trends in the trade sector. The second section examines the relationship between trade, productivity and economic growth from a micro (i.e. firm-level) and a macroeconomic perspective. The third section analyzes the determinants behind Ecuador’s poor trade performance, paying special attention to the structure of Ecuador’s exports, as well as to other institutional and structural factors, including trade policy, and to conditions in international markets.
19. This chapter draws from work by the World Bank (World Bank, 2004b) and original work commissioned for this
report (Hernandez and Pierola, 2006).
68
The fourth section discusses the country’s trade prospects, within the context of the FTA with the US as well as globally. Finally the fifth section concludes with a brief discussion on policy recommendations.
A. Evolution of trade in Ecuador: Recent trends
6.6 Ecuador’s trade openness, measured by the ratio of exports plus imports to GDP, is close to the Latin American average and to that of countries with similar incomes levels, but falls significantly short of the levels exhibited by other fast-growing economics, such as the East Asian tigers where trade represents 140 percent of GDP, compared to 58 percent in Ecuador. Moreover this aggregate picture hides two important facts that have characterized the recent evolution of trade in Ecuador.
6.7 First Ecuador’s export performance appears to be substantially weaker once the effect of oil in accounted for. The ratio of non-oil exports to non-oil GDP has declined from 24.8 percent in 1990-1994 to 20.8 percent in 2000-2004, and currently falls below the regional average (Figure 6.1). In addition import growth was strong and above that of exports following the economic crisis of 1998-9. As a result, current account deficits rose as coverage of imports by exports fell to 85 percent in the period 2001 to 2003.
Figure 6.1: Non-oil exports as percent of non-oil GDP (1995=100)
75
100
125
150
1995 1996 1997 1998 1999 2000 2001 2002 2003 2004
Ecuador East Asia
Latin America lower middle income
Source: Authors’ calculations using data from the World Development Indicators (World Bank, 2005).
6.8 Second Ecuador’s trade performance has not been very responsive to attempts at trade liberalization in the early 1990s. Growth of trade volumes as a percentage of GDP was similar during the 8 years prior to the reforms than during the 8 years following them (Figure 6.2). In contrast other countries that have recently opened their economies to trade exhibit rapid increases in trade volumes following these changes (Warcziag and Welch, 2003). As we will discusse below, the causes of Ecuador’s inability to reap the benefits of trade liberalization can be traced down to the low degree of diversification that characterizes the country’s exports, together with the poor performance of traditional commodity exports.
69
Figure 6.2: Trade responsiveness to liberalization
-5
-3
-1
1
3
5
Peru All developing LAC Ecuador
Growth of real (exports+imports)/real GDPduring 8 years before liberalization
Growth of real (exports+imports)/real GDPduring 8 years after liberalization"
Source: Loayza and authors’ calculations based on Warcziag and Welch (2003).
Figure 6.3: Composition of exports and imports
-
2.000
4.000
6.000
8.000
10.000
1980 1983 1986 1989 1992 1995 1998 2001 2004
Manufactures Traditional agro Other natural resource
Fuel Services
-
2.000
4.000
6.000
8.000
1991 1993 1995 1997 1999 2001 2003
Raw materials Intermediate goods
Consumer goods Capital goods Source: Authors’ calculations using data from COMTRADE accessed through WITS.
6.9 Oil and non-oil exports represent approximately 60 and 40 percent of total exports respectively20. Traditional (agricultural) products, such as bananas and shrimp, account for almost 50 percent of non-oil exports, compared to 25 percent for non-traditional agricultural exports and 16 percent for manufacturing products. These shares vary somewhat by country of destination. Exports to the United States are dominated by oil and agricultural products, while manufacturing products play a more prominent role in exports to the Andean region. Traditional commodity exports (fish, bananas, cocoa and coffee, not including their manufactures) fell by 4.8 percent per year in nominal terms in 1998-2004. In contrast non-traditional exports (including processed fish, other natural resource-based like flowers, fruits other than bananas, vegetables, and manufactured products) grew 5 percent per year during the same period (Figure 6.3).
6.10 Imports of consumer goods, intermediate goods and capital goods represent 25, 50 and 25 percent of total imports respectively. Import growth has been strong and above that of exports since the economic crisis
20. The share of oil exports has increased in recent years, from 55 to 60 percent, as a consequence of rising
international oil prices.
70
of 1998-9. The resulting current account deficit has only recently been reversed as a consequence of high oil prices and increasing remittances, but imports continue to grow, particularly imports of intermediate and consumption goods, fueled by raising domestic consumption levels and by remittances themselves (Figure 6.3).
6.11 In sum, although Ecuador’s aggregate trade performance is similar to that of comparable countries, there appears to be significant room from improvement in terms of both capitalizing on trade liberalization efforts and exploiting the potential of non-traditional exports. This has important implications since, as we discuss next, unrealized trade gains have a direct cost in terms of productivity and economic growth.
Box 6.1: Trade and economic growth – A review of the literature
Evidence on trade volumes and growth. Recent empirical work emphasizes the positive relationship between trade and growth. New literature addresses for the issue of endogeneity of trade flows and for the facts that exports are part of GDP. A seminal work of Frankel and Romer (1999) proposed a methodology for overcoming these shortcomings. On the basis of their resulting instrumental variables estimate for a sample of 150 countries, they found a strong effect of openness on income per capita. According to Frankel and Romer, a 1 percent higher trade share raises income per capita by 2 percent. Decomposing the effects of trade on income, they find that the biggest impact operates through total factor productivity (TFP). Using Frankel and Romer’s methodology, Alesina, Spolaore, and Wacziarg (2003) found a positive effect of openness and scale on the growth rate of income per capita. Moreover, they found that smaller countries gain more in terms of market-size expansion, and therefore the effect of trade on their income per capita and its rate of growth should be larger. Dollar and Kray (2004) and Loayza, Fajnzylber, and Calderón (2005) run growth regression based on trade volumes and control for their joint endogeneity and correlation with country-specific factors through GMM methods that involve taking differences of data and instruments. Both papers conclude that opening the economy to international trade brings about significant growth improvements.
Evidence on trade, diversification and insulation from external shocks. Recent economic literature has emphasized the negative correlation between export concentration and development. Sachs and Warner (1995) found a negative correlation between exports of raw materials as a share of GDP and growth in developing economies. The findings are consistent with earlier studies that associate the negative effects on growth with factors such as the long term deterioration of commodity prices relative to imported manufactured goods prices, limited opportunities for technical progress, productivity gains and sustained job creation in natural resource-based sectors, and the potential appreciation effects of natural resource exports on the real exchange rate, as well as distortionary rent-seeking behaviour that are often associated with natural resource sectors. Feenstra and Kee (2004) established a positive relationship of export variety to industry productivity in a cross-country analysis. They also find that export variety depends significantly on trade costs, such as tariffs, distance and transport costs. Similarly, Klinger and Lederman (2004), based on pioneer work of Imbs and Warziag (2003), found an inverted U-shaped relationship between discovery of new exports and growth, peaking at the middle-income level and then declining. They suggest following Rodrik and Haussman (2003) that market failures may be inhibiting the emergence of new products in developing countries. In this setting, public policy can play an important role.
Evidence on trade, diffusion of knowledge and productivity. Several work point out that exporting leads to higher productivity and therefore growth. Learning-by-exporting can be particularly important in small developing economies, where technology comes basically from abroad. This is the conclusion of Kray (1999) for China, Van Biesenbroek (2003) for Subsaharan countries, Blalock (2004) for Indonesia or Fernandes (2005) for Colombia. Bustos (2005), based on seminal work of Helpman, Melitz, and Yeaple (2004), finds that trade liberalization makes export profitable to more firms, reduces profitability of low productivity firms, and therefore increases average productivity of the industry through reallocation of output. Also she finds that high productivity firms will export and adopt also higher technology.
Source: Hernandez and Pierola (2006).
B. Why should Ecuador care about trade? Trade, productivity and economic growth
6.12 There is significant empirical evidence supporting the hypothesis that trade promotes economic growth (see Box 6.1 for a summary of the existing literature). Some of the reasons behind this positive
71
connection include increased access to new technologies through imports of capital goods and higher productivity levels resulting for stronger competition, economies of scale and learning. In this section we present a brief discussion on the impact of trade on both firm-level productivity and aggregate economic growth in Ecuador.
Trade and firm-level productivity
6.13 One of the main arguments in favor of trade openness for is that it increases efficiency and productivity in the economy through higher competition, economies of scale and learning. Supporters of this hypothesis rely on evidence that exporting firms appear to be more productive than their non-exporting counterparts, and argue that these firms “learn through exporting” as knowledge, technology, product design, and improvements in production methods come from participation in international markets, to which non-exporters do not have access. Detractors, however, point out that similar results would be obtained if more productive firms self-selected into being exporters21.
6.14 We explore the relationship between trade and firm-level productivity in Ecuador using data from the Manufacturing Survey administered by the National Statistical Institute (INEC). In order to do this we model firm-level productivity, measured as (log) value-added per worker, as follows:
ityeartorititit eDDZXVAperL +++++= secln δβα
where X is a dummy variable which takes a value of 1 if the firm is an exporter, Z controls for firm size, and Dsector and Dyear are dummy variables that control for sector- and time-specific effects.
6.15 Average differences between exporters and non-exporters are similar to those reported in the Ecuador Investment Climate Survey (World Bank, 2004). Exporters operate at a larger scale than non-exporters, pay higher wages, produce more output per-worker, use more capital-intensive technologies, and rely on imported inputs and foreign technology more frequently.
6.16 Estimation results show that there are significant differences in productivity between exporters and non-exporters, and that these differences are bigger among large and medium firms than among small ones. Differences in productivity between exporters and non-exporters are also more marked in industries with higher levels of capital intensity, such as ‘cars, machinery & equipment’, and ‘chemicals’. This is consistent with the existence of high entry costs into international markets in more technologically-advanced industries, combined with a higher scope for (rapid) imitation by other domestic producers in industries with low capital intensity.
6.17 In order to explore whether productivity differences are directly associated with export activities, we use information on changes in firms’ status as exporters and/or non-exporters over time. In particular the data allows us to distinguish between:
a) New exporters: Firm X does not export in t but does so in t+1; b) Permanent exporter: Firm X exports in both periods; c) Previous exporter: Firm X exports in t but does not in t+1; d) Never exporter: Firm X never exports.
6.18 Having divided firms into these groups, we estimate the following equation: 21. So far the literature has provided evidence in support of both hypotheses. Much seems to depend of the country
characteristics. Girma and Greenaway (2002) for the United Kingdom, Kraay (1999) for China, Van Biesenbroeck’s (2003) for six Sub-Saharan countries, Blalock and Gertler (2004) for Indonesia, and Fernandes (2004) for Colombia obtain results that point in the direction of productivity improvements directly linked to export activities.
where start, both and stop are dummy variables that assign firms to their corresponding groups. The coefficients for the three relevant dummies are positive and significant, implying that exporters are more productive than non-exporters. In addition interesting differences exists between the three groups. Permanent exporters are significantly more productive than starters and stoppers, while there seem to be no significant differences between new exporters and the firms that quit exporting suggesting that productivity does not declined (immediately) after exiting export markets (Table 6.1, model A).
6.19 The fact that new exporters exhibit higher productivity levels than non-exporters on the year that they start exporting is suggestive of “learning through exporting”. To explore this hypothesis further we add measures of firm productivity and capital per worker at time t to the model above in an attempt to capture systematic differences between groups of firms that pre-date their entry into the exports market. The coefficient on both variables is positive and significant. Their inclusion, however, does not explain away observed differences between exporters and non-exporters, with the exception of stoppers. One possible explanation for these results is that firms undertake productivity enhancing measures in the year(s) leading up to their entry into the exports market, while their productivity continues to increase as a result of their involvement in these markets (Table 6.1, model B).
Table 6.1: Productivity differences by exporting status
Coefficient F-test Model A
Start 0.47** (8.13) =1 =2 Reject Ho (5%) F=4.05
Both 0.60** (19.73) =1 =3 Don’t reject Ho F=0.07
Stop 0.45** (7.17) =2 =3 Reject Ho (5%) F=4.91
Medium 0.63** (24.2) Large 0.97** (34.16) Model B
Start 0.12** (3.25) =1 =2 Do not reject Ho F=0.62
Both 0.09** (4.57) =1 =3 Do not reject Ho F=3.11
Stop 0.03 (0.68) =2 =3 Do not Reject Ho F=2.28
Value added per worker in t 0.73** (114.34) K/L in t 0.09** (22.47) Medium 0.06** (3.33) Large 0.07** (3.95) Note: t values are in parenthesis, (**) indicates significance at 1%, (*) indicates significance at 5%. The regression includes year and sector dummies. Source: Authors’ calculations using data from the Manufacturing Survey (INEC).
6.20 The probability that a non-exporter in the sample becomes an exporter is 1.5 percent, while the probability that an exporter stops exporting is 15 percent. Low numbers of transitions between both states, together with evidence of increases in productivity prior to entry and of persistent productivity gains among stoppers, suggest that there may be entry costs (i.e. sunk costs) associated with becoming an exporter. These costs could be due to, among others, investment in market research, change sin product specification, and the need to comply with foreign markets requirements. Unfortunately, the survey does not include information
73
that could be used to tease out the presence of sunk costs, such as management practices or product specific variables.
6.21 In sum we find significant differences in productivity levels between exporters and non-exporters and evidence of learning effects through the exporting activity. We also find that differences between exporters and non-exporters widen after entry into the export market and do not disappear if the manufacturer stops exporting. These results suggest that productivity gains can be attributed to knowledge and efficiencies gained from participation in international markets. Anecdotal evidence from interviews carried in Ecuador also points in this direction. Companies in the fresh flowers, broccoli and canned-fish sectors identified technology transfers from overseas buyers as one of the key sources of productivity growth.
Trade and economic growth
6.22 Given the positive relationship between trade and productivity growth and business expansion at the firm-level, the question then arises at to whether a similar relationship can be found at the aggregate level. Unfortunately the contribution of trade to economic growth in Ecuador has declined over time. During the 1980s and especially the early 1990s exports acted as one of the main engines of economic growth, accounting for 2-4 percentage points of GDP growth. In addition export-led growth benefited the poor since it increased the demand for unskilled labor (Morley and Vos, 2004). After the crisis, however, the contribution of exports to growth slowed down considerably, while import leakages rose due partly to exchange rate appreciation and growing remittances (Figure 6.4). This contrasts with the experience of other countries in the region, such as Chile, Costa Rica, the Dominican Republic and Guatemala, which have succeeded in translating increased trade volumes associated with trade openness into higher economic growth.
Figure 6.4: Contribution of trade to GDP growth
Ecuador
-4%
-2%
0%
2%
4%
6%
8%
10%
1980-1984 1985-1989 1990-1994 1995-1999 2000-2004
gdp growth import leakage contrib of ex to gdp
Peru
-4%
-2%
0%
2%
4%
6%
8%
10%
1980-1984 1985-1989 1990-1994 1995-1999 2000-2004
gdp growth import leakage contrib of ex to gdp
74
Figure 6.4: Contribution of trade to GDP growth
Chile
-4%
-2%
0%
2%
4%
6%
8%
10%
1980-1984 1985-1989 1990-1994 1995-1999 2000-2004
gdp growth import leakage contrib of ex to gdp
Average LAC
-4%
-2%
0%
2%
4%
6%
8%
10%
1980-1984 1985-1989 1990-1994 1995-1999 2000-2004
gdp growth import leakage contrib of ex to gdp
Source: XX
6.23 A closer examination of the relationship between trade and economic growth using co-integration analysis reveals some important facts that help explained the patterns described above. Long-term economic growth (and investment) does not lead to higher exports. In fact strong export growth has often coincided with periods of weak overall economic growth. On the other hand, growth of non-traditional exports, particularly of canned fish, cut-flowers, fresh vegetables and fruit juice, appears to have a positive effect on overall economic growth. These industries are often characterized by their capacity to adapt new technology, carry out further innovation, increase coordination along the supply chain and, ultimately, generate spillovers to other sectors of the economy. However they only account for 7.5 percent of total exports so that their overall impact on growth has been so far limited.
6.24 In sum, low export penetration in world markets, combined with low export diversification and growing import dependence has slowed aggregate economic growth. In order for Ecuador not to miss an opportunity for stronger growth in a positive international environment, the country needs to strengthen its export capacity, broaden its exports base and, more generally, eliminate existing barriers than hamper competitiveness and difficult entry into the exports market. We turn to these issues next.
C. What is behind Ecuador’s poor trade performance? An overview of Ecuador’s trade structure, institutions and trade policy
6.25 The evidence discussed so far in this chapter has shown that Ecuador has failed to translate trade liberalization efforts into higher trade volumes and, subsequently, higher productivity and economic growth. This section examines some of the possible causes behind this disappointing performance. In doing so attention is paid to Ecuador’s trade structure, its trade institutions and policies, and conditions in international markets.
Ecuador’s trade structure: What you export matters
6.26 A closer look at the nature and structure of Ecuadorian exports reveals two important facts: (i) the structure of exports is unsophisticated for the country’s level of development, and (ii) export diversification is low and slow. We discuss both issues in more detail below.
75
Export sophistication
6.27 Hausmann, Hwang and Rodrik (2005) argue that the level of export sophistication, measured as the weighted average of the income per capita of countries exporting a given basket of goods, is highly correlated with per-capita GDP. They also show that the initial level of export sophistication is a strong and robust predictor of subsequent economic growth, even after controlling for other relevant factors.
6.28 Unfortunately Ecuador’s exports are much less sophisticated than those of countries with similar levels of income per capita like China, Philippines, India, Indonesia, Egypt, Morocco, Jordan, El Salvador or Peru (countries that grow faster than Ecuador). A potential explanation for this is that the technological content of the country’s exports is excessively skewed towards extractive and low-value added activities, even when compared to other countries in the region with similar endowments (Figure 6.5).
Figure 6.5: Sophistication of exports and GDP per capita
Source: Hausmann, Hwang and Rodrik (2005)
Export diversification
6.29 Despite the reduction observed during the last few years, export concentration in Ecuador, measured by the Herfindahl-Hirschmann and other indeces, is significantly higher than that of its regional competitors (Figure 6.6). Ninety-five percent of all non-oil exports are accounted for by only 24 products. Concentration levels are somewhat lower for exports to neighboring Andean countries and the US as a result of increased market access associated with preferential treatment granted under the Andean Trade Preferences Act (ATPA), while they remain high for exports to other markets—e.g. the European Union.
6.30 Increased diversification can be understood as growth of trade in new products and/or the development of new variations of old products to replenish the product cycle. A way to measure the speed of export diversification is to examine changes in trading patterns for the 10 percent least traded products in a country. The evolution of this set of products is relatively positive in Ecuador, as the result of growing diversification in non-traditional and manufacturing exports. The speed of diversification, however, is still slow compared to other countries. The share of least traded products in total exports grew from 10 to 40 percent between 1990 and 2004 in East Asia, but only to 20 percent in Ecuador (Figure 6.6). An alternative way to measure diversification is by counting new exports (i.e. discovery of new products for export). The number of new discoveries in Ecuador is below what would have been predicted by its level of development
76
(Klinger and Lederman, 2004). Countries like Indonesia, India, China, Peru, Colombia, Thailand, Romania or Turkey, at similar income levels, show higher rates of discoveries of new exports and have been growing faster in the last years.
Figure 6.6: Indicators of export diversification/concentration (non-oil)
Ecuador: diversification indices
0%
10%
20%
30%
40%
50%
1991 1993 1995 1997 1999 2001 2003
HHI by destination HHI non-oil Bottom 10%
Latin America: Herfindahl indices (1990-2004)
0%
5%
10%
15%
20%
ECU CHI CRI PER COL ELS GTM MEX
1991-97 1998-2004
Source: XX
Institutional and structural factors behind trade performance: Trade and other complementary policies
6.31 In this section we review the impact of institutional and structural factors on Ecuador’s trade performance. In doing so, we focus on the real exchange rate, trade policy and other complementary policies and/or structural characteristics of the economy.
Real exchange rate
6.32 Following the 1998-9 crisis Ecuador’s real exchange rate (RER) appreciated significantly reaching pre-crisis levels in 2003. The RER has declined slightly since but remains above the levels observed in the early 1990s. RER appreciation occurred at a time when the currency value of Ecuador’s regional competitors remained constant or even depreciated. These changes had the potential of undermining the competitiveness of Ecuadorian products in international markets and could therefore explain the country’s poor trade performance (Figure 6.7). Evidence in this regard is mixed. Growth of non-traditional exports hit a record high during 2001-2003, despite an appreciated RER, suggesting that other compensatory factors, such as institutional and/or structural constraints, may have been at play. The role of these factors is potentially more important for high-value exports to developed countries than for commodity exports, where price is a more fundamental driver of competitiveness.
77
Figure 6.7: Real Exchange Rate
National currency/US$; index 1994=100; down means depreciation
6.33 Trade policy can affect trade performance through various channels. First export promotion policy and, more broadly, trade opening can impact the allocation of resources across sectors and/or across firms within a given sector. As documented above, Ecuadorian firms face significant entry costs into the export market which allows only the most productive firms to become exporters. Empirical evidence from Canada and other shows that policies aimed at reducing these costs, combined with higher trade liberalization could go a long way in increasing average productivity through entry and exit and output relocation (Trefler, 2004; Bustos, 2005).
Box 6.2: Imports of inputs and capital goods and productivity
There is a remarkable difference between exporters and non-exporters regarding the use of capital per worker and imported inputs in the production process. Exporters import 51 percent of their total inputs consumed in the production process, versus a 38 percent of non-exporters. Plants in which imports represent more than 50 percent of total consumption of parts and raw materials are three times as large as those that use only domestic inputs, and twice as large as those for which imported inputs are less than 50 percent of their total purchases. An even greater differential is found for sales, which explains that shipments per worker are twice as much among firms that make intense use of imported parts and raw materials. These plants have also higher levels of productivity, capital per worker, wages, and skilled workers.
Simulations performed found that major gains in firm productivity would come from improved international integration in world markets. International integration variables (mainly access to foreign inputs, transportation and customs reform) would lead to half of the potential productivity gains. Among these factors, increased use of imported inputs would be the single largest source of potential productivity gains in the assumption that firms move to the country’s best practice in all areas of the investment climate. In the assumption that Ecuadorian firms were to close existing investment climate gaps with their Central American counterparts, reduction in customs delays would be the first source of productivity gains, and improvement in the use of imported inputs would be the second largest source.
In a small country like Ecuador, the existing bias against exports should continue to be reduced in order to boost non-traditional exports. This is important both from the perspective of traditional trade policy, but also from the broader perspective of trade facilitation.
Source World Bank (2004b).
78
6.34 Second higher trade liberalization lowers the costs of access to foreign technology embedded in imported inputs and capital goods (Coe and Helpman, 1995, Falvey et al. 2002). Evidence from Ecuador’s Investment Climate Assessment (World Bank, 2004b) suggests that the reduction or elimination of obstacles to these imports could result in major productivity gains (see Box 6.2). Intermediate goods are imported at an average 10 percent tariff, and capital goods at an average 8 percent tariff. Tariffs on capital imports range from 5.2 percent on electrical generators to 14.7 percent on telecommunications equipment. In principle there is no rationale for taxing a needed import that is not produced domestically. Especially in a country where imports of capital goods account for an average 50 percent of total private sector’s gross fixed capital formation and they are the major source of transfer of knowledge for Ecuadorian exporters (compared to foreign investment, licensing or turn-key projects). A potential Free Trade Agreement with the United States should bring these tariffs to zero and permit imports of cheaper machinery.
6.35 Third reducing tariffs and minimizing their dispersion could improve the allocation of resources across sectors and firms and hence lead to higher productivity and economic growth. Ecuador reduced dramatically its average MFN tariff in 1992, but liberalization efforts have been limited since. With an average rating of 5 out of 10 on the IMF’s trade restrictiveness index, Ecuador appeared to have a moderately restrictive trade regime in 2004, implying that there is still work to be done. Higher protection rates have traditionally been granted to sectors with low value-added and/or employment potential despite the fact that they have not grown as a result of protection and trade deficits in those sectors have been continuous and growing (Baquero and Freire, 2004). In addition there is evidence that after the reduction of average tariffs undertaken in 1992, dispersion within sector has widened in many cases. Dispersion contributes to misallocation of resources and it would be desirable to move to a more uniform tariff structure. Finally the gap between the import duties effectively collected (6.5 percent of total imports) and the average tariff (11.9 percent) in Ecuador is large compared to other Latin American countries and could potentially be closed. Hachette (2001) shows that tariff revenues could be increased through measures directed at reducing contraband and improving the capacity of customs collection.
6.36 Apart from traditional trade policy instruments, Ecuador has made extensive use of non-tariff instruments, mainly through mandatory import standards and import authorizations procedures. Currently, import authorizations are required for 1,386 10-digit tariff lines. Most of these authorizations are applied in the food processing industry (17.7 percent), plant products (23.3 percent) and chemical products (39.9 percent). In addition, bans are applied in used cars, clothing and tires. Although import registration processes have been simplified, there is a large discrepancy in the number of days needed to obtain a permit, which sometimes is arbitrarily denied without clear justification pointing to a lack of transparency (e.g. ICA survey reports an average 8.3 days in obtaining an import permit, with a standard deviation of 12.6 days). Non-transparent regulations, besides being incompatible with WTO, result in unnecessary costs, that are especially harmful in agricultural inputs markets (Box 6.3 illustrates this point for the broccoli industry). In addition, they favor the practice of anticompetitive practices in the agricultural inputs markets that harms precisely the main comparative advantage of the country. Reforms should unify and reduce the import licenses and implement an electronic system for approving them or substitute them, when possible, by domestic non-discriminatory standards (importers’ registration and labeling).
6.37 In sum, Ecuador could benefit significantly from a reduction and consolidation of its tariff structure, together with a simplification of its non-tariff instruments.
79
Box 6.3: Costs in the supply chain of broccoli
Broccoli is currently one of the fastest-growing agricultural exports in Ecuador. Cauliflower’s and broccoli’s exports combined have been expanding in the last decade at an annual average of 47 percent between 1992 and 2004. The analysis of the broccoli’s value chain illustrates some of the major domestic/institutional problems faced by exporters across products in their efforts to export.
The figure below shows how the consumer’s price of broccoli (in supermarkets in the United States) is formed taking into account the participation of the different stages in the value chain. Between inputs, production and local transport costs, the price paid to producers represents 11 percent of the final price paid by consumers. The main components of the production costs are the inputs and fertilizers (28 percent) and plants (25 percent). These costs represent more than the labor costs (22 percent). Customs delays, import licenses and other regulations result in lack of competition in the market of agricultural inputs and excessive costs of supply.
Moving forward in the value chain, the largest share of the final price (39 percent) is a result of the processing of fresh broccoli into frozen broccoli. At this stage, the larger components of the processing costs are represented by labor (38 percent), energy (35 percent) and packaging (20 percent).
The costs associated with handling, commissions and customs at the origin are 10 percent of the consumer’s price; they represent almost the same than the price paid to producers. According to information provided in interviews with the private sector, these costs are high due to burdensome procedures from the sanitary authority that are costly in terms of paperwork and time.
Transport costs represent 15 percent of the consumer’s price. Among these costs, the ones resulting from inefficiencies and excessive costs in the port of Guayaquil are the ones where authorities could intervene to reduce overall costs to exporters. Finally, the costs associated to customs at the destination and the distribution are 2 percent and 23 percent respectively.
Composition of the broccoli’s consumer price
0%
10%
20%
30%
40%
50%
60%
70%
80%
90%
100%
Distribution
Transport
Customs at origin
Processing
Inputs / Domestic production/ Local transport
23%
11%
39%
10%
15%
Customs at destination 2%
Source: Hernandez and Pierola (2006) Other complementary policies
6.38 There is extensive evidence in the economic literature regarding the connection between the effectiveness of trade policy and the quality of institutions. Most of this work points out that cross-country variation in the quality of institutions is correlated with cross-country variation in comparative advantage patterns and ultimately variation in productivity and economic growth—in other words, the quality of institutions appears to be complementary to trade policy. We rely on results by Kaltani and Loayza (2005) to
80
assess the impact of institutional and structural constraints on the effectiveness of trade openness in the case of Ecuador. The authors consider six different indicators (education, financial depth, infrastructure, governance, labor market flexibility and cost of market entry and/or exit) and simulate the impact on growth of one-standard deviation in trade openness given each country’s current values of each indicator. For instance such change in trade openness is associated with a 0.6 increase in GDP per capita growth rates given the quality of governance in Ecuador (measured by the ICRG index), compared to 1.2 in Chile (Figure 6.8). Similar degrees of complementarity can be observed for other indicators.
Figure 6.8: Growth impact of trade openness as a function of complementary reforms
Notes: The lines show the effect of a one unit standard deviation increase in the log of trade volume/GDP on the growth rate of GDP per capita. The x-axis represents the range of the reform area in the full sample. The thicker line on the x-axis (when applicable) represents the range of the reform area in the period 1996–2000. Source: Chang, Kaltani, and Loayza (2005).
6.39 It can be observed, however, that Ecuador compares poorly with other counties considered in the analysis in terms of most indicators. This could partly explain why, as mentioned above, recent trade liberalization efforts have failed to translate into higher trade volumes and higher economic growth. Out of the six indicators identified by Chang, Kaltani and Loayza (2005), we focus here on infrastructure and governance in customs since more detailed discussions on the other four have already been provided somewhere else in this report.
6.40 Infrastructure. Although there are very many different dimensions of infrastructure that affect trade, it could be argued that the most important proxy variable of quality of infrastructure for a trade analysis is
81
transportation infrastructure, particularly maritime port infrastructure. Ecuador’s firms face high transportation costs compared to other exporters to the US market despite its relative geographic proximity (Figure 6.9). Excessive transportation costs are one of the factors underlying low access to the US market among those products not included in the ATPEA, such as canned fish; an indication of Ecuador’s inability to compete with countries like Thailand without commercial preferences. In fact the rate of effective protection imposed by transport costs is often much higher than the rate associated with tariff protection. Import tariffs paid by Ecuador’s exports to the US are on average below 1 percent, while transport costs are above 12 percent of total value. Maritime transport costs are even higher for non-traditional export products.
Figure 6.9: Maritime transportation costs for exports of bananas and canned fish
Cost advantage with respect to Ecuador
Bananas57%
48%
38% 37%
21%
-17%
Brazil Philippines Colombia Costa Rica Venezuela Guatemala
Source: World Bank ICA
Canned Fish91%
71%
58%53%
43%35%
6%
Philippines Chile China Peru Thailand Malaysia Colombia
Source: World Bank (2004b).
6.41 Any strategy of trade integration should therefore address the issue of transportation costs explicitly and directly. One way to do this is to improve port efficiency. Port efficiency varies widely from country to country and, especially, from region to region. Although this variation can be partly attributed to differences in physical infrastructure, inefficiencies are more often than not caused by inadequate regulatory and institutional environments that jeopardize competition, foster corruption and slow the introduction of modern techniques of cargo handling and port management. Port efficiency is low in Ecuador, compared to regional standards, as a result of both imbalances in the directions of trade and inefficiencies at Guayaquil’s port—i.e. Guayaquil’s container transfer rate is 25-28 per hour, compared with 60-100 in other South American ports (World Bank, 2004b).
6.42 Ecuador should ensure effective competition between ports and freight companies in order to reduce the high transport costs that are affecting its competitiveness. Although many different models of port management have been adopted, experience indicates that the recipes for success usually share some common ingredients. These include private involvement in port management, flexible labor restrictions, and the curtailing of monopoly power either through regulation or competition. Indeed, the Latin American experience seems to show that private involvement increases port efficiency when supported by labor reform, and when seaport monopoly power is either adequately regulated or reduced by competition.
6.43 Governance and customs. An area that merits special attention in relation to governance due to its direct impact on trade is customs. Ecuador’s custom regime is poor compared to other Latin American countries. On average it takes close to 20 days to clear customs for imports (compared to one-two days in Chile and Colombia) or a week in Central American countries. Exporters also need an average 7 days to perform customs procedures, against an average of 2 days for their competitors in Central America (Figure 6.10). The variance of the period needed to clear customs is also large by international standards: companies
82
report that their longest delay at customs over the previous year was 30 days on average for importers and 14 for exporters. These delays generate significant financial costs, associated with the holding of larger inventories during long periods of time, thus reducing the ability of Ecuadorian firms to compete internationally. In addition delays at customs are estimated to lead to reductions in productivity as well as in the share of exporting firms, even when a number of other investment climate and firm characteristics are held constant. Econometric estimates suggest that a reduction of one week in the average duration of custom procedures faced by Ecuadorian firms would be associated with a 4.9 percent improvement in total factor productivity, and a 2.1 percent increase in the probability of exporting (World Bank, 2004 – ICA).
Figure 6.10: Average time to clear customs
Number of days
-
5
10
15
20
Malaysia
Hondura
s
Nicaragua
China Peru
GuatemalaIndia
BangladeshBrazil
Ecuador
Pakistan
Exports Imports
Source: World Bank (2004 – ICA).
6.44 About 70 percent of merchandise is physically reviewed, which is a high percentage by international standards. Origin valuation certifications and physical inspection done by private inspection companies represent an annual cost of US$50 million to importers. Coordination with other agencies is weak to non-existent including with the IRS and harbor authorities, while corruption allegations are frequent. The 2003 Customs Law attempted to professionalize the customs service and to integrate it with the IRS, but the law still falls short in some of its key provisions (i.e. legal empowerment of electronic statements, customs access to importers’ information on external trading, and authorization to overhaul customs personnel). Although some of these problems were addresses as part of the 2004 Customs Modernization Plan, important challenges remain.
Conditions in international markets: Is Ecuador reading the signals correctly?
6.45 A final factor that undoubtedly affects Ecuadorian trade performance is international market conditions. In this section we analyze changes in these conditions from two different angles: potential demand for Ecuadorian products, and adaptability of Ecuador’s export basket to preferences in destination markets.
External demand for and competitiveness of Ecuadorian exports
6.46 Changes in a country’s exports can be attributed to changes in the demand for those exports and changes in their level of competitiveness vis a vis other exporters serving similar markets. Ecuador compares
83
poorly to other countries in and outside the region on the basis of this exercise. Export growth in recent years has been limited, as discussed above. More importantly demand for Ecuadorian products has been weak, mainly as a result of the decline in the demand for traditional commodities (banana, fish, crustaceans, cocoa, coffee and textiles), and competitiveness gains non-existent—in fact Ecuador’s international competitive position in the US market has deteriorated over the last few years (Figure 6.11). Finally, although the demand for non-traditional and new exports (mainly flowers, prepared fish, hydrocarbon mixtures, wood, fruits other than bananas, vegetables and some manufactures like sinks, cooking appliances or medicaments) has exhibited a more dynamic behavior, the relative weight of these products within the overall export basket is too small for these developments to have a strong aggregate impact.
Figure 6.11: Constant market share analysis of Ecuador and comparable countries
Decomposition of non-oil export growth to the USA, 1998-2004
-5%
5%
15%
EasternAsian
LatinAmerica
Peru Colombia Chile Ecuador
Total export change Demand change
Competitiveness change Residual
Source: Authors’ calculations using data from UN COMTRADE accessed through WITS.
Market adaptability of Ecuadorian exports
6.47 The question then arises as to whether Ecuadorian producers are reacting to deteriorating signals from international markets. One way to answer this question is to compare the structure of Ecuador’s export basket to that of its main buyer’s import basket (i.e. the US’ import basket) using a “similarity index”. This index varies between 0 (no similarity) and 1 (identical composition), and higher index values are indicative of more favorable prospects for broader trade between countries. For comparison purposes we calculate this index for different Latin American countries in reference to the US and for various Eastern European and North African countries in reference to the European Union.
6.48 The difference between the performance of Latin American and that of other countries is remarkable. The composition of the export basket of Latin American countries, including Ecuador, has changed little over time. As a result gains in the similarity index with reference to the US have been small, about 20 percent between 1990 and 2003. In contrast Eastern European and African countries have pursued an aggressive policy of export diversification targeted to strengthened economic integration with the EU, which has resulted in gains in the similarity index of about 40-50 percent. More importantly both increased diversification and higher degree of similarity appear to be correlated with economic growth, suggesting that Ecuador and its neighbors are forgoing an opportunity for higher economic growth through further trade integration with the US.
84
6.49 The evidence presented in this section indicates that Ecuador’s poor trade performance is the end product of the structure of its exports, inadequate trade and other policies, unfavorable conditions in international markets and the country’s inability to diversify its export base. All in all, a rather bleak scenario, although one that can be reversed, as we discuss in the next two sections.
D. Ecuador’s Free Trade Agreement with the US and overall trade prospects
6.50 In this section we examine Ecuador’s trade prospects in the near future, given the evidence presented above. We start with a brief analysis of the potential impact of the FTA with the US currently under negotiation, followed by a more general discussion on overall trade prospects.
Potential impact of the Free Trade Agreement with the U.S.
6.51 The US is the main market for Ecuador’s exports. Attempts by Ecuador’s Central Bank to measure the potential impact of the FTA using a Computerized General Equilibrium Model show expected direct net gains to be small due to the fact that most Ecuadorian exports to the US already received preferential treatment under the ATPDEA. This conclusion is reversed, however, were the ATPDEA to expire prior to the signing of the FTA (see Box 6.3 for a detailed discussion on the results of the CGE simulations).
Box 6.3: Measuring the effects of the FTA with the US
Using a CGE model, the Central Bank of Ecuador estimated the impact of the FTA with the United States on the Ecuadorian economy. Using a static model and including information of households, governments, external sector and industries from the Input-Output table available for 2001 and tariffs for 2003, they evaluate the impact of the FTA on Ecuador’s GDP under three different scenarios: a) signing of the FTA, b) signing of the FTA with immediate impact (goods immediately liberalized) and c) no-signing of the FTA (losing of the preferences from ATPDEA).
The results point out that the Trade Account worsens with respect to the GDP under the three scenarios. Nonetheless, the results in terms of GDP growth vary depending on whether the FTA is signed or not. Indeed, if the FTA is signed, they find a positive effect on the GDP but at a lower degree as the preferences from the ATPDEA are already granted. According to their results, with the signing of the agreement, the GDP would slightly increase (0.027 percent) along with an increase in exports (0.96 percent) and imports (1.73 percent). On the other hand, if the FTA is not signed, then the GDP would fall in 0.2 percent and so will exports (3.75 percent) and imports (1.38 percent). The reduction of the government’s income from lower tariffs would be of US$ 163 millions if the FTA is signed and US$ 131 millions in case the ATPDEA preferences’ are eliminated (FTA is not signed).
Although they do not foresee a drastic change in the composition of exports (since most export products already have preferences), they identify winning and losing sectors. For instance, processed fish is considered a winner as the tariff for this product would be reduced from the high current level of 35 percent. Within the losing sectors they identify cereals, wood products and transport equipment. In particular, the cereal sector would experiment an increase in their imports of 22 percent; this situation would subsequently benefit the sector of noodle processing.
Source: Hernandez and Pierola (2006)
6.52 While the study focuses on direct gains associated with the FTA, indirect gains in the form of stronger institutions and/or higher access to technology are not to be disregarded. We have argued above that improving the customs service, modernizing agricultural health institutions and ports and strengthening competition policies could have a large and positive impact on export development and diversification despite potentially high initial implementation costs. Some of these reforms will be encouraged under the FTA.
85
Overall trade prospects
6.53 Ecuador’s overall trade prospects under the conditions described above can be examined using an export growth prospect index. This index compares a country’s export basket to recent world trade patterns in an attempt to assess how favorable or unfavorable is the outlook for that given basket. Unfortunately Ecuador’s prospects are dim based on such an index. A value of 1 indicates that, given existing conditions in international markets, a country’s exports will expand at the world’s average rate. Similarly a value larger (smaller) than 1 indicates higher (lower) that average growth. Ecuador’s exhibit a value of 0.95 for total exports, and a value of 0.7 for non-oil exports, compared to a value of 1.12 for the region as a whole and of 1.75 for Chile, the country with the most dynamic prospects. In the case of Ecuador this is the result of high export concentration on traditional agricultural and fishing products, whose income elasticity is estimated to be generally low so that their demand does not grow with world income; while other countries stand to benefit from higher levels of trade integration.
6.54 These results contrast with predictions obtained from trade gravity models which predict potential exports growth based on the relative size and other information regarding pairs for trading countries, and hence provide a more tailored approach to a particular country’s situation. This kind of analysis shows that during the 1990s Ecuador’s foreign trade volumes were 26 percent smaller than what the model would have predicted based on Ecuador’s and its trade partners’ characteristics, including geography, distance, population, territory, and oil-exporter status. In other words there is significant untapped potential for Ecuador’s exports to grow. These models also provide information as to what specific sectors/products exhibit the highest potential. In the case of Ecuador room for growth can be found in manufacturing (namely apparel, leather, chemicals, rubber and plastics, transport equipment and other manufacturing products) in reference to the US market, in agricultural products in reference to Latin America, and in forestry, fishing and food products in reference to Europe.
6.55 Taking advantage of unrealized opportunities, however, will require an active role on the part of Ecuadorian authorities to promote export diversification, improve trade policy and strengthen existing institutions. We present a few options in this respect below.
E. Conclusions and policy recommendations
6.56 We have argued in this chapter that Ecuador’s trade performance in recent years has been disappointing due to a number of factors related to the country’s export structure and lack of export dynamism, the inadequacy of existing trade policies and institutions, and unfavorable conditions in international markets. As a result Ecuador has failed to fully benefit from reform efforts aimed at trade liberalization both in terms of increased trade and higher growth. This can change, however, if the Ecuadorian authorities succeed in implementing a comprehensive package of reforms aimed at capitalizing on the country’s wealth of natural resources while effectively expanding its export based.
6.57 In doing this Ecuador can learn from the experience of Chile, a country that has managed to avoid the “natural resource curse” through a combination of (i) strong institutions to implement stable and consistent fiscal and trade policies; (ii) domestic and foreign direct investment in tradable non-oil activities to limit “crowding-out” and minimized the impact of RER changes associated with a strong natural resource sector; (iii) education and innovation in agriculture activities to fully exploit potential spillovers from natural resource exports; and (iv) export diversification to buffer the adverse consequences of terms-of-trade volatility.
6.58 Further trade liberalization, combined with an adequate complementary agenda that tackles institutional constraints should contribute to long term economic growth. This agenda could focus on the following measures. In the short term, the government could achieve a quick win on exports by focusing on measures to reduce costs for exporters, increase access to markets abroad and revamp investment in export industries. These measures include, among others:
86
• Refocusing traditional export promotion and competitiveness promotion institutions to prioritize their activities towards new exports. This could be done by promoting business associations, R&D in agriculture and food activities, incubator programs, fiscal incentives for diversification (revising traditional FTZ incentives and eliminating other tax exemption not considered in the diversification strategy), and export consortia of small and medium enterprises; improving capital risk financing, and revamping the quality and standards institutional system.
• Redefining trade policy. To ensure preferential access to US market is essential for the structural transformation that the Ecuadorian economy needs, through development of new export products. Reduce tariffs on capital goods, dispersion in tariff on intermediate and capital imports and excessive effective protection in low value added activities. Removal of import authorizations and bans would permit lower prices and enhanced competition in the market for agricultural inputs. Also the system of mandatory technical norms should be reviewed. International standards can be a very important vehicle for technology diffusion and application of good practices, and they embed the right incentives for increasing competitiveness of local firms in international markets.
• Reforming the customs service. Excessively long clearance times for imports and exports, extreme physical inspections, involvement of multiple institutions, and reduced competition among port operators should be tackled. A comprehensive review of these bureaucratic hurdles could be done quickly and provide recommendations for regulatory reforms. Impact of recent reforms seems to be weakened by corruption according to surveys of importers and exporters. There is also evidence to suggest that corruption is behind the failure to control smuggling. There is a genuine opportunity to accelerate these reforms by introducing an explicit anti-corruption strategy for customs with the direct participation of exporters and importers.
• Improving transport and port infrastructure. Transportation costs are very high compared to other countries exporting to the United States. Efficiency of ports is a very important variable affecting transport costs, and the one that can be most directly affected by government. Inefficiencies often come from inadequate regulatory and institutional environment that impedes competition, fosters corruption and slows the introduction of modern techniques of cargo handling and port management. Ecuador should ensure effective competition between ports and freight forwarders
6.59 In the longer term, the government should consider a more comprehensive trade strategy that would allow new export discoveries and the upgrading of exports into higher value goods. This strategy should include policies to promote infrastructure development, upgrading of labor force skills, and R&D. General improvements in the country’s investment climate should also have positive effects on FDI and exports.
6.60 The need to diversify the country’s export base has also been highlighted. This should be done in a selective and transparent manner to prevent giving in to sectoral pressures. Rodrik (2003) argues that governments could usefully build mechanisms to subsidize processes so as to improve competitiveness. In doing this the key to success is not picking winners, but taking care of establishing disciplines to end subsidies to losers. He suggests a set of 10 principles to guide the search process. These include: (i) provide incentives only to new activities; (ii) establish clear benchmarks of success; (iii) establish sunset provisions; (iv) target support to sectors, not firms; (v) subsidize activities should have potential spillovers; (vi) vest administration only to agencies with competence; (vii) supervise implementation agencies with high-level political authority; (viii) implementation must be dome with communication to the private sector; (ix) ensure “picking of losers”; and (x) ensure continued wave of promotion so cycle continues.
6.61 Finally many successful experiences of productive diversification have hardly come as a full market-driven process. Well defined strategies and public policies of public-private collaboration are needed. Table 6.2 illustrates how important this intervention was in the cases of the East Asian countries and in Chile. Foreign direct investment attraction and active exchange rate policies also played an important role in most cases.
87
Table 6.2: An overview of international experience with trade reform
Deepening Industrial Structure
FDI Strategy Raising Technological
Effort
Promotion of Large
Enterprises
Exchange Rate Policies
Singapore No protection. Very strong push into specialized high skilled without protection. Promotion for small and medium enterprises.
Aggressive and selective targeting and screening of FDI by TNCs, direction into high-value- added activities.
None for local firms, but TNCs targeted to increase R&D with generous incentive packages.
None, but some public sector enterprises shifted to targeted activities.
Active exchange rate policy.
Taiwan High protection. Strong push into capital skill and technology intensive industry. Strong pressure for raising local content and subcontracting.
Screening of FDI, and its entry discouraged where local firms were strong; local diffusion of technology pushed.
Government orchestrated strong technology support for local R&D and upgrading by SME.
Sporadic shift into heavy industry promoted by the Government.
Active exchange rate policy.
Korea Strong push into capital skill and technology-intensive industry, especially heavy intermediate and capital goods. Protection of local suppliers, subcontracting.
FDI kept out unless necessary for technology access or exports; joint ventures and licensing encouraged.
Ambitious local R&D in advanced industry, heavy investment in targeted technology infrastructures.
Sustained drive to create giant private conglomerates to internalize markets, create export brands, and lead heavy industry.
Active exchange rate policy.
China Strong protection of high-productivity, new-export activities with subsidies and high tariffs, non-tariffs, and licenses. Many Chinese firms created by Government failed.
State monopolies eliminated early. Joint ventures in specific areas (mobile phones and computers). Rapid absorption of FDI-related export activities in free trade zones.
Weak enforcement of intellectual protection rights, which allowed imitation of foreign technologies.
100 percent foreign-owned firms are rare. Foreign firms access the domestic market in exchange for technology transfer (joint ventures).
Significant undervaluation of the exchange rate and low labor costs.
Chile Strong protection of agricultural modernization and new-export activities, accompanied by selective subsidies and credit support.
Rapid entry of FDI into dynamic new export industries (especially forestry and fishing).
Ambitious local R&D in off-frontier innovation industries.
Fundación Chile instrumental in the transferring of technologies and production systems.
Active exchange rate management with real exchange rate depreciation.
88
89
Annex 1. Data sources and definitions in Chapter 1 Table A1.1 Long-term growth in Ecuador: Annual Data, 1960-2004 Variable Definition Source
Population Solimano and Soto (2005)
Working-age population
population 15-64 years old, Solimano and Soto (2005)
Capital Cumulative fixed capital formation for 1950-2004, depreciated at 4.6%
1950-1964: Solimano and Soto (2005). 1965-2004: World Bank (2005)
Employment Labor force * (1-unemployment rate)
Labor force: World Bank (2005) Unemployment rate: Central Bank of Ecuador (2005)
Value added Gross domestic product, base 2000 1950-1964: Solimano and Soto (2005). 1965-2004: World Bank (2005)
Quarterly data, 1990-2004
Value added Gross domestic product, base 2000 Central Bank of Ecuador
Employment Employment in the urban areas INEC and Central Bank of Ecuador
Wages Real minimum wage 1990-1997 Real wage 1997-2004
INEC and Central Bank of Ecuador
Real exchange rate Central Bank of Ecuador
Cost of capital Real interest rate 30-83 days + quarterly depreciation rate (1.13%)
Central Bank of Ecuador
Table A1.2 Cross-country regression analysis Variable Definition and construction Source Real per capita GDP (in 1990 US$)
Ratio of total real GDP to total population. GDP is in US$ 1990 prices 85 PPP-adjusted US$.
Authors' construction based on World Bank data.
Initial output gap Difference between the log of actual GDP and trend GDP around the start of the period.
From Loayza and Soto (2002) updated.
Gross secondary-school enrollment
Ratio of total secondary enrollment, regardless of age, to the population of the age group that officially corresponds to that level of education.
Elbadawi and Soto (2005)
Domestic credit to the private sector
Ratio to GDP of the stock of claims on the private sector by deposit money banks and other financial institutions.
Elbadawi and Soto (2005)
90
Variable Definition and construction Source Openness (% of GDP)
Residual of a regression of the log of the ratio of exports and imports to GDP (in 1995 US$), on the logs of area and population, as well as dummies for oil-exporting and landlocked countries.
Elbadawi and Soto (2005)
Government consumption (% GDP)
Ratio of government consumption to GDP
World Bank (2002). [missing from references]
Main telephone lines (per 1,000 workers)
Telephone mainlines are telephone lines connecting a customer's equipment to the public switched telephone network
Calderón and Servén (2004)
Governance (index) First principal component of four indicators: prevalence of law and order, quality of bureaucracy, absence of corruption, and public accountability.
International Country Risk Guide (ICRG)
Inflation Measured by changes in the consumer price index.
IFS (2005)
Systemic banking crises Number of years in which a country underwent a systemic banking crisis, as a fraction of the number of years in the corresponding period.
Elbadawi and Soto (2005)
Terms-of-trade shocks Log difference of the terms of trade. Terms of trade are defined as customary.
Elbadawi and Soto (2005)
Period-specific shift Time dummy variable. Authors’ construction.
91
Country List Algeria Ghana Panama Argentina Greece Papua New Guinea Australia Guinea Paraguay Austria Honduras Peru Bangladesh India Philippines Belgium Indonesia Portugal Bolivia Iran, I.R. of Senegal Botswana Ireland Sierra Leone Brazil Israel Singapore Burkina Faso Italy South Africa Canada Jamaica Spain Chile Japan Sri Lanka Cameroon Kenya Sweden Colombia Korea Switzerland Congo, Dem. Rep. of Madagascar Syrian Arab Republic Congo, Republic of Malawi Thailand Costa Rica Malaysia Togo Côte d'Ivoire Mexico Trinidad and Tobago Denmark Morocco Tunisia Dominican Republic Netherlands Turkey Ecuador New Zealand United Kingdom Egypt Nicaragua United States El Salvador Niger Uruguay Finland Nigeria Venezuela, Rep. Bol. France Norway Zambia Gambia, The Pakistan Zimbabwe
92
Annex 2: Advantages and disadvantages of various labor reform options
Temporary contracts Maintain Restrict
Maintain option 1 (Status quo)
Advantages: Higher flexibility due to generalized use of temporary contracts
Disadvantages: Inequality between temporary and permanent workers and possible negative impact on productivity
option 4
Advantages: Higher flexibility due to generalized use of temporary contracts
Disadvantages: Higher labor costs can lead to: (i) reduction of employment of vulnerable groups, such as youth and unskill workers, (ii) decrease direct foreign investment
Flexibilize use of new permanent contracts
option 2
Advantages: Reduction in inequality between temporary and permanent contracts making permanent contracts more attractive, while grand-fathering existing permanent contracts
Disadvantages: New source of inequality among permanent workers
option 5
Advantages: Reduction in inequality between temporary and permanent contracts, with shared costs, making permanent contracts more attractive while grand-fathering existing permanent contracts
Disadvantages: New source of inequality among permanent workers
Flexibilize use of all permanent contract
option 3 (with or without compensation to existing permanent contracts)
Advantages: Reduction in inequality between temporary and permanent contracts making permanent contracts more attractive
Disadvantages: (See next column)
option 6 (with con compensation to existing permanent contracts)
Advantages: Reduction in inequality between temporary and permanent contracts making permanent contracts more attractive with shared costs, while compensating those with currently employed with permanent contracts
Disadvantages: Difficulties in establishing compensation scheme
option 7 (without compensation to existing permanent contracts)
Advantages: Reduction in inequality between temporary and permanent contracts making permanent contracts more attractive with shared costs
Disadvantages: Opposition of those currently employed with permanent contracts
Per
man
ent
cont
ract
s
93
Annex 3: A snapshot of Ecuador’s business environment
Ecuador
Latin America & Caribbean Regional
Average
OECD Average
Economy Characteristics Income Category Lower middle
income
GNI per capita (US$) 2,180 3,084 31,217 Informal economy (% GNI, 2003) 34.4 41.5 16.8 Population (millions) 13 23.8 39.8
Starting a Business The challenges of launching a business in Ecuador are shown below. Entrepreneurs can expect to go through 14 steps to launch a business over 69 days on average, at a cost equal to 38.1% of gross national income (GNI) per capita. They must deposit at least 9.2% of GNI per capita in a bank to obtain a business registration number. Procedures (number) 14 11 6 Time (days) 69 63 19 Cost (% of income per capita) 38.1 56.2 6.8 Min. capital (% of income per capita)
9.2 24.1 41
Dealing with Licenses The steps, time, and costs of complying with licensing and permit requirements for ongoing operations in Ecuador are shown below. It takes 19 steps and 149 days to complete the process, and costs 100.0% of income per capita. Procedures (number) 19 16 14 Time (days) 149 206 146 Cost (% of income per capita) 100 381.2 75.1
Hiring and Firing Workers The difficulties that employers in Ecuador face in hiring and firing workers are shown below. Each index assigns values between 0 and 100, with higher values representing more rigid regulations. The Rigidity of Employment Index is an average of the three indices. For Ecuador, the overall index is 58. Difficulty of Hiring Index 44 42 30 Rigidity of Hours Index 60 53 50 Difficulty of Firing Index 70 30 27 Rigidity of Employment Index 58 42 36 Hiring cost (% of salary) 13 15.9 20.7 Firing costs (weeks of wages) 131 62.9 35.1
Registering Property The ease with which businesses can secure rights to property is measured below. In Ecuador, it takes 10 steps and 21 days to register property. The cost to register property there is 6.7% of overall property value. Procedures (number) 10 6 4 Time (days) 21 76 32 Cost (% of property value) 6.7 4.8 4.8
Getting Credit Measures on credit information sharing and the legal rights of borrowers and lenders in Ecuador are shown below. The Legal Rights Index ranges from 0-10, with higher scores indicating that those laws are better designed to expand access to credit. The Credit Information Index measures the scope, access and quality of credit information available through public registries or private bureaus. It ranges from 0-6, with higher values indicating that more credit information is available from a public registry or private bureau. Legal Rights Index 3 3 6 Credit Information Index 4 4 5 Public registry coverage (% adults) 13.6 11.5 7.5
94
Ecuador
Latin America & Caribbean Regional
Average
OECD Average
Private bureau coverage (% adults) 0 31.2 59
Protecting Investors The indicators below describe three dimensions of investor protection: transparency of transactions (Extent of Disclosure Index), liability for self-dealing (Extent of Director Liability Index), shareholders’ ability to sue officers and directors for misconduct (Ease of Shareholder Suits Index) and Strength of Investor Protection Index. The indexes vary between 0 and 10, with higher values indicating greater disclosure, greater liability of directors, greater powers of shareholders to challenge the transaction, and better investor protection. Disclosure Index 1 4 6 Director Liability 5 3 5 Shareholder Suits Index 6 5 6 Investor Protection Index 4 4.5 5.9
Paying Taxes The effective tax that a medium size company in Ecuador must pay or withhold within a year is shown below. Entrepreneurs there must make 33 payments, spend 600 hours, and pay 33.9% of gross profit in taxes. Payments (number) 33 48 16 Time (hours) 600 529 197 Total tax payable (% gross profit) 33.9 52.8 45.4
Trading Across Borders The costs and procedures involved in importing and exporting a standardized shipment of goods in Ecuador are detailed under this topic. Every official procedure involved is recorded - starting from the final contractual agreement between the two parties, and ending with the delivery of the goods. Documents for export (number) 12 7 5 Signatures for export (number) 4 7 3 Time for export (days) 20 30 12 Documents for import (number) 11 10 6 Signatures for import (number) 7 11 3 Time for import (days) 42 37 13
Enforcing Contracts The ease or difficulty of enforcing commercial contracts in Ecuador is measured below. It takes 41 steps and 388 days to enforce contracts there. The cost of enforcing contracts is 15.3% of debt. Procedures (number) 41 35 19 Time (days) 388 461 225 Cost (% of debt) 15.3 23.3 10.6
Closing a Business The time and cost required to resolve bankruptcies is shown below. In Ecuador, the process takes 4.3 years and costs 18% of the estate value. The recovery rate, expressed in terms of how many cents on the dollar claimants recover from the insolvent firm, is 20.73. Time (years) 4.3 3.5 1.5 Cost (% of estate) 18 17 7 Recovery rate (cents on the dollar) 20.7 28.2 73.8 Source: Doing Business, 2006, The World Bank
95
Annex 4. An evaluation of the /H\�GH�5HKDELOLWDFLRQ�3URGXFWLYD�and its potential impact on the banking sector
In September 2005, Congress approved the first draft of the Ley de Rehabilitacion Productiva (LRP). Pending an internal evaluation, Congress would then be ready to consider the proposal in a second and last debate, at which point the bill would be sent to the President who has three options: approval, partial veto, or total veto. Although a second debate has not yet taken place, the potential impact of the law merits some discussion. This annex provides an overview of the content of the law, together with a brief assessment of its potential effect on the banking sector were it to be enacted. Main features and impact Restrictions on the composition of the banking portfolio The proposal’s main features can be summarized as follows. Banks must lend to the productive (real) sector a minimum of 75.0 percent of their deposits. After complying with the above restriction, the following formula must be applied to determine the amount of the required deposits that the banks must hold at the Central Bank: Total Deposits (-) Loans Net (-) Reserve requirements at the Central Bank = New Deposits at the Central Bank.
Table A.4.1: Necessary liquidity to comply with the proposed law (US$ mn)
Total loans, net of provisions, equaled US$5,053 million in 2005. Eleven out of a total of 25 banks exceeded the floor established by the proposal. The remaining 14 banks in order to comply with the provisions
96
established by the proposed law must lend a minimum of US $ 928 million. The latter means that the loan portfolio will experience an 18.4 percent increase, and banks will have 150 days to comply with this provision. Once the first restriction has been met, banks must apply the formula established in the second restriction to determine the amount that each bank must deposit at the Central Bank. In 2005 one medium-size bank and five small banks accounting for 6.1 percent of the banking system loan portfolio had complied with restriction number two, the remaining 19 banks would need US$1,477 million to be within the limits established by the proposed law. In sum, the banking system in order to comply with both restrictions will need a total of US$2,405 million. (Table A.4.1) The increase in the loan portfolio; in the investment portfolio and other assets, together with the exhaustion of deposits held abroad could adversely affect depositors behavior toward risk which may have consequences on the willingness by the public to hold deposits in the system. Financing The financing required to meet the bill’s requirements will come from three sources: deposits held by the banking system abroad; negotiable securities; and other assets that must to be sold to close the financing gap (Table A.4.2).
In 2005 banks held a total of US$1,401 million in deposits abroad as a precautionary buffer. To comply with the law, banks must withdraw a total of US$1,329 million from their holdings abroad. The latter means 94.9 percent of total deposits held abroad. In their balance sheets banks had a total of US$587 million in negotiable securities. They have to liquidate a total of US$562 million to be in compliance with the proposal. That means that banks have to sell a total of 95.7 percent of their negotiable securities. It’s assumed, for the purpose of the analysis that no capital losses banks will suffer from this operation. The financing residual of US$514 million must come from the sale of other assets. In this situation, were the four banks considered big; five medium-size; and three small banks. Their participation of the residual financing is 68.3 percent, 29.4 percent and 2.3 percent respectively In sum if the proposal becomes law it will have a profound impact on the banking system balance sheet. Banks have to dispose of their liquid and other assets in order to finance the changes established in the bill (Table A.4.3).
Table A.4.3 Sources and uses of funds required for compliance (US$ mn)
Uses Increase in the Loan Portfolio 928.0 Increase in Deposits in the Central Bank 1,477.0 Total 2,405.0 Sources Decrease in Deposits held abroad 1,329.0 Decrease in Negotiable Securities 562.0 Decrease in Other Assets 514.0 Total 2,405.0
Table A.4.4: Changes in the Structure of the Banking System Balance Sheet 2005 (US$ mn)
2005 After the Law Differences Loans Net 5,053.0 5,981.0 928.0 Deposits at the Central Bank 1,477.0 1,477.0 Deposits Abroad 1,401.0 72.0 -1,329.0 Negotiable Securities 587.0 25.0 -562 Other Assets -514 -514 Total 7,041.0 7,041.0 0 Restrictions on the cost of credit The bill establishes restrictions on the lending activities and the cost of funds. The proposed law doesn’t allow banks to charge commissions or fees on their lending activities, only interest. Finally, the deposit rate has to be equal to a minimum of 60.0 percent of the lending rate. Impact on overall banking results The implementation of the proposed law will have an adverse impact on the banking system results. The impact that the bill will have on the bottom line of the banking system will be a loss of approximately US$169.2 million in gross profits, or 76.0 percent of the 2005 gross profits. The proposed law will have adverse consequences on the stability of the banking system. If Congress approves it Ecuador will go against what financial prudence recommends regarding the management of a banking system operating under a dollarized economy without both a lender of last resort, and a deposit guarantee scheme (Table A.4.5).
98
Table A.3.5: Principal Changes in the Structure of the Income Statement (US$ mn)
Increase(+) Decrease(-) Increase in Interest Income new loan portfolio +72.3 Loss of Loans Fees -108.2 Increase in Loans Provisions -6.6 Income Loss in Negotiable Securities -48.9 Income loss on Deposits Held Abroad -17.0 Income loss in Other Assets -31.3 Increase in Cost of Funds22 -29.5 Income loss -169.2
22 The increase in the cost of funds has been calculated in 1.3 percent over term deposits. The calculations were made
based on the actual rates of the last six months.
99
Bibliography
Acosta, M. (2003): “Los números indices y las Cuentas Nacionales dolarizadas del Ecuador, 1993-2001, Notas Técnicas #69, Banco Central del Ecuador.
Agencia de Garantía de Depósitos. www.agd.gov.ec
Alvarez, J. and M. Arellano (2004). "Robust Likelihood Estimation of Dynamic Panel Data Models”, CEMFI Working Paper No. 0421.
Alvarez, R., and Lopez, R. (2004). “Orientación exportadora y productividad en la industria manufacturera chilena”. Cuadernos de Economía. Banco Central de Chile. Vol 41(diciembre), 315-343.
Arellano, M., and O. Bover (1995). "Another Look at the Instrumental-Variable Estimation of Error-Components Models." Journal of Econometrics 68(1): 29-52.
Arellano, M., and S. Bond (1991). "Some Tests of Specification for Panel Data: Montecarlo Evidence and an Application to Employment Equations." Review of Economic Studies 58(2): 277-297.
Asociación de Bancos Privados del Ecuador. www.asobancos.org.ec
Banco Central del Ecuador, www.bce.fin.ec
Banco Central del Ecuador. SE-2490-2005, Pareja Canelos Mauricio, Gerente General (e), Julio 7, 2005.
Barro, R. J. (1990). "Government Spending in a Simple Model of Endogenous Growth." Journal of Political Economy 98 (5) part II: S103-S125.
Barro, R. J. (1991). "Economic Growth in a Cross Section of Countries." Quarterly Journal of Economics 56(2): 407-43.
Barro, R. J. (2001). "Human Capital and Growth." American Economic Review 91 (2): 12-17.
Barro, R. J. and J. W. Lee (1994). "Sources of Economic Growth." Carnegie-Rochester Series on Public Policy 40:1-57.
Barro, R. J. and X. Sala-i-Martín (1992). "Public Finance in Models of Economic Growth." Review of Economic Studies 59 (4): 645-661.
Barro, R.J. and X. Sala-i-Martin (1995). Economic Growth. Mc Graw-Hill.
Baxter, M. and R.G. King (1999). "Measuring Business Cycles: Approximate Band-Pass Filters for Economic Time Series." The Review of Economics and Statistics 81, 575-593.
Beck, T., A. Demirguc-Kunti, and R. Levine (2000). "A New Database on Financial Development and Structure." The World Bank Economic Review 14(3): 597-605.
Beckerman, P. (2002): "Long term origins of Ecuador's "Predollarization" Crisis", in Crisis and Dollarization in Ecuador, P. Beckerman and A. Solimano, (eds), The World Bank.
Beckerman, P. and A. Solimano (2002), Crisis and Dollarization in Ecuador, The World Bank.
Bekaert, G., C. Harvey, and C. Lundblad (2001). "Does Financial Liberalization Spur Growth?" National Bureau of Economic Research Working Paper No.W8245.
Bernanke, B. S. and R. S. Gürkaynak (2001): "Is Growth Exogenous? Taking Mankiw, Romer, and Weil Seriously." Working paper W8365. Cambridge, Mass.: National Bureau of Economic Growth.
Blundell, R. and S. Bond (1997). "Initial Conditions and Moment Restrictions in Dynamic Panel Data Models". University College London Discussion Papers in Economics: 97/07, July.
Bolaky, B. and C. Freund (2004): “Trade, Regulations, and Growth”, mimeo, World Bank.
100
Borensztein E., De Gregorio, J., and Lee, J.W. (1998). How does foreign direct investment affect economic growth? Journal of International Economics 45, 115-135.
Bossone Biagio, Should Banks Be “Narrowed”?,An Evaluation of a Plan to Reduce Financial Instability, Public Policy Brief, Levy Institute, No 69, 2002.
Brock, W. and S. Durlauf, (2001), "Growth Economics and Reality," World Bank Economic Review, 15(2): 229-272.
Calderón, C. and L. Servén, (2004). "The Effects of Infrastructure Development on Growth and Income Distribution," Working Papers Central Bank of Chile 270, Central Bank of Chile.
Caprio, G. and D. Klingebiel (2003). "Episodes of Systemic and Borderline Financial Crises". World Bank. Unpublished manuscript.
Caselli, F., G. Esquivel, and F. LeFort (1996)."Reopening the Convergence Debate: A New Look at Cross-Country Growth Empirics." Journal of Economic Growth 1, pp. 363-389.
Chang, R., Kaltani, L., and Loayza, N., 2005. “Openness can be Good for Growth: The Role of Policy Complementarities” NBER working paper 11787, Cambridge, MA.
Christiano, Lawrence J. and Terry J. Fitzgerald (2003). "The Band Pass Filter," International Economic Review, 44(2), 435-465.
Clague, C.; P. Keefer, S. Knack, and M. Olson (1999). "Contract Intensive Money." Journal of Economic Growth 4(2):185 211.
Contreras, D. and M.L.Granda (2002): “Crisis, Ingresos y Mercado del Trabajo en Ecuador”, Bulletin de l'Institut Français des Etudes Andines, 31(3): 621-654.
de Gregorio, J. and C. Bravo-Ortega (2005). “The Relative Richness of the Poor? Natural Resources, Human Capital and Economic Growth," Working Papers Central Bank of Chile 139, Central Bank of Chile.
Dollar, D. and A. Kraay (2001a). "Growth Is Good for the Poor." World Bank Policy Research Working Paper No. 2587.
Dollar, D. and A. Kraay. (2001b). "Trade, Growth and Poverty." World Bank Policy Research Working Paper No. 2615.
Dollar, D., and Kraay, A., (2004). “Trade, Growth, and Poverty”. Economic Journal 114(493): F22-49
Durlauf, S. (2002): "Policy Evaluation and Empirical Growth Research" in Economic Growth. Sources, Trends, and Cycles. N. Loayza nd R. Soto (eds), Banco Central de Chile: Santiago de Chile, 2002.
Easterly, W., N. Loayza, and P. Montiel. (1997). "Has Latin America's Post Reform Growth Been Disappointing?" Journal of International Economics 43: 287-311.
Easterly, W. (2001): "The Lost Decades: Developing Countries' Stagnation in Spite of Policy Reform 1980-1998", mimeo, The World Bank.
Easterly, W., M. Kremer, L. Pritchett, and L. Summers (1993). "Good Policy or Good Luck? Country Growth Performance and Temporary Shocks." Journal of Monetary Economics, Vol. 32.
ECLAC (2004): Base de datos macroeconómicos del estudio económico de América Latina y el Caribe. Santiago, Chile.
Ecuador: Offering Circular. November, 2005.
Elliott, G., T. J. Rothenberg and J. H. Stock (1996). "Efficient Tests for an Autoregressive Unit Root," Econometrica 64, 813 836.
Elbadawi, I. and R. Soto (1997). "Real Exchange Rates and Macroeconomic Adjustment in Sub-Saharan Africa and Other Developing Countries." Journal of African Economies 6(3, Supplement): 74-120.
101
Elbadawi, I. and R. Soto (2005). “Theory and empirics of Real Exchange Rates in Sub-Saharan Africa and Other Developing Economies”, mimeo, The World Bank.
Engle, R. F. and C. W. J. Granger (1987). "Co integration and Error Correction: Representation, Estimation, and Testing," Econometrica, 55, 251 276.
Fischer, S. (1993). "The Role of Macroeconomic Factors in Growth." Journal of Monetary Economics 32(3):485-511.
Frankel, J. and D. Romer. (1999). "Does Trade Cause Growth?" American Economic Review, 89(3): 379 399.
García-Verdú, R. (2005): "Factor Shares from Household Survey Data", mimeo, presented at ITAM-FBBVA-Banco De México Summer Camp in Macroeconomics, August 31-September 2, 2005, Mexico City.
Gallardo-Zavala Jorge, Ecuador: Lecciones de Otra Década Perdida y la Dolarización, Poligráfica C.A., Guayaquil, 2003.
Gallardo-Zavala Jorge, La Verdad sobre la Deuda Externa, Poligráfica C.A., Guayaquil, 2004.
Gollin, Douglas (2002): "Getting Income Shares Right", Journal of Political Economy, Vol. 110, No. 2, April pp. 458-474.
Greuning van, Hennie, Brajovic Bratanovic, Sonja, Analyzing Banking Risk, World Bank, 2000
Hall. R. and C. Jones "Why Do Some Countries Produce So Much More Output per Worker than Others?", Quarterly Journal of Economics, 1999, Vol. 114, pp.83-116.
Hausmann R., and Rodrik D. 2003. “Economic Development as Self Discovery”. Journal of Development Economics 72: 603-33.
Hausmann R., Hwang, J., and Rodrik D. 2005. “What you export matters“. Center for International Development working paper 123. Harvard University. Cambridge, MA.
Helpman, E. (2005): “The mystery of economic growth”. MIT Press. Cambridge, MA.
Hofman, A. (ed.) (2000), The Economic Development of Latin America in the Twentieth Century, Northampton, MA: Edward Elgar Publishing.
Holtz-Eakin, D., W. Newey, and H. S. Rosen (1998). "Estimating Vector Autoregressions with Panel Data." Econometrica 56:1371-1395.
International Monetary Fund, www.imf.org
International Monetary Fund, Chile: Staff Report for the 2005 Article IV Consultation. September 2005.
International Monetary Fund, Ecuador: Staff Report for the 2005 Article IV Consultation, January 2006.
IMF (2003). “Ecuador: Article IV Review”. Washington DC. International Monetary Fund.
International Monetary Fund (various issues) International Financial Statistics.
Kaufman, D., A. Kraay and P. Zoido-Lobaton (1999). "Governance Matters." World Bank Policy Research Working Paper No. 2196.
Kazakhstan UK Embassy. www.kazakhstanembassy.org.uk
Kehoe, T. and E. Prescott (2002), 'Great depressions of the twentieth century', Review of Economic Dynamics, 5 (1), 1 19.
Klinger B. and Lederman D. 2004. “Discovery and Development: An empirical Exploration of New Products”. WBPSWP 3450. World Bank
Knack, S., and P. Keefer (1995). "Institutions and Economic Performance: Cross-Country Tests Using Alternative Institutional Measures." Economic and Politics 7(3): 207-27.
102
Kwiatkowski, D., P.C.B. Phillips, P. Schmidt and Y. Shin (1992). "Testing the Null Hypothesis of Stationary against the Alternative of a Unit Root," Journal of Econometrics, 54, 159 178.
Levine, R. (1997). "Financial Development and Economic Growth: Views and Agenda." Journal of Economic Literature 35, 2, pp. 688-726.
Levine, R., N. Loayza, and T. Beck (2000). "Financial Intermediation and Growth: Causality and Causes." Journal of Monetary Economics 46, No.1:31-77.
Ley de Beneficios Tributarios para Nuevas Inversiones Productivas, Generación de Empleo y Prestación de Servicios, Noviembre 18, 2005.
Ley Orgánica de Responsabilidad, Estabilización y Transparencia Fiscal, Junio 4, 2002. Reglamento, Febrero 10, 2003.
Ley Orgánica Reformatoria a la Ley Orgánica de Responsabilidad, Estabilización y Transparencia Fiscal, Julio 27, 2005. Reglamento, Octubre 12, 2005.
Loayza, N. and R Soto (2002). Economic Growth. Sources, Trends, and Cycles Banco Central de Chile: Santiago de Chile.
Loayza, N. and R Soto (2005). Market-oriented Reforms: Definitions and Measurement, chapter 3 in Understanding Market Reforms, edited by J.M. Fanelli and G. McMahon, Palgrave-McMillan editors, Hampshire, UK,
Loayza, N.; P. Fajnzylber, and C. Calderón (2005): Economic Growth in Latin America and the Caribbean. Stylized Facts, Explanations, and Forecasts, The World Bank.
Lucas, R. (1988). "On the Mechanics of Economic Development." Journal of Monetary Economics,
Mankiw, N. G.; D. Romer, and D. N. Weil (1992): "A Contribution to the Empirics of Economic Growth." Quarterly Journal of Economics 107 (May, Papers and Proceedings, 1991): 407-37.
Martínez, C.; G. Morales and R. Valdés (2001): “Cmabios Estructurales en la Demanda por Trabajo en Chile”, Economía Chilena, 4(2): 5-26.
Mauro, P. (1995). "Corruption and Growth." Quarterly Journal of Economics 110: 681-712.
Melo, A. (2003): "La Competitividad del Ecuador en la Era de la Dolarización: Diagnóstico y Propuestas", mimeo, Banco Interamericano de Desarrollo.
Méon P.G. and K. Sekkat. 2004. “Does the quality of the institutions limit the MENA’s integration in the world economy?” Global Trade Policy (2004), Blackwell Publishing
Morley S. and Vos R., 2004. “Bad Luck or Wrong Policies? External Shocks, Domestic Adjustment, and the Growth Slowdown in Latin America and the Caribbean”. Institute of Social Studies, The Netherlands
Ministerio de Economía y Finanzas del Ecuador. www.ec-gov.com
Norwegian Central Bank. www.norgesbank.no/english
Notaría Primera, Cantón Quito, “Liquidación del Contrato de Fideicomiso Mercantil Fondo de Estabilización, Inversión Social y Productiva y Reducción del Endeudamiento Público, Fideicomiso FEIREP” Septiembre 28, 2005.
Ocampo, J.A., (2004): "Structural Dynamics and Economic Growth in Developing Countries", mimeo, ECLAC.
Olofsdotter, Karin, 1998. Foreign direct investment, country capabilities and economic growth. Weltwirtschaftliches Archiv 134, 534-547.
Prescott, E. (1998): "Needed: A Theory of Total Factor Productivity," International Economic Review, 39(August): 525-552.
103
Prescott, E. and S. Parente (1997): Barriers to Riches, MIT Press, Cambridge, Ma.
Ratha, D. (2005). “Workers’ Remittances: An Important and Stable Source of External Development Finance.” Chapter 1 in Remittances: Development Impact and Future Prospects, eds. Samuel Maimbo and Dilip Ratha. Washington, DC:World Bank.
Rodrik, D. (1996). "Understanding Economic Policy Reform." Journal of Economic Literature, 34 (1): 9-41.
Rodrik, D. (2005): "Why I Learn Nothing from Regressing Economic Growth on Policies", mimeo, Harvard University.
Sachs, J. and A. Warner (1995). "Economic Reform and the Process of Global Integration," Brookings Papers on Economic Activity.
Sachs J., and Warner, A. (1999). “The Big Push, Natural Resource Booms and Growth”. Journal of Development Economics 59(1): 43-76.
Sapelli, C. (2005): "Returns To Schooling And Income Distribution By Cohort In Chile: An Analysis Based On Synthetic Panel Data", Working Paper #290, Instituto de Economía, Universidad Católica de Chile.
Servicio de Rentas Internas del Ecuador. www.sri.gov.ec
Solimano, A. and R. Soto (2005), "Economic growth in Latin America in the late twentieth century: evidence and interpretation", forthcoming in Vanishing Growth, A. Solimano, (ed), Edward Elgar Publishers.
Solow, R. (1956), "Technical change and the aggregate production function", Review of Economic and Statistics 39, 312 20, August.
Soto, R. (2005): “On the robustness of growth regressions”, in progress.
Summer, L. and A. Heston (1991). "The Penn World Table (Mark 5): An Expanded Set of International Comparisons, 1950-1988." Quarterly Journal of Economics 106(2): 327-68.
Superintendencia de Bancos y Seguros del Ecuador. www.superban.gov.ec
Superintendencia del Sistema Financiero de El Salvador. www.ssf.gob.sv
Superintendencia de Bancos de Panamá. www.superbancos.gob.pa
Servicio de Rentas Internas. www.sri.gov.ec
Turnovsky, S. (2002). "Growth in an Open Economy: Some Recent Developments", in M. Dombrecht and J. Smets (ed.) How to Promote Economic Growth in the Euro Area? Edward Elgar eds.
Van Biesenbroeck, J. (2003). “Exporting raises productivity in Sub-Saharan African Manufacturing Plants”. NBER working paper 10020, Cambridge, MA.
Wacziarg, R., and Welch, K.H. (2003). “Trade Liberalization and Growth: New Evidence“. NBER working paper 10152, Cambridge, MA.
Williamson, J. (1995). "What Washington Means by Policy Reform." The International Political Economy and the Developing Countries Vol. 1: 514-28
World Bank, International Development Bank, Ecuador, Creating Fiscal Space for Poverty Reduction: A Fiscal Management and Public Expenditure Review, Volume I: Main Report, November 17, 2005.
World Bank, International Development Bank, Ecuador, Creating Fiscal Space for Poverty Reduction: A Fiscal Management and Public Expenditure Review, Volume II: Background Papers, November 17, 2005.
World Bank, International Monetary Fund, Financial Sector Assessment Program. Ecuador: Technical Notes: Banking System, March 2005.
104
World Bank, Crisis and Dollarization in Ecuador, Stability, Growth and Social Equito, Beckerman, Paul, Solimano, Andrés, Editors, 2002
World Bank (1994). Infrastructure for Development, Oxford University Press for the World Bank.
World Bank (1995). Bureaucrats in Business: The Economics and Politics of Government, Oxford University Press for the World Bank.
World Bank (2000). World Development Indicators, Washington, DC: The World Bank.
World Bank (2000): Ecuador. Crisis, Poverty and Social Services, Report No. 19920 EC.
World Bank (2003). Doing Business in 2004: Understanding Regulation. Oxford University Press for the World Bank.
World Bank (2003): Ecuador. An Economic and Social Agenda in the New Millenium, Report No. 19920 EC.
World Bank (2004): Ecuador Poverty Assessment
World Bank (2005): Ecuador Investment Climate Assessment.
World Bank (2006). International Migration, Remittances, and the Brain Drain. Çaglar Özden and Maurice Schiff Editors The World Bank and Palgrave-Macmillan
World Bank (2003). “World Development Indicators”. Washington DC. The World Bank.
World Bank (2005). “Ecuador’s Investment Climate Assessment”. Washington DC. The World Bank.