ED 109 263 AUTHOR TITLE INSTITUTION REPORT -NO PUB DATE NOTE EDRS PRICE DESCRIPTORS IDENTIFIERS DOCUMENT RESUME TM 004 733 Wilfong, Harry D.;,And Others Percentile Normative Tables for the Armed Services Vocational Aptitude Battery (1973-74 School Year Data Base). Armed Forces Vocational Testing Group, Randolph AFB, Tex. Research Div. AFVTG-TRN-74-3 Dec 74 94p.; For related documents, see TM 004 727 and / 728 MF-$8.76 HC-$4.43 PLUS POSTAGE Armed Forces; High School Stddents; *Na ional Norms; *Occupational Tests; *Raw Scores; Seconda Edu ation; Secondary School Counselors; Sta,.. tical Analysis; *Tables (Data); Test Interpretation; Test Results; Vocational Aptitude *Armed Services Vocational Aptitude-Battery ABSTRACT This report summarizes test performance for 771,031 students tested on Armed Services Vocational Aptitude Battery (ASVAB) Form 2-during school year 1973-74, with separate normative tables provided by sub-test, aptitude composite, grade, sex and geographic region. New-data are provided for ninth'grade and post-high school students. Information contained in the tables parallels percentile scores reported for individual students to be tested with ASVAB in school year 1974-75. Percentile tables in \the present report are ,designed for use by high school counselors\as an interpretative guide and a supplemental reference to the AFVTG computer printout of student test scores. Users are cautioned that 1974-75 represents the first time ASVAB percentile scores are to be computed around empirically developed student norms rather than representative ce derived mobilization population Samples. As such, the data are not representative of tke total available high school population, but do characterize actual test performance of students examined during the preceding year's test cycle Additionally, where individual test score comparisons from one year to the next may be required, the 1974-75 ASVAB percentile reports will represent different levels of student performance\over previous reports (i.e., prior to September.1974). (Author/RC) *********************************************************************** Documents acquired by ERIC include many informal unpublished * materials not available from other sources. ERIC makes every effort * * to obtain the best copy available. nevertheless, items of marginal * * reproducibility are often encountered and this affects the quality * * of the microfiche and hardcopy reproductions ERIC makes available * * via the ERIC Document Reproduction Service (EDRS). EDRS is not * responsible for the quality of the original document. Reproductions * * supplied by EDRS are the best that can be made from the original. ***********************************************************************
Transcript
ED 109 263
AUTHORTITLE
INSTITUTION
REPORT -NOPUB DATENOTE
EDRS PRICEDESCRIPTORS
IDENTIFIERS
DOCUMENT RESUME
TM 004 733
Wilfong, Harry D.;,And OthersPercentile Normative Tables for the Armed ServicesVocational Aptitude Battery (1973-74 School Year DataBase).Armed Forces Vocational Testing Group, Randolph AFB,Tex. Research Div.AFVTG-TRN-74-3Dec 7494p.; For related documents, see TM 004 727 and
/ 728
MF-$8.76 HC-$4.43 PLUS POSTAGEArmed Forces; High School Stddents; *Na ional Norms;*Occupational Tests; *Raw Scores; SecondaEdu ation; Secondary School Counselors; Sta,.. ticalAnalysis; *Tables (Data); Test Interpretation; TestResults; Vocational Aptitude*Armed Services Vocational Aptitude-Battery
ABSTRACTThis report summarizes test performance for 771,031
students tested on Armed Services Vocational Aptitude Battery (ASVAB)Form 2-during school year 1973-74, with separate normative tablesprovided by sub-test, aptitude composite, grade, sex and geographicregion. New-data are provided for ninth'grade and post-high schoolstudents. Information contained in the tables parallels percentilescores reported for individual students to be tested with ASVAB inschool year 1974-75. Percentile tables in \the present report are,designed for use by high school counselors\as an interpretative guideand a supplemental reference to the AFVTG computer printout ofstudent test scores. Users are cautioned that 1974-75 represents thefirst time ASVAB percentile scores are to be computed aroundempirically developed student norms rather than representative
ce derived mobilization population Samples. As such, the dataare not representative of tke total available high school population,but do characterize actual test performance of students examinedduring the preceding year's test cycle Additionally, whereindividual test score comparisons from one year to the next may berequired, the 1974-75 ASVAB percentile reports will representdifferent levels of student performance\over previous reports (i.e.,prior to September.1974). (Author/RC)
***********************************************************************Documents acquired by ERIC include many informal unpublished
* materials not available from other sources. ERIC makes every effort ** to obtain the best copy available. nevertheless, items of marginal *
* reproducibility are often encountered and this affects the quality *
* of the microfiche and hardcopy reproductions ERIC makes available *
* via the ERIC Document Reproduction Service (EDRS). EDRS is not* responsible for the quality of the original document. Reproductions ** supplied by EDRS are the best that can be made from the original.***********************************************************************
\TECHNICAL RESEARCFi\NOTE 74-3
PERCENTILE NORMATIVE TABLES
FOR THE
ARMED SERVICES VOCATIONAL APTITUDE BATTERY
(1973-74 SCHOOL YEAR. DATA BASE)
U S DEPARTMENT OF HEALTHEDUCATION &WELFARENATIONAL INSTITUTE OF
EDUCo. MNTHIS DOCUMENT HAS BEEN REPk0DUCED ERACTLy AS RECEIVED F,R0,.THE PERSON OR ORGANIZATION ORIGIN*TING IT POINTS of VIEW OR OPINIONSSTATED DO NOT NECESSARILY REPRESENT OFFICIAL NATIONAL INSTITUTE OFEDUCATION POSITION OR POLICY
Em4
HARRY D. WILFONGRONALD J. ARMSTRONG, CPT, USMC
RAYMOND K. HUCKELL, JR., SFC, USA
RESEARCH DIVISIONARMED FORCES VOCATIONAL TESTING GROUP
- RANDOLPH AIR FORCE BASE, TEXAS
DECEMBER 1974
APPROVED FOR PUBLIC RELEASE; DISTRIBUTION UNLIMITED
Armed Forces Vocational Testing Group Technical Research Reports and Technical
Research Notes are developed for primary use and reference by secondary schoolcounselors and Department of Defense Armed Services Vocational Aptitude Battery(ASVAB) test administrators and educational specialists. This report is presented in a
format to facilitate ready interpretation and use on the part of counselors and fieldtesting and educator personnel. Conclusions and recommendations are solely thoseof the primary authors and in no way represent either official policy of the military
services or the Department of Defense.
/
APPROVED BY
I
HARRY D. WILFONG, PhD RALPH S. HOGGATTTechnical Advisor Colonel, USAFResearch Division , Commander
Armed Forces Vocational Testing Group Armed Forces Vocational Testing Group
a
SECURITY CLASSIFICATION OF THIS PAGE (When Data Entered)
REPORT DOCUMENTATION PAGEREAD INSTRUCTIONS
BEFORE COMPLETING FORM
I. REPORT NUMBER
TECHNICAL RESEMICH NOTE 74-3
2 GOVT ACCESSION NO. 3 RECIPIENT'S CATALOG NUMBER
4 TITLE (and Subtitle)PERCENTILE NORMATIVE TABLES
FOR THEARMED SERVICES VOCATIONAL APTITUDE BATTERY
,
, ...,(1973-7.4 SCHOOL YEAR DATA BASE)
5 TYPE OF REPORT & PERIOD COVERED
FINAL Sep 73 - March 74
6 PERFORMING ORG REPORT NUMBER
7 AUTHOR!,)HARRY D. WILFONG
RONALD J. ARMSTRONG, CAPT, USMCRAYMOND K. HUCKELL, JR., CFC, USA
13 CONTRACT OR GRANT NUMBER(4)
PERFORMING ORGANIZATION NAME AND ADDRESS
RESEARCH DIVISIONARMED FORCES VOCATIONAL TESTING GROUP
RANDOLPH AIR FORCE BASE, TEXAS
10. PROGRAM ELEMENT. PROJECT. TASKAREA & WORK UNIT NUMBERS
VTG - 100
11 CONTROLLING OFFICE NAME AND ADDRESS 12 REPORT DATE
December 197413. NUMBER OF PAGES
91
14 MONITORING AGENCY NAME a ADDRESS(/f different from Controlling Office) IS SECURITY CLASS. (of this report)
UNCLASSIFIED
15a DECLASSIFICATION DOWNGRADINGSCHEDULE
NOT APPLICABLE
16 DISTRIBUTION STATEMENT (of this Report)
APPROVED FOR PUBLIC RELEASE; DISTRIBUTION UNLIMITED
17 DISTRIBUTION STATEMENT (of the abstract entered in Block 20, if different from Report)
18 SUPPLEMENTARY NOTES
19 KEY WORDS (Continue on reverse side 'f necessary and identify by block number)
20 ABSTRACT / Continue on revers, Bide if necessary and identify by block number)
A previous report (Wilfong and Armstrong, 1974) summarized empiricalnorms for 870,000 students tested on the Armed Services Vocational AptitudeBattery (ASVAB) Form 1, during school year 1972-73. The current report sum-marizes test performance for 771,031 students tested on ASVAB Form 2 during3( )o1 year 1973-74, with separate normative tables provided by sub-test,aptitude compolrlite, grade, sex and geographic region. New data are provided
for ninth grade and p,,st-hig,h school student:-1.
IDD FORM1 JAN 73 1473 EDITION OF I NOV 65 IS OBSOLETE
4 SECURITY CLASSIFICATION OF THIS PAGE (When Data Entered)
SECURITY CLASSIFICATION OF THIS PAGE(When Date Entered)
20. ABSTRACT (COIVTINUED)
Information contained in the tables parallel percentile scores reportedfor individual students to be tested with ASVAB in school year 1974-75% Per-::.
centile tables in the present report are designed for use by high school coun-selors as an int.rpretative guide and a supplemental reference to the AFVTGcomputer printout of student test scores.
Users are cautioned that 1974-75 represents the first time ASVAB percentilescores are to be computed around empirically developed student norms ratherthan representative service derived mobilization population samples. As such,
the data are not representative of the total available high school population,but do characterize actual test performance of students examii,ed during thepreceding year's test cycle. Additionally, where individual test score com-parisons from one year to the next may be required, the 1974-75 ASVAB percentilereports will represent different levels of student perfOrmance over previousreports (i.e., prior to September 1974).
5 SECURITY CLASSIFICATION OF THIS PAGE(When Deraitintered)
PREFACE,
A primary responsibility of the Research Division, Armed FoicesVocational Testing Group, is the publication and distribution of in-terpretative data associated with ,administration of the Armed Serv-ices Vocational Aptitude Battery (ASVAB). Data contained inIthetables of this report summarize test results for 771,031 studentstested on ASVAB, Form 2 only, during school year 1973-74. Thesetables are designed as a basic supplement to the technical appendixcontained in the High School Counselor's Manual (DOD 1304.12X,1973-74 edition).
Data contained in this report are intended for release to and appli-cation by high school ASVAB users. Normative data containedherein parallel individual student test results, reported in percent-iles, as prjnted on the counselor's copy a the ASVAB computerprintout for school year 1974-75.
The tabular information contained in this research note has beenextraeted from the ASVAB historical tapes maintained by the Com-
--------putational Sciences Division, Air Force Human' Resources Labora-tory, AF SC, Lackland Air Force Base, Texas.
This technical research note has been conducted as a subpart ofAFVTG research project unit 100, under guidelines prescribedthrough Department of Defense Instruction 1304.12 (December1972).
6
ii
ABSTRACT
A previous report (Wilfoiig and Aripstrong, 1974) summarized em-pirical norms for 870,000 students teaed on the Armed Services Vo-cational Aptitude Battery (ASVAB) Form 1, during school year 1972-73. The current report summarizes test performance for 771,03, stu-dents tested on ASVAB Form 2 during school year 1973-74, withseparate normative tables provided by subtest, aptitude compbsite,grade, sex, and geographic region. New data are provided for ninth,grade and post-high school students.
Information contained in the tables parallel percentile scores re-ported for individual students to be tested with ASVAB in schoolyear 1974-75. Percentile tables in the prese report are designed foruse by high school counselors as an interpretative guide and a sup-plemental reference to the AFVTG computer printout of studenttest scores.
Users are cautioned that 1974-75 represents the first time ASVABpercentile scores are to be computed around empirically developedstudent norms rather than representative service derived mobiliza-tion population samples. As such, the data are not representative ofthe total available high school population, but do characterize ac-tual test. performance of students examined during the precedingyear's test cycle. Additionally, where individual test score compari-sons from one year to the next may be required, the 1974-75 ASVABpercentile reports will represent different levels of student perform-ance over previous reports (i.e., prior to September 1974).
7
111
TABLE OF CONTENTS
Page
4. Introduction and Background 1
A. Contrast Between Forms 1 and 2, ASVAB 1
B. Computation of. Composite Percentiles 2
II. Method of Sampling 3
III. Results (Development of ASVAI3 Reference Tables) 6
IV., Interpretation 7
A. Subtest Scores 7
B. Use of ASVAB Composites 9
LIST OF FIGURES
Figure 1. Counselor Printout Guide 8
LIST OF TABLES
Table 1. Distribution of P Values for ASVAB, Form 1for an Unrestricted Sample of Navy Recruits 1
Table 2. High School Aptitude Conversion Formulas 2
Table 3. Number Schools (Sampling Units) and Students Tested byGrade - ASVAB, Form 2, SY 1973-74 3
Table 4. Nation-Wide Test Performance,Students Tested on Form 1, (SY 1972-73) vs Form 2 (SY 1973-74) , 6
Tables 1 thru 9: Raw Score to Percentile Conversions bySubtest, Grade, and Grade/Sex
Table 1: Coding Speed , A2-1Table 2: Word Knowledge A2-5Table 3: Arithmetic Reasoning A2-6Table 4: Tool KnowledgeTable 5: Space Perception A2-8Table 6: Mechanical Comprehension A2-9Table 7: Shop.Information A2-10Table 8: Automotive Information . A2-11Table 9: Electronic Information
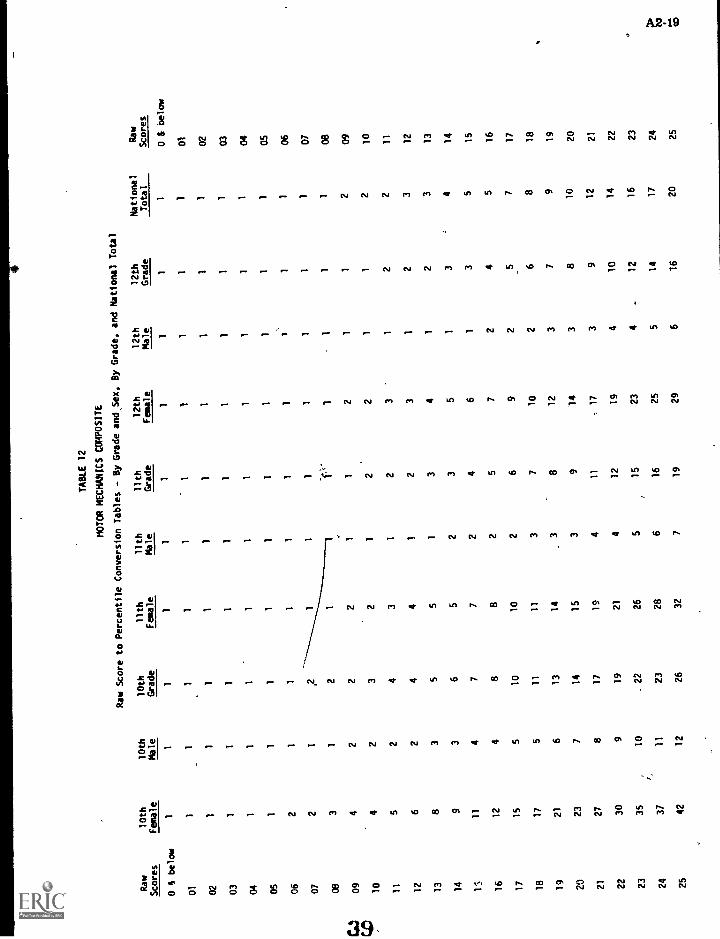
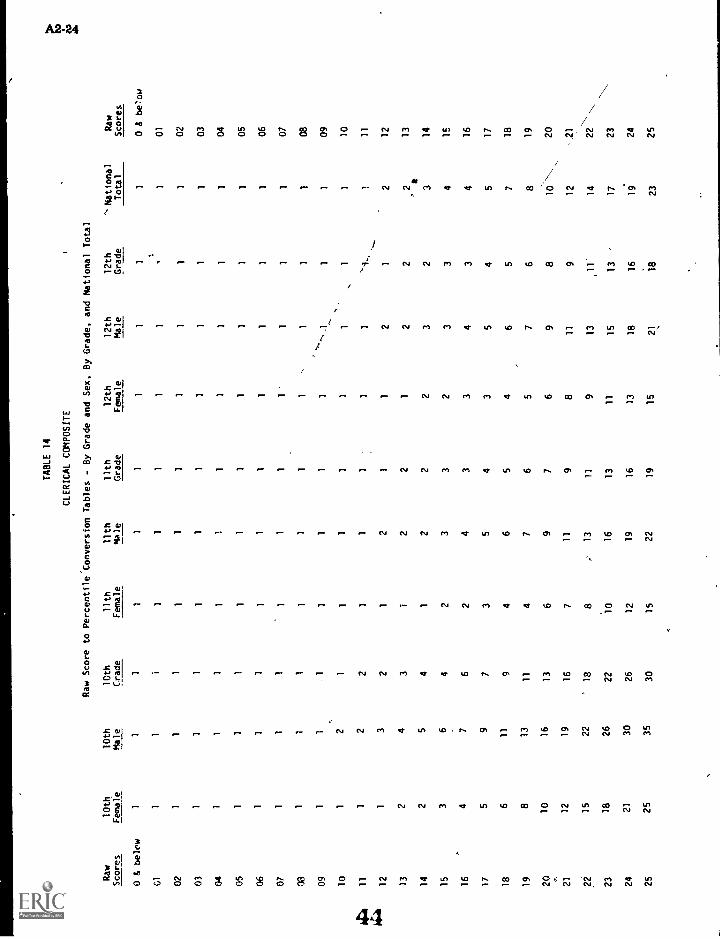
Tables 10 thru 14: Composite Raw Score to PercentileConversions by Grade and Grade/Sex
Table 10: General Mechanical- A2-13Table 11: Electronic A2-16Table 12: Motor Mechanics , A2 -19Table 13: General Technical A2-22Table 14:, Clerical, . A2-24
iv
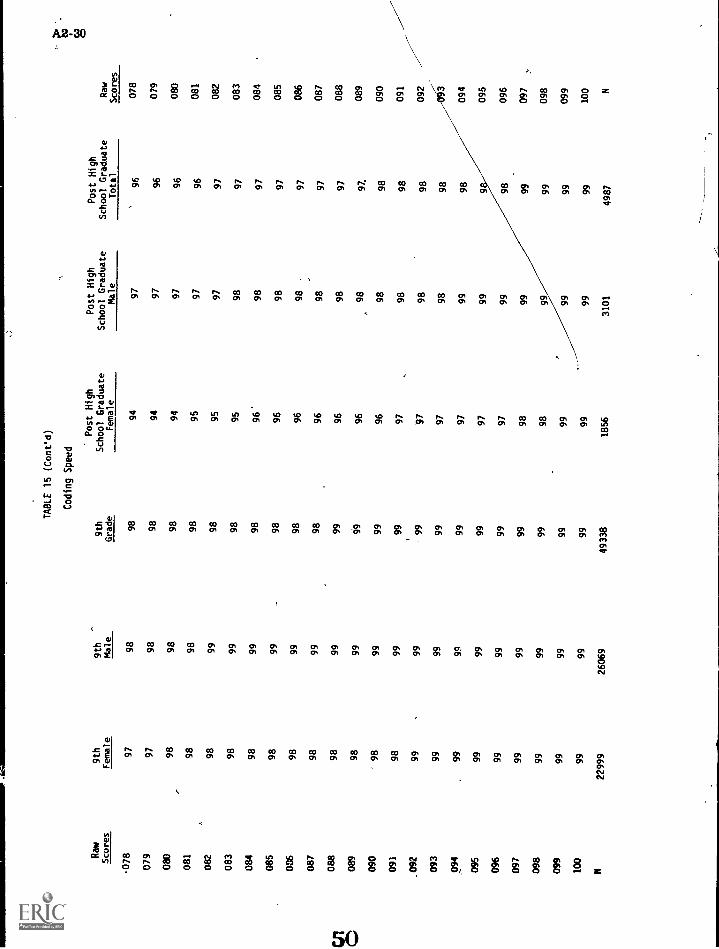
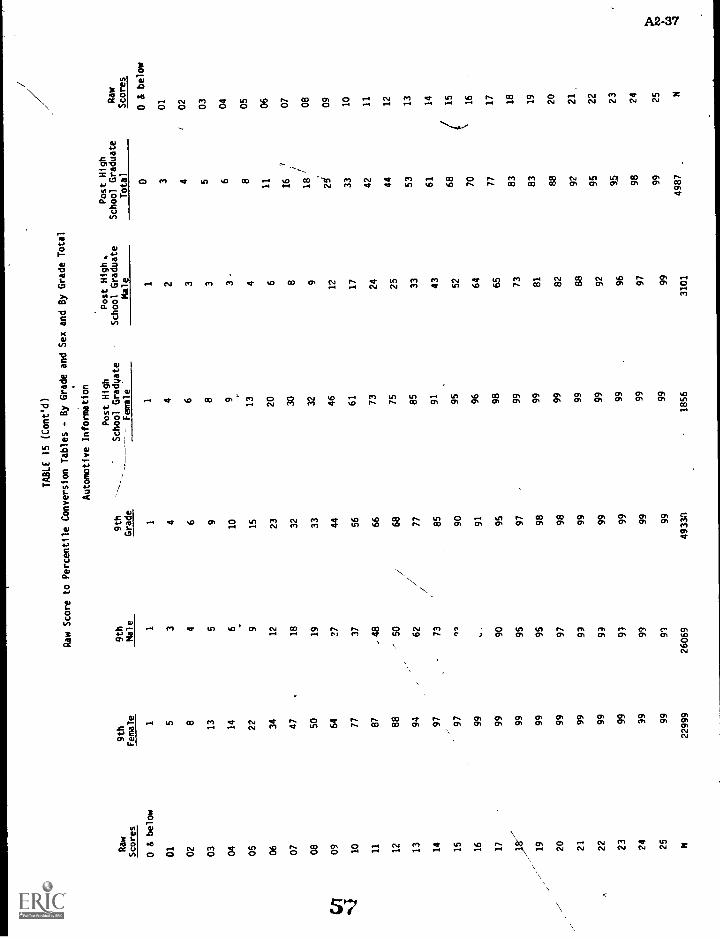
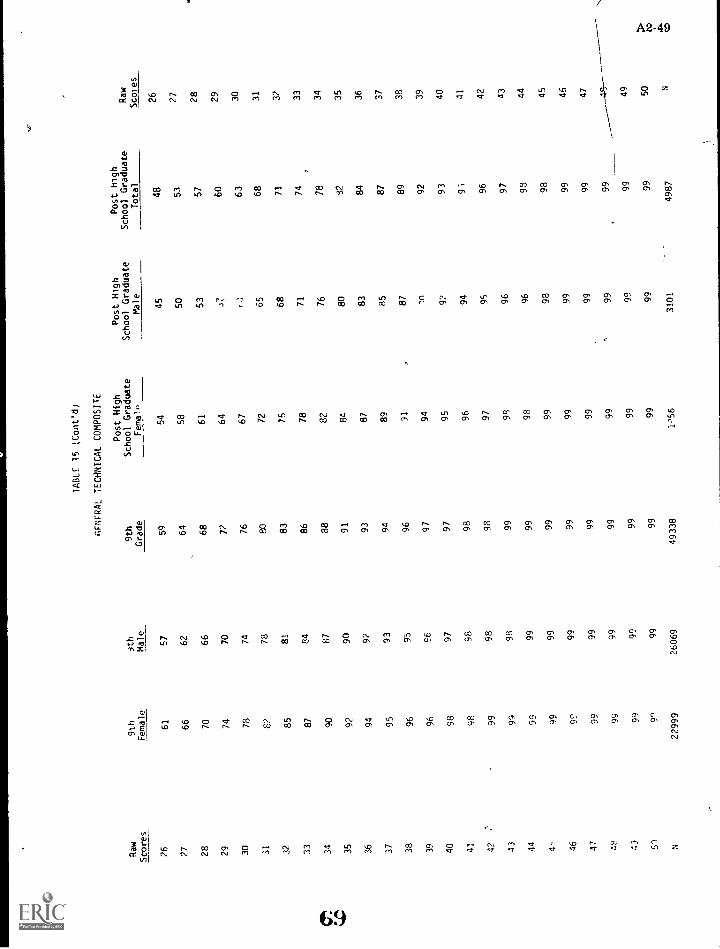
PageTable 15: Raw Score to Percentil:, Conversions by
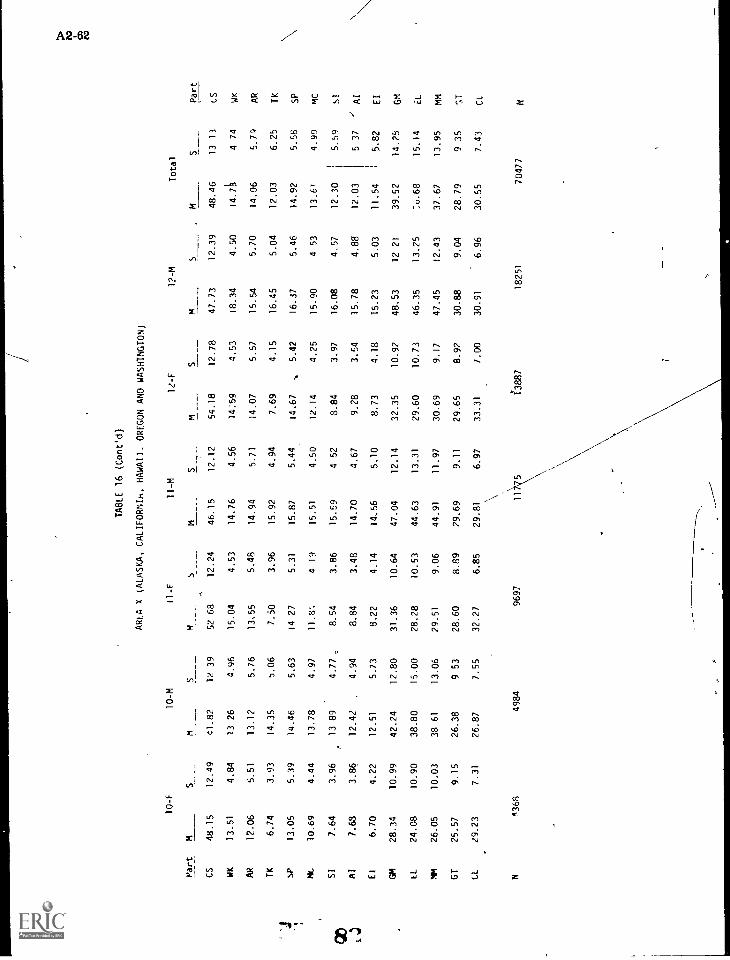
Composite and Subtest; Ninth Grade and Post-High School A2-27Table 16: Means and Standard Deviations by Subtest
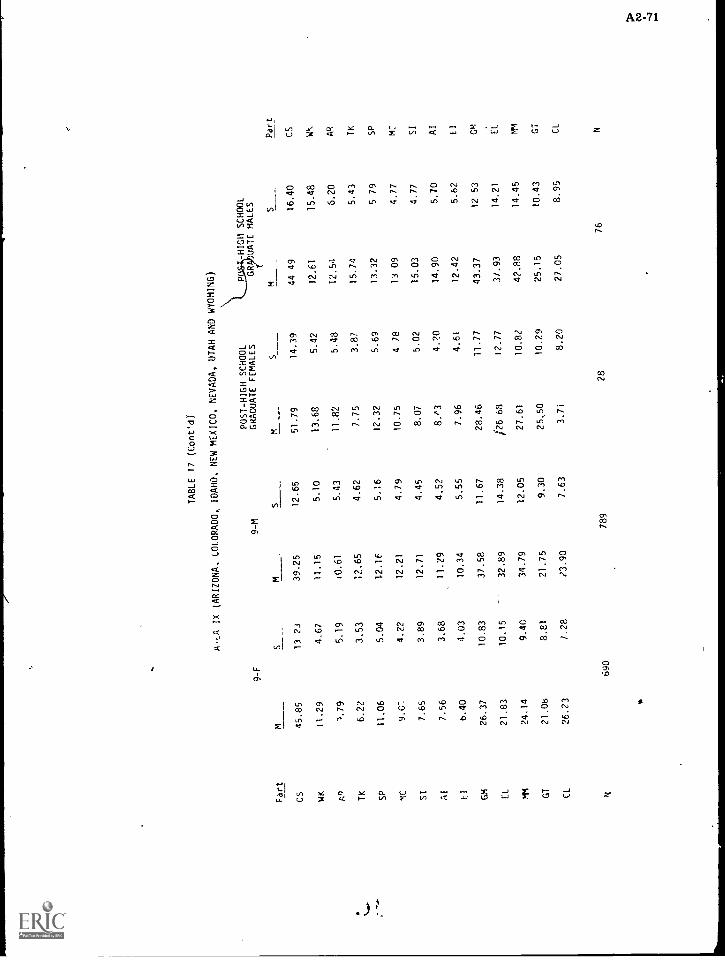
and Composes by Geographic Region A2-53Table 17: Means and Standard Deviations by Subtest and Composite
by Geographic Region for Ninth Grade and Post-High School A2-63Table 18: Means and Standard Deviations by Grade and Sex
by St btest and Composite on a National Basis A2-73Table 19: Means and Standard Deviations by Grade and Sex
by Subtest and Composite for Ninth Grade and Post-High School A2-74
9
PERCENTILE NORMATIVE TABLES7-40R THE ARMED SERVICES VOCATIONAL APTITUDE BATTERY
(1973-74 SCHOOL YEAR DATA BASE)
I. INTRODUCTION AND BACKGROUND
The initial standardization sampleused in computation of norms for theArmed Services Vocational AptitudeBattery (ASVAB) as described in Bayroffand Fuchs (1970) has been used as a basisfor percentile conversions of raw scoredata from 1968 through school year (SY)1972-73. During this same time frame,the version of the battery used opera-tionally in the Department of DefenseHigh School Testing Program wasASVAB-Form 1. A description of each ofthe nine, subtests (i.e., aptitude scales)
Comprising the battery is summarized inAppendix 1.
Form 2 of the ASVAB was introducedinto the high school testing program inSeptember 1973, and was the basic bat-tery in use during SY 1973-74. The pri-mary objective of this report is to sum-marize reference statistics, in tabularformat, on Form 2 of the ASVAB basedon actual student samples tested duringSY 1973-74.
A. Contrast between Forms 1 and 2,ASVAB: Based primarily on researchfindings using unrestricted samplos ofNavy recruits (Thomas, 1970), items forinclusion in Form 2 - as extracted frompre-existing item pools - were selectedaround a dec.eased level of difficulty
Table 1
DISTRIBUTION OF P VALUES FOft ASVAB, FORM 1,FOR AN UNRESTRICTED SAMPLE C NArf RECRUITS (N = 2,274) *a
Sub-test 20-29
Number of Items by
30-39 40-49 50-59
Value Range
60-69 70-79 80-89 90-99
MeanP
Value
WK 1 12 2 9 1C .82
AR 2 4 1 5 3 4 6 .71
,T3 5 2 3 4 8 .73
SP' 1 5 1 2 4 7 5 .70
MC 1 3 3 5 2 4 7 .70
SI(,`:
4 3' 3 2 2 2 9 .69
Al 1 1 4 (4 3 3 6 3 .67
El 1 3 4 1 3 6 7 .69
TOTAL 5 22 21 11 22 22 42 55 .71
*a Adopted from Thomas, P. J. Naval Personnel and Training Retearch
Laboratory, San Diego, California, January 1970.
10
2
(i.e., p-values) in relationship to Form 1.Ranges of p-values represented in theForm 1 version of the battery are shownin Table 1:
There are two subtests in Form 2 wherethe revised difficulty levels as rem*.mended by Pat Thomas (1970) were-notapplied: Coding Speed (OS), -because ofits speeded nature renders establishmentof individual item p-values unnecessary,and/ the difficulty level of the WordKnowledge (WK) subtest was, con-versely, increased to improve both us-able test variance and face validity.
It is essential that the ASVAB user un-derstand the underlying nature of thesedifferences between the two forms of thebattery because year-to-year normativescales and individual scores change ac-cordingly. In both cases, the content ofthe scales (viz. aptitude dimensionsmeasured) and the scoring formulae(Rights minus 1/3 Wrongs except for the
Coding Speed subtest) remained con-stant.
B. Computation of Composite Percent-iles. An additional administrative changewas affected to the computerized scoringroutine which also had a definite, butlimited, impact upon ASVAB score dis-tributions between SY 1973-74 and SY1974-75. Due to the availability of empiri-cal norms of actual student performanceby grade, computation of percentiles forreporting to counselors and students was.modified to an actual percentile equationsystem - by grade and sex - built aroundthe tables shown in this research note.Table 2 shows composite computationalformulae previously used during SY1973-74 and earlier, and the new for-mulae, implemented in September 1974for cbmparative purposes. The statisticalimp ' t of application of the new equa-tion7 is to slightly compress each dis-tribution around the mean (when com-pared to compositing formulae appliedbefore\ September 1974).
Table 2
HIGH SCHOOL APTITUDE CONVERSION FORMULAS
Composite SY 1973-74 SY 1974 +
(EL) Electronics 2EI(%) + M&( %)\ 2E1 + MC
3
(GM) General Mechanical 2SI(%) + SP(%) 2SI + SP3
(MM) Motor Mechanical
(CL) Clerical
(GT) General-Technical
2A1(%) + MC(%) 2Ai + MC3
WK(%) + CS(%)2
WK(%) + AR(%)2
WK + CS3
WK + AR
11
II. METHOD OF SAMPLING
Since the decision was Made to buildreporting percentiles around empiricalnorms established for each precedingschool year; by definition, the samplingpopulation consisted of all studentstested on ASVAB. In turn, the school inwhich ASVAB was administered becamethe individual sampling unit. Conditionsunder which the ASVAB was admin-istered varied from school to school asfollows: required testing of 'all students,grades nine through 12;, testing of onlyseniors interested in vocational careers;voluntary testing of onVy those studentsinterested in pursuing a military career;or testing of male st/niors only. The mostfrequently occurring; and the preferredmode of administrati6n was testing of allstudents, male and ftmale, in grades 10
3
and 12; with the senior administrationrepresenting a retesting of sophomorespreviously examined with the battery.
As a result of these differing modes oftesting; feV; if any, inferences can bedrawn concerning-the level of individualstudent motivation to perform at opti-mum levels on the battery. It is knownthat value of the results to the individualis strongly stressed during the stand-ardized ASVAB test a inistration in-structions and particip ion on the partof each student is strictly oluntary in ac-cordance with Departme Defensepolicy.
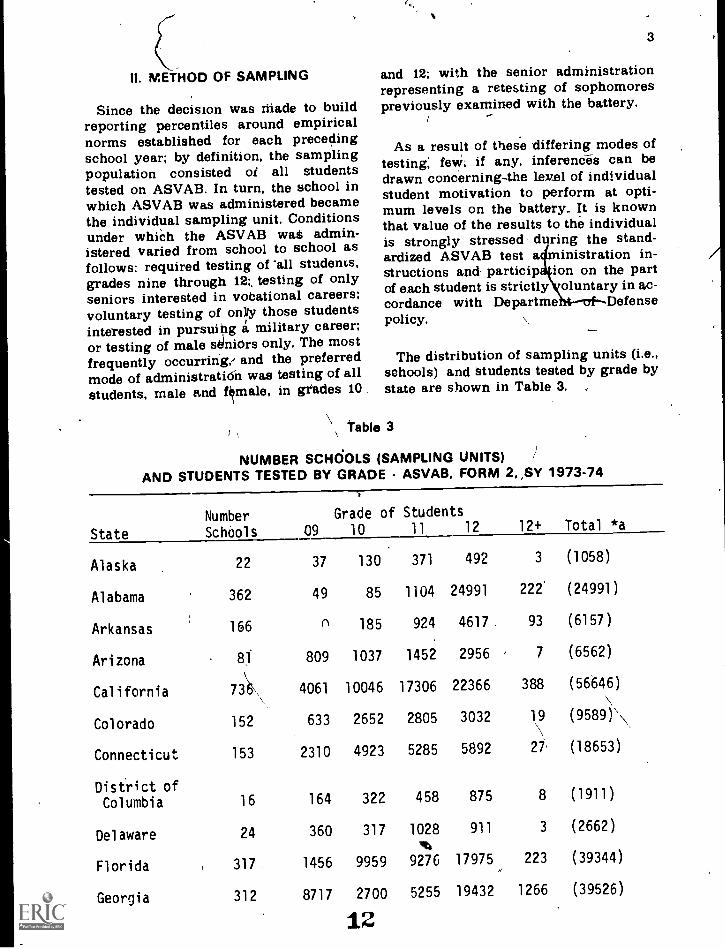
The distribution of sampling units (i.e.,schools) and students tested by grade bystate are shown in Table 3. ,
\ Table 3
NUMBER SCHOOLS (SAMPLING UNITS)AND STUDENTS TESTED BY GRADE - ASVAB, FORM 2,,SY 1973-74
State
Number
Schools 09
Grade of Students
10 11 12 12+ Total *a
Alaska 22 37 130 371 492 3 (1058)
Alabama 362 49 85 1104 24991 222 (24991)
Arkansas 166 0 185 924 4617 93 (6157)
Arizona 81 809 1037 1452 2956 7 (6562)
California 73k, 4061 10046 17306 22366 388 (56646)
North Carolina 204 1681 2786 3440 13312 74 (22029)
,North Dako 179 28 174 2311 3400 19 (6275)
Nebraska 269 778 3065 2872 5537 73 (12825)
New Hampshire 78 526 25U0 1832 1452 9 (6751)
New Jersey 237 1367 4011 6223 9669 132 (22339)
New Mexico 50 433 1665 924 1687 4 (4779)
Nevada 43 502 2645 821 , J 2 (4816)
New York 693 2499 7973 15809 13495 :166 (41277)
Ohio 477 3585 5970 9795 19858 139 (41467)
Oklahoma 108 31 1224 1224 4252 21 (7056)
Oregon 143 476 996 2319 3114 j 10 (7204)
Pennsylvania 576 "'------7835 10937
Rhode Island 4 1363
South Carolina 196 722 1147
South Dakota 111 33 758
Tennessee 156 518 465
Texas 474 4265 11016
Utah 70 .68 790
Virginia 223 129 3731
Virgin Islands 2 0 1
Vermont 60 11 1507
Washington 264 57 1223
Wisconsin 158 163 745
West Virginia 151 1388 4490
Wyoming 41 77 98
Puerto Rico 22 0 2
TOTAL 10783 59426 148607
13451
403
2863
1442
1819
10334
1376
4411
.253
598
4987
2306
2593
593
149
209045
31459 194 (66323)
1351 8 (3225)
10643 193 (16593)
2197 5 (4586)
11923 123 (15325)
21937 728 (50117)
1998 37 (4410)
13461 364 (22878)
199 2 (455)
917 3 (3139)
8700 59 (15394)
3426 57 (6824)
6759 41 (15829)
1041 8 (1875)
574 70 (802)
415730 5986 (872493)
*a Total row values are not summation of individual grades but include,*
students tested whodid not indicate grade on the ASVAB answer card.
Refer to footnote 1 for a detailed description of reasons for the
difference between total students tested on ASVAB-2 (N= 872,493) and
the 771,031-cases used in the sample(s).
+ column in Table 3), caution mustbe exercised in generalizing these data
' to any nation-wide populations. A stand-ard part of the ASVAB test administra-tion instructions directs students to codethe last grade completed on the answercard as the ,indicator of current gradelevel and some of the responses coded atthe post-secondary level may represent
During SY 1973-74, a total of 1,100,248students were tested on both Forms (1And 2). qf -the battery. Of this number,872,493' (89.3%) were tested on Form 2.Of the students tested on Form 2, 476,017
(or 54.55 percent) were males.
Although test norms are reported forstudents in a post-high school status (the
5
14
6
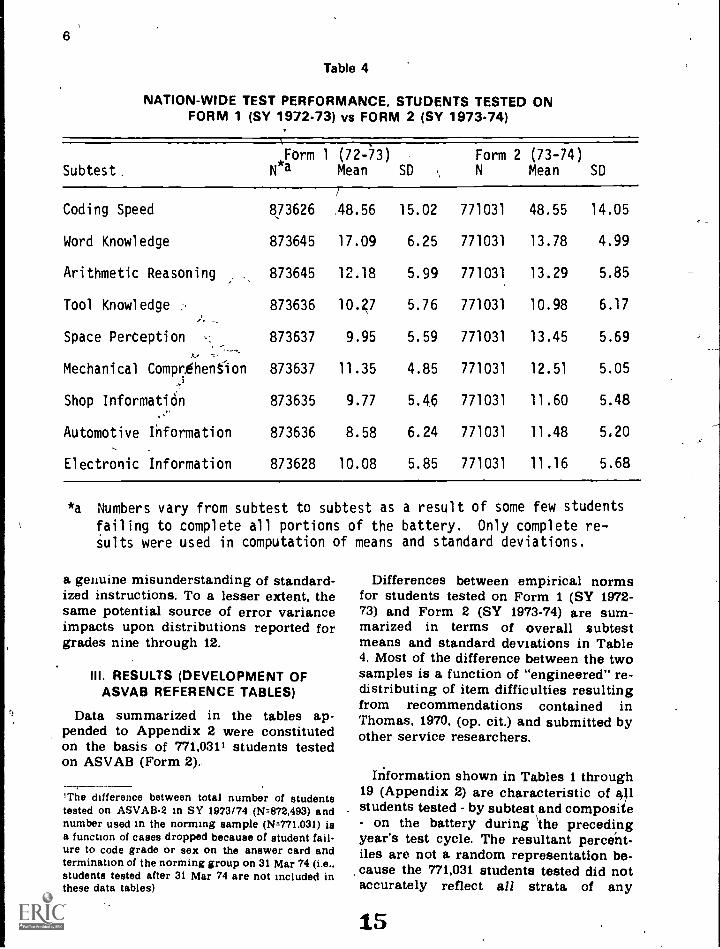
Table 4
NATION -WIDE TEST PERFORMANCE, STUDENTS TESTED ONFORM 1 (SY 1972-73) vs FORM 2 (SY 1973-74)
Shop Information 873635 9.77 5.46 771031 11.60 5.48
Automotive Information 873636 8.58 6.24 771031 11.48 5,20
Electronic Information 873628 10.08 5.85 771031 11.16 5.68
*a Numbers vary from subtest to subtest as a result of some few students
failing to complete all portions of the battery. Only complete re-sults were used in computation of means and standard deviations.
a genuine misunderstanding of standard-ized instructions. To a lesser extent, thesame potential source of error varianceimpacts upon distributions reported forgrades nine through 12.
III. RESULTS (DEVELOPMENT OFASVAB REFERENCE TABLES)
Data summarized in the tables ap-pended to Appendix 2 were constitutedon the basis of 771,031' students testedon ASVAB (Form 2).
The difference between total number of studentstested on ASVAB-2 in SY 1973/74 (N=872,493) andnumber used in the norming sample (N=771.031) isa function of cases dropped because of student fail-ure to code grade or sex on the answer card andtermination of the norming group on 31 Mar 74 (i.e.,students tested after 31 Mar 74 are not included inthese data tables)
Differences between empirical normsfor students tested on Form 1 (SY 1972-73) and Form 2 (SY 1973-74) are sum-marized in terms of overall subtestmeans and standard deviations in Table4. Most of the difference between the twosamples is a function of "engineered" re-distributing of item difficulties resultingfrom recommendations contained inThomas, 1970, (op. cit.) and submitted byother service researchers.
Information shown in Tables 1 through19 (Appendix 2) are characteristic of aIlstudents tested - by subtest and composite- on the battery during \the precedingyear's test cycle. The resultant percent-iles are not a random representation be-cause the 771,031 students tested did notaccurately reflect all strata of any
15
nation-wide population who might be ex-___pected cto eventually take ASVAB, butthey are true empirical norms:
Tables in Appendix 2 are:,
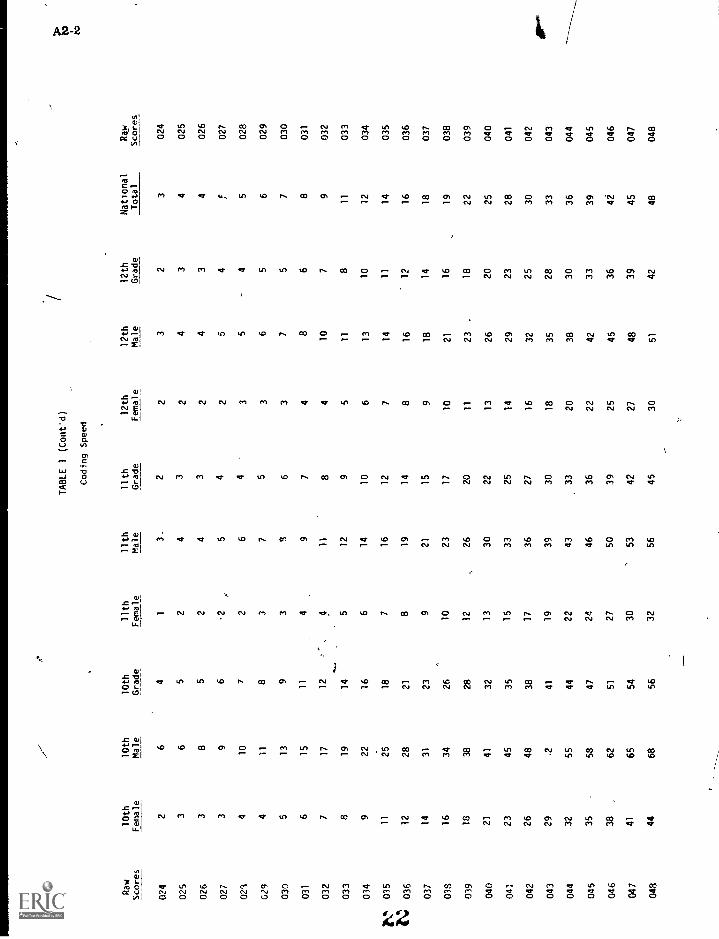
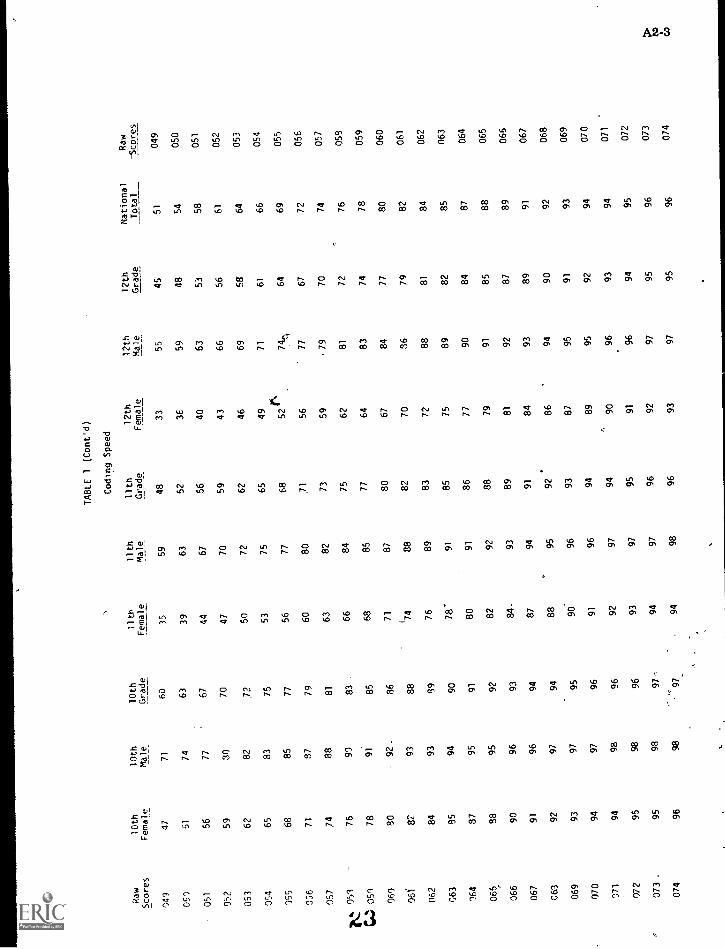
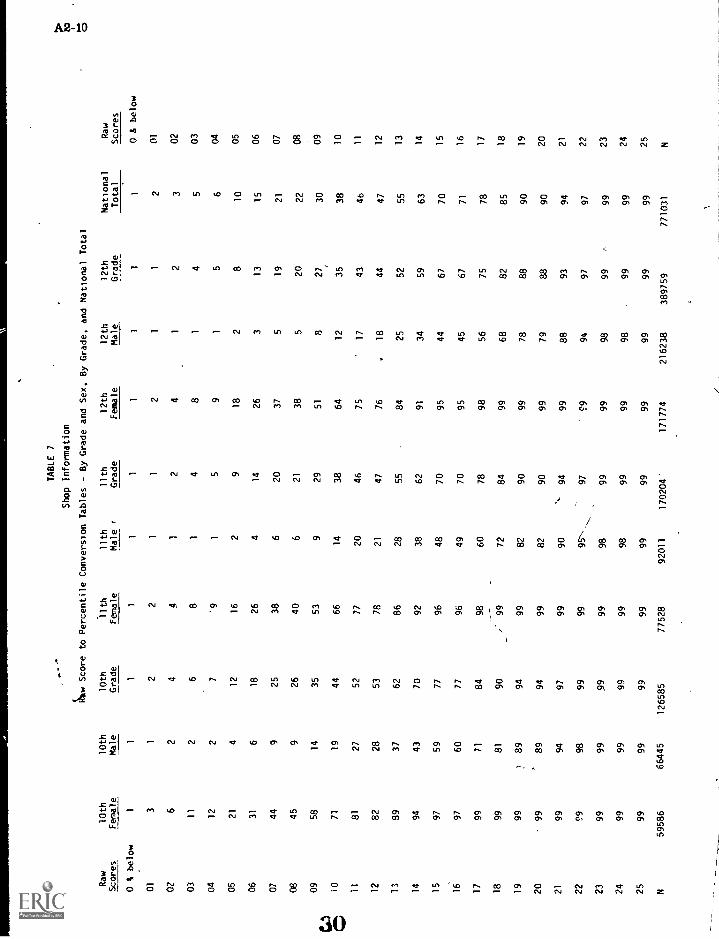
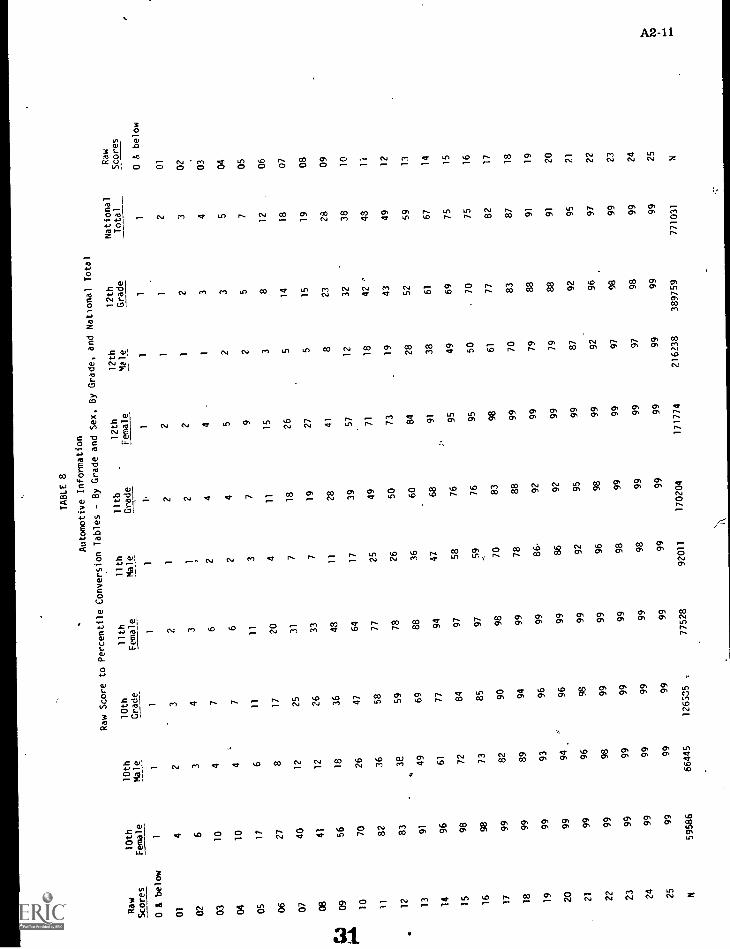
Tables 1 -9:; Show raw score to percent-ile conversions by subtest recorded bygrade and sex. Separate conversions arerecor' ,l by: grade and sex, overallgrade, and total national percentiles.
Tables 10-14: Reflect the same infor-mation as shown in Tables 1 through 9,but report percentiles for each of the fiveASVAI3 composites. Actual scores re-ported on the student record portion ofthe gummed label printout provided byAFVTG to high school counselors are,ex-tracted from these tables. Data in Tables1 through 14 serve as the norming basefor constitution of the counselor's por-tion of the gummed label printout.
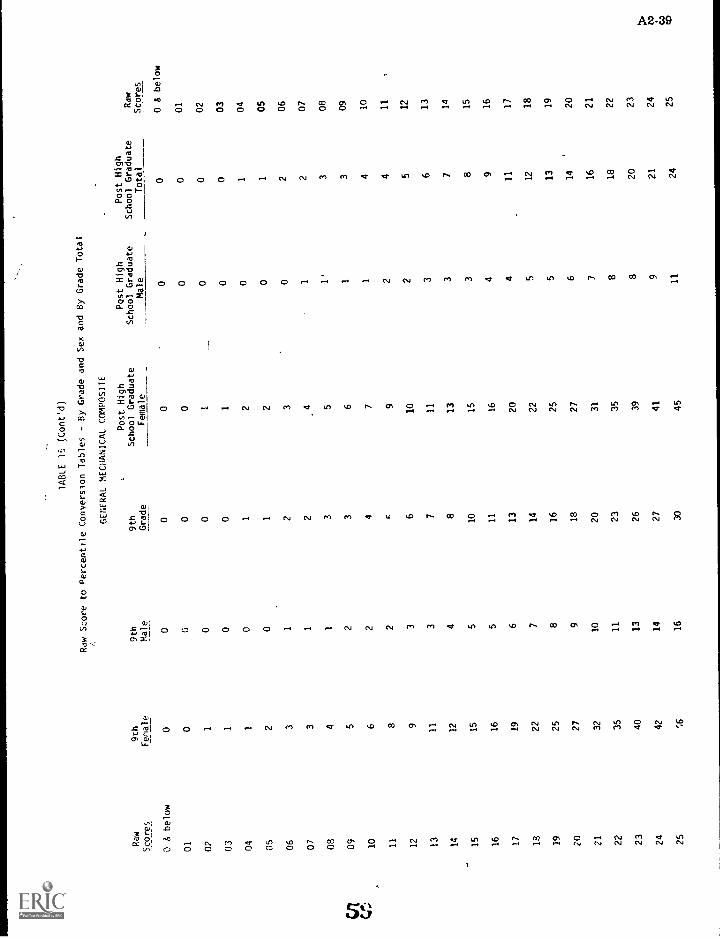
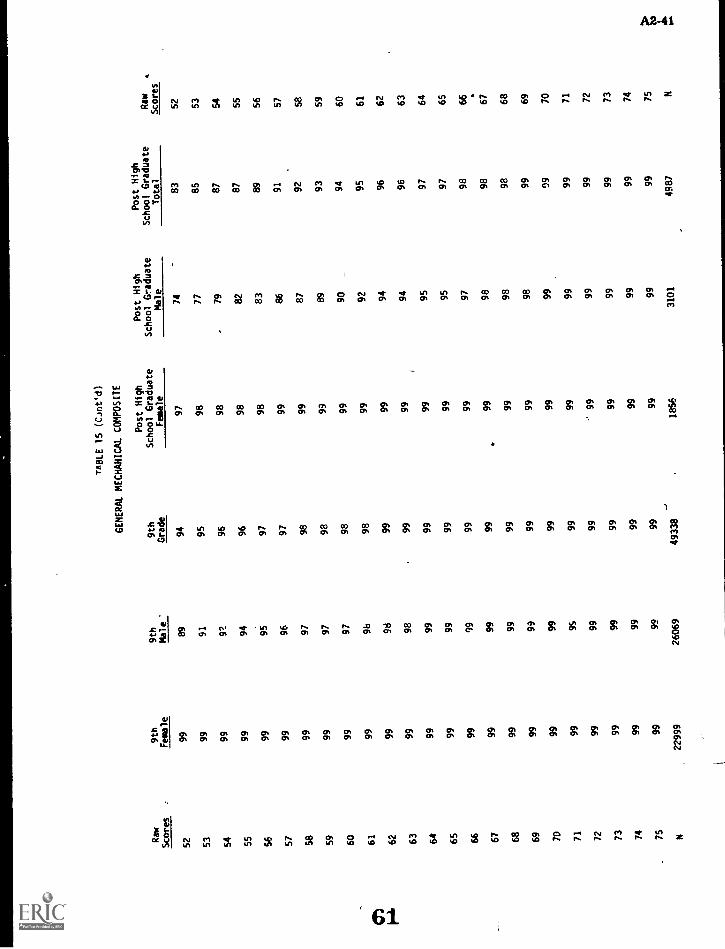
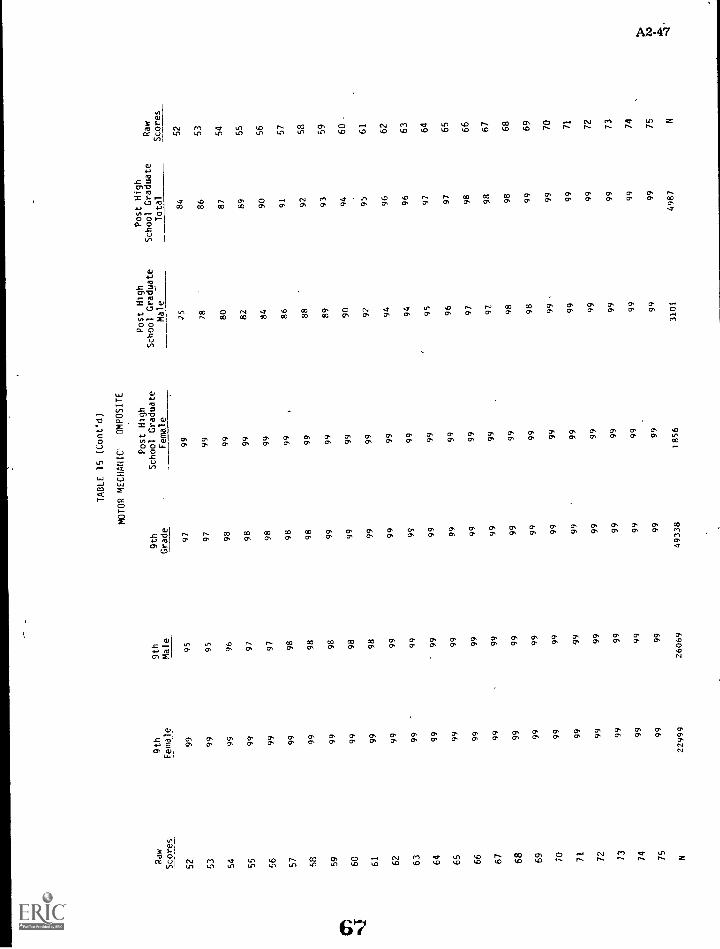
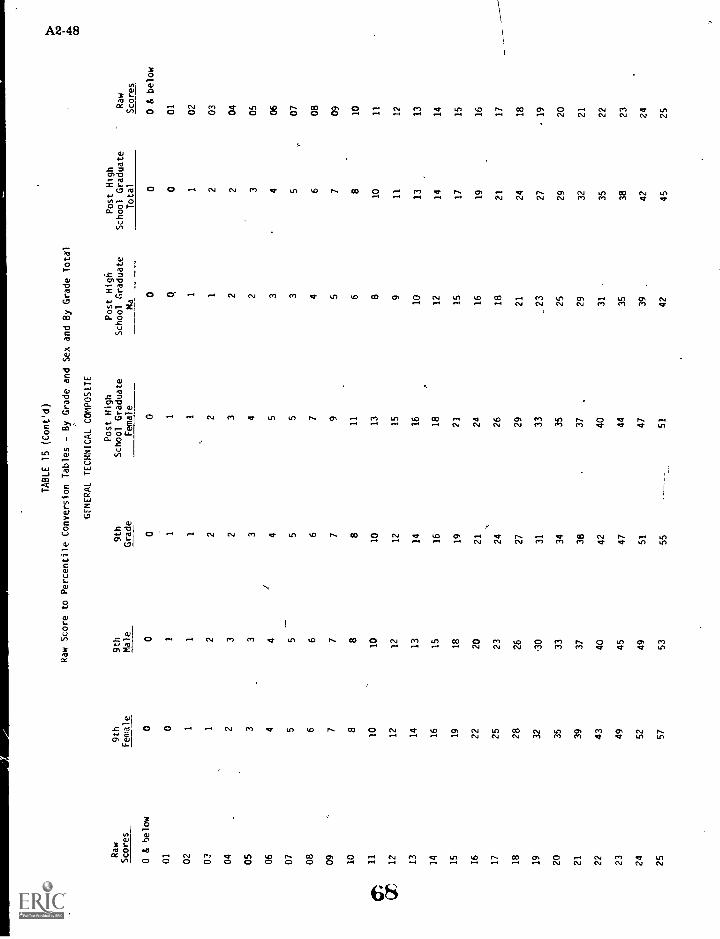
Table 15: Shows raw score to percent-ile conversions on subtests and compos-ites for ninth graders and post-highschool graduates only. As indicated ear-lier, cautkon should be used in general-izing from these data to any nation-widepopulations. It is further stressed that ap-plicability of ASVAB at the ninth gradelevel has yet to be established.
Tables 16-17: Show overall means andstandard deviations by subtest and com-posite by geographic grouping forgrade and sex. To the extent that pre-scribed geographic regions representcompetitive labor markets, these dataare expected to serve as an, overall oc-cupational "expectancy" norming refer-ent. The groupings of states in each ofthe ten regions were defined in accord-ance with the first number in the five-digit zip code system prescribed by theUS Postal Service, This process was usedprimarily due to the simplicity in extract-ing data from historical ASVAB com-puter banks2,
2Seporate raw score to percentile conversion tableshave been prepared for geographic region to dis-play '-'formation :- by region as shown in Tables 1through 14 in Appendix 1. These tables are avail-able from the Armed Forces Vocational TestingGroup upon request
16
7
Tables 18-19: Report subtest and com-posite means and standard deviations bygrade and sex for nation-wide samples.
IV. INTERPRETATION
The ASVAB percentile tables sum-marized in this report are not self-inter-preting, in that the manner in which atest score is reported to a student repre-sents a descriptive rather than an abso-lute indicator of aptitude performance.
Percentile tables do indicate levels ofachievement relative to known samplesof students who have previously takenASVAB. The data are also useful in de-fining the range of scores, extent ofskewness, and areas of restricted'vari-ance. Users are referred to classical Psy-chometric texts, such as Guion (1965)," ,
Cronback (1960), or Anastasi (1970) for amore complete discussion of normativeinterpretation.
A. Subtest Spores: As part of a pro-grammed annual reissue of studentASVAB normative data, based uponsamples tested during each precedingschool year, both total. sample N's andassociated percentile scales are expectedto display moderate fluctations. In this'respect, yearly changes in this nation-wide standardized examination shouldbe expected in successive AFVTG Tech-nical Research Notes.
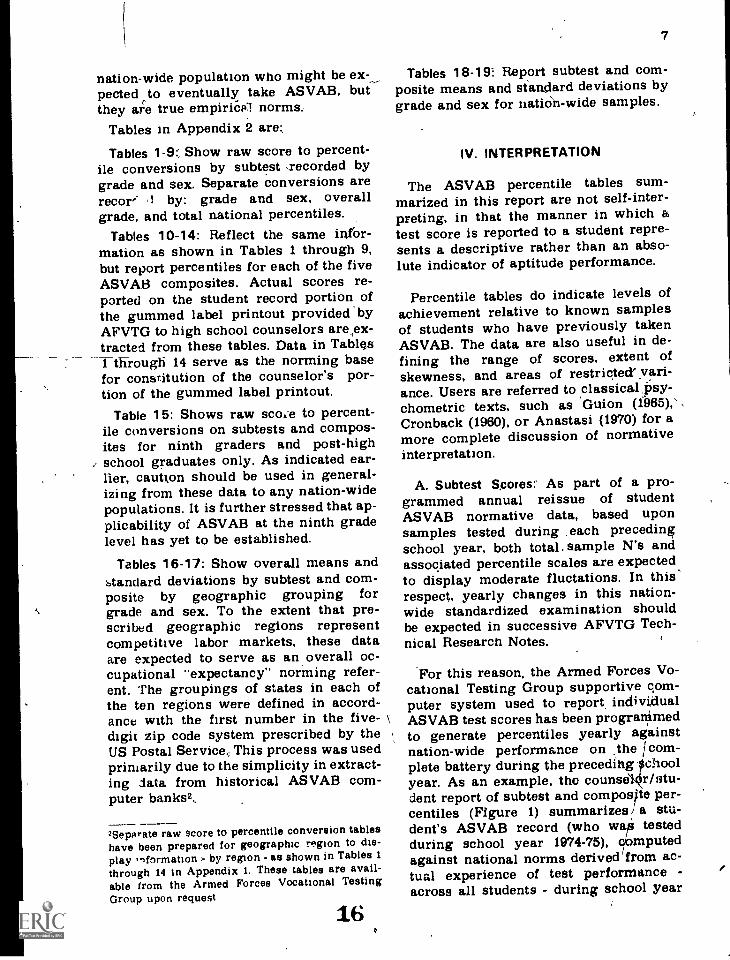
For this reason, the Armed Forces Vo-cational Testing Group supportive com-puter system used to report, individualASVAB test scores has been prograMmedto generate percentiles yearly againstnation-wide performance on the /com-plete battery during the precedihg fohoolyear. As an example, the counselk/stu-dent report of subtest and composite per-centiles (Figure 1) summarizes/ a stu-dent's ASVAB record (who wtestedduring school year 1974-75), computedagainst national norms derived from ac-tual experience of test performance -across all students - during school year
8
COUNSELOR PRINTOUT GUIDE
Student's Name ° Sex Highest Grade Comp Social Security Number
1973-74 as aisplayed in the tables con-tained in this report. Similarly, percent-ile scores reported for individuals to betested in SY 1975-76 will be based onempirically available norms computedupon 1974-75 ASVAB test performancefor both subtest and composite scores.
Individual student ASVAB scores as re-flected in Figure 1 are related to varyinglevels of nation-wide samples as follows(Sample sizes are shown in Tables 18and 19, Appendix 2).
1. The first value reported for sub-tests is attained raw score where thecomputational formula is Rights minus1/3 Wrongs (except for the CodingSpeed subtest). These scores are pre-sented for the benefit of those schools/districts/states desiring to transform at-tained values to other normative scales(e.g., Stanine scales, Z scales, normal-ized percentiles, and similar standard-ized scales).
CS
WK
ARTKSPMC
SI
AlEl
SUBTESTS
- Coding Speed- Word Knowledge- Arithmetic Reasoning- Tool Knowledge
Space Perception- Mechanical Comprehension- Shop Information
Automotive Information- Electronics Information
2. The second reported subtest valueis a percentile score based upon all in-dividuals tested on .ASVAB during thepreceding school year. As mentionedpreviously, these percentile ranks._ em-brace a range from ninth grade throughjunior college, technical institute, orcommunity college.
3. The second percentile rank re-poxted (i.e., the third value shown on theprintout for each student) represents allindividual scores by subtest, by grade.Since the majority of persons testedwith ASVAB fall between grades 10through 12, percentiles (Tables 1-14) arerestricted to these levels.
4. The final score recorded for eachstudent reflects nation-wide percentilesfor both grade and sex: As a counselingaid, various combinations of tabled per-centiles may prove useful in aiding stu-dents in career decision. For example, in
17
counseling an 11th grade female inter-ested in possible entry into the Electron-ics field, it may be desirable to contrasther attained scores against percentiledistributions for 12th grade males, sincethe latter group best represents a real-istic pool of competitors for initial en-trance into the labor market.
B. Use of ASVAB Composites: Oc-cupational placement and vocationalcounseling are more efficiently accom-plished on the basis of the results ofseveral measurements in combinationrather than on the score from a single
-scale (ors t lotest). The underlying ration-ale is that most occupations involvemultiple combinations of aptitudes,skills, and 4bilities; that is, they are fac-torially complex, involving interaction ofseveral di/ent types of learning andenviro)iment experiences. It is also em-phasized that the initial conceptualiza-tion involved in formulating ASVAB(Bayroff and Fuchs, 1970) assumed thatoptimum validity for the battery wouldbe best achieved through combination ofsubtests into composites. For these rea-sons, it is the aptitude composite thatpossesses maximum utility for studentcounseling; and, in turn, normativescales for the separate composites in thissummary have the most valid basis, forinterpretation. Additionally, the variousvalidity studies thus far conducted onASVAB as related to criteria of academic(Harris and Huckell, 1974) or training(Vitola, Mullins and Croll, 1973;... andThomas, 1970, op. cit.) report validity, onthe battery only in terms of compositetest performance. As an added aid tocounselor interpretation, the followingsupplemental description of the fiveASVAB student composites should be re-viewed in relationship to specific per-centile norms as reported in the varioustables appended to this report.
1. General Technical (GT):, As dem-onstrated by Harris and Huckell, op. cit.,the general-technical composite bestrepresents the student's capability forpotential perfoguanee in occupational
18
9
areas requiring overall academic ability.The composite is composed of unitweighting the Word Knowledge (WK)and Arithmetic Reasoning (AR) subtestsbf ASVAB. Males and females performat essentially the same level, across allgrade levels, on this composite.
2. Clerical (CL): This compositemeasures the student's ability relevant toperformance in the range of clerical andadministrative occupations. The com-posite consists of the Clerical CodingSpeed (CS) and Word Knowledge (WK)subtests of the battery. On this com-posite it is to be noted that females con-sistently score higher than males.
3. Electronics (EL):i This compositemeasures student skills in terms of abil-ities related to electrical/electronicknowledge to include electrical theory,schematics, and test equipment. Thecomposite is computed from the Elec-tronic Information (El) and MechanicalComprehension (MC) subtests. On thiscomposite a distinct and significant dif-ference (p L .001) existed between maleand female test results, with males per-forming significantly higher.
4. General Mechanics (GM): This com-posite is correlated with perforMance re-quiring abilities in a variety of mechani-cal, skilled trades, and trade occupations(for sample vocational jobs }der to Vol-ume' II, DOD 1304.12Y, of the ASVABCounselor's Manual). The GM compositeconsists of the ASVAB Shop Information(SI) and Spatial Perception (SP) scales.As with the EL composite, the GM com-posite shows consistent differences be-tween male and female test perform-ance.
5. Motor Mechanics (MM): This com-posite measures skills, knowledge, andachievement related to engine, auto-motive, and mechanical repair operations- and related jobs. It is composed ofmeasures of Automotive Information(Al) and Mechanical Comprehension(MC). Again, Males consistently possesshigher mean scores than females.
10
As is the case with most nation-widestandardized aptitude test batteries, in-terpretation of ASVAB against locallydeveloped and maintained test norms ishighly encouraged. It is at the local levelthat student test data can be comparedagainst other predictor variables such isactual classroom performance, outsideactivities. and similar noncognitive fac-tors; all of which are essential to he in-dividual guidance and coun elingprocess.
Bayroff, A. G., and Fuchs, E. F. TheArmed Services Vocational AptitudeBattery. Technical Research Report1161. US Army Behavioral and Sys-tems Research Laboratory, MilitarySelection Research Division, Arling-ton, Virginia, February 1970.
Cronback, Lee J. Essentials of Psychologi-cal Testing. New York: Harper andRow, 1960.
Guion, R. M. Personnel Testing. NewYork: McGraw-Hill, 1965.
Harris, R. K. and Huckell, R. K., Jr. Pre-dicting Academic Success in Second-ary Schools from the General Techni-cal Composite on the Armed ServicesVocational Aptitude Battery. TechnicalResearch Note AFVTG 74-2, ResearchDivision, Armed Forces VocationalTesting Group, Universal City, Texas,October 1974 (in press).
Thomas, Patricia J. A Comparison be-tween the Armed Services VocationalAptitude Battery and the Navy BasicTest Battery in Predicting Navy SchoolPerformance, Technical. Bulletin STB70-4. Naval Personnel and TrainingResearch Laboratory, San Diego,California, January 1970.
Vitola, B. M., Mullins, C. V., and Croll,P. R. Validity of Armed Services Voca-tional Aptitude Battery, Form 1, to Pre-dict Technical School Success, AFHRLTR-73-7, Air Force Human ResourcesLaboratory, AFSC, Lackland AFB,Texas, September 1973.
Wilfong, H. D. and Armstrong, R. J. Ref-erence Tables for the Armed ServicesVocational Aptitude Battery, Techni-cal Research Note AFVTG 74-1, Re-search Division, Armed Forces Voca-tional Testing Group, Universal City,Texas, March 1974.
19
A1-1
Appendix 1
DESCRIPTION OF ASVAB SUBTESTS
TESTS IN THE ARMED SERVICES VOCATIONAL APTITUDE BATTERY (ASVAB)
1. Coding Speed Test (CS). In this test there is a key and 100 items. The key is a groupof words with a code number for each word. Each item presents one word for whichthe examinee indicates the code number.
2. Word Knowledge (WK). Each item requires the examinee to select the correctsynonym for a specified word.
3. Arithmetic Reasoning (AR). Each item is a reasoning problem involving applica-tion of the arithmetic process.
4. Tool Knowledge (TK). Each item presents five drawings of various tools or shopequipment. The examinee indicates which of the four alternative drawings goes bestwith the lead drawing.
5. Space Perception (SP). Each item consists of five drawings: A pattern and fourboxes. The question to be answered is which one of the boxes can be made by foldingthe pattern.
6. Automotive Information (Al). Each item asks a question about the identificationor operation of automobile parts.
7. Shop Information (SI). This test has questions about shop practices and the use oftools. Many of the items contain drawings.
B. Mechanical Comprehension (MC). Each item, includes a drawing, or drawings, il-lustrating some physical principle and a question.
9. Electronic Information (El). This test has questions about elementary principles ofelectricity and about electrical/electronic devices, drawings, and equipment.
\
20
TABLE 1
Coding Speed
Raw Score To Percentile Conversion TaYles - By Grade and Sex, ByGrade, and National Total
Raw
10th
10th
10th
11th
11th
11th
12th
12th
12th
National
Raw
Scores
Female
Male
Grade
Female
Male
Grade
Female
Male
Grade
Total
Scores
000
11
11
11
11
10
000
001
11
11
11
11,
10
001
002
11
11
11
11
10
002
003
--1
11
11
11
11
0003
004
11
11
11
11
10
004
005
11
11
11
11
10
006
006
I1
11
11
11
0006
N007
11
11
11
11
10
007
II"
008
;1
11
11
11
11
0008
009
11
11
11
11
10
009
010
I1
11
11
11
11
010
011
11
11
11
11
11
011
012
11
11
11
11
11
012
013
11
11
11
11
11
013
014
11
11
11
11
11
014
015
12
1,
11
11
11
1015
016
12
I1
11
11
11
016
017
12
21
11
11
11
017
018
12
21
11
11
11
018
019
13
21
21
12
12
019
020
13
21
21
12
12
020
021
14
31
22-
12
22
021
022
24
31
22
12
22
022
023
25
31
32
13
23
023
TABLE 1
(Cont'd)
Coding Speed
Raw
Scores
10th
Female
10th
Male
10th
Grade
11th
Female
11th
Male
11th
Grade
12th
Female
12th
Male
12th
Grade
National
Total
Ray
Scores
024
26
41
3.
22
32
3024
025
36
52
43
24
34
025
026
38
52
43
24
34
026
027
39
62
.-
54
25
4r
027
023
410
72
64
35
-4
5028
029
411
83
75
36
56
029
030
513
93
96
37
57
030
031
615
11
49
74
86
8031
032
717
12
411
84
10
79
032
033
819
14
512
95
11
811
033
034
922
16
614
10
613
10
12
034
015
11
25
18
716
12
714
11
14
035
036
12
28
21
819
14
816
12
16
036
037
14
31
23
921
15
918
14
18
037
038
16
34
26
10
23
17
10
21
16
19
038
039
18
38
28
12
26
20
11
23
18
22
039
040
21
41
32
13
30
22
13
26
20
25
040
041
23
45
35
15
33
25
14
29
23
28
041
042
26
48
38
17
36
27
16
32
25
30
042
043
29
,2
41
19
39
30
18
35
28
33
043
044
32
55
44
22
43
33
20
38
30
36
044
045
35
58
47
24
46
36
22
42
33
39
045
046
38
,62
51
27
50
39
25
45
36
42
046
047
41
65
54
30
53
42
27
48
39
45
047
048
44
68
56
32
56
45
30
51
42
48
048
Raw
Scores
10th
Female
10th
Male
10th
Grade
11th
Female
11th
Male
TABLE 1
(Cont'd)
Coding Speed
11th
12th
Grade
Female
12th
Male
12th
Grade
National
_Total
Raw
-Scores
049
47
71
60
35
59
48
33
55
45
51
049
05')
51
74
63
39
63
52
36
59
48
54
050
051
56
77
67
44
67
56
40
63
53
58
051
052
59
30
70
47
70
59
43
66
56
61
052
053
62
82
72
50
72
62
46
69
58
64
053
054
65
83
75
53
75
65
49
71
61
66
054
155
68
85
77
56
77
68
52r,
74(1
64
69
055
056
71
87
79
60
80
71
56
77
67
72
056
057
74
88
81
63
82
73
59
. 79
70
74
057
.N.k.
051
76
90
83
66
84
75
62
81
72
76
058
C4 051
78
91
85
68
85
77
64
83
74
78
059
060
80
92-
86
71
87
80
67
84
77
80
060
061
82
93
88
174
88
82
70
36
79
82
061
062
84
93
89
76
89
83
72
88
81
84
062
063
85
94
90
78.
91
85
75
89
82
85
063
064
37
95
91
80
91
86
77
90
84
87
064
065
88
95
92
82
92
88
79
91
85
88
065
066
90
96
93
84.
93
89
81
92
87
89
066
067
91
96
94
87
94
91
84
93
89
91
067
063
92
97
94
88
95
92
86
94
90
92
068
069
93
97
95
90
96
93
87
95
91
93
069
070
94
97
96
91
96
94
89
95
92
94
070
071
94
98
96
92
97
94
90
96
93
94
071
072
95
98
96
93
97
95
91
96
94
95
072
073
95
98
97-
94
97
96
92
97
95
96
073
074
96
98
-97
94
98
96
93
97
95
96
074
_
Raw
Scores
10th
Female
10th
Male
10th
Grade
11th
Female
11th
Male
TABLE 1
-::
.
Coding
. 11th
Grade
(Cont'd)
Speed
12th
Female
12th
Male
12th
Grade
National
Total
Raw
Scores
075
96
98
97
95
98
96
94
97
96
96
075
076
97
98
98
95
98
97
95
98
96
97
076
077
97
99
98
96
98
97
95
98
97
97
077
078
97
99
98
96
98
97
95
98
97
97
078
079
97
99
98
97
98
97
96
98
97
98
079
080
97
99
98
97
99
98
96
98
97
98
080
081
98
99
98
97
99
98
97
99
98
98
081
082
98
99
98
98
99
98
97
99
98
98
082
033
98
99
99
98
99
98
97
99
98
98
083
084
98
99
99
98
99
99
98
99
98
98
084
085
98
99
99
98
99
99
98
99
98
99
085
086
98
99
99
98
99
99
98
99
99
99
086
087
98
99
99
98
99
99
98
99
99
99
087
088
99
99
99
99
99
99
98
99
99
99
088
089
99
99
99
99
99
99
99
99
99
99
089
090
99
99
99
99
99
99
99
99
99
99
090
091
99
99
99
99
99
99
99
99
99
99
091
092
99
99
99
99
, 99
99
99
99
99
99
092
093
99
99
99
99
99
99
99
99
99
99
093
094
99
99
99
99
99
99
99
99
99
99
094
095
99
99
99
99
99
99
99
99
99
99
095
096
99
99
99
99
99
99
99
99
99
99
096
097
99
99
99
99
99
99
99
99
99
99
097
098
99
99
99
99
99
99
99
99
99
99
098
099
99
99
99
99
99
99
99
99
99
99
099
100
99
99
99
99
99
99
99
99
99
99
100
N59586
66445
126585
77528
92011
170206
171774
216238
389759
771031
N
Raw
Scores
10th,
Female
10th
Ma le
TABLE 2
Word Knowledge
Raw Score to Percentile Conversion Tables -By Grade and Sex, By Grade, and
National
Totil
11 th
12th
12th
10th
1 1 th
1 1 th
Ma le
12th
Grade
Female e
Grade
Female e
Grade
Male
National
Total
Raw
Scores
0& below
11
11
11
11
11
0& below
01
/2
11
1,
11
11
101
92
23
22
21
12
12
02
03
34
42
22
"2
33
303
94
34
43
32
23
33
04
05
67
64
44
44
45
05
06
910
96
66
66
67
06
07
13
13
13
88
89
99
10
07
08
13
14
13
88
89
99
11
08
09
19
19
19
12
12
12
13
12
13
15
09
10
25
25
25
16
16
16
18
16
17
20
10
113
11
32
32
32
21
21
22
23
21
22
25
11
CA
12
33
32
32
22
22
22
23
22
22
26
12
13
42
41
41
29
29
29
31
28
29
33
13
14
52
51
52
38
38
39
k.
40
37
38
43
14
15
63
62
63
50
50
50
50
48
49
54
15
16
64
63
63
50
50
50
51
49
50
54
16
17
75
75
75
63
63
63
62
62
62
66
17
18
84
85
85
76
76
75
74
74
74
. ,
18
19
92
92
92
86
86
86
84
85
85
87
19
20
92
92
92
87
87
86
84
85
85
87_
20
21
96
97
97
94
94
93
92
93
92
94
21
22
98
99
99
98
98
97
96
97
97
97
22
23
99
99
99
99
99
99
99
99
99
99
23
24
99
99
99
99
99
99
99
99
99
99
24
25
99
99
99
99
99
99
99
99
99
99
25
N59586
66445
126585
77528
92011
170204
171774
216238
389759
771031
N
O
TABLE 3
> IvArithmetic Reasoning
4o
Raw Score to Percentile Conversion Tables - By Grade and Sex, By Grade, and National Total
Ilth
10th
11th
12th
12th
11th
12th
Raw
10th
10th
T.-male
Male
Male.
Raw
Scores
Female
Grade
Scores
Female
Male
Grade
Grade
Natioral
Total
0 & below
11
11
11
1'
11
10 & below
01
22
21
11
11
12
01
02
43
32
22
22
23
02
03
65
54
33
43
34
03
04
65
64
33
43
34
04
G5
98
96
55
74
57
05
06
14
11
13
97
810
68
10
06
07
20
16
18
14
10
12
15
912
14
07
08
21
17
19
14
10
12
15
10
12
15
08
09
29
23
26
-21
15
17
22
14.
17
20
09
1')
38
30
34
28
20
24
28
19
23
?7
10
11
47
38
42
36
27
31
36
25
30
34
11
Ilk:
12
48
39
43
37
27
32
37
26:
31.
35
12
CY:
13
58
48
53
46
35
40
46
33
39
44
13
14
66
57
61
54
43
48
54
41
47
5?
14
15
74
65
69
62
52
56
62
49
55
60
15
16
15
66
70
63
53
58
63
50
56
61
16
17
82
74
77
71
61
66
71
59
64
69
17
18
87
81
84
78-
69
73
77
67
71
76
18
19
91
86
88
84
76
79
83-
74
78
82
19
20
92
87
89
84
77
80
84
75
'79
82
20
21
95
91
93
89
83
86
89
81
85
87
21
22
97
94
96
93
..88
90
93
87
90
92
22
23
99
97
98
96
93
94
96
92
94
95
23
24
99
97
98
96
93
95
96
92
94
95
24
25
99
99
99
99
97
98
99
97
98
98
25
771031
N59586
66445
77528
171774
389759
N126585
92011
170204
216238
1
TABLE 4
Tool Knowledge
Raw Score to Percentile Conversion Tables - ByGrade and Sex, By Grade, and National
Total
Raw
10th
10th
10th
-11th
11th
11th
12th
12th
12th
National
Raw
Scores
Female
Male
.Grade
Female
Male
Grade
Female
Male
Grade
Total
Scores
0 3 below
11
11
11
11
11
0 & below
01
41
24
12
41
2-
..2
01
02
10
15
81
49
14
V5
02
03
18
210
16
18
16
18
03
04
19
210
16
18
17
18
04
05
32
417
almw...Z8
314
28
214
15'
05'
06
46
625
41
521
41
420
22
06
07
60
10
34
55
729
54
728
3U
07
OS
62
11
35
57
830
55
728
:1
0,3
09
74
16
44
69
12
38
67
11
36
39
09
IQ10
84
23
52
80
17
46
76
..5
43
46
10
4\1
11
90
31
59
87 .
24
52
85
21
49
53
11
12
91
32
60
87
24
E3
86
22
50
54
12
13
95
41
66
92
32
60
91
29
56
60
13
1497
51
72
95
41
66
94
37
62
66
14
15
98
60
'8
97
50
71
96
45
68
7?
15
16
98
60
78
97
50
72
96
46
68
72
16
17
99
70
84
98
60
77
98
.,55-
74
78
17
18
99
78
88
99
69
83
99
64
79
83
18
19
99
85
92
99
77
87
99
-.3+
87
19
20
99
85
92
99
78
88
99
74
85
88
20
21
99
91
95
99
85
92
99
82
90
92
21
22
99
95
98
99
91
95
99
89
94
95
22
'3
99
98
99
99
96
98
99
95
97
98
23
24
99
98
,99
., '3
,99
96
98
99
95
97
98
24
25
99
99
99
99
99
99
99
98
99
99
25
N59586
66445
126585
77528
920U
170204
171774
216238
389759
771031
N
TABLE 5
Space Perception
Raw Score to Percentile Conversion T. bl es - by Grade and Sex, By Grade, and National Total
Raw
1 Qt
10th
10th
1 1 th
1 1 th
l'th
12th
12th
12th
Na ti ooa 1
Raw
Scores
1 e
Male
Grade
Female
Male
Grade
Female
Male
Grade
Tc ta 1
Scores
____
0 & below
1I
11
11
11
11
0& below
01
12
21
11
11
11
01
02
32
22
22
22
202
03
44
43
33
33
33
03
04
44
43
33
43
34
04
05
36
75
44
64
56
05
06
12
910
,8
67
10
78
906
07
18
14
15
12
911
14
10
12
13
07
OS
18
14
16
13
10
11
15
10
12
14
03
09
25
20
22
19
14
16
21
15
18
19
09
IN.!
10
34
27
30
26
19
22
28
20
24
26
10
GC
11
43
34
38
34
25
29
36
27
31
33
11
..-
12
43
15
39
35
26
30
37
27
32
34
12
13
53
'
43
48
43
33
38
46
35
\' 40
42
13
14
62
52
57
52
41
46
55
42
48
51
14
15
70
60
65
61
49
54
63
50
56
59
15
Ti5 ---.!_
71
61
66
62
50
55
64
51
56
60
I6
17
78
69
74
70
58
64
72
59
64
68
17
18
85
76
80
77
66
71
78
67
72
75
18
19
90
83
86
83
74
78
84
74
79
81
19
20.
90
83
86
84
75
79
85
75
79
82
20
21
94
89
91
90
82-
85
90
82
86
88
21
22
97
94
95
94
89
91
94
88
91
92
22
23
99
97
98
97
94
95
91
94
95
96
23
24
99
97
98
97
94
96
97
-94
95
96
24
25
99
99
99
99
98
98
99
98
98
99
25
N59586
66445
126535
77528
92011
17020e
171774
216238
389759
77103'
N
TABLE 6
Mechanical Comprehension
Raw Score to Percentile Corversion
Tables - By Grade and Sex, By Grade,
and National Total
Raw
10th
10th
10th
llth
11th
11th
12th
12th
12th
National
Raw
Scores
Female
Male
Grade
Female
Male
-Grade
Female
Male
Grade
Te:
'31
Scores
0 & below
11
11
11
11
11
0 & below
01
21
21
11
1.
11
101
02
32
32
11
21
22
02
03
33
43
22
42
33
03
04
64
54
23
42
34
04
05
10
58
73
58
35
605
06
16
81-
211
47
12
58
906
07
24
11
17
17
711
19
712
14
07
08
26
12
18
19
712
20
713
15
08
09
36
16
25
27
10
1C
29
10
19
21
09
NI
10
47
22
34
37
15
25
39
15
25
28
10
:10
11
58
29
43
48
20
33
49
20
33
36
11
12
60
31
44
50
;2
35
52
22
35
38
12
13
70
40
54
61
29
44
62
28
43
47
13
14
80
50
64
72
J8
53
72
37
53
57
14
15
87
61
73
81
48
63
81
47
62
66
15
16
88
63
75
83
56
65
83
49
64
68
16
17
94
73
83
90
61
74
90
60
73
77
17
13
97
82
89
95
72
82
94
71
81
84
18
19
99
89
94
98
82
89
97
80
88
90
19
20
99
90
94
98
83
90
98
82
89
91
20
21
99
95
97
99
90
94
99
89
94
95
21
22
99
98
99
99
95
97
99
95
97
98
22
23
99
99
99
99
98
99
99
98
99
99
23
24
99
99
99
99
98
99
99
98
99
99
24
25
99
99
99
99
99
99
99
99
99
),99
25
N59586
66445
126585
77528
92011
170204
171774
216238
389759
771031
)
N
TABLE 7
Shop Information
4wScore to Percentile Conversion Tables - By Grade and Sex, By Grade, and National Total
Raw
10th
10th
10th
11th
11th
11th
12th
12th
12th
National
Raw
Scores
Female
Male
Grade
Female
Male
eGrade
Female
Male,
Grade
Total
Scores
0 & below
11
11
11
11
11
0& below
01
31
22
11
21
12
01
02
62
44
12
41
23
02
03
11
26
81
48
14
503
04
12
27
"9
15
91
56
04
05
21
412
16
29
18
28
10
05
06
31
618
26
414
26
313
15
06
07
44
925
38
620
37
519
21
07
08
45
926
40
621
38
520
22
08
09
58
14
35
53
929
51
827
30
09
CO
I
C)
10
71
19
44
66
14
38
64
12
35
38
10
n81
27
52
77
20
46
75
17
43
46
11
12
82
28
53
78
21
47
76
18
44
4T
12
13
89
37
62
86
28
55
84
25
52
55
13
14
94
43
70
92
38
62
91
34
59
63
14
15
97
59
77
96
48
70
95
44
67
70
15
16
97
60
77
96
49
70
95
45
67
71
16
17
99
71
84
98
60
78
98
56
75
78
17
.18
99
81
90
.99
72
84
99
68
82
85
18
_
19
99
89
94
99
82
90
99
78
88
90
19
20
99
89
94
99
82
90
99
79
88
90
20
21
99
94
97
99
90
'94
99
88
93
94
21
22
99
98
99
99
95",
97
S9
94
97
97
22
---,
23
99
99
99
99
98
99
99
98
99
99
23
24
99
99
99
99
98
99
99
98
99
99
24
25
99
99
99
99
99
99
99
99
99
99
25
N59586
66445
126585
77528
92011
170204s
171774
216238
389759
771031
N
TABLE 8
Automotive Information
Raw Score to PercentileConversion Tables - By Grade
and Sex, By Grade, and
National Total
Raw
Scores
10th
Female
10th
Male
10th
Grade
11th
Female
11th
Male
11th
Grade
Female
M1e2 lt eh
12th
Grade
National
Total
Raw
Scores
0&
below
11
11
11
11
11
0& below
01
42
32
12
21
12
01
02
63
43
12
21
23
02
03
10
47
62
44
13
403
04
10
47
62
45
23
504
05
17
611
11
37
92
57
05
06
27
817
20
411
15
38
12
06
07
40
12
25
31
718
26
514
18
07
08
41
12
26
33
719
27
515
19
08
CO
;1116
09
56
18
36
48
11
28
41
823
28
09
10
70
26
47
64
17
39
57
12
32
38
10
11
82
36
58
77
25
49
71
18
42
'43
11
12
83
38
59
78
26
50
73
19
43
49
12
13
91
49
69
88
36
60
84
28
52
59
13
14
96
61
77
94
47
68
91
.:
38
61
67
14
15
98
72
84
97
58
76
95
49
69
75
15
16
98
73
85
97
59
76
95
50
70
75
16
17
99
82
90
98
70
83
98
61
77
82
17
18
99
89
94
99
78
88
99
70
83
87
18
19
99
93
96
99
86
92
99
79
88
91
19
20
99
94
96
99
86
92
99
79
88
91
20
21
99
96
98
99
92
95
99
87
92
95
21
22
99
98
99
99
96
98
99
92
96
97
22
23
99
99
99
99
98
99
99
97
98
99
23
24
99
99
99
99
98
99
99
97
98
99
24
25
99
99
99
99
99
99
99
99
99
99
25
N59586
66445
126535
,77528
92011
170204
171774
216238
389759
771031
N
TABLE 9
.Electronic Information
Raw Score to Percentile Conversion Tables - By Grade and Sex, By Grade, and National Total
11th
Raw
10th
10th
10th
Grade
Raw
National
Grade
11th
Male
12th
Glr2atdhe
Scores
Female
"tale
Female
Male
Female
Scores
o& below
32
22
11
11
1
Total
2C& below
01
74
54
23
41
23
01
02
12
58
73
46
24
502
03
17
712
11
37
93
68
03
04
=.18
712
12
47
10
36
804
05
26
10
17
18
511
15
49
12
05
06
36
13
24
27
716
23
513
17
06
07
47
16
31
37
922
32
718
23
07
OR
48
17
32
38
10
23
33
819
24
08
09
60
22
40
50
13
30
45
11
26
31
09
CO
10
71
29
49
63
18
39
"
57
15
34
39
11)
N11
,81
36
57
74
24
47
69
2142
48
11
12
82
37
58
75
25
48
70
21
43
49
12
13
89
46
67
84
34
57
80
29
52
57
13
E14
94
57
74
91
44
65
88
39
61
66
14
15
97
67
81
95
54
73
93
50
69
74
15
16
97
68
81
95
55
74
94
51
70
74
16
17
99
77
87
98
67
81
97
63
78
81
17
18
99
85
92
99
76
87
98
73
84
87
18
19
- 99'
90
95
99
84
91
99
82
90
91
19
20
4,
99
91
95
99
84
91
99
82
9u
,92
20
21
99
95
97
99
90
94
99
89
94
95
21
22
99
97
48
99
94
97
99
94
96
97
22
23
99
99
99
99
97
98
99
97
98
99
23
24
99
99
99
99
97
99
,99
97
98
99
24
25
99
99
99
99
99
99
99
99
99
99
25
N59586
66445
126585
77528
92011
170204
171774
216238
389759
771031
N
TA
BLE
10
GE
NE
RA
L M
EC
HA
NIC
AL
CO
MP
OS
ITE
Raw
Sco
re to
Per
cent
ile C
onve
rsio
n T
able
s -
By
Gra
de a
nd S
ex, B
y G
rade
,an
d N
atio
nal T
otal
Raw
10th
10th
10th
11th
11th
11th
12th
12th
12th
Nat
iona
lR
aw
Sco
res
Fem
ale
Mal
eG
rade
Fem
ale,
__"
Mal
eG
rade
Fem
ale
Mal
eG
rade
Tot
alS
core
s
0 &
bel
ow1
11
11
11
11
10
& b
elow
011
11
11
11
11
101
021
11
11
11
11
102
031
11
11
11
11
103
A04
11
11
I1
11
1:
1'
04
051
11
11
11
11
105
061
11
1I
11
11
06
072
11
11
11
11
107
CO
ce2
11
11
12
11
108
C.)
093
12
21
12
11
209
104
12
21
13
Ia
210
115
13
31
24
12
311
126
24
41
24
12
312
,13
82
55
13
61
34
13
149
25
61
47
14
414
1511
37
82
49
15
515
1612
37
92
510
25
616
1715
49
112
612
26
717
1817
410
132
714
27
818
1921
512
-16
39
163
910
19
2022
513
173
918
310
1120
2126
616
204
1121
411
1321
2229
717
224
323
413
1422
1:
2333
920
265
1527
515
1723
2435
9V
276
1628
516
1824
25-
4011
2432
718
326
1820
25
TABLE 10 (Cont'd)
GENERAL IECHA4ICAL COMPOSITE
Raw
13th
10th
10th
11th
Female
11th
Male
11th
National
Raw
12th
12th
Scores
Scores
Fema.e
Male
Grade
Grade
12th
Female
Male
Grade
26
43
12
26
34
820
35
720
22
26
27
47
14
30
39
922
39
822
25
27
28
49
14
31
41
924
41
923 ,,
26
28
29
54
17
34
45
11
27
.45
11
26
29
29
30
57
18
37
48
12
29
48
12
28
31
30
31
62
21
40
53
14
32
53
13
31
34
31
,
32
63
22
42
55
15
33
55
14
32
36
32
33
68
25
45
60
17
37
59
16
35
39
33
Cm:
34
71
27
48
63
19
39
62
18
37
41
34
lPih
35
75
30
51
67
21
42
66
20
41
45
35
36
76
32
53
69
22 \
44
68
21
42
46
36
37
80
35
56
73
25
47
72
24
45
49
37
38
82
38
59
76
27
49
75
26
48
52
38
39
85
42
62
79
31
53
78
29
51
55
39
40
86
43
64
81
32
54
80
30
52
57
40
41
89
47
67
84
36
58
83
34
56
60
41
42
90
50
69
86
38
60
85
36
58
62
42
43
93
54
72
89
42
63
88
40
61
65
43
44
93
56
74
90
43
64
88
41
62
66
44
45
95
60
76
,92
47
68
91
45
65
69
45
46
96
63
78
93
50
70
92
48
67
71
46
47
97
67
81
94
55
73
94
52
70
74
47
48
97
69
82.
95
56
74
94
54
72
75
48
49
98
73
85
96
161
77
96
58
75
78
49
50
98
75
86
97
63
79
96
61
76
80
50
51
99
79
88
98
67
81
97
65
79
82
51
TA
BLE
10
(Con
t'd)
GE
NE
kAL
ME
CIli
elIC
AL
CO
MP
OS
ITE
Raw
10th
10th
10th
11th
Ilth-
11th
120
12th
12th
Nat
iona
lR
aw
Sco
res
Fem
ale
Mal
eG
rade
Fem
ale
Mal
eG
rade
Fem
ale
Mal
eG
rade
Tot
alS
core
s
5299
8089
9869
8298
6680
8352
5399
8391
9973
8598
7083
8653
5499
8592
9975
8699
7384
8754
5599
8893
9979
8899
7686
3955
5699
8994
9980
8999
7887
'90
56
5799
9195
9984
9199
8189
9157
5399
9396
9986
9299
8491
9358
5999
9497
9988
9499
8692
9459
Ca
Can
6099
9597
9989
9499
8893
9460
6199
9698
9991
9599
9094
9661
6299
9798
9993
9699
9195
9662
6399
9899
9995
9799
9396
9763
6499
9899
9995
9799
9497
9864
6599
9999
9997
9899
9698
9865
6699
9999
9997
9999
9798
9966
6799
9999
9998
9999
9899
9967
61,
9999
9999
9999
9998
9999
68
6999
9999
9999
9999
9999
9969
7099
9999
999'
299
9999
999,
470
7199
9999
9999
9999
9999
9971
7299
9999
9999
9999
9999
9972
7399
9999
9999
9999
9999
9973
7499
9999
9999
9999
9999
9974
7599
9999
9999
9999
9999
9975
II59
586
6644
512
6585
7752
8,
9201
117
0204
17T
774
2162
3838
9759
7710
31N
TA
BLE
11
ELE
CT
RO
NIC
S C
OM
PO
SIT
E, 6-.
Raw
Sco
re to
Per
cent
ile C
onve
rsio
n T
able
s -
By
Gra
de a
nd S
ex, B
y G
rade
, and
Nat
iona
l Tot
alCA
Raw
10th
10th
10th
11th
11th
11th
12th
12th
12th
Nat
iona
lR
aw
Sco
res
Fem
ale
Mal
eG
rade
Fem
ale
Mal
eG
rade
Fem
ale
Mal
eG
rade
Tot
alS
core
s
0 A
bel
ow1
11
11
11
11
10
& b
elow
011
11
I'1
11
11
101
02I
11
11
11
11
102
031
11
11
11
11
103
04I
11
11
11
11
104
05-
21
11
11
11
11
05
062
12
11
11
11
1O
f
073
22
2.w
ir1
21
12
, 07
084
23
21
22
11
209
095
24
31
23
12
309
107
35
41
34
12
310
119
36
52
35
13
411
Co
129
46
62
46
13
412
Q13
124
97
25
72
46
13
1413
59
93
59
26
14
1516
611
113
610
26
915
1619
612
123
711
36
916
1721
714
14-
49
133
910
17
1923
915
164
1015
49
1119
1927
918
195
1119
4lb
1319
2029
1019
215
1219
511
1420
2133
1121
246
1422
513
-16
21
2235
1223
267
1624
614
1722
2340
1426
309
1929
716
2023
2442
1427
329
1930
717
-21
24
2546
1630
369
2234
919
2325
,t
ti
TA
BLE
11
(Cont'd)
ELE
CT
RO
NIC
S C
alP
OS
ITE
Raw
10th
10th
10th
11th
11th
11th
12th
12th
12th
National
Raw
Scores
Female
Male
Grade
Female
Male
Grade
Female
Male
Grade
Total
Scores
26
49
18
33
39
10
24
37
921
25
26
27
54
19
36
44
12
26
41
10
24
28
27
29
56
20
37
46
12
28
43
11
25
30
28
29
60
23
40
51
14
31
48
12
28
33
29
30
64
24
43
54
15
33
51
13
30
35
30
31
68
27
46
59
17
36
56
15
33
38
31
32
70
28
48
` 61
18
38
58
16
35
40
32
33
74
31
52
66
20
41
63
18
38
43
33
34
77
33
54
70
22
44
66
20
40
45
34
Ca
IQ35
81
37
57
74
25
47
70
22
43
49- --35
36
82
38
59
76
26
49
72
23
45
50
36
37
85
42
62
79
29
52
76
26
48
53
37
38
87
44
65
82
31
54
79
28
50
56
38
39
90
48
68
85
34
57
82
31
54
59
39
40
91
50
69
86
36
59
84
33
55
60
40
41
93
54
72
89
40
62
87
36
59
64
41
42
94
57
74
91
42
64
88
39
61
66
42
43
96
61
77
93
46
68
91
43
64
69
43
44
96
63
78
94
48
69
92
45
66
70
44
45
97
66
81
95
52
72
94
49
69
73
45
46
98
69
82
96
55
74
95
52
71
75
46
47
98
72
85
97
59
76
96
55
73'
77
47
48
98
74
85
97
61
77
96
57
74
78
48
49
99
77
87
98
65
80
97
61
77
81
49
50
99
79
88
98
68
82
98
64
79
82
50
51
99
82
90
99
71
84
98
68
81
85
91
Raw
Scores
10th
Female
10th
Male
10th
Grade
11th
Female
11th
Male
TABLE 11 (Cont'd)
FCflONICS COMPOSITE
11th
12th
Grade
Female
12th
Male
12th
Grade
83
85
86
88
89
91 92
93
93
95
95
96
97
98
'8
99
99
99
9S
99
99
99
99
99
389759
National
Total
Raw
Scores
52
53
54
55
56
57
58
59
60
61
62
63
64
65
66
67
68
69
70
71 72
73
74
75
N
99
99
99
99
99
99
99
99
99
99
99
99
99
99
99
99
99
99
99
99
99
99
99
99
59586
83
86
ST -
90
90
92
93
94
95
96
96
97 98
98
99
99
99
99
99
99
99
99
99
99
66445
91 92
93
94
95
96
96
97
97
98
98
99
99
99
99
99
99
99
99
99
99
99.
99
99 .
126585
99
99
99
99
99
99
99
99
99
' 99
99
99
99
99
99
99 99
99
99
99
99
99
99
99
C
77528
73
77
79
82
83
86
87
89
90
92
93
94
95
96
97
98
98
99
99
99
99
99
99
99
92011
85
87
88
90
91
92
93
94
95
96
96
97
97
98
98
99
99
/99
99
99
99
99
99
99
170204
98
99
99
99
99 99
99
99
39
99
99
99
99
99
99
99
99
99
99
99
99
99
99
99
171774
70
-74
76
80
81
83
85
88
88
91 92
94
94
96
96
97
98
98
99
99
99
99
99
99
216238
86
88
89
91
91 92
93
94
95
96
96
97
98
98
98
99
99
99
99
99
)99
99
99
99
771031
52
53
54
55
56
57
58
59
60
61 62
63
64
65
66
67
68
69
70
71
72
73
74
75
N-
TABLE 12
MOTOR MECHANICS COMPOSITE
Raw Score to Percentile Conversion Tables - By Grade
and Sex. By Grade, and National Total
Raw
10th
10th
10th
11th
11th
11th
12th
12th
12th
National
Raw
Scores
Female
Male
Grade
Female
Male
Grade
Female
Male
Grade
Total
Scores
0 4 below
11
11
11
11
11
0 6 below
01
11
11
1l
11
11
01
02
11
11
11
11
11
02
03
11
11
11
11
11
03
04
11
11
11
11
11
04
05
11
11
11
11
11
05
06
21
11
11
11
106
07
21
,2
11
11
11
107
RB
31
21
11
11
08
Cob"
09
42
22
11
21
12
09
CZ
10
42
32
12
21
12
10
11
52
43
12
31
22
I1
12
62
44
12
31
23
12
13
83
55
13
41
23
13
14
93
65
23
51
34
14
15
11
47
72
46
13
515
16
12
48
82
57
24
516
17
15
510
10
26
92
57
17
18
17
511
11
37
10
26
818
19
21
613
14
38
12
37
919
20
23
714
15
39
14
38
10
20
21
27
817
19
411
, 17
39
12
21
22
30
919
21
412
19
410
14
22
23
35
10
. 22
26
515
23
412
16
23
24
37
11
23
28
616
25
514
17
24
25
42
12
26
32
719
29
616
20
25
4
Raw
Scores
10th
Female
10th
Male
10th
Grade
11th
Female
11th
Male
TABLE 12 (Cont'd)
MITOR MECHANICS COMPOSITE
11th
12th
Grade
Female
12th
Male
,
12th
Grade
National
Total
Raw
Scores
26
46
14
29
36
821
33
618
22
26
27
52
16
33
42
924
38
721
25
27
.,
28
54
17
35
44
10
26
40
822
27
28
29
60
19
39
50
12
29
46
926
30
29
30
64
21
41
54
13
32
50
10
28
33
30
31
69
24
46
60
15
36
56
12
32
37
31
32
72
26
48
63
16
38
59
13
33- ---
32
----34/
33
77
30
52
69
19
42
64
15
__,.---
37----------
43
33
34
80
32
55
73
21
45
68
17
,---4 0
45
34
35
84
36
59
77
24
48
_V
19
43
49
35
36
85
38
60
79
25
50
76
21
45
51
36
37
88
43
64
24
29
54
80
24
48
54
37
4;11
90
46
67
86
32
57
83
26
51
57
36
4:D
38
39
93
50
70
89
36
60
86
29
54
60
39
40
94
52
72
90
38
62
88
31
56
62
40
41
95
57
75
92
42
65
90
35
59
65
41
42
96
60
77
94
45
67
92
37
62
67
42
43
97
65
80
95
49
70
94
41
65
70
43
44
98
67
81
96
51
72
94
43
66
72
44
45
98
71
84
97
56
75
96
I
48
69
'74
45
46
99
-
74
86
98
59
77
97
51
71
76
46
47
99
78
88
98
63
79
97
55
.74
79
47
48
N79
89
98
65
80
98
57
75
8048
49
99
82
90
99
69
82
98
6177
82
49
50
99
84
91
99
,71.
84
98
64
79
84
50
51
99
87
93
99
75
86'
99
6881
85
51
TA8LE 12 (Cont'd)
40TOR lECHANICS COMPOSITE
Raw
10th
10th
10th
11th
11th
11th
12th '
12th
National
Raw
Scores
Female
Male
Grade
Female
Male
Female
gl:
Grade
Scores
Grade
52
99
88
94
/
53
99
90
95
54
99
91
95
55
99
93
96
56
99
94
-97
57
99
95
97
5899
96
98
11 59
53
97
98
Omi
60
99
97
98
61
99
98
99
62
99
98
99
63
99
99
99
6499
99
99
65
99
99
99
66
5'9
99
99
67
99
99
99
6899
99
99
69
99
99
99
70
99
99
99
71
99
99
99
72
99
99
99
73
99
99
99
74
99
99
99
75
99
:
99
99
N)586
66445
126585
99
76
87
99
r
69
82
86
52
99
80
89
99
73
85
88
53
99
82
90
99
75
86
89
54
99
85
92
99
79
88
91
55
99
86
92
99
80
89
92
56
99
88
93
9y
83
90
93
57
99
90
94
99
85
91
94
58
99
92
95
99
87
'93
95
59
99
92
96
99
88
93
95
60
99
94
97
99
90
95
96
61
99
95
'
97
99
92
95
97
6?
99
96
98
99
94
97
98
63
99
97
98
99
/ 95
97
98
64
99
98
99
99
96
98
98
bi;
99
98
99
99
97
98
99
66
99
99
99
99
98
99
99
67
99
99
99
99
98
99
99
68
99
99
99
99
99
99
99
69
99
99
99
99
99
99
99
70
99
99
99
99
99
99
99
71
99
99
99
99
99
99
99
72
99
.',.!
99
99
99
99
99
73
99
99
99
99
99
99
99
74
99
99
99
99
99
99
99
75
77528
92011
170204
171774
216238
389759
771031
N
TA8LE 13
GFNERAL TECHNICAL COMPOSITE
Raw Score to Percentile Conversion Tables - By Grade and Sex, By Grade, and National Total
Raw
10th
10th
10th
11th
11th
11th
12th
12th
12th
National
Raw
Scores
Female
Male
Grade
Female
Male
Grade
Female
Male
Grade
Total
Scores
0 & below
11
11
11,
11
11
01
11
11
11
11
1
02
11
11
11
11
11
03
11
11
11
11
11
04
11
11
11
11
11
05
11
11
11
11
31
06
11
11
11
11
11
07
22
21
11
21
12
08
33
72
22
22
22
09
43
42
22
32
23
10
54
43
23
32
33
i11
65
64
33
43
45
5
12
87
75
44
54
56
13
98
86
55
65
57
14
11
910
76
68
67
8
15
14
12
13
97
810
78
10
16
16
14
15
10
89
11
810
12
17
19
16
17
12
10
11
13
10
11
13
18
22
18
20
14
11
12
15
11
13
15
19
26
22
24
17
14
15
18
13
15
18
20
29
25
27
19
16
17
20
15
17
21
21
32
28
30
22
18
20
23
17
20
23
22
36
31
33
24
20
22
26
19
22
26
23
41
35
38
28
23
26
30
23
____26------
30
24
45
39
42
3 ?.
26
29
33
25
29
33
25
49
43
46
35
29
32
36
28
32
36
0 & below
01 02
03
04
05
06
07
08
09
10
11
12
13
14
15
16
17
18
19
20
21 22
23
24
25
is
TABLE 13 (Cont'd)
GE
NE
RA
L T
EC
HN
ICA
L C
OM
POSI
TE
Raw
10th
10th
10th
11th
11th
11th
12th
12th
12th
National
Raw
Scores
Female
Male
Grade
Female
Male
Grade
Female
Male
Grade
____
Total
Scores
26
53
47
49
39
33
35
39
31
35
40
26
2/
58
52
55
44
38
40
44
36
39
45
27
28
62
56
59
48
41
44
48
39
43
48
28
29
66
60
63
52
45
48
52
43
47
52
29
30
69
64
67
56
49
52
56
47
51
56
30
31
75
/2
61
55
58
61
52
56
61
31
32
78
73
75
65
59
61
65
56
60
65
32
33
81
76
78
69
63
65
68
60
64
69
33
34
84
,79
81
72
67
69
72
64
68
72
34
4435
87
84
85
77
72
74
77
69
73
77
35
CA
:36
90
86
88
80
75
77
80
73
76
80
J6
37
92
88
90
83
79
81
83
77
79
83
37
38
93
91
92
86
82
84
85
80
82
86
38
39
95
93
94
8986
87
89
84
86
89
39
40
96
95
96
91
88
90
91
87
89
91
40
41
97
96
97
93
91
92
92
89
91
93
41
42
,..,
97
98
95
93
94
94
92
93
94
42
43
99
98
99
96
95
96
96
95
95
96
43
44
99
99
99
97
97
97
97
96
96
97
44
45
99
99
99
98
98
98
98
97
97
98
45
46
99
99
99
99
99
99
99
98
98
99
46
47
99
99
99
99
99
99
99
99
99
99
47
as99
99
99
99
99
99
99
99
99
99
48
49
99
99
99
99
99
99
99
99
99
99
49
50
99
99
99
99
99
99
99
99
99
49
50
N59586
66445
126585
77528
92011
170204
171774
216238
389759
771031
N
TABLE 14
CLERICAL COMP0S1TE
Raw Score to Percentile'Conversion Tables - By Grade and Sex, By Grade, and National Total
Raw
Scores
10th
Female
10th
Male
10th
Grade
11th
Female
11th
Ma le
11th
Grade
12th
Female
kale
I 2 t h
Grade
National
Total
Raw
Scores
0&
below
11
1I
11
11
11
below
GI
11
11
11
11
101
02
11
1I
11
11
11
02
03
11
11
11
11
11
03
as1
11
11
11
11
104
05
11
11
11
11
11
05
06
11
11
11
11
11
06
07
11
I1
11
11
11
07
03
1I
11
11
1'
11
108
09
11
11
11
1--.1,.._
11
09
10
12
11
11
11
s
11
10
411
12
21
11
11
'9-.
I11
ill11
112
13
21
21
12
1
---.
212
13
24
3i
22
12
22
13
''
*14
25
41
22
23
23
14
15
36
42
33
23
34
15
16
47
62
43
34
34
16
17
59
73
54
35
45
17
18
611
94
65
46
57
18
19
813
11
47
65
76
819
20 ...
10
16
13
69
76
98
10
,20
21
12
19
16
711
98
11
912
21
.22
15
22
18
8.
13
11
913
II.
14
22'',
23
18
26
22
10
16
13
11
15
13
17
23
24
21
30
26
12
19
16
13
18
16
19.
24
25
25
35
30
15
22
19
15
21
1823
25
TABLE 14 (Cont'd)
CLERICAL COMPOSITE
Raw
10th
10th
.10th
11th
11th
11th
12th
12th
12th
National
Raw
Scores
Female
Male
Grade
Female
Male
Grade
Female
Male
Grade
Total
Scores
26
29
40
35
18
26
22
18
24
22
26
26
27
33
45
40
21
31
26
21
29
25
31
27
28
38
51
45
25
36
31
25
33
29
35
28
2q
44
57
51
29
41
36
29
38
34
40
29
30
49
63
56
34
47
41
33
44
39
45
30
31
55
69
62
40
54
47
38
50
45
,31
32
61
74
53
45
60
53
43
56
50
57
32
33
67
79
73
51
66
59
49
62
56
62
33
34
72
83
73
57
72
65
55
68
62
68
34
001
35
77
87
32
63
77
71
61
74
68
73
35
CA
36
82
90
86
69--
82<
66
79
73
78
36
_____
37
86
92
99
74
86
72
83
78
82
37
38
89
94
92
/79
89
85
77
87
82
86
38
39
92
96
94
84
92
88
81
90
86
89
39
40
94
97
96
88
94
91
85
93
89
92
40
41
95
98
97
91
96
93
89
95
92
94
41
42
97
98
93
93
97
95
91
96
94
95
42
43
98
99
98
95
98
97
94,
97
96
97
43
44
98
99
99
97
98
98
95
98
97
98
44
45
99
99
99
98
99
98
97
99
98
98
45
46
99
99
99
98
99
99
98
99
98
99
46
47
99
99
99
99
99
99
98
99
99
99
47
48
99
99
99
99
99
99
99
99
99
99
48
49
99
99
99
99
99
99
99
99
99
99
49
50
99
99-
99
99
99
99
99
99
99
99
50
51
99
99
99
99
19
99
99
99
99
99
51
TABLE 14 (Cont'd)
r Raw
Scores
loth
Femaie
10th
Male
10th
Grade
11th
Female
11th
Male
CLERICAL COMPOSITE
11th
12th
Grade
Female
12th
Male
12th
Grade
National
Total
Raw
Scores
52
99
99
99
99
99
99
99
99
99
99
52
53
99
99
99
99
99
99
99
99
99
99
53
54
99
99
99
99
99
99
99
99
99
99
54
55
99
99
99
99
99
99
99
99
99
99
55
56
99
99
99
99
99
99
99
99
99
99
56
57
99
99
"
99
99
99
99
99
99
99
99
57
58
99
99
99
99
99
99_
99
99
99
99
58
NI
59586
66445
126585
77528
92011
170204
171774
216238
389759
771031
N
TABLE 15
Raw
Scores
9th
Female
Raw Score to Percentile Conversion Tables - Ilv Grade and Sex and By Grade Total
Coding Speed
t
Post High
Post High
9th
9th
School Graduate
School Graduate
Male
Grade
Female
Male
Post High
School Graduate
Total
Raw
Scores
000
00
00
00
000
001
00
00
00
001
002
00
00
00
002
003
00
00
00
000
004
00
00
00
004
005.
00
00
00
005
006
00
00
00
006
007
00
00
00
007
008
00
00
00
008
4;111
009
00
00
00
009
I010
00
00
00
010
011
00
00
00
011
012
01
00
10
012
013
01
0,0
11
013
014
01
10
11
014
015
02
11
11
015
016
0"2
11
11
06
017
12
21
22
017
018
13
21
22
018
019
14
21
32
019
020
14
31
33
020
021
25
41
43
021
022
26
42
43
022
023
37
52
54
023
024
38
63
65
024
025
49
73
76
025
TABLE 15 (Cont'd)
Coding Speed
Post High
Post High
Post High
Raw
9th
9th
9th
School Graduate
School Graduate
School Graduate
Raw
-
Scores
Female
Male
Grade
Female
Male
Total
Scores
046
511
84
86
026
027
513
94
97
027
028
614
11
410
8028
029
717
12
511
9029
030
919
14________
6____,
12
10
030
031
10
22
16
714
11
031
032
12
25
19
815
13
032
033
14
28
21
918
14
033
034
16
32
24
10
19
16
034
035
18
35
27
11
21
17
035
036
20
39
30
12
23
19
036
P037
23
42
33
14
26
22
037
Cr
038
26
46
37
15
29
24
038
039
29
50
40
16
32
26
039
040
32
54
44
18
34
28
040
041
35
58
47
21
37
31
041
042
39
62
51
22
40
33
042
043
42
65
54
23
44
36
043
044
45
68
57
25
46
39
044
045
48
71
61
27
50
41
045
046
52
74
64
30
52
44
046
047
55
76
66
32
55
47
047
048
58
79
69
35
57
49
048
049
61
81
72
39
60
52
049
050
65
83
75
43
63
56
050
051
69
86
78
46
67
59
051
CD
TABLE 15 (Cont'd)
Raw
Scores
9th
Female
9th
Male
9th
Grade
Coding Speed,
Post High
School Graduate
Female
Post High
School Graduate
Male
Post High
School Graduate
Total
Raw
Scores
052
72
88
80
49
69
62
052
053
75
89
82
52
72
64
053
054
77
90
84
55
74
67
054,-
055
79
92
86
58
77
70
''''''
6055:
056
81
93
87
61
79
72
057
83
94
89
63
80
74
057
058
85
94
90
66
82
76
058
059
87-
95
91
69
84
78
059 ,
060
X88
95
92
70
85
80
060
061
89
96
93
73
87
82
061
062
90
96
93
74
88
83
062
063
91
96
94
76
89
84
063
064
92
97
94
78
90
85
064
065
93
97
95
80
91
87
065
066
94
97
96
82
92
88
066
067
94
97
96
84
93
89
067
068
95
98
96
85
93
89
068
069
95
98
97
87
94
91
069
070
96
98
97
88
94
92
070
071
96
98
97
88
95
93
071
072
96
98
97
89
95
93
072
073
97
98
97
89
96
94
073
074
97
9B
97
91
96
94
074
075
97
98
98
92
96
95
075
076
97
98
498
93
96
95
076
g2
077
97
98
98
93
97
95
077
on
D
TABLE 15 (Cont'd)
Coding Speed
Post High
Post High
Post High
Raw
9th
9th
9th
School Graduate
School Graduate
School Graduate
Raw
Scores
Female
Male
Grade
Female
Male
Total
Scores
078
078
97
98
98
94
97
079
97
98
98
94
97
079
080
98
98
98
94
97
080
081
98
98
98
95
97
081
96
96
96
96
082
98
99
98
95
97
97
082
083
98
99
98
95
98
97
083
084
98
99
98
96'
98
97
084
085
98
99
98
96
98
97
085
086
98
99
98
96
98
97
086
087
98
99
98
96
98
97
087
088
98
99
99
96
98
97
088
C089
98
99
99
96
98
97.
089
090
- 98
99
99
96
98
98
090
091
98
99
99
97
98
98
091
.092
99
99
,
99
97
98
98
092
093
99
99
99
97
98
98
i.3
094
99
99
99
97
99
98
094
095
99
99
99
97
99
9095
096
99
99
99
97
99
98
096
097
99
99
99
98
99
99
097
098
99
99
99
98
99
99
098
099
99
99
99
99
99
99
099
100
99
99
99
99
99
99
100
N22999
26069
49338
1856
3101
4987
N
TABLE 15 (Cont'd)
Raw Score to Percentile Conversion Tables - By
Grade and Sex and By Grade Total
Raw
Scores
9th
Finale
9th
Male
9th
Grade i
Word Knowledge
Post High
School Graduate
Female
Post High
School Graduate
Male
Post High
School Gra
Total
aw
Scduate Rores
0 & below
11
11
11
6 & below
01
22
22
22
01
02
34
33
33
02
03
45
33
55
93
04
.5
65
66
604
05
79
810
88
05
06
11
12
12
13
11
12
06
07
16
12
16
17
14
16
07
08
17
17
17
18
16
17
08
09
CA
001.
09 10
23 30
23 30
23 30
24 31
20
26
22
28
10
11
X30
39
38
36
32
33
11
12
38
40
39
37
33
34
12
13
48
49
49
43
41
42
13
14
59
59
'59
51
49
50
14
15
59
70
70
59
59
59
15
16
70
71
71
60
60
- 60
16
17
81
81
81
70
71
71
17
18
89
89
89
80
81
81
18
19
94
89
89
87
89
88
19
20
95
95
95
88
90
89
20
21
98
98
98
93
95
94
21
,22
22
99
99
99
97
98
98
23
99
99
99
97
98
98
23
24
99
99
99
99
99
99
24
25
99
99
99
99
99
99
25
17
Ca
N22999
26069
49338
1856
3101
4987
N.
TABLE 15 (Cont'd)
Raw Score to Percentile Conversion Tables - By Grade and Sex and By Grade Total
Arithmetic Reasoning
Post High
Post High
Post High
Raw
9th
9th
9th
School Graduate
School Graduate
School Graduate
Raw
Scores
Female
Male
Grade
'Female
Male
Total
Scores
0 & below
11
11
11
0 & below
01
33
34
23
01
02
55
56
34
02
03
75
79
36
03
04.
87
810
57
04
05
12
11.
12
15
710
05
06
18
15
17
20
11
14
06
07
25
21
23
25
15
19
07
08
26
22
24
26
16
20
08
09
35
29
32
34
22
27
09
Cil
10
45
38
41
42
29
34
10
1\)
11
54
47
50
49
37
42
11
12
56
48
52
51
38
43
12
13
65
57
61
59
46
51
13
14
73
67
70
67
54
59
14
15
80
74
77
74
62
67
15
16
82
76
78
76
64
68
16
17
87
82
85
82
70
75
17
18
92
88
90
87
77
81
18
19
92
88
93
90
82
85
19
20
95
92
94
91
83
86
20
21
97
95
96
95
88
91
21
22
99
97
98
97
92
44
22
23
99
97
-98
98
92
96
23
24
99
99
99
99
95
97
24
25
99
99
99
99
98
99
25
.,
H22999
26069
49338
1856
3101
4987
N
Raw
9th
Scores
Female
0 & below
01
5"
02
11
03
19
04
21
05
35
06
50
07
65
08
66
09
78
CA
10
87
CA:
11
87
12
93
13
96
14
98
15
98
16
98
17
99
18
99
19
99
20
99
21
99
22
99
23
99
24
99
25
99
N22999
TABLE 15 (Cont'd)
Raw Score to Percentile Conversion Tables - By Grade and
Sex and By Grade Total
Tool Knowledge
Post High
Post High
Post High
9th
9th
School Graduate
School Graduate
School Graduate
Raw
Male
Grade
Female
Male
TOtal
Scores
01
10
1
03
60
3
16
12
15
26
22
19
311
23
210
519
36
316
928
48
521
14
38
60
528
15
39
62
929
22
48
73
14
36
31
57
82
19
43
10
40
65
82
..: 24
48
11
41
66
88
25
49
12
52
73
92
33
55
13
62
79
95
41
61
14
71
84
95
49
61
72
85
97
50
67
80
89
98
59
74
87
93
99
68
80
87
93
99
76
80
92
96
99
77
85
96
98
99
85
90
98
99
99
91
94
0 & below
01
02
03 04
05
06
07
08 09
98
99
99
99
99
99
99
99
99
26069
49338
1856
91 95 98
3101
94 97
99
4987
15
16
\17 18
19
20
21
22 23
24
25 N
TABLE 15 (Conted)
Raw Score to Percentile Conversion Tables
y Grade and Sex and By Grade Total
Raw
Scores
0& below
9th
Female
i
9th
Male
-1
9th
Grad
1
Space
eci-Ception
Post Hir'h
School Graduate
female
1
Post High
School Graduate
Male
1
Post High
School Graduate
Igtal____
I
Raw
Scores
0& below
01
22
22
22
01
02
33
3-
33
i
302
03
35
33
33
03
04
66
66
15
04
05
98
9,
10
68
05
60
15
13
14
15
q12
06
07
21
13
19
21
13
16
07
08
22
18
20
22
14
17
08
90
30
25
27
29
19
23
,-,--------
09
10
39
33
36
,37
26
30
10
C A
33
38
11
441
11
49
42
45
46
12
50
43
46
47
31
38
12
13
60
52
56
57
42
48
13
14
69
61
65
66
50
56
14
15
77
69
/3
74
58
64
15
16
78
70
74
75
59
65
16
17
85
78
81
82
67
72
17
18
90
84
87
86
74
79
18
19
90
89
91
90
80
84
19
20
94
90
92
91
81
85
20
21
97
93
Q5
94
87
90
21
22
98
96
97
97
92
94
22
23
98
96
97
97
02
94
23
24
99
98
99
99
96
97
24
25
99
99
99
99
99
99
25
N22999
26069
49338
1856
3101
4987
N
ti
TA
BLE
15
(C)it'0/
Raw Score to Percentile Conversion Tables - By Grade and Sex
and By
....e Total
Mechanical Comprehension
Post
Hig
hP
osPost
Hig
h
Raw
9th-
9th
9th
School Graduate
School
Hig
hPost
School Graduate
Raw
Scores
Female
Male
Scores
Female
Mal e
Grade
Total
0 & below
11
11
11
0 & below
012
22
2-2
201
024
33
53
302
034
33
73
E03
047
56
84
604
0513
710
146
905
0620
1015
218
1306
0729
1021
3011
1807
8831
1523
3312
2008
CY.
09
4221
3143
1726
09
Cri
1053
2840
5321
3310
1165
3750
63)
2R41
11
1267
3952
6631
442
1377
4862
7438
5213
1485
5971
8149
6114
1591
7080
8858
7015
1692
7282
9162
7316
1796
8188
9571
8017
1898
8893
9780
8618
1999
9496
9788
9219
2099
9597
9989
9320
2199
9899
9993
9621
2299
9999
9997
9822
2399
9999
9998
23
2499
,,99
9099
9924
2599
9999
9999
9925
4987
N77
999
4933
818
5631
01N
L_J6
9
TABLE 15 (Cont'd)
Raw Score tc Percentile Converion Tables - By Grade and Sex and By Grade Total
Shop Information
Post High
Post Hi9h
Post Hi9h
Raw
9th
9th
9th
School Graduate
School Graduate
School Graduate
Raw
§cal
Female
Male
Grade
Female
Male
Total
Scores
0 & bele
10
11
11
0 & below
01
31
24
13
01
02
72
74,,-__,,,
82
502
03
12
27
13
27
03
04
14
'3
815
38
04
05
33
513
23
512
05
os
34
820
34
617
06
07
47
1?
29
44
922
07
08
as
13
30
47
10
24
08
09
63
19
40
58
13
30
09
10
75
27
49
69
18
37
10
CiCT:
11
84
36
59
78,
24
44
11
1?
85
37
60
80
25
46
12
13
92
48
69
86
32
53
13
14
96
59
76
92
42
61
14
15
96
70
83
92
52
68
15
16
98
71
84
96
53
69
16
17
99
81
90
98
64
77
17
18
99
88
94
98
73
83
18
19
99
88
94
98
82
83
19
20
99
94
97
99
83
89
20
21
99
97
99
99
90
94
21
22
99
99
99
99
95
97
22
23
99
99
99
99
95
97
23
24
99
99
99
99
98
99
24
25
99
99
99
99
98
99
25
N22999
26069
49338
1856
3101
4987
N
/
TABLE 15 (Cont'd)
///
Raw Score to Percentile Conversion Tables - By Grade
and Sex and By Grade Total
Automotive Information
Raw
Scores
9th
Female
9th
Male
//'
/
9th
---
Grade
Post High
School Graduate
Post High,
School Graduate
Hale
Post High
School Graduate
Total
1 if
Raw
Scores
3 .4
Female
0& below
01
02
03
04
05 06
07
08 09 10
11
12
13 14
15
16
17
..-
)8'
19
20 21
22
23
24 25 N
1 5 8
13 14
22 34
47
50 64
77
87
88 94
97
97
99
99 99
99
99 99
99
99
99 99
22999
12
18
19
27
37
- 48
' 50
62
73
01
90
95
95
97
99
93 97
99
91
26069
1 4 6 9
10 15
23
32
33
44 56
66
68 77
85 90
91
95
97
98 98
99
99
99
99 99
49338
1 4 6 8 9 13
20 30
32
46
61 73
75
85
91
95
96
98 99
99
99 99
99
99
99 99
1856
1 2 3 3 3 .
4 6 8 9
12
17
24
25
33
43 52
64
65
73
81
82 88
92 96
97
3101
0 3 4 5 6 8
11
16
18
24
33
42
44
53
61
68 70
77
83
83
88
92
95
95 98
99
4987
1
i
/
0 & below
01
02 03
04
05
06 07
08
09 10
11
12 13
14
15
16
17 18
19
20
21
22 23
24
25 N
TABLE 15 (Cint'd)
Raw Score to Percentile Conversion Tables - By Grade and :ex and By Grade Total
Electronic Information
Post High
Post High
Post High
Raw
9th
9th
9th
School Graduate
School Graduate
School Graduate
Raw
Scores
Female
Male
Grade
Female
Male
Total
Scores
0 A below
II
II
II
0 & below
01
95
77
34
01
02
14
711
10
46
02
03
21
915
15
46
03
04
23
10
16
16
59
04
05
13
14
23
23
713
05
OC
44
18
30
31
10
18
06
07
55
23
38
40
10
23
07
08
58
24
39
42
13
24
08
09
68
30
48
53
18
31
09
Cil
10
79
38
57
65
23
39
10
Cr
11
86
47
65
75
29
47
II
12
87
48
67
77
31
48
12
13
92
58
74
86
39
57
13
14
96
68
81
91
48
64
14
15
96
68
81
95
59
72
15
16
98
77
87
96
60
73
16
17
99
85
92
98
68
79
17
18
99
90
95
99
77
85
18
19
99
90
95
99
83
89
19
20
99
95
97
99
84
90
20
21
99
97
98
99
89
93
21
22
99
99
99
99
94
96
22
23
99
99
99
99
94
96
23
N
24
99
99
99
99
97
98
24
25
99
99
99
99
99
99
25
N22999
26069
49338
1856
3101
'
4987
N
TABLE 15 (Cont'd)
Raw Score to Percentile Conversion Tables - By Grade and Sex and By
Grade Total
GENERAL MECHANICAL COMPOSITE
Raw
Scores
9th
Female
9th
Male
9th
Grade
Post High
School Graduate
Female
Post High
School Graduate
Male
Post High
School Graduate
Total
Raw
Scores
0& below
00
00
00
0& below
01
00
00
00
01
02
10
01
00
02
03
10
01
00
03
04
10
12
01
04
05
20
12
01
05
06
31
23
02
06
07
31
24
12
07
08
41
35
l'
308
01
09
52
36
13
09
CI::
10
62
47
14
10
II
82
92
411
12
93
610
25
12
13
11
37
11
36
13
14
12
48
13
37
14
15
15
510
15
38
15
16
16
511
16
49
16
17
19
613
20
411
17
18
22
714
22
512
18
19
25
816
25
513
19
20
27
918
27
614
20
21
32
10
20
31
716
21
22
35
11
23
35
818
22
23
40
13
26
39
820
23
>24
42
14
27
41
921
24
tv
8,3
25
',6
16
30
45
11
24
25
tiO
TABLE 15 (Cont'd)
GENERAL MEChANICAL COMPOSITE
Post High
Post High
Post High
Raw
9th
9th
9th
School Graduate
School Graduate
School Graduate
Raw
Scores
Female
Male
Grade
Female
Male
Total
Scores
26
50
18
33
48
12
25
26
27
55
20
37
52
13
28
27
28
57
22
38
54
14
29
28
29
62
25
42
58
16
32
29
30
65
27
45
60
17
34
30
31
69
30
49
64
20
36
31
32
71
31
50
66
21
38
32
33
75
35
54
70
23
41
33
34
78
38
57
72
25
43
34
35
81
41
60
75
28
46
35
36
83
43
62
76
30
47
36
37
85
47
65
79
33
50
37
4n
38
87
50
68
81
35
52
38
039
90
54
71
84
38
56
39
40
91
56
72
85
40
57
40
41
93
60
76
88
43
60
41
42
94
63
78
89
46
62
42
43
95
67
80
91
50
65
43
44
96
69
82
92
51
66
44
45
97
73
84
94
55
70
45
46
97
75
86
95
58
72
46
47
98
79
88
95
62
75
47
48
98
80
89
96
63
76
48
49
98
83
91
96
67
78
49
50
98
85
92
97
69
80
50
51
99
88
93
97
73
82
51
TABLE 15 (C.git'd)
GENERAL MECHANICAL COMPOSITE
Post High
Post High
Post High
Raw
9th
9th
9th
School Graduate
School Graduate
School Graduate
Raw
Scores
:Female
Male '
Grade
Female
Male
Total
Scores
52
99
89
94
97
74
83
52
53
99
91
95
98
77
85
53
54
99
9?
96
98
79
87
54
55
99
94
96
98
82
87
55
56
99
95
97
98
83
89
56
57
99
96
97
99
86
91
57
58
99
97
98
99
87
92
58
59
99
97
98
99
89
93
59
60
99
97
98
99
90
94
60
061
99
9b
98
99
92
95
61
Imik
62
99
98
99
99
94
96
62
63
99
98
99
99
94
96
63
64
99
99
99
99
95
97
64
65
99
99
99
99
95
97
65
66
99
99
99
99
97
98
66
67
99
99
99
99
98
98
67
sa99
99
99
99
98
98
68
69
99
99
99
99
98
99
69
70
99
99
99
99
99
99
70
71
99
9S
99
99
99
99
71
72
99
99
99
' 99
99
99
72
73
99
99
99
99
99
99
73
74
99
99
99
99
99
99
74
75
99
99
99
99
99
99
75
N22999
26069
49338
1856
3101
4987
N
TABLE 15 (Cont'd)
Raw Score to Percentile Conversion Tables - By Grade and Sex and By Grade TOtal
ELECTRONICS COMPOSITE
Post High
Post High
Post High
Raw
9th
9th
9th
School Graduate
School Graduate
School Graduate
Raw
Scores
Female
Male
Grade
Female
Male
Total
Scores
0 & below
11
11
01
0 & below
01
31
22
01
01
02
32
33
01
02
03
42
33
12
03
04
53
44
12
04
05
63
54
13
05.
06
71
66
14
06
07
94
68
24
07
08
10
57
92
508
09
12
69
10
36
09
CT)
10
14
710
11
36
10
1N)
11
16
710
13
37
11
12
17
812
14
48
12
13
20
914
15
59
13
14
22
10
16
17
510
14
15
26
11
18
20
611
15
16
27
12
19
21
712
16
17
31
13
22
24
714
17
18
34
14
24
26
815
18
19
38
14
26
30
917
19
20
41
16
28
32
10
18
20
21
45
18
31
36
10
20
21
22
48
20
33
38
11
21
22
23
53
21
36
42
13
24
23
24
55
22
38
44
14
25
24
25
60
25
41
47
15
27
25
Raw
Scores
9th
Female
9th
Male
9th
Grade
TABLE 15 (Cont'd)
ELECTRONICS COMPOSITE
Post High
School Graduate
Female
Post High
School Graduate
Male
Post High
School Graduate
Total
Raw
Scores
26
63
26
43
50
16
29
26
27
67
29
47
54
18
31
27
28
69
30
48
57
19
33
28
29
73
33
52
61
21
36
29
30
76
35
54
64
22
38
30
31
79
38
57
68
24
41
31
32
81
39
59
69
26
42
32
33
84
43
62
72
28
45
33
34
86
45
64
75
30
47
34
35
89
49
68
79
33
50
35
(t
36
90
51
69
81
34
52
36
Cm,
37
92
54
72
84
37
54
37
38
93
57
74
86
39
56
38
39
94
61
77
88
42
60
39
40
95
63
78
89
44
61
40
41
96
67
81
92
48
64
41
42
97
69
82
93
51
67
42
43
97
73
84
94
54
69
43
44
98
74
85
95
56
71
44
45
98
77
8i
96
60
73
45
46
98
79
88
97
63
75
46
47
98
87
88
97
65
78
47
48
99
83
90
97
67
79
48
49
99
85
92
98
70
81
49
AI
Pe
50
99
87
93
98
72
82
50
9 N
51
99
89
94
98
75
84
51
I.
ca
TABLE 15 (Cont'd)
ELECTRONICS COMPOSITE
Post High
Post High
Post High
Raw
9th
9th
9th
School Graduate
School Graduate
School Graduate
Raw
Scores
Female
Male
Grade
Female
Male
Total
Scores
52
99
90
95
98
76
85
52
53
99
92
95
98
79
87
53
54
99
93
96
99
81
88
54
55
99
93
96
99
81
88
55
56
99
95
97
99
84
90
56
57
99
96
97
99
86
91
57
58
99
96
98
99
88
92
58
59
99
97
98
99
89
93
59
60
99
97
98
99
90
94
60
61
99
98
98
99
92
94
61
Cr;
62
99
98
98
99
93
95
62
1.14
63
99
98
99
99
94
96
63
64
99
98
99
99
95
97
64
65
99
99
99
99
96
97
65
66
99
99
99
99
97
98
66
67
99
99
99
99
97
98
67
68
99
99
99
99
97
98
68
69
99
99
99
99
98
98
69
70
99
99
99
99
98
99
70
71
99
99
99
99
98
99
71
72
99
99
99
99
99
99
72
73
99
99
99
99
99
99
73
74
99
99
99
99
99
99
74
75
99
99
99
99
99
99
75
N22999
26069
49338
1856
3101
4987
N
TABLE 15 (Cont'd)
Raw Score to Percentile Conversion Tables - ByGrade and Sex and By Grade Total
MOTOR MECHANICS COMPOSITE
Post High
Post High
Post High
Raw
9th
9th
9th
School Graduate
School Graduate
School Graduate
Raw
Scores
Female
Male
Grade
Female
Male
Total
Scores
0 & below
10
11
00
01
11
11
01
02
21
11
11
03
21
22
1,
1
04
32
22
11
05
32
33
12
06
42
34
12
07
-5
34
41
2
.,''
08
76
35
51
3
Ot
09
74
56
23
Cl!
10
84
67
24
11
10
47
72
4
12
11
58
83
5
13
13
69
10
36
14
15
611
11
36
15
17
712
12
37
16
19
813
13
48
17
23
915
16
4
18
25
10
17
17
5
19
29
11
20
21
5
20
32
12
21
23
6
21
36
13
24
27
.7
22
40
14
27
23
46
16
30
24
48
17
32
25
54
20
36
9
10 12
13 15
29
816
33
18
35
19
22
40
9
10
11
0 & below
01
02
03 04
05
06 07
08
09 10
11
12 13
14
15 16
17
18 19
20 21
22
23 24
25
Raw
9th
9th
Scores
Female
Male
26
58
21
27
63
24
28
66
26
29
71
29
30
75
32
31
79
.36
32
81
38
33
85
42
34
87
45
35
90
50
36
92
52
37
94
56
C:
38
95
60
C:
39
96
64
40
97
66
41
97
71
42
98
74
43
98
78
44
98
80
45
99
83
46
99
85
47
99
88
48
99
89
49
99
91
50
99
92
51
99
94
TAM 15 (Cont'd)
MOTOR MECHANICS COMPOSITE
Post HIgh
Post High
Post High
9th
School Graduate
School Graduate
School Graduate
Raw
Grade
Female
Male
Total
Scores
_12
24
26
13
26
27
14
28
28
15
31
29
17
33
30
19
36
31
20
38
32
23
41
33
24
44
34
27
46
-35
28
48
36
32
51
37
34
54
38
3/
57
39
40
59
40
43
62
41
46
64
42
49
66
43
51
68
44
55
71
45
58
73
46
62
76
47
64
77
48
68
79
49
71
81
50
74
83
51
38
44
42
48
44
50
49
57
52
61
56
65
58
68
62
/3
65
76
69
79
70
81
74
84
76
86
79
89
81
90
84
92
85
93
88
93
89
95
91
96
92
97
93
97
94
98
95
98
96
98
96
98
TABLE 15 (Cont'd)
MOTOR MECHANIC'
OMPOSITE
Post High
Post High
Post High
Raw
9th
9th
9th
School Graduate
School Graduate
School Graduate
Raw
Scores
Female
Male
Grade
Female
Male
Total
Scores
Sc_--
52
99
95
97
99
75
84
52
53
99
95
97
99
78
86
53
54
99
96
98
99
80
87
54
55
99
97
98
99
82
89
55
56
99
97
98
99
84
90
56
57
99
98
98
99
86
91
57
58
99
98
98
99
88
92
58
59
99
98
99
99
89
93
59
Cr;
,,,,,I
60
99
98
99
99
90
94
60
61
99
98
99
99
92
95
61
62
99
99
99
99
94
96
62
63
99
'
99
99
99
94
96
63
64
99
'
99
99
99
95
97
64
65
99
99
99
99
96
97
65
66
99
99
99
99
97
98
66
67
99
99
99
99
97
98
67
68
99
99
99
99
98
98
68
69
99
99
99
99
98
99
69
70
99
99
99
99
99 ,
99
70
71
99
99
99
99
99
99
71
72
99
99
99
99
99
99
72
73
99
99
99
99
99
99
73
74
99
99
99
99
99
99
74
75
99
99
99
99
99
99
75
> t0 .4
N22999
26069
49338
1856
3101
4987
N.1
TABLE 15 (Cont'd)
Raw Score to Percentile Conversion Tables - By Grade and Sex and By Grade Total
GENERAL TECHNICAL COMPOSITE
Post High
Post High
Post High
Raw
9th
9th
9th
School Graduate
School Graduate
School Graduate
Raw
Scores
Female
Male
Grade
Female
Ma
Total
Scores
0 & below
00
00
00
0& below
01
01
11
00
01
02
11
11
11
02
03
I2
22
12
03
04
23
23
22
04
05
33
34
23
05
06
44
.1
45
34
06
07
55
55
35
07
08
66
67
46
08
09
77
79
57
09
10
88
811
68
10
Cr:
11
10
10
10
13
810
11
Cr
12
12
12
12
15
911
12
13
14
13
14
16
10
13
13
14
16
15
16
18
12
14
14
15
19
18
19
21
15
17
15
16
22
20
21
26
16
19
16
17
25
23
24
26
18
21
17
18
28
26
27
29
21
24
18
19
32
,30
31
33
_23
27
19
20
35
33
34
35
25
29
20
21
39
37
38
37
29
32
21
22
43
40
42
40
31
35
22
23
49
45
47
44
35
38
23
24
52
49
51
47
39
42
24
25
57
53
55
51
42
45
25
TABLE 15 (Cont'd)
GFNFRAL TECHNICAL COMPOSITE
Raw
Scores
26
9th
Female
61
ith
Male
9th
Grade
Post High
School Graduate
Femalo
Post High
School Graduate
Male
Post High
School Graduate
Total
Raw
Scores
57
59
54
45
48
26
27
66
62
64
58
50
53
27
28
70
66
68
61
53
57
28
29
74
70
72
64
J7
60
29
30
78
74
76
67
r,9
63
30
31
62
78
20
72
65
68
31
32
85
81
83
75
68
71
32
33
87
84
86
78
71
74
33
Are
34
90
87
88
82
76
78
34
CL!!
35
92
90
91
84
80
32
35
36
94
92
93
87
83
84
36
37
95
93
94
89
85
87
37
38
96
95
96
91
87
89
38
39
96
96
97
94
in
92
39
40
98
97
97
95
92
93
40
41
98
98
98
96
94
91
41
42
.'
99
98
98
97
95
96
42
43
99
98
99
99
96
97
a3
44
99
99
99
98
96
93
44
4-
99
99
99
99
98
98
45
46
9,'
99
99
99
99
99
46
47
99
99
99
99
99
99
47
42
99
99
99
99
99
99
-------48--------
43
99
99
99
99
99
99
49
52
9"
99
99
99
99
99
50
> Iv .ia
N22999
26069
49338
1"56
3101
4987
NC
D
Raw 3cov,. to
TABLE 15 FCont'd$
Percentile Conversion Tables - By Grade and SeA and By Grade Total
CLERICAL COMPOSITE
Post High
Post 410
Post High
Raw
9th
9th
9th
School Graduate
School Graduate
School Graduate
Raw
Scores
Female
" 'e
Grade
Female
Male
Total
-Scores
0& below
00
00
00
081 below
01
0,..,
00
U01
Oi
o0
00
0U
02
03
00
00
003
04
00
00
004
05
00
00
00
05
06
01
00
00
06
07
01
01
107
08
02
11
11
08
4\3
09
13
21
22
09
Cr
10
i3
31
22
10
11
24
32-
33
11
12
35
42
43
12
13
47
s3
54
13
14
58
64
65
14
-,-
15
610
85
76
15
16
7X12
96
88
16
17
914
12
810
917
18
11
16
--14_.
912
11
18
19
13
19
16
11
15
13
19
20
16
23
20
13
17
16
20
21
19
27
23
15
20
18
21
22
22
31
27
18
22
21
22
23
26
36
31
20
25
23
23
24
30
41
36
23
28
26
24
25
35
47
41
25
32
30
25
TABLE 15 (Cont'd)
CLERICAL COMPOSITE
Raw
Scores
9th
Female
9th
Male
9th
Grade
Post High
School Graduate
Female
-Post High
School Graduate
Male
Post High
School Graduate
Total
Raw
Scores
26
40
52
46
29
36
33
26
27
46
58
52
32
41
38
27
28
"A
64
58
35
45
42
28
29
66
69
63
40
50
46
29
30
62
75
69
44
55
51
30
31
tS
39
74
,48
io
56
31
32
73
879
53
66
132
33
-8
82
83
58
'1
66
33
34-
82
90
87
63
76
71
34
35
86
93
90
68
79
75
35
36
Sq
95
92
73
83
79
36
37
92
96
94
77
86
83
37
38
44
97
A81
89
86
38
39
46
98
yZ
85
92
89
39
40
92
98
98
88
94
92
40
41
98
98
98
90
95
93
41
42
98
99
98
92
95
95
42
43
98
99
99
95
97
96
43
44
99
99
99
96
97
97
44
45
99
99
99
97
98
97
45
46
99
99
99
98
98
98
46
47
99
99
99
98
98
98
47
48
99
99
99
98
99
98
48
49
99
99
99
99
99
99
49
-.)
99
99
99
99
99
e,
50
51
99
99
99
99
99
99
51
TABLE 15
Cont'd)
CLERICAL COMPOSITE
Raw
Scores
9th
Female
9th
Male
9th
Grade
Post High
School Graduate
Female
Post High
School Graduate
Male
Post High
School Graduate
Total
Raw
Scores
5?
99
99
99
99
99
99
52
53
99
99
99
99
99
99
53
54
99
99
99
99
99
99
54
55
99
99
99
99
99
99
55
c6
99
99
99
99
99
99
56
57
99
99
99
99
99
99
57
58
99
99
99
99
99
99
58
N2?999
26069
49338
1856
3101
4987
N
TABLE 16
MEANS AND STANDARD DEVIATIONS OF ASVAB SCORES BY AREA, GRADE AND SEX
AREA I
(CONNECTICUT, MAINE, MASSACHUSETTS, NEW HAMPSHIRE, NEW JERSEY, RHODE ISLANDAND VERMONT)
Part
M
10-F
SM
10-M
SM
11-F
5M
11-M
SM
12-F
SM
12-M
5M
Total
SPart
LS
50.38
13.19
43.24
13.47
52 71
12.59
45.90
12.79
53.86
13.06
47.04
12.77
47.94
13.67
CS
WK
13.81
4.67
13.68
4.63
15.45
4.31
15.09
4.28
15.74
4.44
15.43
4.27
14.73
4.57
WK
411Q
Co;
AR
11.78
5.24
13 16
5.57
13.66
5.34
14.97
5 51
13.94
5.52
15.48
5.39
13.74
5 63
AR
TK
6.32
3.61
13.40
5.05
7.01
4.01
14.66
5.01
6.93
4.00
15.16
5.13
10.95
5.99
TK-
SP
12.29
5.29
13.58
5.63
13.54
5.24
14.88
5.46
13.41
5.39
15.18
5.49
13.71
5.55
5P
MC
19.18
4.22
13.42
4.71
11.16
4.11
14.72
4.47
11.15
4.18
15.02
4.50
12.67
4.81
MC
SI
7 45
3.81
13.45
4.73
8 14
3.80
14.69
4.58
8.15
3.82
15.15
,4.65
11.49
5.43
51
AI
7.23
3.59
11.71
4.61
8.20
3.53
13.38
4.60
8.52
3.49
14.31
4.76
10.82
5.06
AI
El
6.97
4.29
12.31
5.62
8.1-1
4.21
14.09
5.09
8.49
4.33
14.79
5.18
11.04
5.80
EI
GM
27.19
1Q.62
40.49
12.70
29.82
10.53
44.27
12.13
29.71
10.67
45.48
12.39
36.68
13 89
GM
EL
24.13
10.87
38.04
14.35
27.50
10.64
42.90
13.14
28.13
11.00
44 60
13.32
34.75
14.95
EL
MM
24.65
9.25
36.84
12.08
27.55
8.97
41.47
11.67
28.20
9.03
43.64
12.15
34.30
13.20
MM
GT
25.59
8.76
26.85
3.99
29.10
8.47
30.06
8.58
29.68
8.81
30.91
3.46
28.4'
8.93
GT
CL
30.27
7.06
27.77
7.30
32.68
6.68
30.06
6.79
33.36
6.98
30.78
6.75
30.37
7.31
CL
N7658
8279
8315
9809
10942
15565
69514
J
TABLE 16 (Cont'cI)
AREA 11 (NEW YORK, PENNSYLVANIA AND DELAWARE;
Part
M
-1-_F
SM
10-M
S
11-F
MS
M
11-M
SM
12-F
S
12-M
SM
'otal
SPart
CS
4.1 93
14 2
42 63
12 87
54.13
13.97
47 28
13.58
55 43
13 84
48.53
1? 23
48 95
14.2'
CS
wK
13.46
4 82
13.29
4 77
15.10
4.63
14.94
4.49
15.22
4.61
15.33
4,30
14 48
4 70
WY
AR
11 96
5 37
13 04
5.57
13 93
5 62
15.27
5.75
13.98
5,65
15 73
5 50
12 97
AR
7K
6.19
3.53
13 63
4 '47
6 46
3.69
13.98
5.21
6.90
3 94
15.21
-,
2:
10.94
5 I:
TK
SP
12.36
5 28
13 67
5 55
13.43
5.48
14.96
5.56
13.49
5 41
15 22
5 s8
13 84
5 9
SP
MC
17 23
4 31
13 54
4 83
11 06
4 32
14.63
4 73
11.20
4.35
15.15
4 62
12.90
4=f5
MC
S1
7.47
3.79
11.81
4.72
7 78
3.76
14.13
4.80
8.25
3.96
15.28
4 73
11.58
5 -0
Si
AI
7 28
3.71
11.95
4.68
7.78
3.58
12 68
4.74
8'556
3.68
14.32
4 /4
10.87
5.12
Al
El
7 26
4.39
12.58
5.54
8.17
4.26
13 92
5.34
8.82
4.38
14.98
5 04
11
33
5 74
El
GM
27.28
10.66
41.29
12.60
28.99
10.69
43.23
12 73
29 99
11.09
45 76
;2 67
37 Of
14 11
GM
EL
24.75
11.19
38.70
14.46
27.40
11.01
42.47
13 97
28 84
11.33
44.91
17 25
35 47
:0:5
EL
MM
24.80
9.59
37.43
12.29
26.62
9 35
39 99
12.24
28.32
9.67
43.P0
12 22
34.53
MM
GT
25.42
9.06
26.33
9.13
29.03
9.17
30.21
9.11
29.21
9.17
3;.06
6.65
28 45
9 34
GT
LL
29.78
7 46
27.16
7.33
32.81
7.22
30.36
7 25
33.37
7.25
31.11
5.96
30.47
7.60
CL
N8345
9435
10890
13076
17142
25273
98275
TABLE 16 (Cont'd)
AREA III (DISTRICT OF COLUMBIA, MARYLAND, NORTHCAROLINA, SOUTH CAROLINA, VIRGINIA AND
WEST VIRGINIA)
Part
M
10-F
SM
10-M
S
11-F
MS
11-M
MS
12-F
MS
12-M
MS
Total
MS
Part
CS
49.01
14.85
41 85
14.44
50.46
13.81
43.98
12.96
51.55
14.19
45.23
13.71
46.88
14 60
CS
WK
11.49
5.06
11.18
5.38
12.71
5 21
12.90
5.33
12.95
5.24
13.15
5.38
12.47
5.41
'
WK
AR
10.08
5.40
11.01
5.69
11.37
5.66
13.06
5.76
11.65
5.73
13.52
5.91
11.95
5.97
AR
4 1C
TK
5.62
3 73
12.58
5.19
5 68
3.76
13.23
5.21
5.93
3.98
13.78
5.29
9.79
6 01
TK
SP
10.56
5.22
11.43
5.66
11.42
5.43
13 04
5.77
11.42
5.4r,
13.10
5.86
11.86
5.72
SP
MC
3.95
4 37
11 83
5.10
9 61
4 34
13.13
5.00
9.73
4.45
13.44
5.05
11.26
5.14
MC
SI
7.21
3 86
12.59
4.70
7.38
3.89
13.33
4.61
7.60
3.94
13.82
4.62
10.55
5.29
SI
Al
7.68
3 78
11.98
4.32
8.25
3.73
13 15
4.80
8.78
3.65
14.04
4.75
11.00
5.07
Al
t.1
7 19
4.46
11.28
5.63
7.67
4.49
12.75
5.34
8.25
4.37
13.49
5.21
10.41
5 61
El
GM
24.99
10.83
36.61
12.85
26.17
11.03
39.69
12.68
26.62
11.16
40.73
12 86
32.97
13.95
GM
EL
23 32
11 46
34 40
14 94
24.95
11.52
38.63
14.21
26.23
11.39
40.42
14.11
32.07
14 94
EL
MM
24.30
9.82
35.78
12.92
26.12
9.67
39.42
12.56
27.28
9.61
41.52
12.71
33.25
13,53
MM
GT
21.57
9.38
22.19
9.89
24.08
9.84
25.96
9.96
24.61
9.93
26.66
10.23
24.42
10.25
GT
CL
27.49
3.04
24.79
8.47
29.19
7.99
77.23
8.03
29.80
8.21
27.89
8.35
27.77
8 52
CL
6565
7168
7379
7512
22707
26762
86921
TABLE 16
Cont'd}
Pa, t
M
1:1-
F
S
10-M
MS
AREA iv 01LA8AMA, FLORIDA, GEORGIA, MISSISSIPPI AND TENNESSEE'
11-F
11-M
12-F
MS
mS
MS
M
12-M
5M
'otal
5Part
CS
49.48
13 91
41 Cl
13.22
52.72
14.29
45.
'13.52
52.56
14 77
4-,.80
14 18
47 89
14.Q7
CS
I.t
12 51
5.06
12 60
5 10
13 38
5.15
13 45
5.24
12.89
5 24
12 98
5 42
12 76
5 75
wv
AR
11.41
5.53
12 54
5 78
12.33
5 78
13 Sr)
5.94
11.74
5 72
13 56
5 94
12.40
5.93
AR
TK
5.97
3 77
12 90
4.96
6.15
3 98
13.73
5.06
6.42
4,32
14.08
5 24
10 11
E u3
TK
SP
-11 \
67
5.43
12.76
5.79
12.30
5.62
13.87
5 93
11.54
5.43
13 13
5 84
12.25
5'4
SP
mC
q 72
4.43
13 00
5 07
10.35
4.47
13.96
5.04
9 82
4.47
13.49
5 09
11 59
5.16
MC
SI
7 S4
3.87
13.07
4.62
7.69
3.91
13 80
4.55
7.81
4.06
13.96
4.54
10 78
5 27
SI
Al
7.54
3.81
11.92
4.74
8 32
3.68
13.29
4 74
9 01
3./8
14.33
4 65
11.21
5 08
AI
..:1
6.90
4.45
12.15
5.68
7.87
4 36
13.34
5.38
8.40
4.46
13.57
5.14
10.63
5.61
CI
I1M
26.74
10.94
38.90
12.75
27 68
11.19
41.47
12.74
27.16
11.39
41 J5
12 76
33.77
13.93
GM
0:
EL
23.51
11.41
37.30
14.98
26 08
11.36
40.63
14.47
26.93
11.60
40.64
14.05
32.83
14 98
EL
MM
24.80
q.93
36.83
12 67
26.93
9.75
40.54
12.68
27.86
9.93
42.15
12.64
34.00
13 57
MM
OT
24.00
4.56
25.14
9.74
25.71
9.90
27.29
10.13
24.63
9.92
26.54
10.27
25.16
10.19
GT
CL
23.75
7.b5
26.21
7.92
30.62
7.97
28 15
8.10
30.07
8 34
27.94
8.46
28.39
8.53
CL
4953
5829
7031
8421
36121
39821
118361
TABLE 16 (Cont'd)
AREA V ,(INDIANA, KENTUCKY, MICHIGAN AND OHIO)
Part
19-F
10-M
11-F
11-M
12-F
12-M
Total
S13.98
Part
MS
M5
MS
M5
MS
M5
M
_-
CS
4R 49
13.69
41
J.8
12 74
52.42
45.45
12.97
54.93
14.62
13.32
48 00
12.90
48.35
CS
13.07
14.48
13.95
io:
12.20
4 79
12 29
4 96
4.69
4.74
4.51
4.48
4.92
WK
13.78,
13.61
13 18
s/
A-2
11 89
5.3:
12.81
5.67
12 78
5.63
14.07
5.78
13.31
5.47
14.97
5.59
5 77
AR
ANI
--...
Tv
6 12
3.61
13.16
5.08
6.66
3 74
14.76
5.08
7.17
4.07
5.64
5.07
6 12
TK
14.99
11 53
12.95
13.40
14.67
W5 27
5.60
5.37
5.70
13.50
5.33
5 57
13.1548
5 63
SP
10.82
15.00
MC
9.50
4.37
12.64
5 02
4.30
14.37
4.85
11.11
4.24
4.65
5.03
MC
14.97
5:78
1::
13.45
51
7.56
3.96
4.90
8.21
3.86
4.66
8.82
4.02
4.53
11.93
5 55
SI
13 95
2,I
7 61
3 P1
12 00
5.00
8.36
3.58
4.74
9 26
3.62
15.35
4.69
11.33
5,22
1::12:
Al
11.93
13.95
El
'.00
4.49
5 64
8 15
4.29
44.62
5.29
9.23
141:2030
15.01
4.88
EI
G'S
26.76
11 08
39.85
13.14
29.82
10 82
12.70
46.55
12.27
14.92
31.13
10.78
12 99
37.43
GM
1153.79
EL M
EL
23.59
11.57
27.13
11.03
42 27
14.00
45.01
45.69
36.49
13.23
12.47
29.57
MM
24.72
9.95
36.64
27.54
9.32
42.27
9.19
35.13
29.62
35.63
GT
23.09
8.95
9.48
26.73
9.23
27 85
9.37
2/.93
8.82
29.43
12.10
8.87
26.79
9 45
GT
24.47
CL
28.02
7.39
25.78
7.51
31.09
28.59
7.10
7.36
32.59
7.01
30.13
7.04
29.40
7.68
CL
9484
10746
11031
13682
22880
29253
109663
TABLE 16 (Cont'd)
ARLA VI (IOWA, MINNESOTA, MONTANA, NORTH DAKOTA, SOUTH DAKOTA AND WISCONSIN)
Part
1D-F
MS
10-M
MS
11-F
MS
11-M
MS
12-F
MS
12-M
MS__ __
Total
MS__
Part
50 82
12.30
44 77
12.87
54.57
12.72
47.57
12.31
56.75
12 09
49.06
11.62
50.89
12.35
CS
W.
14.21
4.25
14.05
4.52
14 86
4.04
14.79
4 08
15.65
3.93
15.48
3.99
15205
4 14
WK
AR
12.94
5.11
14.24
5.45
13 95
5.26
15 49
5.35
15.14
5.32
16.56
5.27
15.15
5.45
AR
TK
7.01
3.66
14.49
4.72
7.45
3.84
16.62
4.55
8.00
4.04
17.25
4.64
12.73
6.77
TK
SP
13 37
5.19
14.70
5.43
14.21
5.08
15.37
5.25
14.97
5.03
16.06
5.24
15.02
5.29
SP
MC
11.00
4.11
14.46
4.32
11.87
3.99
15.88
4.09
12.49
3.91
16.41
4.11
14.20
4.58
MC
SI
8.29
.3.75
14.61
4 21
9.01
3.85
16.66
4.12
9.46
3.90
17.1
4 09
13.35
5 53
SI
Calk.;r
AI
8.20
3 53
12.70
4.52
9.20
3.29
15.68
4.32
9.64
3.25
16.76
4.45
13 00
5 29
AI
EI
8 15
4 28
13.39
5.12
9.24
3.99
15.31
4.34
10.00
3 89
15.92
4.27
12.76
5.24
EI
SM
29.95
10 28
43 93
11.42
32.23
10.34
48.69
11.13
33.88
10 51
50.34
11.04
41.71
13.68
GM
EL
27.30
10.77
41.25
13 04
30.35
10 07
46.49
11 38
32.49
9.84
48.25
11.29
39.72
13 72
EL
MM
27.39
8.99
39.86
11.55
30.27
8.43
47.23
10.91
31.77
8.25 '
49.94
11.22
40.20
13.55
MM
ST
27.15
8.19
28.29
8 76
28.81
8.05
30.28
8.15
30.79
8 04
32.04
8.03
30.20
8.35
GT
CI.
30.82
6.52
28.64
7 14
32.72
6.38
30.31
6.36
34.23
6.16
31.50
6.14
31.68
6.62
CL
1790
2273
5058
5629
9053
12848
39545
TABLE 16 (Cont'd)
Part
M
10-F
SM
10-M
S
AREA VII (ILLINOIS, KANSAS.
114
MS
M
MISSOURI AND
11-M
SM
NEBRASKA)
12-F
SM
12-M
SM
lotal
SPart
CS
51.43
12.72
43 40
12.12
55.17
12.43
47.73
12.20
57.40
12.82
49.17
12.56
50.77
13 10
CS
WK
13.29
4.51
13.28
4.57
14.95
4.30
14.83
4.28
15.30
4.32
15.15
4.31
14.62
4.4'
WK
AR
12.00
5.19
12.96
5.55
13.80
5.41
15.05
5.55
14.38
5 58
15.67
5.60
14.24
5 f1
AR
T. -
5.33
3.69
13.97
5.11
6.76
3.76
14.97
5.18
7.21
3.98
16.12
5.05
11.51
6 26
TK
SP
12 33
5 09
13.52
5 38
13.91
5.24
15.17
5.47
14.11
5.34
15.35
5 51
14.24
5 48
SP
MC
10.35
4.16
13.63
4.72
11.52
4 ;5
15.04
4.46
11.67
4.20
15.46
4.47
13.25
4 79
MC
SI
7.95
3.79
14.09
4.53
8.51
3.67
15.07
4.42
8.87
3.80
16.04
4.39
12.27
5 39
SI
AI
7.98
3 61
12 80
4 69
8 61
3.35
14.20
4.62
9.19
3.38
15.62
4.65
11.93
5.19
AI
El
7.51
4.21
12.73
5.25
8.43
3.99
14.44
4.95
9.05
4.05
15.17
4.72
11.72
5 52
El
GM
28.23
10.41
41.70
12.14
30.92
10.30
45.31
11.88
31.83
10.55
47.44
11.84
38.77
13 68
GM
EL
25.37
10.70
39.09
13.77
28.38
10.18
43.92
12.86
29.76
10.43
45.80
12.48
36.68
14.40
EL
MM
26.31
9.32
39 24
12.29
28.74
8.64
43.44
11.77
30.05
8.79
46.69
11.91
37.11
13.46
MM
GT
25.29
8.51
26.25
8.87
28.75
8.53
/29.87
8.59
29.68
8.70
30.82
8.72
28.86
8.95
GT
CL
30.09
6.73
27.42
6.89
33.01
6.56
30.40
6.62
34.10
6.67
31.21
6.77
31.21
7.09
CL
N6249
7095
8986
10568
15819
21003
75442
TABLE 16 (Cwit'd)
AREA VIII (ARKANSAS, LOUISIANA, OKLAHOMA AND TEXAS)
Part
M
10-F
SM
10-M
SM
11-F
S,
M
11-M
SM
12-F
SM
12-M
SM
Total
SPart
CS
49.46
13.52
43.05
13.30
52.84
14.07
45.44
13.69
53.69
13.40
46.67
13.02
48.30
14.15
CS
WK
11.97
4.98
12.04
5.32
12.82
4.95
12.85
5.19
13.40
5.05
13.46
5.13
12.80
5.21
WK
AR
10.75
5.40
11.98
5.79
11.51
5.57
12.96
5.83
12.29
5.69
13.96
.5.82
12.37
5.86
AR
TK
5.80
3.67
13.03
5.03
6.23
3.90
13.99
5.26
6.48
4.17
15.04
5.21
10.50
6.20
TK
SP
11.65
5.20
12.86
5.65
12.29
5.35
13.50
5.81
12.48
5.45
13.96
5.74
12.81
5.66
SP
MC
9.49
4.28
12.78
5.07
10.07
4.30
13.48
4.99
10.39
4.35
14.15
4.87
11.88
5.06
MC
Ci r
SI
7.29
3.80
13.03
4.58
7.76
3.90
13.89
4.57
8.05
3.97
14.76
4.49
11.12
5.37
SI
C.;
AI
8.12
3.69
12 42
4.57
8.66
3.66
13.81
4.71
9.32
3.66
15.03
4.64
11.60
5.09
Al
LI
7.08
4.27
11.74
5.36
7.60
4.31
12.76
5.27
8.54
4.29
_.
13.87
4.94
10.59
5.51
El
GM
26.22
10.55
38.92
12.55
27.80
10.88
41.29
12.63
28.57
11.16
43.49
12.45
35.06
13.94
GM
EL
23.65
10.95
36.25
14.42
'25.26
11.06
38.99
14.15
27.47
11.14
41.90
13.46
33.06
14.70
EL
MM
25.73
9.56
37.61
12.41
27.39
9.54
41.10
12.62
29.04
9.57
44.22
12.45
35.08
13.57
Mm
GT
22.72
9.26
24.01
9.95
24.33
9.40
25.81
9.84
25.68
9.62
27.42
9.82
25.17
9.94
GT
CL
28.12
7.32
26.05
7.69
30.10
/.49
27.66
7.87
30.96
7.57
28.68
7.68
28.56
7.96
CL
N6250
6340
5842
7232
17019
19952
70518
TABLE 16 (Cont'd)
AREA IX (ARIZONA, COLORADO, IDAHO, NEW MEXICO,NEVADA, UTAH AND WYOMING)
Part
M
10-F
SM
10-M
S
11-F
MS
M
11-M
SM
12-F
SM
12-M
SM
Total
SPart
LS
49.77
12.06
43.79
11.80
52.75
12.41
46.63
12.06
54.92
12.67
48:83
12.36
49 07
12.98
CS
WK
12.83
4 78
12.96
4 85
14.26
4.65
14.40
4.68
\15.15
4.61
15.00
4.63
14.07
4.84
WK
AR
11.25
5 27
12.57
5.71
13.02
5.59
14.57
5.66
13.75
5.65
15.37
5.68
13.45
5.81
AR
TK
6.77
3.66
14.65
4 85
7 72
3.95
16.49
4.72
8.04
4.13
17.25
4.62
13.23
6.23
TK
Cr
SP
12.45
5.20
14.03
5.49
14.05
5.22
15.57
5.33
14.50
5.25
16.16
5.37
14.46
5.49
SP
toe
MC
10.42
4.19
13.92
4.72
11.67
4.30
15 48
4.45
12.02
4.27
16.04
4.50
13.38
4.93
MC
SI
8.01
3.78
14.40
4.47
9.00
3.98
16.19
4.36
9.22
4.04
16.65
4.35
12.56
5.54
SI
AI
8.46
3.58
13,12
4.45
9.37.
3.58
15.39
4.65
9.86
3.61
16.38
4.69
12.40
5.25
AI
El
7.15
4.24
12.77
5.34
8.60
4.22
14.85
4.97
9.14
4.17
15.47
4.92
11.59
5.71
El
GM
28.47
10.46
42.83
12.13
32.05
10.69
47.95
11.80
32.94
10.91
49.47
11.73
39.59
14.10
GM
EL
24.71
10 68
39 47
13.87
28 86
10.76
45.18
13.02
30.30
10.80
46.99
12.95
36.55
14.95
EL
MM
27.34
9.24
4r 15
11.72
30.41
9.33
46.26
.82.
31.73
9.35
48.81
12.11
38.17
13.76
MM
GT
24.08
8.81
25.53
9.34
27.25
9.13
28.94
9.13
8.90
9.14
30.38
9.18
27.51
9.49
GT
CL
29.08
b.84
27.22
6 98
31.51
7.03
29.61
6.98
33.1
7.08
30.94
7.04
30.09
7.40
CL
N3924
4294
3268
4270
6004
7351
31881
TABLE 16 (Cont'd)
ARLA X (ALASKA, CALIFORND,, HAWAII. OREGON AND WASHINGTON)
Part
10-F
MS___
10-M
MS
11-E
MS
__
11-M
MS
11-F
MS
12-M
MS
.
Total
MS___
Part
CS
48.15
12.49
41.82
12 39
52 68
12.24
46.15
12.12
54.18
12.78
47.73
12.39
48.46
13 13
LS
WK
13.51
4.84
13 26
4.96
15.04
4.53
14.76
4.56
14.59
4.53
18.34
4.50
14.713
4 74
WK
AR
12.06
5.51
13.12
5.76
13.55
5.48
14.94
5.71
14.07
5.57
15.54
5.70
14.06
5.79
AR
TK
6.74
3.93
14.35
5.06
7.50
3.96
15.92
4.94
7.69
4.15
16.45
5.04
12.03
6.25
TK
SP
13.05
5.39
14.46
5.63
14 27
5.31
15.87
5.44
14.67
'5.42
16.37
5.46
14.92
5.58
SP
Mt.
10.69
4.44
13.78
4.97
11.8:
4 19
15.51
4.50
12.14
4.25
15.90
4 53
13.61
4.90
MC
SI
7.64
3.96
13 89
4.77
c8.54
3.86
15.59
4 52
8.84
3.97
16.08
4.57
12.30
5.59
SI
AI
7.63
3.86
12.42
4.94
8.84
3.48
14.70
4.67
9.28
3.54
15.78
4.88
12.03
5 37
/AI
El
6.70
4.22
12.51
5.73
8.22
4.14
14,56
5.10
8.73
4.18
15.23
5.03
11.54
5.82
El
GM
28.34
10.99
42.24
12.80
31.36
10.64
47.04
12.14
32.35
10.92
48.53
12 21
39.52
14.25
GM
LL
24.08
10.90
38.80
15.00
28.28
10.53
44.63
13.31
29.60
10.73
46.35
13.25
I0.68
15.14
EL
MM
26.05
10.03
38 61
13.06
29.51
9.06
44.91
11.97
30.69
9.17
47.45
12.43
37.67
13.95
MM
GT
25.57
9.15
26.38
9 53
28.60
8.89
29.69
9.11
29.65
8.92
30.88
9.04
28.79
9 35
7LL
19.23
7.31
26.87
7.55
32.27
6.85
29.81
6.97
33.31
7.00
30.91
6.96
30.55
7.43
CL
\\,
NA368
4984
9697
117
513887
18251
70477
TABLE 17
MEANS AND STANDARD DEVIATIONS OF ASVABSCORES BY AREA, GPADE AND SEX
Part
A,JEA
M
I(CH,
9 -F
TICUT, MAINE,,, MASSACHUSETTS,; NEW HAMPSHIRE,
NEW JERSEY, RHODE ISLAND ANO VERMONT)
POST-HIGH SCHOOL
PUST-HILH SCHOOL
9-M
GRADUATE FEMALES
GRADUATE MAILS
SM
SM
SM
SPart
CS
4E. 38
12.32
37.93
11 51
53.41
15.84
44.55
14.93
LS
WK
13 23
4.46
12 50
4 71
14.84
4.90
14 2c
4.17
WY
Cr
AR
I') 38
4 96
11 55
5 07
12.50
5.30
13.8b
5.
7AR
C4
TK
O.05
3 54
12 62
4 77
6.27
3.68
13 97
5.44
1K
SP
11.16
5.01
12 25
5.29
12.41
5.15
14.11
5.79
SP
ML
9 3'
4.04
12 35
4 54
10 01
3.89
12.87
5.22
Mr
SI
7 14
3.31
12.69
4.57
8 03
3.65
13.o6
5 27
SI
PI
6.63
3 E2
10 96
4.56
8 33
3 .4
13.28
5.33
AI
El
6 18
4.34
11.32
5 59
8.5/
4.14
13 16
6 03
El
GM
25 44
10.24
37.63
11 38
28.47
10.19
40 44
13.91
GM
LL
21 73
in 78
34.58
14.11
27.16
10.48
39 19
15.84
CL
MM
22.64
9.17
34 26
11.67
26.67
8.85
39 44
13.96
MM
GT
24.11
°8.24
24 05
8 53
27.34
8.83
28.13
8.91
4GT
LL
27 92
6 77
6 80
32 .,1
8.56
28 79
7.45
CI
N2503
3227
70
184
I
__TABLE 17 lCont'd1
cart
M
3 -C
AREA II
1
(NEW VURK. PENNSY'VANIA 11%0 0FLAWAPE1
POST-H111 SCHOOL
9-M
GPAOUATE FEMALES
5M
S_
P0ST-HI311 S-0Jr4
GPAgIATO
NI
Sc'art
'..s
15
3',
I! 64
39
38
11 03
51
34
14 45
44 51
16 47
CS
14,
17 77
4 5',
12 41
4 68
13 12
5 12
12 92
5 16
WY
1).96
4 89
11 69
5 30
11
10
5.36
11 97
5.59
AP
TN
5 93
'3 36
12 29
4.69
6 62
4.02
14 35
5 84
7K
SP
11.68
0 01
12 55
5 35
11 45
5 28
13.16
5 96
SP
,
MC
9.60
4 01
12 42
4 66
9 00
4.21
12 39
5 16
MC
SI
7 43
3 63
12.58
4 43
7.82
4 13
13.67
5.30
SI
Al
6 94
3.54
10 96
4 44
7.48
4 60
13.25
5 58
Al
Cr
L,
6 83
4 24
11.50
5 24
7.57
4.68
12.75
6:02
El
IMPA
GM
26 54
10.08
17 72
11 88
27 10
10.94
40.51
14.30
GM
EL
23.25
10.54
35.43
13 60
24 14
12.11
37 89
15 78
EL
MY
23.48
8.91
34.33
11.54
23 96
11.36
38.90
14.58
MM
SI
23.73
3 22
24.10
8 74
24.22
9.10
24.79
9.27
GT
CL
27.77
6.69-
25 20
6.73
29.91
7,30
27.42
8.55
CL
4174
5748
102
202
TABLE 17 Oont'd)
AREA 111 (DISTRICT OF COLUMBIA, MARYLAND,NORTfi CAROLINA, SOUTH CAROLINA, VIRGINIA AND WEST VIRGINIA)
Part
^
9-F
SM
9-M
S
POST-HIGH SCHOOL
GRADUATE FEMALES
M_
S_
POST-HIGH
GRADUATE
M
SCHOOL
MALES S
Part
CS
44 90
14 87
38.03
13 66
50 97
13.76
45.75
___
13 80
CS
wK
9 87
4 94
9 83
5 42
12 92
5.34
13.34
5 29
',Jr
Cr
AR
8 43
5 13
9.55
5.53
11
37
5 98
13.92
5 84
AR
Cil
P.
5 14
3 54
11.'3
4 88
5 81
3.95
14.13
5 20
TK
'I'
9 03
4 96
9.97
5 46
11.94
5.57
13.21
5.82
LP
MC
7 85
4 19
10.44
5.22
9.29
4.41
13 49
5 22
MC
SI
6 49
3 71
10.99
4.80
7 50
4 19
13.74
4.91
SI
AI
6.87
3 94
10 23
4.87
8.54
3.53
13.90
5 16
AI
El
5.69
4 32
9.19
5.55
8.31
4.27
13.69
5.48
EI
GM
22 35
10.19
31 95
12 99
26.94
12.09
40.68
13.32
cl.
19.23
11
04
28.82
14 85
25 91
11.31
40.87
4.79
EL
MM
21.59
10 08
30.91
13.25
26.37
9.81
41.28
13 65
MM
GT
18 29
3 98
19 38
9 79
24 30
10.41
27 26
9.81
GT
LL
24.49
8.02
22.18
8.38
29.61
8.15
28.29
8.15
CL
N1992
1958
210
503
TABLE 17 (Cont'd)
AREA IV ,(ALABAMA, FLORIDA, GEORGIA, MISSISSIPPI AND TENNESSEE)
Part
M
9-F
SM
9-M
S
POST -HIGH SCHOOL
GRADUATE FEMALES
MS
POST-HIGH SCHOOL
GRADUATE MALES
MS
,Part
CS
46 25
13.91
40.12
13.47
52.21
16.99
45.03
15 36
CS
WK
12 31
5.03
11.96
5 35
11.39
5.57
12.19
5.52
WK
AR\
10.83
5 78
11 47
5 88
9.94
5.65
12.62
5 95
AR
TK
5.75
3 6]
11
32
P.73
5.51
3.96
14 30
5 32
TK
SP
11.01
5.17
11.68
5.80
10.22
5.20
12.98
5 56
SP
MC
9.37
4.32
11.90
5.1'
8.48
4.10
12.82
4.96
MC
SI
6.98
3.54
11.38
4.51
6.96
3.91
13.69
5 08
SI
Cr
CI:
_Al
s.97
3 60
10.23
4.47
8.60
3.86
14.14
5.07
AI
EI
6.29
4 28
10.35
s.63
7.08
4.36
13.06
5.68
El
GM
24.97
10 0
34.44
12.68
24.13
10.72
40.37
13.49
GM
EL
21.95
10.96
\32.60
14.91
22.64
'11.22
38.93
15.01
EL
PM
23 31
9.42
\32.37
12.15
25.68
9.93
41.09
13.45
MM
,,T
23.17
9.71
23.43
10.13
21.33
10.17
24.80
10.24
GT
CL
27 42
7 99
25 00
8.34
28.46
8.89
26.85
8.86
LI
N4488
4349
653
889
/,--_,--
TABLE 17 (Cont'd)
AREA V (INDIANA, KENTUCKY, MiCHIGAN AND OHIO
...
,,,
Part
M
9-F
SM
9-M
S1
POST-HIGH SCHOOL
GRADUATE FEMALES
MS
POST -HIGH SCHOOL
GRADUATE MALES
MS
Part
CS
44.39
13 14
3/.95
'12.30
1I
51.28
15.86
43.58
13.99
CS
WK
!1.17
4.73
11.11
5.08
J13.18
5.fi9
12 38
5.22
WY
AR
1 94
5 14
10.71
5 40
1n 95
6.17
12.27
5.56
AR
TK
5.93
3.46
12 24
4.82
6.77
4.79
14 94
5.65
TK
SP
10.83
5.04
11.60
5.41
11.38
5.94
13.17
6 03
SP
MC
8 81
4.18
11.51
4.93
10.10
4.85
13.07
5.21
MC
S1
7.32
3.85
12 33
4.88
8.38
4.32
14.58
5.59
SI
AI
6 89
3(7
10.65
4 89
8.92
4.05
14.55
5 7/
A!
I
II
6.19
4 /47
10 34
5.68
8.73
4 80
13.67
5 96
Fl
C.M
25 46
10.59
36.26
13.02
28 13
/12.69
42.33
14.93
GM
EL
21 20
11
32.18
14.87
27.56
12,57
40.41
15.65
EL
MM
22 59
_9.5,
32,31
13.01
27.93
10.72
42.17
15.17
MM
GT
21
11
8.74
21 82
9.35
24.13
10./3
24.65
9.39
GT
CL
25 63
7.32
23.42
7 54
29.95
8.28
/
26.95
e.98
CL
43294
3620
82
310
N
a
TABLE 17 (Cont'0
Part
M
AREA VI (IOWA, MINNESOTA, MONT
,
9-F
9-M
SM
S
NORTH DAKOTA, SOLTH DAKOTA AND WISCONSIN),
POST-HIGH SCHOOL
POST-HIGH SCHOOL
GRADUATE FEMALES
GRADUATE MALES
MS
MS
Part
CS
47.25
10.80
40.55
10.86
54.90
14 24
45 24
15 72
CS
WY
13.20
4 25
13.00
1.65
14.53
3.88
14 17
4 12
WK
AR
II
51
4.10
12.27
5.33
14.23
4.84
13 74
5.39
AR
TK
6.50
3.28'
13.49
4.57
9.13
4.59
15 99
4.93
TK.
SP
11.99
5 11
12.75
5.31
13.30
4.71
14 63
5.29
SP
MC
10.02
4.06
13.31
4.51
11 17
4.48
14 63
3.70
MC
WSI
8 02
3.68
'13.54
4.08
8.50
4.38
15.85
4.61
SI
4C
AI
7 55
3.29
12.09
4.54
8 97
3.89
15 77
4 40
AI
El
6 78
3.90
12.20
5.05
8.90
4.49
14.80
5.20,
El
GM
78.03
10 36
39.83
11.23
30.30
11.46
46.33
12.32
GM
EL
23.58
9.69
37.72
13.16
28.97
11.27
44.23
12.45
EL
IN
25.32
8.68
37.48
11.54
29.10
10.26
46.18
10.39
MM
GT
24.71
7.78
25.27
8 64
28.77
7.84
27.91
8.08
GI
CL
28.60
6.16
26.19
6.65
32.47
7.78
28 95
7.27
CL
621
657
30
93
TABLE 17 (C0nt'd)
AREA VII (ILLINOIS, KANSAS, MISSOURI AND NEBRASKA)
Dat.
Y-F
4S
9-M
M5
POST-HIGH SCHOOL
GRADUATE FEMALES
MS
POST-HIGH SCHOOL
GRADUATE MALES
MS
Part
CS
4' 58
12.75
41.21
11.53
04.26
14 40
43.07
11 90
CS
'.4'
12 53
4.82
12.86
4.69
13.56
4.84
13-49
5.1?
WK
AR
10.90
5 23
11 y4
".,37
10 42
6 45
1? 98
6 12
AR
T.
5 80
3.34
1? 00
5.70
- 65
3 66
'5.57
5.35
TK
SP
11.0
4.87
12.69
5 33
12 60
4.64
13 69
5 80
SF-
MC
9 4.'
4.12
12.80
4.60
9.84
4.25
13 98
5.32
MC
5.
7 4:
3.71
12.82
4.32
8.16
3.60
14.22
5 35
SI
AI
6 70
3.69
10 82
4 61
9 26
0.55
14.58
5.05
AI
El
6.25
4 05
11.46
5.29
9.06
4.26
13.74
4 89
El
GM
26.45
10 11
38.33
11.63
28.93
9 51
42.52
14.13
GM
EL
21.96
10.26
35,71
13.57
27.95
10.95
41.46
13.35
EL
MK
22.86
9.35
34.45
11.79
29.35
9 38
43.14
13.70
MM
GT
21.44
8.83
24.80
8 88
23.98
10.16
26.48
10.1?
GT
CL
28.04
6.99
26.27
6 82
31.29
7.98
27.45
7.21
CL
1480
1661
55
124
TABLE 17 (Cont'd)
Part
9-F
MS
AREA VIII
M
(ARKANSAS. LOUISIANA. OKLAHOMA AND TElAS
POST-HIGH SCHOOL
9-M
GRADUATE FEMALES
SM
S
POST-HIGH SCHOOL
GRADUATE MALES
MS
Part
45 03
13 64
38.10
12.23
54.93
16.05
48.16
14 50
CS
WK
10.87
5.13
11
21
5 27
12 77
5 65
12.79
5.63
WI,
AR
9.52
3.38
10.74
5 59
10.83
5.88
12.66
6.06
AR
TK
5.32
3.51
12.08
4 90
6 35
4.04
14.65
5 29
Ty
SP
11.11
5.25
11.94
5.65
'11.85
5.42
14.05
5.49
MC
9.09
4.29
11.9;
5.08
9.55
4.59
13 64
4 99
MC
SI
6.08
3.75
12.33
4.65
7.53
4.38
14.50
4.84
SI
41
7.33
3 66
11.32
4.50
8.49
4 16
14 46
5.26
Al
El
5.84
4.14
10.39
5.38
7.71
4.48
13 50
5 65
El
GM
25.06
10.30
36.59
12.68
26.1----,_
12.06
43.05
13.10
GM
EL
20.77
10.71
32.79
14.45
24.98
11.87
40.64
14.78
EL
MM
23.75
9.53
34.63
12.22
26.54
11.12
47.55
13.75
MM
GT
20.39
9.44
21.95
9.66
23.60
10.59
'5.45
10.67
GT
CL
25.54
7.56
23.58
7 c"
30.77
8.98
28.51
8.70
CL
1934
473
471
N'
TABLE 17 (Cont'd)
nLA IX (ARIZONA, COLORADO, IDAHO, NEW MEXICO, NEVADA,
UTAH AND WYOMING)
Fart
M
9-F
SM
9-M
S
POST-HIGH SCHOOL
GRADUATE FEMALES
MS
P-HIGH SCHOOL
GR
UATE MALES
MS
Part
CS
45.85
13 23
39.25
12.65
51.79
14.39
44 49
16.40
CS
WK
11.29
4.67
11.15
5.10
13.68
5.42
12.61
15.48
WK
AQ
1.79
5.19
10.61
5.43
11.82
5.48
12.54
6.20
AR
TK
6.22
3.53
12.65
4.62
7.75
3.87
15.74
5.43
TK
SP
11.06
5.04
12.1f
5.16
12.32
5.69
13.32
5 79
SP
MC
9.C7
4.22
12.21
4.79
10.75
4 78
13 09
4.77
MC
SI
7.65
3.89
12.71
4.45
8.07
5.02
15.03
4.77
SI
AI
7.56
3.68
11.29
4.52
8.'3
4.20
14.90
5.70
Al
LI
6.40
4.03
10.34
5.55
7.96
4.61
12.42
5.62
El
GM
26.37
10.83
37.58
11.67
28.46
11.77
43.37
12 53
GM
EL
21.83
10.15
32.89
14.38
/26 68
12.77
3/.93
14.21
EL
*I
24.14
9.40
34.79
12.05
27.61
10.82
42.88
14.45
MM
GT
21.08
8.81
21.75
9.30
25,50
10.29
25.15
10.43
GT
CL
26.23
7.28
23.90
7.63
3.7i
8.20
27.05
8.95
CL
4690
789
28
76
N
TABLE 17 (Cont'd)
AREA V (ALASKA, CAI IFORNIA, HAWAII, OREGON AND WASHINGTON)
Part
M
9-F
M
9-M
S_-
POST-HIGH SCHOOL
GRADUATE FEMALES
MS
POST-HIGH SCHOOL
GRADUATE MALES
MS
Part
CS
43.65
11.44
38'.00
10.70
50.28
14.50
44.53
14.32
CS
WK
12.56
4.68
12.47
4.78
15 41
6.06
14.15
5.43
WK
AR
10.64
5.15
11.61
5.41
13.10
6.07
14.07
6.25
AR
TK
6.34
3 53
13.21
4.71
7 40
4.72
16.36
5.32
TK
SP
11 80
4.99
12.92
5.22
13.11
5.61
15.70
6.05
SP
MC
9.73
4.17
12.86
4.66
10.86
4.74
14.66
5.47
MC
SI
7.32
3.80
13.05
4.54
9.29
4.93
15.44
5.14
SI
AI
7.09
3.69
11.11
4.69
9.31
4.32
15.47
5.57
Al
EI
6.09
4.29
11.05
5.63
8.87
4.78
14.50
5.25
EI
GM
26.44
10.37
39.02
12.02
31 68
13.04
46.57
14.21
GM
EL
21.9i
10 76
34.97
14.28
28.60
12.59
43 66
14.78
EL
MM
23.90
9.41
35.09
12.16
29.45
11.59
45.61
14.83
MM
GT
23 19
8.68
2,.07
8.86
28.51
10.85
28.22
10.61
G-
CL
26.77
6.89
24.79
6.71
31.86
8.42
28.66
8.66
CL
N1937
2126
'4
153
249
N
TABLE 18
MEANS AND STANDARD DEVIATIONS OF ASVAB SCORES BY GRADE AND SEX. ONA NATIONAL BASIS
Part
10-F
MS
M_____
10-M
11-F
M
11-M
MS
M
12-F
12-M
Total
M___
S_
Part
Cs
49 62
l 54
42.57
13.03
53.07
13.25
46.14
12.92
4.10
13.75
47.32
13 19
48 55
14.15
CS
1.(
1.83
4.88
12.77
4.99
14 34
4 75
14.24
4.75
14.25
4.93
14.32
4.88
13.78
4 99
WK
AR
11.38
5 39
12.56
5 70
13.05
5.61
14.48
5.76
13.03
5.73
14.73
5.78
13.29
5 85
AR
Ti..
6.19
3.70
13.48
5 06
6.71
3.89
14.73
5 15
6.85
4.15
15.25
5.23
10.98
6 17
TK
SP
11 99
5 30
13.25
5.65
13.39,
5.42
14.73
5.65
12.96
5.52
14.61
5.74
13 45
5 69
SP
'IC
9.93
4.34
13.16
4 94
10.99
4.31
14 60
4,75
10.83
4.41
14.71
4.83
12.51
5 05
MC
SI
-D6
3.8E
13.54
4.71
8.14
3.86
14.75
4.65
8.32
4 00
15.16
4.64
11.60
5 48
SI
7.69
3 73
12.29
4.75
8.,6
3.57
13.87
4.75
9.07
3.63
14.95
4 76
11.48
5.20
Al
El
/.13
4.36
12.23
5.55
8 17
4.25
12.97
5.20
8.75
4.31
14.52
5.05
11.16
5 68
El
7."
'27:11
10.79
40.32
12.77
29.58
10.85
44.22
11.59
29.60
11.27
44.94
12.77
36 65
14 21
GM
EL
24.19
11.15
37.63
14.59
27.34
10.93
42.55
13.74
28.32
11.20
43.75
13.55
34.84
14.99
EL
M"
25 30
9 67
37.56
12.60
27.90
9.3'
42.34
12.34
28.97
9.50
44.61
12.53
35 47
13 72
MM
G7
24.21
Q.13
25.33
9.51
27.41
9.26
28 72
9.35
27.29
9.58
29 11
9.53
27.07
9 71
GT
CL
L9 03
7.40
26.53
7.58
31.70
7.25
29.29
7.33
31.95
7.67
29.76
7.58
29 63
7 85
CI:
59586
66445
77528
92011
171774
216238
771031
TABLE 19
MEANS AND STANDARD DEVIATIONS 01 ASVAB'S ORES BY GRADE AND SEX ON A NATIONAL