DOCUMENT RESUME ED 381 208 JC 950 198 AUTHOR Budig, Jeanne E. TITLE Postcards for Student Success. PUB DATE Mar 95 NOTE 23p.; Paper presented at a forum of the Indiana Association of Institutional Research (West Lafayette, IN, March 20-21, 1995). PUB TYPE Reports Descriptive (141) Speeches/Conference Papers (150) EDRS PRICE MFO1 /PCO1 Plus Postage. DESCRIPTORS *Academic Achievement; *Attendance Patterns; *Attendance Records; Community Colleges; Discipline Policy; Program Costs; Student Attitudes; *Teacher Student Relationship; Two Year Colleges IDENTIFIERS Student Attendance Improvement Program IA ABSTRACT Aware of the high correlation between class attendance and academic success, Vincennes University (VU) in Indiana implementea a "blue card" system to improve class attendance. The first week of class, students are asked to sign a blue card verifying their local address and allowing the release of academic information. Instructors begin class by discussing the importance of attendance and explaining that the tear-off portions of the blue cards will be used to notify students that the instructor is concerned about their absences. When students begin to miss class, postcards are sent to the student's local and permanent addresses. The first card indicates concern over non-attendance, the second is more strongly worded, and the third informs the student that he /;he has been dropped for non-attendance and has received a grate of W or WF. The cost of the program is approximately $465 per year. Parents and academic advisors unanimously support the program, and students unanimously dislike it. Data collected during the 5 years of program operation indicate the following: (1) overall card usage increased each fall semester from 5,529 (#1 cards) in 1990 to 6,230 in fall 1994; (2) campuswide, about 20% of the students receive #1 cards, with students in academic transfer courses more likely to receive these warnings than occupational students (22% vs 15% in 1994); (3) card usage was lighest in Humanities and Social Sciences courses, and lowest in Health Occupations courses; (4) about half of the students who receive #1 cards receive #2 cards; (5) the use of the "blue card system" enhanced student success and reduced the proportion of D and F grades, particularly for students in developmental courses and eat y morning courses. (Nine data tables and three graphs are included.) (KP) *********************************************************************** Reproductions supplied by EDRS are the best that can be made * from the original document. '' ***********************************************************************
Transcript
DOCUMENT RESUME
ED 381 208 JC 950 198
AUTHOR Budig, Jeanne E.TITLE Postcards for Student Success.PUB DATE Mar 95NOTE 23p.; Paper presented at a forum of the Indiana
Association of Institutional Research (WestLafayette, IN, March 20-21, 1995).
PUB TYPE Reports Descriptive (141) Speeches/ConferencePapers (150)
EDRS PRICE MFO1 /PCO1 Plus Postage.DESCRIPTORS *Academic Achievement; *Attendance Patterns;
*Attendance Records; Community Colleges; DisciplinePolicy; Program Costs; Student Attitudes; *TeacherStudent Relationship; Two Year Colleges
IDENTIFIERS Student Attendance Improvement Program IA
ABSTRACTAware of the high correlation between class
attendance and academic success, Vincennes University (VU) in Indianaimplementea a "blue card" system to improve class attendance. Thefirst week of class, students are asked to sign a blue card verifyingtheir local address and allowing the release of academic information.Instructors begin class by discussing the importance of attendanceand explaining that the tear-off portions of the blue cards will beused to notify students that the instructor is concerned about theirabsences. When students begin to miss class, postcards are sent tothe student's local and permanent addresses. The first card indicatesconcern over non-attendance, the second is more strongly worded, andthe third informs the student that he /;he has been dropped fornon-attendance and has received a grate of W or WF. The cost of theprogram is approximately $465 per year. Parents and academic advisorsunanimously support the program, and students unanimously dislike it.Data collected during the 5 years of program operation indicate thefollowing: (1) overall card usage increased each fall semester from5,529 (#1 cards) in 1990 to 6,230 in fall 1994; (2) campuswide, about20% of the students receive #1 cards, with students in academictransfer courses more likely to receive these warnings thanoccupational students (22% vs 15% in 1994); (3) card usage waslighest in Humanities and Social Sciences courses, and lowest inHealth Occupations courses; (4) about half of the students whoreceive #1 cards receive #2 cards; (5) the use of the "blue cardsystem" enhanced student success and reduced the proportion of D andF grades, particularly for students in developmental courses andeat y morning courses. (Nine data tables and three graphs areincluded.) (KP)
Abstract: Aware of the high correlation between class attendance and academic success,Vincennes University invlemented a project designed to improve class attendance. This paperdescribes the Attendance Notification System, its utilization, its acceptance by faculty andstudents, and its impact.
Aware of the high correlation between class attendance and academic success, Vincennes
University implemented a project designed to improve class attendance. The challedge was to
develop a system for notifying students early when class absences began to undermine the
likelihood of a passing grade. The criteria were that the system must be effective, immediate, and
not labor intensive. The system has now been in place for five years.
Using the automation capabilities of the mainframe computer, V.U. designed a "blue card"
4111
which students are asked to sign during the first week of class. The card verifies a local address,
and the student's signature allows the release of academic information. Instaictors begin classes
by discussing the importance of attendance and explaining that the "tear-off' portions of the blue
cards would be used to notify students that the instructor was concerned about their absences.
When students begin to miss class, the instructor tears off the first part of a computer-
generated ticket. A 10-keystroke input generates two postcards, one to the student's local
addr',ss and one to his permanent address; the cards indicate concern over non-attendance.
Further absences generate a second, more strongly worded postcard. A third tear-off generates a
letter to the student that he/she has been dropped for non-attendance and has received a grade of
W or WF. A copy of this letter is sent to the Records Office for the permanent file.
The cost of the program is nominal. Programming was a one-time effort. Printing costs
are approximately $165 per year and postage was under $300 last year.
2
Support for the Program
Parents unanimously support the program, often calling or writing the president to express
their appreciation. Students rather unanimously dislike the program on the grounds that they are
still being treated like high schoolers. (These are the same students who demand 24-hr dorm
visitation hours "to study" with a member of the opposite sex.) It should be mentioned that the
responsible students who do not miss class are totally unaffected by the project.
There was -- and continues to be -- a degree of faculty resistance to the program, on
philosophical grounds that these students are now adults and should take responsibility for their
own actions. However, many faculty have been swayed by the argument, "if you were spending
$3000 or so per semester for your son or daughter to attend college, wouldn't you like to know
when they are missing classes?"
Academic advisors express their gratitude. The system periodically generates for them a
list of their major who have received attendance notification, frequently from courses outside the
major field of study. This is the first time this information had been available.
Have "Blue Cards" made a difference?
Analysis of pilot study data found a 2-3% reduction in D/F/WF grades. The effect was
most pronounced in basic developmental mathematics classes--a 17% decrease in D/F/WF grades
and a 14% increase in AJB/C grades. The results were significant among classes scheduled at
8:00 a.m. or in the evening--a 4% increase in A/B/C grades. For the 8:00 A.M. and evening basic
developmental math classes, there was a gain of 33% in the success rate and concurrent decrease
of 33% in D/F/WF grades.
Since 1990 there have been a great many changes at V.U., particularly in the grading
system, probation standards, and curriculum. It is not possible to isolate the effects of this one
3
component of the University's enrollment management program. The only way to ascertain the
impact of this system would be to discontinue it for a term, which we are not willing to do.
One particular advantage, from an institutional research viewpoint, is the availability of
data on approximately what proportion of students, in lower level courses at an open admissions
residential college, are in jeopardy of acade:nic success because they miss class. The topic is
given broad coverage in the literature, but I do not believe an actual data exists elsewhere.
Bibliography
Astin, A.W. Preventing students from dropping out. San Francisco: Jossey-Bass. 1975.
Beal, P.E., and Noel, L. What works in student retention. IowaCity: The American College Testing Program. 1980.
Bean, J.P. and Metzner, B.S. A conceptual model of nontraditional student attrition.Review of Educational Research, 55 (4): 485-540. 1985.
Lenning. 0.T., Beal, P.E., :Ind Sauer, K Retention and attrition: Evidence for action andresearch. Boulder, CO: National Center for Higher Education Management Systems. 1980.
Noel, L., Levitz, R., Saluri, D., and Associates. Increasing student retention: Effectiveprograms and practices for reducing the dropout rate. San Francisco: Jossey-Bass. 1985.
Pascarella, E.T., ed. Studying student attrition. 'New Directions for InstitutionalResearch, no.. 36. San Francisco: Jossey-Bass. 1982.
Pascarella, E.T., and Terenzini, P T How college affects students: Findings and insightsfrom twenty years of research. San Francisco: Jossey-Bass. 1991.
Trinto, V. Leaving college: Rethinking the causes and cures of student attrition. Chicago:University of Chicago Press. 1987.
Uperaft, M.L., Gardner, J.N., and Associates. The freshmanyear experience. SanFrancisco: Jossey-Bass. 1989.
5
Research ReportUse of the Attendance Notification System
OFFICE OF INSTITUTIONAL RESEARCH
Use of the Attendance Notification System
In 1990 Vincennes University implemented an Attendance Notification System
whereby faculty members could easily notify students when class absence began to
jeopardize their academic success. The System has been in use for five years now.
The purpose of this study is to report on the continued use of Attendance Notification
cards. The data source is the Attendance System Usage Report # IB0077, Fall
semester 1990 1994.
Figure 1 is the proportion of students, by division, who received first notificationcards.
Figure II is the proportion of students, by division, who received second noti-fication cards.
Figure III is the proportion of students, by division, who received dropped fromclass for non-attendance notification cards.
The Appendix gives actual utilization of cards by division and total number ofenrolled students (duplicate count) for each division from Fall 1990 to Fall 1994.
94-56
ATTENDANCE NOTIFICATION SYSTEMReceived Card .#
30%
25%
, 20%a)2 15%a)
10%
5%
Hum HPER WSci Bus H Occ P Sery Tech
11111Fall 1990
Fall 1993 stFall 1991 II Fall 1992Fall 1994
Proportion of Students who Received First Card
DIVISION Fall 1990 Fall 1991 Fall 1992 Fall 1993 Fall 1994
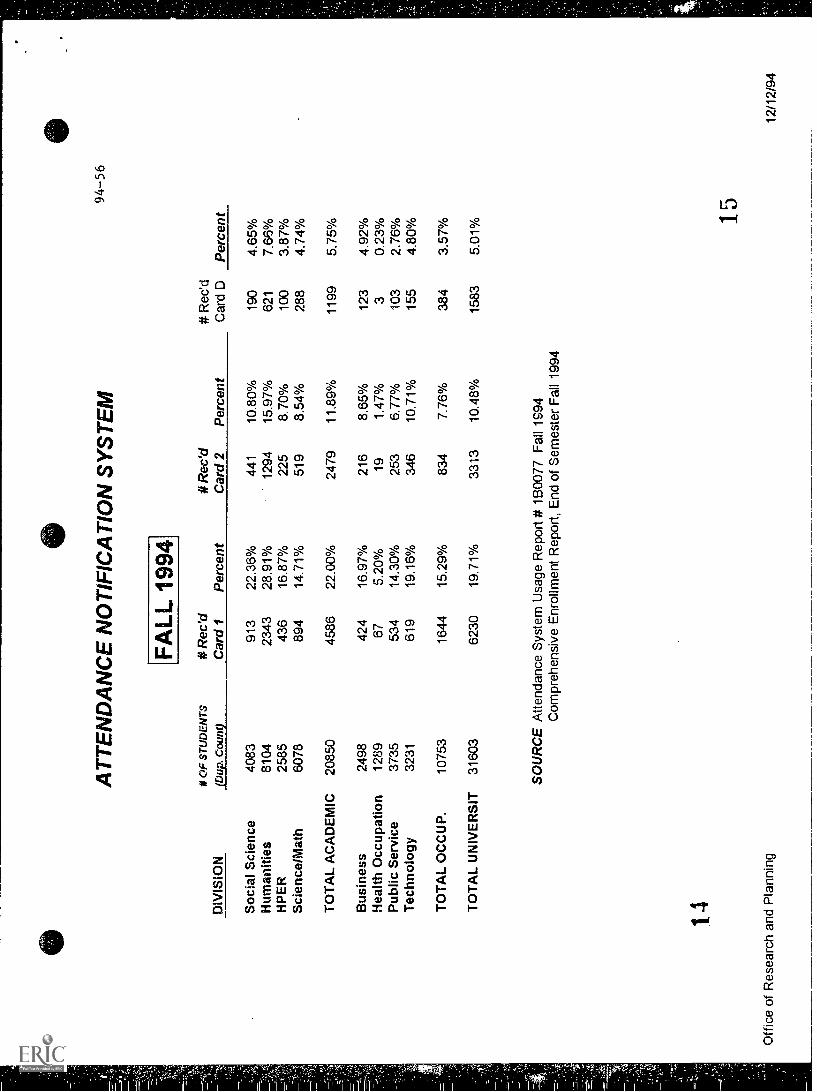
1. Overall card usage has increased each fall semester since 1990, from 5,529(card #1's) issued in 1990 to 6,230 in Fall 1994. The maximum utilization was in Fall1993 when 6,936 #1 Cards were sent.
2. Campus-wide, abdut 20% of the students receive Card # 1. In Fall 1990 itwas 16.25%.
3. Students enrolled in academic transfer courses are more likely to receive #1cards than students in occupational courses. The proportion of academic transferstudents receiving cards in 1990 was 17.31%, and in 1994 was 22.00%. Theproportion of occupational students receiving #1 cards in 1990 was 14.23% and in1994 was 15.29%.
4. Students enrolled in Humanities and in Social Sciences courses are morelikely to receive #1 cards. Since fall 1992, 20-23% of students in Social Sciencescourses and 25-28% of students in Humanities courses received #1 cards.
This suggests that students are more likely to exhibit attendance problems ingeneral education courses rather than courses within their majors. However, thepossibility that Humanities and Social Sciences faculty are more vigorous in their use ofcards cannot be ruled out.
5. Card usage is lowest in the Health Occupations division, at about fivepercent. This is no doubt due to the selective admissions into Health Occupationsprograms.
6. "Average" utilization is shown by the HPER, Science/Math, Business, PublicService, and Technology divisions, where about 15% of the students receive #1 cards.Dean Smith might be interested in exploring why the Business Division sent so manycards in Fall 1993.
7. Card usage is steadily increasing in the Technology division. Does thisincrease reflect a change in class attendance patterns among Technology students, orof support of the "blue card" system by faculty?
Attendance Notification System 94-56
Findings (Continued)
Receipt of Second Card
8. The proportion of students receiving the second card has risen since 1990 inSocial Sciences, Humanities and Technology. It has remained fairly constant in HPERand the Business Division.
9. Approximately HALF the number of students who receive #1 cards thenreceive #2 cards.
Withdrawal by the Instructor for Non-Attendance (WF. card #3)
10. Approximately 5% of the students in all divisions except Health Occupationswere withdrawn for non-attendance. The rate is higher the last two years in theBusiness and Humanities division, and is approximately 7.5% in Humanities.
Does the Attendance Notification Card System Make a Difference?
1. Results of a pilot-test (IR # 890-09) suggested that use of the "blue cardsystem" enhanced student success (more grades A,B,C, or P), and reduced theproportion of D/F grades, particularly for students in developmental courses and forcourses beginning early in the morning.
2. if #2 cards are one-half the number of #1 cards, then the first card had animpact. Did it make the student start attending class, or did it counsel the studenttoward early voluntary withdrawal?
A review of the voluntary withdrawal rates since 1990 (Student Success incourses, five year summary) does not suggest a clear increase in the proportion ofstudents withdrawing from courses in any area or division.
Nor does a review of the proportion of students being successful in coursesreveal a clear increase in student success for any division. But there has been a greatdeal of curriculum revision over this time period. Moreover, as many of the coursesbecame designated as "protected", the population enrolled in those courses is notcomparable from 1990 to 1994.
Attendance Notification System 94-56
One must look elsewhere for evidence of the success of this system. Onesource of anecdotal evidence is the record of positive reaction to the system by parentswho call the office of the Dean of Students. Those calls continue to be largely, if notexclusively, in support of the system.
A second pattern of evidence is increasing utilization of the cards by faculty. Thissuggests that faculty do think that the system is having a positive impact. Among thecomments received from Deans when they were asked about positive impacts of theprogram were the following:
"Knowing attendance performance of their advisees is important."
"We were able to save students who were not attending classes outside theirmajor."
"The system allows fewer students to 'slip through the cracks'."
"I believe they primarily achiave two goals: the awakening.of the student to thefact that we are interested in them and keeping track of their behavior (in the form ofattendance), and it probably serves to keep the faculty more accountable for reporting."
"It serves the purpose of keeping parents informed who often are in a betterposition to motivate their own. Addilionally , the system of notification providesrecorded "evidence" of how instructors had attempted to warn of impending academicproblems in the event they (instructors) would need to defend the grading of lowergrades.
The only negative attitudes toward the Attendance Notification System appearsto come from students, who say it's too strict; it treats them like high school kids; it failsto let them develop and exercise responsibility. (Trailblazer, March 27, 1992). ButDean Weaver notes that the students who are mature and responsible do not receivenor require notification of poor attendance.