The information contained in this document is subject to changewithout notice.
Agilent Technologies makes no warranty of any kind with regard to thismaterial, including but not limited to, the implied warranties ofmerchantability and fitness for a particular purpose. AgilentTechnologies shall not be liable for errors contained herein or forincidental or consequential damages in connection with the furnishing,performance, or use of this material.
Understanding EDGE (with GSM)What Is EDGE (with GSM)?
What Is EDGE (with GSM)?The Global System for Mobile communication (GSM) digitalcommunications standard defines a voice and data over-air interfacebetween a mobile radio and the system infrastructure. This standardwas designed as the basis for a radio communications system. A basestation control center (BSC) is linked to multiple base transceiverstation (BTS) sites which provide the required coverage.
EDGE (Enhanced Data Rates for GSM Evolution) enhances the GSMstandard with a new modulation format (3π/8 8PSK) and filteringdesigned to provide higher data rates in the same spectrum. EDGE hasalso been adopted as the basis for IS-136HS (NADC).
GSM 900, GSM 450, GSM 480, GSM 850, DCS 1800, and PCS 1900 areGSM-defined frequency bands. The term GSM 900 is used for anyEDGE (with GSM) system operating in the 900 MHz band, whichincludes P-GSM, E-GSM, and R-GSM. Primary (or standard) GSM 900band (P-GSM) is the original GSM band. Extended GSM 900 band(E-GSM) includes all the P-GSM band plus an additional 50 channels.Railway GSM 900 band (R-GSM) includes all the E-GSM band plusadditional channels.
DCS 1800 is an adaptation of GSM 900, created to allow for smaller cellsizes for higher system capacity. PCS 1900 is intended to be identical toDCS 1800 except for frequency allocation and power levels. The termGSM 1800 is sometimes used for DCS 1800, and the term GSM 1900 issometimes used for PCS 1900. For specifics on the bands, refer to Table1-1.
The GSM digital communications standard employs an 8:1 TimeDivision Multiple Access (TDMA) allowing eight channels to use onecarrier frequency simultaneously. The 270.833 kbits/second raw bit rateis modulated on the RF carrier using Gaussian Minimum ShiftKeying (GMSK).
The standard includes multiple traffic channels (TCH), a controlchannel (CCH), and a broadcast control channel (BCCH). The GSMspecification defines a channel spacing of 200 kHz.
8 Chapter 1
Understanding EDGE (with GSM)What Is EDGE (with GSM)?
T
U(
D(
R(
T(
T(
MD
F
T
B
M
C
T
M
M
MC
VB
able 1-1 EDGE (with GSM) Band Data
P-GSM(GSM 900)
E-GSM(GSM 900)
R-GSM(GSM 900)
DCS 1800(GSM 1800)
PCS 1900(GSM 1900)
GSM 450 GSM 480 GSM 850
plinkMS Transmit)
890 to 915MHz
880 to 915MHz
876 to 915MHz
1710 to 1785MHz
1850 to 1910MHz
450.4 to457.6 MHz
478.8 to486 MHz
824 to 849MHz
ownlinkBTS Transmit)
935 to 960MHz
925 to 960MHz
921 to 960MHz
1805 to 1880MHz
1930 to 1990MHz
460.4 to467.6 MHz
488.8 to496 MHz
869 to 894MHz
angeARFCN)
1 to 124 0 to 124and975 to 1023
1 to 124and955 to 1023
512 to 885 512 to 810 259 to 293 306 to 340 128 to 251
Understanding EDGE (with GSM)What Is EDGE (with GSM)?
The GSM framing structure is based on a hierarchical systemconsisting of timeslots, TDMA frames, multiframes, superframes, andhyperframes. One timeslot is 156.25 (157) bit periods including tail,training sequence, encryption, guard time, and data bits. Eight of thesetimeslots make up one TDMA frame. Either 26 or 51 TDMA framesmake up one multiframe. Frames 13 and 26 in the 26 frame multiframeare dedicated to control channel signaling.
EDGE employs the same symbol rate and frame structure as GSM.
EDGE and GSM signals can be transmitted on the same frequency,occupying different timeslots, and both use existing GSM equipment.Due to the similarity between the formats, the transmittermeasurements are the same, with the addition of the following threeEDGE-specific measurements:
• EDGE EVM - Provides a measure of modulation accuracy. EDGE8PSK modulation pattern uses a rotation of 3π/8 radians to avoidzero crossing, thus affording some margin of linearity relief foramplifier performance. It is substantially more demanding thanGSM modulation (GMSK), and EDGE EVM testing is necessary toreveal performance shortcomings.
• EDGE PvT - Verifies that the transmitter output power has thecorrect amplitude, shape, and timing for the EDGE format.
• EDGE ORFS - Verifies that the RF carrier is contained within thedesignated 200 kHz channel.
Mobile Stations and Base Transceiver Stations
The cellular system includes the following:
• base transceiver stations, referred to as BTS(frequency ranges dependent on the standard; refer to Table 1-1)
• mobile stations, referred to as MS(frequency ranges dependent on the standard; refer to Table 1-1)
Uplink and Downlink
Uplink is defined as the path from the mobile station to the basetransceiver station. Downlink is the path from the base transceiverstation to the mobile station.
10 Chapter 1
Understanding EDGE (with GSM)What Is EDGE (with GSM)?
What Is an ARFCN?
An ARFCN is the Absolute Radio Frequency Channel Number used inthe EDGE (with GSM) system. Each RF channel is shared by up toeight mobile stations using Time Division Multiple Access (TDMA). TheARFCN is an integer (in a range dependent on the chosen standard,refer to Table 1-1) which designates the carrier frequency.
What are Timeslots?
EDGE (with GSM) utilizes Time Division Multiple Access (TDMA) witheight time slots per RF channel which allows eight users to use a singlecarrier frequency simultaneously. Users avoid one another bytransmitting in series. The eight users can transmit once every 4.62 msfor 1 timeslot which is 577 µs long. The eight user timeslots arenumbered from 0 to 7.
Typically, each 577 µs timeslot has a length of 156.25 bit periods, whichconsists of 148 data bits and 8.25 guard bits. The 4.62 ms required tocycle through eight timeslots is called a frame. In a TDMA system, theshape of each transmitted burst must be controlled carefully to avoidover-lapping bursts in time.
Chapter 1 11
Understanding EDGE (with GSM)What Does the Agilent Technologies E4406A VSA Series Transmitter Tester Do?
What Does the Agilent Technologies E4406AVSA Series Transmitter Tester Do?The E4406A VSA Series Transmitter Tester makes measurements thatconform to the GSM 5.04, 5.05, 11.10, 11.21, and ANSI J-STD-007specifications.
These documents define complex, multi-part measurements used tomaintain an interference-free environment. For example, thedocuments include measuring the power of a carrier. The E4406Aautomatically makes these measurements using the measurementmethods and limits defined in the standards. The detailed resultsdisplayed by the measurements allow you to analyze EDGE (with GSM)system performance. You may alter the measurement parameters forspecialized analysis.
This instrument was primarily developed for making measurements ondigital transmitter carriers. These measurements can help determine ifa GSM transmitter is working correctly. The E4406A is capable ofmeasuring the continuous carrier of a base station transmitter.
For infrastructure test, the instrument will test base stationtransmitters in a non-interfering manner by means of a coupler orpower splitter.
This instrument makes the following measurements:
• Transmit Power
• Power versus Time
• Phase and Frequency Error
• Output RF Spectrum
• Spectrum (Frequency Domain)
• Waveform (Time Domain)
• Tx Band Spur
• EDGE EVM
• EDGE PvT
• EDGE ORFS
12 Chapter 1
Understanding EDGE (with GSM)Other Sources of Measurement Information
Other Sources of Measurement InformationAdditional measurement application information is available throughyour local Agilent Technologies sales and service office. The followingapplication notes treat digital communications measurements in muchgreater detail than discussed in this measurement guide.
• Application Note 1298Digital Modulation in Communications Systems - An Introductionpart number 5965-7160E
• Application Note 1312Understanding GSM Transmitter Measurements for BaseTransceiver Stations and Mobile Stationspart number 5966-2833E
Instrument Updates at www.agilent.com/find/vsa
This web location can be used to access the latest information about thetransmitter tester.
Chapter 1 13
Understanding EDGE (with GSM)Other Sources of Measurement Information
14 Chapter 1
2 Setting Up the EDGE(with GSM) Mode
15
Setting Up the EDGE (with GSM) ModeAccessing the Mode
Accessing the ModeAt initial power up, the transmitter tester will come up in the Basicmode, with the Spectrum (Frequency Domain) measurement selectedand the Measure menu displayed.
To access the EDGE (with GSM) measurement personality, press theMODE key and select the EDGE w/GSM key.
If you want to set the mode to a known factory default state, pressPreset . This will preset the mode setup and all of the measurements tothe factory default parameters.
NOTE Note that pressing the Preset key does not switch instrument modes.
You may want to install a new personality, reinstall a personality thatyou have previously uninstalled, or uninstall a personality option.Instructions can be found in “Installing Optional MeasurementPersonalities” later in this section.
16 Chapter 2
Setting Up the EDGE (with GSM) ModeHow to Make a Measurement
How to Make a MeasurementFollow the three-step process shown in the table below:
Step Primary Key Setup Keys Related Keys
1. Select &setup a mode
Mode Mode Setup , Input ,Frequency Channel
System
2. Select &setup a measurement
Measure Meas Setup Meas Control ,Restart
3. Select &setup view
View/Trace Span X Scale,Amplitude Y Scale , Display ,Next Window , Zoom
File , Save,Print , Print Setup ,Marker , Search
Chapter 2 17
Setting Up the EDGE (with GSM) ModeChanging the Mode Setup
Changing the Mode SetupNumerous settings can be changed at the mode level by pressing theMode Setup key. This will access a menu with the selections listed below.These settings affect all the measurements in the GSM mode.
Radio
The Radio key accesses a menu to select:
• Band - Select the GSM band (P-GSM, E-GSM, R-GSM, GSM 450,GSM 480, GSM 850, DCS 1800, or PCS 1900). Refer to the table inthe previous section for GSM band data.
• Device - Select the device to test BTS (Base Transceiver Station) orMS (Mobile Station).
• BTS Type - Select the type of BTS (Base Transceiver Station) to betested (Normal, Micro, or Pico).
• Freq Hopping - Turn frequency hopping on or off. If frequencyhopping is turned on, the instrument will ignore the bursts when thefrequency is hopped off the selected channel frequency. Thus onlyvalid data is included in the results. Only the Power vs. Time, andthe Phase and Frequency Error measurements can be made onhopping GSM signals.
• Carrier - Select the type of carrier to measure (Burst or Continuous).
Radio Default Settings
Band E-GSM
Device BTS
BTS Type Normal
Freq Hopping Off
Carrier Burst
18 Chapter 2
Setting Up the EDGE (with GSM) ModeChanging the Mode Setup
Input
The Input key accesses a menu to select the following. (You can alsoaccess this menu from the front-panel key Input .)
• Input Port - Choose between RF, I/Q, I Only , 50 MHz Ref, and IF Align .
• RF Input Range - To set the RF input range, choose Auto or Manual . IfAuto is chosen, the instrument automatically sets the attenuatorbased on the power level of the carrier (where the instrument istuned). If there are multiple carriers present, the total power mightoverdrive the front end. In this case you need to set the RF InputRange to Manual and enter the expected Max Total Pwr . Manual is alsoused if you want to hold the input attenuation constant (for the bestrelative power accuracy). For single carriers it is generallyrecommended to set the RF Input Range to Auto .
• Max Total Pwr - To set the maximum total power at the UUT (UnitUnder Test). This is the maximum expected value of the meancarrier power referenced to the output of the UUT (may includemultiple carriers). The Max Total Pwr setting is coupled to the InputAtten setting. If RF Input Range is set to Auto , and Max Total Pwr ischanged, RF Input Range is switched to Manual .
• Input Atten - To set the input attenuator setting. The Input Attensetting is coupled to the Max Total Pwr setting. The Input Atten keyreads out the actual hardware value that will be used for the currentmeasurement. If more than one input attenuator value is used in asingle measurement, the value used at the carrier frequency will bedisplayed. If RF Input Range is set to Auto , and Input Atten is changed,RF Input Range is switched to Manual .
NOTE The Max Total Pwr and Input Atten settings are coupled together. Whenyou switch to a different measurement, the Max Total Pwr is keptconstant, but the Input Atten may change if the two measurements havedifferent mixer margins. Thus, you can directly set the transmittertester input attenuation, or you can set it indirectly by specifying themaximum expected power at the UUT (Max Total Pwr setting).
• Ext Atten - To enter the external attenuator setting for either a BTSor MS. This will allow the instrument to display the measurementresults referred to the output of the UUT (Unit Under Test).
Chapter 2 19
Setting Up the EDGE (with GSM) ModeChanging the Mode Setup
• IF Align Signal - This key has effect only when Input Port is set to IFAlign . When IF Align is activated, the RF path is switched to bring inthe same alignment signal that is automatically switched in toperform many alignments. This selection will allow manualadjustment of the alignment signal for diagnostic purposes:
— Signal Rate - The signal is modulated by a digital sequence thatcan be set to 1 of 13 positions (rate 0 through 12) to cause thecomb spacing (or pulse timing) of the alignment signal to widen ornarrow. The key reports the comb spacing for a given rate (0 to12) in “kHz”.
— Signal Amptd - This is the DAC control that changes theamplitude of the signal. It is a 12 bit (0 to 4095) DAC. A higherDAC number will raise the signal amplitude.
— Signal Type - This can be CW (a tone that appears in the center ofthe IF), Comb , or Pulse .
Input Default Settings
Input Port RF
RF Input Range Auto
Max Total Power −15.00 dBm
Input Atten 0.00 dB
Ext Atten MS 0.00 dB
Ext Atten BTS 0.00 dB
IF Align Signal Rate 0 (= 468.75 kHz)
IF Align Signal Amptd DAC 500
IF Align Signal Type CW
20 Chapter 2
Setting Up the EDGE (with GSM) ModeChanging the Mode Setup
Trigger
The Trigger key accesses the mode setup menu for the following triggersource menus:
• Free Run (Immediate)
• RF Burst
• Video (IF Envlp)
• Ext Front
• Ext Rear
• Frame
Pressing one of the trigger source menu keys will access the triggermode setup menu. This menu is used to set the Delay , Level , and Slopefor each trigger source. Note that the actual trigger source is selectedseparately for each measurement (under the Meas Setup key).
Delay - For trigger delay use positive values. For pre-trigger usenegative values.
Level - For the RF Burst selection, the level is relative to the peaklevel of the RF signal. For the Video selection, the level is the value,in dBm at the RF input, that will cause the trigger. For the Ext Frontand Ext Rear selections, the level range is −5 to +5 volts.
Slope Pos Neg - Choose to trigger off of the leading edge(Pos ) or the trailing edge (Neg) of the burst.
Other keys accessed under the Trigger key:
• Trig Holdoff - Sets the period of time before the next trigger can occur.
• Auto Trig - Acts as a trigger timeout. If no trigger occurs by thespecified time, a trigger is automatically generated.
• Frame Timer - Accesses the menu to manually control the frametimer:
Period - Sets the period of the frame clock.
Offset - Sets a one-time phase adjustment of the frame clock.
Reset Offset - Resets the display of offset key to 0.
Sync Source - Selects the source used to sync the frame timer (ExtFront, Ext Rear, or Off).
Chapter 2 21
Setting Up the EDGE (with GSM) ModeChanging the Mode Setup
• RF Sync Delay - In measurements that detect the GSM “T0”,RF Sync Delay adjusts the “T0” point. This adjustment does not applyif the Burst Sync key is set to None , or if it is set to Training Seq in thePhase and Frequency Error measurement. The “T0” point is definedas the time point of the transition from bit 13 to bit 14 of themidamble training sequence for a given time slot.
• Burst Search Threshold - Sets the threshold level used in the searchfor EDGE (with GSM) bursts after data is acquired. This is a relativelevel based on the peak “on” power.
22 Chapter 2
Setting Up the EDGE (with GSM) ModeChanging the Mode Setup
Demod
• Burst Align - Select the burst alignment between:
EDGE (with GSM) - Uses the burst alignment as defined in theEDGE (with GSM) specifications.
1/2 Bit Offset - Shifts the burst alignment by 1/2 bit. This selectionapplies to the Power vs. Time and the Phase and Frequency Errormeasurements.
Trigger Default Settings
RF BurstDelayPeak LevelSlope
0.000 s−20.00 dBPos
VideoDelayLevelSlope
0.000 s−6.00 dBmPos
Ext FrontDelayLevelSlope
0.000 s2.00 VPos
Ext RearDelayLevelSlope
0.000 s2.00 VPos
Trig Holdoff 0.000 s
Auto Trig 100.0 ms Off
Frame TimerPeriodOffsetReset OffsetSync Source
4.615383 ms0.000 sDisplayOff
RF Sync Delay 0.000 s
Burst Search Threshold −40.00 dB
Demod Default Settings
Demod Burst Align EDGE (with GSM)
Chapter 2 23
Setting Up the EDGE (with GSM) ModeChanging the Frequency Channel
Changing the Frequency ChannelAfter selecting the desired mode setup, you will need to select thedesired ARFCN, center frequency, BMT frequency, burst type, and TSC(Training Sequence Code). The selections made here will apply to allmeasurements in the mode. Press the Frequency Channel key to accessthe following menu:
ARFCN Allows you to select the desired RF channel to bemeasured. Refer to the table in the previous section forthe ARFCN range for a specific GSM band.
Center Freq This is the current instrument center frequency. Usethis key to input a frequency that corresponds to thedesired RF channel to be measured.
BMT Freq Allows you to select the Bottom, Middle, or Topfrequencies of the selected radio band to be measured.This will automatically select a specific centerfrequency and ARFCN. Refer to the following table.
Setting Up the EDGE (with GSM) ModeChanging the Frequency Channel
Timeslot Allows you to select the timeslot to be measured.Timeslot numbers in the range of 0 to 7 can be selected.Selection of the Timeslot is based on the position on thescreen−that is Timeslot 0 is defined to be at the start ofthe data, and the data is divided into 8 timeslots (0 to7). This key will be unavailable (grayed out) if a bursttype other than Normal is selected.
Burst Type Choose an EDGE (with GSM) burst type from thefollowing selections:
TSC Allows you to select the Training Sequence Code thatdetermines which burst is to be measured. This key willbe unavailable (grayed out) if a burst type other thanNormal is selected, indicating the standard TSC is usedcorresponding to the burst type.
• Auto - In auto, the measurement is made on the firstburst found to have any one of the valid TSCs in therange of 0 to 7. The measurement may be made onvarious timeslots if more than one timeslot has oneof the 8 valid TSCs.
• Man - In manual, the measurement is made on thefirst burst found to have the selected TSC. TSCnumbers in the range of 0 to 7 can be selected. Themeasurement may be made on various timeslots ifmore than one timeslot has this same TSC.
When the EDGE (with GSM) mode is selected, the instrument willdefault to the following settings.
Function Factory Default Setting
ARFCN >251
Center Frequency 942.600 MHz
Timeslot 0 Off
Burst Type Normal(TCH & CCH)
TSC (Std) 0 Auto
Chapter 2 25
Setting Up the EDGE (with GSM) ModeEDGE (with GSM) Measurement Key Flow
EDGE (with GSM) Measurement Key FlowThe key flow diagrams, shown in a hierarchical manner on thefollowing pages, will help the user to grasp the overall functionalrelationships for the front-panel keys and the softkeys displayed at theextreme right side of the screen. The diagrams are:
“Mode Setup / Frequency Channel Key Flow” on page 28
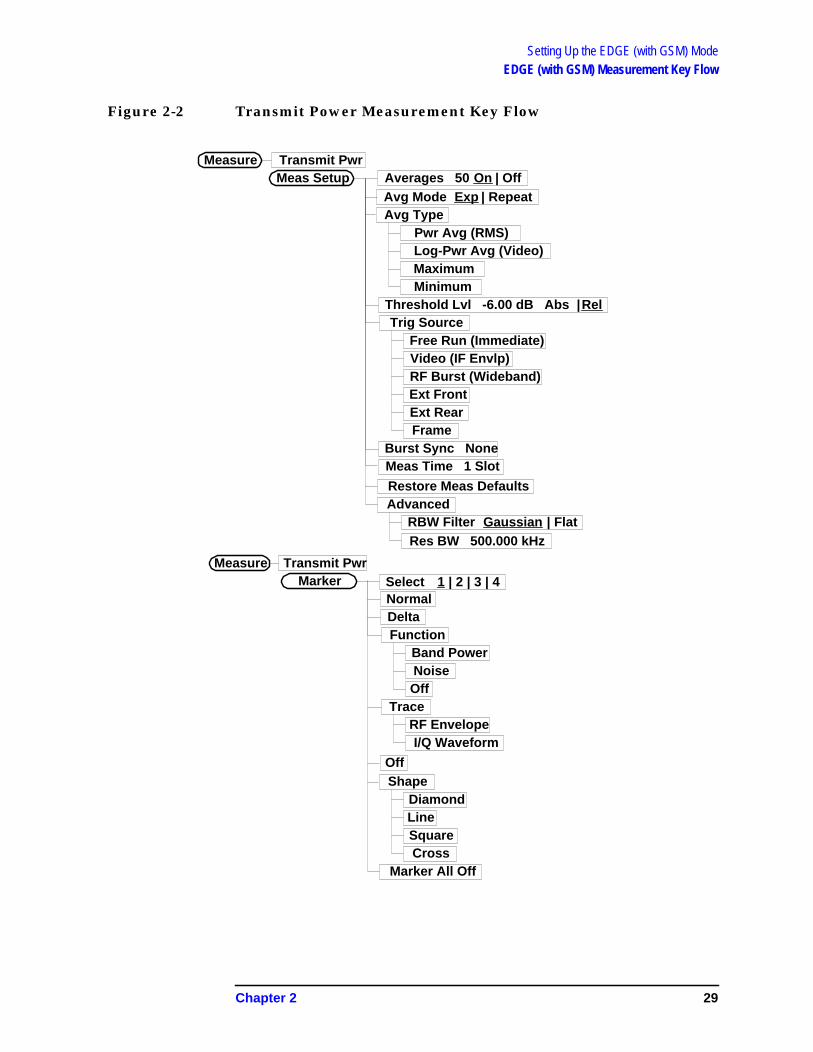
“Transmit Power Measurement Key Flow” on page 29
“Power vs. Time Measurement Key Flow” on page 30
“Phase and Frequency Error Measurement Key Flow” on page 31
“Output RF Spectrum Measurement Key Flow” on page 32
“EDGE ORFS Measurement Key Flow (1 of 2)” on page 41
Use these flow diagrams as follows:
• There are some basic conventions:
An oval represents one of the front-panel keys.
This box represents one of the softkeys displayed.
This represents an explanatory description on its specific key.
This box represents one of the default condition softkeys displayed.Default conditions are shown as much as possible with underlinedparameters or values displayed on those softkey labels.
• Follow the measurement diagram from left to right and top tobottom.
• A single softkey may allow multiple choices. For example; the Devicesoftkey reveals two choices, BTS or MS. The underlined choice is thecurrent state of the instrument. To change choices, press the softkeyone time.
• When entering a numeric value of Frequency , for example, use thenumeric keypad and terminate the entry with the appropriate unitselection from the softkeys displayed.
QPSK EVM
View/Trace
<for EVM>
Avg Number 10 On|Off
26 Chapter 2
Setting Up the EDGE (with GSM) ModeEDGE (with GSM) Measurement Key Flow
• When entering a numeric value of Slot (Std) , for example, use thenumeric keypad and terminate with the Enter front-panel key.
• Instead of using the numeric keypad to enter a value, it may beeasier to use the RPG knob or Up/Down keys.
Chapter 2 27
Setting Up the EDGE (with GSM) ModeEDGE (with GSM) Measurement Key Flow
Figure 2-1 Mode Setup / Frequency Channel Key Flow
Pre-ADC BPF On | OffPre-FFT Fltr Gaussian | FlatPre-FFT BW 1.55000 MHz Auto| Man
MeasureMeas Setup
FFT Window Flat Top (High Amptd Acc)Flat Top (High Amptd Acc)UniformHanningHammingGaussian (Alpha 3.5)BlackmanBlackman-HarrisK-B 70 dB (Kaiser-Bessel)K-B 90 dB (Kaiser-Bessel)K-B 110 dB (Kaiser-Bessel)
FFT SizeLength Ctrl Auto | ManMin Pnts/RBW
(a)
Average
Chapter 2 33
Setting Up the EDGE (with GSM) ModeEDGE (with GSM) Measurement Key Flow
Setting Up the EDGE (with GSM) ModeEDGE (with GSM) Measurement Key Flow
Figure 2-15 EDGE ORFS Measurement Key Flow (2 of 2)
Select 1 | 2 | 3 | 4NormalDeltaFunction
Band PowerNoiseOff
TraceRF Envelope ModulationRF Envelope Switching
OffShape
DiamondLineSquareCross
Marker All Off
MarkerEDGE ORFSMeasure
42 Chapter 2
Setting Up the EDGE (with GSM) ModeInstalling Optional Measurement Personalities
Installing OptionalMeasurement PersonalitiesWhen you Install a measurement personality, you follow a two stepprocess.
1. Install the measurement personality firmware into the instrument.(See the supplied installation instructions.)
2. Enter a license key number to enable the measurement personality.(Refer to the “License Key Numbers” section below.)
Adding additional measurement personalities requires purchasing aretrofit kit for the desired option. The retrofit kit contains themeasurement personality firmware. A license key certificate is alsoincluded in the kit. It documents the license key number that is for yourspecific option and instrument serial number. Installation instructionsare included with the retrofit kit.
The installation instructions require you to know three pieces ofinformation about your instrument: the amount of memory installed,the Host ID, and the instrument serial number.
The Exit Main Firmware key is used during the firmware installationprocess. This key is only for use when you want to update firmwareusing a LAN connection. The Exit Main Firmware key halts the operationof the instrument firmware so you can install an updated version offirmware using a LAN connection. Instructions for loading futurefirmware updates are available at the following URL:www.agilent.com/find/vsa/
Required information: Key Path:
InstrumentMemory:
__________________
System , File System(the amount of memory in yourinstrument will be the sum of the Usedmemory and the Free memory)
Host ID:__________________
System , Show System , Host ID
InstrumentSerial Number:__________________
System , Show System , Serial Number
Chapter 2 43
Setting Up the EDGE (with GSM) ModeInstalling Optional Measurement Personalities
Available Personality Options
The option designation consists of three characters, as shown in theOption column of the table below.
License Key Numbers
Measurement personalities purchased with your instrument have beeninstalled and enabled at the factory. You will receive a unique licensekey number with every measurement personality purchased. Thelicense key number is a hexadecimal number that is for your specificmeasurement personality and instrument serial number. It enables youto install, or reactivate that particular personality.
Follow these steps to display the unique license key number for themeasurement personality that is installed in your instrument:
1. Press System , Install , Choose Option. The Choose Option key accessesthe alpha editor. Use the alpha editor to enter letters (upper-case)and the front-panel numeric keys to enter digits for a personalityoption that is already installed in the instrument.
2. Press the Done key on the alpha editor menu. The unique license keynumber for your instrument will now appear on the License Keysoftkey.
Available Personality Optionsa Option
GSM measurement personality BAH
EDGE (with GSM) measurement personalityb 202
cdmaOne measurement personality BAC
NADC, PDC measurement personalities BAE
iDEN measurement personality HN1
W-CDMA measurement personality BAF
cdma2000 measurement personality B78
a. Available as of the print date of this guide.b. For instruments that already have Option BAH licensed,
order E4406AU Option 252 to add EDGE (with GSM).
44 Chapter 2
Setting Up the EDGE (with GSM) ModeInstalling Optional Measurement Personalities
You will want to keep a copy of your license key number in a securelocation. Please enter your license key numbers below for futurereference. If you should lose your license key number, call your nearestAgilent Technologies service or sales office for assistance.
If you purchase an option later, you will receive a certificate thatindicates the unique license key number that you will need to installthat option on your particular serial number instrument.
NOTE You will need to enter a license key number only if you purchase anadditional measurement personality at a later date, or if you want toreactivate a measurement personality that has been deactivated.
Installing a License Key Number
NOTE Follow this procedure to reinstall a license key number which has beendeleted during the uninstall process, or lost due to a memory failure.
To install a license key number for the selected option, use the followingprocedure:
1. Press System , Install , Choose Option . The Choose Option key accessesthe alpha editor menu. Use the alpha editor to enter letters(upper-case) and the front-panel numeric keys to enter numbers forthe option designation. Then press the Done key. As you enter theoption, you will see your entry in the active function area of thedisplay.
Note: that you must already have entered the license key for theGSM option BAH before you can enter the license key for the EDGEretrofit option 252.
2. Press License Key. Use the alpha editor to enter letters and thefront-panel numeric keys to enter digits. You will see your entry inthe active function area of the display. When you have completedentering the license key number, press the Done key.
License Key Numbers for Instrument with Serial # ________
For Option______________ the license key number is _____________________
For Option______________ the license key number is _____________________
For Option______________ the license key number is _____________________
For Option______________ the license key number is _____________________
For Option______________ the license key number is _____________________
For Option______________ the license key number is _____________________
Chapter 2 45
Setting Up the EDGE (with GSM) ModeInstalling Optional Measurement Personalities
3. Press the Install Now key after you have entered the personalityoption number and the license key number. On some instruments, amessage may appear in the function area of the display which reads,“Insert disk and power cycle the instrument ”. Disregardthis message. If you want to proceed with the installation, press theYes key and cycle the instrument power off and then on. Press the Nokey if you wish to cancel the installation process.
Using the Uninstall Key
The following procedure removes the license key number for theselected option. This will make the option unavailable for use, and themessage “Application Not Licensed ” will appear in the Status/Infobar at the bottom of the display. Please write down the 12-digit licensekey number for the option before proceeding. If that measurementpersonality is to be used at a later date you will need the license keynumber to reactivate the personality firmware.
NOTE Using the Uninstall key does not remove the personality from theinstrument memory, and does not free memory to be available to installanother option. If you need to free memory to install another option,refer to the instructions for loading firmware updates located at theURL: www.agilent.com/find/vsa/
1. Press System , More(1 of 3) , More(2 of 3) , Uninstall , Choose Option .Pressing the Choose Option key will activate the alpha editor menu.Use the alpha editor to enter the letters (upper-case) and thefront-panel numeric keyboard to enter the digits (if required) for theoption, then press the Done key. As you enter the option, you will seeyour entry in the active function area of the display.
2. Press the Uninstall Now key after you have entered the personalityoption. Press the Yes key if you want to continue the uninstallprocess. Press the No key to cancel the uninstall process.
3. Cycle the instrument power off and then on to complete the uninstallprocess.
46 Chapter 2
3 Making EDGE (with GSM)Measurements
47
Making EDGE (with GSM) MeasurementsEDGE (with GSM)Measurements
EDGE (with GSM)MeasurementsOnce in the EDGE w/GSM mode, the following measurements for theGSM 450, GSM 480, GSM 850, GSM 900, DCS 1800, and PCS 1900bands are available by pressing the Measure key.
❏ Transmit Power on page 54
❏ Power vs. Time on page 59
❏ Phase and Frequency Error on page 64
❏ Output RF Spectrum on page 71
❏ Spectrum (Frequency Domain) on page 83
❏ Waveform (Time Domain) on page 92
❏ Tx Band Spur on page 99
❏ EDGE EVM on page 103
❏ EDGE PvT on page 103
❏ EDGE ORFS on page 103
These are referred to as one-button measurements. When you press thekey to select the measurement it will become the active measurement,using settings and a display unique to that measurement. Dataacquisitions will automatically begin provided trigger requirements, ifany, are met.
48 Chapter 3
Making EDGE (with GSM) MeasurementsPreparing for Measurements
Preparing for MeasurementsIf you want to set the EDGE w/GSM mode to a known, factory defaultstate, press Preset . This will preset the mode setup and all of themeasurements to the factory default parameters.
NOTE Pressing the Preset key does not switch instrument modes.
To preset only the settings that are specific to the selectedmeasurement, press Meas Setup , More , Restore Meas Defaults . This willset the measure setup parameters, for the currently selectedmeasurement only, to the factory defaults.
Initial Setup
Before making a measurement, make sure the mode setup andfrequency/channel parameters are set to the desired settings. Refer tothe sections “Changing the Mode Setup” and “Changing the FrequencyChannel” in the previous chapter.
How to Make a Measurement
Follow the three-step process shown in the table below:
Step Primary Key Setup Keys Related Keys
1. Select &setup a mode
Mode Mode Setup , Input ,Frequency Channel
System
2. Select &setup a measurement
Measure Meas Setup Meas Control ,Restart
3. Select &setup view
View/Trace Span X Scale,Amplitude Y Scale , Display ,Next Window , Zoom
File , Save,Print , Print Setup ,Marker , Search
Chapter 3 49
Making EDGE (with GSM) MeasurementsPreparing for Measurements
Measurement Control
The Meas Control front panel menu key controls processes that affectthe running of the current measurement.
• Measure softkey. Press Meas Control , Measure (not to be confused withthe front panel Measure key which has a different function) to togglebetween Single and Cont (for continuous) measurement states.When set to Single, the measurement will continue until it hasreached the specified number of averages set by the average counter.When set to Continuous, the measurement will run continuously,and perform averaging according to the current average type (repeator exponential). The default setting is continuous.
• Pause key. Press Meas Control , Pause to pause the currentmeasurement. Once toggled, the label of the Pause key changes toread Resume . The Resume key, once pressed, continues the activemeasurement from the point at which it was paused.
• Restart key. The Restart front panel key repeats the currentmeasurement from the beginning, while retaining the currentmeasurement settings.
50 Chapter 3
Making EDGE (with GSM) MeasurementsPreparing for Measurements
Measurement Setup
The Meas Setup key accesses features that enable you to adjustparameters of the current measurement, such as resolution bandwidth.You will also use the Meas Setup menu to access the Average, Trig Source ,and Advanced measure setup feature menus.
The following measure setup features can be used with many or allmeasurements.
• Res BW key. Press Meas Setup , Res BW to change the resolution of agiven measurement. Selection of a narrower bandwidth will result ina longer data acquisition time.
• Restore Meas Defaults key. To preset only the settings that arespecific to the selected measurement, press Meas Setup , More ,Restore Meas Defaults . This will set the measure setup parameters,for the currently selected measurement only, to the factory defaults.
EDGE (with GSM) Averaging
Selecting one of the averaging keys in the Meas Setup menu will allowyou to modify the number, averaging mode, and type of averaging youuse for the currently selected measurement.
• Averages, Avg Bursts On Off, or Avg Number - Allows you to selectwhether averages are made or not.
• Avg Mode Exp Repeat - Allows you to choose either exponential orrepeat averaging. This selection only effects the averaging after thenumber of N averages is reached (set using the Averages ,Avg Bursts , or Avg Number key).
— Exponential averaging: When Measure is set at Cont , dataacquisitions will continue indefinitely. After N averages,exponential averaging is used with a weighting factor of N (thedisplayed average count stops at N). Exponential averagingweights new data more than old data, which allows tracking ofslow-changing signals. The weighting factor N is set using theAverages , Avg Bursts , or Avg Number key.
— Repeat averaging: When Measure is set at Cont , dataacquisitions will continue indefinitely. After N averages isreached, all previous result data is cleared and the average countis set back to 1. This is equivalent to being in Measure Single andpressing the Restart key each time the Single measurementfinishes.
Chapter 3 51
Making EDGE (with GSM) MeasurementsPreparing for Measurements
• Avg Type - Select the averaging type from the following selections:(Not all of the selections are available for all measurements)
Pwr Avg (RMS) - The true power averaging, and is equivalent totaking the RMS of the voltage. It is the most accurate type.
Log-Pwr Avg (Video) - Simulates the traditional spectrum analyzertype of averaging by averaging the log of the power.
Mean - Averages the mean values.
Voltage Avg - Averages the voltage values.
Maximum - Keeps track of the maximum values.
Minimum - Keeps track of the minimum values.
Max & Min - Keeps track of the maximum and minimum values.
Trig Source
Changing the selection in the Trig Source menu alters the trigger sourcefor the selected measurement only. Not all of the selections areavailable for all measurements. Note that the RF Burst (Wideband) ,Video (IF Envlp) , Ext Front , and Ext Rear menu keys found in the Triggermenu enable you to change settings to modify the delay, level, and slopefor each of these trigger sources. Choose one of the following triggersources:
• Free Run (Immediate) - The trigger occurs at the time the data isrequested, completely asynchronous to the RF or IF signal.
• RF Burst (Wideband) - An internal wideband RF burst trigger thathas an automatic level control for burst signals. It triggers on a levelthat is relative to the peak of the signal passed by the RF.
• Video (IF Envlp) - An internal IF envelope trigger. It triggers on anabsolute threshold level of the signal passed by the IF.
• Ext Front - Activates the front panel external trigger input (EXTTRIGGER INPUT). The external trigger must be a signal between −5and +5 volts.
• Ext Rear - Activates the rear panel external trigger input (TRIGGERIN). The external trigger must be a signal between −5 and +5 volts.
• Frame - Uses the internal frame clock to generate a trigger signal.The clock parameters are controlled under the Mode Setup key or themeasurement firmware, not both. See the specific measurement fordetails.
Rear panel TRIGGER 1 OUT and TRIGGER 2 OUT connectors are coupledto the selected trigger source. These trigger outputs are always on therising edge with a pulse width of at least 1 µs.
52 Chapter 3
Making EDGE (with GSM) MeasurementsPreparing for Measurements
Burst Sync
Pressing the Burst Sync key allows you to choose the source used tosynchronize the measurement to the “T0” point of the GSM burst. The“T0” point is defined as the time point of the transition from bit 13 to bit14 of the midamble training sequence for a given time slot. TheBurst Search Threshold setting (in the Mode Setup keys under Trigger )applies to both Training Seq and RF Amptd . It is described on page 22.Pressing the Burst Sync key will bring up a menu with some or all of thefollowing choices:
• Training Seq - Synchronizes the measurement to the timing of thedemodulated training sequence in the GSM burst. This is the mostprecise method, but requires a GSM burst with a valid TSC(Training Sequence Code). The “T0” point is determined bydemodulation of the burst and successful identification of the TSC.“T0” is then found to within 1/10 bit.
• RF Amptd - Synchronizes the measurement to the burst transition ofthe measured RF carrier. “T0” is set to the 50% point between thestart and end of the burst.
• None - Use the start of the time record as the start of the useful part.“T0” is set to the middle of the useful part.
• Ext - Use the external trigger plus delay as the start of the usefulpart. “T0” is set to the middle of the useful part.
Chapter 3 53
Making EDGE (with GSM) MeasurementsMaking the Transmit Power Measurement
Making the Transmit Power Measurement
Purpose
Transmit Power is the measure of in-channel power for EDGE (withGSM) systems. Mobile stations and base transceiver stations musttransmit enough power, with sufficient modulation accuracy, tomaintain a call of acceptable quality without leaking into frequencychannels or timeslots allocated for others. EDGE (with GSM) systemsuse dynamic power control to ensure that each link is maintained withminimum power. This gives two fundamental benefits: overall systeminterference is kept to a minimum and, in the case of mobile stations,battery life is maximized.
The Transmit Power measurement determines the average power foran RF signal burst at or above a specified threshold value. Thethreshold value may be absolute, or relative to the peak value of thesignal.
At the base transceiver station, the purpose of the Transmit Powermeasurement is to determine the power delivered to the antennasystem on the radio-frequency channel under test. The Transmit Powermeasurement verifies the accuracy of the mean transmitted RF carrierpower. This can be done across the frequency range and at each powerstep.
Measurement Method
The instrument acquires a EDGE (with GSM) signal in the timedomain. The average power level above the threshold is then computedand displayed. This measurement uses the “power-above-threshold”method instead of the “useful part of the burst” method defined in theEDGE (with GSM) standards. The measured Transmit Carrier Powerwill be very nearly the same for these two methods. Thepower-above-threshold method has the advantages of being faster andallows power measurements to be made at somewhat lower powerlevels. It also has the advantage of not requiring the carrier to have avalid TSC (Training Sequence Code).
Note that this measurement does not provide a way to specify whichtimeslot is to be measured. Therefore if multiple timeslots are on, theyshould all be set at the same power level, or the levels of those timeslotsto be excluded need to be kept below the threshold level. If you want tomeasure Transmit Carrier Power using the GSM specified useful partof the burst method, use the Power vs. Time measurement, which alsomeasures the power ramping of the burst.
54 Chapter 3
Making EDGE (with GSM) MeasurementsMaking the Transmit Power Measurement
Making the Measurement
NOTE The factory default settings provide a EDGE (with GSM) compliantmeasurement. For special requirements, you may need to change someof the settings. Press Meas Setup , More (1 of 2) , Restore Meas Defaults atany time to return all parameters for the current measurement to theirdefault settings.
Select the desired ARFCN, center frequency, timeslot, burst type, andTSC (Training Sequence Code) as described in the section titled“Changing the Frequency Channel” on page 24.
Press Measure , Transmit Pwr to immediately make Transmit Power theactive measurement.
To change any of the measurement parameters from the factory defaultvalues, refer to the “Changing the Measurement Setup” section for thismeasurement.
Chapter 3 55
Making EDGE (with GSM) MeasurementsMaking the Transmit Power Measurement
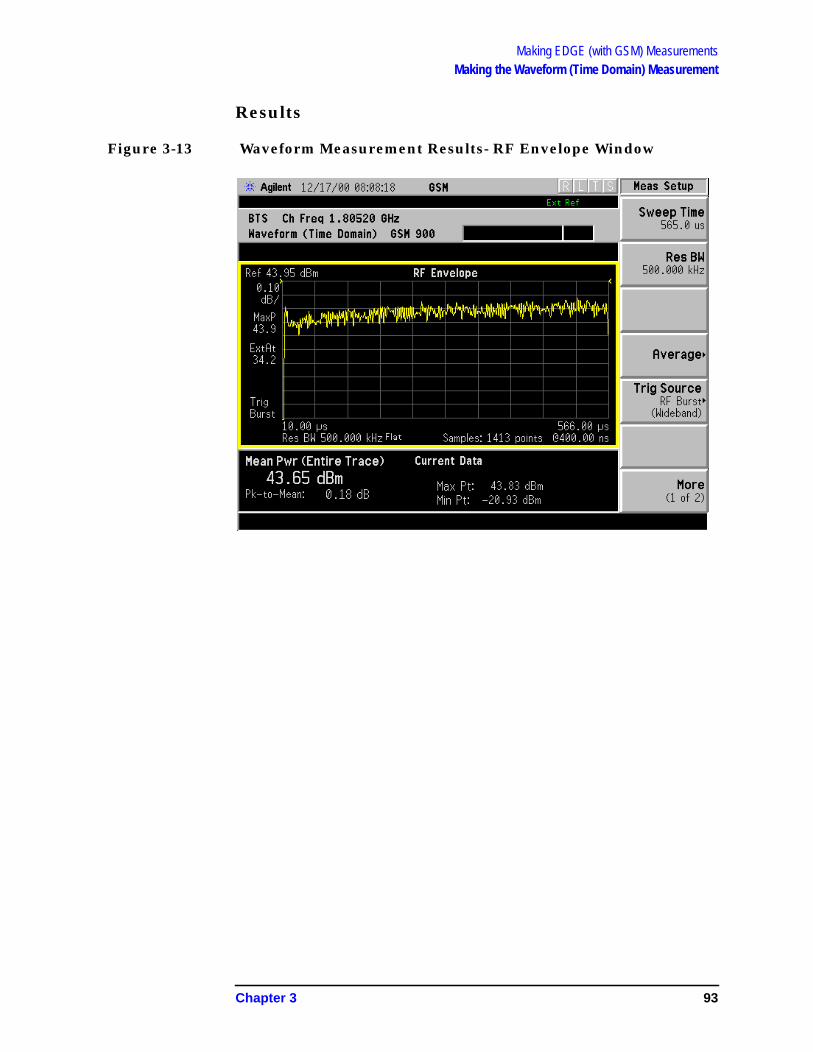
Results
Figure 3-1 Transmit Power Result - Single Burst
Figure 3-2 Transmit Power Result - Multiple Bursts
56 Chapter 3
Making EDGE (with GSM) MeasurementsMaking the Transmit Power Measurement
Changing the Measurement Setup
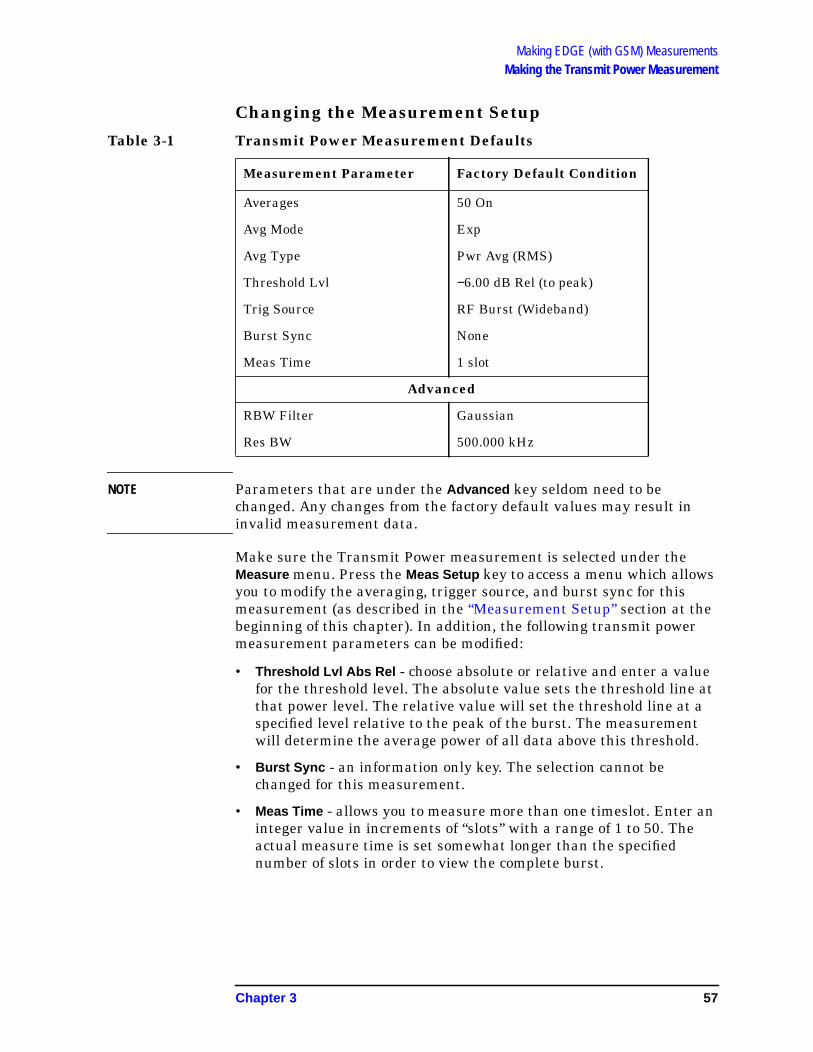
NOTE Parameters that are under the Advanced key seldom need to bechanged. Any changes from the factory default values may result ininvalid measurement data.
Make sure the Transmit Power measurement is selected under theMeasure menu. Press the Meas Setup key to access a menu which allowsyou to modify the averaging, trigger source, and burst sync for thismeasurement (as described in the “Measurement Setup” section at thebeginning of this chapter). In addition, the following transmit powermeasurement parameters can be modified:
• Threshold Lvl Abs Rel - choose absolute or relative and enter a valuefor the threshold level. The absolute value sets the threshold line atthat power level. The relative value will set the threshold line at aspecified level relative to the peak of the burst. The measurementwill determine the average power of all data above this threshold.
• Burst Sync - an information only key. The selection cannot bechanged for this measurement.
• Meas Time - allows you to measure more than one timeslot. Enter aninteger value in increments of “slots” with a range of 1 to 50. Theactual measure time is set somewhat longer than the specifiednumber of slots in order to view the complete burst.
Table 3-1 Transmit Power Measurement Defaults
Measurement Parameter Factory Default Condition
Averages 50 On
Avg Mode Exp
Avg Type Pwr Avg (RMS)
Threshold Lvl −6.00 dB Rel (to peak)
Trig Source RF Burst (Wideband)
Burst Sync None
Meas Time 1 slot
Advanced
RBW Filter Gaussian
Res BW 500.000 kHz
Chapter 3 57
Making EDGE (with GSM) MeasurementsMaking the Transmit Power Measurement
• Advanced - accesses a menu to change the following parameters:
RBW Filter - this key toggles to select a Flat Top or a Gaussian (thedefault filter) resolution bandwidth filter. A Gaussian filterprovides more even time domain response, particularly for bursts.A Flat Top filter provides a flatter bandwidth but is less accuratefor pulse responses. A Flat Top filter also requires less memoryand allows longer data acquisition times.
Res BW - sets the resolution bandwidth.
Troubleshooting Hints
Low output power can lead to poor coverage and intermittent servicefor phone users. Out of specification power measurements indicate afault usually in the power amplifier circuitry. They can also provideearly indication of a fault with the power supply, i.e. the battery in thecase of mobile stations.
58 Chapter 3
Making EDGE (with GSM) MeasurementsMaking the Power vs. Time Measurement
Making the Power vs. Time Measurement
Purpose
Power vs. Time measures the mean transmit power during the “usefulpart” of GSM bursts and verifies that the power ramp fits the withinthe defined mask. Power vs. Time also lets you view the rise, fall, and“useful part” of the GSM burst.
GSM is a Time Division Multiple Access (TDMA) scheme with eighttime slots, or bursts, per RF channel. If the burst does not occur atexactly the right time, or if the burst is irregular, then other adjacenttimeslots can experience interference. Because of this, the industrystandards specify a tight mask for the fit of the TDMA burst.
The Power vs. Time measurement provides masks for both BTS (BaseTransceiver Station) and MS (mobile station). The timings arereferenced to the transition from bit 13 to bit 14 of the midambletraining sequence. The 0 dB reference is determined by measuring themean transmitted power during the “useful part” of the burst. You canalso define a user configurable limit mask to apply to the measuredburst using SCPI commands (refer to the “Changing the MeasurementSetup” section).
The GSM specifications defines the “useful part” of the normal GSMburst as being the 147 bits centered on the transition from bit 13 to bit14 (the “T0” time point).
Measurement Method
The instrument acquires a EDGE or GSM signal in the time domain.The “T0” point and the useful part are computed. If Burst Sync is set toTraining Seq , a GSM demodulation is performed to find “T0”. If BurstSync is set to RF Amptd , an approximation of “T0” will be used withoutperforming a demodulation. The average power in the useful part isthen computed and displayed, and the GSM limit mask is applied. Themeasurement displays Pass when the burst fits within the bounds ofthe mask.
Chapter 3 59
Making EDGE (with GSM) MeasurementsMaking the Power vs. Time Measurement
Making the Measurement
NOTE The factory default settings provide a EDGE (with GSM) compliantmeasurement. For special requirements, you may need to change someof the settings. Press Meas Setup , More (1 of 2) , Restore Meas Defaults atany time to return all parameters for the current measurement to theirdefault settings.
Select the desired ARFCN, center frequency, timeslot, burst type, andTSC (Training Sequence Code) as described in the section titled“Changing the Frequency Channel” on page 24.
Timeslot is available when Burst Sync is either Training Sequence orRF Amptd .
The timeslots are determined by taking the acquired data and dividingit into timeslots 0 to 7. An active timeslot burst must be withinapproximately 25% of the expected timeslot position, otherwise theE4406A may think the burst is an adjacent timeslot and may not detectit. The trigger delay can be used to position the signal if it is notaligning in the timeslots as desired.
Press Measure , Pwr vs Time to immediately make Power vs. Time theactive measurement.
To change any of the measurement parameters from the factory defaultvalues, refer to the “Changing the Measurement Setup” section for thismeasurement.
60 Chapter 3
Making EDGE (with GSM) MeasurementsMaking the Power vs. Time Measurement
Results
Figure 3-3 Power vs. Time Measurement Result - Burst View
Chapter 3 61
Making EDGE (with GSM) MeasurementsMaking the Power vs. Time Measurement
Changing the Measurement Setup
NOTE Parameters that are under the Advanced key seldom need to bechanged. Any changes from the default values may result in invalidmeasurement data.
Make sure the Power vs. Time measurement is selected under theMeasure menu. The Meas Setup key will access a menu which allows youto modify the averaging, trigger source, and burst sync for thismeasurement (as described in the “Measurement Setup” section at thebeginning of this chapter). In addition, the following power vs. timemeasurement parameters can be modified:
• Meas Time - allows you to measure more than one timeslot. Enter avalue in integer increments of “slots” with a range of 1 to 50. Theactual measure time in µs is set somewhat longer than the specifiednumber of slots in order to view the complete burst.
• Advanced - accesses a menu to change the following parameters:
RBW Filter - chooses the type of filter, either Gaussian or Flat(Flatop). Gaussian is the best choice when looking at the overallburst or the rising and falling edges, as it has excellent pulseresponse. If you want to precisely examine just the useful part ofthe burst, choose Flat .
Res BW - sets the resolution bandwidth.
Power vs. Time Custom Masks
For the Power vs. Time measurement, you can define a userconfigurable limit mask to apply to the measured burst. This featurecan only be accessed via SCPI commands. Refer to the programmingmanual for further information.
Table 3-2 Power vs. Time Measurement Defaults
Measurement Parameter Factory Default Condition
Avg Bursts 10 Off
Avg Mode Exp
Avg Type Pwr Avg (RMS)
Meas Time 1 Slot
Trig Source RF Burst (Wideband)
Burst Sync Training Seq
Advanced
RBW Filter Gaussian
Res BW 500.000 kHz
62 Chapter 3
Making EDGE (with GSM) MeasurementsMaking the Power vs. Time Measurement
Changing the View
The View/Trace key will access a menu which allows you to select thedesired view of the measurement from the following selections:
• Burst - views the entire sweep as specified by the meas time.
• Rise & Fall - zooms in on the rising and falling portions of theburst being tested.
NOTE The limit test will still be performed on the entire burst, (viewed usingthe Burst menu), when Rise & Fall is selected.
Changing the Display
The Display key will allow you to turn the limit mask on and off. Thisalso disables the mask limit test, but still calculates the power in theuseful part.
Troubleshooting Hints
If a transmitter fails the Power vs. Time measurement this usuallyindicates a problem with the units output amplifier or leveling loop.
Chapter 3 63
Making EDGE (with GSM) MeasurementsMaking the Phase and Frequency Error Measurement
Making the Phase and Frequency ErrorMeasurement
Purpose
Phase and frequency error are the measures of modulation quality forGSM systems. Since GSM systems use relative phase to transmitinformation, the phase and frequency accuracy of the GSM transmitterare critical to the systems performance and ultimately affect range.
GSM receivers rely on the phase and frequency quality of the 0.3GMSK signal in order to achieve the expected carrier to noiseperformance. A transmitter with high phase and frequency error willoften still be able to support phone calls during a functional test.However, it will tend to provide difficulty for mobiles trying to maintainservice at the edges of the cell, with low signal levels or under difficultfading and Doppler conditions.
Measurement Method
The phase error of the test signal is measured by computing thedifference between the phase of the transmitted signal and the phase ofa theoretically perfect signal.
The instrument samples the transmitter output in order to capture theactual phase trajectory. This is then demodulated and the ideal phasetrajectory is mathematically derived. Subtracting one from the otherresults in an error signal.
This measurement allows you to display these errors numerically andgraphically on the analyzer display. It also allows you to view a binaryrepresentation of the demodulated data bits.
64 Chapter 3
Making EDGE (with GSM) MeasurementsMaking the Phase and Frequency Error Measurement
Making the Measurement
NOTE The factory default settings provide a GSM compliant measurement.For special requirements, you may need to change some of the settings.Press Meas Setup , More (1 of 2) , Restore Meas Defaults at any time toreturn all parameters for the current measurement to their defaultsettings.
Select the desired ARFCN, center frequency, timeslot, burst type, andTSC (Training Sequence Code) as described in the section titled“Changing the Frequency Channel” on page 24.
Select the type of carrier to measure. Press Mode Setup , Radio , Carrierand select Burst to measure a burst carrier, or Cont to measure acontinuous carrier from a non-bursting base station.
When Training Sequence is selected as the burst sync for thismeasurement, set the Timeslot selection to determine which timeslot tomeasure. For example, if Timeslot is set to 2, the measurement will bemade on the timeslot number 2. Be careful when adding delay in theTrigger setup, as this measurement does not take into account triggerdelay when checking for a valid burst. If there is sufficient delay added(usually more than 25% of a timeslot), the burst might not be detected.
Press Measure , Phase & Freq to immediately make Phase and FrequencyError the active measurement.
To change any of the measurement parameters from the factory defaultvalues, refer to the “Changing the Measurement Setup” section for thismeasurement.
Chapter 3 65
Making EDGE (with GSM) MeasurementsMaking the Phase and Frequency Error Measurement
Results
Figure 3-4 Phase and Frequency Error Result - Quad View
66 Chapter 3
Making EDGE (with GSM) MeasurementsMaking the Phase and Frequency Error Measurement
Figure 3-5 Phase and Frequency Error Result - Phase Error View
Figure 3-6 Phase and Frequency Error Result - RF Envelope View
Chapter 3 67
Making EDGE (with GSM) MeasurementsMaking the Phase and Frequency Error Measurement
Figure 3-7 Phase and Frequency Error Result - Polar View
Figure 3-8 Phase and Frequency Error Result - Data Bits
68 Chapter 3
Making EDGE (with GSM) MeasurementsMaking the Phase and Frequency Error Measurement
Changing the Measurement Setup
NOTE Parameters that are under the Advanced key seldom need to bechanged. Any changes from the default values may result in invalidmeasurement data.
Make sure the Phase and Frequency Error measurement is selectedunder the Measure menu. Press the Meas Setup key to access a menuwhich allows you to modify the averaging, trigger source, and burstsync for this measurement (as described in the “Measurement Setup”section at the beginning of this chapter).
Changing the View
The View/Trace key will allow you to select the desired view of themeasurement from the following:
• I/Q Error (Quad-View) - See Figure 3-4. Provides a combination viewincluding:
Window 1: Phase Error
Window 2: Phase Error with Freq
Window 3: RF Envelope
Window 4: Numeric Results + Demodulated bits
Any of these windows can be selected (using the Next Window key)and made full size (using the Zoom key). See Figure 3-5 andFigure 3-6.
• I/Q Measured Polar Vector - See Figure 3-7. Provides a view of numericresults and a polar vector graph.
Window 1: Numeric Results
Window 2: Polar Vector Graph
• Data Bits - See Figure 3-8. Provides a view of the numeric results anddata bits with the sync word (TSC) highlighted.
Table 3-3 Phase and Frequency Error Measurement Defaults
Measurement Parameter Factory Default Condition
Avg Bursts 10 Off
Avg Mode Repeat
Avg Type Maximum
Trig Source RF Burst (Wideband)
Burst Sync Training Sequence
Chapter 3 69
Making EDGE (with GSM) MeasurementsMaking the Phase and Frequency Error Measurement
The menus under the Span X Scale and Amplitude Y Scale keys arecontext dependent upon the selected window (graph type). The Span XScale parameters will be in units of time or bits, dependent on the viewselected. The Amplitude Y Scale parameters will be in units of dB ordegrees, dependent on the view selected. All of the softkey labels areblank when I/Q Measured Polar Vector , or Data Bits are selected.
Changing the Display
The Display key will allow you to turn the bit dots on and off.
Troubleshooting Hints
Poor phase error indicates a problem with the I/Q baseband generator,filters, or modulator in the transmitter circuitry. The output amplifierin the transmitter can also create distortion that causes unacceptablyhigh phase error. In a real system poor phase error will reduce theability of a receiver to correctly demodulate, especially in marginalsignal conditions. This ultimately affects range.
Occasionally, a Phase and Frequency Error measurement may fail theprescribed limits at only one point in the burst, for example at thebeginning. This could indicate a problem with the transmitter powerramp or some undesirable interaction between the modulator andpower amplifier.
70 Chapter 3
Making EDGE (with GSM) MeasurementsMaking the Output RF Spectrum Measurement
Making the Output RF SpectrumMeasurement
Purpose
The Output RF Spectrum measurement is the EDGE (with GSM)version of adjacent channel power (ACP). Either a single offset ismeasured with corresponding traces or up to 15 offsets are measuredand a table is displayed.
The output RF spectrum measurements determine the spectral energyemitted into the adjacent channels. Excessive amounts of energyspilling into an adjacent frequency channel could interfere with signalsbeing transmitted to other MS or BTS. The measurements are dividedinto two main groups: spectrum due to the 0.3 GMSK modulation andnoise, and spectrum due to switching transients (burst ramping).
Since GSM is a TDMA format, RF power is being switched on and offdepending on whether the actual burst is being transmitted. Theswitching of power causes spectral splatter at frequencies other thanthat being transmitted by the carrier. Fast transitions in the timedomain causes switching transients that have high frequency contentassociated with them.
NOTE The default output RF spectrum measurements do not perform tests atfrequency offsets greater than 1800 kHz from the carrier.
Chapter 3 71
Making EDGE (with GSM) MeasurementsMaking the Output RF Spectrum Measurement
Measurement Method
In this measurement, the transmitter (source) is set to transmit a GSMframe at a given channel (frequency). The instrument acquires a timerecord at a particular offset from the channel being transmitted. Themethod of acquiring the time record is either a FFT/Inverse-FFTmethod, or a direct time domain (DTD) method, depending on theoffset. These two methods and when they are used, will be describedbelow. When the offset is zero, the instrument is said to be measuringthe carrier. For a given offset frequency from the carrier, thetransmitter must not exceed a certain power level relative to thecarrier. The GSM specification defines the offsets and their maximumabsolute and relative power levels.
The general steps in making the measurement are as follows:
• Acquire time record (using either FFT or DTD methods, describedbelow)
• Synchronize for gating on the carrier - finds 50% and 90% portion ofburst for Spectrum Due to Modulation portion of the test
• Measure power of the carrier
• Compare each offset power to reference to get relative power level
The method of acquiring the time record is dependent on accuracy anddynamic range. With no pre-ADC filter (infinite bandwidth), the entireIF bandwidth of the IF signal is hitting the analog to digital converter(ADC). The ADC gain is set based on the peak level at its input. Thedynamic range (noise floor) of the ADC is dependent on the gainselected. For the type of signals being measured, the highest energywithin the IF bandwidth is at the carrier. Therefore, the lowest dynamicrange (highest noise floor) of the ADC occurs when the full energy of thecarrier is input to the ADC.
All offsets measured using the FFT method are done with theinstrument tuned such that the carrier is at the center of the IFbandwidth. Therefore, the dynamic range of the offsets measured usingthe FFT method is the same as that for the carrier. The dynamic rangerequirement generally increases as the offset frequency increases. If thedynamic range requirement exceeds what is available by FFT method,the direct time domain (DTD) method utilizing the pre-ADC filter isused.
The Direct Time Break Freq key setting is the first offset frequencywhich is measured using the DTD method. Its range is determined byassuring no aliasing occurs on FFT offsets and that the dynamic rangerequirements are met.
72 Chapter 3
Making EDGE (with GSM) MeasurementsMaking the Output RF Spectrum Measurement
The FFT method acquires a wideband signal (1.55 MHz) in a flattopfilter. An FFT is performed to get the spectrum of the GSM signal. Theresolution bandwidth filter can now be applied mathematically to thespectrum at multiple offsets, with an inverse-FFT performed on thedata which passes the filter. In this way, multiple offsets are acquiredfrom one time record and LO setting. Since the resolution bandwidthfilter is a mathematical formula, it can be any shape and size, and isperfect. The VSA uses the 5-pole synchronously tuned filter that theGSM standard specifies.
The primary disadvantage to the FFT method is that the acquisitionmust include the carrier. The high energy of the carrier causes the ADCto range down, thus lowering the dynamic range. At large offsets, thedynamic range requirement is very challenging so the direct timedomain (DTD) method is used. The LO is tuned to the particular offsetand the pre-ADC filter is used to reduce the carrier. This allows theADC to range up, giving higher dynamic range. The disadvantage tothis method is that each offset measured has its own time recordacquisition and LO tune position, and this causes the measurement toslow down compared to FFT offsets. The 5-pole synchronously tunedfilter is approximated by utilizing a digital Gaussian filter and settingits equivalent noise bandwidth to that of the 5-pole synchronouslytuned filter. For these DTD offset frequencies, the filter hascloser-to-ideal 5-pole behavior (< 1% tolerance) than does a 10%tolerance, 5-pole analog filter.
Regardless of how the time record is obtained for a particular offset, thepower must be measured and compared to the reference power. Thereare two measurements being made for the test: output RF spectrumdue to modulation and the output RF spectrum due to switchingtransients. The GSM standard specifies which offsets get which tests.In these two modes, the following conditions are met:
• In the output RF spectrum due to modulation measurement, theaverage value during at least 40 bits between bit 87 and 132(approximately equivalent to the 50% to 90% portion of the burst,excluding midamble) is retained. The vertical lines mark the sectionof the burst over which the measurement is made. If multiple burstsare examined, an average of the average values is calculated. Therelative power (difference between the average power of the burst atzero offset and the average power of the burst at the indicated offset)and the absolute power are displayed.
• In the output RF spectrum due to switching transients, the peakvalue of the burst is retained. If multiple bursts are examined, thenthe maximum of the peak values is retained. The relative power(difference between the peak power of the burst at zero offset andthe peak power of the burst at the indicated offset) and the absolutepower are displayed.
Chapter 3 73
Making EDGE (with GSM) MeasurementsMaking the Output RF Spectrum Measurement
The GSM standard specifies the tests are run on specified offsets fromthe carrier. The instrument identifies this as single offset or multipleoffset modes. The measurement made in these two modes is the same,except that the multiple offset mode automatically makes themeasurement at all the specified offsets frequencies and lists theresults in a table at the end of the measurement.
Figure 3-9 shows a single-offset (Examine) trace for an entire GSMframe with timeslots 0, 2, and 6 turned on and timeslots 1, 3, 4, 5, and 7turned off. The vertical bars show the portion used to measure powerdue to modulation.
Figure 3-9 GSM Frame in Single-Offset (Examine)
The RF envelope trace is displayed. If averaging is turned on, the traceis then averaged with previous traces. For the modulationmeasurement, the user may select the type of trace averaging, eitherlog-power averaged (Video) or power averaged (RMS). For the switchingtransients measurement, the peak of the traces is used. Formodulation, the displayed value is the average of points within thevertical bars. For transients, the displayed value is the max of all pointsfor all traces (Max of Peak) over the entire frame.
74 Chapter 3
Making EDGE (with GSM) MeasurementsMaking the Output RF Spectrum Measurement
Making the Measurement
NOTE The factory default settings provide a GSM compliant measurement.For special requirements, you may need to change some of the settings.Press Meas Setup , More (1 of 2) , Restore Meas Defaults at any time toreturn all parameters for the current measurement to their defaultsettings.
Select the desired ARFCN, center frequency, timeslot, burst type, andTSC (Training Sequence Code) as described in the section titled“Changing the Frequency Channel” on page 24.
When Training Sequence is selected as the burst sync for thismeasurement, set the Timeslot selection to determine which timeslot tomeasure. For example, if Timeslot is set to 2, the measurement will bemade on the timeslot number 2. Be careful when adding delay in theTrigger setup, as this measurement does not take into account triggerdelay when checking for a valid burst. If there is sufficient delay added(usually more than 25% of a timeslot), the burst might not be detected.
Press Measure , Output RF Spectrum to immediately make Output RFSpectrum the active measurement.
To change any of the measurement parameters from the factory defaultvalues, refer to the “Changing the Measurement Setup” section for thismeasurement.
Chapter 3 75
Making EDGE (with GSM) MeasurementsMaking the Output RF Spectrum Measurement
Results
Figure 3-10 Output RF Spectrum Result Example (Short List)Modulation View
Figure 3-11 Output RF Spectrum Result Example (Short List)Switching View
76 Chapter 3
Making EDGE (with GSM) MeasurementsMaking the Output RF Spectrum Measurement
Changing the Measurement Setup
Table 3-4 Output RF Spectrum Measurement Defaults
Measurement Parameter Factory Default Condition
Avg Bursts 20 On
Avg Mode Repeat
Meas Method Multi-Offset
Meas Type Modulation
Ofs Freq List Short
Offset Freq(when single offset is selected)
250.000 kHz
Trig Source RF Burst
Burst Sync(information only)
RF Amptd
Fast Avg On
Advanced
Mod Avg Log-Pwr Avg (Video)
Switching Avg(information only)
Max of Peak
Direct Time Break Freq 600.000 kHz
Modulation Meas BWs
Carrier RBW 30.000 kHz
<1800 kHz Offset RBW 30.000 kHz
≥1800 kHz Offset RBW 100.000 kHz
VBW/RBW Ratio(information only)
1
Switching Meas BWs
Carrier RBW 300.000 kHz
<1800 kHz Offset RBW 30.000 kHz
≥1800 kHz Offset RBW 30.000 kHz
VBW/RBW Ratio(information only)
3
Chapter 3 77
Making EDGE (with GSM) MeasurementsMaking the Output RF Spectrum Measurement
NOTE Parameters that are under the Advanced key seldom need to bechanged. Any changes from the default values may result in invalidmeasurement data.
Make sure the EDGE ORFS measurement is selected under theMeasure menu. Press the Meas Setup key to access a menu which allowsyou to modify the averaging and trigger source for this measurement(as described in the “Measurement Setup” section at the beginning ofthis chapter). In addition, the following output RF spectrummeasurement parameters can be modified:
• Measure - accesses a menu to choose the measurement mode.
Multi-Offset - automatically makes measurements at all offsetfrequencies in the selected list (Standard , Short , or Custom ).(See table below.) Press the Ofs Freq List key to select a list ofoffsets to measure.
Single Offset (Examine) - makes a measurement at a single offsetfrequency as set by the Offset Freq softkey.
• Meas Type - accesses a menu to choose the measurement type.
Mod & Switch - will perform both Modulation and Switchingmeasurements.
Modulation - measures the spectrum due to the 0.3 GMSKmodulation and noise.
Switching - measures the spectrum due to switching transients(burst ramping).
78 Chapter 3
Making EDGE (with GSM) MeasurementsMaking the Output RF Spectrum Measurement
• Ofs Freq List - accesses a menu to choose the offset frequency list.Select a Standard , Short , or Custom list as shown in the table below.
• Offset Freq - Only available when Measure is set to Single Offset(Examine) . Offset frequencies can be entered using the RPG knob orthe Data Entry keys.
• Trig Source - in this measurement, trigger source and burst sync arelinked. Refer to the explanation under Burst Sync .
• Burst Sync - Synchronization is different on ORFS compared to othermeasurements. Since offsets may be very low power and acquiredusing very narrow filters, the burst edges are not well defined andthere certainly is not enough information to perform ademodulation. Therefore all synchronization is performed on thecarrier. The timing reference (“T0”) is then re-used on the offsets.Since “T0” on the carrier is determined with respect to the triggerpoint, the trigger point on the offsets is very important. Once “T0” isdetermined, the 50% and 90% points can be found.
Custom User-defined list that specifies:Offset Freq, RES BW, Limit Offsets,Meas Type,Initialized to be the same as the standardlist
(currently settable only by remotecommands)
400, 600,1200, 1800
Chapter 3 79
Making EDGE (with GSM) MeasurementsMaking the Output RF Spectrum Measurement
Therefore, the trigger must be synchronous with respect to a risingedge of a burst. The RF Burst trigger will do this if the offset iswithin about 7 MHz of the carrier. Remember that since the RFBurst trigger is wideband, the carrier will still cause the signal totrigger. Assuming the trigger threshold remains constant, thetrigger with respect to the burst will remain constant. Since theFrame Trigger uses an internal frame timer (clock), its period is setso that it occurs synchronously with respect to the transmittingframe. If an external trigger is used, it is important that it issynchronous with the burst.
Because of these requirements, only the trigger source can beselected while the measurement selects the burst sync type based onthe trigger source.
NOTE Video trigger source is not allowed, because when the instrument istuned to offset frequencies away from the carrier, the video triggerthreshold will not be reached (due to the low power level of the offset.)
Trigger Source Measurement DefinedBurst Sync
Free Run None
RF Burst RF Amplitude
Ext Front External
Ext Rear External
Frame Training Sequence
80 Chapter 3
Making EDGE (with GSM) MeasurementsMaking the Output RF Spectrum Measurement
• Fast Avg - Fast averaging is a technique developed by HP/Agilent.The GSM standard specifies 50% to 90% portion of the burst,excluding the midamble, be measured. Since most offsets aremeasured in a 30 kHz filter, there is a lot of variation from burst toburst, hence the averaging.
The fast average method makes use of the 10% to 90% portion of theburst, excluding the midamble. The 10% to 50% portion of the bursthas statistically the same average power as the 50% to 90%.Therefore, measuring both portions from one burst is statisticallythe same as measuring 50% to 90% from two bursts. Now, twoaverages are completed with one burst. When averaging is turnedon, this will double the speed of the measurement.
This method is only applicable on the modulation portion of the test,and only when averaging is enabled. The method is not availablewhen Modulation and Switching are done at the same time.
• Advanced - accesses a menu with the following keys:
Mod Avg - choose between:
Pwr Avg (RMS)
Log-Pwr Avg (Video)
Switching Avg - information only. Averaging is fixed atmaximum of peak.
Modulation Meas BWs - accesses a menu with the followingselections:
Carrier RBW
<1800 kHz Offset RBW
>=1800 kHz Offset RBW
VBW/RBW Ratio - information only. Modulation ratio isfixed at 1.
Switching Meas BWs - accesses a menu with the followingselections:
Carrier RBW
<1800 kHz Offset RBW
>=1800 kHz Offset RBW
VBW/RBW Ratio - information only. Switching ratio is fixed at 3.
Chapter 3 81
Making EDGE (with GSM) MeasurementsMaking the Output RF Spectrum Measurement
Direct Time Break Freq - Selects the transition frequency (the firstoffset frequency) where the Direct Time Domain method is usedinstead of the FFT method.The Direct Time Domain offers a highdynamic range and is faster for measuring at a few offsetfrequencies. The FFT method has a moderate dynamic range(generally sufficient when the RBW = 30 kHz). It is much fasterfor measuring at many offset frequencies
Changing the View
If the Multi-Offset measurement has been chosen and the MeasType is Mod & Switch, pressing the View/Trace key will allow you toselect the desired view of the current measurement. If the MeasType is Modulation, the Switching Numeric view is unavailable. If theMeas Type is Switching, the Modulation Numeric view is unavailable.
If the Single Offset measurement has been chosen, the ModulationNumeric and the Switching Numeric softkeys are unavailable (grayedout) as both modulation and switching results are always displayed.
Troubleshooting Hints
The Output RF Spectrum measurement, along with the Phase andFrequency Error measurement, can reveal numerous faults in thetransmit chain, such as the I/Q baseband generator, filters & modulator.
82 Chapter 3
Making EDGE (with GSM) MeasurementsMaking the Spectrum (Frequency Domain) Measurement
Making the Spectrum (Frequency Domain)Measurement
NOTE This Spectrum measurement section is used in the followingpersonalities: Basic, cdmaOne, GSM, NADC, PDC, iDEN, cdma2000,W-CDMA (3GPP), W-CDMA (Trial & Arib).
Purpose
The spectrum measurement provides spectrum analysis capability forthe instrument. The control of the measurement was designed to befamiliar to those who are accustomed to using swept spectrumanalyzers.
This measurement is FFT (Fast Fourier Transform) based. TheFFT-specific parameters are located in the Advanced menu. Alsoavailable under basic mode spectrum measurements is anI/Q window, which shows the I and Q signals in parameters of voltageversus time. The advantage of having an I/Q view available while in thespectrum measurement is that it allows you to view complexcomponents of the same signal without changing settings ormeasurements.
Measurement Method
The transmitter tester uses digital signal processing to sample theinput signal and convert it to the frequency domain. With theinstrument tuned to a fixed center frequency, samples are digitized at ahigh rate, converted to I and Q components with DSP hardware, andthen converted to the frequency domain with FFT software.
Making the Measurement
NOTE The factory default parameters provide a good starting point.You willlikely want to change some of the settings. Press Meas Setup , More (1 of2), Restore Meas Defaults at any time to return all parameters for thecurrent measurement to their default settings.
Press Measure , Spectrum (Freq Domain) to immediately make Spectrum(Frequency Domain) the active measurement.
To change any of the measurement parameters from the factory defaultvalues, refer to the “Changing the Measurement Setup” section for thismeasurement.
Chapter 3 83
Making EDGE (with GSM) MeasurementsMaking the Spectrum (Frequency Domain) Measurement
Results
A display with both a spectrum window and an I/Q Waveform windowwill appear when you activate a spectrum measurement. Use the NextWindow key to select a window, and the Zoom key to enlarge a window.
Figure 3-12 Spectrum Measurement Result- Spectrum and I/Q Waveform
84 Chapter 3
Making EDGE (with GSM) MeasurementsMaking the Spectrum (Frequency Domain) Measurement
Making EDGE (with GSM) MeasurementsMaking the Spectrum (Frequency Domain) Measurement
NOTE Parameters under the Advanced key seldom need to be changed. Anychanges from the default advanced values may result in invalidmeasurement data.
Make sure the Spectrum (Freq Domain) measurement is selected underthe Measure menu. Press the Meas Setup key to access a menu whichallows you to modify the averaging, and trigger source for thismeasurement (as described in the “Measurement Setup” section). Inaddition, the following parameters can be modified:
• Span - This key allows you to modify the frequency span. Changingthe span causes the bandwidth to change automatically, and willaffect data acquisition time.
• Res BW - This feature sets the resolution bandwidth for the FFT, andallows manual or automatic settings. A narrower bandwidth willresult in a longer data acquisition time. In Auto mode the resolutionbandwidth is set to Span/50 (2% of the span).
• Advanced - The following FFT advanced features should be used onlyif you are familiar with their operation. Changes from the defaultvalues may result in invalid data.
Pre-ADC BPF - This key allows you to toggle the pre-ADCbandpass filter to On or Off states. The pre-ADC bandpass filteris useful for rejecting nearby signals, so that sensitivity withinthe span range can be improved by increasing the ADC rangegain.
Pre-FFT Fltr - Allows you to toggle between Flat (flat top) andGaussian . The pre-FFT filter defaults to a flat top filter which hasbetter amplitude accuracy. The Gaussian filter has better pulseresponse.
Pre-FFT BW - The Pre-FFT bandwidth allows you to selectbetween a manual or an automatic setting. The pre FFT-bandwidth filter can be set between 1 Hz and 10 MHz. In Automode this bandwidth is nominally 50% wider than the span. Thisbandwidth determines the ADC sampling rate.
86 Chapter 3
Making EDGE (with GSM) MeasurementsMaking the Spectrum (Frequency Domain) Measurement
FFT Window - Allows you to access the following selectionmenu. Unless you are familiar with FFT windows, use the flat topfilter (the default filter).
• Flat Top - Selects a filter for best amplitude accuracy, byreducing scalloping error.
• Uniform - You can select to have no window active by usingthe uniform setting.
• Hanning• Hamming• Gaussian - Selects a gaussian filter with an alpha of 3.5.• Blackman• Blackman Harris• K-B 70dB / 90dB/ 110dB (Kaiser-Bessel) - Allows selection
of Kaiser-Bessel filters with sidelobes of −70, −90, or −110 dBc.
FFT Size - This menu contains the following features:
• Length Ctrl - This feature allows you to set the FFT andwindow lengths either automatically or manually.
• Min Pts in RBW - This feature allows you to set theminimum number of data points that will be used inside theresolution bandwidth. This adjustment is only available if theLength Ctrl key is set to Auto.
• Window Length - This feature allows you to enter the FFTwindow length ranging from 8 to 1048576. This lengthrepresents the actual quantity of I/Q samples that arecaptured for processing by the FFT. This value can only beentered if length control is set to Manual.
• FFT Length - This feature allows you to enter the FFT lengthin the number of captured samples, ranging from 4096 to1048576. The FFT length setting is automatically limited sothat it is equal or greater than the FFT window length setting.Any amount greater than the window length is implementedby zero-padding. This value can be entered only if lengthcontrol is set to Man (manual).
Chapter 3 87
Making EDGE (with GSM) MeasurementsMaking the Spectrum (Frequency Domain) Measurement
ADC Range - Allows you to access the following selection menuto define one of the following ADC ranging functions:
• Auto - Select this to set the ADC range automatically. Formost FFT spectrum measurements, the auto feature shouldnot be selected. An exception is when measuring a signalwhich is “bursty”, in which case auto can maximize the timedomain dynamic range, if FFT results are less important toyou than time domain results.
• Auto Peak - Select this to set the ADC range automatically tothe peak signal level. Auto peak is a compromise that workswell for both CW and burst signals.
• AutoPeakLock - Select this to hold the ADC rangeautomatically at the peak signal level. Auto peak lock is morestable than auto peak for CW signals, but should not be usedfor “bursty” signals.
• Manual - Allows you to access the selection menu: −6 dB , 0 dB ,+6 dB , +12 dB , +18 dB , +24 dB , to set the ADC range level. Alsonote that manual ranging is best for CW signals.
Data Packing - Allows you to access the following selectionmenu to define one of the following data packing methods:
• Auto - Data is automatically packed. This is the default settingand most recommended.
• Short (16 bit) - Data is packed by every 16 bits.
• Medium (24 bit) - Data is packed by every 24 bits.
• Long (32 bit) - Data is packed by every 32 bits.
ADC Dither - Allows you to toggle the ADC dither function betweenAuto , On, and Off . When set to auto (the default), ADC dither willbe activated when a narrow bandwidth is being measured, anddeactivated when a wide bandwidth is being measured. “ADCdither” refers to the introduction of noise to the digitized steps ofthe analog-to-digital converter; the result is an improvement inamplitude accuracy. Use of the ADC dither, however, reducesdynamic range by approximately 3 dB.
88 Chapter 3
Making EDGE (with GSM) MeasurementsMaking the Spectrum (Frequency Domain) Measurement
Decimation - Allows you to toggle the decimation function betweenAuto and Man, and to set the decimation value. Auto is thepreferred setting, and the only setting that guarantees alias-freeFFT spectrum measurements. If you are familiar with thedecimation feature, you can change the decimation value bysetting to Man, but be aware that aliasing can result in highervalues.
IF Flatness - Allows you to toggle between On and Off . Whentoggled to On (the default), the IF flatness feature causesbackground amplitude corrections to be performed on the FFTspectrum. The Off setting is used for adjustment andtroubleshooting the transmitter tester.
Changing the View
View/Trace menu keys are used to activate a view of a measurementwith preset X and Y scale parameters, called a “window”. Using the Xand Y Scale keys you can then modify these parameter settings. Youcan also activate specific traces, using the Trace Display menu key.
Windows Available for Spectrum Measurements
The spectrum and the I/Q windows can be viewed at the same time, orindividually. You can use the Next Window and Zoom keys to movebetween these different views.
Spectrum window Select this window if you want to view frequencyand power. Changes to frequency span or power will sometimes affectdata acquisition.
I/Q Waveform window. Select this window to view the I and Q signalcharacteristics of the current measurement in parameters of voltageand time.
NOTE For the widest spans the I/Q window becomes just “ADC time domainsamples”, because the I/Q down-conversion is no longer in effect.
Chapter 3 89
Making EDGE (with GSM) MeasurementsMaking the Spectrum (Frequency Domain) Measurement
Using the Markers
The Marker front-panel key accesses the menu to configure the markers.If you want to use the marker function in the I/Q window, pressView/Trace , I/Q Waveform , Marker , Trace , IQ Waveform .
• Select 1 2 3 4 - Allows you to activate up to four markers with thecorresponding numbers, respectively. The selected number isunderlined and its function is defined by pressing the Function key.The default is 1.
• Normal - Allows you to activate the selected marker to read thefrequency and amplitude of the marker position on the spectrumtrace, for example, which is controlled by the RPG knob.
• Delta - Allows you to read the differences in frequencies andamplitudes between the selected marker and the next.
• Function Off - Allows you to define the selected marker function to beBand Power , Noise , or Off . The default is Off . If set to Band Power , youneed to select Delta .
• Trace Spectrum - Allows you to place the selected marker on theSpectrum , Spectrum Avg , or I/Q Waveform trace. The default isSpectrum .
• Off - Allows you to turn off the selected marker.
• Shape Diamond - Allows you to access the menu to define the selectedmarker shape to be a Diamond , Line , Square , or Cross . The default isa Diamond .
• Marker All Off - Allows you to turn off all of the markers.
The front panel Search key performs a peak search when pressed. Amarker will automatically be activated at the highest peak.
90 Chapter 3
Making EDGE (with GSM) MeasurementsMaking the Spectrum (Frequency Domain) Measurement
Band Power
A band power measurement using the markers calculates the averagepower between two adjustable markers. To make a band powermeasurement:
Press the Marker key.
Press Trace , Spectrum to activate a marker on the instantaneousspectrum signal. Press the Spectrum Avg key to activate a marker onthe average spectrum trace.
Press Function, Band Power .
Two marker lines are activated at the extreme left side of thehorizontal scale. Press Normal and move marker 1 to the desiredplace by rotating the RPG knob.
Press Delta to bring marker 2 to the same place as marker 1.
Move marker 1 to the other desired position by rotating the RPGknob. Band power measures the average power between the twomarkers. When the band power markers are active, the results areshown in the results window as Mean Pwr (Between Mks). When theband power function is off the results window reads Mean Pwr(Entire Trace).
Troubleshooting Hints
Changes made by the user to advanced spectrum settings, particularlyto ADC range settings, can inadvertently result in spectrummeasurements that are invalid and cause error messages to appear.Care needs to be taken when using advanced features.
Chapter 3 91
Making EDGE (with GSM) MeasurementsMaking the Waveform (Time Domain) Measurement
Making the Waveform (Time Domain)Measurement
NOTE This Waveform measurement section is used in the followingpersonalities: Basic, cdmaOne, GSM, NADC, PDC, iDEN, cdma2000,W-CDMA (3GPP), W-CDMA (Trial & Arib).
Purpose
The waveform measurement is a generic measurement for viewingwaveforms in the time domain. This measurement is how theinstrument performs the zero span functionality found in traditionalspectrum analyzers. Also available under basic mode waveformmeasurements is an I/Q window, which shows the I and Q signal inparameters of voltage and time. The advantage of having an I/Q viewavailable while in the waveform measurement is that it allows you toview complex components of the same signal without changing settingsor measurements.
The waveform measurement can be used to perform general purposepower measurements to a high degree of accuracy.
Measurement Method
The transmitter tester makes repeated power measurements at a setfrequency, similar to the way a swept-tuned spectrum analyzer makeszero span measurements. The input analog signal is converted to adigital signal, which then is processed into a representation of awaveform measurement. The transmitter tester relies on a high rates ofsampling to create an accurate representation of a time domain signal.
Making the Measurement
NOTE The factory default parameters provide a good starting point.You willlikely want to change some of the settings. Press Meas Setup , More (1 of2), Restore Meas Defaults at any time to return all parameters for thecurrent measurement to their default settings.
Press Measure , Waveform (Time Domain) to immediately makeWaveform (Time Domain) the active measurement.
To change any of the measurement parameters from the factory defaultvalues, refer to the “Changing the Measurement Setup” section for thismeasurement.
92 Chapter 3
Making EDGE (with GSM) MeasurementsMaking the Waveform (Time Domain) Measurement
I/Q Waveform Window:Amplitude Y ScaleScale/DivReference
100.0 mv0.00 V (Ctr)
Advanced
Pre-ADC BPF Off
RBW Filter Gaussian
ADC Range Auto
Data Packing Auto
ADC Dither Off
Decimation Off
94 Chapter 3
Making EDGE (with GSM) MeasurementsMaking the Waveform (Time Domain) Measurement
Make sure the Waveform (Time Domain) measurement is selected underthe Measure menu. Press the Meas Setup key to access a menu whichallows you to modify the averaging, and trigger source for thismeasurement (as described in the “Measurement Setup” section). Inaddition, the following parameters can be modified:
• Sweep Time - This key allows you to select the measurementacquisition time. It is used to specify the length of the time capturerecord. Values between 10 µs and 50 s can be entered, dependingupon the resolution bandwidth setting.
• Res BW - This key sets the measurement bandwidth. A largerbandwidth results in a larger number of acquisition points andreduces the maximum allowed for sweep time. You can enter valuesbetween 10 Hz. and 7.5 MHz.
• Advanced menu key. This key accesses the features listed below.
Pre-ADC BPF - This key allows you to toggle the pre-ADCbandpass filter to On or Off states. The pre-ADC bandpass filteris useful for rejecting nearby signals, so that sensitivity withinthe span range can be improved by increasing the ADC rangegainRBW Filter - This key toggles to select a flat top or a Gaussianresolution bandwidth filter. A Gaussian filter provides more eventime domain response, particularly for bursts. A flat top filterprovides a flatter bandwidth but is less accurate for pulseresponses. A flat top filter also requires less memory and allowslonger data acquisition times. For most waveform applications,the Gaussian filter is recommended, and it is the default filter forwaveform measurements.ADC Range -.Allows you to access the following selection menu todefine one of the following ADC ranging functions:
• Auto - This key causes the instrument to automatically adjustthe signal range for optimal measurement results.
• AutoPeak - This key causes the instrument to continuouslyseek the highest peak signal.
• AutoPeakLock - This key causes the instrument to adjust therange for the highest peak signal it identifies, and retains therange settings determined by that peak signal, even when thepeak signal is no longer present.
• Manual - Allows you to access the selection menu: −6 dB , 0 dB ,+6 dB , +12 dB , +18 dB , +24 dB , to set the ADC range level. Alsonote that manual ranging is best for CW signals.
Chapter 3 95
Making EDGE (with GSM) MeasurementsMaking the Waveform (Time Domain) Measurement
Data Packing - Allows you to access the following selection menu todefine one of the following data packing methods:
• Auto - Data is automatically packed. This is the default settingand most recommended.
• Short (16 bit) - Data is packed by every 16 bits.• Medium (24 bit) - Data is packed by every 24 bits.• Long (32 bit) - Data is packed by every 32 bits.
ADC Dither - Allows you to toggle the ADC dither functionbetween On and Off . Activation of the ADC dither results in betteramplitude linearity and resolution in low level signals. However,it also results in reduced dynamic range. ADC dither is set to Offby default.Decimation - Allows you to toggle the decimation functionbetween On and Off and to set the decimation value. Decimationallows longer acquisition times for a given bandwidth byeliminating data points. Long time captures can be limited by thetransmitter tester data acquisition memory. Decimation numbers1 to 4 describe the factor by which the number of points arereduced. A decimation figure of 1, which results in no data pointreduction, is the default.
96 Chapter 3
Making EDGE (with GSM) MeasurementsMaking the Waveform (Time Domain) Measurement
Changing the View
The View/Trace menu keys are used to activate a view of a measurementwith preset X and Y scale parameters; this view is called a “window.”Using the X and Y scale keys, you can then modify these parameters.You can also activate traces, using the Traces Display menu key.
Windows Available for Waveform Measurements
RF Envelope window. Select this window if you want to viewpower (in dBm) vs. time. Remember that data acquisition will beaffected when you change the sweep time.
I/Q Waveform window. Select this window to view the I and Q signalcharacteristics of the current measurement in parameters of voltageand time.
Using the Markers
The Marker front-panel key accesses the menu to configure the markers.If you want to use the marker function in the I/Q window, pressView/Trace , I/Q Waveform , Marker , Trace , IQ Waveform .
• Select 1 2 3 4 - Allows you to activate up to four markers with thecorresponding numbers, respectively. The selected number isunderlined and its function is defined by pressing the Function key.The default is 1.
• Normal - Allows you to activate the selected marker to read thefrequency and amplitude of the marker position on the spectrumtrace, for example, which is controlled by the RPG knob.
• Delta - Allows you to read the differences in frequencies andamplitudes between the selected marker and the next.
• Function Off - Allows you to define the selected marker function to beBand Power , Noise , or Off . The default is Off . If set to Band Power , youneed to select Delta .
• Trace Spectrum - Allows you to place the selected marker on theSpectrum , Spectrum Avg , or I/Q Waveform trace. The default isSpectrum .
• Off - Allows you to turn off the selected marker.
• Shape Diamond - Allows you to access the menu to define the selectedmarker shape to be a Diamond , Line , Square , or Cross . The default isa Diamond .
• Marker All Off - Allows you to turn off all of the markers.
The front panel Search key performs a peak search when pressed. Amarker will automatically be activated at the highest peak.
Chapter 3 97
Making EDGE (with GSM) MeasurementsMaking the Waveform (Time Domain) Measurement
NOTE In the Waveform measurement, the Mean Pwr (Entire Trace) valueplus the Pk-to-Mean value will sum to equal the current Max Pt. valueas shown in the data window below the RF Envelope display. If you do amarker peak search (Search ) with averaging turned off, the marker willfind the same maximum point. However, if you turn averaging on, thePk-to-Mean value will use the highest peak found for any acquisitionduring averaging, while the marker peak will look for the peak of thedisplay, which is the result of n-averages. This will usually result indiffering values for the maximum point.
Band Power
A band power measurement using the markers calculates the averagepower between two adjustable markers. To make a band powermeasurement:
Press the Marker key.
Press Function, Band Power .
Two marker lines are activated at the extreme left side of thehorizontal scale. Press Normal and move marker 1 to the desiredplace by rotating the RPG knob.
Press Delta to bring marker 2 to the same place as marker 1.
Move marker 1 to the other desired position by rotating the RPGknob. Band power measures the average power between the twomarkers. When the band power markers are active, the results areshown in the results window as Mean Pwr (Between Mks). When theband power function is off the results window reads Mean Pwr(Entire Trace).
Troubleshooting Hints
Changes made by the user to advanced waveform settings caninadvertently result in measurements that are invalid and cause errormessages to appear. Care needs to be taken when using advancedfeatures.
98 Chapter 3
Making EDGE (with GSM) MeasurementsMaking the Tx Band Spur Measurement
Making the Tx Band Spur Measurement
Purpose
The Tx Band Spur measurement checks that the transmitter does nottransmit undesirable energy into the transmit band. This energy maycause interference for other users of the GSM system.
Measurement Method
This is a base station only measurement. The transmitter should be setat its maximum output power on all time slots. This measurement isperformed at RF channels B (bottom), M (middle), and T (top). Refer tothe following table.
The transmit band spectrum is measured in several frequencysegments using resolution bandwidths as specified by the standard (seethe list below).
Making EDGE (with GSM) MeasurementsMaking the Tx Band Spur Measurement
The mean transmit power is measured first using the“power-above-threshold” method (see the Transmit Powermeasurement for detail), and then used as a reference for themeasurement limit lines if limits are used. The spectrums, which arebelow or above the carrier frequency and within the transmit band, aremeasured.
For each spectrum segment, the measurement looks for the spectrumpeak closest to the limit and saves the data. The peak of all segments isreported as the Worst Spur . The amplitude difference from the peak tothe limit line (∆ from Limit), and from the peak to the mean transmitpower (∆ from Carrier) are displayed. The frequency difference from thepeak to the carrier frequency (Offset Freq) is also displayed. If the peakgoes above the limit line, the display will indicate FAIL . If Marker is on,the active marker is placed at the peak of the displayed segment.
Making the Measurement
NOTE The factory default settings provide a GSM compliant measurement.For special requirements, you may need to change some of the settings.Press Meas Setup , More (1 of 2) , Restore Meas Defaults at any time toreturn all parameters for the current measurement to their defaultsettings.
Select the desired transmit band, (P-GSM, E-GSM, R-GSM, GSM 450,GSM 480, GSM 850, DCS 1800, or PCS 1900), as described in thesection “Changing the Mode Setup” on page 18. Select the desiredARFCN and center frequency as described in the section “Changing theFrequency Channel” on page 24.
Press Measure , Tx Band Spur to immediately make Tx Band Spur theactive measurement.
To change any of the measurement parameters from the factory defaultvalues, refer to the “Changing the Measurement Setup” section for thismeasurement.
100 Chapter 3
Making EDGE (with GSM) MeasurementsMaking the Tx Band Spur Measurement
Results
Figure 3-14 Tx Band Spur - Lower Segment
Changing the Measurement Setup
Table 3-5 Tx Band Spur Measurement Defaults
Measurement Parameter Factory Default Condition
Avg Number 30 On
Avg Mode Repeat
Avg Type Maximum
Meas Type Full
Limit −36 dBm
Chapter 3 101
Making EDGE (with GSM) MeasurementsMaking the Tx Band Spur Measurement
Make sure the Tx Band Spur measurement is selected under theMeasure menu. The Meas Setup key will access a menu which allows youto modify the averaging for this measurement. The following Tx BandSpur measurement parameters can be modified:
• Meas Type - select the measurement type from the followingselections:
Full - In Continuous Measure, it repeatedly does full search of allsegments.
Examine - In Continuous Measure, after doing one full searchacross all segments, it parks on the worst segment andcontinuously updates that segment.
• Limit - set the absolute or relative limit. The limit range is from-200 dBm to 100 dBm.
dBm - Absolute limit
dBc - Relative to Mean Transmit Power.
Changing the View
The View/Trace key will allow you to further examine the desiredspectrum segment. Each of these choices selects a different part of thefrequency spectrum for viewing:
Troubleshooting Hints
Almost any fault in the transmitter circuits can manifest itself asspurious of one kind or another. Make sure the transmit band iscorrectly selected and the frequency is either the Bottom, Middle, orTop channel. The “Unexpected carrier frequency (BMT only) ”message usually indicates the transmit band and/or carrier frequencyis not correct. The “ADC overload -- unexpected carrierfrequency ” message usually indicates the channel frequency of theVSA does not match the carrier frequency of the signal.
LowerSegment
lower Tx band edge to -6 MHz offsetfrom the channel frequency
Lower AdjSegment
-6 MHz to -1.8 MHz offsetfrom the channel frequency
Upper AdjSegment
+1.8 MHz to +6 MHz offsetfrom the channel frequency
UpperSegment
+6 MHz offset from the channel frequency tothe upper Tx band edge
102 Chapter 3
Making EDGE (with GSM) MeasurementsMaking the EDGE EVM Measurement
Making the EDGE EVM Measurement
Purpose
Phase and frequency errors are the measures of modulation quality forthe EDGE (with GSM) system. Since the EDGE (with GSM) systemuses the 3π/8 8PSK modulation technique, the phase and frequencyaccuracies of the EDGE (with GSM) transmitter are critical to thecommunications system performance and ultimately affect range.
EDGE (with GSM) receivers rely on the phase and frequency quality ofthe 3π/8 8PSK modulation signal in order to achieve the expectedcarrier to noise ratio. A transmitter with high phase and frequencyerrors will often still be able to support phone calls during a functionaltest. However, it will tend to provide difficulty for mobiles trying tomaintain service at the edge of the cell with low signal levels or underdifficult fading and Doppler conditions.
Measurement Method
The phase error of the unit under test is measured by computing thedifference between the phase of the transmitted signal and the phase ofa theoretically perfect signal.
The instrument samples the transmitter output in order to capture theactual phase trajectory. This is then demodulated and the ideal phasetrajectory is mathematically derived. Subtracting one from the otherresults in an error signal.
This measurement allows you to display these errors numerically andgraphically on the instrument display. There are graphs for EVM, PhaseError and Mag Error in the graph windows. In the text window, thereare Evm: in % rms, in % peak at the highest symbol number, 90 % EVMresult, Mag Error: in % rms, Phase Error: in degrees, Freq Error:in Hz, Droop in mdB/symbol, and I/Q Offset: in dB.
Chapter 3 103
Making EDGE (with GSM) MeasurementsMaking the EDGE EVM Measurement
Making the Measurement
NOTE The factory default settings provide an EDGE compliant measurement.For special requirements, you may need to change some of the settings.Press Meas Setup , More (1 of 2) , Restore Meas Defaults at any time toreturn all parameters for the current measurement to their defaultsettings.
Select the desired center frequency, burst type, and slot as described in“Radio” on page 18.
Press Measure , EVM to immediately make the error vector magnitudemeasurement.
To change any of the measurement parameters from the factory defaultvalues, refer to “Changing the Measurement Setup” for thismeasurement.
Results
The next figure shows an example of measurement result with thegraphic and text windows. The measured summary data is shown inthe left window and the dynamic vector trajectory of the I/Qdemodulated signal is shown as a polar vector display in the rightwindow.
Making EDGE (with GSM) MeasurementsMaking the EDGE EVM Measurement
Changing the Measurement Setup
The next table shows the factory default settings for error vectormagnitude measurements.
Make sure the Error Vector Magnitude (EVM) measurement is selectedunder the Measure menu. The Meas Setup key accesses a menu whichallows you to modify the averaging, trigger source and burst sync forthis measurement as described in “Measurement Setup” earlier in thischapter. However, the trigger source does not include Line .
Making EDGE (with GSM) MeasurementsMaking the EDGE EVM Measurement
Changing the View
The View/Trace key accesses the menu which allows you to select thedesired measurement view from the following selections:
• I/Q Measured Polar Vector - The measured summary data is shown inthe left window and the dynamic vector trajectory of I/Qdemodulated signal is shown as a polar vector display in the rightwindow, as shown in Figure 3-15 on page 104.
• I/Q Measured Polar Constln - The measured summary data is shown inthe left window and the dynamic vector constellation of I/Qdemodulated signal is shown as a polar vector display in the rightwindow as shown in Figure 3-16 on page 106.
The Display key accesses the menu to allow the following selections forchanging the graph displays:
• Symbol Dots - Allows you to toggle the symbol dots between On andOff . The default setting is On.
When either EVM, Phase Error or Mag Error window is active in theI/Q Error (Quad-View) display, the Span X Scale key accesses the menuto allow the following selections:
• Scale/Div - Allows you to define the horizontal scale by changing thesymbol value per division. The range is 1 to 100 symbols perdivision. The default setting is 13.7 (for BS) or 13.4 (for MS) symbolsper division.
• Ref Value - Allows you to set the symbol reference value ranging from0 to 1000 symbols. The default setting is 0.
• Ref Position - Allows you to set the reference position to either Left ,Ctr (center) or Right . The default setting is Left .
Chapter 3 107
Making EDGE (with GSM) MeasurementsMaking the EDGE EVM Measurement
• Scale Coupling - Allows you to toggle the scale coupling functionbetween On and Off . The default setting is On. This functionautomatically determines the scale per division and reference valueby the magnitude of the measurement results.
When either EVM: or Mag Error: window is active in the I/Q Error(Quad-View) display, the Amplitude Y Scale key accesses the menu toallow the following selections:
• Scale/Div - Allows you to define the vertical scale by changing thevalue per division. The range is 0.01 to 3600 degrees. The defaultsetting is 20.0 degrees per division. However, since the ScaleCoupling default is set to On, this value is automatically determinedby the measurement results.
• Ref Value - Allows you to set the reference value ranging from 0 to500%. The default setting is 0%.
• Ref Position - Allows you to set the reference position to either Top ,Ctr (center) or Bot (bottom). For the EVM: graph the, default setting isBot . For the Mag Error: graph the default setting is Ctr .
• Scale Coupling - Allows you to toggle the scale coupling functionbetween On and Off . The default setting is On. This functionautomatically determines the scale per division and reference valueby the magnitude of the measurement results.
When the Phase Error: window is active in the I/Q Error display, theAmplitude Y Scale key accesses the menu to allow the followingselections:
• Scale/Div - Allows you to define the vertical scale by changing thevalue per division. The range is 0.01 to 3600 degrees. The defaultsetting is 20.0 degrees per division. However, since the ScaleCoupling default is set to On, this value is automatically determinedby the measurement results.
• Ref Value - Allows you to set the reference value ranging from 0 to500%. The default setting is 0%.
• Ref Position - Allows you to set the reference position to either Top ,Ctr (center) or Bot (bottom). For the EVM graph, the default settingis Bot . For the Mag Error graph, the default setting is Ctr.
• Scale Coupling - Allows you to toggle the scale coupling functionbetween On and Off . The default setting is On. This functionautomatically determines the scale per division and reference valueby the magnitude of the measurement results.
108 Chapter 3
Making EDGE (with GSM) MeasurementsMaking the EDGE EVM Measurement
Troubleshooting Hints
Use the spectrum (frequency domain) measurement to verify that thesignal is present and approximately centered on the display.
Poor phase error indicates a problem at the I/Q baseband generator,filters, and/or modulator in the transmitter circuitry.The outputamplifier in the transmitter can also create distortion that causesunacceptably high phase error. In a real system, poor phase error willreduce the ability of a receiver to correctly demodulate the signal,especially in marginal signal conditions.
Chapter 3 109
Making EDGE (with GSM) MeasurementsMaking the EDGE PvT Measurement
Making the EDGE PvT Measurement
Purpose
EDGE PvT measures the mean transmit power during the “useful part”of GSM bursts and verifies that the power ramp fits the within thedefined mask. Power vs. Time also lets you view the rise, fall, and“useful part” of the GSM burst.
GSM is a Time Division Multiple Access (TDMA) scheme with eighttime slots, or bursts, per RF channel. If the burst does not occur atexactly the right time, or if the burst is irregular, then other adjacenttimeslots can experience interference. Because of this, the industrystandards specify a tight mask for the fit of the TDMA burst.
The Power vs. Time measurement provides masks for both BTS (BaseTransceiver Station) and MS (mobile station). The timings arereferenced to the transition from bit 13 to bit 14 of the midambletraining sequence. The 0 dB reference is determined by measuring themean transmitted power during the “useful part” of the burst. You canalso define a user configurable limit mask to apply to the measuredburst (refer to the “Changing the Measurement Setup” section).
The GSM specifications defines the “useful part” of the normal GSMburst as being the 147 bits centered on the transition from bit 13 to bit14 (the “T0” time point).
Measurement Method
The instrument acquires a GSMEDGE (with GSM) signal in the timedomain. The “T0” point and the useful part are computed. If Burst Syncis set to Training Seq , a GSM demodulation is performed to find “T0”. IfBurst Sync is set to RF Amptd , an approximation of “T0” will be usedwithout performing a demodulation. The average power in the usefulpart is then computed and displayed, and the GSM limit mask isapplied. The measurement displays Pass when the burst fits within thebounds of the mask.
110 Chapter 3
Making EDGE (with GSM) MeasurementsMaking the EDGE PvT Measurement
Making the Measurement
NOTE The factory default settings provide a GSMEDGE (with GSM)compliant measurement. For special requirements, you may need tochange some of the settings. Press Meas Setup , More (1 of 2) , RestoreMeas Defaults at any time to return all parameters for the currentmeasurement to their default settings.
Select the desired ARFCN, center frequency, timeslot, burst type, andTSC (Training Sequence Code) as described in the section titled“Changing the Frequency Channel” on page 24.
Timeslot is available when Burst Sync is either Training Sequence orRF Amptd .
The timeslots are determined by taking the acquired data and dividingit into timeslots 0 to 7. An active timeslot burst must be withinapproximately 25% of the expected timeslot position, otherwise theE4406A may think the burst is an adjacent timeslot and may not detectit. The trigger delay can be used to position the signal if it is notaligning in the timeslots as desired.
Press Measure , Pwr vs Time to immediately make Power vs. Time theactive measurement.
To change any of the measurement parameters from the factory defaultvalues, refer to the “Changing the Measurement Setup” section for thismeasurement.
Chapter 3 111
Making EDGE (with GSM) MeasurementsMaking the EDGE PvT Measurement
Results
Figure 3-18 Power vs. Time Measurement Result - Burst View
Figure 3-19 Power vs. Time Measurement Result - Rise & Fall View
112 Chapter 3
Making EDGE (with GSM) MeasurementsMaking the EDGE PvT Measurement
Changing the Measurement Setup
NOTE Parameters that are under the Advanced key seldom need to bechanged. Any changes from the default values may result in invalidmeasurement data.
Make sure the Power vs. Time measurement is selected under theMeasure menu. The Meas Setup key will access a menu which allows youto modify the averaging, trigger source, and burst sync for thismeasurement (as described in the “Measurement Setup” section at thebeginning of this chapter). In addition, the following power vs. timemeasurement parameters can be modified:
• Meas Time - allows you to measure more than one timeslot. Enter avalue in integer increments of “slots” with a range of 1 to 50. Theactual measure time in µs is set somewhat longer than the specifiednumber of slots in order to view the complete burst.
• Advanced - accesses a menu to change the following parameters:
RBW Filter - chooses the type of filter, either Gaussian or Flat(Flatop). Gaussian is the best choice when looking at the overallburst or the rising and falling edges, as it has excellent pulseresponse. If you want to precisely examine just the useful part ofthe burst, choose Flat .
Res BW - sets the resolution bandwidth.
Power vs. Time Custom Masks
For the Power vs. Time measurement, you can define a userconfigurable limit mask to apply to the measured burst. This featurecan only be accessed via SCPI commands. Refer to the programmingmanual for further information.
Table 3-7 Power vs. Time Measurement Defaults
Measurement Parameter Factory Default Condition
Avg Bursts 10 Off
Avg Mode Exp
Avg Type Pwr Avg (RMS)
Meas Time 1 Slot
Trig Source RF Burst (Wideband)
Burst Sync Training Seq
Advanced
RBW Filter Gaussian
Res BW 500.000 kHz
Chapter 3 113
Making EDGE (with GSM) MeasurementsMaking the EDGE PvT Measurement
Changing the View
The View/Trace key will access a menu which allows you to select thedesired view of the measurement from the following selections:
• Burst - views the entire sweep as specified by the meas time.
• Rise & Fall - zooms in on the rising and falling portions of theburst being tested.
NOTE The limit test will still be performed on the entire burst, (viewed usingthe Burst menu), when Rise & Fall is selected.
Changing the Display
The Display key will allow you to turn the limit mask on and off. Thisalso disables the mask limit test, but still calculates the power in theuseful part.
Troubleshooting Hints
If a transmitter fails the Power vs. Time measurement this usuallyindicates a problem with the units output amplifier or leveling loop.
114 Chapter 3
Making EDGE (with GSM) MeasurementsMaking the EDGE ORFS Measurement
Making the EDGE ORFS Measurement
Purpose
The EDGE ORFS measurement is the GSM EDGE (with GSM) versionof adjacent channel power (ACP). Either a single offset is measuredwith corresponding traces or up to 15 offsets are measured and a tableis displayed.
The output RF spectrum measurements determine the spectral energyemitted into the adjacent channels. Excessive amounts of energyspilling into an adjacent frequency channel could interfere with signalsbeing transmitted to other MS or BTS. The measurements are dividedinto two main groups: spectrum due to the 0.3 GMSK modulation andnoise, and spectrum due to switching transients (burst ramping).
Since GSM is a TDMA format, RF power is being switched on and offdepending on whether the actual burst is being transmitted. Theswitching of power causes spectral splatter at frequencies other thanthat being transmitted by the carrier. Fast transitions in the timedomain causes switching transients that have high frequency contentassociated with them.
NOTE The default output RF spectrum measurements do not perform tests atfrequency offsets greater than 1800 kHz from the carrier.
Measurement Method
In this measurement, the transmitter (source) is set to transmit a GSMframe at a given channel (frequency). The instrument acquires a timerecord at a particular offset from the channel being transmitted. Themethod of acquiring the time record is either a FFT/Inverse-FFTmethod, or a direct time domain (DTD) method, depending on theoffset. These two methods and when they are used, will be describedbelow. When the offset is zero, the instrument is said to be measuringthe carrier. For a given offset frequency from the carrier, thetransmitter must not exceed a certain power level relative to thecarrier. The GSM specification defines the offsets and their maximumabsolute and relative power levels.
Chapter 3 115
Making EDGE (with GSM) MeasurementsMaking the EDGE ORFS Measurement
The general steps in making the measurement are as follows:
• Acquire time record (using either FFT or DTD methods, describedbelow)
• Synchronize for gating on the carrier - finds 50% and 90% portion ofburst for Spectrum Due to Modulation portion of the test
• Measure power of the carrier
• Compare each offset power to reference to get relative power level
The method of acquiring the time record is dependent on accuracy anddynamic range. With no pre-ADC filter (infinite bandwidth), the entireIF bandwidth of the IF signal is hitting the analog to digital converter(ADC). The ADC gain is set based on the peak level at its input. Thedynamic range (noise floor) of the ADC is dependent on the gainselected. For the type of signals being measured, the highest energywithin the IF bandwidth is at the carrier. Therefore, the lowest dynamicrange (highest noise floor) of the ADC occurs when the full energy of thecarrier is input to the ADC.
All offsets measured using the FFT method are done with theinstrument tuned such that the carrier is at the center of the IFbandwidth. Therefore, the dynamic range of the offsets measured usingthe FFT method is the same as that for the carrier. The dynamic rangerequirement generally increases as the offset frequency increases. If thedynamic range requirement exceeds what is available by FFT method,the direct time domain (DTD) method utilizing the pre-ADC filter isused.
The Direct Time Break Freq key setting is the first offset frequencywhich is measured using the DTD method. Its range is determined byassuring no aliasing occurs on FFT offsets and that the dynamic rangerequirements are met.
The FFT method acquires a wideband signal (1.55 MHz) in a flattopfilter. An FFT is performed to get the spectrum of the GSM signal. Theresolution bandwidth filter can now be applied mathematically to thespectrum at multiple offsets, with an inverse-FFT performed on thedata which passes the filter. In this way, multiple offsets are acquiredfrom one time record and LO setting. Since the resolution bandwidthfilter is a mathematical formula, it can be any shape and size, and isperfect. The VSA uses the 5-pole synchronously tuned filter that theGSM standard specifies.
116 Chapter 3
Making EDGE (with GSM) MeasurementsMaking the EDGE ORFS Measurement
The primary disadvantage to the FFT method is that the acquisitionmust include the carrier. The high energy of the carrier causes the ADCto range down, thus lowering the dynamic range. At large offsets, thedynamic range requirement is very challenging so the direct timedomain (DTD) method is used. The LO is tuned to the particular offsetand the pre-ADC filter is used to reduce the carrier. This allows theADC to range up, giving higher dynamic range. The disadvantage tothis method is that each offset measured has its own time recordacquisition and LO tune position, and this causes the measurement toslow down compared to FFT offsets. The 5-pole synchronously tunedfilter is approximated by utilizing a digital Gaussian filter and settingits equivalent noise bandwidth to that of the 5-pole synchronouslytuned filter. For these DTD offset frequencies, the filter hascloser-to-ideal 5-pole behavior (< 1% tolerance) than does a 10%tolerance, 5-pole analog filter.
Regardless of how the time record is obtained for a particular offset, thepower must be measured and compared to the reference power. Thereare two measurements being made for the test: output RF spectrumdue to modulation and the output RF spectrum due to switchingtransients. The GSM standard specifies which offsets get which tests.In these two modes, the following conditions are met:
• In the output RF spectrum due to modulation measurement, theaverage value during at least 40 bits between bit 87 and 132(approximately equivalent to the 50% to 90% portion of the burst,excluding midamble) is retained. The vertical lines mark the sectionof the burst over which the measurement is made. If multiple burstsare examined, an average of the average values is calculated. Therelative power (difference between the average power of the burst atzero offset and the average power of the burst at the indicated offset)and the absolute power are displayed.
• In the output RF spectrum due to switching transients, the peakvalue of the burst is retained. If multiple bursts are examined, thenthe maximum of the peak values is retained. The relative power(difference between the peak power of the burst at zero offset andthe peak power of the burst at the indicated offset) and the absolutepower are displayed.
The GSM standard specifies the tests are run on specified offsets fromthe carrier. The instrument identifies this as single offset or multipleoffset modes. The measurement made in these two modes is the same,except that the multiple offset mode automatically makes themeasurement at all the specified offsets frequencies and lists theresults in a table at the end of the measurement.
Figure 3-20 shows a single-offset (Examine) trace for an entire GSMframe with timeslots 0, 2, and 6 turned on and timeslots 1, 3, 4, 5, and 7turned off. The vertical bars show the portion used to measure powerdue to modulation.
Chapter 3 117
Making EDGE (with GSM) MeasurementsMaking the EDGE ORFS Measurement
Figure 3-20 GSM Frame in Single-Offset (Examine)
The RF envelope trace is displayed. If averaging is turned on, the traceis then averaged with previous traces. For the modulationmeasurement, the user may select the type of trace averaging, eitherlog-power averaged (Video) or power averaged (RMS). For the switchingtransients measurement, the peak of the traces is used. Formodulation, the displayed value is the average of points within thevertical bars. For transients, the displayed value is the max of all pointsfor all traces (Max of Peak) over the entire frame.
118 Chapter 3
Making EDGE (with GSM) MeasurementsMaking the EDGE ORFS Measurement
Making the Measurement
NOTE The factory default settings provide a GSM compliant measurement.For special requirements, you may need to change some of the settings.Press Meas Setup , More (1 of 2) , Restore Meas Defaults to return allparameters for the current measurement to their default settings.
Select the desired ARFCN, center frequency, timeslot, burst type, andTSC (Training Sequence Code) as described in the section titled“Changing the Frequency Channel” on page 24.
When Training Sequence is selected as the burst sync for thismeasurement, set the Timeslot selection to determine which timeslot tomeasure. For example, if Timeslot is set to 2, the measurement will bemade on the timeslot number 2. Be careful when adding delay in theTrigger setup, as this measurement does not take into account triggerdelay when checking for a valid burst. If there is sufficient delay added(usually more than 25% of a timeslot), the burst might not be detected.
Press Measure , Output RF Spectrum to immediately make Output RFSpectrum the active measurement.
To change any of the measurement parameters from the factory defaultvalues, refer to the “Changing the Measurement Setup” section for thismeasurement.
Results
Figure 3-21 Output RF Spectrum Result (Short List) Modulation View
Chapter 3 119
Making EDGE (with GSM) MeasurementsMaking the EDGE ORFS Measurement
Changing the Measurement Setup
Table 3-8 Output RF Spectrum Measurement Defaults
Measurement Parameter Factory Default Condition
Avg Bursts 20 On
Avg Mode Repeat
Meas Method Multi-Offset
Meas Type Modulation
Ofs Freq List Short
Offset Freq(when single offset is selected)
250.000 kHz
Trig Source RF Burst
Burst Sync(information only)
RF Amptd
Fast Avg On
Advanced
Mod Avg Log-Pwr Avg (Video)
Switching Avg(information only)
Max of Peak
Direct Time Break Freq 600.000 kHz
Modulation Meas BWs
Carrier RBW 30.000 kHz
<1800 kHz Offset RBW 30.000 kHz
≥1800 kHz Offset RBW 100.000 kHz
VBW/RBW Ratio(information only)
1
Switching Meas BWs
Carrier RBW 300.000 kHz
<1800 kHz Offset RBW 30.000 kHz
≥1800 kHz Offset RBW 30.000 kHz
VBW/RBW Ratio(information only)
3
120 Chapter 3
Making EDGE (with GSM) MeasurementsMaking the EDGE ORFS Measurement
NOTE Parameters that are under the Advanced key seldom need to bechanged. Any changes from the default values may result in invalidmeasurement data.
Make sure the Output RF SpectrumEDGE ORFS measurement isselected under the Measure menu. Press the Meas Setup key to access amenu which allows you to modify the averaging and trigger source forthis measurement (as described in the “Measurement Setup” section atthe beginning of this chapter). In addition, the following output RFspectrum measurement parameters can be modified:
❏ Measure - accesses a menu to choose the measurement mode.
Multi-Offset - automatically makes measurements at all offsetfrequencies in the selected list (Standard , Short , or Custom ).(See table below.) Press the Ofs Freq List key to select a list ofoffsets to measure.
Single Offset (Examine) - makes a measurement at a single offsetfrequency as set by the Offset Freq softkey.
❏ Meas Type - accesses a menu to choose the measurement type.
Mod & Switch - will perform both Modulation and Switchingmeasurements.
Modulation - measures the spectrum due to the 0.3 GMSKmodulation and noise.
Switching - measures the spectrum due to switching transients(burst ramping).
❏ Ofs Freq List - accesses a menu to choose the offset frequency list.Select a Standard , Short , or Custom list as shown in the table below.
Custom User-defined list that specifies:Offset Freq, RES BW, Limit Offsets,Meas Type,
(currently settable only by remotecommands)
Chapter 3 121
Making EDGE (with GSM) MeasurementsMaking the EDGE ORFS Measurement
❏ Offset Freq - Only available when Measure is set to Single Offset(Examine) . The Step hardkeys (⇑ or ⇓) will step through the offset listas selected by the Offs Freq List key. Other offset frequencies can beentered using the RPG knob or the Data Entry keys.
❏ Trig Source - in this measurement, trigger source and burst sync arelinked. Refer to the explanation under Burst Sync .
❏ Burst Sync - Synchronization is different on ORFS compared to othermeasurements. Since offsets may be very low power and acquiredusing very narrow filters, the burst edges are not well defined andthere certainly is not enough information to perform ademodulation. Therefore all synchronization is performed on thecarrier. The timing reference (“T0”) is then re-used on the offsets.Since “T0” on the carrier is determined with respect to the triggerpoint, the trigger point on the offsets is very important. Once “T0” isdetermined, the 50% and 90% points can be found.
Therefore, the trigger must be synchronous with respect to a risingedge of a burst. The RF Burst trigger will do this if the offset iswithin about 7 MHz of the carrier. Remember that since the RFBurst trigger is wideband, the carrier will still cause the signal totrigger. Assuming the trigger threshold remains constant, thetrigger with respect to the burst will remain constant. Since theFrame Trigger uses an internal frame timer (clock), its period is setso that it occurs synchronously with respect to the transmittingframe. If an external trigger is used, it is important that it issynchronous with the burst.
Because of these requirements, only the trigger source can beselected while the measurement selects the burst sync type based onthe trigger source.
NOTE Video trigger source is not allowed, because when the instrument istuned to offset frequencies away from the carrier, the video triggerthreshold will not be reached (due to the low power level of the offset.)
Trigger Source Measurement DefinedBurst Sync
Free Run None
RF Burst RF Amplitude
Ext Front External
Ext Rear External
Frame Training Sequence
122 Chapter 3
Making EDGE (with GSM) MeasurementsMaking the EDGE ORFS Measurement
❏ Fast Avg - Fast averaging is a technique developed by HP/Agilent.The GSM standard specifies 50% to 90% portion of the burst,excluding the midamble, be measured in 50 averages. Since mostoffsets are measured in a 30 kHz filter, there is a lot of variationfrom burst to burst, hence the averaging.
The fast average method makes use of the 10% to 90% portion of theburst, excluding the midamble. The 10% to 50% portion of the bursthas statistically the same average power as the 50% to 90%.Therefore, measuring both portions from one burst is statisticallythe same as measuring 50% to 90% from two bursts. Now, twoaverages are completed with one burst. When averaging is turnedon, this will double the speed of the measurement.
This method is only applicable on the modulation portion of the test,and only when averaging is enabled. The method is not availablewhen Modulation and Switching are done at the same time.
❏ Advanced - accesses a menu with the following keys:
• Mod Avg - choose between:
Pwr Avg (RMS)
Log-Pwr Avg (Video)
• Switching Avg - information only. Averaging is fixed atmaximum of peak.
• Modulation Meas BWs - accesses a menu with the followingselections:
Carrier RBW
<1800 kHz Offset RBW
>=1800 kHz Offset RBW
VBW/RBW Ratio - information only. Modulation ratio isfixed at 1.
• Switching Meas BWs - accesses a menu with the followingselections:
Carrier RBW
<1800 kHz Offset RBW
>=1800 kHz Offset RBW
VBW/RBW Ratio - information only. Switching ratio is fixed at 3.
Chapter 3 123
Making EDGE (with GSM) MeasurementsMaking the EDGE ORFS Measurement
• Direct Time Break Freq - Selects the transition frequency (the firstoffset frequency) where the Direct Time Domain method is usedinstead of the FFT method.The Direct Time Domain offers a highdynamic range and is faster for measuring at a few offsetfrequencies. The FFT method has a moderate dynamic range(generally sufficient when the RBW = 30 kHz). It is much fasterfor measuring at many offset frequencies
Changing the View
If the Multi-Offset measurement has been chosen and the MeasType is Mod & Switch, pressing the View/Trace key will allow you toselect the desired view of the current measurement. If the MeasType is Modulation, the Switching Numeric view is unavailable. If theMeas Type is Switching, the Modulation Numeric view is unavailable.
If the Single Offset measurement has been chosen, the ModulationNumeric and the Switching Numeric softkeys are unavailable (grayedout) as both modulation and switching results are always displayed.
Troubleshooting Hints
The Output RF Spectrum measurement, along with the Phase andFrequency Error measurement, can reveal numerous faults in thetransmit chain, such as the I/Q baseband generator, filters & modulator.