20
CASHEWS highlights of the cashew industry presented by Red River Foods, Inc. JUNE 2010
C A S H E W Shigh l igh ts o f the cashew indus t r y
presented by Red River Foods, Inc.
JUNE 2010

Red River Foods, Inc. June 2010 3
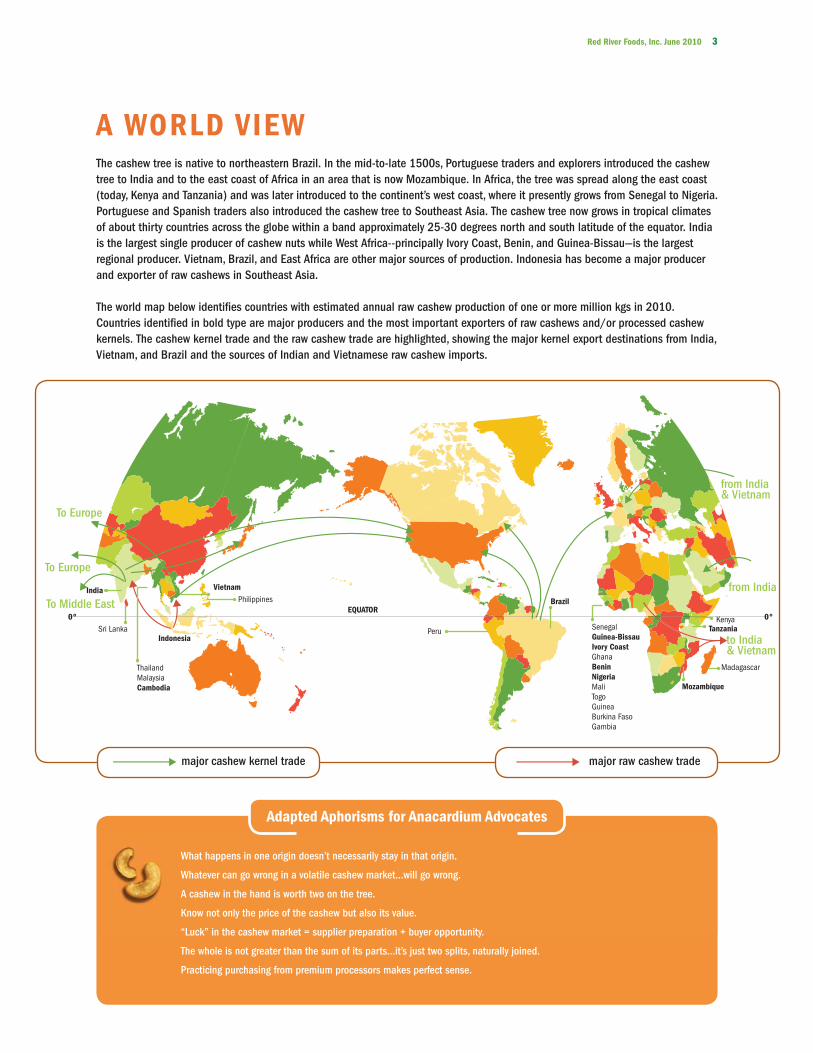
A WORLD VIEW The cashew tree is native to northeastern Brazil. In the mid-to-late 1500s, Portuguese traders and explorers introduced the cashew tree to India and to the east coast of Africa in an area that is now Mozambique. In Africa, the tree was spread along the east coast (today, Kenya and Tanzania) and was later introduced to the continent’s west coast, where it presently grows from Senegal to Nigeria. Portuguese and Spanish traders also introduced the cashew tree to Southeast Asia. The cashew tree now grows in tropical climates of about thirty countries across the globe within a band approximately 25-30 degrees north and south latitude of the equator. India is the largest single producer of cashew nuts while West Africa--principally Ivory Coast, Benin, and Guinea-Bissau—is the largest regional producer. Vietnam, Brazil, and East Africa are other major sources of production. Indonesia has become a major producer and exporter of raw cashews in Southeast Asia.
The world map below identifi es countries with estimated annual raw cashew production of one or more million kgs in 2010. Countries identifi ed in bold type are major producers and the most important exporters of raw cashews and/or processed cashew kernels. The cashew kernel trade and the raw cashew trade are highlighted, showing the major kernel export destinations from India, Vietnam, and Brazil and the sources of Indian and Vietnamese raw cashew imports.
Peru
Brazil
SenegalGuinea-BissauIvory CoastGhanaBeninNigeriaMaliTogoGuineaBurkina FasoGambia
ThailandMalaysiaCambodia
Indonesia
0° 0°EQUATOR
PhilippinesVietnamIndia
Sri LankaKenya
Tanzania
Mozambique
Madagascar
major cashew kernel trade
from India & Vietnam
To Europe
To Middle East
What happens in one origin doesn’t necessarily stay in that origin.
Whatever can go wrong in a volatile cashew market…will go wrong.
A cashew in the hand is worth two on the tree.
Know not only the price of the cashew but also its value.
“Luck” in the cashew market = supplier preparation + buyer opportunity.
The whole is not greater than the sum of its parts…it’s just two splits, naturally joined.
Practicing purchasing from premium processors makes perfect sense.
To Europe
from India
to India & Vietnam
major raw cashew trade
Adapted Aphorisms for Anacardium Advocates
4 Highlights of the cashew industry
THE IMPORTANCE OF QUALITYThe matter of product quality has long been an issue, but its importance has been magnifi ed in recent years because of the focus
on food safety. In part, the product quality issue has been the consequence of steadily increasing demand, which has drawn many
more players into the industry in two of the three major origins, Vietnam and India. Manufacturers and end-users want to ensure
their suppliers are buying the better qualities. Yet there is not a comparable concern among some suppliers / processors at origin.
In Vietnam there are a number of new entrants whose processing operations are far below acceptable standards. In addition,
local traders gather and export product from various packing centers. The usual result is poor and inconsistent quality from these
operations. In India most processors are linked directly to a main processing company much as “subsidiaries” of a company.
While the product from the main processing facility may meet export quality standards, that from the smaller, linked operations
can be below standard. In Vietnam and in India, only a relatively few processors have attained ISO (International Organization for
Standardization), GMP (Good Manufacturing Practice), and HACCP (Hazard Analysis Critical Control Point) certifi cations. Those
processors, operators, and traders who do offer the better quality products will be the ones who attract the more reliable and
reputable buyers.
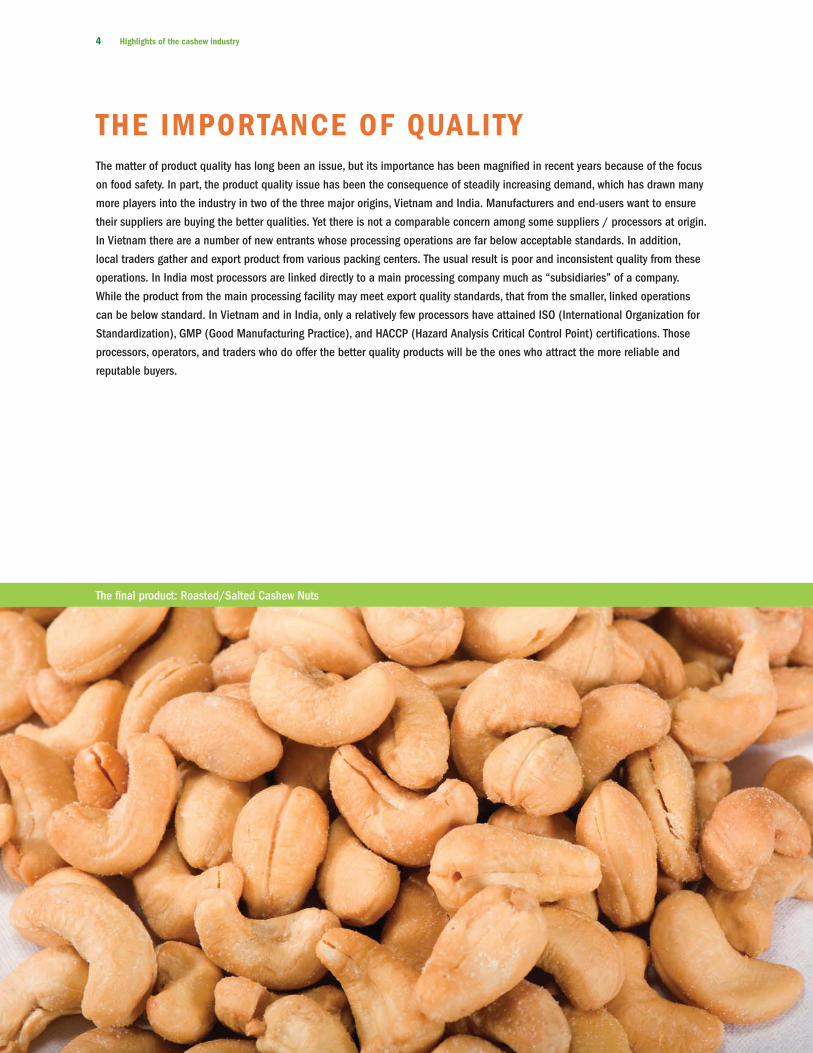
The fi nal product: Roasted/Salted Cashew Nuts

Red River Foods, Inc. June 2010 5
H A R V E S T I N G S E A S O N SHarvesting seasons are generally similar in the producing countries, depending on their location relative to the equator. Countries
north of the equator, including India, Vietnam, and producers in West Africa, harvest from early in the calendar year to approximately
mid-year. Countries south of the equator, including Brazil and producers in East Africa, harvest from September or October to early in
the following calendar year.
end of season
beginning of season
Jan Feb Mar Apr May Jun Jul Aug Sep Oct Nov Dec
India
Vietnam
Benin
Guinea-Bissau
Ivory Coast
Nigeria
Togo
Brazil
Mozambique
Tanzania
Kenya
Mali
Ghana
Burkina Faso
Senegal
Gambia
Cashew apple ready for harvest
6 Highlights of the cashew industry
R A W P R O D U C T I O N T R E N D SThe edible cashew kernel is encased within a kidney-shaped seed or pod at the bottom of a cashew “apple.” Cashews are not harvested in the conventional sense. Once the cashew apple falls to the ground, the cashew seed is removed. Cashew seeds are gathered and taken to various collection points from where they are delivered to a processing facility. After drying, the cashew kernel is separated from the seed either mechanically or by hand.
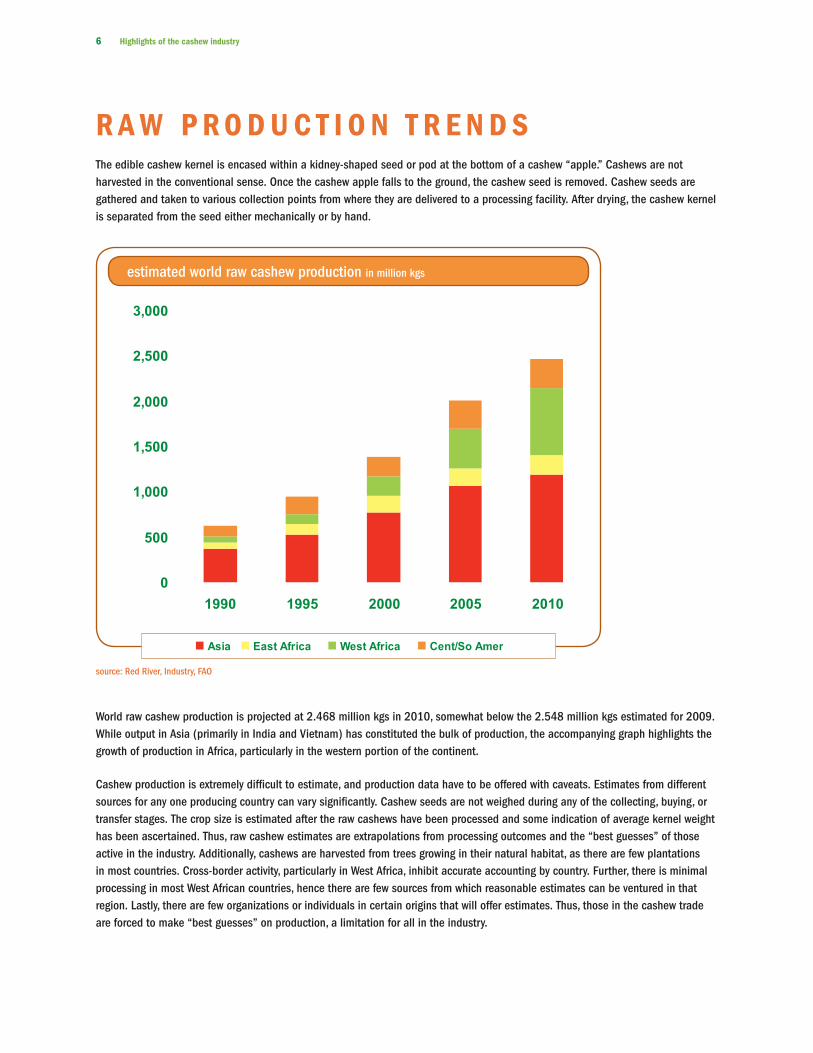
World raw cashew production is projected at 2.468 million kgs in 2010, somewhat below the 2.548 million kgs estimated for 2009. While output in Asia (primarily in India and Vietnam) has constituted the bulk of production, the accompanying graph highlights the growth of production in Africa, particularly in the western portion of the continent.
Cashew production is extremely diffi cult to estimate, and production data have to be offered with caveats. Estimates from different sources for any one producing country can vary signifi cantly. Cashew seeds are not weighed during any of the collecting, buying, or transfer stages. The crop size is estimated after the raw cashews have been processed and some indication of average kernel weight has been ascertained. Thus, raw cashew estimates are extrapolations from processing outcomes and the “best guesses” of those active in the industry. Additionally, cashews are harvested from trees growing in their natural habitat, as there are few plantations in most countries. Cross-border activity, particularly in West Africa, inhibit accurate accounting by country. Further, there is minimal processing in most West African countries, hence there are few sources from which reasonable estimates can be ventured in that region. Lastly, there are few organizations or individuals in certain origins that will offer estimates. Thus, those in the cashew trade are forced to make “best guesses” on production, a limitation for all in the industry.
estimated world raw cashew production in million kgs
0
500
1,000
1,500
2,000
2,500
3,000
1990 1995 2000 2005 2010
source: Red River, Industry, FAO
Asia East Africa West Africa Cent/So Amer
Red River Foods, Inc. June 2010 7
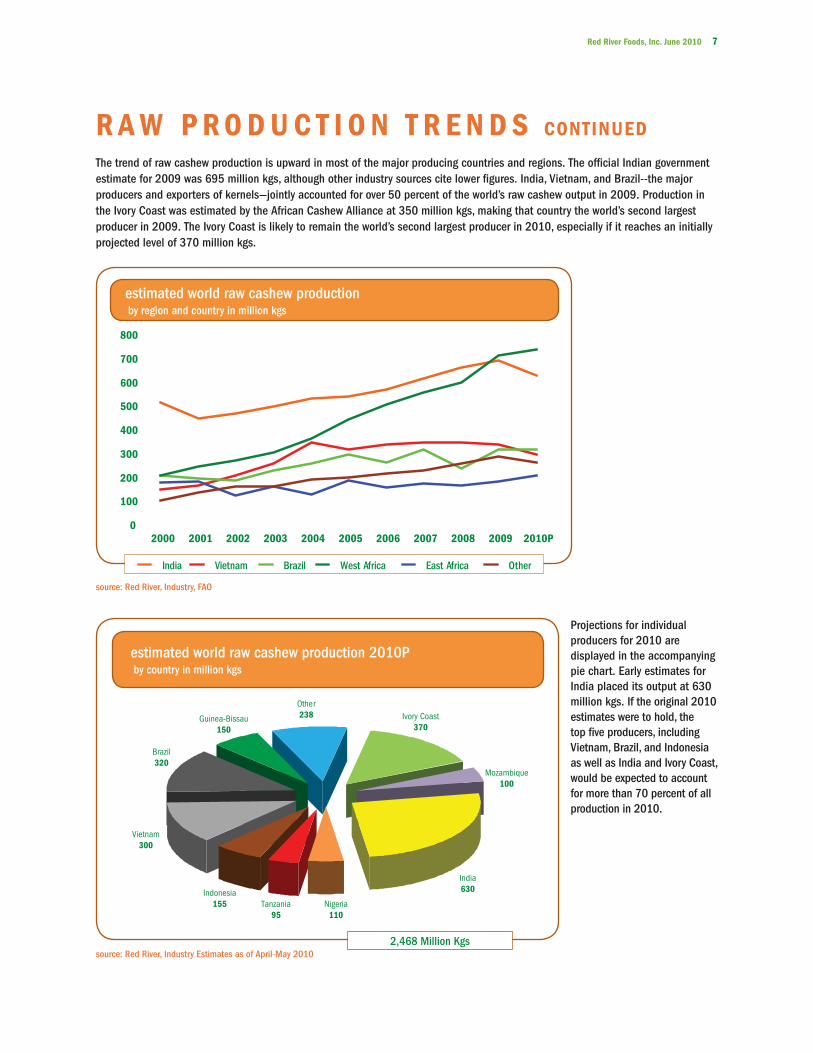
The trend of raw cashew production is upward in most of the major producing countries and regions. The offi cial Indian government estimate for 2009 was 695 million kgs, although other industry sources cite lower fi gures. India, Vietnam, and Brazil--the major producers and exporters of kernels—jointly accounted for over 50 percent of the world’s raw cashew output in 2009. Production in the Ivory Coast was estimated by the African Cashew Alliance at 350 million kgs, making that country the world’s second largest producer in 2009. The Ivory Coast is likely to remain the world’s second largest producer in 2010, especially if it reaches an initially projected level of 370 million kgs.
R A W P R O D U C T I O N T R E N D S CONTINUED
estimated world raw cashew production by region and country in million kgs
0
100
200
300
400
500
600
700
800
2000 2001 2002 2003 2004 2005 2006 2007 2008 2009 2010P
India Vietnam Brazil West Africa East Africa Other
source: Red River, Industry, FAO
Projections for individual producers for 2010 are displayed in the accompanying pie chart. Early estimates for India placed its output at 630 million kgs. If the original 2010 estimates were to hold, the top fi ve producers, including Vietnam, Brazil, and Indonesia as well as India and Ivory Coast, would be expected to account for more than 70 percent of all production in 2010.
Guinea-Bissau150
Tanzania95
Other238 Ivory Coast
370
India630
Nigeria110
Indonesia155
Brazil320
Vietnam300
Mozambique100
estimated world raw cashew production 2010P by country in million kgs
source: Red River, Industry Estimates as of April-May 20102,468 Million Kgs

8 Highlights of the cashew industry
The accompanying graph displays the estimated percentage of whole and broken grades produced by the three major producers / exporters. The high percentage of broken grades in Brazil is the result of mechanical processing, while most processing in India and Vietnam is labor intensive, done by hand.
Generally, cashew kernel yields range from about 20 to 24 percent. Thus, one metric ton of raw cashews can yield between 200 and 240 kgs of edible kernel wholes and pieces after processing, depending on country of origin. A crop that yields 1 million kgs of cashew wholes and pieces, for example, might be estimated to have been 4.2 to 5.0 million kgs of raw production.
The adjacent table displays the estimated average amounts (in kgs) of exportable grade kernels produced per metric ton from the three major exporting countries. These percentages may vary from year to year and even during the same season because of weather conditions, the quality of the seed, the time of the season when the crop is being processed, and the capabilities of the processor. In Vietnam, for example, each metric ton of raw cashew seed produced and processed in that country yields about 230 kgs (23 percent) of exportable grade kernels. Thus, the 2010 Vietnamese crop, estimated at 300 million kgs, would yield about 70 million kgs of exportable grade wholes and pieces.
estimated percentage of whole and broken gradesproduced by major processors/exporters per metric ton of export kernels
80%
53%
75%
20%
47%
25%
Vietnam
Brazil
India
Whole Brokensource: Industry
EXPORTABLE GRADES
India
Kenya, Mozambique
Processing Country Country of Origin kgs
Benin, G-Bissau, Togo 240
Ivory Coast, Senegal 220
India Indonesia 240
200
200
230
Brazil Brazil 210
Vietnam Vietnam 230
Nigeria
estimated amount of export-quality kernelsproduced by major processors/exporters per metric ton of raw cashew nuts
source: Industry

Red River Foods, Inc. June 2010 9
U.S. IMPORTSCashews remain the largest segment of the U.S. tree nut import market, and represented 68 percent of all shelled tree nut imports in 2009. (The accompanying chart does not include tree nuts imported in-shell, particularly brazil nuts and pecans.) Cashew imports were up 5 million kgs in 2009 to 117 million kgs. For the fi rst four months of 2010 imports were 32 million kgs, only slightly below the level of imports during the same period in 2009, suggesting an import level for 2010 of 112-115 million kgs.
U.S. cashew imports for consumption rose annually through 2004 and, with the exception of 2007, have been at stable levels since then, between 114 and 117 million kgs. The sharp price increases between 2007 and early 2008 gave way to a price decline in 2009, as evidenced by the decline in the average CIF value from $5.79 per kg in 2008 to $5.10 in 2009. The 2009 average CIF values for Vietnam and Brazil were $.86 and $.73 below 2008 levels, respectively. The average CIF value of imports from India fell $.37 between 2008 and 2009.
U.S. cashew kernel imports for consumptionvolumes and avg CIF values per kg
0
20
40
60
80
100
120
140
2000 2001 2002 2003 2004 2005 2006 2007 2008 2009 2010P
source: U.S. Department of Agriculture 2010 projection as of imports through April
Total Mn Kgs Avg CIF Val Per Kg
U.S. tree nut imports 2009shelled weight in million kgs
Filberts2.2 Brazils
9.6Macs 6.9
Chesnuts 4.9
Pine Nuts4.0
Pecans22.6
Other3.8
Cashews116.9
source: U.S. Department of Agriculture170.9 Million Kgs
Cashew seeds drying in the sun

10 Highlights of the cashew industry
Vietnam is the leading source of U.S. imports, accounting for 45 percent of the U.S. market in 2009, up from 41 percent in 2008. India commanded over 50 percent of the U.S. import market until 2002, but has been overtaken by Vietnam and represented only 26 percent of the U.S. market in 2009. U.S. imports from Brazil were 24 percent of total imports as Brazil recovered from the short 2008 crop. Vietnam continues to maintain a clear price advantage over its competitors. The average CIF value of its cashews imported into the U.S. was $4.82 per kg in 2009 while Indian and Brazilian cashews were at $5.64 and $5.08, respectively.
U.S. IMPORTS CONTINUED
KERNEL EXPORTSTotal kernel exports from the three major world suppliers--India, Vietnam, and Bra-zil—were 326 million kgs in 2009, up about 20 million kgs from the 2008 level of 307 million kgs. Collectively, the three major suppliers shipped 113 million kgs to the U.S. and 72 million kgs to the European Union, about 57 percent of their total ex-ports. Vietnam has made continual gains vis-à-vis its competitors in the international cashew trade, primarily because of its grow-ing export market in the U.S. Total Indian exports were essentially fl at from 2005 through 2007, then fell about 11 million kgs between 2007 and 2009. Brazilian shipments rebounded in 2009 from the short 2008 crop.
0
10
20
30
40
50
60
2000 2001 2002 2003 2004 2005 2006 2007 2008 2009
U.S. cashew kernel imports for consumption by country in million kgs
Other Brazil Vietnam Indiasource: U.S. Department of Agriculture
India, Brazil, and Vietnam cashew kernel exports in million kgs
112.
3
111.
1
112.
2
105.
2
101.
5
105.
4
120.
0 153.
0
167.
0
177.
0
41.9
43.2 51
.6
34.7 47
.8
2005 2006 2007 2008 2009
source: IndustryN.B.: India data includes exports from ports of Mangalore, Cochin, and Tuticorin only.
India Vietnam Brazil
Red River Foods, Inc. June 2010 11
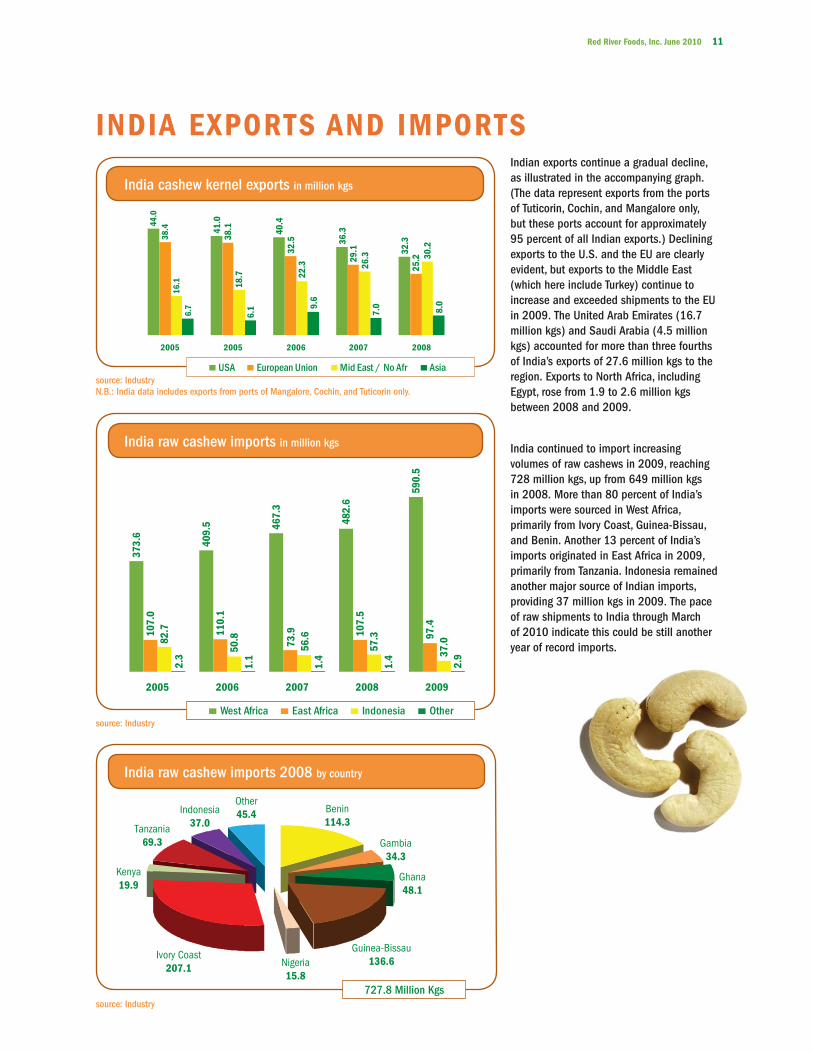
Indian exports continue a gradual decline, as illustrated in the accompanying graph. (The data represent exports from the ports of Tuticorin, Cochin, and Mangalore only, but these ports account for approximately 95 percent of all Indian exports.) Declining exports to the U.S. and the EU are clearly evident, but exports to the Middle East (which here include Turkey) continue to increase and exceeded shipments to the EU in 2009. The United Arab Emirates (16.7 million kgs) and Saudi Arabia (4.5 million kgs) accounted for more than three fourths of India’s exports of 27.6 million kgs to the region. Exports to North Africa, including Egypt, rose from 1.9 to 2.6 million kgs between 2008 and 2009.
India raw cashew imports in million kgs
373.
6
409.
5 467.
3
482.
6
590.
5
107.
0
110.
1
73.9 10
7.5
97.4
82.7
50.8
56.6
57.3
37.0
2.3
1.1
1.4
1.4
2.9
2005 2006 2007 2008 2009
West Africa East Africa Indonesia Othersource: Industry
India cashew kernel exports in million kgs
44.0
41.0
40.4
36.3
32.338
.4
38.1
32.5
29.1
25.2
16.1 18
.7 22.3 26
.3 30.2
6.7
6.1 9.
6
7.0 8.0
2005 2005 2006 2007 2008
USA European Union Mid East / No Afr Asiasource: IndustryN.B.: India data includes exports from ports of Mangalore, Cochin, and Tuticorin only.
INDIA EXPORTS AND IMPORTS
India raw cashew imports 2008 by country
Ivory Coast207.1
Other45.4
Nigeria15.8
Ghana48.1
Gambia34.3
Benin114.3
Indonesia37.0Tanzania
69.3
Kenya19.9
Guinea-Bissau136.6
source: Industry727.8 Million Kgs
India continued to import increasing volumes of raw cashews in 2009, reaching 728 million kgs, up from 649 million kgs in 2008. More than 80 percent of India’s imports were sourced in West Africa, primarily from Ivory Coast, Guinea-Bissau, and Benin. Another 13 percent of India’s imports originated in East Africa in 2009, primarily from Tanzania. Indonesia remained another major source of Indian imports, providing 37 million kgs in 2009. The pace of raw shipments to India through March of 2010 indicate this could be still another year of record imports.
12 Highlights of the cashew industry
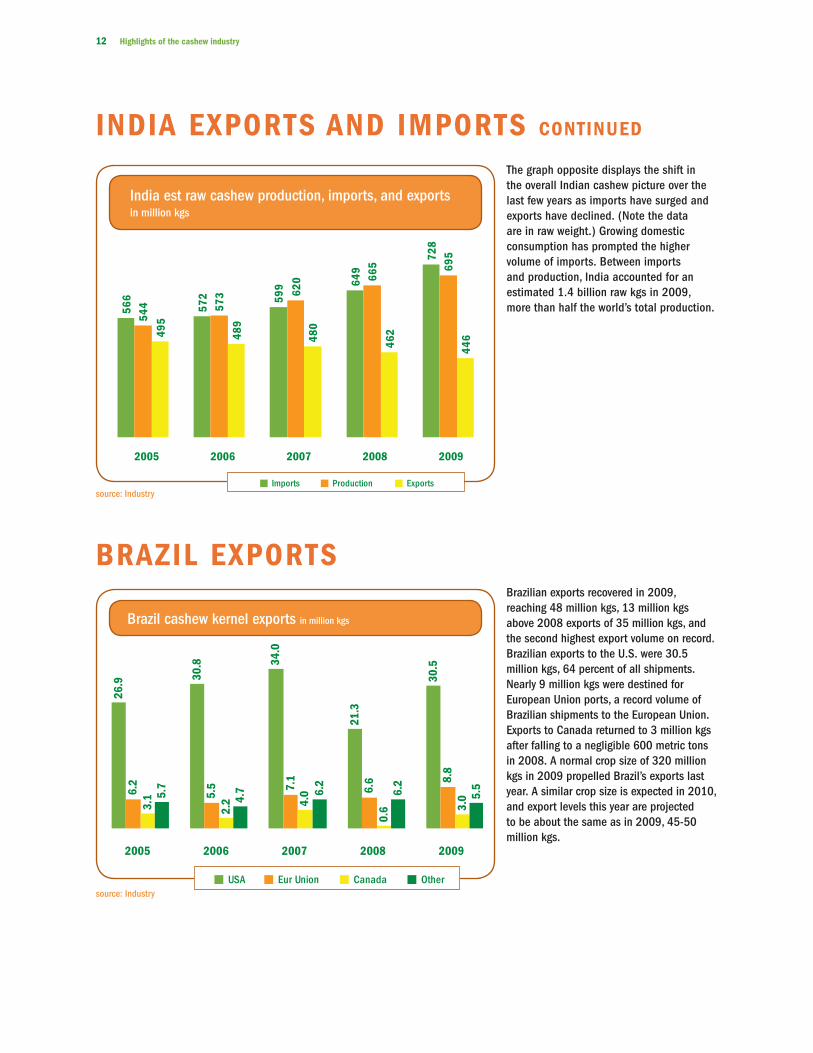
BRAZIL EXPORTS Brazilian exports recovered in 2009, reaching 48 million kgs, 13 million kgs above 2008 exports of 35 million kgs, and the second highest export volume on record. Brazilian exports to the U.S. were 30.5 million kgs, 64 percent of all shipments. Nearly 9 million kgs were destined for European Union ports, a record volume of Brazilian shipments to the European Union. Exports to Canada returned to 3 million kgs after falling to a negligible 600 metric tons in 2008. A normal crop size of 320 million kgs in 2009 propelled Brazil’s exports last year. A similar crop size is expected in 2010, and export levels this year are projected to be about the same as in 2009, 45-50 million kgs.
Brazil cashew kernel exports in million kgs
26.9 30
.8 34.0
21.3
30.5
6.2
5.5 7.
1
6.6 8.
8
3.1
2.2 4.
0
0.6 3.
05.7
4.7 6.
2
6.2
5.5
2005 2006 2007 2008 2009
USA Eur Union Canada Othersource: Industry
INDIA EXPORTS AND IMPORTS CONTINUED
India est raw cashew production, imports, and exports in million kgs
566
572 59
9 649
728
544 57
3 620 66
5 695
495
489
480
462
446
2005 2006 2007 2008 2009
Imports Production Exportssource: Industry
The graph opposite displays the shift in the overall Indian cashew picture over the last few years as imports have surged and exports have declined. (Note the data are in raw weight.) Growing domestic consumption has prompted the higher volume of imports. Between imports and production, India accounted for an estimated 1.4 billion raw kgs in 2009, more than half the world’s total production.
Red River Foods, Inc. June 2010 13
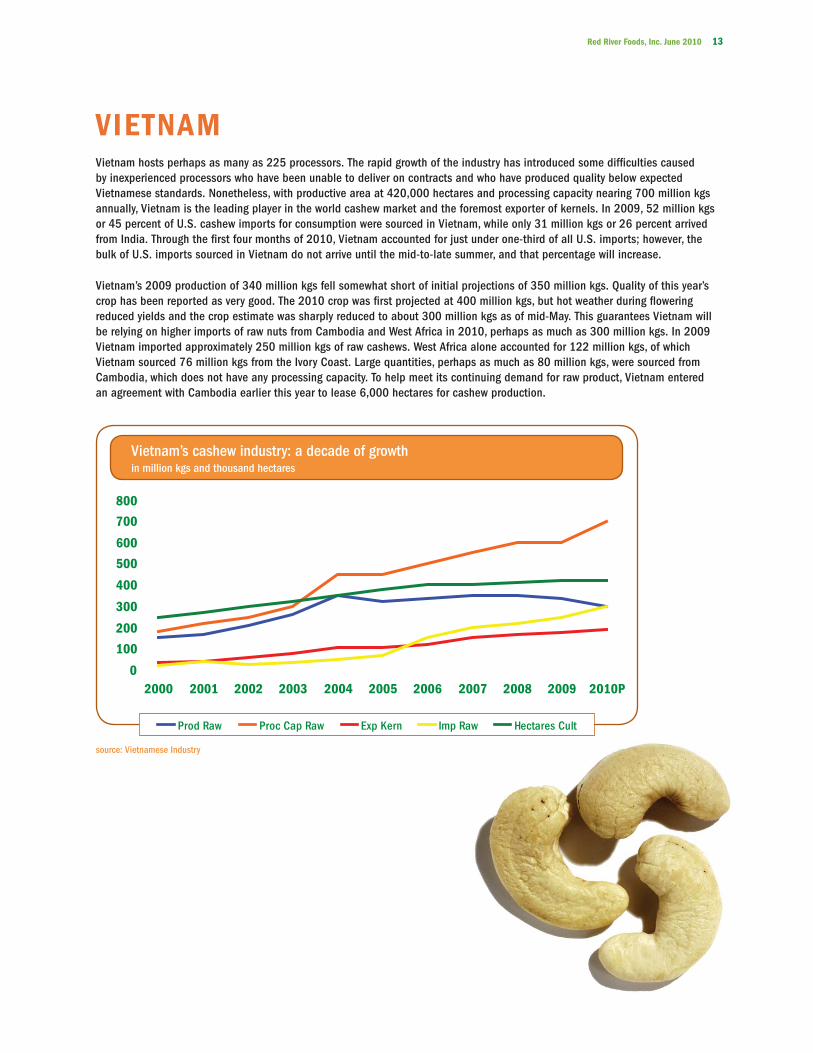
VIETNAMVietnam hosts perhaps as many as 225 processors. The rapid growth of the industry has introduced some diffi culties caused by inexperienced processors who have been unable to deliver on contracts and who have produced quality below expected Vietnamese standards. Nonetheless, with productive area at 420,000 hectares and processing capacity nearing 700 million kgs annually, Vietnam is the leading player in the world cashew market and the foremost exporter of kernels. In 2009, 52 million kgs or 45 percent of U.S. cashew imports for consumption were sourced in Vietnam, while only 31 million kgs or 26 percent arrived from India. Through the fi rst four months of 2010, Vietnam accounted for just under one-third of all U.S. imports; however, the bulk of U.S. imports sourced in Vietnam do not arrive until the mid-to-late summer, and that percentage will increase.
Vietnam’s 2009 production of 340 million kgs fell somewhat short of initial projections of 350 million kgs. Quality of this year’s crop has been reported as very good. The 2010 crop was fi rst projected at 400 million kgs, but hot weather during fl owering reduced yields and the crop estimate was sharply reduced to about 300 million kgs as of mid-May. This guarantees Vietnam will be relying on higher imports of raw nuts from Cambodia and West Africa in 2010, perhaps as much as 300 million kgs. In 2009 Vietnam imported approximately 250 million kgs of raw cashews. West Africa alone accounted for 122 million kgs, of which Vietnam sourced 76 million kgs from the Ivory Coast. Large quantities, perhaps as much as 80 million kgs, were sourced from Cambodia, which does not have any processing capacity. To help meet its continuing demand for raw product, Vietnam entered an agreement with Cambodia earlier this year to lease 6,000 hectares for cashew production.
Vietnam’s cashew industry: a decade of growth in million kgs and thousand hectares
source: Vietnamese Industry
0
100
200
300
400
500
600
700
800
2000 2001 2002 2003 2004 2005 2006 2007 2008 2009 2010P
Prod Raw Proc Cap Raw Exp Kern Imp Raw Hectares Cult
14 Highlights of the cashew industry
AFRICAN CASHEW
PRODUCERSWestBenin
Burkina FasoGhanaGuinea
Guinea-BissauIvory Coast
MaliNigeriaSenegal
The GambiaTogo
EastKenya
MadagascarMozambique
Tanzania
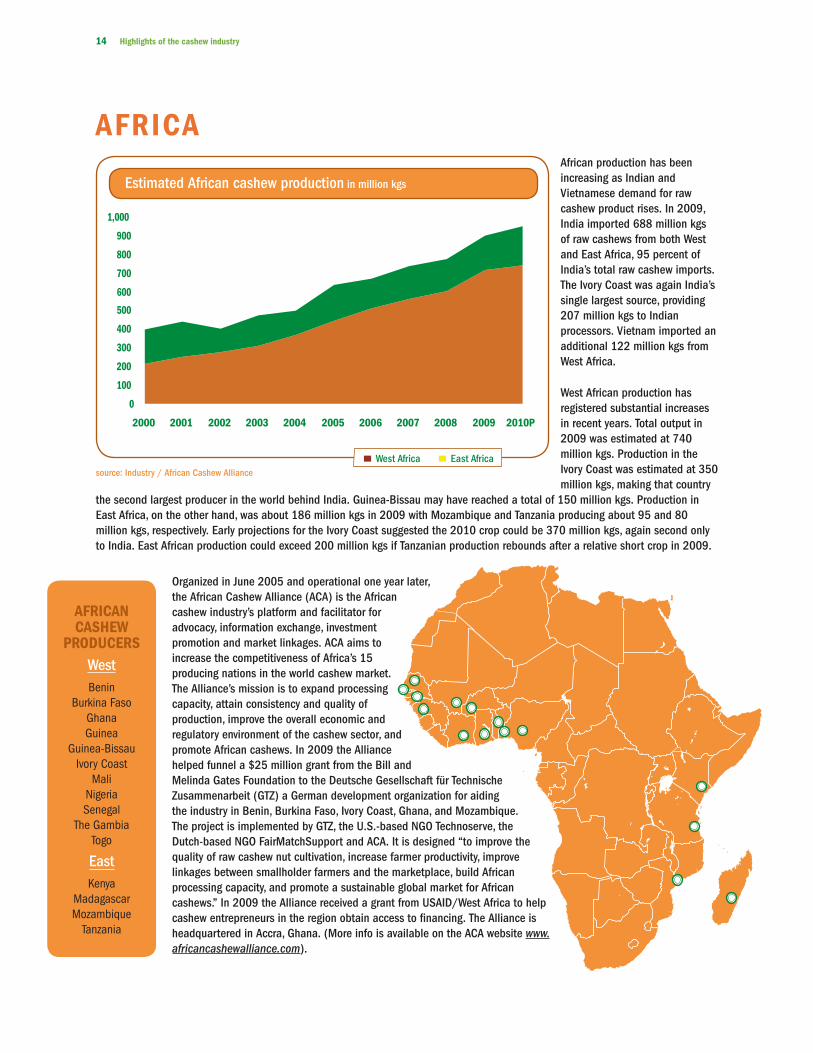
Organized in June 2005 and operational one year later, the African Cashew Alliance (ACA) is the African cashew industry’s platform and facilitator for advocacy, information exchange, investment promotion and market linkages. ACA aims to increase the competitiveness of Africa’s 15 producing nations in the world cashew market. The Alliance’s mission is to expand processing capacity, attain consistency and quality of production, improve the overall economic and regulatory environment of the cashew sector, and promote African cashews. In 2009 the Alliance helped funnel a $25 million grant from the Bill and Melinda Gates Foundation to the Deutsche Gesellschaft für Technische Zusammenarbeit (GTZ) a German development organization for aiding the industry in Benin, Burkina Faso, Ivory Coast, Ghana, and Mozambique. The project is implemented by GTZ, the U.S.-based NGO Technoserve, the Dutch-based NGO FairMatchSupport and ACA. It is designed “to improve the quality of raw cashew nut cultivation, increase farmer productivity, improve linkages between smallholder farmers and the marketplace, build African processing capacity, and promote a sustainable global market for African cashews.” In 2009 the Alliance received a grant from USAID/West Africa to help cashew entrepreneurs in the region obtain access to fi nancing. The Alliance is headquartered in Accra, Ghana. (More info is available on the ACA website www.africancashewalliance.com).
AFRICA African production has been increasing as Indian and Vietnamese demand for raw cashew product rises. In 2009, India imported 688 million kgs of raw cashews from both West and East Africa, 95 percent of India’s total raw cashew imports. The Ivory Coast was again India’s single largest source, providing 207 million kgs to Indian processors. Vietnam imported an additional 122 million kgs from West Africa.
West African production has registered substantial increases in recent years. Total output in 2009 was estimated at 740 million kgs. Production in the Ivory Coast was estimated at 350 million kgs, making that country
the second largest producer in the world behind India. Guinea-Bissau may have reached a total of 150 million kgs. Production in East Africa, on the other hand, was about 186 million kgs in 2009 with Mozambique and Tanzania producing about 95 and 80 million kgs, respectively. Early projections for the Ivory Coast suggested the 2010 crop could be 370 million kgs, again second only to India. East African production could exceed 200 million kgs if Tanzanian production rebounds after a relative short crop in 2009.
0
100
200
300
400
500
600
700
800
900
1,000
2000 2001 2002 2003 2004 2005 2006 2007 2008 2009 2010P
Estimated African cashew production in million kgs
West Africa East Africasource: Industry / African Cashew Alliance

Red River Foods, Inc. June 2010 15
PRICES Between 2000 and 2003 estimated average monthly FOB prices for W320s generally declined, but then shifted upward in 2004 and 2005. Prices fell back in 2006 as supplies increased, but began a sharp increase in mid-2007 as shippers in Vietnam and then India defaulted and delayed on their contracts. In June 2007 the estimated average price was about $4.50 per kg; by year’s end the price had risen to nearly $5.70 per kg. Price increases continued into 2008 and by mid-year the estimated average FOB price had climbed to $7.40 per kg. Thus, the price differential during the 2007-2008 season reached $2.90 per kg. The graph clearly depicts the volatility of the market between 2007 and 2008. The 2007-2008 period was an historic disruption in the cashew market, marked by the Brazilian 2008 crop shortfall; infl ationary pressures and new, inexperienced processors in Vietnam; and by defaults, demands for contract renegotiations, and delayed shipments in both Vietnam and India. Volatility led to uncertainty and, as a consequence, an extremely challenging period for importers. Prices fell back under $5.00 per kg by the end of 2008.
With higher domestic demand in India and Indian-Vietnamese competition for African raw cashews, average FOB prices began a steady climb in early 2009 from an estimated low of nearly $4.70 per kg to a high of nearly $6.40 per kg by year’s end. Through the fi rst quarter of 2010, estimated average monthly FOB prices for W320s hovered around the $6.00 mark.
$7.50$7.41
$7.00
$6.50
$6.35$6.11
$6.00 $6.04
$5.62 $5.67$5.82$5.51
$5.50
$5.00
$4.78 $4.63 $4.92$4.54$4.50
$4.32 $4.67$4.25 $4.43$4.30
$4.19 $4.25$4.00
$3.86
$3.73$3.50 $3.66Janto
Mar2000 2001 2002 2003 2004 2005 2006 2007 2008 2009 2010
Estimated avg annual FOB price ranges—cashews W320s in USD/kg
source: Industry
16 Highlights of the cashew industry
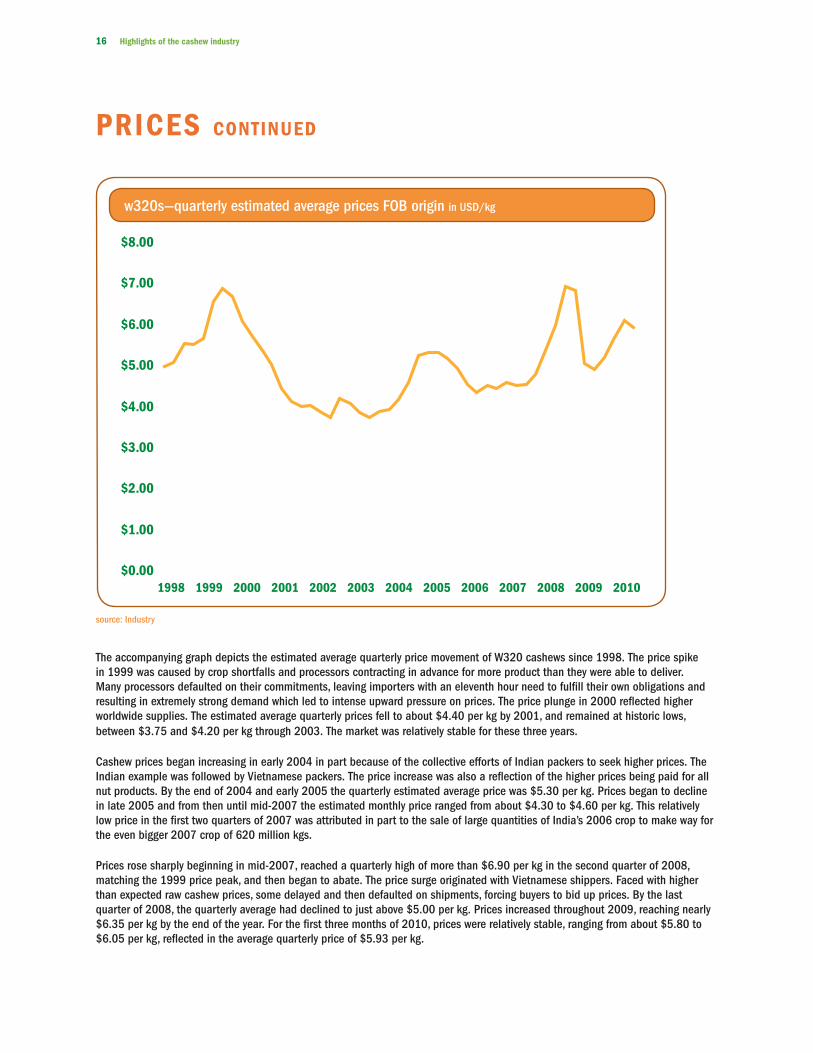
The accompanying graph depicts the estimated average quarterly price movement of W320 cashews since 1998. The price spike in 1999 was caused by crop shortfalls and processors contracting in advance for more product than they were able to deliver. Many processors defaulted on their commitments, leaving importers with an eleventh hour need to fulfi ll their own obligations and resulting in extremely strong demand which led to intense upward pressure on prices. The price plunge in 2000 refl ected higher worldwide supplies. The estimated average quarterly prices fell to about $4.40 per kg by 2001, and remained at historic lows, between $3.75 and $4.20 per kg through 2003. The market was relatively stable for these three years.
Cashew prices began increasing in early 2004 in part because of the collective efforts of Indian packers to seek higher prices. The Indian example was followed by Vietnamese packers. The price increase was also a refl ection of the higher prices being paid for all nut products. By the end of 2004 and early 2005 the quarterly estimated average price was $5.30 per kg. Prices began to decline in late 2005 and from then until mid-2007 the estimated monthly price ranged from about $4.30 to $4.60 per kg. This relatively low price in the fi rst two quarters of 2007 was attributed in part to the sale of large quantities of India’s 2006 crop to make way for the even bigger 2007 crop of 620 million kgs.
Prices rose sharply beginning in mid-2007, reached a quarterly high of more than $6.90 per kg in the second quarter of 2008, matching the 1999 price peak, and then began to abate. The price surge originated with Vietnamese shippers. Faced with higher than expected raw cashew prices, some delayed and then defaulted on shipments, forcing buyers to bid up prices. By the last quarter of 2008, the quarterly average had declined to just above $5.00 per kg. Prices increased throughout 2009, reaching nearly $6.35 per kg by the end of the year. For the fi rst three months of 2010, prices were relatively stable, ranging from about $5.80 to $6.05 per kg, refl ected in the average quarterly price of $5.93 per kg.
PRICES CONTINUED
19991998 2000 2001 2002 2003 2004 2005 2006 2007 2008 2009 2010$0.00
$1.00
$2.00
$3.00
$4.00
$5.00
$6.00
$7.00
$8.00
w320s—quarterly estimated average prices FOB origin in USD/kg
source: Industry

Red River Foods, Inc. June 2010 17
INDUSTRY PERSPECTIVEThe cashew industry recovered from the diffi cult mid-2007 to mid-2008 period. At that time a series of market misfortunes converged to send prices spiraling upward: short and off-quality Vietnamese crops in 2007 and 2008, respectively; a short 2008 crop in Brazil; and delays and defaults in Vietnam and later India. Since early 2009 prices have been trending upward, while exports to the U.S. and EU were rising above 2008 levels. New markets have come into play, including the Middle East; India alone increased exports to that region from 15 million kgs in 2005 to 28 million kgs in 2009. Vietnam has a large cross-border trade with China, estimated at 30-35 million kgs in 2009. While the growth of the Vietnamese industry slowed in 2009, it appears to be making gains in 2010 based on projections for higher imports and processing capacity. However, production estimates have been drastically scaled back to 300 million kgs. India’s appetite for African cashews is unabated as that county reached another record level of raw cashew imports of 728 million kgs in 2009. The Brazilian industry rebounded from a particularly diffi cult year in 2008 with a crop of perhaps 320 million kgs in 2009 and could produce another crop of 320 million kgs in 2010. U.S. demand, as measured by cashew kernel imports, rose from 112 million kgs in 2008 to 117 million kgs in 2009. U.S. imports through April 2010 indicate steady demand with total imports for the year at perhaps 112-115 million kgs.
Harvested cashew apples
18 Highlights of the cashew industry
CA
SH
EW I
ND
US
TRY
TIM
ELIN
E
Afr
ican C
ashew
Alli
ance b
egin
s
exp
ort
er,
surp
assed
Vie
tnam
ese,
India
n
prices b
egin
prices r
ise s
harp
ly;
Cam
bodia
for
India
raw
im
port
s incre
ase f
m 3
94 m
n k
gs in 2
002 t
o r
ecord
728 m
n k
gs in 2
009
India
exp
ort
s d
ecre
ase
sin
ce 1
986-8
7
exp
ort
Cro
p s
hort
ages,
supplie
r defa
ults
forc
e h
ighest
avg
exp
ort
prices
pro
cessin
g
estim
ate
d a
t
40-5
0 m
n k
gs
Avg
FO
Bto
colla
pse
to r
ebound
exp
ort
prices r
ecord
ed
pro
c'g
industr
y
Vie
tnam
leases 6
,000
hecta
res f
rom
Afr
cashew
industr
y
to A
fr C
ashew
to f
inancin
g
gra
nts
$25 m
n
Gate
s F
dn
Peak e
xport
year
for
Bra
zil
to h
elp
develo
p
auth
orizes
health b
enefit
Avg
FO
B p
rices d
eclin
e d
ram
tically
fro
mcla
ims f
or
Vie
tnam
cro
pV
ietn
am
exp
ort
s a
t
India
pace o
f
raw
im
port
s
2004
2000
peak levels
in 1
999
2002
2003
2001
cert
ain
nuts
1999
Alli
ance
by h
eat;
est
low
ere
d t
o 3
00
cro
p,
exp
ort
s
Bra
zil
cro
p r
educed
pro
duction
exp
ort
s t
o U
.S.
form
ed u
nder
2005
dow
n 3
5%
;
US
AID
countr
ies t
o incre
ase
sponsors
hip
pro
cessin
g,
add p
roduct
valu
e
2007
slo
w V
iet
labor
issues
Bra
zil
Afr
ican
Cashew
belo
w s
tandard
import
s r
ise f
m 7
0 m
n k
gs in 2
005 t
o p
roje
cte
d 3
00 m
n k
gs in 2
010
U.S
. F
DA
Majo
r qualit
y
pro
ble
ms e
merg
e
Vie
tnam
ese r
aw
cashew
im
port
s incre
ase d
ram
atically
;
Peak y
ear
for
U.S
. im
port
s:
incre
asin
g
Avg
FO
B e
xport
prices d
eclin
e
lead t
o s
urp
lus
sto
cks in I
ndia
,
Obje
ctive is t
o e
sta
blis
h c
ashew
ente
rprises s
o local popula
tions m
ay r
ealiz
e f
inancia
l benefits
fro
m a
ddin
g v
alu
e t
o t
he c
ashew
rath
er
than s
imply
exp
ort
ing t
he r
aw
mate
rial.
Alli
ance t
o a
id
Ind a
ccess
em
phasis
on q
ualit
y
price in D
ec
US
AID
cashew
pro
d
Various e
ffort
s b
y inte
rnational govern
ment
org
aniz
ations a
nd N
GO
s t
o institu
te c
ashew
supply
chain
org
aniz
ation a
nd c
ashew
pro
cessin
g in A
fric
an p
roducers
.
2006
2010
Vie
tnam
becom
es
gra
nts
$146 m
U.S
. im
port
s f
luctu
ate
: declin
e 1
3%
in 2
005,
flat
in 2
006 a
t 114 m
kgs,
rise t
o 1
25
mid
-2005;
rem
ain
rela
tive
ly f
lat
Annual in
cre
ases o
f cashew
im
port
s into
the U
.S.
Vie
tnam
India
raw
cashew
imposes t
ax
Vie
tnam
becom
es
on F
OB
exp
kern
el im
port
s b
egin
His
torically
low
avg F
OB
origin
to incre
ase s
harp
ly
second larg
est
cashew
pro
ducer,
Moza
mbiq
ue
India
second larg
est
kern
el
Vie
t re
covers
;
pro
cessin
g;
in 2
006 a
nd f
irst
half 2
007
Moza
mbiq
ue
pro
cessin
g b
egin
s
Avg
FO
B e
xport
exp
ort
prices
fall
as m
kt
uncert
ain
ties
record
exp
ort
s
rebound
FO
B p
rices
fluctu
ate
early
Avg
FO
B
2009;
rise,
fall,
dro
p s
harp
ly
in V
ietn
am
Early 2
007
2008
only
by I
ndia
libera
lization
exp
ort
131 m
illio
n k
gs
year
for
India
:
122 m
n k
gs
surp
assed o
nly
by
Peak e
xport
Moza
mbiq
ue
causes
20-2
5 m
n k
gs
pro
cessin
g
estim
ate
d a
t
org
aniz
ing c
ashew
inte
rests
in
Moza
mbiq
ue
ship
pers
defa
ult,
dela
y;
cause s
harp
price incre
ases
m k
gs in 2
007,
fall
to 1
15 m
kgs in 2
008,
and incre
ase a
gain
in 2
009 t
o 1
17 m
kgs
peak J
un 0
8
Manu,
buyers
incre
ase
and level off
Mozam
biq
ue
record
level
could
mean
anoth
er
record
year
in 2
010
Vie
tnam
ese
2009
fm 4
00 m
n k
gs

Red River Foods is pleased to provide information about the world cashew trade. The information and data herein represent estimates from a variety of sources as well as our own estimates. We wish to extend our grateful appreciation to the many individuals who helped make this brochure possible by contributing to our research. The company makes no warranty about the accuracy of these data and assumes no duty to update any materials contained in this report. Within the industry it is generally accepted that production, export, and other data can be understated, overestimated, or even unreported.
Red River wishes to emphasize that unforeseen events caused by political, legal, economic, or other circumstances, as well as weather conditions, could affect current expectations for any one market or for the world situation generally. Readers should not unduly rely on any estimates, forward-looking statements, or data cited herein to reach conclusions or make decisions about the various markets or market prices.
Red R iver Foods , Inc .9020 Stony Po int Parkway
Sui te 380Richmond, V i rg in ia 23235
USA
te l— 804.320.1800 fax—804.320.1896 phipps j@redr i ve r foods .com
Red River Foods , Inc .9020 Stony Po int Parkway
Sui te 380Richmond, V i rg in ia 23235
USA
te l— 804.320.1800 fax—804.320.1896 email—[email protected]
stages in the deve lopment o f a cashew nut


