23
EDISON INTERNATIONAL (EIX) SOUTHERN CALIFORNIA EDISON (SCE) 9 Corporate Structure 1 SCE Highlights 10Financial Highlights 2 SCE Transmission Program 10Business Highlights 3 SCE Results of Operations 11Stock and Dividend Highlights 3 SCE Regulatory Assets 12Credit Ratings 4 SCE Regulatory Liabilities 12Contractual Obligations 5 SCE Authorized Rates of Return and Capital Structure 13Credit Agreements and Short-Term Debt 5 SCE Operating and Financial Ratios 13Preferred and Preference Stock 6 SCE Fuel Consumption 13Five-Year Long-Term Debt Maturities 6 SCE Customers 13Consolidated Long-Term Debt 7 SCE Residential Rate Structure 14
SCE Kilowatt-Hour Sales 15SCE Operating Revenue by Class of Service 15SCE Operating Statistics 16SCE Jointly Owned Projects 17Detail of SCE Utility Plant – Net 18
GENERAL INFORMATION
California Public Utilities Commission (CPUC) 19Federal Energy Regulatory Commission (FERC) 19Leadership Team 20Investor Relations Contact Information 21
Cautionary Statement
This Financial and Statistical Report and the statements and statistics contained herein have been assembled for informative purposes andare not intended to induce, or for use in connection with, any sale or purchase of securities. Under no circumstances is this report or anypart of its contents to be considered a prospectus, or an offer to sell, or the solicitation of an offer to buy, any securities.
Readers are urged to read this entire Financial & Statistical Report, including the information incorporated by reference, as well as the 2018Annual Report on Form 10-K filed by Edison International with the U.S. Securities & Exchange Commission and its other SEC filings. Thesereports are available on our website: www.edisoninvestor.com. These filings also provide additional information on historical and other factualdata contained in this report.
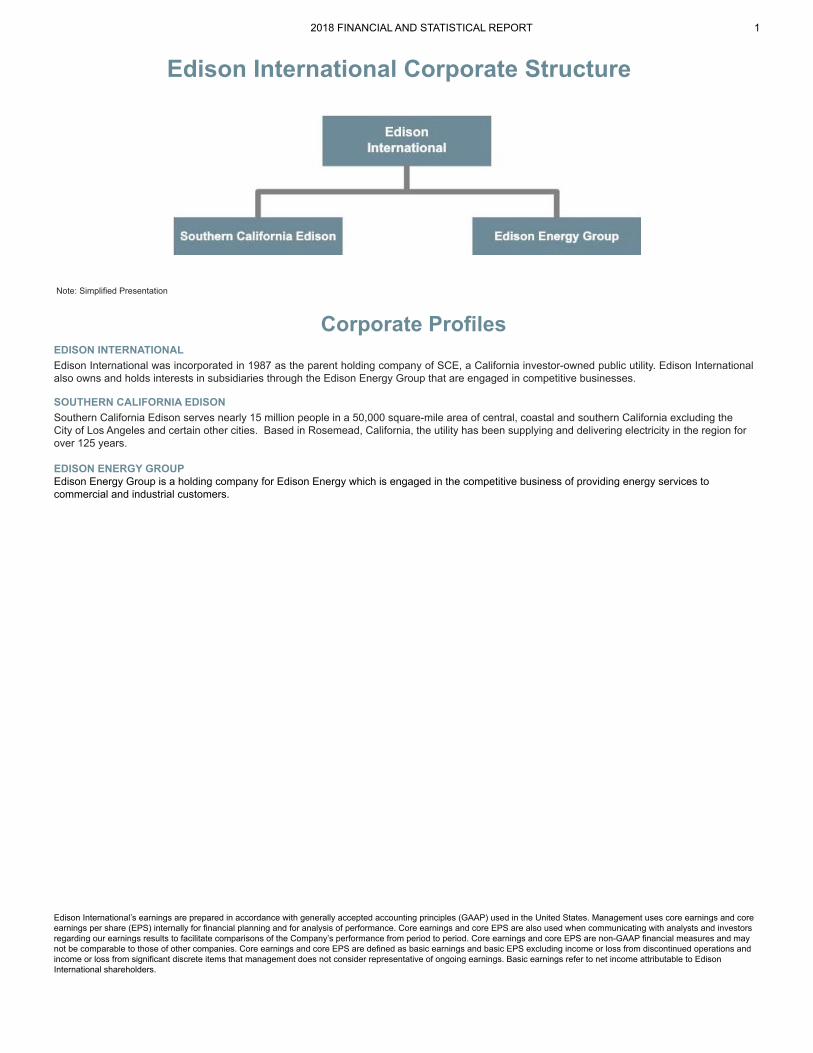
Edison International Corporate Structure
Note: Simplified Presentation
Corporate Profiles EDISON INTERNATIONAL Edison International was incorporated in 1987 as the parent holding company of SCE, a California investor-owned public utility. Edison Internationalalso owns and holds interests in subsidiaries through the Edison Energy Group that are engaged in competitive businesses.
SOUTHERN CALIFORNIA EDISON Southern California Edison serves nearly 15 million people in a 50,000 square-mile area of central, coastal and southern California excluding theCity of Los Angeles and certain other cities. Based in Rosemead, California, the utility has been supplying and delivering electricity in the region forover 125 years.
EDISON ENERGY GROUP Edison Energy Group is a holding company for Edison Energy which is engaged in the competitive business of providing energy services tocommercial and industrial customers.
Edison International’s earnings are prepared in accordance with generally accepted accounting principles (GAAP) used in the United States. Management uses core earnings and coreearnings per share (EPS) internally for financial planning and for analysis of performance. Core earnings and core EPS are also used when communicating with analysts and investorsregarding our earnings results to facilitate comparisons of the Company’s performance from period to period. Core earnings and core EPS are non-GAAP financial measures and maynot be comparable to those of other companies. Core earnings and core EPS are defined as basic earnings and basic EPS excluding income or loss from discontinued operations andincome or loss from significant discrete items that management does not consider representative of ongoing earnings. Basic earnings refer to net income attributable to EdisonInternational shareholders.
2018 FINANCIAL AND STATISTICAL REPORT 1
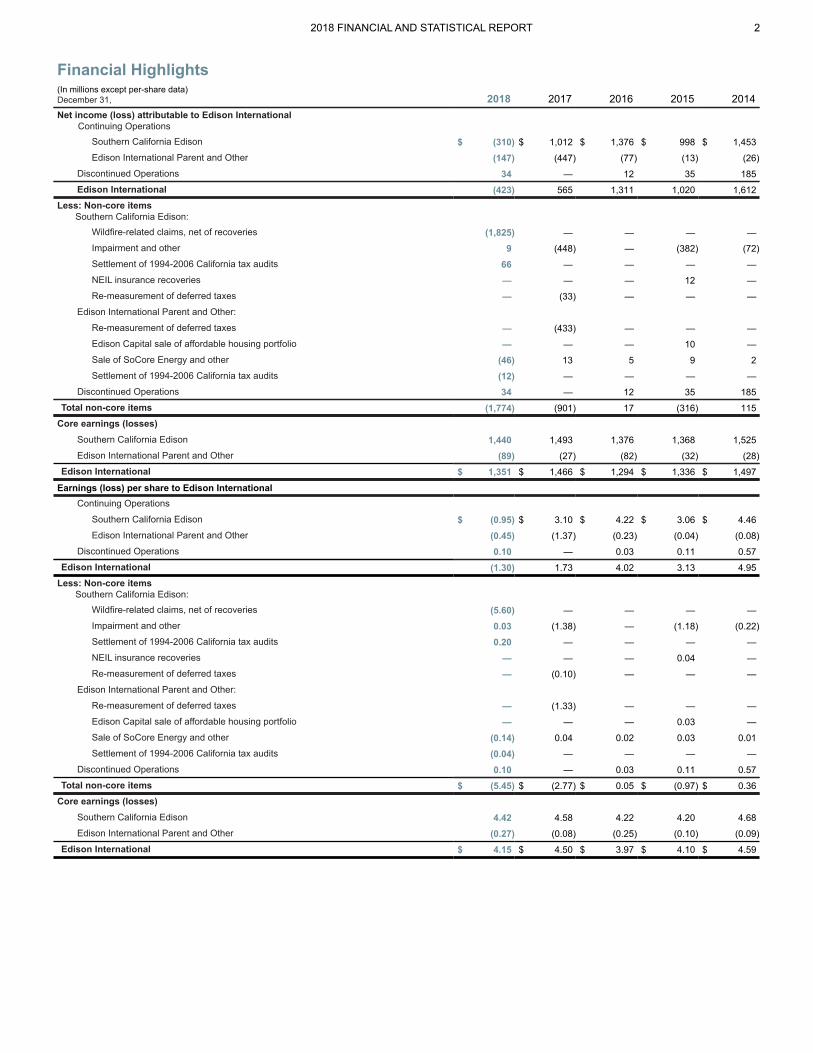
Financial Highlights(In millions except per-share data)December 31, 2018 2017 2016 2015 2014Net income (loss) attributable to Edison International Continuing Operations
Southern California Edison $ (310) $ 1,012 $ 1,376 $ 998 $ 1,453Edison International Parent and Other (147) (447) (77) (13) (26)
Discontinued Operations 34 — 12 35 185Edison International (423) 565 1,311 1,020 1,612
Less: Non-core items Southern California Edison:
Wildfire-related claims, net of recoveries (1,825) — — — —Impairment and other 9 (448) — (382) (72)Settlement of 1994-2006 California tax audits 66 — — — —NEIL insurance recoveries — — — 12 —Re-measurement of deferred taxes — (33) — — —
Edison International Parent and Other:
Re-measurement of deferred taxes — (433) — — —Edison Capital sale of affordable housing portfolio — — — 10 —Sale of SoCore Energy and other (46) 13 5 9 2Settlement of 1994-2006 California tax audits (12) — — — —
Discontinued Operations 34 — 12 35 185Total non-core items (1,774) (901) 17 (316) 115
Core earnings (losses)Southern California Edison 1,440 1,493 1,376 1,368 1,525Edison International Parent and Other (89) (27) (82) (32) (28)
Edison International $ 1,351 $ 1,466 $ 1,294 $ 1,336 $ 1,497
Earnings (loss) per share to Edison InternationalContinuing Operations
Southern California Edison $ (0.95) $ 3.10 $ 4.22 $ 3.06 $ 4.46Edison International Parent and Other (0.45) (1.37) (0.23) (0.04) (0.08)
Discontinued Operations 0.10 — 0.03 0.11 0.57Edison International (1.30) 1.73 4.02 3.13 4.95
Less: Non-core items Southern California Edison:
Wildfire-related claims, net of recoveries (5.60) — — — —Impairment and other 0.03 (1.38) — (1.18) (0.22)Settlement of 1994-2006 California tax audits 0.20 — — — —NEIL insurance recoveries — — — 0.04 —Re-measurement of deferred taxes — (0.10) — — —
Edison International Parent and Other:
Re-measurement of deferred taxes — (1.33) — — —Edison Capital sale of affordable housing portfolio — — — 0.03 —Sale of SoCore Energy and other (0.14) 0.04 0.02 0.03 0.01Settlement of 1994-2006 California tax audits (0.04) — — — —
Discontinued Operations 0.10 — 0.03 0.11 0.57Total non-core items $ (5.45) $ (2.77) $ 0.05 $ (0.97) $ 0.36
Core earnings (losses)Southern California Edison 4.42 4.58 4.22 4.20 4.68Edison International Parent and Other (0.27) (0.08) (0.25) (0.10) (0.09)
Edison International $ 4.15 $ 4.50 $ 3.97 $ 4.10 $ 4.59
2018 FINANCIAL AND STATISTICAL REPORT 2
Business HighlightsSouthern California Edison 2018 2017 2016 2015 2014
Total assets at December 31 $ 56,574 $ 51,515 $ 50,891 $ 49,785 $ 49,456Rate base1 $ 29,557 $ 27,816 $ 25,923 $ 24,596 $ 23,254Capital expenditures2 $ 4,363 $ 3,835 $ 3,527 $ 3,867 $ 3,967Total system sales (kilowatt-hours, in millions) 87,143 87,170 87,242 87,937 88,725Peak demand in megawatts (MW) 23,766 23,508 23,091 23,079 23,055Generating capacity resources (MW) 3,284 3,175 3,175 3,139 3,139Customers (thousands) 5,127 5,095 5,061 5,033 5,005Employees (as of December 31) 12,219 12,234 11,947 12,678 13,600
1Represents year-end rate base at December 31, which includes capital expenditures related to certain FERC-approved projects during the construction phase; 2014-2015 excludes1San Onofre Nuclear Generating Station (SONGS). 2Capital expenditures for each year include accruals.
2018 FINANCIAL AND STATISTICAL REPORT 3
Stock and Dividend HighlightsDecember 31, 2018 2017 2016 2015 2014Stock PriceHigh $ 70.54 $ 83.38 $ 78.72 $ 69.59 $ 68.74Low $ 47.19 $ 62.67 $ 57.97 $ 55.18 $ 44.74Year end $ 56.77 $ 63.24 $ 71.99 $ 59.21 $ 65.48
Total Shareholder Return (6.7)% (9.5)% 24.9% (6.9)% 45.0%
DividendsDividend per common share $ 2.42 $ 2.17 $ 1.92 $ 1.67 $ 1.42Dividend yield (dividends paid to year-end stock price) 4.26 % 3.4 % 2.7% 2.8% 2.2%Dividend payout ratio (dividends paid to SCE core earnings) 54.8 % 47.4 % 45.5% 39.8% 30.3%
Common shares outstanding (thousands) 325,811 325,811 325,811 325,811 325,811
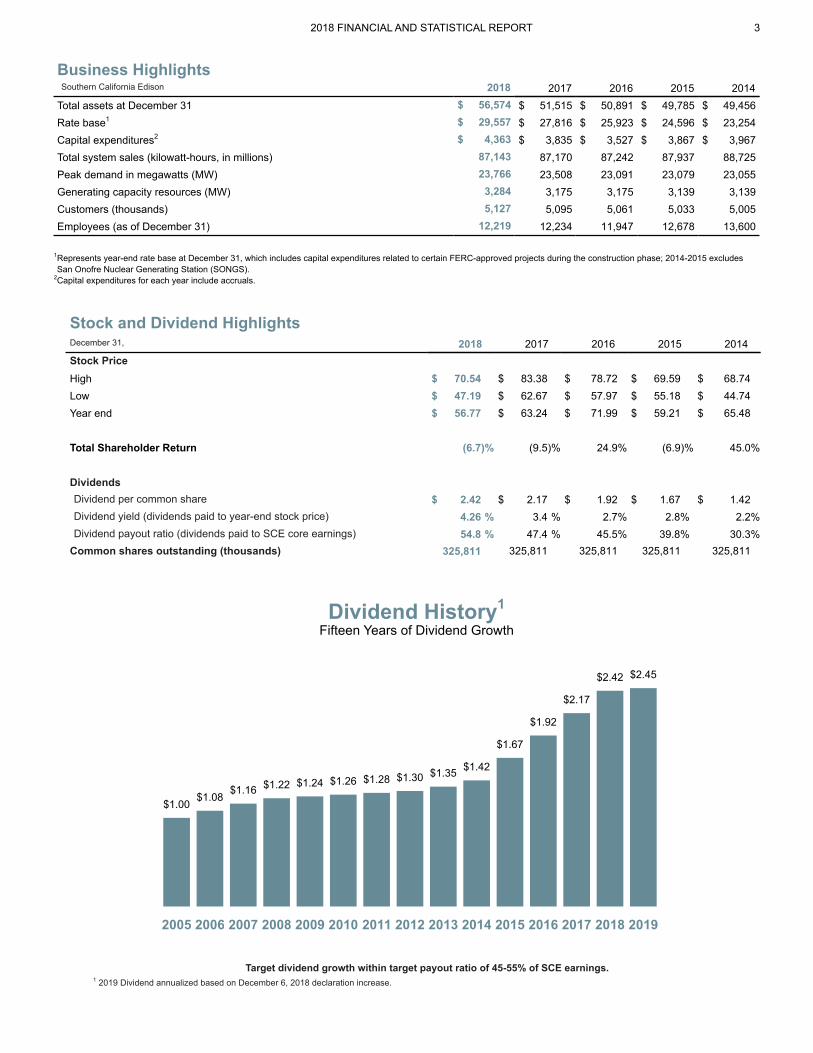
Dividend History1
Fifteen Years of Dividend Growth
2005 2006 2007 2008 2009 2010 2011 2012 2013 2014 2015 2016 2017 2018 2019
$1.00$1.08
$1.16 $1.22 $1.24 $1.26 $1.28 $1.30 $1.35 $1.42
$1.67
$1.92
$2.17
$2.42 $2.45
Target dividend growth within target payout ratio of 45-55% of SCE earnings. 1 2019 Dividend annualized based on December 6, 2018 declaration increase.
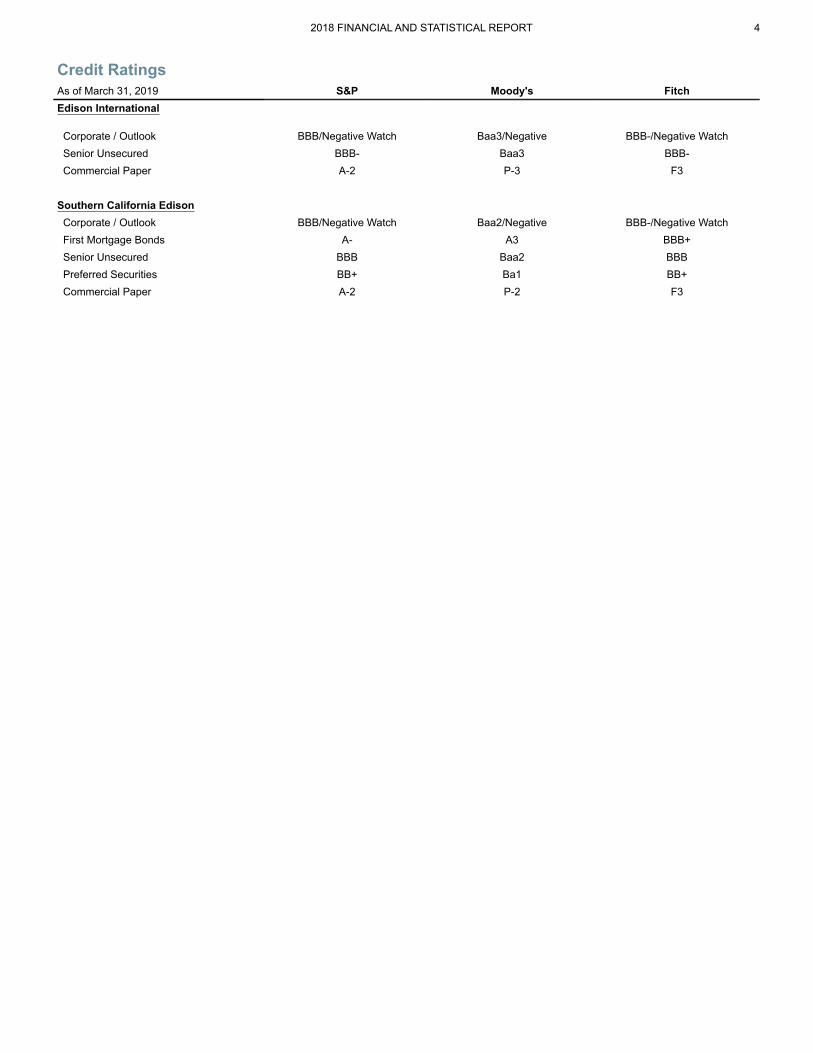
Credit RatingsAs of March 31, 2019 S&P Moody's FitchEdison International
Corporate / Outlook BBB/Negative Watch Baa3/Negative BBB-/Negative Watch Senior Unsecured BBB- Baa3 BBB- Commercial Paper A-2 P-3 F3
Southern California Edison Corporate / Outlook BBB/Negative Watch Baa2/Negative BBB-/Negative Watch First Mortgage Bonds A- A3 BBB+ Senior Unsecured BBB Baa2 BBB Preferred Securities BB+ Ba1 BB+ Commercial Paper A-2 P-2 F3
2018 FINANCIAL AND STATISTICAL REPORT 4
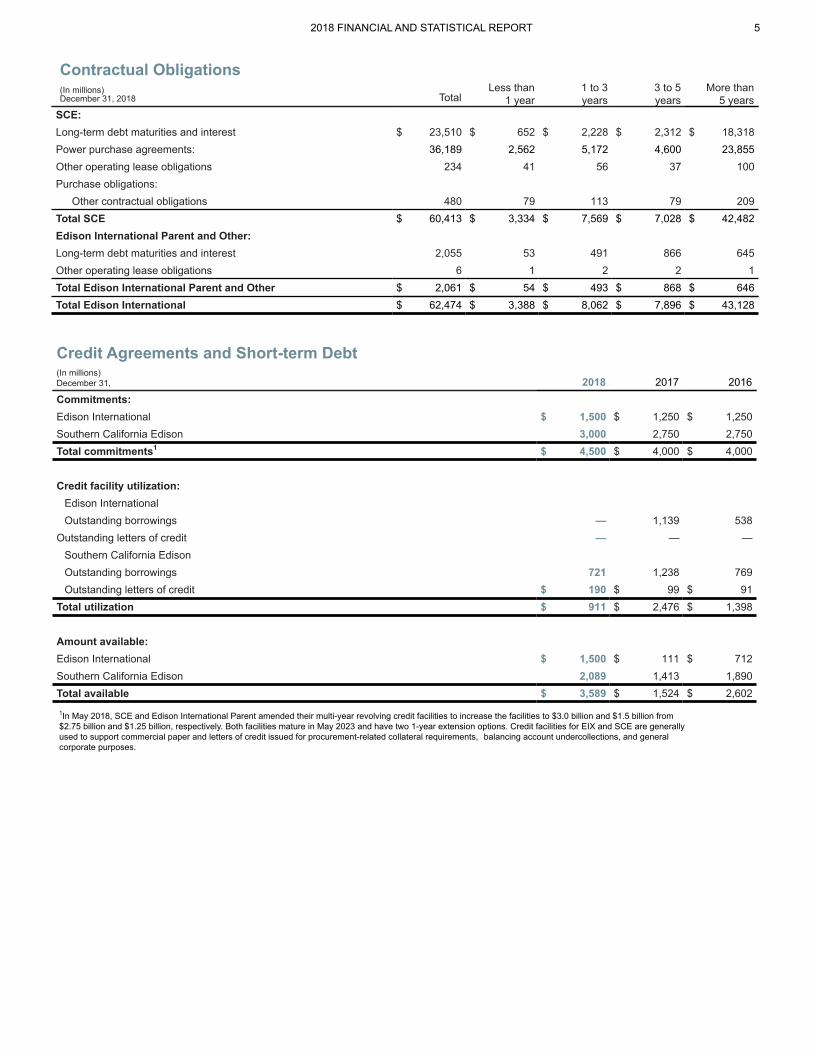
Contractual Obligations(In millions)December 31, 2018 Total
Less than 1 year
1 to 3 years
3 to 5 years
More than 5 years
SCE:Long-term debt maturities and interest $ 23,510 $ 652 $ 2,228 $ 2,312 $ 18,318Power purchase agreements: 36,189 2,562 5,172 4,600 23,855Other operating lease obligations 234 41 56 37 100Purchase obligations:
Other contractual obligations 480 79 113 79 209Total SCE $ 60,413 $ 3,334 $ 7,569 $ 7,028 $ 42,482Edison International Parent and Other:Long-term debt maturities and interest 2,055 53 491 866 645Other operating lease obligations 6 1 2 2 1Total Edison International Parent and Other $ 2,061 $ 54 $ 493 $ 868 $ 646Total Edison International $ 62,474 $ 3,388 $ 8,062 $ 7,896 $ 43,128
2018 FINANCIAL AND STATISTICAL REPORT 5
Credit Agreements and Short-term Debt(In millions)December 31, 2018 2017 2016Commitments:Edison International $ 1,500 $ 1,250 $ 1,250Southern California Edison 3,000 2,750 2,750Total commitments1 $ 4,500 $ 4,000 $ 4,000
Credit facility utilization:Edison InternationalOutstanding borrowings — 1,139 538
Outstanding letters of credit — — —Southern California EdisonOutstanding borrowings 721 1,238 769Outstanding letters of credit $ 190 $ 99 $ 91
Total utilization $ 911 $ 2,476 $ 1,398
Amount available:Edison International $ 1,500 $ 111 $ 712Southern California Edison 2,089 1,413 1,890Total available $ 3,589 $ 1,524 $ 2,602
1In May 2018, SCE and Edison International Parent amended their multi-year revolving credit facilities to increase the facilities to $3.0 billion and $1.5 billion from$2.75 billion and $1.25 billion, respectively. Both facilities mature in May 2023 and have two 1-year extension options. Credit facilities for EIX and SCE are generallyused to support commercial paper and letters of credit issued for procurement-related collateral requirements, 1balancing account undercollections, and generalcorporate purposes.
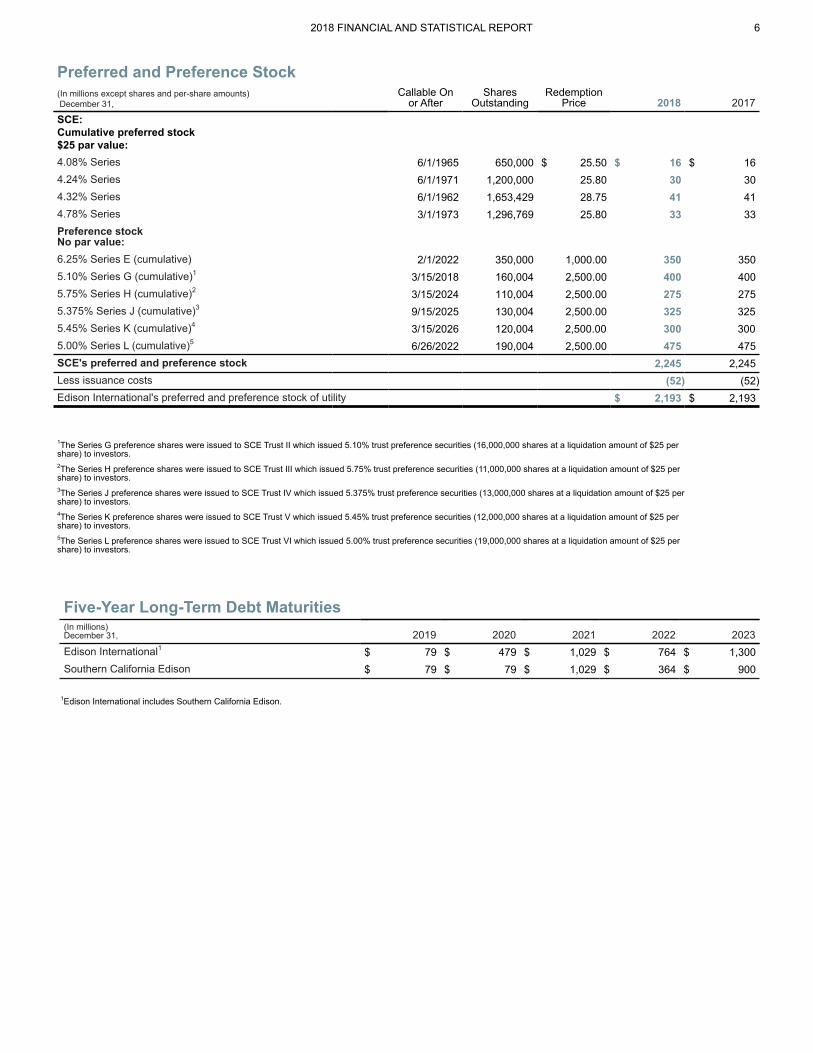
Preferred and Preference Stock(In millions except shares and per-share amounts) December 31,
Callable Onor After
SharesOutstanding
RedemptionPrice 2018 2017
SCE:Cumulative preferred stock$25 par value:4.08% Series 6/1/1965 650,000 $ 25.50 $ 16 $ 164.24% Series 6/1/1971 1,200,000 25.80 30 304.32% Series 6/1/1962 1,653,429 28.75 41 414.78% Series 3/1/1973 1,296,769 25.80 33 33Preference stockNo par value:6.25% Series E (cumulative) 2/1/2022 350,000 1,000.00 350 3505.10% Series G (cumulative)1 3/15/2018 160,004 2,500.00 400 4005.75% Series H (cumulative)2 3/15/2024 110,004 2,500.00 275 2755.375% Series J (cumulative)3 9/15/2025 130,004 2,500.00 325 3255.45% Series K (cumulative)4 3/15/2026 120,004 2,500.00 300 3005.00% Series L (cumulative)5 6/26/2022 190,004 2,500.00 475 475SCE's preferred and preference stock 2,245 2,245Less issuance costs (52) (52)Edison International's preferred and preference stock of utility $ 2,193 $ 2,193
1The Series G preference shares were issued to SCE Trust II which issued 5.10% trust preference securities (16,000,000 shares at a liquidation amount of $25 pershare) to investors.2The Series H preference shares were issued to SCE Trust III which issued 5.75% trust preference securities (11,000,000 shares at a liquidation amount of $25 pershare) to investors.3The Series J preference shares were issued to SCE Trust IV which issued 5.375% trust preference securities (13,000,000 shares at a liquidation amount of $25 pershare) to investors.4The Series K preference shares were issued to SCE Trust V which issued 5.45% trust preference securities (12,000,000 shares at a liquidation amount of $25 pershare) to investors.5The Series L preference shares were issued to SCE Trust VI which issued 5.00% trust preference securities (19,000,000 shares at a liquidation amount of $25 pershare) to investors.
2018 FINANCIAL AND STATISTICAL REPORT 6
Five-Year Long-Term Debt Maturities(In millions)December 31, 2019 2020 2021 2022 2023Edison International1 $ 79 $ 479 $ 1,029 $ 764 $ 1,300Southern California Edison $ 79 $ 79 $ 1,029 $ 364 $ 900
1Edison International includes Southern California Edison.
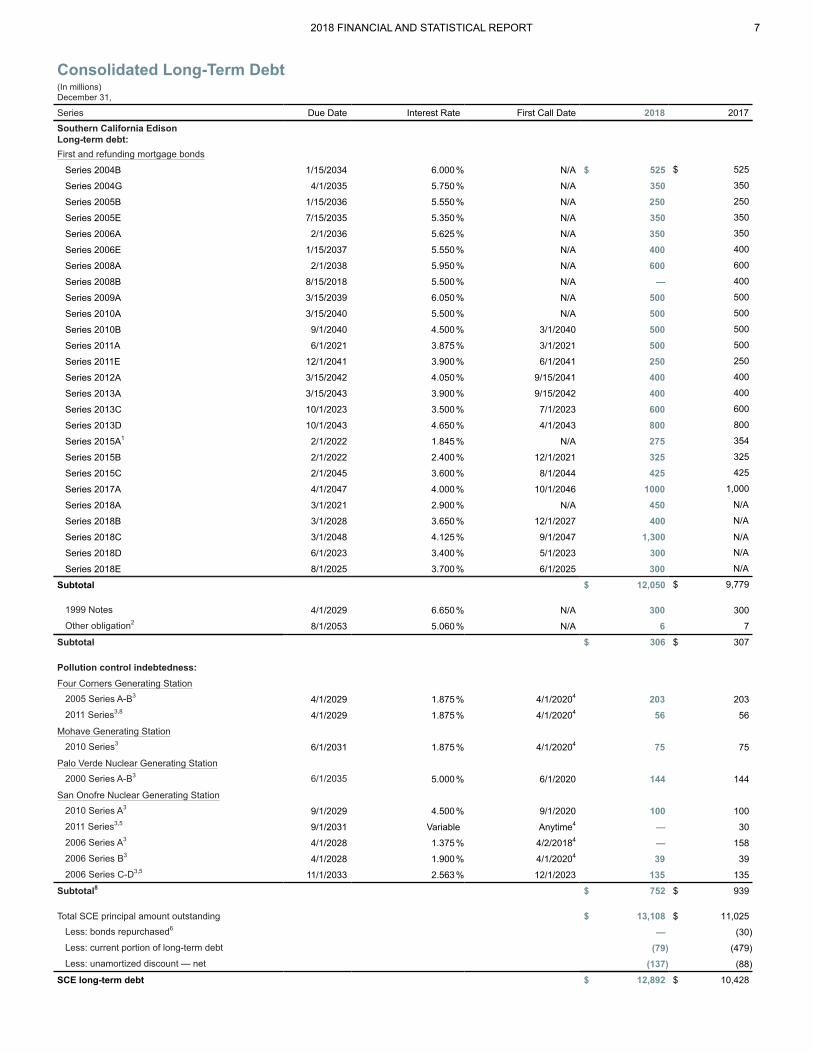
Consolidated Long-Term Debt(In millions)December 31,
Series Due Date Interest Rate First Call Date 2018 2017Southern California EdisonLong-term debt:First and refunding mortgage bonds
Series 2004B 1/15/2034 6.000% N/A $ 525 $ 525
Series 2004G 4/1/2035 5.750% N/A 350 350
Series 2005B 1/15/2036 5.550% N/A 250 250
Series 2005E 7/15/2035 5.350% N/A 350 350
Series 2006A 2/1/2036 5.625% N/A 350 350
Series 2006E 1/15/2037 5.550% N/A 400 400
Series 2008A 2/1/2038 5.950% N/A 600 600
Series 2008B 8/15/2018 5.500% N/A — 400
Series 2009A 3/15/2039 6.050% N/A 500 500
Series 2010A 3/15/2040 5.500% N/A 500 500
Series 2010B 9/1/2040 4.500% 3/1/2040 500 500
Series 2011A 6/1/2021 3.875% 3/1/2021 500 500
Series 2011E 12/1/2041 3.900% 6/1/2041 250 250
Series 2012A 3/15/2042 4.050% 9/15/2041 400 400
Series 2013A 3/15/2043 3.900% 9/15/2042 400 400
Series 2013C 10/1/2023 3.500% 7/1/2023 600 600
Series 2013D 10/1/2043 4.650% 4/1/2043 800 800
Series 2015A1 2/1/2022 1.845% N/A 275 354
Series 2015B 2/1/2022 2.400% 12/1/2021 325 325
Series 2015C 2/1/2045 3.600% 8/1/2044 425 425
Series 2017A 4/1/2047 4.000% 10/1/2046 1000 1,000
Series 2018A 3/1/2021 2.900% N/A 450 N/A
Series 2018B 3/1/2028 3.650% 12/1/2027 400 N/A
Series 2018C 3/1/2048 4.125% 9/1/2047 1,300 N/A
Series 2018D 6/1/2023 3.400% 5/1/2023 300 N/A
Series 2018E 8/1/2025 3.700% 6/1/2025 300 N/A
Subtotal $ 12,050 $ 9,779
1999 Notes 4/1/2029 6.650% N/A 300 300Other obligation2 8/1/2053 5.060% N/A 6 7
Subtotal $ 306 $ 307
Pollution control indebtedness:Four Corners Generating Station
2005 Series A-B3 4/1/2029 1.875% 4/1/20204 203 2032011 Series3,8 4/1/2029 1.875% 4/1/20204 56 56
Mohave Generating Station2010 Series3 6/1/2031 1.875% 4/1/20204 75 75
Palo Verde Nuclear Generating Station2000 Series A-B3 6/1/2035 5.000% 6/1/2020 144 144
San Onofre Nuclear Generating Station2010 Series A3 9/1/2029 4.500% 9/1/2020 100 1002011 Series3,5 9/1/2031 Variable Anytime4 — 302006 Series A3 4/1/2028 1.375% 4/2/20184 — 1582006 Series B3 4/1/2028 1.900% 4/1/20204 39 392006 Series C-D3,5 11/1/2033 2.563% 12/1/2023 135 135
Subtotal8 $ 752 $ 939
Total SCE principal amount outstanding $ 13,108 $ 11,025Less: bonds repurchased6 — (30)Less: current portion of long-term debt (79) (479)Less: unamortized discount — net (137) (88)
SCE long-term debt $ 12,892 $ 10,428
2018 FINANCIAL AND STATISTICAL REPORT 7
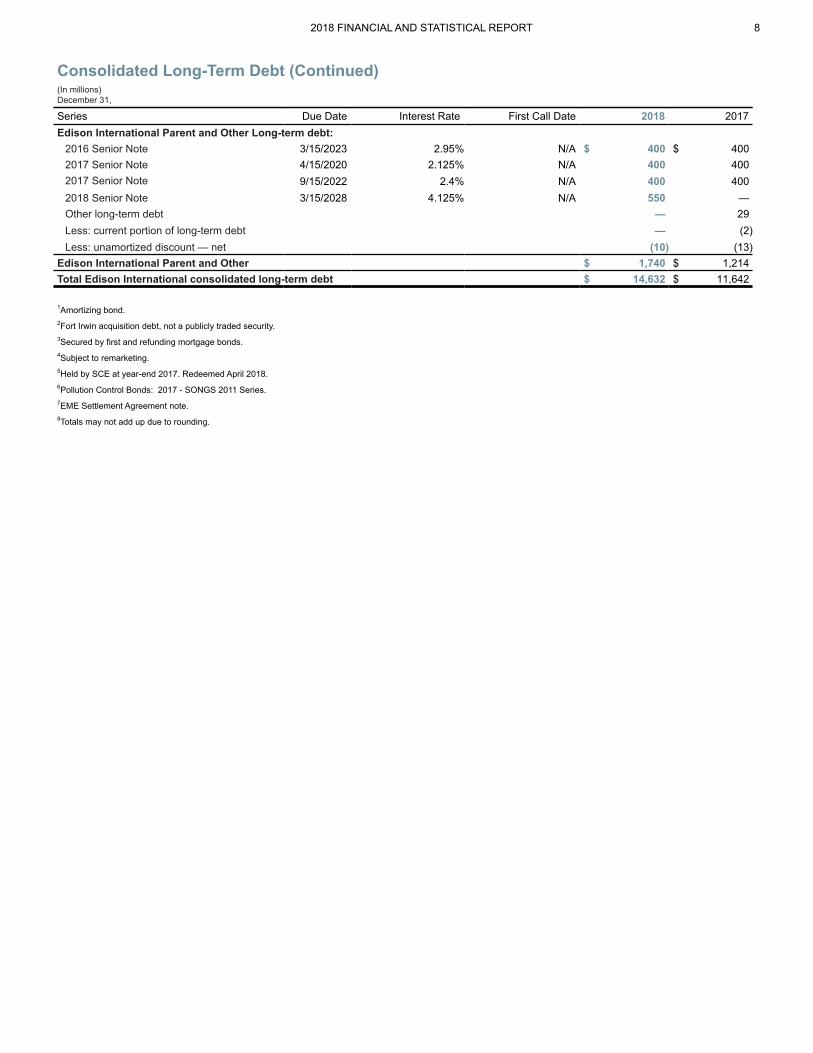
1Amortizing bond.2Fort Irwin acquisition debt, not a publicly traded security.3Secured by first and refunding mortgage bonds.4Subject to remarketing.5Held by SCE at year-end 2017. Redeemed April 2018.6Pollution Control Bonds: 2017 - SONGS 2011 Series.7EME Settlement Agreement note.8Totals may not add up due to rounding.
Consolidated Long-Term Debt (Continued)(In millions)December 31,
Series Due Date Interest Rate First Call Date 2018 2017Edison International Parent and Other Long-term debt:
2016 Senior Note 3/15/2023 2.95% N/A $ 400 $ 4002017 Senior Note 4/15/2020 2.125% N/A 400 4002017 Senior Note 9/15/2022 2.4% N/A 400 4002018 Senior Note 3/15/2028 4.125% N/A 550 —Other long-term debt — 29Less: current portion of long-term debt — (2)Less: unamortized discount — net (10) (13)
Edison International Parent and Other $ 1,740 $ 1,214Total Edison International consolidated long-term debt $ 14,632 $ 11,642
2018 FINANCIAL AND STATISTICAL REPORT 8
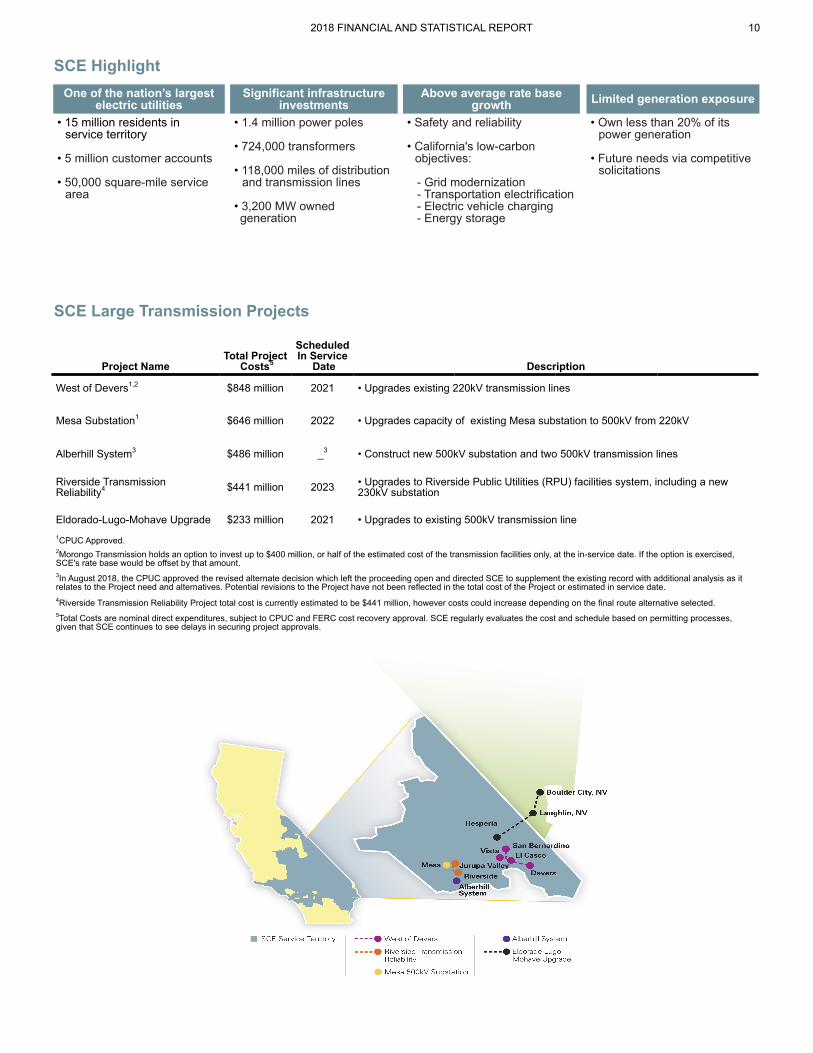
SCE HighlightOne of the nation’s largest
electric utilitiesSignificant infrastructure
investmentsAbove average rate base
growth Limited generation exposure
• 15 million residents inXservice territory
• 5 million customer accounts
• 50,000 square-mile serviceXarea
• 1.4 million power poles
• 724,000 transformers
• 118,000 miles of distributionXand transmission lines
• 3,200 MW ownedgeneration
• Safety and reliability
• California's low-carbonXobjectives:
- Grid modernization - Transportation electrification - Electric vehicle charging - Energy storage
• Own less than 20% of itsXpower generation
• Future needs via competitiveXsolicitations
2018 FINANCIAL AND STATISTICAL REPORT 10
SCE Large Transmission Projects
Project NameTotal Project
Costs5
ScheduledIn Service
Date Description
West of Devers1,2 $848 million 2021 • Upgrades existing 220kV transmission lines
Mesa Substation1 $646 million 2022 • Upgrades capacity of existing Mesa substation to 500kV from 220kV
Alberhill System3 $486 million _3 • Construct new 500kV substation and two 500kV transmission lines
Riverside TransmissionReliability4 $441 million 2023 • Upgrades to Riverside Public Utilities (RPU) facilities system, including a new
230kV substation
Eldorado-Lugo-Mohave Upgrade $233 million 2021 • Upgrades to existing 500kV transmission line1CPUC Approved.2Morongo Transmission holds an option to invest up to $400 million, or half of the estimated cost of the transmission facilities only, at the in-service date. If the option is exercised,SCE's rate base would be offset by that amount.3In August 2018, the CPUC approved the revised alternate decision which left the proceeding open and directed SCE to supplement the existing record with additional analysis as itrelates to the Project need and alternatives. Potential revisions to the Project have not been reflected in the total cost of the Project or estimated in service date.4Riverside Transmission Reliability Project total cost is currently estimated to be $441 million, however costs could increase depending on the final route alternative selected.5Total Costs are nominal direct expenditures, subject to CPUC and FERC cost recovery approval. SCE regularly evaluates the cost and schedule based on permitting processes,given that SCE continues to see delays in securing project approvals.
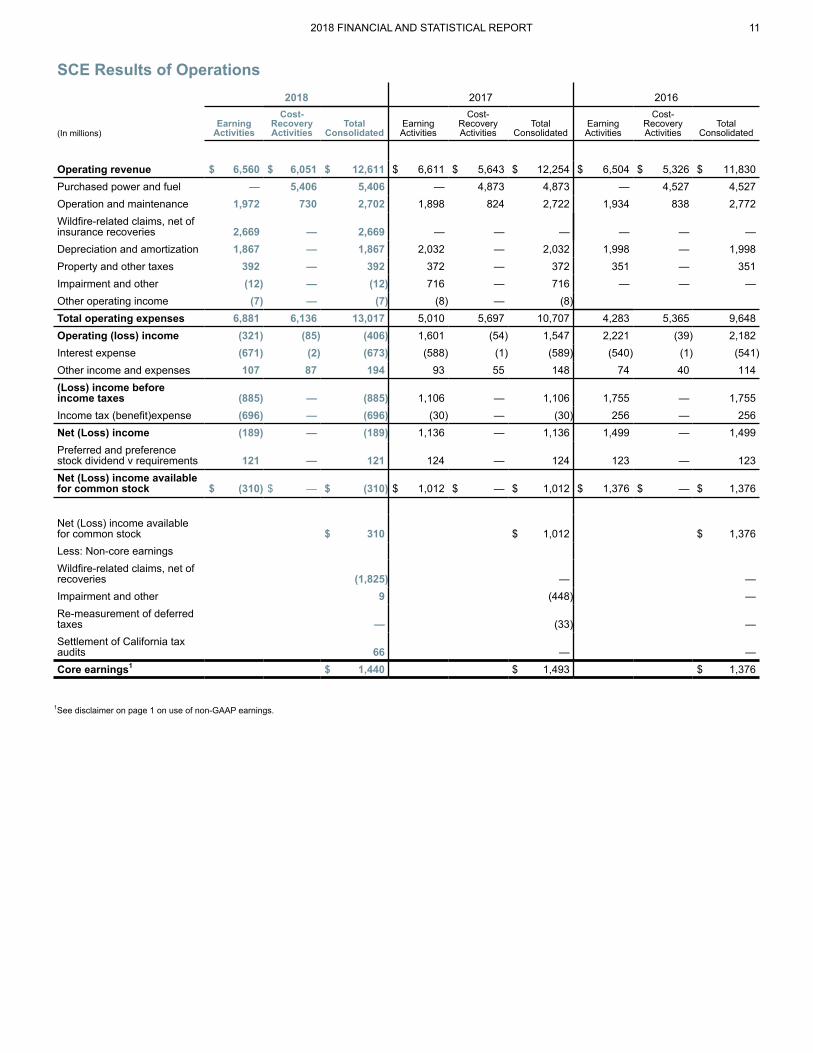
SCE Results of Operations2018 2017 2016
(In millions)Earning
Activities
Cost-RecoveryActivities
TotalConsolidated
EarningActivities
Cost-RecoveryActivities
TotalConsolidated
EarningActivities
Cost-RecoveryActivities
TotalConsolidated
Operating revenue $ 6,560 $ 6,051 $ 12,611 $ 6,611 $ 5,643 $ 12,254 $ 6,504 $ 5,326 $ 11,830Purchased power and fuel — 5,406 5,406 — 4,873 4,873 — 4,527 4,527Operation and maintenance 1,972 730 2,702 1,898 824 2,722 1,934 838 2,772Wildfire-related claims, net ofinsurance recoveries 2,669 — 2,669 — — — — — —Depreciation and amortization 1,867 — 1,867 2,032 — 2,032 1,998 — 1,998Property and other taxes 392 — 392 372 — 372 351 — 351Impairment and other (12) — (12) 716 — 716 — — —Other operating income (7) — (7) (8) — (8)Total operating expenses 6,881 6,136 13,017 5,010 5,697 10,707 4,283 5,365 9,648Operating (loss) income (321) (85) (406) 1,601 (54) 1,547 2,221 (39) 2,182Interest expense (671) (2) (673) (588) (1) (589) (540) (1) (541)Other income and expenses 107 87 194 93 55 148 74 40 114(Loss) income beforeincome taxes (885) — (885) 1,106 — 1,106 1,755 — 1,755Income tax (benefit)expense (696) — (696) (30) — (30) 256 — 256Net (Loss) income (189) — (189) 1,136 — 1,136 1,499 — 1,499Preferred and preferencestock dividend v requirements 121 — 121 124 — 124 123 — 123Net (Loss) income availablefor common stock $ (310) $ — $ (310) $ 1,012 $ — $ 1,012 $ 1,376 $ — $ 1,376
Net (Loss) income availablefor common stock $ 310 $ 1,012 $ 1,376Less: Non-core earningsWildfire-related claims, net ofrecoveries (1,825) — —Impairment and other 9 (448) —Re-measurement of deferredtaxes — (33) —Settlement of California taxaudits 66 — —Core earnings1 $ 1,440 $ 1,493 $ 1,376
1See disclaimer on page 1 on use of non-GAAP earnings.
2018 FINANCIAL AND STATISTICAL REPORT 11
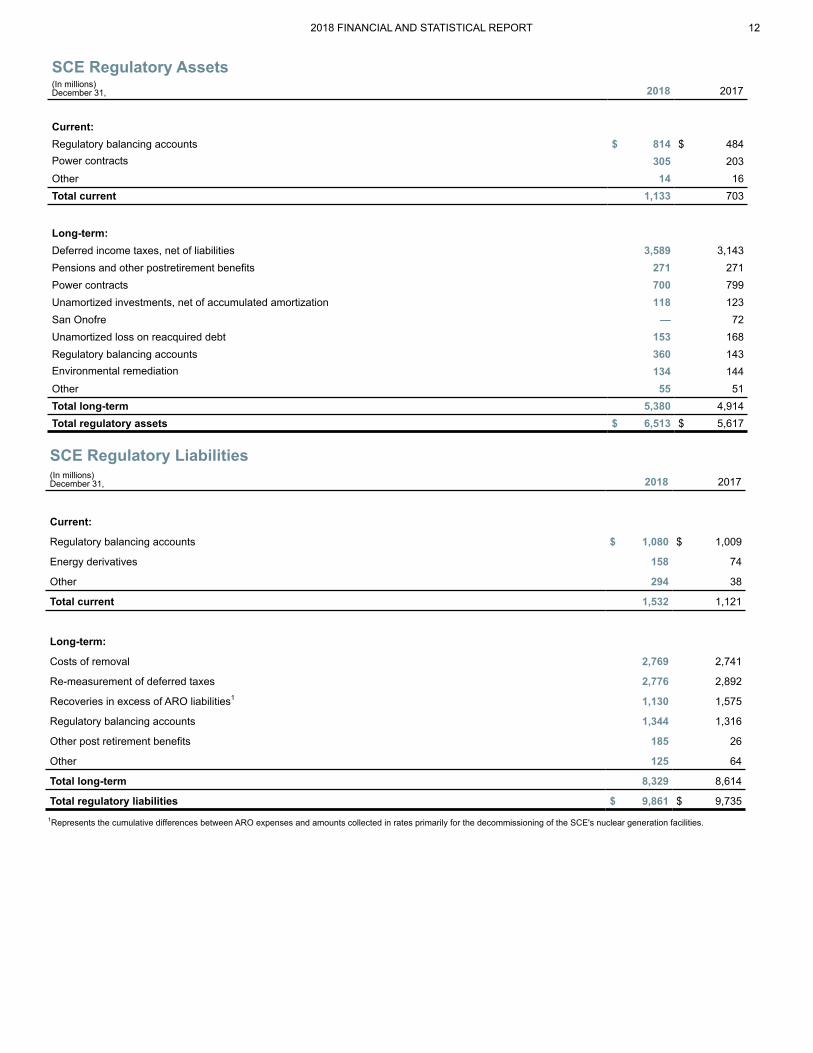
SCE Regulatory Assets(In millions)December 31, 2018 2017
Current:Regulatory balancing accounts $ 814 $ 484Power contracts 305 203Other 14 16Total current 1,133 703
Long-term:Deferred income taxes, net of liabilities 3,589 3,143Pensions and other postretirement benefits 271 271Power contracts 700 799Unamortized investments, net of accumulated amortization 118 123San Onofre — 72Unamortized loss on reacquired debt 153 168Regulatory balancing accounts 360 143Environmental remediation 134 144Other 55 51Total long-term 5,380 4,914Total regulatory assets $ 6,513 $ 5,617
2018 FINANCIAL AND STATISTICAL REPORT 12
SCE Regulatory Liabilities(In millions)December 31, 2018 2017
Current:
Regulatory balancing accounts $ 1,080 $ 1,009
Energy derivatives 158 74
Other 294 38
Total current 1,532 1,121
Long-term:
Costs of removal 2,769 2,741
Re-measurement of deferred taxes 2,776 2,892
Recoveries in excess of ARO liabilities1 1,130 1,575
Regulatory balancing accounts 1,344 1,316
Other post retirement benefits 185 26
Other 125 64
Total long-term 8,329 8,614
Total regulatory liabilities $ 9,861 $ 9,7351Represents the cumulative differences between ARO expenses and amounts collected in rates primarily for the decommissioning of the SCE's nuclear generation facilities.
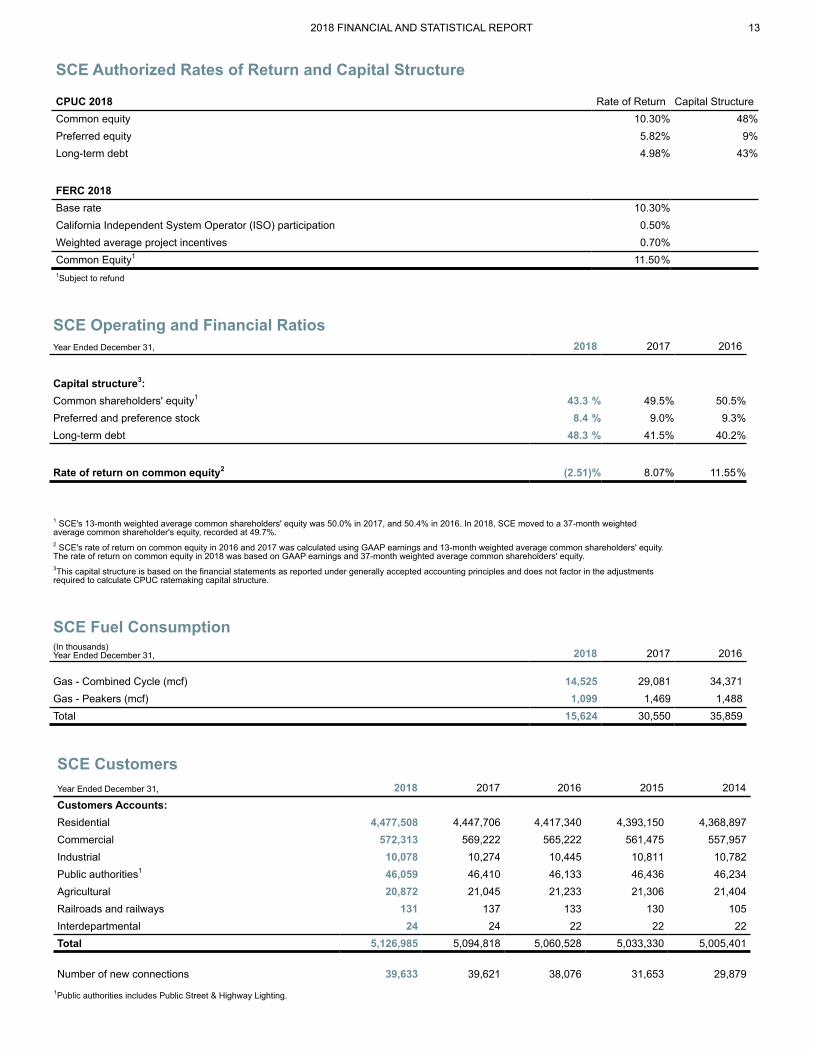
SCE Authorized Rates of Return and Capital Structure
CPUC 2018 Rate of Return Capital StructureCommon equity 10.30% 48%Preferred equity 5.82% 9%Long-term debt 4.98% 43%
FERC 2018Base rate 10.30%California Independent System Operator (ISO) participation 0.50%Weighted average project incentives 0.70%Common Equity1 11.50%1Subject to refund
2018 FINANCIAL AND STATISTICAL REPORT 13
SCE Operating and Financial RatiosYear Ended December 31, 2018 2017 2016
Capital structure3:Common shareholders' equity1 43.3 % 49.5% 50.5%Preferred and preference stock 8.4 % 9.0% 9.3%Long-term debt 48.3 % 41.5% 40.2%
Rate of return on common equity2 (2.51)% 8.07% 11.55%
1 SCE's 13-month weighted average common shareholders' equity was 50.0% in 2017, and 50.4% in 2016. In 2018, SCE moved to a 37-month weightedaverage common shareholder's equity, recorded at 49.7%.2 SCE's rate of return on common equity in 2016 and 2017 was calculated using GAAP earnings and 13-month weighted average common shareholders' equity.The rate of return on common equity in 2018 was based on GAAP earnings and 37-month weighted average common shareholders' equity.3This capital structure is based on the financial statements as reported under generally accepted accounting principles and does not factor in the adjustmentsrequired to calculate CPUC ratemaking capital structure.
SCE Fuel Consumption(In thousands)Year Ended December 31, 2018 2017 2016
Gas - Combined Cycle (mcf) 14,525 29,081 34,371Gas - Peakers (mcf) 1,099 1,469 1,488Total 15,624 30,550 35,859
SCE CustomersYear Ended December 31, 2018 2017 2016 2015 2014Customers Accounts:Residential 4,477,508 4,447,706 4,417,340 4,393,150 4,368,897Commercial 572,313 569,222 565,222 561,475 557,957Industrial 10,078 10,274 10,445 10,811 10,782Public authorities1 46,059 46,410 46,133 46,436 46,234Agricultural 20,872 21,045 21,233 21,306 21,404Railroads and railways 131 137 133 130 105Interdepartmental 24 24 22 22 22Total 5,126,985 5,094,818 5,060,528 5,033,330 5,005,401
Number of new connections 39,633 39,621 38,076 31,653 29,8791Public authorities includes Public Street & Highway Lighting.
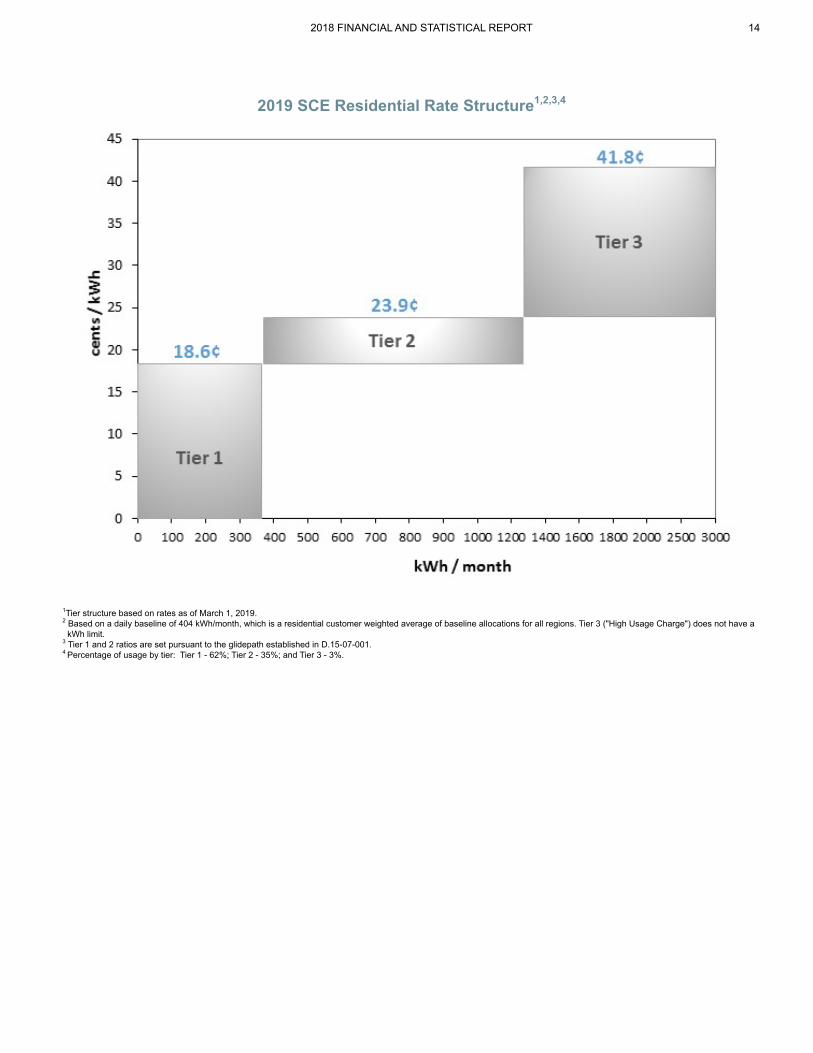
2019 SCE Residential Rate Structure1,2,3,4
1Tier structure based on rates as of March 1, 2019.2 Based on a daily baseline of 404 kWh/month, which is a residential customer weighted average of baseline allocations for all regions. Tier 3 ("High Usage Charge") does not have a kWh limit.3 Tier 1 and 2 ratios are set pursuant to the glidepath established in D.15-07-001.4 Percentage of usage by tier: Tier 1 - 62%; Tier 2 - 35%; and Tier 3 - 3%.
2018 FINANCIAL AND STATISTICAL REPORT 14
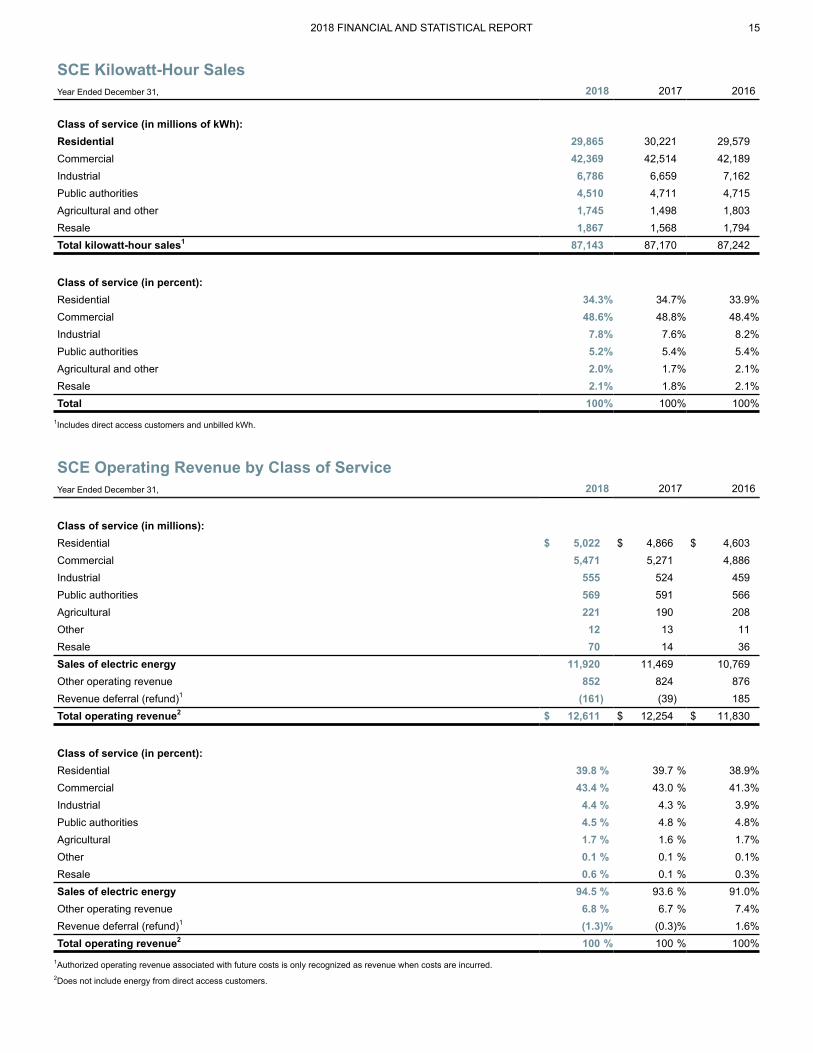
SCE Kilowatt-Hour SalesYear Ended December 31, 2018 2017 2016
Class of service (in millions of kWh):Residential 29,865 30,221 29,579Commercial 42,369 42,514 42,189Industrial 6,786 6,659 7,162Public authorities 4,510 4,711 4,715Agricultural and other 1,745 1,498 1,803Resale 1,867 1,568 1,794Total kilowatt-hour sales1 87,143 87,170 87,242
Class of service (in percent):Residential 34.3% 34.7% 33.9%Commercial 48.6% 48.8% 48.4%Industrial 7.8% 7.6% 8.2%Public authorities 5.2% 5.4% 5.4%Agricultural and other 2.0% 1.7% 2.1%Resale 2.1% 1.8% 2.1%Total 100% 100% 100%
1Includes direct access customers and unbilled kWh.
2018 FINANCIAL AND STATISTICAL REPORT 15
SCE Operating Revenue by Class of ServiceYear Ended December 31, 2018 2017 2016
Class of service (in millions):Residential $ 5,022 $ 4,866 $ 4,603Commercial 5,471 5,271 4,886Industrial 555 524 459Public authorities 569 591 566Agricultural 221 190 208Other 12 13 11Resale 70 14 36Sales of electric energy 11,920 11,469 10,769Other operating revenue 852 824 876Revenue deferral (refund)1 (161) (39) 185Total operating revenue2 $ 12,611 $ 12,254 $ 11,830
Class of service (in percent):Residential 39.8 % 39.7 % 38.9%Commercial 43.4 % 43.0 % 41.3%Industrial 4.4 % 4.3 % 3.9%Public authorities 4.5 % 4.8 % 4.8%Agricultural 1.7 % 1.6 % 1.7%Other 0.1 % 0.1 % 0.1%Resale 0.6 % 0.1 % 0.3%Sales of electric energy 94.5 % 93.6 % 91.0%Other operating revenue 6.8 % 6.7 % 7.4%Revenue deferral (refund)1 (1.3)% (0.3)% 1.6%Total operating revenue2 100 % 100 % 100%
1Authorized operating revenue associated with future costs is only recognized as revenue when costs are incurred. 2Does not include energy from direct access customers.
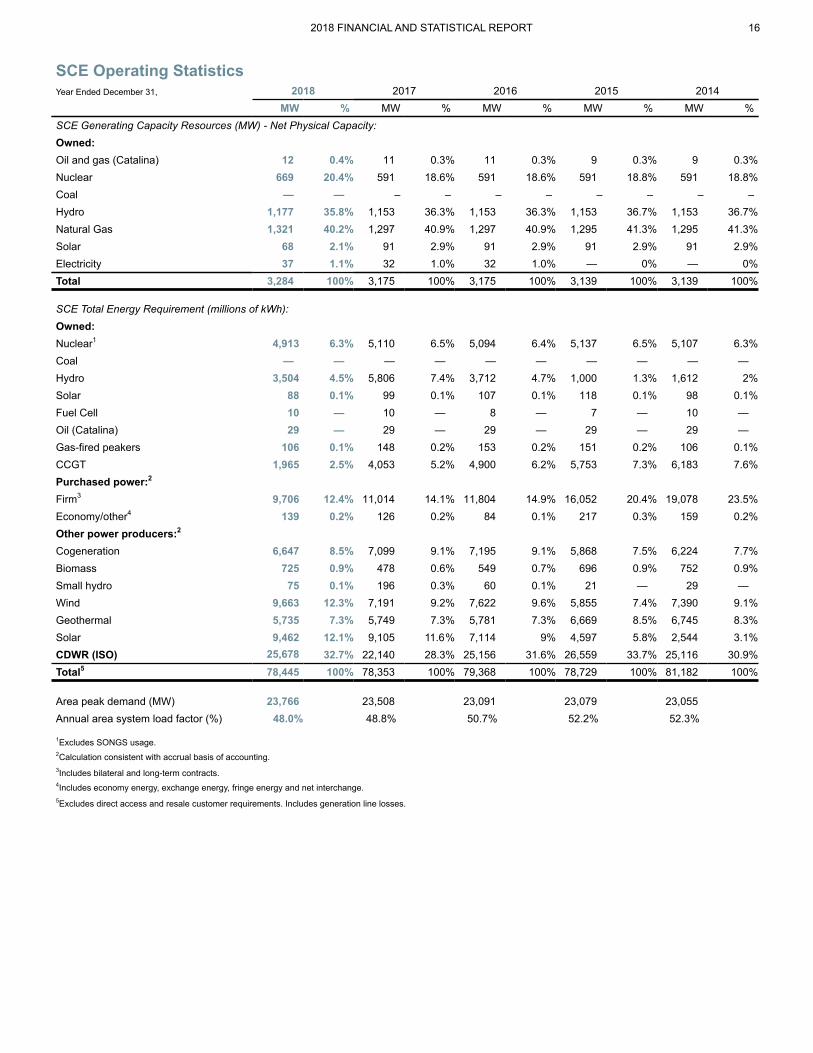
SCE Operating StatisticsYear Ended December 31, 2018 2017 2016 2015 2014
MW % MW % MW % MW % MW %SCE Generating Capacity Resources (MW) - Net Physical Capacity:Owned:Oil and gas (Catalina) 12 0.4% 11 0.3% 11 0.3% 9 0.3% 9 0.3%Nuclear 669 20.4% 591 18.6% 591 18.6% 591 18.8% 591 18.8%Coal — — – – – – – – – –Hydro 1,177 35.8% 1,153 36.3% 1,153 36.3% 1,153 36.7% 1,153 36.7%Natural Gas 1,321 40.2% 1,297 40.9% 1,297 40.9% 1,295 41.3% 1,295 41.3%Solar 68 2.1% 91 2.9% 91 2.9% 91 2.9% 91 2.9%Electricity 37 1.1% 32 1.0% 32 1.0% — 0% — 0%Total 3,284 100% 3,175 100% 3,175 100% 3,139 100% 3,139 100%
SCE Total Energy Requirement (millions of kWh):Owned:Nuclear1 4,913 6.3% 5,110 6.5% 5,094 6.4% 5,137 6.5% 5,107 6.3%Coal — — — — — — — — — —Hydro 3,504 4.5% 5,806 7.4% 3,712 4.7% 1,000 1.3% 1,612 2%Solar 88 0.1% 99 0.1% 107 0.1% 118 0.1% 98 0.1%Fuel Cell 10 — 10 — 8 — 7 — 10 —Oil (Catalina) 29 — 29 — 29 — 29 — 29 —Gas-fired peakers 106 0.1% 148 0.2% 153 0.2% 151 0.2% 106 0.1%CCGT 1,965 2.5% 4,053 5.2% 4,900 6.2% 5,753 7.3% 6,183 7.6%Purchased power:2
Firm3 9,706 12.4% 11,014 14.1% 11,804 14.9% 16,052 20.4% 19,078 23.5%Economy/other4 139 0.2% 126 0.2% 84 0.1% 217 0.3% 159 0.2%Other power producers:2
Cogeneration 6,647 8.5% 7,099 9.1% 7,195 9.1% 5,868 7.5% 6,224 7.7%Biomass 725 0.9% 478 0.6% 549 0.7% 696 0.9% 752 0.9%Small hydro 75 0.1% 196 0.3% 60 0.1% 21 — 29 —Wind 9,663 12.3% 7,191 9.2% 7,622 9.6% 5,855 7.4% 7,390 9.1%Geothermal 5,735 7.3% 5,749 7.3% 5,781 7.3% 6,669 8.5% 6,745 8.3%Solar 9,462 12.1% 9,105 11.6% 7,114 9% 4,597 5.8% 2,544 3.1%CDWR (ISO) 25,678 32.7% 22,140 28.3% 25,156 31.6% 26,559 33.7% 25,116 30.9%Total5 78,445 100% 78,353 100% 79,368 100% 78,729 100% 81,182 100%
Area peak demand (MW) 23,766 23,508 23,091 23,079 23,055Annual area system load factor (%) 48.0% 48.8% 50.7% 52.2% 52.3%
1Excludes SONGS usage.2Calculation consistent with accrual basis of accounting.3Includes bilateral and long-term contracts.4Includes economy energy, exchange energy, fringe energy and net interchange.5Excludes direct access and resale customer requirements. Includes generation line losses.
2018 FINANCIAL AND STATISTICAL REPORT 16
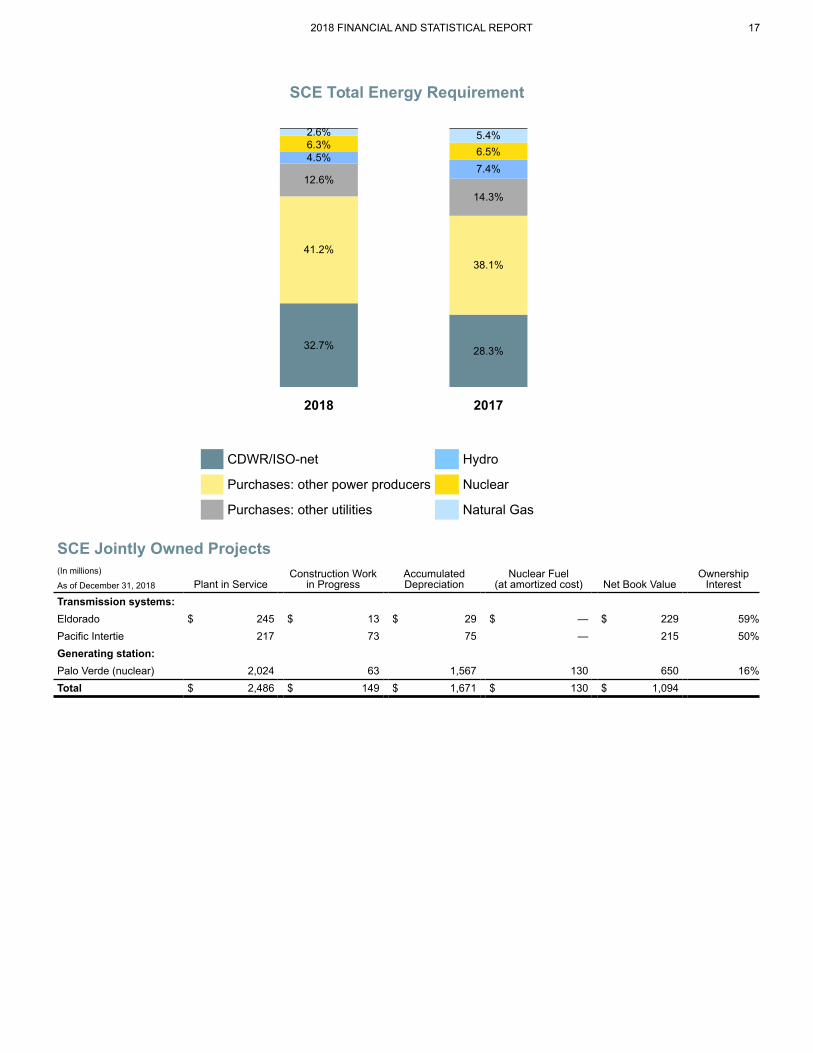
SCE Total Energy Requirement
2018 2017
32.7% 28.3%
41.2%38.1%
12.6%14.3%
4.5%7.4%
6.3% 6.5%
2.6% 5.4%
CDWR/ISO-net Hydro
Purchases: other power producers Nuclear
Purchases: other utilities Natural Gas
2018 FINANCIAL AND STATISTICAL REPORT 17
SCE Jointly Owned Projects(In millions)
Plant in ServiceConstruction Work
in ProgressAccumulatedDepreciation
Nuclear Fuel(at amortized cost) Net Book Value
OwnershipInterestAs of December 31, 2018
Transmission systems:Eldorado $ 245 $ 13 $ 29 $ — $ 229 59%Pacific Intertie 217 73 75 — 215 50%Generating station:Palo Verde (nuclear) 2,024 63 1,567 130 650 16%Total $ 2,486 $ 149 $ 1,671 $ 130 $ 1,094
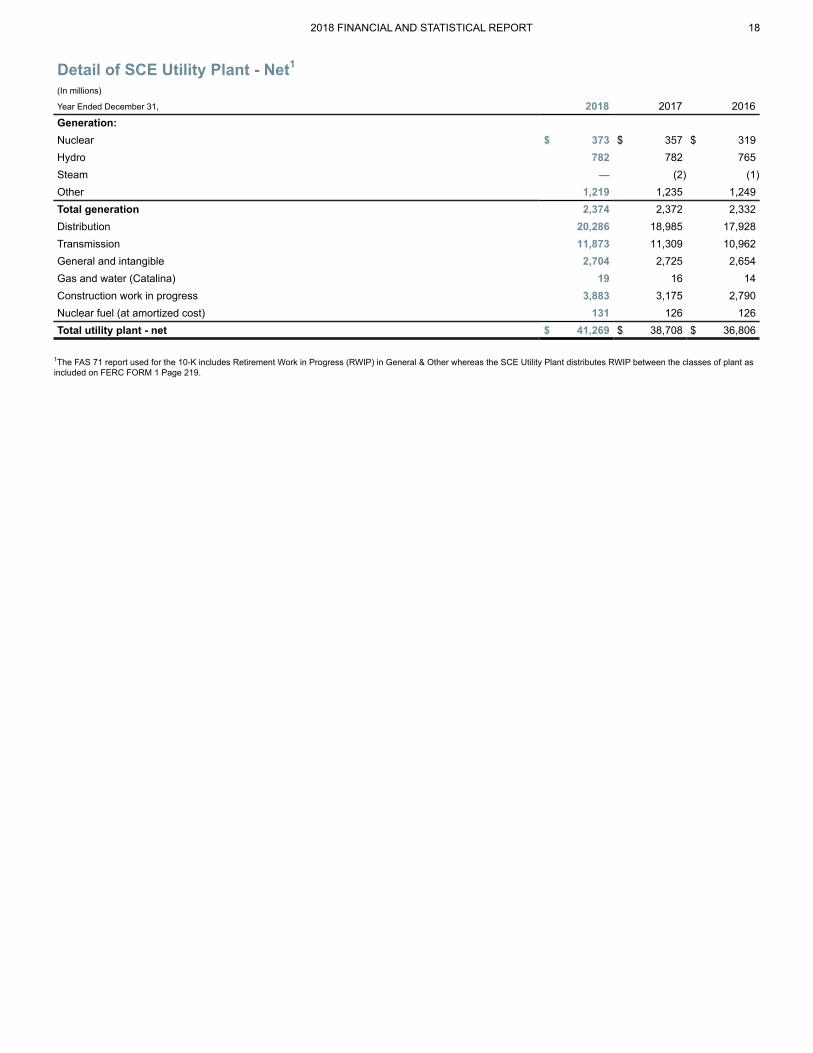
Detail of SCE Utility Plant - Net1
(In millions)
Year Ended December 31, 2018 2017 2016Generation:Nuclear $ 373 $ 357 $ 319Hydro 782 782 765Steam — (2) (1)Other 1,219 1,235 1,249Total generation 2,374 2,372 2,332Distribution 20,286 18,985 17,928Transmission 11,873 11,309 10,962General and intangible 2,704 2,725 2,654Gas and water (Catalina) 19 16 14Construction work in progress 3,883 3,175 2,790Nuclear fuel (at amortized cost) 131 126 126Total utility plant - net $ 41,269 $ 38,708 $ 36,806
1The FAS 71 report used for the 10-K includes Retirement Work in Progress (RWIP) in General & Other whereas the SCE Utility Plant distributes RWIP between the classes of plant asincluded on FERC FORM 1 Page 219.
2018 FINANCIAL AND STATISTICAL REPORT 18

2018 FINANCIAL AND STATISTICAL REPORT 19
California Public Utilities Commission (CPUC)1
The California Public Utilities Commission (CPUC) regulates privately owned electric, natural gas, telecommunications, water, railroad, rail transit, andpassenger transportation companies, in addition to authorizing video franchises. The Governor appoints five commissioners for six year terms.The CPUC plays a key role in making California a national and international leader on a number of clean energy related initiatives and policies designed tobenefit consumers, the environment, and the economy. For additional information, please refer to their website www.cpuc.ca.gov.
Commissioner Service Began Term Ends Prior Professional ExperienceMichael Picker (President) 1/14 1/21 Prior to appointment as commissioner in January 2014, was Senior Advisor for
Renewable Energy in the Office of the Governor from 2009 to 2014. He was also amember of the Sacramento Municipal Utility District Board of Directors from2012-2014.
Martha Guzman Aceves 12/16 12/22 Formerly served as Deputy Legislative Affairs Secretary in the Office of theGovernor since 2011, focusing on natural resources, environmental protection,energy and food and agriculture.
Clifford Rechtschaffen 12/16 12/22 Prior to appointment as commissioner in December 2016, served as a SeniorAdvisor for Governor Jerry Brown from 2011-2017, where he worked on climate,energy, and environmental issues.
Genevieve Shiroma 1/19 1/25 Prior to appointment as commissioner in January 2019, served as a member of theAgricultural Labor Relations Board since 1999, serving as chair since 2017 and from2011 to 2014 and 1999 to 2006.
Liane M. Randolph 1/15 1/21 Formerly served as Deputy Secretary and General Counsel at the California NaturalResources Agency prior to appointment in to the commission in December 2014
Federal Energy Regulatory Commission (FERC)1
The Federal Energy Regulatory Commission is composed of up to five commissioners who are appointed by the President of the United States with the adviceand consent of the Senate. Commissioners serve five-year terms, and have an equal vote on regulatory matters. For additional information, please refer to theirwebsite www.ferc.gov.
Commissioner Service Began Term Ends Prior Professional ExperienceNeil Chatterjee (Chairman) 5/17 6/21 Prior to joining the Commission, he was energy policy advisor to U.S. Senate
Majority Leader Mitch McConnell.Cheryl LaFleur 7/10 6/19 Prior to joining the Commission, Commissioner LaFleur was a former executive vice
president and acting CEO of National Grid USA; member of NARUC Committees onElectricity and Critical infrastructure.
Richard Glick 11/17 6/22 Prior to joining the Commission, Commissioner Glick was general counsel for theDemocrats on the Senate Energy and Natural Resources Committee, serving as asenior policy advisor on numerous issues including electricity and renewableenergy.
Bernard McNamee 12/18 6/20 Prior to joining the Commission, Commissioner McNamee served in a number oflegal and policy positions at the state and federal level throughout his career. Healso served at the U.S. Department of Energy (DOE) in multiple positions, includingExecutive Director of the Office of Policy and Deputy General Counsel for EnergyPolicy.
1As of March 31, 2019
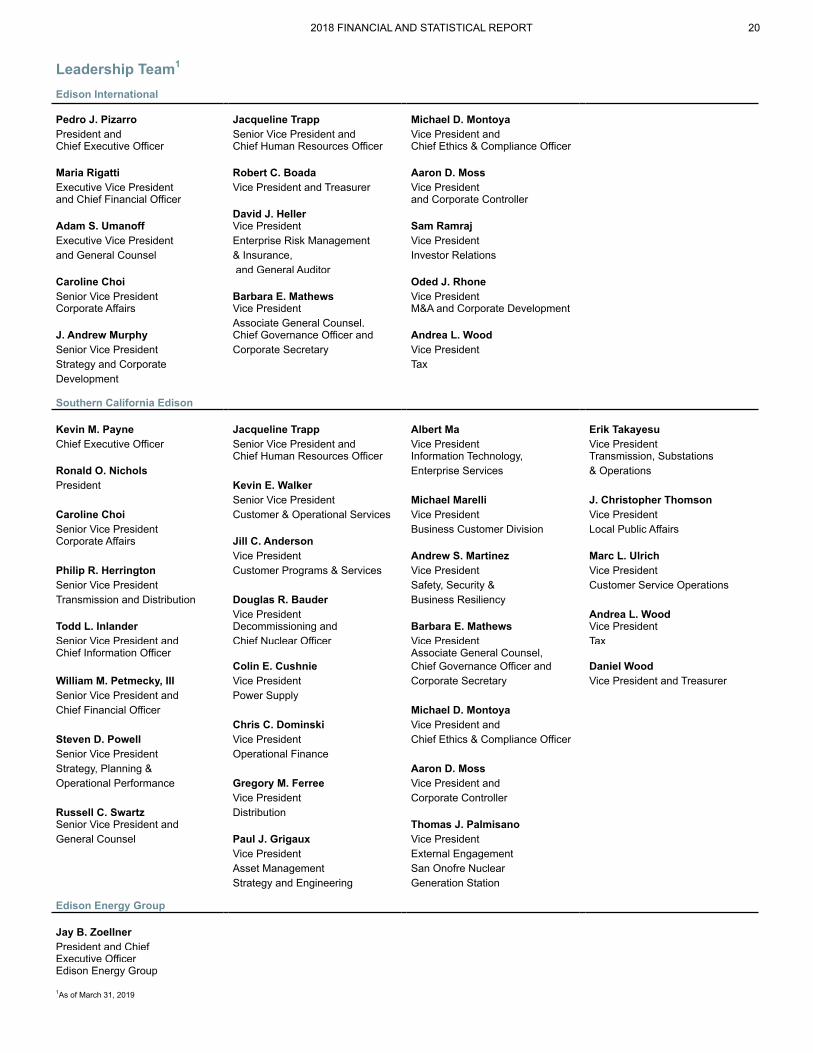
Leadership Team1
Edison International
Pedro J. Pizarro Jacqueline Trapp Michael D. MontoyaPresident and Senior Vice President and Vice President andChief Executive Officer Chief Human Resources Officer Chief Ethics & Compliance Officer
Maria Rigatti Robert C. Boada Aaron D. MossExecutive Vice President Vice President and Treasurer Vice Presidentand Chief Financial Officer and Corporate Controller
David J. HellerAdam S. Umanoff Vice President Sam RamrajExecutive Vice President Enterprise Risk Management Vice Presidentand General Counsel & Insurance, Investor Relations
and General AuditorCaroline Choi Oded J. RhoneSenior Vice President Barbara E. Mathews Vice PresidentCorporate Affairs Vice President M&A and Corporate Development
Associate General Counsel,J. Andrew Murphy Chief Governance Officer and Andrea L. WoodSenior Vice President Corporate Secretary Vice PresidentStrategy and Corporate TaxDevelopment
Southern California Edison
Kevin M. Payne Jacqueline Trapp Albert Ma Erik TakayesuChief Executive Officer Senior Vice President and Vice President Vice President
Chief Human Resources Officer Information Technology, Transmission, SubstationsRonald O. Nichols Enterprise Services & OperationsPresident Kevin E. Walker
Senior Vice President Michael Marelli J. Christopher ThomsonCaroline Choi Customer & Operational Services Vice President Vice PresidentSenior Vice President Business Customer Division Local Public AffairsCorporate Affairs Jill C. Anderson
Vice President Andrew S. Martinez Marc L. UlrichPhilip R. Herrington Customer Programs & Services Vice President Vice PresidentSenior Vice President Safety, Security & Customer Service OperationsTransmission and Distribution Douglas R. Bauder Business Resiliency
Vice President Andrea L. WoodTodd L. Inlander Decommissioning and Barbara E. Mathews Vice PresidentSenior Vice President and Chief Nuclear Officer Vice President TaxChief Information Officer Associate General Counsel,
Colin E. Cushnie Chief Governance Officer and Daniel WoodWilliam M. Petmecky, III Vice President Corporate Secretary Vice President and TreasurerSenior Vice President and Power SupplyChief Financial Officer Michael D. Montoya
Chris C. Dominski Vice President andSteven D. Powell Vice President Chief Ethics & Compliance OfficerSenior Vice President Operational FinanceStrategy, Planning & Aaron D. MossOperational Performance Gregory M. Ferree Vice President and
Vice President Corporate ControllerRussell C. Swartz DistributionSenior Vice President and Thomas J. PalmisanoGeneral Counsel Paul J. Grigaux Vice President
Vice President External EngagementAsset Management San Onofre NuclearStrategy and Engineering Generation Station
Edison Energy Group
Jay B. ZoellnerPresident and Chief Executive OfficerEdison Energy Group
1As of March 31, 2019
2018 FINANCIAL AND STATISTICAL REPORT 20
For Additional Information, Contact:
Sam RamrajVice President,Investor [email protected](626) 302-2540
Allison G. BahenSenior Manager,Investor [email protected](626) 302-5493
Edison International2244 Walnut Grove AvenueRosemead, California 91770
Investor Relations(877) [email protected]
Stock Transfer Agent, Registrar of Stock, andAdministrator of Dividend Reinvestment PlanEQ Bank, N.A.1110 Centre Point Curve, Suite 101Mendota Heights, MN 55120-4100Telephone (800) 347-8625Fax (651) 450-4033www.shareowneronline.com
Ticker SymbolEIX (Common Stock)
Internet Addresshttp://www.edisoninvestor.com
Listed Securities
Media ListingEdisonInt or EIX (Common Stock)SoCalEd (Preferred Stock)
Stock Exchange ListingNew YorkNew York Alt
2018 FINANCIAL AND STATISTICAL REPORT 21


