Chartered Fortrend Securities - Wealth ManagementJoel Hewish is an Investment/Financial Adviser at Fortrend Securities and manages the Wealth Management division. The opinions expressed are his own and do not represent those of Joe Forster orthe International Advisory division. Edition No. 16 29th September 2010 Bottom Line: Financial markets appear to be in the later stages of their corrective patterns which have persisted for the past 3 months. Major equity markets have either completed a topping formation, are completing a topping formation or are already well entrenched in the next phase of their downtrend. Globalequity markets are now showing similar extreme technical and bullish sentiment readings to those displayed just prior to market tops registered in April 2010, January 2010, May 2008 and October 2007. The technical and investor sentiment evidence now overwhelmingly supports the resumption of the next leg down in the not too distant future. This next leg down should produce swift and broad declines. Limitedtime remains to protect yourself and profit from this opportuni ty!!Chart 1 – US S&P 500 •The S&P 500 continued its climb higher over the past fortnight and according to a report from Bloomberg 27 September 2010, the S&P 500 is now on track to register its best September performance since the 1930s. •While this may be a bullish sign to some in the market, perversely it may have actually produced quite the opposite. •The rally from the lows in July now appear to have set the market up nicely for another leg lower and potentially a very significant decline in the not too distant future.
Transcript
8/8/2019 Edition 16 - Chartered 29th September 2010
Joel Hewish is an Investment/Financial Adviser at Fortrend Securities and manages the Wealth
Management division. The opinions expressed are his own and do not represent those of Joe Forster or
the International Advisory division.
Edition No. 16
29th September 2010
Bottom Line: Financial markets appear to be in the later stages of their corrective patterns which have
persisted for the past 3 months. Major equity markets have either completed a topping formation, are
completing a topping formation or are already well entrenched in the next phase of their downtrend. Global equity markets are now showing similar extreme technical and bullish sentiment readings to those
displayed just prior to market tops registered in April 2010, January 2010, May 2008 and October 2007. The
technical and investor sentiment evidence now overwhelmingly supports the resumption of the next leg
down in the not too distant future. This next leg down should produce swift and broad declines. Limited
time remains to protect yourself and profit from this opportunity!!
Chart 1 – US S&P 500
• The S&P 500 continued its climb higher over the past fortnight and according to a report from
Bloomberg 27 September 2010, the S&P 500 is now on track to register its best September
performance since the 1930s.
• While this may be a bullish sign to some in the market, perversely it may have actually produced
quite the opposite.
• The rally from the lows in July now appear to have set the market up nicely for another leg lower
and potentially a very significant decline in the not too distant future.
8/8/2019 Edition 16 - Chartered 29th September 2010
• Although the market has rallied quite significantly over the past 3 months, it still remains
approximately 6.5% away from its recovery high registered 26 April 2010.
• Of concern now, however, is that the rally has now pushed numerous technical and sentiment
indicators into high alert territory, irrespective of the fact that the market still remains a good
margin below the April 2010 recovery high.
• While the market can still move higher from here, these same indicators have only ever lined up
together with such unitedness in periods just prior to recent years tops and the subsequent
declines.
Chart 2 – US S&P 500 – A closer look
• The S&P 500 is hovering just above the 61.8% Fibonacci retracement level at 1,140.
• The next level of resistance above 1,140 is at the 78.6% Fibonacci retracement level at 1,175,which also lines up with the previous resistance level that arose 5 trading days after the 6 May
2010 flash crash.
• Can the S&P 500 get to 1,175? Yes it’s possible. Can it get to the highs of 26 April 2010 and
beyond? It can’t be ruled out but it is highly unlikely.
• When assessing the probabilities of which direction the next major move is likely to occur, the
overwhelming evidence lines up towards the downward direction.
• Once again, perverse as it may seem, with every new move higher, it brings with it new evidence
that the next significant move will be towards the downside and it could be quite some move.
• So what is the evidence I talk about? Well I’ll discuss that in just a moment.
8/8/2019 Edition 16 - Chartered 29th September 2010
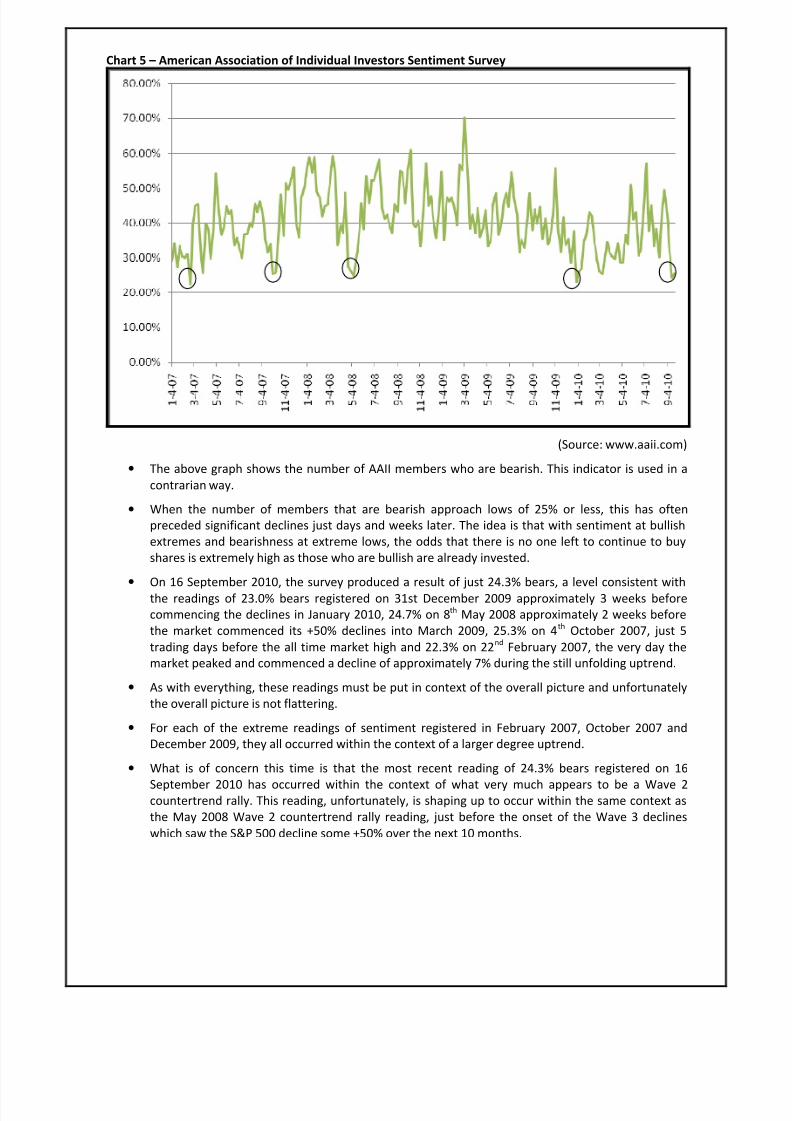
Chart 5 – American Association of Individual Investors Sentiment Survey
(Source: www.aaii.com)
• The above graph shows the number of AAII members who are bearish. This indicator is used in a
contrarian way.
• When the number of members that are bearish approach lows of 25% or less, this has often
preceded significant declines just days and weeks later. The idea is that with sentiment at bullish
extremes and bearishness at extreme lows, the odds that there is no one left to continue to buy
shares is extremely high as those who are bullish are already invested.
• On 16 September 2010, the survey produced a result of just 24.3% bears, a level consistent with
the readings of 23.0% bears registered on 31st December 2009 approximately 3 weeks before
commencing the declines in January 2010, 24.7% on 8th
May 2008 approximately 2 weeks before
the market commenced its +50% declines into March 2009, 25.3% on 4th
October 2007, just 5
trading days before the all time market high and 22.3% on 22nd
February 2007, the very day the
market peaked and commenced a decline of approximately 7% during the still unfolding uptrend.
• As with everything, these readings must be put in context of the overall picture and unfortunately
the overall picture is not flattering.
• For each of the extreme readings of sentiment registered in February 2007, October 2007 and
December 2009, they all occurred within the context of a larger degree uptrend.
• What is of concern this time is that the most recent reading of 24.3% bears registered on 16
September 2010 has occurred within the context of what very much appears to be a Wave 2countertrend rally. This reading, unfortunately, is shaping up to occur within the same context as
the May 2008 Wave 2 countertrend rally reading, just before the onset of the Wave 3 declines
which saw the S&P 500 decline some +50% over the next 10 months.
8/8/2019 Edition 16 - Chartered 29th September 2010
Chartered is a fortnightly publication from Fortrend Securities – Wealth Management and is provided for the purpose of general information only. The views and opinions expressed in the publication are those of Joel
Hewish and do not necessarily match those views of Joe Forster and Fortrend Securities – International Advisory. This publication is provided as general information only and does not take into account your
personal circumstances, aims and objectives and should not be considered personal advice. You should first consult a licensed Investment or Financial Adviser before acting on any of the information provided in this