The Journal of the Internaonal Federaon of Clinical Chemistry and Laboratory Medicine Communicaons and Publicaons Division (CPD) of the IFCC Editor-in-chief : Prof. Gábor L. Kovács, MD, PhD, DSc Department of Laboratory Medicine, Faculty of Medicine, University of Pecs, Hungary e-mail: [email protected]ISSN 1650-3414 Volume 28 Number 2 May 2017
Transcript
The Journal of the International Federation of Clinical Chemistry and Laboratory Medicine
Communications and Publications Division (CPD) of the IFCCEditor-in-chief : Prof. Gábor L. Kovács, MD, PhD, DScDepartment of Laboratory Medicine, Faculty of Medicine, University of Pecs, Hungarye-mail: [email protected]
Advances and pitfalls in using laboratory biomarkers for the diagnosis and management of sepsisDunja Rogić, Gordana Fressl Juroš, Jόzsef Petrik, Ana Lončar Vrančić 114
Nonconventional markers of sepsisPéter Kustán, Zoltán Horváth-Szalai, Diána Mühl 122
Advances in the diagnosis of sepsis: hydrogen sulfide as a prognostic marker of septic shock severityMiha Košir, Matej Podbregar 134
A validation study of after reconstitution stability of diabetesShyamali Pal 142
A toddler with anasarca caused by congenital nephrotic syndromeTumelo M. Satekge, Olivia Kiabilua, Gertruida van Biljon, Komala Pillay, Tahir S. Pillay 156
eJIFCC2017Vol28No2pp098-098Page 98
In this issue: Advances in the diagnosis of sepsis
Foreword of the editorEditor in Chief: Gábor L. Kovács, M.D., Ph.D., DSc
Dr. Tamás Kőszegi presently is a full profes-sor of laboratory medicine at the Department of Laboratory Medicine, University of Pécs, Hungary. He graduated as an MD from the University of Pécs (1979) and obtained his spe-cialty degree in Medical Laboratory Diagnostics (1984). He wrote his PhD thesis on the release kinetics of intracellular ATP using different cel-lular models (1996). His research interest is wide but in common, he uses mainly those methods that are related to luminescence. One of his pioneering work on procalcitonin (PCT) research began in 1999. He published several papers in collaboration with clinicians on the role of PCT in systemic inflammation (sepsis). He also proved that neutrophil granulocytes might be a potential source of PCT release in septic patients. He is devoted to proteomics and to find protein biomarkers in systemic dis-eases with a special emphasis on inflamma-tion. He worked out a method to characterize perchloric acid soluble serum proteins in sys-temic diseases related to inflammation (sepsis,
malignancies, autoimmune diseases, Crohn’s syndrome, etc.). Recently, his interest has been focusing on serum actin, actin binding proteins (gelsolin and Gc-globulin) and also on urinary orosomucoid, cystatin C and actin detection in systemic inflammatory conditions. His group adapted gelsolin, Gc-globulin, urinary oroso-mucoid and urinary cystatin C to automated routine laboratory instruments. These bio-markers may give substantial additional help for the clinicians at the intensive care unit to make a quick decision in the treatment of se-verely ill patients. He also published several papers on the mode of action, molecular and cellular interactions of mycotoxins with a major focus on ochratoxin A. His most recent interest is to capture and characterize circulating tumor cells and cell-free nucleic acids in breast cancer patients. Dr. Kőszegi has published more than 300 papers including abstracts, has a cumula-tive IF 140, and obtained independent citations close to 500.
eJIFCC2017Vol28No2pp099-103Page 99
In this issue: Advances in the diagnosis of sepsis
Advances in the diagnosis of sepsisGuest editor: Tamás Kőszegi1,2
1 Department of Laboratory Medicine, University of Pécs Medical School, Pécs, Hungary2 János Szentágothai Research Center, Pécs, Hungary
A R T I C L E I N F O E D I T O R I A L
Inevitably, sepsis has still remained one of the ma-jor challenges at the Intensive Care Units (ICUs) (1). About 30 million cases per year are estimated worldwide and this tendency is continuously in-creasing (2). Although sepsis is known for a long time, its pathomechanism is not completely under-stood due to the various triggering factors and also to the altered response of the individuals with dif-ferent underlying diseases.
In sepsis with bacteremia, endotoxins (LPS) of Gram negative microbes and exotoxins from Gram posi-tive microbes play a major role in the development of the symptoms. Currently, it is thought that patho-genesis of sepsis includes microbial interaction with the host defense system before bacteria can enter the bloodstream (3-5). Defense mechanisms in tis-sues differ from those of the intravascular ones. In the tissues (e.g. first in localized infections) leuko-cytes are the main antimicrobial factors while in the bloodstream fight against bacteria is mediated by humoral factors on the surface of erythrocytes. Bacteria that can invade the circulatory system possess
Corresponding author:Dr. Tamás KőszegiDepartment of Laboratory MedicineUniversity of Pécs7624 Pécs, Ifjúság u. 13HungaryPhone: +36 30 491 7719Fax: +36 72 536 121E-mail: [email protected]
Key words:sepsis, procalcitonin, novel biomarkers, laboratory management of sepsis
AcknowledgementThe present scientific contribution is dedicated to the 650th anniversary of the foundation of the University of Pécs, Hungary.
Conflict of interestThe author declares that there is no conflict of interest regarding the publication of this article..
antioxidant enzymes (SOD, catalase, etc.) pro-tecting them from oxidative injury exerted by the host. In the bloodstream invading bacte-ria are attached to the surface of erythrocytes stimulating oxygen release (from oxyhemoglo-bin) that might kill bacteria by oxidation. If bac-teria escape oxidation they enter erythrocytes by permeabilizing the membrane. Once inside the erythrocytes bacteria are most probably to be killed due to the high concentration of oxy-gen. On the other hand, bacteria might survive inside the RBCs at poor oxygenation or when bacteria are resistant to oxidation. In this way, RBCs may form a bacterial reservoir where they can further proliferate (6,7). Inside the erythro-cytes bacteria are protected from most of the antibiotics and the antibacterial factors of the host. Bacterial proliferation damages eryth-rocytes with a subsequent release of the mi-crobes into the bloodstream (or to other eryth-rocytes). In case of bacteremia a premature release of oxygen from erythrocytes and an oxidation resistant infection might occur. As a consequence, sepsis and in severe cases, septic shock will develop. Further oxidation of plasma proteins and lack of proper oxygen content in erythrocytes may cause injury of distant organs leading to multi-organ failure (MOF) (8,9).
These events are also strongly related to the development of a misbalance between the inflammatory and anti-inflammatory cascade especially when tissue injury (major surgery, trauma, burns, pancreatitis, etc.) is present. From the laboratory part, only a few param-eters are used routinely for early detection of sepsis from the more than 200 sepsis related biomarkers, namely pro-inflammatory and acute-phase proteins (CRP, procalcitonin, in-terleukines) (10-14), pentraxins (15,16), cyto-kine/chemokine biomarkers (IL-6, IL-8, IL-10, TNF- α, etc.) (17,18), macrophage migration in-hibitory factor (19,20), high-mobility-group box 1 (HMGB1) (21,22), coagulation biomarkers (23,24),
triggering receptor expressed on myeloid cells 1 (TREM-1) (25,26) and midregional pro-adre-nomedullin (27). Up to now, no single marker or a combination of the above markers proved to be specific and sensitive enough for timely diagnosis of sepsis. Furthermore, the ultimate need to predict the outcome of the disease or to monitor therapeutic efficiency by laboratory testing has not been fulfilled completely.
The uncertainty regarding both clinical and laboratory diagnostic criteria has led to the es-tablishment of new sepsis guidelines in 2016. Among the diverse findings and explanations in sepsis, the only true fact is, that diagnosis with proper decision making should be per-formed within the shortest possible time. The sooner the antibiotic therapy is begun the higher chance for the patient to survive. In or-der to fulfil this requirement both clinical and laboratory findings (including microbiological identification) are equally important.
In this issue of the eJIFCC, there are four man-uscripts which summarize the present knowl-edge on the major aspects of diagnosis and treatment of sepsis with the introduction of some unconventional new biomarkers. The first manuscript of Trásy and Molnár highlights sepsis management from the point of view of intensive therapy. The paper is focusing on the important aspects of the new sepsis guidelines and on the pathophysiology of the disease. The authors describe the body’s immune re-sponse to pathogen invasion (pathogen-asso-ciated molecular patterns: PAMP and damage-associated molecular patterns: DAMP). The role of procalcitonin (PCT) in the diagnosis and antibiotic treatment is discussed in details. Professor Molnár and his group have been in-volved in the research of diagnostic and prog-nostic markers of sepsis for more than 15 years with special emphasis on the clinical usage of PCT (28,29).
eJIFCC2017Vol28No2pp099-103Page 101
Tamás KőszegiAdvances in the diagnosis of sepsis
In the next paper Rogić and her co-authors, be-sides the classical CRP and PCT markers high-light the potential use of presepsin as a recent laboratory parameter for early detection of sep-sis. Presepsin is a 13 kDa soluble form of CD14 cluster surface glycoprotein derived mainly from membrane bound CD14 on the surface of monocytes (mCD14). Presepsin enables the binding of LPS and the LPS-binding protein (LBP) complex to toll-like receptors (TLRs), aug-menting the inflammatory response. Even if the clinical usefulness of presepsin has not been verified in every detail yet, the major advantage of this test lies in the very early rise of presepsin in sepsis (within 1 hour). Another advantage of the test is that measurement of presepsin can be done at the bedside with a POC method. Professor Rogić’s basic fields of research and professional activities are evidence-based labo-ratory medicine, organization and management of medical biochemistry laboratory, point-of-care testing, and organization and management of laboratory parameters of renal diseases. The next review of Kustán et al. deals with uncon-ventional biomarkers with potential clinical use-fulness at the ICU. A challenging observation in sepsis and septic shock is the release of large amounts of a physiological intracellular protein, actin into the circulation. Once freed from the cells, excess actin is toxic and enhances the risk for respiratory distress syndrome, forming of micro emboli and development of multiple organ dysfunction syndrome (MODS). Excessive actin release into the bloodstream decreases the level of the actin scavenger proteins gelso-lin and Gc globulin. In septic patients, especially with acute kidney injury (AKI) urinary actin level is strongly associated with kidney status. In criti-cally ill patients, urinary alpha-1-acid glycopro-tein or orosomucoid (u-ORM) as an inflamma-tory marker is extremely elevated and may be considered as a non-invasive marker for diag-nosis of sepsis. Kustán and his co-authors have
worked out an automated immune turbidimet-ric assay for measuring of u-ORM and that of gelsolin is under development (30). Finally, the manuscript of Miha Košir and Matej Podbregar are discussing the function and clinical usage of a less known gaseous transmitter, hydrogen sul-fide. Besides NO and CO, hydrogen sulfide (H2S) is the third known gasotransmitter molecule influencing many physiological processes such as maintenance of vascular tone, modulating the inflammatory response, scavenging reac-tive oxygen species, etc. Its plasma concentra-tion has a predictive value for the outcome of sepsis. Interestingly, too high or too low plasma H2S levels exert unfavorable effects predict-ing the severity of the disease and indicating a worse outcome. Professor Podbregar and his team are attempting to place successful basic research into clinical context including interest in pathophysiology of shock, hemodynamic sta-bilization, prediction of severity of shock, cyto-kine removal techniques/modulation of inflam-mation and bioactive gases (NO, H2S). They are also interested in development of point of care prediction tools.
In conclusion, the successful diagnosis and treatment of sepsis is based on the correct in-terpretation of clinical signs and symptoms and also on the availability of laboratory tests with high specificity and sensitivity. Measurement of one lab parameter is never enough and monitoring of key markers such as procalcito-nin is essential. The tendency (rising or falling) of the biomarker is usually more important than the absolute values. Further evaluation of presepsin in comparison with well-established markers (PCT, CRP) and with possible interfer-ing factors (kidney failure) is of utmost impor-tance. The introduction of non-commercially available tests as u-ORM, gelsolin, Gc globulin and H2S into the routine laboratory palette in-evitably would give valuable complementary data for sepsis management.
eJIFCC2017Vol28No2pp099-103Page 102
Tamás KőszegiAdvances in the diagnosis of sepsis
REFERENCES1. Tetta C, Fonsato V, Ronco C, CamussI G. Severe sepsis remains the dominant challenge in the care of critically ill patients. Crit Care Resusc 2005;7:32–9.
2. Fleischmann C, Scherag A, Adhikari NK, Hartog CS, Tsaga-nos T, Schlattmann P, et al. International forum of acute care trialists. Assessment of global incidence and mortal-ity of hospital-treated sepsis. Current estimates and limi-tations. Am J Respir Crit Care Med 2016;193(3):259–72.
3. Cohen J, Vincent J-L, Adhikari NKJ, Machado FR, Angus DC, Calandra T, et al. The Lancet infectious diseases com-mission: sepsis: a roadmap for future research. Lancet Infect Dis 2015;15:581–614.
4. Wiersinga WJ, Leopold SJ, Cranendonk DR, van der Poll T. Host innate immune responses to sepsis. Virulence 2014;5(1):36–44.
5. Wiersinga WJ. Current insights in sepsis: from patho-genesis to new treatment targets. Curr Opin Crit Care 2011;17(5):480–6.
6. Minasyan H. Erythrocyte: bacteria killer and bacteria pray. Int J Immunol. (Special Issue: Antibacterial Cellular and Humoral Immunity). 2014;2(5-1):1-7.
7. Minasyan H. Erythrocyte and leukocyte: two partners in bacteria killing. Int Rev Immunol 2014;33(6):490–7.
8. Shacter E. Quantification and significance of pro-tein oxidation in biological samples. Drug Metab Rev 2000;32(3&4):307–26.
9. Hovorka SW, Hong J, Cleland JL, Schöneich Ch. Metal-catalyzed oxidation of human growth hormone: modula-tion by solvent-induced changes of protein conformation. J Pharm Sci 2001(January);90(1):58–69.
10. Tschaikowsky K, Hedwig-Geissing M, Braun GG, Radespiel-Troeger M. Predictive value of procalcito-nin, interleukin-6, and C-reactive protein for survival in postoperative patients with severe sepsis. J Crit Care 2011;26(1):54–64.
11. Ho KM, Lee KY, Dobb GJ, Webb SA. C-reactive protein concentration as a predictor of in-hospital mortality after ICU discharge: a prospective cohort study. Intensive Care Med 2008;34(3):481–7.
12. Gabay C, Kushner I. Acute-phase proteins and oth-er systemic responses to inflammation. N Engl J Med 1999;340(6):448–54.
13. Sexton PM, Christopoulos G, Christopoulos A, Nylen ES, Snider Jr RH, Becker KL. Procalcitonin has bioactivity at calcitonin receptor family complexes: potential mediator implications in sepsis. Crit Care Med 2008;36(5):1637–40.
14. Clec’h C, Fosse JP, Karoubi P, Vincent F, Chouahi I, Ham-za L, et al. Differential diagnostic value of procalcitonin in
surgical and medical patients with septic shock. Crit Care Med 2006;34(1):102–7.
15. de Kruif MD, Limper M, Sierhuis K, Wagenaar JF, Spek CA, Garlanda C, et al. TX3 predicts severe disease in fe-brile patients at the emergency department. J Inf Secur 2010;60(2):122–7.
16. Bottazzi B, Garlanda C, Cotena A, Moalli F, Jaillon S, Deban L, et al. The long pentraxin PTX3 as a prototypic humoral pattern recognition receptor: interplay with cel-lular innate immunity. Immunol Rev 2009;227(1):9–18.
17. Tsalik EL, Jaggers LB, Glickman SW, Langley RJ, van Vel-kinburgh JC, Park LP, et al. Woods CW discriminative value of inflammatory biomarkers for suspected sepsis. J Emerg Med 2012;43(1):97–106.
18. Andaluz-Ojeda D, Bobillo F, Iglesias V, Almansa R, Rico L, Gandía F, et al. A combined score of pro- and anti-in-flammatory interleukins improves mortality prediction in severe sepsis. Cytokine 2012;57(3):332–6.
19. Calandra T, Roger T. Macrophage migration inhibitory factor: a regulator of innate immunity. Nat Rev Immunol 2003;3(10):791–800.
20. Bozza FA, Gomes RN, Japiassú AM, Soares M, Ca-stro-Faria-Neto HC, Bozza PT, et al. Macrophage migra-tion inhibitory factor levels correlate with fatal outcome in sepsis. Shock 2004;22(4):309–13.
21. Wang H, Yang H, Tracey KJ. Extracellular role of HMGB1 in inflammation and sepsis. J Intern Med 2004; 255(3):320–31.
22. Karlsson S, Pettilä V, Tenhunen J, Laru-Sompa R, Hyn-ninenM, Ruokonen E. HMGB1 as a predictor of organ dysfunction and outcome in patients with severe sepsis. Intensive Care Med 2008;34(6):1046–53.
23. Sakr Y, Reinhart K, Hagel S, Kientopf M, Brunkhorst F. Antithrombin levels, morbidity, and mortality in a surgical intensive care unit. Anesth Analg 2007;105(3): 715–23.
24. Dhainaut JF, Shorr AF, MaciasWL, Kollef MJ, Levi M, Reinhart K, et al. Dynamic evolution of coagulopathy in the first day of severe sepsis: relationship with mortality and organ failure. Crit Care Med 2005;33(2):341–8.
25. Bouchon A, Facchetti F, Weigand MA, Colonna M. TREM-1 amplifies inflammation and is a crucial mediator of septic shock. Nature 2001;410(6832):1103–7.
26. Cohen J. TREM-1 in sepsis. Lancet 2001; 358(9284): 776–8.
27. Struck J, Tao C, Morgenthaler NG, Bergmann A. Iden-tification of an Adrenomedullin precursor fragment in plasma of sepsis patients. Peptides 2004;25(8): 1369–72.
28. Molnar Z, Szakmany T, Koszegi T. Prophylactic N-ace-tylcysteine decreases serum CRP but not PCT levels and
eJIFCC2017Vol28No2pp099-103Page 103
Tamás KőszegiAdvances in the diagnosis of sepsis
microalbuminuria following major abdominal surgery. A prospective, randomised, double-blinded, placebo-controlled clinical trial. Intensive Care Med. 2003;29(5): 749-55.
29. Trásy D, Tánczos K, Németh M, Hankovszky P, Lovas A, Mikor A, Hajdú E, Osztroluczki A, Fazakas J, Molnár Z. Delta Procalcitonin Is a Better Indicator of Infection Than
Absolute Procalcitonin Values in Critically Ill Patients: A Prospective Observational Study. J Immunol Res. 2016; Epub 2016 Aug 15
30. Kustán P, Szirmay B, Horváth-Szalai Z, Ludány A, Kovács GL, Miseta A, Kőszegi T, Mühl D. Urinary orosomucoid: a novel, early biomarker of sepsis with promising diagnostic performance. Clin Chem Lab Med. 2017;55(2):299-307.
eJIFCC2017Vol28No2pp104-113Page 104
In this issue: Advances in the diagnosis of sepsis
Procalcitonin – assisted antibiotic strategy in sepsisDomonkos Trásy, Zsolt MolnárDepartment of Anaesthesiology and Intensive Therapy, Faculty of Medicine, University of Szeged, Hungary
A R T I C L E I N F O A B S T R A C T
Sepsis is one of the biggest challenges in critical care nowadays. Defining sepsis is a difficult task on its own and its diagnosis and treatment requires well trained, devoted personnel with interdisciplinary collaboration in order to provide the patients the best chance for survival. Immediate resuscitation, early adequate antimicrobial therapy, source control and highly sophisticated organ support on the inten-sive care units are all inevitable necessities for suc-cessful recovery.
To help fast and accurate diagnosis biomarkers have been measured for decades. Procalcitonin (PCT) is one of the most studied, but the results are conflict-ing. Sepsis means a very loose cohort of a large het-erogeneous patient population, hence defining cer-tain cut off values for PCT to differentiate between different severities of the disease is almost impos-sible. Clinicians first have to understand the patho-physiological background of sepsis to be able to in-terpret correctly the PCT results.
Nevertheless, PCT has been shown to have the best sensitivity and specificity to indicate infection, antibi-otic appropriateness and stopping therapy.
Corresponding author:Zsolt MolnárDepartment of Anaesthesiology and Intensive TherapyFaculty of Medicine University of Szeged 6 Semmelweisst6725 Szeged, HungaryPhone: +36 62 545168Fax: +36 62 545593E-mail: [email protected]
Domonkos Trásy, Zsolt MolnárProcalcitonin – assisted antibiotic strategy in sepsis
In this article we will focus on some important aspects of pathophysiology and advice on how to implement that in the everyday clinical practice.We believe that this multimodal evaluation of the clinical picture together with PCT results can be a useful tool to make the most out of the PCT results, and do the best for patients on the ICU.
INTRODUCTION
One of the most challenging tasks in critical care medicine is the treatment of serious infection related multiple organ dysfunction, termed in general as sepsis, and septic shock. Early de-tection of infection and the immediate start of resuscitation parallel with adequate antimicro-bial therapy undoubtedly give the best possible chance for survival and received strong recom-mendation by the Surviving Sepsis Campaign guidelines [1]. However, while recognizing or-gan failure via objective signs is relatively easy, diagnosing infection as the possible underlying cause remains a challenge. Due to the non-spe-cific properties of conventional signs of infec-tion, such as body temperature and white cell count (WCC), biomarkers have been utilized to aid diagnosis for decades. One of the most studied biomarkers is procalcitonin (PCT) [2]. Its role in assisting antibiotic (AB) therapy has been studied extensively, with contradicting results. There are positive studies [3, 4] showing that a PCT-guided patient management reduced anti-biotic exposure and length of antibiotic therapy without affecting patient outcomes. There are also negative studies, which could not show this benefit [5-7]. However, to understand the val-ues and limitations of inflammatory biomarkers it is inevitable to understand the immunological background of critical illness determined mainly by the host response. Moreover, putting the re-sults of these studies in context, based on new insights of the pathomechanism of sepsis and
systemic inflammation generated mainly by the individuals’ host response, may explain the dif-ferences between the reported results and help the clinician to interpret PCT data with more con-fidence at the bedside.
SEPSIS SYNDROME AS A DISEASE
In most surgical and medical specialties we di-agnose definitive diseases, which would indicate definitive treatment. However, defining, hence diagnosing sepsis is not that simple.
The term “sepsis syndrome” was invented dur-ing the designing of the protocol of one of the first prospective randomized trials in sepsis, performed by a group of scientists led by the late Roger Bone in Las Vegas in 1980 [8]. Several years later a statement paper was published by the same authors titled “Sepsis syndrome: a valid clinical entity” [9], after which the medi-cal society started to deal with sepsis as with a definitive disease, which created false expecta-tions:1) physicians wanted one single test with high sensitivity and specificity to diagnose sep-sis, and 2) there was an urge to find an “anti-sepsis magic bullet”. Neither of these wishes have and will never ever come true.
Regarding the definition and diagnosis of sepsis, the classical signs of the “sepsis syndrome” such as fever/hypothermia, leukocytosis/leukopenia, tachycardia and hypotension, meant a very large and non-specific cohort of patients. For this rea-son, a consensus conference was brought to-gether which defined the so called “consensus criteria” of sepsis, which has been used for de-cades in research and clinical practice alike [10]. However, the uncertainty about sepsis defini-tions lingered on that resulted the recently pub-lished new definitions as “Sepsis 3” [11]. In this, sepsis is defined as a “life- threatening organ dysfunction caused by a dysregulated host re-sponse to infection”. As categories only sepsis, septic shock, and organ dysfunction remained.
eJIFCC2017Vol28No2pp104-113Page 106
Domonkos Trásy, Zsolt MolnárProcalcitonin – assisted antibiotic strategy in sepsis
These efforts clearly show that finding the appro-priate definition of sepsis has been a continuous challenge for more than 30 years. The difficulty in defining sepsis originates from its complex pathophysiology, which is affected by numer-ous individual variations of the host response. Furthermore, in most specialties diagnostic labo-ratory or radiological tests have very high sensi-tivity and specificity often reaching almost 95-100% [12]. However, in the case of sepsis, it is different, which makes not just the diagnosis, but the interpretation of the results of clinical trials and also epidemiological data very difficult.
THE IMMUNE RESPONSE FOR AN INSULT
The immune system is a complex network and the immune response to pathogens relies on both innate and adaptive components, dynami-cally defined as the pro-, and anti-inflammatory forces. The innate immune system (including the complement system, sentinel phagocyte
and natural killer cells), is responsible for the eradication of the invaders, while the adaptive immune system’s role is to control the process and keep it localized to the site of the insult [13]. Under normal circumstances these mech-anisms remain in balance. The innate system acts by broad recognition of antigens, mainly by triggering “pathogen-associated molecular patterns” (PAMP) of lipopolysaccharide ele-ments of the surfaces of invading pathogens. When there is an imbalance due to the dys-regulation of the pro-, and anti-inflammatory forces, the local response escalates into a sys-temic host response also termed as “cytokine storm” [14]. It was a surprising finding, that after trauma, burns, ischemia-reperfusion, pan-creatitis, major surgery, etc., same or similar molecules are released mainly from the mito-chondria of the injured or stressed cells that are found during PAMPs, and can also cause a cy-tokine storm. This process accompanying tissue
For further details, see text.
Figure 1 The molecular responses for damage (DAMP) and pathogen (PAMP) type insults
eJIFCC2017Vol28No2pp104-113Page 107
Domonkos Trásy, Zsolt MolnárProcalcitonin – assisted antibiotic strategy in sepsis
injury is called “damage-associated molecular patterns” (DAMP). In the case of bacterial in-fection this similarity is due to the fact that the bacteria and the mitochondria (which is more-or-less an encapsulated bacterium) share very similar genetic background. This explains why tissue injury induced DAMP and bacterial in-fection induced PAMP manifest in similar host responses and clinical manifestations [15]. This similar pathophysiological response is summa-rized in Figure 1. This indicates that in addition to PAMP, DAMP can also cause the induction of the production of similar cytokines, hormokines and also PCT. This on the one hand provides the potential benefit of PCT in diagnosing infection (PAMP) but also limits its accuracy as levels may increase in scenarios without infection (DAMP). This is the reason, why unexpected PCT values (high or low) are often interpreted as “false neg-ative” or “false positive”. However, understand-ing the nature of PCT production helps a lot in the interpretation of PCT values at the bedside.
THE ROLE OF PCT IN DIAGNOSING INFECTION
The so called “sepsis biomarkers” do not recog-nize sepsis per se, but inflammation. The rea-sons have been explained in the previous para-graphs, namely that both damage and pathogen related insults can provoke a very similar inflam-matory host response. Therefore, in this con-text, the right question is: whether the critically ill condition is due to infection or not? Because if it is, we should start anti-microbials or other source control. But if it isn’t, then anti-microbial therapy should not be commenced, due to its several undesired effects. Therefore, it is not “sepsis” what we treat, but organ dysfunction and infection.
Diagnosing infection on the ICU is not easy and requires a multimodal approach. Clinical signs are obviously the most important in recognizing
critical illness and suspecting infection and even the source of infection, but they cannot prove it on their own. Conventional indicators such as fever/hypothermia, leukocytosis/leukope-nia, tachypnea, tachycardia, hypotension, taken from the classical “sepsis-syndrome” criteria are non-specific, and in fact poor indicators of infection. To fill this gap inflammatory bio-marker measurements have been developed [2]. Every biomarker has its own merit and limitations, but there is no “ideal” biomarker, and there may never be one. Biomarkers can support decision making but they will never be able to differentiate between inflammatory response for infection from host response for non-infectious insults with a 100% sensitivity and specificity due to the complex, overlapping pathomechanism of PAMP and DAMP. This is in sharp contrast with the diagnostic power of cer-tain biomarkers used in the world of “definitive” diseases, where several laboratory parameters have this ability. Furthermore, learning how to use biomarkers is not easy either.
The two most commonly used markers in infec-tion/sepsis diagnostics and for guiding thera-peutic interventions are PCT and CRP [2]. One of the main limitations of CRP is that it moves “slowly”, and after a certain insult it reaches its maximum value usually 48 hours later. This is in general unacceptable on the ICU, as every hour delay in starting for example appropriate antibi-otic treatment can affect mortality as indicated by the study of Kumar et al. [16]. Furthermore, levels are generally elevated in most ICU pa-tients, making interpretation of CRP very diffi-cult [17].
Procalcitonin is detectable in the serum within a few (4-6) hours after its induction, which is most often bacterial infection. During the “normal” course of an infection it reaches its peak within 24 hours and then starts its decline in the case of adequate treatment with levels reducing by roughly 50% daily according to its half-life [18].
eJIFCC2017Vol28No2pp104-113Page 108
Domonkos Trásy, Zsolt MolnárProcalcitonin – assisted antibiotic strategy in sepsis
Procalcitonin differentiates bacterial infections from systemic inflammatory response of other etiologies with higher sensitivity and specific-ity as compared to CRP [19], and also have a good prognostic value regarding survival [20]. However, interpreting PCT values on admission or after the onset of an acute insult, let it be in-fectious or not, is not simple. But this holds true for any biomarker, as they show a large scatter between patients with a seemingly similar clini-cal condition, hence single absolute values are difficult to interpret.
There are many studies reporting that PCT val-ues correlate with severity and differ signifi-cantly in patients with SIRS, sepsis, severe sepsis and septic shock [21]. Clec’h et al., found that patients with septic shock had more than 10 times higher median PCT levels as compared to those admitted with shock of non-septic origin [22]. However, looking at the data carefully re-veals that although there was a remarkable and statistically significant difference, but there is also a huge scatter and overlap of the PCT data between the groups (septic shock: 14 [0.3-767] vs. non-septic shock: 1 [0.15-36] ng/ml, respec-tively), which makes individual interpretation of a single measurement very difficult - a finding, which is generally true for every biomarker of inflammation. This has been reinforced by the same group in a subsequent study, in which they found that the median PCT value in medi-cal vs. surgical patients differed both in SIRS: 0.3 (0.1-1.0) vs. 5.7 (2.7-8.3) ng/ml, and in sep-tic shock: 8.4 (3.6-76.0) vs. 34.0 (7.1-76.0) ng/ml, respectively [23]. These differences and the large overlap can be explained by the PAMP and DAMP based host response. In certain cases there is a single PAMP or DAMP, but they can also occur in combination as PAMP+DAMP. The latter is bound to have a pronounced inflamma-tory response reflected in several times higher PCT values. Therefore, it has become clear that the same PCT value, in other words a given
“normal” value, cannot be used in every condi-tion. Medical patients with infection in general should have lower PCT values (single insult of PAMP) as compared to surgical patients with in-fection, where DAMP and PAMP are present at the same time. Moreover, it is also important to acknowledge, that any cellular injury, let it be direct tissue or ischemia-reperfusion injury without infection can result in elevation of PCT induced by a single DAMP type insult.
Although PCT absolute values have the above mentioned limitations, but there is overwhelm-ing evidence that in most cases high PCT values indicate bacterial infection. The shortcomings of PCT absolute values might be compensated when the kinetics of PCT is taken into account to indicate infection.
PCT-ASSISTED ANTIBIOTIC THERAPY
There are three fundamental questions to be answered during our ward rounds when treat-ing patients with suspected or proven infec-tions on the ICU: 1) is there infection, in other words should we start empirical antibiotic ther-apy; 2) is the commenced antibiotic effective; and finally 3) when should we stop antibiotic treatment?
In this article we are giving some aspects to an-swer these questions referring to the result of previous studies which were performed at our department in the last few years in the field of procalcitonin and antibiotic therapy [24, 25, 26].
1. Is there infection?
It has been explained earlier that either PAMP or DAMD can induce PCT production. Serum lev-els of any biomarker show large scatter even in a seemingly homogenous patient population. That is why it is so difficult, almost impossible, to define an exact PCT value that indicates bacterial infection. Indeed, even the most accurate studies can only show 75-85% sensitivity and specificity.
eJIFCC2017Vol28No2pp104-113Page 109
Domonkos Trásy, Zsolt MolnárProcalcitonin – assisted antibiotic strategy in sepsis
Unfortunately, most clinicians tend to interpret sepsis as a definitive disease, therefore they have false expectations from the role of the biomarkers in the diagnosis of infection, and they become “biomarker sceptic”, when they find high levels of PCT after a non-infectious insult, such as surgery, trauma, or after cardio-pulmonary resuscitation. But those who know the patophysiology of inflammation (mecha-nism of DAMP, PAMP) are not surprised by this phenomenon, because they understand that this is due to the etiology and heterogeneity of patients, more precisely due to the individual immune response after a particular insult.
Our recently published results showed that PCT kinetics could give a much more reliable help to the clinicians’ decision making than absolute values. As it has a half-life of less than 24 hours, we hypothesized that kinetics may produce dif-ferent pattern in those who receive adequate treatment as compared to those who don’t. In the EProK („Early Procalcitonin Kinetics”) study patients were enrolled who were thought to have infection [24]. From the enrolled 209 pa-tients in 114 cases PCT was available from the previous day before the infection was suspect-ed [25]. Throughout this 24 hours we found that PCT elevation was approximately twice higher in patients who turned out to have infec-tion versus those who did not. So a more than 88% PCT elevation in 24 hours refers to infec-tion with 75% (65-84) sensitivity and 79% (60-92) specificity (AUC 77%). It can be an absolute value independent indicator of infection.
It is important to note that if the patient is he-modynamically unstable and infection is likely, by definition he/she has septic shock or at least one cannot exclude it, hence antibiotic therapy shouldn’t be delayed but has to be commenced immediately, regardless of the PCT or any bio-marker value [16]. However, if the patient is sta-ble hemodynamically, and PCT is “low” or de-creasing then we can wait, observe the patient
and reassess later. What “low” means as an exact value is difficult to define, as it depends on the etiology and the patient. Therefore, we have to admit, that diagnosing infection with or without PCT remains a challenge.
2. Evaluating antibiotic appropriateness
After commencing empirical antibiotic therapy, it is indispensable to confirm appropriateness to correct treatment if needed as soon as pos-sible because it is upmost vital. In septic shock every hour delay in starting adequate antibiotic therapy could have serious effect on survival [16]. But unnecessary overuse of antibiotics can also cause increased bacterial resistance, inva-sive fungal infections, side effects and increased costs [27]. Despite international guidelines are available to help in choosing the right medica-tion with the best possible chance, unfortu-nately it seems that inappropriate empirical antibiotic therapy can be as high as 25-30% on the ICU [28, 29]. The gold standard for proving appropriateness of antibiotic therapy is the mi-crobiological confirmation of the bacteria and its susceptibility. However, these results may come far too late, in reality days after the speci-men had been sent, but treatment cannot be delayed. At present there is very little to help the clinicians at the early stage of patient care to confirm appropriate antibiotic treatment.
The above mentioned EProK study showed that there was a significant difference in the early kinetics of PCT between patients receiving ap-propriate as compared to those getting inap-propriate antibiotic therapy (24). Serum PCT levels were measured right after ABs were com-menced then 8 hourly in the first day. In those patients who received effective AB therapy PCT reached the highest level at 16 hours and start-ed to decline at the end of the first day while those whose therapy turned out to be inade-quate the PCT level continued to increase during the first day (Figure 2).These data suggest that
eJIFCC2017Vol28No2pp104-113Page 110
Domonkos Trásy, Zsolt MolnárProcalcitonin – assisted antibiotic strategy in sepsis
early response of PCT within the first 24 hours of commencing empirical antibiotics in critically ill patients may help the clinician to evaluate the appropriateness of therapy.
Measuring PCT when antibiotics were com-menced, then 12-16 and 24 hours later can re-veal a certain kinetics. In the case of continuous increase (red arrows), it is likely that the empiri-cal ABs are inappropriate. However, a “roof-top” type PCT pattern, indicating, the levels peaked somewhere around 12-16 hours can indicate ap-propriate antibiotic therapy.
Once empirical antibiotics were commenced, daily re-evaluation of the situation is needed. In addition to the clinical picture and PCT levels, microbiology should also be taken into account. Microbiological data usually becomes available 2-3 days after specimen were sent, and then it’s time to re-evaluate the situation. The course of the clinical condition, combined with both the microbiological and PCT results, what we term as a multimodal approach, can assist us whether to continue, reconsider or change anti-biotics and/or reassess organ support and most
importantly, to stop antibiotics even on day 3 if they are considered unnecessary.
Despite no clinical improvement a decrease in PCT still may indicate that the infection is un-der control, but the patient needs more time to gain benefit from treatment. Therefore, ABs should be continued. On the contrary, if PCT is not decreasing or even increasing, these can be important signs that infection is not under con-trol, hence source of infection and antibiotics (type, dose) should be reassessed. If antibiotics are appropriate, depending on PCT changes ABs should either be continued or other sources of infection should be looked for. In case of inap-propriate ABs and no clinical improvement, re-gardless of the PCT, therapy should be changed.
If there is clinical improvement but no proof of infection (micro: negative), based on PCT chang-es (↓ or ↑) infection may be excluded and ABs stopped, or continued. Similar algorithms can be applied if ABs are appropriate. If ABs are in-appropriate and PCT decreases, then one may consider the microbiology as false positive and stop ABs, because it is highly unlikely that there
Figure 2 PCT kinetics during the first day of effective and ineffective empiric antibiotic therapy [24]
eJIFCC2017Vol28No2pp104-113Page 111
Domonkos Trásy, Zsolt MolnárProcalcitonin – assisted antibiotic strategy in sepsis
is clinical improvement and decreasing PCT if an infection is not under control due to inappro-priate ABs. This scenario happens when there are pathogens (colonization for example), but no infection. Finally, in case of inappropriate ABs and unfavourable PCT changes, consulta-tion with infectologists and microbiologists is recommended.
This multimodal evaluation could help to indi-vidualize suspected infection management in the early course of sepsis on the ICU.
3. Stopping antibiotic therapy
Procalcitonin, mainly due to its favourable kinetic profile can potentially be a useful biomarker for also the cessation of antibiotic treatment [30]. In the first trial on 600 ICU patients, the PRORATA study [4], PCT-guided antibiotic management was tested. Antibiotics were encouraged in case of elevated PCT levels, and discouraged when levels were low. The novelty of this trial was that investigators were encouraged to discon-tinue antibiotics when PCT concentration was less than 80% of the peak value or when abso-lute concentration of less than 0.5 ng/ml was reached. The same protocol was repeated in a large recent study on 1500 patients by de Jong et al., in a multicenter prospective trial [31]. The results were similar just like the previous one applying this approach shortened the duration of antibiotic treatment and the daily dose an-tibiotic consumption, in addition the mortality in this group was significantly lower in the PCT-group as compared to conventionally treated patients. In spite of the reinfection rate being higher in the PCT guided group the cumulative cost of antibiotics per patient was significantly lower. Despite the significantly shorter anti-biotic therapy, they were unable to show any difference in outcome between the groups, in other words patients did not suffer harm from not receiving antibiotics for the length of time recommended by guidelines.
CONCLUSION
In this deadly battle of fighting the burden of se-rious infections on the ICU, we often keep miss-ing the point. Although sepsis exists, just like critical illness, but precisely defining it is prob-ably impossible due to its diversity in etiology, pathomechanism and clinical manifestation. Therefore, interpreting the results of sepsis stud-ies is a daunting task. Procalcitonin is definitely one of the most reliable inflammatory markers in the critically ill to date, and there is also con-vincing evidence that its use to guide antibiotic therapy can rationalize starting, escalating and stopping antibiotic therapy. Furthermore, when the concept, highlighted in this paper is applied, PCT may also become cost effective, by not start-ing at all, or stopping antibiotic therapy early. However, starting or stopping antibiotic treat-ment is more complex than just treating one single figure or even the kinetics of PCT values. A multimodal, individualized concept, consisting of a) recognizing organ dysfunction, b) identify-ing the possible source, c) following the clinical picture and d) taking PCT and PCT-kinetics into account, is necessary to make the most out of your PCT and to do the best for your patients in your everyday practice. Indeed, it requires well-trained, devoted, thinking physicians who dial in all information such as the results of physical ex-amination, laboratory data, and physiologicmea-surements and make the decisions. Therefore, PCT is not the answer, but it can certainly help, considering that we understand what’s going on in our patients.
REFERENCES
1. Rhodes A, Evans LE, Alhazzani W, Levy MM, Antonelli M, Ferrer R, Kumar A, Sevransky JE, Sprung CL, Nunnally ME, Rochwerg B, Rubenfeld GD, Angus DC, Annane D, Beale RJ, Bellinghan GJ, Bernard GR, Chiche JD, Cooper-smith C, De Backer DP, French CJ, Fujishima S, Gerlach H, Hidalgo JL, Hollenberg SM, Jones AE, Karnad DR, Klein-pell RM, Koh Y, Lisboa TC, Machado FR, Marini JJ, Mar-shall JC, Mazuski JE, McIntyre LA, McLean AS, Mehta S,
eJIFCC2017Vol28No2pp104-113Page 112
Domonkos Trásy, Zsolt MolnárProcalcitonin – assisted antibiotic strategy in sepsis
Moreno RP, Myburgh J, Navalesi P, Nishida O, Osborn TM, Perner A, Plunkett CM, Ranieri M, Schorr CA, Seckel MA, Seymour CW, Shieh L, Shukri KA, Simpson SQ, Singer M, Thompson BT, Townsend SR, Van der Poll T, Vincent JL, Wiersinga WJ, Zimmerman JL, Dellinger RP. Surviving Sep-sis Campaign: International Guidelines for Management of Sepsis and Septic Shock: 2016. Intensive Care Med. 2017;43(3):304-377
2. Pierrakos C, Vincent JL. Sepsis biomarkers: a review. Crit Care. 2010;14:R15
3. Christ-Crain M, Jaccard-Stolz D, Bingisser R, Gencay MM, Huber PR, Tamm M, Müller B. Effect of procalcito-nin-guided treatment on antibiotic use and outcome in lower respiratory tract infections: cluster-randomised, single-blinded intervention trial. Lancet. 2004;363:600-7
4. Bouadma L, Luyt CE, Tubach F, Cracco C, Alvarez A, Schwebel C, Schortgen F, Lasocki S, Veber B, Dehoux M, Bernard M, Pasquet B, Régnier B, Brun-Buisson C, Chastre J, Wolff M; PRORATA trial group. Use of procalcitonin to reduce patients’ exposure to antibiotics in intensive care units (PRORATA trial): a multicentre randomised con-trolled trial. Lancet. 2010;375:463-74
5. Layios N, Lambermont B, Canivet JL, Morimont P, Prei-ser JC, Garweg C, Ledoux D, Frippiat F, Piret S, Giot JB, Wiesen P, Meuris C, Massion P, Leonard P, Nys M, Lancel-lotti P, Chapelle JP, Damas P. Procalcitonin usefulness for the initiation of antibiotic treatment in intensive care unit patients. Crit Care Med. 2012;40:2304-9
6. Jensen JU, Lundgren B, Hein L, Mohr T, Petersen PL, An-dersen LH, Lauritsen AO, Hougaard S, Mantoni T, Bømler B, Thornberg KJ, Thormar K, Løken J, Steensen M, Carl P, Petersen JA, Tousi H, Søe-Jensen P, Bestle M, Hestad S, Andersen MH, Fjeldborg P, Larsen KM, Rossau C, Thom-sen CB, Ostergaard C, Kjaer J, Grarup J, Lundgren JD.The Procalcitonin and Survival Study (PASS) – a randomised multi-centre investigator initiated trial to investigate whether daily measurements biomarker procalcitonin and pro-active diagnostic and therapeutic responses to abnormal procalcitonin levels, can improve survival in in-tensive care unit patients. Calculated sample size (target population): 1000 patients. BMC Infect Dis.2008;8:91-101
7. Shehabi Y, Sterba M, Garrett PM, Rachakonda KS, Ste-phens D, Harrigan P, Walker A, Bailey MJ, Johnson B, Millis D, Ding G, Peake S, Wong H, Thomas J, Smith K, Forbes L, Hardie M, Micallef S, Fraser JF; ProGUARD Study Inves-tigators; ANZICS Clinical Trials Group.Procalcitonin algo-rithm in critically ill adults with undifferentiated infection or suspected sepsis. A randomized controlled trial. Am J RespirCrit Care Med. 2014;190:1102-1110
8. Bone RC, Fisher CJ Jr, Clemmer TP, Slotman GJ, Metz CA, Balk RA. A controlled clinical trial of high-dose meth-ylprednisolone in the treatment of severe sepsis and sep-tic shock. New Engl J Med.1987;317:653-8
9. Bone RC, Fisher CJ Jr, Clemmer TP, Slotman GJ, Metz CA, Balk RA. Sepsis syndrome: a valid clinical entity. Methylprednisolone Severe Sepsis Study Group. Crit Care Med.1989;17:389-93
10. [No authors listed] American College of Chest Physi-cians/Society of Critical Care Medicine Consensus Confer-ence: definitions for sepsis and organ failure and guide-lines for the use of innovative therapies in sepsis. Crit Care Med.1992;20:864-74
11. Singer M, Deutschman CS, Seymour CW, Shankar-Hari M, Annane D, Bauer M, Bellomo R, Bernard GR, Chiche JD, Coopersmith CM, Hotchkiss RS, Levy MM, Marshall JC, Martin GS, Opal SM, Rubenfeld GD, van der Poll T, Vincent JL, Angus DC. The Third International Consensus Definitions for Sepsis and Septic Shock (Sepsis-3). JAMA. 2016;315(8):801-10
12. Sartori M, Cosmi B, Legnani CJ, Favaretto E, Valdré L, Guazzaloca G, Rodorigo G, Cini M, Palareti G. The Wells rule and D-dimer for the diagnosis of isolated distal deep vein thrombosis. J ThrombHaemost.2012;10:2264-9
13. Cavaillon JM, Adrie C, Fitting C, Adib-Conqui M. Re-programming of circulatory cells in sepsis and SIRS. J En-dotoxin Res.2005;11:311-320
14. Cavaillon JM, Adib-Conquy M. Bench-to-bedside re-view: endotoxin tolerance as a model of leukocyte repro-gramming in sepsis. Crit Care. 2006;10:233
15. Zhang Q, Raoof M, Chen Y. Circulating mitochondrial DAMPs cause inflammatory responses to injury. Nature. 201; 464:104-7
16. Kumar A, Roberts D, Wood KE, Light B, Parrillo JE, Sharma S, Suppes R, Feinstein D, Zanotti S, Taiberg L, Gurka D, Kumar A, Cheang M. Duration of hypotension before initiation of effective antimicrobial therapy is the critical determinant of survival in human septic shock. Crit Care Med. 2006;34:1589-96
17. Dandona P, Nix D, Wilson MF, Aljada A, Love J, Assi-cot M, Bohuon C. Procalcitonin increase after endotoxin injection in normal subjects. J ClinEndocrinolMetab. 1994;79:1605-8
19. Müller B, Becker KL, Schächinger H,Rickenbacher PR, Huber PR, Zimmerli W, Ritz R.Calcitonin precursors are re-liable markers of sepsis in a medical intensive care unit. Crit Care Med. 2000;28:977-83
20. Jensen JU, Heslet L, Jensen TH, Espersen K, Steffensen P, Tvede M.Procalcitonin increase in early identification of critically ill patients at high risk of mortality. Crit Care Med. 2006;34:2596-602
eJIFCC2017Vol28No2pp104-113Page 113
Domonkos Trásy, Zsolt MolnárProcalcitonin – assisted antibiotic strategy in sepsis
21. Pupelis G, Drozdova N, Mukans M, Malbrain ML.Serum procalcitonin is a sensitive marker for septic shock and mortality in secondary peritonitis.Anaesthesiol Intensive Ther. 2014;46:262-73
22. Clec’h C, Ferriere F, Karoubi P, Fosse JP, Cupa M, Ho-ang P, Cohen Y. Diagnostic and prognostic value of pro-calcitonin in patients with septic shock. Crit Care Med. 2004;32:1166-9
23. Clec’h C, Fosse JP, KaroubiP, Vincent F, Chouahi I, Hamza L, Cupa M, Cohen Y. Differential diagnostic value of procalcitonin in surgical and medical patients with sep-tic shock. Crit Care Med. 2006;34:102-7
24. Trásy D, Tánczos K, Németh M, Hankovszky P, Lovas A, Mikor A, László I, Hajdú E, Osztroluczki A, Fazakas J, Mol-nár Z,EProK study group. J Crit Care. 2016;34:50-5
25. Trásy D, Tánczos K, Németh M, Hankovszky P, Lovas A, Mikor A, Hajdú E, Osztroluczki A, Fazakas J, Molnár Z.Delta Procalcitonin Is a Better Indicator of Infection Than Absolute Procalcitonin Values in Critically Ill Pa-tients: A Prospective Observational Study. J Immunol Res. 2016;2016:3530752
26. Garnacho-Montero J, Huici-Moreno MJ, Gutierrez-Pizarraya A, López I, Márquez-Vácaro JA, Macher H, Guer-rero JM, Puppo-Moreno A.Prognostic and diagnostic val-ue of eosinopenia, C-reactive protein, procalcitonin, and circulating cell-free DNA in critically ill patients admitted with suspicion of sepsis. Crit Care. 2014;18: R116
27. Ohl CA, Luther VP. Antimicrobial stewardship for inpa-tient facilities. J Hosp Med. 2011;1:S4-15
28. Charles PE, Tinel C, Barbar S, Aho S, Prin S, Doise JM, Olsson NO, Blettery B, Quenot JP. Procalcitonin kinetics within the first days of sepsis: relationship with the ap-propriateness of antibiotic therapy and the outcome. Crit Care. 2009;13:R38
29. Mettler J, Simcock M, Sendi P, Widmer AF, Bingisser R, Battegay M, Fluckiger U, Bassetti S.Empirical use of antibi-otics and adjustment of empirical antibiotic therapies in a university hospital: a prospective observational study. BMC Infect Dis. 2007;7:21
30. Schroeder S, Hochreiter M, Koehler T, Schweiger AM, Bein B, Keck FS, von Spiegel T. Procalcitonin (PCT)-guided algorithm reduces length of antibiotic treatment in surgi-cal intensive care patients with severe sepsis: results of a prospective randomized study. Langenbecks Arch Surg. 2009;394:221-6
31. de Jong E, van Oers JA, Beishuizen A, Vos P, Vermei-jden WJ, Haas LE, Loef BG, Dormans T, van Melsen GC, Kluiters YC, Kemperman H, van den Elsen MJ, Schouten JA, Streefkerk JO, Krabbe HG, Kieft H, Kluge GH, van Dam VC, van Pelt J, Bormans L, Otten MB, Reidinga AC, Ende-man H, Twisk JW, van de Garde EM, de Smet AM, Kes-ecioglu J, Girbes AR, Nijsten MW, de Lange DW.Efficacy and safety of procalcitonin guidance in reducing the dura-tion of antibiotic treatment in critically ill patients: a ran-domised, controlled, open-label trial. Lancet Infect Dis. 2016;16(7):819-27
eJIFCC2017Vol28No2pp114-121Page 114
In this issue: Advances in the diagnosis of sepsis
Advances and pitfalls in using laboratory biomarkers for the diagnosis and management of sepsisDunja Rogić1,3, Gordana Fressl Juroš2, Jόzsef Petrik3, Ana Lončar Vrančić1
1 Department of Laboratory Diagnostics, University Hospital Center Zagreb, Croatia2 Children’s Hospital Srebrnjak, Zagreb, Croatia3 Department of Medical Biochemistry and Hematology, Faculty of Pharmacy and Biochemistry, University of Zagreb, Croatia
A R T I C L E I N F O A B S T R A C T
Sepsis is a critical patient condition with high mor-tality rate caused by a complex and inadequate host response to infection. Since early identification and start of antibiotic therapy in the first few hours after sepsis development dramatically improves outcomes, it is of utter importance to offer fast, reliable and spe-cific early laboratory biomarkers to help clinicians in sepsis recognition. On the other hand, the biomark-ers should also be helpful in excluding sepsis and/or confirming therapy effectiveness, and thus prevent overprescribing of antibiotics. In this paper, we dis-cuss the significance and relative merits of three cur-rently available protein biomarkers: C-reactive pro-tein, procalcitonin and presepsin. Although useful, none of these biomarkers has been shown to com-pletely fulfill the roles mentioned above.
Corresponding author:Dunja RogićUniversity Hospital Center Kišpatićeva 1210 000 ZagrebCroatiaPhone: +385-1-2367288
Key words:management of sepsis, C-reactive protein, procalcitonin, presepsin
eJIFCC2017Vol28No2pp114-121Page 115
Dunja Rogić, Gordana Fressl Juroš, Jόzsef Petrik, Ana Lončar VrančićAdvances and pitfalls in using laboratory biomarkers for the diagnosis and management of sepsis
INTRODUCTION
The 2016 Guidelines of the Surviving Sepsis Campaign (SSC) classify sepsis and septic shock as medical emergencies and therefore treat-ment and resuscitation must begin immediately (1). Sticking to the shortest possible time frame for diagnosis and treatment is crucial since it often means life or death for the patient. However, it is –especially in the early stages– not easy to be sure if a patient is septic or not. As a consequence, to be on the safe side, antibi-otics are often overprescribed, which generates further problems. As sepsis represents one of the major problems in intensive care units, it is essential for clinicians to have fast, accurate and reliable biomarkers that can help them to make a quick diagnosis and appropriately manage or exclude this life-threatening condition. An ideal biomarker should have all of the following char-acteristics: fast and specific increase in sepsis, rapid decrease after effective therapy, short half-life and fast and widely available and reliable method of determination. None of the current biomarkers exhibits all of these specifications in full, but the best currently used biomarker available both as a point of care test (POCT) and as a part of several major in vitro diagnostics (IVD) manufacturers’ portfolio is procalcitonin (PCT) (2). However, since CRP is still uniformly and inevitably used worldwide, its importance in sepsis diagnosis and management will be briefly discussed. The focus of attention will be placed on the new and rapidly advancing bio-marker presepsin whose role is still uncertain, but which might represent a step towards ear-lier and better sepsis recognition by laboratory means (3). Of course, the golden standard for sepsis confirmation remains within the scope of microbiology laboratory, but the time to result even with the recent advancement of Matrix Assisted Laser Description/Ionization - Time of Flight (MALDI TOF) technology is still inferior to the above mentioned surrogate biomarkers.
C-REACTIVE PROTEIN
C-reactive protein (CRP) belongs to the pentrax-in family of calcium-dependent, ligand-binding proteins. Human CRP molecule has a discoid shape and consists of five identical nonglycosyl-ated polypeptide subunits, each containing 206 amino acid residues (4). The CRP gene is located on the first chromosome (1q21q23).
CRP was isolated from the sera of patients in-fected with Streptococcus pneumoniae, and was first described by Tillett and Frances in 1930 (5). The CRP, named for its capacity to precipitate the somatic polysaccharide-F of Streptococcus pneumoniae, was the first acute-phase protein to be described and is an exquisitely sensitive marker of systemic inflammation and tissue damage (4).
CRP is synthesized primarily in the liver, and at lower levels in adipocytes as a response to interleukin-6 (IL-6), interleukin-1 (IL-1) and tu-mor necrosis factor-α (TNF-α). CRP is an acute phase protein. During acute-phase response to infection, inflammation or tissue damage, the concentration of CRP increases several thou-sand times within 48 hours. Authors Pepys and Hirschfield stated that the median concentra-tion of CRP is 0.8 mg/L in healthy young adult volunteer blood donors, the 90th percentile is 3.0 mg/L, and the 99th percentile is 10 mg/L (1) but, following an acute-phase stimulus, the values may increase from less than 50 μg/L to more than 500 mg/L, that is, 10,000-fold (6).
The function of CRP is manifold. The CRP can bind to specific ligands and activate a complement on the classical pathway and thereby participate in non-specific defences against infection and pre-vent the development of autoimmune diseases. The main ligand for CRP is phosphocholine which is present in the cells of most pathogens, includ-ing bacteria and fungi. Furthermore, it is consid-ered that the CRP interacts with damaged endo-thelial cells or the apoptotic and necrotic cells.
eJIFCC2017Vol28No2pp114-121Page 116
Dunja Rogić, Gordana Fressl Juroš, Jόzsef Petrik, Ana Lončar VrančićAdvances and pitfalls in using laboratory biomarkers for the diagnosis and management of sepsis
The major CRP drawback in sepsis lies in its lack of specificity. Elevated CRP concentrations in the circulation may indicate inflammation and/or tissue damage of any origin, such as bacterial and viral infections, mycoses, allergic complica-tions of infection, various inflammatory reac-tions, necrosis, trauma, or malignancies (7-13). The particular problem is a common postopera-tive CRP elevation with values that might easily overlap with the septic ones, particularly in the initial stages when early recognition is of utter importance.
The CRP values are not affected by diurnal vari-ations, food intake and most medications.
Recent evidence suggests that aging has a sig-nificant effect on inflammatory response and the immune system of elderly people, which is to be considered when interpreting CRP values (14).
Acute phase proteins such as CRP, PCT, serum amyloid A, IL-6, and hepcidin have been inves-tigated in multiple studies related to neonatal sepsis. CRP is usually used as an indicator of bacterial sepsis in newborns since PCT values may not be easily interpreted in the first few days of life. However, the determination of CRP has a few drawbacks; it is not useful as a marker for the early phase of infection because it can only be detected about 12 hours after the onset of clinical symptoms, it reaches its maxi-mum after 20 to 72 h (15) and does not show satisfactory specificity (16). However, due to its universal availability and fairly straightforward interpretation of values, CRP is still the most common marker used worldwide in all hospital-ized patients, including those with high risk of sepsis development.
PROCALCITONIN
PCT is a calcitonin precursor prohormone which consists of 116 amino acids and is normally ex-pressed by neuroendocrine cells of the thyroid gland, lungs and pancreas. In healthy people
PCT values are low, less than 0.046 μg/L (95th percentile) (17,18). PCT values in various non-septic infections are usually lower than 0.5 μg/L (18). This fact, i.e. exclusively bacteria-related increase represents one of the crucial PCT advantages when compared to CRP. In severe septic shock PCT can rise up to 1000-fold. The pathomechanism of blood PCT elevation is a reaction to various exogenous and endogenous stimuli, such as inflammatory interleukins, membrane elements, bacteria lipopolysaccha-rides or peptidoglycans as well as bacterial en-dotoxins. In sepsis, PCT is synthesized mostly in liver, but also in other parenchymal organs (19).
Increase in PCT level in patient’s blood can be detected approximately 2 to 4 hours after the onset of sepsis (19), which represents another major advantage making it both more suitable and specific than CRP in this clinical context. It is important to know that PCT has a plasma half-life of 20-24 hours (20) Therefore, according to current recommendations, the minimum time before testing needs to be repeated (minimum retesting interval) should be 24 hours (21).
PCT can serve as an aid for clinicians in assess-ing the risk category for their patient of devel-oping sepsis or septic shock, according to the classification (18) in Table 1.
After initial measurement, PCT can be used to monitor progression of the disease and therapy effectiveness, taking into account minimum re-testing interval for PCT of 24 hours.
PCT has also proved to be useful in guiding antibiotic therapy. This approach was mainly evaluated in patients with respiratory tract in-fections; however, it can also be used in criti-cally ill patients with sepsis or severe sepsis of various origins (21,22). In those patients, daily measurement of PCT is indicated and discon-tinuation of antibiotic therapy should be con-sidered when PCT levels decrease to less than 80% of the peak value or below 0.5 μg/L (23).
eJIFCC2017Vol28No2pp114-121Page 117
Dunja Rogić, Gordana Fressl Juroš, Jόzsef Petrik, Ana Lončar VrančićAdvances and pitfalls in using laboratory biomarkers for the diagnosis and management of sepsis
This approach has been shown to significant-ly reduce the antibiotics use without com-promising the patient outcome, which might prove beneficial towards the goal of minimising the antibiotic usage both for the sake of pa-tients and hospital resources. It is important to note that current recommendations state that measurement of PCT levels can be used to sup-port shortening the duration of antimicrobial therapy in sepsis patients; however, as yet this approach is not based on strong evidence (1). Similar strength of recommendations pertains to the fact that PCT levels can be used to sup-port the discontinuation of empiric antibiotics in patients who initially appeared to have sep-sis, but have subsequently been proven to have limited clinical evidence of infection (1).
In conclusion, PCT has proven to be a helpful biomarker in early diagnosing of sepsis in emer-gency departments and intensive care units. It has also been recommended for monitoring ef-fectiveness and modulating duration of antibi-otic therapy. It is now widely available both as a laboratory and as a point-of-care test, whereas laboratory methods are preferred due to semi-quantitative nature of results on most POCT de-vices. When ordering PCT, it should be essential that the result provides the clinician with an an-swer that could not have been resolved by oth-er laboratory tests combined with clinical signs and symptoms, such as complete blood count
or CRP measurement. It is important to note that PCT and all other biomarkers can provide only supportive and supplemental data to clini-cal assessment. Decisions on initiating, altering, or discontinuing antimicrobial therapy should never be made solely on the basis of changes in any biomarker, including PCT (1). The follow-ing questions therefore cannot as yet unequivo-cally be answered exclusively either by PCT or any other available biomarker: Does my patient have sepsis? Is this antibiotic therapy effective for my patient? Can I now safely discontinue antibiotic therapy? PCT seems to be of help in answering those questions in many clinical situ-ations; however, it cannot fulfill this role by it-self and should therefore be ordered rationally.
PRESEPSIN
Presepsin is a newly investigated sepsis marker that has been shown to have potential as an early marker of sepsis recognition, for antimi-crobial therapy monitoring and as a prognostic marker. Presepsin (sCD14-ST) is a peptide sized 13 kDa that is generated by proteolytic cleav-age of soluble forms of CD14 cluster (sCD14). CD14 is a cell surface glycoprotein with molecu-lar mass of 53-55 kDa that is anchored by glyco-syIphosphatidylinositol (GPI) to cell membrane and represents a membrane form of CD14 (mCD14). The mCD14 as a co-receptor medi-ates the binding of the bacterial endotoxin,
Table 1 Risk categories according to PCT values
PCT value (μg/L) Risk category
< 0.5 low risk of systemic bacterial or fungal infection
0.5 - 2.0 high risk of systemic bacterial or fungal infection
2.0 – 10 high risk of sepsis and progression to septic shock
> 10 high risk of septic shock
eJIFCC2017Vol28No2pp114-121Page 118
Dunja Rogić, Gordana Fressl Juroš, Jόzsef Petrik, Ana Lončar VrančićAdvances and pitfalls in using laboratory biomarkers for the diagnosis and management of sepsis
lipopolysccharides (LPS) and complex LPS-lipopolysaccharide binding protein (LBP) to toll-like receptors (TLRs), causing the activa-tion of inflammatory responses: cell activation, fagocytosis and cytokine production defending host against pathogen (24-26). After the sTLR activation, the mCD14 undergoes the prote-olysis, producing two soluble forms (sCD14) of different sizes. The smaller sCD14 is produced by protease cleaving of mCD14 and the bigger one is produced intracellularly and is directly released from the cell in the protease-indepen-dent manner (27-29). CD14 is present mostly on monocytes, macrophages, neutrophils, B-lymphocytes and also on chondrocytes, den-dritic cells and human epithelial intestinal cells. Hepatocytes can also express CD14, especially during endotoxemia (30). Recent investigation of presepsin kinetics has shown that, when the polymorphonuclear and monocytic cells were exposed to LPS, presepsin could be detected as early as one hour after the exposure, with maximum concentration in the third hour (31). This finding may confirm that presepsin can be a useful marker of host response to bacteria and can be both a specific marker of infection as well as an early indicator, compared to cur-rent markers.
Many studies have investigated accuracy of pre-sepsin in diagnosis of system immune response syndrome (SIRS), sepsis and septic shock in dif-ferent clinical conditions. The systematic re-views and meta-analysis showed that presepsin as a diagnostic marker of sepsis has diagnostic sensitivity and specificity of 0.83 and 0.78, re-spectively, diagnostic accuracy (expressed as ROC AUC, receiver operating characteristic, area under the curve) of 0.88, and positive and negative likelihood ratios of 3.9 and 0.21, re-spectively (32).
Multicenter prospective studies have demon-strated a statistically significant difference in presepsin levels between patients with bacterial
and non-bacterial infective disease. Presepsin at the cut-off value of 600 ng/L has diagnostic sensitivity and specificity of 87.8% and 81.4%, respectively, which is comparable to PCT at the cut-off of 0.5 µg/L. A study showed that there was no statistically significant difference in pre-sepsin levels between patients with localized and systemic infection, which might preclude its usefulness in sepsis (33).
A multicenter randomized clinical trial which investigated the clinical role of presepsin assay for monitoring disease in relation to the devel-opment of complications (34) found that higher presepsin levels on the first day were closely as-sociated with higher incidence of subsequent organ failures (SOFA score). It also studied pre-sepsin role in monitoring the host response to antimicrobial therapy and appropriateness of therapy – the trial confirmed that patients with increasing presepsin concentrations during the first 7 days were less likely to have received early appropriate antibiotic therapy. The study also stated prognostic accuracy of presepsin for early and long-term outcomes; early presepsin was higher in non-survivors than in survivors. Patients with lung infection had lower baseline presepsin levels than patients with abdominal and urinary tract infections (34,35).
Another study has shown that presepsin levels are elevated at an early stage of sepsis and in-crease with its progression. The plasma prese-psin levels reached the highest level in septic shock. ROC analysis of presepsin to differenti-ate SIRS (systemic inflammatory response syn-drome) and sepsis revealed that, at the cut-off of 581 ng/L, sensitivity and specificity were 65% and 100%, respectively, AUC was 0.830. When presepsin is combined with the MEDS (Mortality in Emergency Department Sepsis) scoring sys-tem, the AUC was significantly higher - 0.95, with the sensitivity and specificity of 85% and 100%, respectively (36). A similar investigation of the diagnostics of sepsis has shown AUC for
eJIFCC2017Vol28No2pp114-121Page 119
Dunja Rogić, Gordana Fressl Juroš, Jόzsef Petrik, Ana Lončar VrančićAdvances and pitfalls in using laboratory biomarkers for the diagnosis and management of sepsis
presepsin to be 0.82. For predicting severe sep-sis in sepsis patients, the AUC was 0.840 and, with the combination of presepsin and MEDS score the AUC was 0.875 (35).
A very important piece of information about presepsin should be emphasized. As presepsin is a small protein (13 kDa) and is filtered by kid-neys, its level is strongly dependent on kidney function. The decreased glomerular filtration causes elevated levels of presepsin in circulation and thus, presepsin levels above the cut-off val-ue in patients with renal failure have to be inter-preted with caution (37,38). A study showed no statistical difference in presepsin concentration between septic and non septic oliguric patients (stage failure in RIFLE criteria; RIFLE, concensus classification criteria for acute kidney injury: Risk, Injury, Failure, Loss, End-stage kidney dis-ease), which might preclude its use in patients with renal failure (38). In this regard, however, future studies are necessary to confirm this finding. There is also a recent study (39) which deemed presepsin as a valuable biomarker for diagnosis of infection and sepsis; however, its diagnostic accuracy has not shown any superi-ority compared to PCT. Therefore, the authors question its validity for introduction into clini-cal practice. Similarly, its added value has been questioned in patients with pyelonephritis (40).
Despite the somewhat controversial findings about its validity, presepsin might be an effec-tive biomarker for the timely diagnosis of sepsis, particularly due to its early elevation. Besides diagnosis, it might prove useful for monitoring therapy effectiveness and it might serve as an aid in prognosis. It is important to note that its measurement can be performed quickly and easily (41) as a POC test; however, as it is still not widely available on common laboratory platforms, its utility might be hampered. Along with, or –as a better scenario for healthcare re-sources– instead of other diagnostic inflamma-tory markers, presepsin might therefore get its
place in the septic patient care as a routine labo-ratory marker used to facilitate current diagnos-tic strategies, particularly for early recognition of sepsis within the first few hours, which nowa-days still represents a diagnostic challenge.
CONCLUSION
So far in clinical practice no single, optimal bio-chemical marker is available to confirm or ex-clude the diagnosis of severe infection within the clinically required time frame. Therefore the diagnosis has to include consideration of all im-portant signs of infection. The quest for an ideal sepsis biomarker is still going on. The most reli-able one according to current knowledge is still PCT, while the emerging and promising markers such as presepsin still lay in waiting to be un-equivocally proven as more useful and effective.
REFERENCES
1. Surviving Sepsis Campaign: International Guidelines for Management of Sepsis and Septic Shock. Crit Care Med 2016;45(3):486-552.
2. Hoeboer SH, van der Geest PJ, Nieboer D, et al. The di-agnostic accuracy of procalcitonin for bacteraemia: a sys-tematic review and meta-analysis. Clin Microbiol Infect. 2015;21:474-481.
3. Wu J, Hu L, Zhang H, Wu F, He T. Accuracy of presepsin in sepsis diagnosis: a systematic review and meta-analy-sis. PloS One 2015;10(7) :e0133057. doi: 10.1371
4. Pepys MB, Baltz ML. Acute phase proteins with spe-cial reference to C-reactive protein and related proteins (pentaxins) and serum amyloid A protein. Adv Immunol 1983;34:141–212.
5. Tillett WS, Francis TJr. Serological reactions in pneumo-nia with a non-protein somatic fraction of pneumococ-cus. J Exp Med 1930;52:561-571.
7. Sasaki K, Fujita I, Hamasaki Y, Miyazaki S. Differentiat-ing between bacterial and viral infection by measuring both C-reactive protein and 2’-5’-oligoadenylate syn-thetase as inflammatory markers. J Infect Chemother 2002;8(1):76-80.
eJIFCC2017Vol28No2pp114-121Page 120
Dunja Rogić, Gordana Fressl Juroš, Jόzsef Petrik, Ana Lončar VrančićAdvances and pitfalls in using laboratory biomarkers for the diagnosis and management of sepsis
8. Marková M, Brodská H, Malíčková K, Válková V, Cet-kovský P, Kolář M, Haluzík M. Substantially elevated C-reactive protein (CRP), together with low levels of procal-citonin (PCT), contributes to diagnosis of fungal infection in immunocompromised patients. Support Care Cancer 2013;21(10):2733-42.
9. Galez D, Dodig S, Raos M, NogaloB. CRP in chil-dren with asthma and allergic rhinitis. Biochem Med 2006;16(2):163-169.
10. Lippi G, Favaloro EJ, Montagnana M, Franchini M. C-reactive protein and venous thromboembolism: causal or casual association? Clin Chem Lab Med 2010;48(12):1693-701.
11. Barauskas G, Svagzdys S, Maleckas A. C-reactive pro-tein in early prediction of pancreatic necrosis. Medicina (Kaunas) 2004;40(2):135-40.
12. Neumaier M, Metak G, Scherer MA. C-reactive pro-tein as a parameter of surgical trauma: CRP response af-ter different types of surgery in 349 hip fractures. Acta Orthop 2006;77(5):788-90.
13. Allin KH, Nordestgaard BG. Elevated C-reactive pro-tein in the diagnosis, prognosis, and cause of cancer. Crit Rev Clin Lab Sci 2011;48(4):155-70.
14. Ticinesi A, Lauretani F, Nouvenne A, Porro E, Fanelli G, Maggio M, Meschi T. C-reactive protein (CRP) measure-ment in geriatric patients hospitalized for acute infection. Eur J Intern Med 2017;37:7–12.
15. Gabay C, Kushner I. A cute-phase proteins and oth-er systemic responses to inflammation. N Engl J Med 1999;340:448–54.
16. Ng PC, Lam HS. Diagnostic markers for neonatal sep-sis. Curr Opin Pediatr 2006;18:125–31.
17. Rimac V. Procalcitonin - potential, limitations and availability. Signa Vitae 2015;10(suppl 1): 84-86.
18. Meisner M. Update on procalcitonin measurements. Ann Lab Med 2014;34(4):263-273.
19. Procalcitonin new findings relating to synthesis, bio-chemistry and function of procalcitonin in infection and sepsis diagnosis. Available at: http://www.brahms.de Accessed: 3 April 2017.
20. Sager R, Kutz A, Mueller B, Schuetzcorresponding P. Procalcitonin-guided diagnosis and antibiotic steward-ship revisited. BMC Medicine 2017,15:15.
21. The Royal College of Pathologists, The Association for Clinical Biochemistry and Laboratory Medicine, The Institute of Biomedical Science. National minimum re-testing intervals in pathology: A final report detailing consensus recommendations for minimum retesting
intervals for use in pathology. Available at: www.rcpath.org Accessed: 3 April 2017.
22. Hausfater P, Garric S, Ben Ayed S, Rosenheim M, Ber-nard M, Riou B. Usefulness of procalcitonin as a marker of systemic infection in emergency department patients: a prospective study. Clin Infect Dis 2002;34(7):895-901.
23. Schuetz P, Albrich W, Mueller B. Procalcitonin for diag-nosis of infection and guide to antibiotic decisions: past, present and future. BMC Medicine 2011,9:107.
24. Bufler P, Stiegler G, Schuchmann M, Hess S, Krüger C, Stelter F, Eckerskorn C, Schütt C, Engelmann H. Soluble lipopolysaccharide receptor (CD14) is released via two different mechanisms from human monocytes and CD14 transfectants. Eur J Immunol 1995;25(2):604-10.
25. Zanoni I, Granucci F. Role of CD14 in host protection against infections and in metabolism regulation. Front Cell Infect Microbiol 2013;3:32.
26. Abbas AK, Lichtman AH, Pillai S. Cellular and Molecu-lar Immunology [Internet]. 7th ed. Philadelphia. Elsevier Saunders, eBooks. Chapter 4 – Innate Immunity.[cited 2017April09];p.62-63.
27. Labeta MO, Durieux JJ, Fernandez N, Herrmann R, Ferrara P. Release from a human monocyte-like cell line of two different soluble forms of the lipopolysaccharide receptor, CD14. Eur J Immunol 1993;23(9):2144-51.
28. Chenevier-Gobeaux C, Borderie D, Weiss N, Mallet-Coste T, Claessens Y-E. Presepsin (sCD14-ST), an in-nate immune response marker in sepsis. Clin Chim Acta 2015;23:450:97-103.
29. Le-Barillec K, Si-Tahar M, Balloy V, Chignard M. Prote-olysis of monocyte CD14 by human leukocyte elastase in-hibits lipopolysaccharide-mediated cell activation. J Clin Invest 1999;103:1039-1046.
30. Liu S, Khemlani LS, Shapiro RA, Johnson ML, Liu K, Geller DA, et al. Expression of CD14 by hepatocytes: up-regulation by cytokines during endotoxemia. Infect Im-mun 1998 Nov;66(11):5089-5098.
31. Chenevier-Gobeaux C, Bardet V, Poupet H, Poyart C, Borderie D, Claessens Y-E. Presepsin (sCD14-ST) secretion and kinetics by peripheral blood mononuclear cells and monocytic THP-1 cell line. Ann Biol Clin 2016;74(1):93-7.
32. Zhang J, Hu Z-D, Song J, Shao J. Diagnostic value of presepsin for sepsis: a systematic review and meta-analy-sis. Medicine 2015;94(47):e2158.
33. Endo S, Suzuki Y, Takahashi G, Shozushima T, Ishikura H, Murai A, Nishida T, Irie Y, Miura M, Iguchi H, Fukui Y, Tanaka K, Nojima T, Okamura Y. Usefulness of presepsin in the diagnosis of sepsis in a multicenter prospective study. J Infect Chemother 2012;18(6):891-7.
Dunja Rogić, Gordana Fressl Juroš, Jόzsef Petrik, Ana Lončar VrančićAdvances and pitfalls in using laboratory biomarkers for the diagnosis and management of sepsis
34. Masson S, Caironi P, Spanuth E, Thomae R, Panigada M, Sangiorgi G, Fumagalli R, Mauri T, Isgrò S, Fanizza C, Romero M, Tognoni G, Latini R, Gattinoni L; ALBIOS Study Investigators. Presepsin (soluble CD14 subtype) and pro-calcitonin levels for mortality prediction in sepsis: data from the Albumin Italian Outcome Sepsis trial. Criti Care 2014;18(1): R6.
35. Liu B, Chen Y-X, Yin Q, Zhao Y-Z, Li C-S. Diagnostic val-ue and prognostic evaluation of Presepsin for sepsis in an emergency department. Criti Care 2013;17(5):R244.
36. Carpio R, Zapata J, Spanuth E, Hess G. Utility of pre-sepsin (sCD14-ST) as a diagnostic and prognostic marker of sepsis in the emergency department. Clin Chim Acta 2015;450:169-175.
37. Kotera A, Sagishima K, Tashiro T, Niimori D, Kamohara H, Kinoshita Y. A validation of presepsin levels in kidney dysfunction patients: four case reports. J Intensive Care 2014;2(1):63.
38. Nakamura Y, Ishikura H, Nishida T, Kawano Y, Yuge R, Ichiki, R, Murai A. Usefulness of presepsin in the diagno-sis of sepsis in patients with or without acute kidney in-jury. BMC Anesthesiol 2014;14(1):88.
39. de Guadiana Romualdo DG, Torrella PE, Acebes SR, Oton MD, Sanchez RJ, et al. Diagnostic accuracy of presepsin (sCD14-ST) as a biomarker of infection and sepsis in the emergency department. Clin Chim Acta 2017;464:6-11.
40. Claessens YE, Trabattoni E, Grabar S, Quinquis L, Der Sahakian G, Anselmo M, Schmidt J, de la Coussaye JE, Plaisance P, Casalino E, Potel G, Lecomte F, Borderie D, Chenevier-Gobeaux C. Plasmatic presepsin (sCD14-ST) concentrations in acute pyelonephritis in adult patients. Clin Chim Acta 2017;464:182-188.
41. Okamura Y, Yokoi H. Development of a point-of-care assay system for measurement of presepsin (sCD14-ST). Clin Chim Acta 2011;412(23):2157-2161.
eJIFCC2017Vol28No2pp122-133Page 122
In this issue: Advances in the diagnosis of sepsis
Nonconventional markers of sepsisPéter Kustán1,2, Zoltán Horváth-Szalai2,3, Diána Mühl1
1 Department of Anaesthesiology and Intensive Therapy, University of Pécs Medical School, Pécs, Hungary2 Department of Laboratory Medicine, University of Pécs Medical School, Pécs, Hungary3 János Szentágothai Research Center, Pécs, Hungary
A R T I C L E I N F O A B S T R A C T
Sepsis still remains a challenging healthcare problem with high mortality rate. To improve outcome, early diagnosis and monitoring of sepsis is of utmost im-portance. In this process objective laboratory param-eters are the most helpful.
Procalcitonin and C-reactive protein are the most commonly used and recommended markers of sep-sis however, more than 200 sepsis biomarkers have already been published. This mini review focuses on nonconventional novel possibilities for the recogni-tion of sepsis severity. Presepsin, actin and actin scav-enger proteins (gelsolin and Gc-globulin) and oroso-mucoid are discussed. Besides serum parameters, the urinary levels of these markers are also elabo-rated, since urinary biomarkers of sepsis provide new diagnostic implications and are helpful for monitor-ing both the kidney function and the septic process.
Increasing serum actin levels and decreasing levels of actin binding proteins seem to be associated with sepsis severity and outcome. Actin can be detected in the urine samples of septic patients as well, and strongly elevated levels of it were found in sepsis-related acute kidney injury. Both serum and urinary
Corresponding author:Dr. Péter KustánDepartment of Laboratory MedicineUniversity of Pécs7624 Pécs, Ifjúság u. 13HungaryPhone: +36 30 248 3289Fax: +36 72 536 121E-mail: [email protected]
AcknowledgementThe present scientific contribution is dedicated to the 650th anniversary of the foundation of the University of Pécs, Hungary. The presented work was funded by NKFI-EPR K/115394/2015/HU and GINOP-2.3.2-15-2016-00021 grants. Hereby we express our special thanks for the invaluable help of our nurses, assistance and colleagues.
Conflict of interestThe authors declare that there is no conflict of interest regarding the publication of this article.
Péter Kustán, Zoltán Horváth-Szalai, Diána MühlNonconventional markers of sepsis
orosomucoid might be able to indicate sepsis, however urinary orosomucoid is a more sensi-tive inflammatory marker.
Novel laboratory tests can provide rapid help for clinical decision making because the key point in successful treatment lies in the early diagnosis of sepsis.
INTRODUCTION
Although sepsis is one of the oldest syndromes in medicine it is a challenging healthcare problem even nowadays. In spite of the era of modern an-tibiotics and intensive therapy sepsis is still one of the leading causes of morbidity and mortality (1).
Sepsis is a heterogeneous and complex syndrome with various etiology, severity and prognosis. To our present knowledge the inflammatory re-sponse is the key role in the pathophysiology of sepsis however; a kind of uncertainty exists regarding the factors most likely to lead to in-creased lethality. In spite of the uncertainties one fact is obvious: the earlier the diagnosis of sepsis is raised, the more favorable outcome may be predicted (2, 3).
Based on the novel results and advances of pathobiology, management and epidemiology of sepsis, the definitions of the syndrome have been changed recently. Sepsis-3 consensus de-fines sepsis as a life-threatening organ dysfunc-tion caused by a dysregulated host response to infection (4).
The diagnosis of sepsis is most often not easy especially in newborns or in patients whose im-mune response is not adequate. Therefore, it is of utmost importance to introduce diagnostic biomarkers which can predict or verify systemic inflammation as early as possible. These tests should also be applicable for monitoring of the disease progression and efficacy of therapy as well.
Microbiological identification of pathogens is essential for efficient therapy of sepsis, because the clinical signs are nonspecific. Gold standard microbiological culturing methods require quite a long time (days), but new molecular biological techniques, polymerase chain reaction and mass spectrometric methods can shorten pathogen identification in the bloodstream (5). However, these methods can not differentiate between colonization and infection, moreover they need a well trained and equipped laboratory.
The diagnosis and monitoring of sepsis is of ut-most importance, in this regard objective labo-ratory tests may provide rapid information for proper decision making. Up to now, more than 200 sepsis biomarkers have already been stud-ied, most of them belonging to the inflamma-tory mediators’ family (acute phase proteins, cytokines, chemokines, CD markers, adhesion molecules, etc.) (6, 7).
This mini review discusses classical sepsis bio-markers as well but the major focus will be on some of novel interesting nonconventional mark-ers of sepsis.
CONVENTIONAL SEPSIS MARKERS: SERUM PCT AND CRP
The diagnostic and therapeutic guidelines of sepsis management recommend the use of pro-calcitonin (PCT) and C-reactive protein (CRP) measurements for early recognition of the syn-drome (2, 8).
Blood levels of PCT rise 4-6 hours after the onset of systemic infection and PCT’s half-life is about one day. Procalcitonin concentrations showed good correlation with the severity of sepsis, higher PCT levels correlated with higher risk of mortality (9). Massive tissue damage could also provoke elevated serum PCT values without in-fection, but fungal and viral infections do not elevate the PCT concentrations (10).
eJIFCC2017Vol28No2pp122-133Page 124
Péter Kustán, Zoltán Horváth-Szalai, Diána MühlNonconventional markers of sepsis
Monitoring of PCT kinetics is recommended be-cause delta PCT is a better marker of infection than absolute levels and furthermore, early PCT kinetics could indicate the efficacy of antibiotic therapy (11, 12).
CRP is a non-specific inflammatory marker, therefore it increases in many acute and chronic diseases (tissue injury, autoimmune disorders, malignancies), however in sepsis management, CRP could supplement PCT measurements. After infections serum CRP reaches its maxi-mum within 48-72 hours. Strongly elevated CRP levels were found to be severity and mortality predictors in sepsis (13). The measurement of high sensitivity CRP (hsCRP) is recommended.
Since both biomarkers have some limitations, promising other possibilities should be searched for and in fact, are available nowadays.
PRESEPSIN
CD14 molecule is a pattern recognition receptor existing in two forms: as a membrane-bound type (mCD14) and a soluble form (sCD14). Both forms play a role in recognition of LPS and in cell activation. Soluble CD14 subtype (sCD14-ST) also called as presepsin elevates significantly during inflammation and seems to be usable in differentiating between bacterial and nonbac-terial infections (14).
Presepsin is normally present in very low con-centrations in the serum of healthy individuals. In response to bacterial infections, its concen-tration increases within 2 hours, according to the severity of the disease (15). Studies have been reported with various diagnostic cut-off levels for sepsis between 400–600 pg/ml (16, 17). Preliminary studies showed that plasma presepsin is a highly sensitive and specific mark-er of sepsis, and its concentration significantly correlates with the severity of the disorder and in-hospital mortality of patients suffering from severe sepsis and septic shock (18). A novel
point of care test is available on the market for rapid presepsin determination, which can help clinicians in rapid decision making.
Due to its 13 kDa molecular weight, presepsin is filtered through the glomeruli, then reab-sorbed, and catabolized within proximal tubu-lar cells (19). There is increasing evidence, that presepsin levels are affected by kidney function. Elevated presepsin levels were found in patients with decreased renal function and inverse cor-relation was described between presepsin and GFR as well (19, 20).Therefore, presepsin levels should be interpreted more attentively in pa-tients with kidney disease.
ACTIN
Actin is a multifunctional 43 kDa protein which is present in all eukaryotic cells in monomeric/globular (G-actin) and in polymeric/filamentous (F-actin) form (Figure 1). The two forms dynam-ically change due to the very rapid polymer-ization and depolymerization of the molecule. Actin takes a pivotal part in many cellular pro-cesses (building up microfilamental cytoskel-eton, motility, moving, division, junctions) and in muscle contraction, too (22).
As actin is one the most abundant intracellular protein, during massive cell injury and catabolic conditions high amounts of actin can release into the circulation. Free extracellular actin has toxic effects, since actin filaments are thought to increase blood viscosity, to activate plate-lets, and cause endothelial cell damage and small blood vessel obstructions. Therefore, high amounts of extracellular actin may contribute to the development of multiple organ failure (23, 24).
The so called actin scavenger system is respon-sible for the protection of the body from actin toxicity; however the capacity of this defense system can be overwhelmed by massive tissue injury (25).
eJIFCC2017Vol28No2pp122-133Page 125
Péter Kustán, Zoltán Horváth-Szalai, Diána MühlNonconventional markers of sepsis
In healthy individuals the major source of extra-cellular actin is most probably the skeletal mus-cle with its large mass and high actin content. Circulating actin levels might provide clinically relevant information on disease severity, serum actin (se-ACT) levels were found to be higher in septic patients (3.5 (1.6-6.1) mg/L) than in con-trols (3.0 (2.1-3.7) mg/L) however did not meet criteria for statistical significance (Figure 2A). The cause of increased se-ACT levels in systemic inflammation and in sepsis might be the exten-sive tissue injury and detritus of blood cells (26).
There is only scarce data on urinary appearance of actin, however due to its molecular weight free actin could be filtrated through the glomer-uli. Recently, our research group has observed the presence of actin in urine samples of septic patients in contrast, actin could not be detected
in urine specimens from healthy individuals (27). Urinary actin (u-ACT) levels were deter-mined by quantitative western blot, as in serum. Significantly higher urinary actin was measured in samples of patients with sepsis-related acute kidney injury (AKI, Figure 2B) compared to non-AKI patients (8.17 (2.09-45.53) ng/mL vs. 4.03 (091-10.21) ng/mL). Dialyzed patients showed extremely high u-ACT levels (36.02 (4.7-176.56) ng/ml). U-ACT correlated significantly (p<0.01) with kidney function markers (serum creatinine: 0.315, urinary albumin: 0.704) but no correla-tion was found with se-ACT levels (27).
Previously Kwon et al. found increased u-ACT levels as predictors of kidney failure after isch-emic injury in renal allografts (u-ACT/u-Cr were 1095.6 ± 729.6 ng/mg in cadavers with sustained acute renal failure and 355.0 ± 247.0 ng/mg in
G-actin contains 4 subdomains, and includes one ATP molecule and one Ca2+ ion located in the nucleotide cleft, which exists in a closed state (21).
Figure 1 The structure of native G-actin
eJIFCC2017Vol28No2pp122-133Page 126
Péter Kustán, Zoltán Horváth-Szalai, Diána MühlNonconventional markers of sepsis
cadavers recovering from acute renal failure; p<0.05) (28). However the appearance of actin in urine has not been clarified, u-ACT excretion may reflect overall cellular damage in the kid-neys, thus it might provide novel possibility for early diagnosis of AKI, which is the most severe complication of sepsis.
ACTIN-BINDING PROTEINS
In order to protect the body from overwhelming actin toxicity, there are two major extracellular actin-binding proteins called gelsolin (GSN) and Gc-globulin (group specific component, also called vitamin D-binding protein) (Figure 3). Both plasma proteins are essential actin scavengers working in concert. GSN severs and depolymerizes actin filaments originating from disrupted cells, and Gc-globulin frees GSN from actin monomers and sequesters them. The bound actin filaments and monomers are finally cleared from the circulation by the reticulo-endothelial system (31). Furthermore, both GSN and Gc-globulin could modulate inflammatory processes. Under physiological conditions, the
concentration of actin in the blood is far less than that of actin binding proteins. Interestingly, in case of severe systemic inflammation, due to excessive tissue injury the excessive amount of extracellular actin and the pro-inflammatory mediators exceed the binding capacity of the scavenger proteins, so the plasma concentration of these drops significantly (25). Both actin-binding proteins are cleared from the circulation by the reticulo-endothelial system, however urinary levels of them are also studied (31).
GELSOLIN
Gelsolin is a ubiquitous, multifunctional protein. Three different isoforms exist in humans, two cytoplasmic forms and one circulatory isoform (32). Circulatory GSN is mainly secreted by mus-cle tissue (26). Circulatory GSN is a 93 kDa Ca2+-dependent protein and its plasma values range between 190-300mg/L (but these are highly method-dependent) (31,32). Besides actin, plas-ma GSN may also be able to bind to bioactive molecules (lysophosphatidic acid, sphingosine 1-phosphate, fibronectin and platelet activating
Figure 2 Serum and urinary actin levels in septic patients
Based on (26), (27).
eJIFCC2017Vol28No2pp122-133Page 127
Péter Kustán, Zoltán Horváth-Szalai, Diána MühlNonconventional markers of sepsis
factor), pro-inflammatory mediators and bac-terial wall components (lipoteichoic acid and lipopolysaccharides).
In follow-up studies, first-day GSN levels were proven to have a significant distinguishing abil-ity regarding the septic and the non-septic states furthermore, GSN also predicted the outcome of sepsis (26, 34-36). Non-survivor septic patients showed lower levels of serum GSN (Figure 4). Recently, our research group introduced a new promising marker besides GSN, the serum actin/GSN ratio (derived from the same patients’ ac-tin and GSN levels) which had similar prognostic value as APACHE II clinical scores regarding inten-sive care unit mortality (26). One limiting factor is the lack of a rapid detection method for actin and GSN, which is the current focus of our research.
Higher plasma GSN levels seem to have good prog-nostic value in sepsis, moreover the protective role
of GSN have been proven by administration of ex-ogenous gelsolin to rodents with septicemia and severe injury yielding reduction in mortality (37).
Studies regarding urinary GSN (u-GSN) levels in sepsis have been scarcely performed. Ferreia et al. (38) described u-GSN as a discriminating protein regarding cisplatin- and gentamicin-induced AKI in rats. Another study of Maddens et al. (39) reported increased u-GSN levels in septic mice. Both of these observations based on Western blot analyses indicated that u-GSN originates from the blood by glomerular filtra-tion. In addition, u-GSN seems to be a possible diagnostic marker in patients suffering from type I diabetes mellitus (40). Interestingly, de-creased u-GSN levels were found in rheumatoid arthritis patients (41), however they did not offer any predictive value. So far, all studies re-garding u-GSN are promising starting points and should be further validated.
Figure 3 Crystal structures of calcium-free human gelsolin and that of uncomplexed Gc-globulin
A: GSN consists of six domains (G1-G6) indicated by different colors. In the Ca-free, inactive form of GSN, the six similarly folded domains adopt a compact globular structure held together by extensive noncovalent interactions of G2 with both G6 and the C-terminal tail (29).B: Gc-globulin is built up of 3 three homologous α-helical domains. Domains I and II can be subdivided further into two structurally related subdomains (30).
eJIFCC2017Vol28No2pp122-133Page 128
Péter Kustán, Zoltán Horváth-Szalai, Diána MühlNonconventional markers of sepsis
GC-GLOBULIN
Plasma Gc-globulin (52 - 59 kDa) is a member of the albuminoid superfamily. Gc-globulin is mainly produced by the liver (serum level: 300-600 mg/L) owning 3 major isoforms (Gc1f, Gc1s, Gc2) (42). Gc-globulin seems to act as an acute-phase protein after injury. Also, important func-tion of Gc-globulin is binding and transporting 25-OH-D and 1,25-(OH)2D3 vitamin metabolites. Furthermore it enhances neutrophil chemotax-is and could modulate T cell responses (42).
Admission plasma concentration of Gc-globulin below 134 mg/L (determined by immune neph-elometry) was found to be associated with organ dysfunction (hematologic or respiratory failure) and sepsis after traumatic injury (43). Jeng et al. found an association between critical illness and lower 25-OH-D and Gc-globulin levels in critically ill patients when compared to healthy controls (44).
Gc-globulin is filtered freely through the glom-eruli because of its low molecular weight. In the kidney, Gc-globulin is involved in the vitamin D biosynthesis process. Under normal circum-stances, Gc-globulin is reabsorbed and catabo-lized by proximal tubular epithelial cells resulting only in a trace urinary excretion (42). Therefore, acute tubular injury is expected to result in exag-gerated urinary Gc-globulin excretion. Recently, urinary Gc-globulin (u-Gc-globulin) was report-ed as a promising novel biomarker of major contrast material induced nephropathy-asso-ciated events (u-Gc-globulin/u-Cr in patients developing major adverse renal events (MARE) vs. those without MARE were 125.68 ± 211.62 vs. 14.99 ± 38.10 ng/ml/mmol/l; p<0.001) (45). Shoukry et al. have determined increased u-Gc-globulin levels by ELISA in diabetic patients as an early diagnostic marker of diabetic ne-phropathy. Urinary Gc-globulin/u-Cr levels were
Figure 4 A: First-day serum GSN levels in septic survivor and non-survivor patients based on 7-day mortality
B: Receiver operating characteristic curve of serum GSN for predicting 7-day mortality of sepsis
AUC: 0.74, cut-off value: 11.38 mg/L (sensitivity: 76.2%, specificity: 72.7%). Based on (26).
eJIFCC2017Vol28No2pp122-133Page 129
Péter Kustán, Zoltán Horváth-Szalai, Diána MühlNonconventional markers of sepsis
more than 10 times higher in macroalbuminuric patients compared to controls (1516.3 ± 228.6 ng/mg vs. 123.4 ± 28.2 ng/mg; p<0.001) (46). Investigating the association between sepsis-induced acute kidney injury and Gc-globulin in urine still remains an interesting challenge.
OROSOMUCOID
Orosomucoid (ORM) or α-1-acid glycoprotein is a positive acute phase protein. ORM is a 41-43kDa heavily glycosylated protein (Figure 5) with sev-eral transport and immunomodulatory function (47). ORM has been described as part of the non-specific defense system against excessive inflam-matory response (48). ORM has anti-neutrophil and anti-complement activity, it can inhibit apop-tosis, macrophage activation, lymphocyte pro-liferation, superoxide generation, and platelet aggregation as well (49). Its protective role was
demonstrated also in several rodent models of shock, inflammation and sepsis (50-52).
The normal orosomucoid concentration in hu-man serum ranges between 0.5-1.2 g/L and it can rise during acute and chronic inflammatory diseases (53). In spite of the well-known fact that serum orosomucoid (se-ORM) is a non-specific inflammatory marker, recently it has been de-scribed as a potential diagnostic and prognostic biomarker of sepsis. Significantly higher levels were found in sepsis than in SIRS and admission se-ORM levels showed a good prognostic accu-racy for sepsis mortality if combined with SOFA score (AUC ROC: 0.878) (54).
ORM is also present in urine, but with much lower concentrations than in serum, normally ORM accounts for about 1-5 % of total proteins in urine (<3 mg/L) (55, 56). Previous stud-ies described slightly elevated u-ORM levels in
Figure 5 Crystal structure of human orosomucoid (alpha1-acid glycoprotein)
ORM contains a typical lipocalin fold with an eight-stranded beta-barrel. This structure is responsible for diverse ligand-binding. Furthermore, ORM structure contains five N-linked glycosylation sites (47).
eJIFCC2017Vol28No2pp122-133Page 130
Péter Kustán, Zoltán Horváth-Szalai, Diána MühlNonconventional markers of sepsis
Figure 6 Serum orosomucoid (A) and urinary orosomucoid (B) levels in sepsis
diseases associated with chronic inflamma-tory activation, like autoimmune diseases, diabetes mellitus and cancer (57-60). U-ORM excretion can be elevated after acute inflam-matory stimuli as well. Recently published data suggest that u-ORM could be a promising non-invasive marker for diagnosis of sepsis (61). About 100-times higher levels were found in sepsis than in controls, and SIRS pa-tients showed 10-fold higher u-ORM levels than controls. U-ORM was referred to urinary creati-nine levels and a cut off value at 6.75 mg/mmol with great sensitivity and specificity (94.7% and 90.0%, respectively) has been described for di-agnosis of sepsis. The diagnostic accuracy of u-ORM for sepsis (AUC ROC: 0.954) was similar to PCT and higher than se-ORM. Furthermore, u-ORM levels correlated well with conventional in-flammatory parameters. In this study, extremely elevated u-ORM levels were found in septic pa-tients with dialysis requirement (61). Another paper demonstrated u-ORM above 40 mg/L as an early predictor for acute kidney injury af-ter cardiac surgery in children (AUC ROC 0.87).
U-ORM values were found to be strongly associ-ated with severity of AKI (62).
In spite of the promising data, the exact mecha-nism of u-ORM elevation is not well explored. Local renal processes due to systemic inflamma-tion could play a crucial role, since extrahepatic gene expression of ORM (leukocytes, endothe-lial cells, kidney, etc.) has been described (63). Furthermore, glomerular and tubular dysfunc-tion also may have a pivotal part.
U-ORM seems to be a more sensitive marker of sepsis than se-ORM (Figure 6), providing clini-cally relevant information for real-time moni-toring of inflammatory activation in a non-inva-sive manner.
CONCLUSION
The outcome of sepsis largely depends on early diagnosis and the earliest possible beginning of a consecutive adequate antibiotic therapy. For definitive diagnosis, identification of pathogens is still the gold standard however this approach quite often requires several hours or days lead-ing to a delay in decision making.
Urinary orosomucoid levels are referred to urinary creatinine and expressed in mg/mmol. Based on (61).
eJIFCC2017Vol28No2pp122-133Page 131
Péter Kustán, Zoltán Horváth-Szalai, Diána MühlNonconventional markers of sepsis
Therefore, measurement of fast responding protein biomarkers of sepsis has gained a major focus in the last decades. Unfortunately, most of the protein biomarkers do not have proper specificity even if they possess better sensitivi-ty. For the assessment of overall tissue damage, monitoring of the actin-scavenger system is a promising new entity. Urinary markers provide a non-invasive tool for real-time monitoring of septic processes. Orosomucoid determination in urine might be a novel possibility for the ear-ly recognition of systemic inflammation. Since sepsis is a heterogeneous clinical syndrome and not a definitive disease a single marker alone should never be satisfactory. Multi-marker ap-proach and complex evaluation of the clinical signs and biomarkers should improve patient management at the bedside.
REFERENCES
1. Angus DC, van der Poll T. Severe sepsis and septic shock. N Engl J Med. 2013;369(9):840-51.
2. Dellinger RP, Levy MM, Rhodes A, Annane D, Gerlach H, Opal SM, et al. Surviving sepsis campaign: international guidelines for management of severe sepsis and septic shock: 2012. Crit Care Med. 2013;41(2):580-637.
3. Levy MM, Artigas A, Phillips GS, Rhodes A, Beale R, Os-born T, et al. Outcomes of the Surviving Sepsis Campaign in intensive care units in the USA and Europe: a prospective cohort study. The Lancet Infect Dis. 2012;12(12):919-24.
4. Singer M, Deutschman CS, Seymour CW, Shankar-Hari M, Annane D, Bauer M, et al. The Third International Con-sensus Definitions for Sepsis and Septic Shock (Sepsis-3). JAMA. 2016;315(8):801-10.
5. Lebovitz EE, Burbelo PD. Commercial multiplex tech-nologies for the microbiological diagnosis of sepsis. Mol Diagn Ther. 2013;17(4):221-31.
6. Pierrakos C, Vincent JL. Sepsis biomarkers: a review. Crit Care. 2010;14(1):R15.
7. Reinhart K, Bauer M, Riedemann NC, Hartog CS. New approaches to sepsis: molecular diagnostics and biomark-ers. Clin Microbiol Rev. 2012;25(4):609-34.
8. Rhodes A, Evans LE, Alhazzani W, Levy MM, Antonelli M, Ferrer R, et al. Surviving Sepsis Campaign: Internation-al Guidelines for Management of Sepsis and Septic Shock: 2016. Intensive Care Med. 2017;43(3):304-377.
9. Meisner M. Pathobiochemistry and clinical use of pro-calcitonin. Clin Chim Acta 2002; 323(1-2):17-29.
10. Wacker C, Prkno A, Brunkhorst FM, Schlattmann P. Procalcitonin as a diagnostic marker for sepsis: a sys-tematic review and meta-analysis. Lancet Infect Dis. 2013;13(5):426-35.
11. Trasy D, Tanczos K, Nemeth M, Hankovszky P, Lovas A, Mikor A, et al. Early procalcitonin kinetics and appropri-ateness of empirical antimicrobial therapy in critically ill patients: A prospective observational study. J Crit Care. 2016;34:50-5.
12. Trasy D, Tanczos K, Nemeth M, Hankovszky P, Lovas A, Mikor A, et al. Delta Procalcitonin Is a Better Indicator of Infection Than Absolute Procalcitonin Values in Critically Ill Patients: A Prospective Observational Study. J Immunol Res. 2016;2016:3530752.
14. Endo S, Suzuki Y, Takahashi G, Shozushima T, Ishikura H, Murai A, et al. Usefulness of presepsin in the diagnosis of sepsis in a multicenter prospective study. J Infect Che-mother 2012;18(6):891-7.
15. Masson S, Caironi P, Fanizza C, Thomae R, Bernasconi R, Noto A, et al. Circulating presepsin (soluble CD14 sub-type) as a marker of host response in patients with severe sepsis or septic shock: data from the multicenter, random-ized ALBIOS trial. Intensive Care Med. 2015;41(1):12-20.
16. Shozushima T, Takahashi G, Matsumoto N, Kojika M, Okamura Y, Endo S. Usefulness of presepsin (sCD14-ST) measurements as a marker for the diagnosis and sever-ity of sepsis that satisfied diagnostic criteria of systemic inflammatory response syndrome. J Infect Chemother. 2011;17(6): 764–9.
17. Ulla M, Pizzolato E, Lucchiari M, Loiacono M, Soardo F, Forno D, et al. Diagnostic and prognostic value of pre-sepsin in the management of sepsis in the emergency department: a multicenter prospective study. Crit Care. 2013;17(4): R168.
18. Behnes M, Bertsch T, Lepiorz D, Lang S, Trinkmann F, Brueckmann M, et al. Diagnostic and prognostic utility of soluble CD 14 subtype (presepsin) for severe sepsis and septic shock during the first week of intensive care treat-ment. Crit Care. 2014;18(5):507.
19. Nagata T, Yasuda Y, Ando M, Abe T, Katsuno T, Kato S, et al. Clinical impact of kidney function on presepsin levels. PLoS One. 2015;10(6):e0129159.
20. Nakamura Y, Ishikura H, Nishida T, Kawano Y, Yuge R, Ichiki R, et al. Usefulness of presepsin in the diagnosis of sepsis in patients with or without acute kidney injury. BMC Anesthesiol. 2014;14: 88.
eJIFCC2017Vol28No2pp122-133Page 132
Péter Kustán, Zoltán Horváth-Szalai, Diána MühlNonconventional markers of sepsis
21. Wang H, Robinson RC, Burtnick LD. The structure of native G-actin. Cytoskeleton (Hoboken). 2010;67(7):456-65. PDB ID:3HBT
22. Reisler E, Egelman EH. Actin structure and func-tion: what we still do not understand. J Biol Chem. 2007;282(50):36133-7.
23. Erukhimov JA, Tang ZL, Johnson BA, Donahoe MP, Raz-zack JA, Gibson KF, et al. Actin-containing sera from pa-tients with adult respiratory distress syndrome are toxic to sheep pulmonary endothelial cells. Am J Respir Crit Care Med. 2000;162(1):288-94.
24. Lee PS, Patel SR, Christiani DC, Christiani DC, Bajwa E, Stossel TP, Waxman AB. Plasma gelsolin depletion and circulating actin in sepsis: a pilot study. PLoS ONE, 2008;3(11):e3712
25. Lee WM, Galbraith RM. The extracellular actin-scavenger system and actin toxicity. N Engl J Med. 1992;326(20):1335-41.
26. Horváth-Szalai Z, Kustán P, Mühl D, Ludány A, Bugyi B, Kőszegi T. Antagonistic sepsis markers: Serum gelsolin and actin/gelsolin ratio. Clin Biochem. 2017;50(3):127-133.
27. Kustan P, Szirmay B, Horvath-Szalai Z, Ragan D, Ludany A, Mühl D, Koszegi T. Monitoring of novel urinary protein markers in sepsis. Clin Chem Lab Med. 2016;54(10):eA324.
28. Kwon O, Molitoris BA, Pescovitz M, Kelly KJ. Urinary actin, interleukin-6, and interleukin-8 may predict sus-tained ARF after ischemic injury in renal allografts. Am J Kidney Dis. 2003;41(5):1074-87.
29. Nag S, Ma Q, Wang H, Chumnarnsilpa S, Lee WL, Lars-son M, et al. Ca2+ binding by domain 2 plays a critical role in the activation and stabilization of gelsolin. Proc Natl Acad Sci U S A. 2009;106(33):13713-8. PDB ID: 3FFN
30. Otterbein LR, Cosio C, Graceffa P, Dominguez R. Crys-tal structures of the vitamin D-binding protein and its complex with actin: structural basis of the actin-scaven-ger system. Proc Natl Acad Sci U S A. 2002;99(12):8003-8. PDB ID: 1KW2
31. Li GH, Arora PD, Chen Y, McCulloch CA, Liu P. Multi-functional roles of gelsolin in health and diseases. Med Res Rev. 2012;32(5):999-1025.
32. Kwiatkowski DJ, Stossel TP, Orkin SH, Mole JE, Colten HR, Yin HL. Plasma and cytoplasmic gelsolins are encoded by a single gene and contain a duplicated actin-binding domain. Nature. 1986;323(6087):455-8.
33. Vouyiouklis DA, Brophy PJ. A novel gelsolin isoform expressed by oligodendrocytes in the central nervous sys-tem. J Neurochem. 1997;69(3):995-1005.
34. Wang H, Cheng B, Chen Q, Wu S, Lv C, Xie G, et al. Time course of plasma gelsolin concentrations during
severe sepsis in critically ill surgical patients. Crit Care. 2008;12(4):R106.
35. Lee PS, Drager LR, Stossel TP, Moore FD, Rogers SO. Relationship of plasma gelsolin levels to outcomes in criti-cally ill surgical patients. Ann Surg. 2006;243(3):399-403.
36. Lee PS, Patel SR, Christiani DC, Bajwa E, Stossel TP, Waxman AB. Plasma gelsolin depletion and circulating actin in sepsis: a pilot study. PLoS One. 2008;3(11):e3712.
37. Lee PS, Waxman AB, Cotich KL, Chung SW, Perrella MA, Stossel TP. Plasma gelsolin is a marker and therapeutic agent in animal sepsis. Crit Care Med 2007; 35:849-855.
38. Ferreira L, Quiros Y, Sancho-Martínez SM, García-Sán-chez O, Raposo C, López-Novoa JM, et al. Urinary levels of regenerating islet-derived protein III β and gelsolin differ-entiate gentamicin from cisplatin-induced acute kidney injury in rats. Kidney Int. 2011;79(5):518-28.
39. Maddens B, Ghesquière B, Vanholder R, Demon D, Van-massenhove J, Gevaert K, Meyer E. Chitinase-like proteins are candidate biomarkers for sepsis-induced acute kidney injury. Mol Cell Proteomics. 2012;11(6):M111.013094.
40. Caseiro A, Barros A, Ferreira R, Padrão A, Aroso M, Quintaneiro C, et al. Pursuing type 1 diabetes mellitus and related complications through urinary proteomics. Transl Res. 2014;163(3):188-99.
41. Park YJ, Yoo SA, Hwang D, Cho CS, Kim WU. Identifi-cation of novel urinary biomarkers for assessing disease activity and prognosis of rheumatoid arthritis. Exp Mol Med. 2016;48:e211.
42. Delanghe JR, Speeckaert R, Speeckaert MM. Behind the scenes of vitamin D binding protein: more than vi-tamin D binding. Best Pract Res Clin Endocrinol Metab. 2015;29(5):773-86.
43. Dahl B, Schiødt FV, Ott P, Wians F, Lee WM, Balko J, O’Keefe GE. Plasma concentration of Gc-globulin is asso-ciated with organ dysfunction and sepsis after injury. Crit Care Med. 2003;31(1):152-6.
44. Jeng L, Yamshchikov AV, Judd SE, Blumberg HM, Mar-tin GS, Ziegler TR, Tangpricha V. Alterations in vitamin D status and anti-microbial peptide levels in patients in the intensive care unit with sepsis. J Transl Med. 2009;7:28.
45. Chaykovska L, Heunisch F, von Einem G, Alter ML, Hocher CF, Tsuprykov O, et al. Urinary Vitamin D Binding Protein and KIM-1 Are Potent New Biomarkers of Major Adverse Renal Events in Patients Undergoing Coronary Angiography. PLoS One. 2016;11(1):e0145723.
46. Shoukry A, Bdeer Sel-A, El-Sokkary RH. Urinary mono-cyte chemoattractant protein-1 and vitamin D-binding protein as biomarkers for early detection of diabetic ne-phropathy in type 2 diabetes mellitus. Mol Cell Biochem. 2015;408(1-2):25-35.
eJIFCC2017Vol28No2pp122-133Page 133
Péter Kustán, Zoltán Horváth-Szalai, Diána MühlNonconventional markers of sepsis
47. Schonfeld DL, Ravelli RB, Mueller U, Skerra A. The 1.8-A crystal structure of alpha1-acid glycoprotein (Oro-somucoid) solved by UV RIP reveals the broad drug-bind-ing activity of this human plasma lipocalin. J Mol Biol. 2008;384(2):393-405. PDB ID: 3KQ0
48. Logdberg L, Wester L. Immunocalins: a lipocalin sub-family that modulates immune and inflammatory re-sponses. Biochim Biophys Acta. 2000;1482(1-2):284-97.
49. Hochepied T, Berger FG, Baumann H, Libert C. Alpha(1)-acid glycoprotein: an acute phase protein with inflammatory and immunomodulating properties. Cyto-kine Growth Factor Rev. 2003;14(1):25-34.
50. Hochepied T, Van Molle W, Berger FG, Baumann H, Lib-ert C. Involvement of the acute phase protein alpha 1-acid glycoprotein in nonspecific resistance to a lethal gram-negative infection. J Biol Chem. 2000;275(20):14903-9.
51. Muchitsch EM, Auer W, Pichler L. Effects of alpha 1-acid glycoprotein in different rodent models of shock. Fundam Clin Pharmacol. 1998;12(2):173-81.
52. Hjalmarsson C, Lidell ME, Haraldsson B. Beneficial ef-fects of orosomucoid on the glomerular barrier in puro-mycin aminonucleoside-induced nephrosis. Nephrol Dial Transplant. 2006;21(5):1223-30.
53. Ceciliani F, Pocacqua V. The acute phase protein al-pha1-acid glycoprotein: a model for altered glycosylation during diseases. Curr Protein Pept Sci. 2007;8(1):91-108.
54. Li F, Yu Z, Chen P, Lin G, Li T, Hou L, et al. The increased excretion of urinary orosomucoid 1 as a useful biomarker for bladder cancer. Am J Cancer Res. 2016;6(2):331-40.
55. Tencer J, Thysell H, Grubb A. Analysis of proteinuria: reference limits for urine excretion of albumin, protein HC, immunoglobulin G, kappa- and lambda-immunoreac-tivity, orosomucoid and alpha 1-antitrypsin. Scand J Clin Lab Invest. 1996;56(8):691-700.
56. Kustán P, Szirmay B, Horváth-Szalai Z, Ludány A, Laka-tos Á, Mühl D, et al. Urinary orosomucoid: validation of an automated immune turbidimetric test and its possible clinical use. Biochem Med (Zagreb). 2016:421-30.
57. Park YJ, Yoo SA, Hwang D, Cho CS, Kim WU. Identifi-cation of novel urinary biomarkers for assessing disease activity and prognosis of rheumatoid arthritis. Exp Mol Med. 2016;48:e211.
58. Svendstrup M, Christiansen MS, Magid E, Hommel E, Feldt-Rasmussen B. Increased orosomucoid in urine is an independent predictor of cardiovascular and all-cause mortality in patients with type 2 diabetes at 10 years of follow-up. J Diabetes Complications. 2013;27(6):570-5.
59. Christiansen MS, Hommel E, Friberg L, Molvig J, Mag-id E, Feldt-Rasmussen B. Increased urinary orosomucoid excretion is not related to impaired renal function in pa-tients with type 2 diabetes. J Diabetes Complications. 2010;24(1):28-36.
60. Irmak S, Tilki D, Heukeshoven J, Oliveira-Ferrer L, Friedrich M, Huland H, et al. Stage-dependent increase of orosomucoid and zinc-alpha2-glycoprotein in urinary bladder cancer. Proteomics. 2005;5(16):4296-304.
61. Kustán P, Szirmay B, Horváth-Szalai Z, Ludány A, Kovács GL, Miseta A, et al. Urinary orosomucoid: a novel, early biomarker of sepsis with promising diagnostic per-formance. Clin Chem Lab Med. 2017;55(2):299-307
62. Devarajan P, Krawczeski CD, Nguyen MT, Kathman T, Wang Z, Parikh CR. Proteomic identification of early bio-markers of acute kidney injury after cardiac surgery in children. Am J Kidney Dis. 2010;56(4):632-42.
In this issue: Advances in the diagnosis of sepsis
Advances in the diagnosis of sepsis: hydrogen sulfide as a prognostic marker of septic shock severityMiha Košir1, Matej Podbregar2,3
1 Emergency Department, University Medical Centre Ljubljana, Slovenia
2 Clinical Department for Anaesthesiology and Surgical Intensive Care, University Medical Centre Ljubljana, Slovenia3 Faculty of Medicine, University of Ljubljana, Slovenia
A R T I C L E I N F O A B S T R A C T
Hydrogen sulfide (H2S) is a third known gasotransmit-ter. Most of the time it was knows as a poisonous gas. In last 30 years, we are seeing change in its perception. Scientists have discovered its major role in different or-gan systems. It is endogenously produced in various tis-sues and its production is influenced by many factors. In normal, physiological conditions only 20% of H2S is in its free form. The role of H2S is very wide. It acts as a signaling molecule, has influence on vascular tone, in-flammatory response, scavenges reactive oxygen spe-cies, can be cytoprotective and can even reduce the extent of myocardial ischemia. Different studies have shown H2S has considerable influence in pathology of sepsis and its outcome. High free plasma levels of H2S are predictor of unfavorable outcome. Findings show that moderate free plasma levels of H2S have protec-tive effect. Paradoxical very low free plasma levels of H2S, seen in patients with chronic heart failure, are also predictor of severity of disease and poor outcome. We presume that relationship between morbidity/mor-tality and concentration of H2S has a wide U-shape curve dependence. New researches with discovery of H2S agonists and antagonists could open new ways in understanding different pathologies and ability to
Corresponding author:Prof. Matej PodbregarClinical Department for Anaesthesiology and Surgical Intensive CareUniversity Medical Centre LjubljanaLjubljana, SloveniaPhone: +38 64 021 5960E-mail: [email protected]
Miha Košir, Matej PodbregarAdvances in the diagnosis of sepsis: hydrogen sulfide as a prognostic marker of septic shock severity
treat them. Recent advances in the identifica-tion of H2S agonists and antagonists may help in forwarding our understanding of pathomecha-nisms and hence their treatment.
INTRODUCTION
Hydrogen sulfide (H2S) is a long-known substance. In normal conditions, it is a gas with a very characteristic odor of rotten eggs (1,2). In the 16th century it was the cause to eye inflamma-tion and bacterial infection in sewer workers. The toxic effect of H2S is in its ability to bind to cytochrome C oxidase. As such, inhibiting the mi-tochondrial respiratory chain and consequently inhibiting cell energy production. A change in perspection came in 1989, when H2S was detect-ed in mammalian brain. At the end of the cen-tury it was discovered that hydrogen sulfide has ability to modulate vascular tone, neuronal func-tion and also has cryoprotective abilities during ischemia (3). With these discoveries, the hydro-gen sulfide, beside nitric oxide (NO) and carbon monoxide (CO), became a member of so called gasotransmitters (4). In the last decade, numer-ous studies have investigated the role of H2S at different diseases, ranging from chronic heart failure to different types of shock. In one of this studies, Goslar and colleagues demonstrated that total plasma sulfide is a marker of shock se-verity in non-surgical, critically ill adult patients admitted into the medical ICU (5). Other animal and human studies confirm their findings.
ENDOGENOUS PRODUCTION AND METABOLISM OF H2S
To date we know four different pathways of H2S production (Figure 1). Two of them are pyridoxal 5’-phosphate (vitamin B6) dependent enzymatic pathway with cystathionine β-synthase (CBS) and cystathionine γ-lyse (CSE). The substrate in both cases is L-cysteine (6). CBS is the main
H2S synthase in the nervous system, but is also present in kidney, liver, brain, ileum, uterus, pla-centa and pancreatic islets. The production of H2S is suppressed by NO and CO and enhanced via CSB by S-adenosyl methionine. CSE is widely present in different peripheral organs (kidney, liver, thoracic part of aorta, ileum, portal vein, uterus, pancreatic islets, placenta), but it was not detected in the brain. The activity of CSE is regulated by concentration of Ca2+ (7).
The third pathway consists of two enzymes, cys-teine aminotransferase (CAT – aspartate amino-transferase) and 3-mercaptopyruvate sulfur-transferase (3-MST). This way of producing H2S is present mainly in mitochondria. The base in-gredient is L-cysteine. The activity of both en-zymes is presumed to be suppressed under oxi-dative stress conditions, like in mitochondria. Other way to regulate the production of H2S via CAT/3-MST is with Ca2+ ions. In the absence of Ca2+ the production of H2S is maximal and low-ered in concentration depended manner (6,7).
The fourth way of H2S synthesis is synthesis from D-cysteine via D-aminoacid oxidase (DAO) and 3-MST. This is happening in kidney and cerebel-lum. D-cysteine is not endogenous produced mol-ecule and can be only provided from food – exog-enous pathway. Because of this, it is thought, that D-cysteine has a therapeutic potential to increase H2S production in cerebellum and kidney (6,7).
As already mentioned H2S can stop (inhibit) mitochondrial respiratory chain by inhibiting cytochrome c oxidase. This happens when H2S concentration is high. Similar happens with NO, CO and cyanide. On the other side, it is very in-teresting that it can also be enzymatically me-tabolized in mitochondria and as that can be a source for generating ATP. This can only happen in very low concentrations (less than 10 μM) of H2S. In that conditions, it also increases mito-chondrial O2 consumption and ATP production. High concentrations have opposite effect (6).
eJIFCC2017Vol28No2pp134-141Page 136
Miha Košir, Matej PodbregarAdvances in the diagnosis of sepsis: hydrogen sulfide as a prognostic marker of septic shock severity
PHYSIOLOGICAL ROLE OF H2S
Hydrogen sulfide is known to have a large number of pharmacological effects in various cell types and tissues. Its effect mostly depends on plasma level of H2S. Higher plasma levels have pros and cons, which will be described in following lines.
Also, low levels, below than normal present in healthy individual, can indirectly predict increased morbidity and mortality. This was shown in study by Kovačić and colleagues where they have dem-onstrated that total plasma sulfide in patients with chronic heart failure (CHF) vary with NYHA stages.
Figure 1 Pathways of endogenous production of H2S (simplified scheme)
eJIFCC2017Vol28No2pp134-141Page 137
Miha Košir, Matej PodbregarAdvances in the diagnosis of sepsis: hydrogen sulfide as a prognostic marker of septic shock severity
Lowest sulfide levels were present in NYHA class IV (2.67 [2.22-4.31] μM) compared to NYHA class II (5.84 [4.33-8.00] μM), along with negative cor-relation with pro-BNP and pulmonary artery systolic pressure (8). High levels are often associ-ated with cytotoxic mechanisms, which are asso-ciated with generation of free radicals, depletion of glutation, release of intracellular iron and pro-apoptotic actions (8,9). Based on different data we can assume, that morbidity/mortality, among other factors, depends also on plasma concen-tration of hydrogen sulfide. Correlation can be il-lustrated with wide U shape curve (Figure 2).
Because of the topic of the article we will focus on the cytoprotective and vascular effects (dys-function). This is crucial to understanding the H2S effect during septic shock.
Cytoprotective effect
Evidence shows that H2S has wide cytoprotec-tive effect in various tissues and organs. Low levels of H2S are presumed to exert antiapoptot-ic and antinecrotic mechanisms (9). In nervous system, it increases the levels of glutathione (a major intracellular antioxidant) and, as such, protects cells from oxidative stress. Similar ef-fect is seen in kidney and heart (7). During heart ischemia the energy levels drop. Because there is lack of oxygen the anaerobic respiration starts and lactic acid starts to accumulate. The consequence is reduction of intracellular pH (10). Na/K-ATPase cannot function and there is accumulation of sodium in the cell. This leads to reversal of Na/Ca antiporter and intracellular and mitochondrial calcium accumulation. At the
CHF: chronic heart failure
Figure 2 Graph presenting allegedly correlation between total plasma sulfide and morbidity/mortality
eJIFCC2017Vol28No2pp134-141Page 138
Miha Košir, Matej PodbregarAdvances in the diagnosis of sepsis: hydrogen sulfide as a prognostic marker of septic shock severity
reperfusion, oxygen delivery restores, but the respiratory chain complexes are in reduced state and a large quantity of reactive oxygen species is observed. All these events lead to promotion of cell death by necrosis (11). With studies where endogenous production of H2S was enhanced or exogenous H2S donors were administered, scientists observed that H2S was successful in attenuating myocardial infarction following ischemic-reperfusion injury, promot-ed angiogenic responses and inhibited fibrosis during heart failure. H2S also acts as a ROS scav-enger (7). A study by Elrod JW et al. from 2007 demonstrated that exogenous administration of H2S or overexpression of CSE, which enhance H2S production, reduced myocardial infarct size and preserved left ventricular function after ischemic-reperfusion injury. H2S can reduce mi-tochondrial respiration to induce a state known as a “suspended-animation” in which cellular respiration and oxygen demand are reduced. Consequently, the oxidative stress is reduced and mitochondrial function is preserved (3).
Vasodilatory effect
Hydrogen sulfide has also vasodilatory effect, which is concentration-dependent. H2S induces the relaxation of vascular smooth muscle via ac-tivation of KATP channels. The consequence is hy-perpolarization of the cell and the effect is relax-ation of the cell (4). Although the effect of H2S is not only dependent on KATP channels. Its function can also be modified by local oxygen concentra-tion (5). High expression of KATP channels leads to vascular dysfunction (hypotension) during sepsis.
One other pathway has also been demonstrated to induce vasodilatation with H2S. H2S can also increase intracellular concentration of cyclic ad-enosine monophosphate (cAMP). This causes activation of protein kinase A and relaxation of smooth muscle (12).
Evidence suggest that there is a synergistic ac-tion of NO and H2S in the modulation of vascular tone (13). H2S can activate nitric oxide synthase located on endothelia (eNOS) and augment NO bioavailability (3). NO donor was shown to increase the expression of CSE and by that in-crease the conversion of L-cysteine to H2S (14).
HYDROGEN SULFIDE AND ITS ROLE IN SEPTIC SHOCK
By definition, since 2016, sepsis is a life-threat-ening organ dysfunction caused by a dysregu-lated host response to infection. Septic shock should be defined as a subset of sepsis in which particularly profound circulatory, cellular, and metabolic abnormalities are associated with a greater risk of mortality than with sepsis alone (15). During this time, many endogenous fac-tors contribute to development of symptoms we usually see in septic patient. There is sub-stantial production of cytokines, eicosanoids, reactive oxygen species and nitrogen species. All this overproduction leads to severe systemic inflammatory response with hypotension and vital organs hypoperfusion and the end result can be multiorgan failure. Secondary to that there is also loss of vascular responses to en-dogenous and exogenous catecholamines.
In 2011, Goslar and colleagues reported that during the state of shock plasma sulfide values are very elevated. Based on our results it can be concluded that total plasma sulfide is equiv-alent to lactate as a predictor of ICU survival. As described above we confirmed the findings that H2S is involved in regulation of vascular tone and the association between plasma H2S concentration and extent of tissue damage. Higher total plasma sulfide was inversely corre-lated with blood pressure and cardiac function. Patients with higher total plasma sulfide during ICU admission had higher mortality compared to patients with lower levels. According to our
eJIFCC2017Vol28No2pp134-141Page 139
Miha Košir, Matej PodbregarAdvances in the diagnosis of sepsis: hydrogen sulfide as a prognostic marker of septic shock severity
findings an increase in total plasma sulfide of 1μM resulted in a 5,8% higher probability of ICU mortality (5). In 2008, Zhang found that en-dogenous production of H2S is time-dependent during sepsis. Over production was only pres-ent in early stages and peaked 4-8 hours after CLP (coecal ligation and puncture) (16).
Correlation between plasma H2S levels and sep-sis was also shown in a different study by Zhang and coworkers, where they showed significant increase in plasma H2S levels in mouse models of LPS (bacterial endotoxin lipopolysaccharide) induced sepsis along with increased CSE gene expression and activity of the enzyme (17). This increase in gene expression, enzymatic activity and consequently H2S levels was re-duced with administration of dexamethasone. Dexamethasone also reduced activity of induc-ible nitric oxide synthase (iNOS) (18).
The importance of H2S in pathogenesis of sepsis is also reported in studies where propargylgly-cine (PAG), a CSE inhibitor, was administered. There was a significant decrease in plasma H2S levels with better survival rates. Furthermore, high H2S levels during sepsis may be responsible for hemodynamic collapse in septic shock (4).
Increased endogenous production of H2S starts in the acute phase of shock. During septic shock, there is also increase of NO levels because of upregulation of iNOS. This higher NO levels can induce CSE expression, which leads to higher H2S levels – a positive feedback loop (4). Further studies are needed to elucidate the role of H2S synthesis, where it may mediate inflammation or an anti-inflammatory mechanism.
Contrary to the data above there are some re-ports which are suggesting that higher (proba-bly moderately high?) H2S levels act as cytopro-tective and may prevent multiorgan failure (4). It is known that H2S acts as a ROS scavenger in vitro. The reduction of oxidative stress can be
result of inactivation of ROS producing enzymes or by direct “rummaging” of ROS (4, 19).
H2S can also act as an endogenous modulator of inflammation. As already described during sepsis there is an increase in H2S production. Inhibition of H2S production decreased system-ic inflammatory response and reduced multi-organ failure in sepsis. Suggesting that H2S has proinflammatory properties (16). Leukocytes and their interaction with endothelium have a main role in pathogenesis of sepsis. Studies utilizing H2S donors (sodium hydrogen sulfide and sodium sulfide) showed reduced infiltra-tion and adherence of leukocytes to the endo-thelium through the activation of KATP channels. H2S donors also reduced edema formation. Suppression of endogenous H2S production have the opposite effect. Suppression can be achieved with NSAID, which reduce expression of CSE (14).
MEASUREMENT OF ENDOGENOUS H2S AND ITS DIFFICULTIES
There are several methods to measure sulfide concentrations in live biological systems – head space gas analysis, derivatization methods (penta fluorobenzyl bromide or N,N-dimethyl-p-phenylenediamine sulfate), spectrophotom-etry, direct measurement in solution with a silver sulfide or polarographic sensor and most recently developed colorimetric system using a silver-embedded Nafion/polyvinylpyrrolidone (PVP) membrane (20, 21). Different methods give very variable results and there is no con-sensus which method is the most accurate and best represent the true value of sulfide in living system. Direct and precise measurement in liv-ing cells and fluids still remains a challenge.
Sulfide is naturally subjected to oxidation, it has lipophilic property, is slightly soluble in wa-ter and acts as a weak acid. Beside free plasma H2S there are also other forms of sulfide in the
eJIFCC2017Vol28No2pp134-141Page 140
Miha Košir, Matej PodbregarAdvances in the diagnosis of sepsis: hydrogen sulfide as a prognostic marker of septic shock severity
body – mostly sulfane sulfur (elemental sulfur, thiosulfate, persulfide, thiosulfonate, polysul-fides, polythionates) and acid-labile sulfur. The latter is mostly present in iron-sulfur clusters in proteins. The level of H2S is also influenced by pH and temperature – at physiological pH and 37°C, around 20% of sulfide is present as H2S, and if the temperature drops to 25°C 40% of sulfide is present as H2S. Main problem today is how to measure the gaseous form of H2S (5, 20, 21). Measurement of plasma H2S is still a chal-lenge and new methods have to be developed.
Most widely used method is indirect measure-ment of H2S in plasma. In this case plasma is mixed with distilled water, trichloroacetic acid, zinc acetate, N,N-dimethyl-p-phenylenediamine sulfate in 7.2 M HCl and FeCl3 in 1.2 M HCl. This results in a blue color reaction – methylene blue formation. The supernatant is then spectropho-tometrically measured. The calibration curve of NaHS (3.125-100 μM) or Na2S (0.699-139.86 μM) are used to calculate the sulfide concentra-tion (5, 16, 21).
A recently developed method enables selec-tive detection of H2S in living cells using a silver embedded Nafion/polyvinylpyrrolidone (PVP) membrane and a colorimetric detection meth-od. Silver and H2S form Ag2S which is brown in color. Then absorbance at 310 nm is measured (22).
With gas chromatography, we are able to detect sulfide at physiological levels, but it can falsely rise sulfide levels by liberating loosely-bound sulfide because of irreversible sulfide binding or shifts in phase transition equilibria (21).
Hartman and Dcona have described a method for direct measuring of H2S. It is based on con-version of profluorescent 8-azidopyrene-1,3,6-trisulfonic acid (N3-PTS) to 8-aminopyrene-1,3,6-trisulfonic acid (APTS) by H2S. Then the fluorescence at 435 nm is measured (23).
CONCLUSION
The knowledge about role of hydrogen sulfide in sepsis is still fragmental. High endogenous (over)production of H2S during sepsis has mul-tiple implications. It contributes to smooth muscle cell dysfunction, which leads to hypo-tension. This causes circulatory failure, myo-cardial dysfunction, organ injury and at the end multi organ failure. Contrary to all negative ef-fect, higher H2S production also has some ben-eficial effects. It improves endothelial function, prevents adhesion of leukocytes and throm-bocytes, stimulates the host defense system. H2S acts as reactive oxygen species scavenger and reduces oxidative stress, preserves mito-chondrial function consequently leading to less apoptotic cells. H2S has U-shaped effects curve; in moderate elevation of H2S production during (early stages of) sepsis can be beneficial in term of host defense and other protective effect; on the other hand, the extensive overproduction has harmful effects.
All physiological stimulations which influence H2S production and maintain a certain level of substance in the tissue are not known. Next step can be discovering and synthesis of H2S ag-onists and antagonists, which will influence the pathogenesis of several diseases where the role of H2S apparently has been implicated.
REFERENCES
1. Szabo C. Hydoregen sulfide and its therapeutic poten-tial. Nac Rev Drug Discov. 2007; 6(11): 917-935.
2. Reiffenstein RJ, Hulbert WC, Roth SH. Toxicology of hy-drogen sulfide. Annu Rev Toxicol. 1992; 32: 109-34.
3. Polhemus DJ, Calvert JW, Butler J, Lefler DJ. The car-dioprotective actions of hydrogen sulfide in acute myo-cardial infarction and heart failure. Scientifica (Cairo). 2014; 2014: 768607. Published online 2014 Jun 22. doi: 10.1155/2014/768607.
4. Coletta C, Szabo C: Potential role of hydrogen sulfide in the pathogenesis of vascular dysfunction in septic shock. Current Vascular Pharmacology. 2013; 11(2): 208-21.
eJIFCC2017Vol28No2pp134-141Page 141
Miha Košir, Matej PodbregarAdvances in the diagnosis of sepsis: hydrogen sulfide as a prognostic marker of septic shock severity
5. Goslar T, Marš T, Podbregar M. Total plasma sulfide as a marker of shock severity in nonsurgical adult pa-tients. Shock. 2011; 36(4): 350-5. doi: 10.1097/SHK. 0b013e31822bcfd0.
6. Bełtowski J. Hydrogen sulfide in pharmacology and medicine - An update. Pharmacol Rep. 2015; 67(3): 647-58. doi: 10.1016/j.pharep.2015.01.005.
7. Kimura H. Signaling Molecules: Hydrogen Sulfide and Polysulfide. Antioxidants & Redox signaling. 2015; 22(5): 362-76. doi: 10.1089/ars.2014.5869
8. Kovačić D, Glavnik N, Marinšek M. Total plasma sulfide in congestive heart failure. Journal of Cardiac Failure. 2012; 18(7): 541-48. doi: 10.1016/j.cardfail.2012.04.011.
9. Jha S, Calvert JW, Duranski MR, Ramachandran A, Lefer DJ. Hydrogen sulfide attenuates hepatic ischemia-reper-fusion injury: role of antioxidant and antiapoptotic signal-ing. Am J Physiol Heart Circ Physiol. 2008; 295(2): 801-6. doi: 10.1152/ajpheart.00377.2008.
12. Kimura H. Hydrogen sulfide induces cyclic AMP and modulates the NMDA receptor. Biochem Biophys Res Commun. 2000; 267:129-33.
13. Coletta C, Papapetropoulos A, Erdelyi K, Olah G, Mó-dis K, Panopoulos P, et al. Hydrogen sulfide and nitric ox-ide are mutually dependent in the regulation of angio-genesis and endothelium dependent vasorelaxation. Proc Natl Acad Sci USA. 2012; 109(23): 9161-6. doi: 10.1073/pnas.1202916109.
14. Zanardo RC, Brancaleone V, Distrutti E, Fiorucci S, Cirino G, Wallace JL. Hydrogen sulfide is an endogenous modulator of leukocyte-mediated inflammation. FASEB J. 2006; 20(12): 2118-20.
15. Singer M, Deutschman CS, Seymour CW, Shankar-Hari M, Annane D, Bauer M, et al. The Third International
Consensus Definitions for Sepsis and Septic Shock (Sepsis-3). JAMA. 2016; 315(8): 801-10. doi:10.1001/jama.2016.0287.
16. Zhang H, Moochhala SM, Bhatia M. Endogenous hy-drogen sulfide regulates inflammatory response by acti-vating the ERK pathway in polymicrobial sepsis. J Immu-nol. 2008; 181(6): 4320-31.
17. Zhang H, Zhi L, Moore PK, Bhatia M. Role of hydro-gen sulfide in cecal ligation and puncture-induced sepsis in the mouse. Am J Physiol Lung Cell Mol Physiol. 2006; 290(6): 1193-201. doi: 10.1152/ajplung.00489.2005
18. Li L, Whiteman M, Moore PK. Dexamethasone in-hibits lipopolysaccharide-induced hydrogen sulfide bio-synthesis in intact cells and in an animal model of endo-toxic shock. J Cell Mol Med. 2009; 13(8B):2684-92. doi: 10.1111/j.1582-4934.2008.00610.x.
19. Suzuki K, Olah G, Modis K, Coletta C, Kulp G, Gerö D, et al. Hydrogen sulfide replacement therapy protects the vascular endothelium in hyperglycemia by preserv-ing mitochondrial function. Proc Natl Acad Sci USA. 2011; 108(33):13829-34. doi: 10.1073/pnas.1105121108.
20. Wintner EA, Deckwerth TL, Langston W, Bengtsson A, Leviten D, Hill P, et al. A monobromobimane-based as-say to measure the pharmacokinetic profile of reactive sulfide species in blood. Br J Pharmacol. 2010; 160(4): 941–57. doi: 10.1111/j.1476-5381.2010.00704.x.
21. Shen X, Kolluru GK, Yuan S, Kevil CG. Measurement of H2S in vivo and in vitro by the monobromobimane meth-od. Methods Enzymol. 2015; 554:31-45. doi: 10.1016/bs.mie.2014.11.039.
22. Ahn YJ, Lee YJ, Lee J, Lee D, Park HK, Lee GJ. Colorimet-ric detection of endogenous hydrogen sulfide production in living cells utilizing silver-embedded polymer mem-brane. Spectrochimica Acta Part A: Molecular and Biomo-lecular Spectroscopy. 2017; 177: 118-24. doi: 10.1016/j.saa.2017.01.040
23. Hartman MCT, Dcona M. A new, highly water-soluble, fluorescent turn-on chemodosimeter for direct measure-ment of hydrogen sulfide in biological fluids. Analyst. 2012; 137(21): 4910-2. doi: 10.1039/c2an35870k.
eJIFCC2017Vol28No2pp142-155Page 142
A validation study of after reconstitution stability of diabetes: level 1 and diabetes level 2 controlsShyamali PalR B Diagnostic Private Limited, Lake Town, Kolkata, India
I N F O A B S T R A C T
Objective
The after reconstitution stability of L1 & L2 is 7 days when stored at 2°-8°c and tightly capped. The total content of the vial is 500 µL and per test requirement is 5 µL. Hence, in 7 days laboratories would consume only 35 µL wasting 365 µL which is 73% of the expen-sive control samples and such wastage should be ide-ally prevented. The study of after reconstitution sta-bility proved the stability of the control samples up to 90 days resulting in proper utilization of L1 & L2.
Materials and methods
The L1 & L2 controls were reconstituted using 500 µL deionized water. The vials were allowed to stand for 5-10 minutes, swirled 8-10 times to maintain the homogeneity. Aliquots of 10 µL were prepared. One aliquot of one control level being used per day, both levels on alternate day. 5 µL control is mixed with 1.5 mL diluent and HbA1c was tested in D10 system by HPLC method. Therefore, 500µL may be utilized up to 45 days approximately provided the extended use of control run is not affecting quality of test results. The minimum number of samples tested by the labora-tory from a single vial is 45 and maximum 46.
Corresponding author:Shyamali PalR B Diagnostic Private LimitedP- 857, Block- B, Lake TownKolkata 700089IndiaE-mail: [email protected]
Key words:HbA1c, six sigma, decision charts, total allowable error, HPLC
Limitation of the study: Involvement of more participant laboratories could produce better scope of assessment of after reconstitution stability. But laboratories using same commercial lot was not available except one laboratory, the data from which has been supplemented.
Ethical issues: The laboratories involved in the study used controls exclusively for validation study. For regular use to validate patient results the manufacturer’s instruction has been followed.
Shyamali PalA validation study of after reconstitution stability of diabetes
Results
Three lots were tested of which one lot has been tested in two laboratories. Mean, SD, CV%, TAE, %Bias, z-score and sigma calculations were done. The medical method decision charts were created for all lots based upon normalized operational specifications which showed excel-lent precision in both control levels. Number of rejections in the study was nil.
Conclusion
The extended use of controls is validated.
Abbreviations (in alphabetical order)
L1: Lyphochek Diabetic control level 1L2: Lyphochek Diabetic control level 2HbA1c: Glycosylated HemoglobinHPLC: High Performance Liquid ChromatographyTAE: Total Allowable Error
INTRODUCTION
The IUPAC technical committee recommended validation study in a single laboratory provided the study is appropriate to the fitness of pur-pose and the validated document is continually verified (1). The recommendation suggested to estimate measurement trueness, recovery and linearity. In the present study, the valida-tion of stability of reconstituted analyte was in question. So, the number of rejections, CV% as an indicator of measurement trueness, %bias and z-score are the parameters to be estimated (2). As the values of the analyte have been pro-vided in the manufacturers insert so TAE may be obtained from the same. In 1974, Westgard, Carey and Wold introduced the concept of TAE to provide a quantitative approach for judging the acceptability of method performance (2)
and on 2009, Clinical and Laboratory Standards Institute (CLSI) published the TAE of all clini-cal chemistry analytes (3). It has been recom-mended to use the CLSI table for TEA or to use 95% confidence interval of the limit of possible analytic error whichever is appropriate/less (4). If the result of reconstituted sample remains within the range provided by manufacturer ap-parently it may be said that the after reconsti-tution period may be extended. To validate the extended stability after reconstitution, Sigma should to be calculated and approved finally from medical method decision chart (5, 6). The medical method decision chart is based on sig-ma calculations and operating point ≥ 5 sigma is the marker of excellence of performance.
MATERIALS AND METHODS
Lyphochek Bilevel Diabetes Controls (L1 &L2) were reconstituted using 0.5 ml deionized wa-ter. Calibrated auto pipette was used for recon-stitution. The stopper was replaced and the control samples were allowed to stand for 5-10 minutes. The vials were gently swirled 8-10 times before preservation in aliquots to main-tain homogeneity. 10 µL reconstituted controls were kept in each aliquot. The aliquots were preserved at 2°C-8°C (7). One aliquot was taken out every day and 5 µL of reconstituted sample was mixed in 1.5 mL diluent. The aliquot was brought to room temperature and swirled be-fore mixing with diluent. The L1 & L2 aliquots were used on alternate day. Hence approxi-mately 45 aliquots of one level control would be consumed in 90 days. Three vials of Lot num-bers 33870, 33890 and 33920 were tested for 90 days generating 135 numbers L1 & L2 data i.e., 135 number results generated per level per lot. Lot 33920 have been tested in two differ-ent laboratories (incidentally common lot was supplied) hence 135 number data of both levels could have been accumulated from two labora-tories. Both level control samples of same lot
eJIFCC2017Vol28No2pp142-155Page 144
Shyamali PalA validation study of after reconstitution stability of diabetes
were reconstituted and aliquoted on the same day and time. HbA1c was measured in BIORAD D10 system by Ion Exchange HPLC method. As the objective was to establish after reconstitu-tion stability of control samples hence method and mode needed to be user specific and wide-ly accepted.
STATISTICAL CALCULATIONS
Statistical calculations were as per the guideline of Westgard et al (4). Mean, SD, CV%, %Bias of every lot have been calculated. Bias is the dif-ference of laboratory mean and Peer group mean. The manufacturer’s mean of Lot 33870 were 5.4% (L1), 9.9 % (L2). The peer mean were 5.38% and 9.79%. The manufacturer’s mean for lot 33890 were 5.3% and 9.8%. Peer mean were 5.48 & 9.79. The manufacturer’s mean for 33920 were 5.4 & 9.8 and peer mean were 5.42% and 9.84% respectively. Peer means were used for statistical calculations as per CLSI guideline and Westgard’s rule. TAE is the percentage of total allowable deviation range. The ratio of manufacturer’s allowable deviation
and manufacturer’s target mean is expressed in % (8). When TAE is more than 20% as per CLSI guideline 20% has been considered as optimum TAE (4). From TAE, %Bias and CV% Sigma is cal-culated (TAE-%Bias/CV%). Method decision charts were plotted on the basis of calculations from Westgard Website.
RESULTS AND DISCUSSION
The after reconstitution stability was tested in three consecutive lots 33870, 33890 & 33920. The bias was calculated considering peer mean as target mean. As per Multi QC rule ± 3SD would be considered as acceptable allowable error (TAE) keeping the option of one day 2-3SD result in the warning range when the laboratory uses its own laboratory mean [8]. In lot 33870 calculated TAE (from peer mean and SD) of L1 was 20.9 and in 33920 both level values were 28.5 and 20. But as per CLSI guideline optimum TAE should be 20% [Table 1]. So, instead 20.9 & 28.5 the TAE was considered to be 20. No result was found to have exceeded ± 2SD. Hence num-ber of rejection/warning range result in three
Table 1 HbA1c Peer results of lots 33870, 33890, 33920
Shyamali PalA validation study of after reconstitution stability of diabetes
lots was zero. The peer mean & SD were con-sidered for TAE calculation as they are narrower than manufacturer’s range (Insert value), based on statistical calculation of worldwide results and system and method specific.
Two lot results showed intra laboratory preci-sion findings. After reconstitution stability of Lot 33870 & 33890 were tested using two L1 & two L2 vials for 90 & 92 days. One aliquot tested on alternated day so 45 aliquots consumed within 90 days and 46 consumed by 92 days. The sigma values were 8.0, 6.3 & 7.3, 5.9 [Tables 2 & 3].
Z-Score calculation is recommended for accu-racy check of internal quality control [9] and in both lots both level z-score are within ± 2 [Tables 2 & 3].
The inter performance testing of one lot has been done in two laboratories with lot no. 33920. Both laboratory tested 3 vials of L1 & L2 for 90 days obtaining total 270 results [Tables 4 & 5]. The sigma values were above 6 and z-scores within limit. The sigma and z-score of all three lots satis-fies the criteria of standard performance.
Table 2 Statistical evaluation of HbA1c values of Lot 33870
*Allowable Bias- Normal Operational Specifications along Y-axis. Calculated as: %Bias*100/TAE (%)*Allowable Imprecision- Normal Operational Specifications along X-axis. Calculated as: CV%*100/TAE (%)N- Number of tests performed Critical error – Calculations obtained from “Quality Control Grid Calculator”. Critical error < ±2.0 shows excellent performance
Shyamali PalA validation study of after reconstitution stability of diabetes
The use of normalized operation specification chart (NOPSPECs) is being done from the early 1990s. The chart describes the operational lim-its for imprecision and inaccuracy with respect to a desired level of quality assurance for the particular analyte [10]. The chart is the medical decision chart to select a QC procedure (11, 12). The idea of the medical decision chart is to ex-press the values on the X and Y axis as % of TAE. The X-axis is plotted as imprecisionmeasure% TAE i.e., percentage of allowable imprecision and Y axis Bias measure% TAE or percentage of allowable bias of the method to be validated (Charts 1-8). The charts may be downloaded from Westgards website. Sigma would be automatically calcu-lated from the input of TAE (%), CV% & % Bias.
The medical decision chart is based on CLSI guideline by Westgard et al where maximum allowable bias is 20% and CV is 10% resulting 2 sigma. Considering allowable Bias measure%TAE 20 the colour codes in the charts showed the less the imprecision (CV %) the higher is the sigma value (2-6, colour codes red –green). The method is validated if sigma is ≥4, good if sigma is ≥5, excellent when sigma is ≥ 6. The sigma op-erating points below 6 are beyond the level of excellence as above 6 sigma no grade has been prescribed yet. Calculations were described be-low Table 2 and followed for all three lots. The operational specification chart for both con-trols in 3 groups were evaluated (Tables 1-5, Charts 1-8). Analytical accuracy for all the assay
Table 4 Statistical evaluation of Lot 33920 (Laboratory 1)
Shyamali PalA validation study of after reconstitution stability of diabetes
performance are within optimum excellence decision range (Charts 1-8). Hence, the diabetic controls may be used for 3 months instead of 7 days after reconstitution.
As per the QC calculator rule critical error up to 2 indicates excellent precision. In the present study, the critical errors of all the lots are < ± 2. The stability of the reconstituted control have satisfactorily passed both operating points and critical error criteria. So, the utilization of diabet-ic controls up to 90 days is acceptable if reconsti-tuted control material is kept in aliquot at 2°-8°C and one aliquot is being used once (13, 14).
CONCLUSION
1. The use of diabetic controls of BIORAD for extended days is validated and veri-fied. The controls may be used for ap-proximately 90 days provided they are preserved properly.
2. The study is having an important practi-cal application value. The laboratory has saved 5-fold expenditure i.e. 1 control in 7 days, hence 6 control vials in 45 days approximately. Such cost saving would be beneficial for the patient care ser-vices as the laboratory would be able to perform HbA1c at a patient beneficial rate. HbA1c is a prognostic marker of diabetes so the aim of the laboratories should be to offer the test at a moder-ate cost.
3. Any waste should be discouraged. The study showed prevention of waste of expensive controls.
REFERENCES1. Thompson M, Stephen L R E, Wood R. Harmonized guidelines for single lab validation of methods of analy-sis (IUPAC technical report). Pure and Applied Chemistry; Vol.74:p.835-55,2009.
2. Westgard J O, Carey R N, Wold S. Criteria for judging precision and accuracy in method development and eval-uation. Clin. Chem; Vol.20: p.825-33, 1974.
3. Clinical and Laboratory Standards Institute (CLSI). Esti-mation of total analysis error for clinical laboratory meth-ods. CLSI EP 21-A-2003.
4. Westgard J O, Westgard S A. Total analytic error dis-cussed in Clinical Laboratory News. Clinical Laboratory News, AACC; Sept.p.8-10, 2013.
5. Dong – Hyun J, Kang Ki-Ju. A method for optimal mate-rial selection aided with decision making theory. Science Direct; Vol.21.p.199-206, 2000.
7. Kit Inserts, BIORAD, Lot numbers 33870, 33890, 33920.
8. Westgard J O, Klee G G. Quality management. Chap-ter16 in Fundamentals of Clinical Chemistry, 4th edition. Burtis C Ed, WB Saunders Company, Philadelphia, 1996, p.211-23.
9. Asian B, Mudjet A, Cevlik T, Bolayrli M, Emerk K. Un-certainty in proficiency testing schemes: KBUDEK experi-ence. Clin. Biochem, vol.42, issue 5, p.321, 2009.
10. Westgard J O. Charts of Operational Process Specifi-cations (OPSpecs charts) for assuring precision, recovery and Quality Control needed to satisfy proficiency testing performance criteria. Clin. Chem. 38/7, p.1226-33, 1992.
11. Westgard J O, Stein B. An automatic process for select-ing statistical QC procedures to assure clinical or analyti-cal quality requirements. Clin .Chem.43, 0. 400-3, 1997.
12. Westgard J O. Six sigma quality design and control: Desirable precision and requisite QC for laboratory mea-surement processes. Madison, Wis: Westgard QC: 2001.
13. Westgard J O. Managing quality vs. measuring uncer-tainty in the medical laboratory. Clin Chem Lab Med.48, p.31-40, 2010.
Chart 8 Method decision chart of L2, 33920 (Laboratory 2)
eJIFCC2017Vol28No2pp156-163Page 156
Case report: A toddler with anasarca caused by congenital nephrotic syndromeTumelo M. Satekge1, Olivia Kiabilua1, Gertruida van Biljon2, Komala Pillay3, Tahir S. Pillay1,4
1 Department of Chemical Pathology1, Faculty of Health Sciences, University of Pretoria and NHLS Tshwane Academic Division, Pretoria, South Africa2 Department of Paediatrics, University of Pretoria and Steve Biko Academic Hospital, South Africa3 Division of Anatomical Pathology, University of Cape Town and Red Cross Children’s Hospital and NHLS, South Africa4 Division of Chemical Pathology, University of Cape Town, South Africa
I N F O A B S T R A C T
Congenital nephrotic syndrome is a rare inherited disorder arising from defects in the proteins of the cells in the glomerular basement membrane and de-velops either in utero or at birth. The clinical presen-tation is the result of massive protein loss in the urine with associated compensatory mechanisms.
Here we present a clinical case of a female toddler with a history of anasarca (severe generalised ede-ma) from birth and who presents with the classical biochemical laboratory findings of nephrotic syn-drome, together with the more pronounced features that arise from protein loss including abnormal thy-roid function testing and a marked hypercholester-olaemia. Renal biopsy indicated congenital nephrotic syndrome of the Finnish type. This clinical-diagnostic case report represents an example of the broad spec-trum of pathophysiological findings of a severe con-genital nephrotic syndrome.
Corresponding author:Prof. Tahir S. PillayDepartment of Chemical Pathology Faculty of Health SciencesUniversity of PretoriaArcadia, Pretoria, 0007South AfricaPhone: 012-319-2114E-mail: [email protected]
TS, OK and TSP conceived the idea and wrote and edited the manuscript. GvB was the paediatrician managing the patient and contributed to the manuscript. KP was the anatomical pathologist who analysed the biopsies and contributed to the manuscript.
Tumelo M. Satekge, Olivia Kiabilua, Gertruida van Biljon, Komala Pillay, Tahir S. PillayA toddler with anasarca caused by congenital nephrotic syndrome
INTRODUCTION
Congenital nephrotic syndrome (CNS)
CNS manifests normally at birth to 3 months of life and is associated with inherited defects in one of the three components of the glomeru-lar basement barrier namely fenestrated endo-thelium, glomerular basement membrane and podocytes (1-3). Mutations in podocytes lead to congenital nephrotic syndrome of the Finnish type (CNS-F) where podocyte foot processes form filtration slits covered by the slit diaphragm (1-4). The responsible NPHS1 gene was the first described and encodes for nephrin, a type - 1 transmembrane protein of the immunoglobulin superfamily and is a pivotal component of the slit diaphragm. Almost 50 mutations so far have been described in the NPHS1 gene and the au-tosomal recessive gene maps to 19q13.1 (4, 5). CNS-F presents with massive non-selective pro-teinuria in utero allowing for prenatal screen-ing (1). Other features include premature birth (35 – 38 weeks) with low birth weight and neo-natal edema as they were present in this case. Other mutations may occur in podocin (NPHS2) and is associated with autosomal recessive, steroid-resistant focal segmental glomerulo-sclerosis (FSGS). Autosomal dominant FSGS can result from TRCP6 and CD2AP mutations caus-ing defects in the podocyte. Also, mutations in Wilms´ tumor suppressor gene can occur in the Denys-Drash syndrome (glomerulopathy in combination with Wilms’ tumor and male pseudohermaphroditism). Although the com-mon histological finding is mesangial sclerosis, this diagnosis was excluded by the absence of ambiguous genitalia and abdominal mass (2, 4).
CASE REPORT
Clinical features
A 15-month-old first-born female toddler pre-sented with a history of generalised body swelling since birth and neurodevelopmental delay. The
first presentation was at 2 weeks after full-term normal vaginal delivery with low birthweight of 2.3 kg. The mother was HIV-positive during preg-nancy and received anti-retroviral drugs. She re-ported unsatisfactory growth of the new-born with motor and speech delay. The child was fed breast milk until 4 months and afterwards with infant formula. On examination, she was below the 3rd percentile for height and weight (weight 6.5 kg; length 64 cm and head circumference 44.5 cm). Despite having Harrison’s sulci, the child was un-distressed with no dysmorphic features. There were generalised edema and hypoplastic teeth. Central nervous system examination re-vealed delayed social and motor milestones with no smile, reaching or sitting and decreased tone and muscle power with normal reflexes. Based on these clinical presentations, congenital ne-phrotic syndrome was suspected and specific laboratory testing was performed and renal bi-opsy was done for immuno-histochemical work-up to establish diagnosis.
Laboratory findings
The urine dipstick resulted with 3+ for proteinuria, no signs of haematuria. Blood testing showed a significant depressed C3 level of 0.638 g/L (reference interval 0.9-1.8 g/L) and hypoalbuminaemia of 2.0 g/L (reference interval 27-43 g/L) indicating nephrotic syndrome (NS). Whole blood count revealed anaemia with haemoglobin of 8.0 g/L and there was thrombocytosis with 656 x 10⁹/L. Plasmatic coagulation tests were found within normal ranges, as well as liver enzymes and renal function testing and electrolytes. Total- and LDL cholesterol levels were markedly increased; TSH and PTH were also significantly elevated together with hypocalcaemia and hyperphosphatemia as outlined in Table 1. Serologic testing for active infections including hepatitis, toxoplasmosis, anti-streptolysin-O titer, cytomegalo virus and syphilis gave negative results, HIV-antibody ELISA was negative and HIV-RNA was not detectable.
eJIFCC2017Vol28No2pp156-163Page 158
Tumelo M. Satekge, Olivia Kiabilua, Gertruida van Biljon, Komala Pillay, Tahir S. PillayA toddler with anasarca caused by congenital nephrotic syndrome
Histological and immunochemical findings
A renal biopsy showed mesangial hypercellular-ity, focal microcystic dilatations of the tubules and a mild interstitial inflammatory infiltrate (Figure 1A). 4+ foot process effacement and in-creased tubular lipid droplets were visualised on electron microscopy. Immunofluorescence displayed focal 1+ IgM mesangial positivity.
Clinical course
After establishing diagnosis, optimal supportive treatment including Enalapril p.o., intravenous albumin, furosemide, low salt intake, high ca-loric- and protein diet were given along with
calcitriol and thyroxine. Poor compliance to thy-roxine contributed to neurodevelopment delay. Treatment was not effective and was hampered by persistent proteinuria.
Unilateral nephrectomy was performed showing massive lymphoplasmocytic inflammatory in-filtrates, focal segmental glomerulosclerosis with microcystic tubular dilatation, hypertensive vascular changes and ascending pyelonephritis (Figure 1B). Unfortunately, renal function dra-matically deteriorated with volume overload, subsequent bacterial peritonitis and the patient died from septic shock.
Figure 1A Renal biopsy histology showing mesangial hypercellularity and focal microcystic dilatations of tubules
A
ig 1
eJIFCC2017Vol28No2pp156-163Page 159
Tumelo M. Satekge, Olivia Kiabilua, Gertruida van Biljon, Komala Pillay, Tahir S. PillayA toddler with anasarca caused by congenital nephrotic syndrome
DISCUSSION
Generalised edema can result from renal dis-ease, liver disease, allergic reactions, cardiac disease, malnutrition or protein-losing enter-opathy. In children, the most common cause is renal disease. First, evaluation can commence with simple tests such as urine dipstick and urine microscopy to identify proteinuria and casts. In our case, edema is a hallmark of NS but the pathogenesis is not fully understood (6, 7). Selective loss of albumin leads to hypoalbumin-emia and decreased capillary oncotic pressure resulting in net fluid flux outwards and renal
losses not compensated with increased albumin production in the liver. Sequestration of fluid in the interstitium triggers renal sodium reabsorp-tion and fluid retention to maintain intravascu-lar volume and blood pressure balanced (the “underfill” hypothesis) (6, 7).
In NS associated with glomerulonephritis the ex-tent of proteinuria is variable and a reduction in GFR is common. Intravascular fluid volume is typ-ically normal or expanded because of inappro-priately stimulated sodium and fluid retention together with decreased GFR results in an “over-fill” state. Distinguishing between these two
Figure 1B Left kidney histology post nephrectomy demonstrating interstitial lymphoplasmocytic inflammatory infiltrates, microcystic dilatations of tubules, fibrosis and tubular atrophy
B
eJIFCC2017Vol28No2pp156-163Page 160
Tumelo M. Satekge, Olivia Kiabilua, Gertruida van Biljon, Komala Pillay, Tahir S. PillayA toddler with anasarca caused by congenital nephrotic syndrome
states is critical to the management of edema in NS. Protein loss in the urine leads to further com-plications including hypogammaglobulinaemia.
In NS, there is increased risk of thromboem-bolism owing to increased pro-coagulants and decreased anticoagulants (urinary loss of anti-thrombin III, plasminogen and protein S) (8). In our patient, we found thrombocytosis which is one of the prothrombotic factors in NS; how-ever the rest of the coagulation profile was un-remarkable and there were no clinical signs of a thromboembolic state. As part of nephrotic syndrome workup to exclude secondary causes, relevant infections particularly in the presence of pre-natal HIV exposure were sought and test-ing was found negative for all pathogens tested.
The markedly elevated total and LDL choles-terol is probably due to over-compensated li-poprotein synthesis for reduced plasma oncotic pressure due to depleted albumin (9). This is associated with an increased risk of cardiovas-cular events (9). The hypothyroid state in the nephrotic syndrome could also be a contribu-tory factor to the hypercholesterolemia. The elevation of Apo B containing lipoproteins is a prominent feature in nephrotic syndrome and in severe cases is accompanied by hypertriglyc-eridemia (9). Thyroid hormone alterations in Congenital Nephrotic syndrome of the Finnish type (CNS-F) without renal impairment are well documented (10). Thyroid binding globulin is lost with proteinuria leading to low total T4 and T3. Correspondingly, free thyroid hormones are expected to be normal or even elevated with normal TSH. In severe CNS-F, as in this case, FT4 is lost in urine proportionally with massive pro-teinuria without commensurate compensation by the thyroid gland. This in turn stimulates the hypothalamic-pituitary axis as demonstrated by high elevated TSH (10). Low FT3 in this case can be explained by the catabolic nature of NS as a non-thyroidal illness characterised by impaired peripheral conversion of T4 to T3.
There was persistent hypocalcaemia with no other overt signs of rickets. She had poor neu-rodevelopment including motor milestones, Harrison sulci and hypoplastic teeth. Vitamin D-binding protein loss is a likely cause for calcidiol depletion owing to its greater affin-ity for 25OHD3. However, 1.25(OH)2D3 and 24,25(OH)2D3 can also be low in patients with nephrotic syndrome without renal impairment (11). This can be explained by depletion of the precursor in the form of 25-OHD3 and to a lesser extent to loss of binding protein in severe cases. Tubular damage as a result of exceeded reab-sorption of filtered protein can lead to destabi-lisation of 1α-hydroxylase resulting in low cal-citriol level (11). It has been hypothesized that corrected total calcium overestimates hypocal-cemia; this was also evident in our case (Table 1). Ionised calcium and vitamin D metabolites were unfortunately not measured. Depleted to-tal calcium was associated with an elevated PTH on more than two occasions (Table 1) indicative of secondary hyperparathyroidism leading to bone demineralization (11).
The histology was typical of CNS-F where immu-nofluorescence did not detect immune depos-its. Microcystic changes of proximal and distal tubules are common findings in CNS of Finnish type, but it may also be present in other his-tological subtypes of NS. Mostly, CNS-F shows slower progression even with marked protein-uria and renal function tests can be normal early on. If signs of deterioration are present despite optimal supportive treatment, bilateral nephrectomy, dialysis and subsequent trans-plantation should be the definitive approach to prevent further severe deterioration by revers-ing the biochemical abnormalities and hormon-al disturbances with minimal risk of recurrence after surgery (12). However, in our case a rapid dramatic deterioration occurred with septic shock leading to fatal outcome.
eJIFCC2017Vol28No2pp156-163Page 161
Tumelo M. Satekge, Olivia Kiabilua, Gertruida van Biljon, Komala Pillay, Tahir S. PillayA toddler with anasarca caused by congenital nephrotic syndrome
Tumelo M. Satekge, Olivia Kiabilua, Gertruida van Biljon, Komala Pillay, Tahir S. PillayA toddler with anasarca caused by congenital nephrotic syndrome
TAKE HOME MESSAGES / LEARNING POINTS
• Anasarca in neonates requires a systemic approach to rapidly establish the correct diagnosis. Bedside testing with urine dip-stick is an essential screening tool to guide further investigations; a 3+ proteinuria on dipstick is highly suggestive of nephrotic syndrome to be confirmed by appropriate laboratory work-up.
• Nephrotic syndrome is characterised by proteinuria, edema, hyperlipidaemia, hy-poproteinaemia and may be associated with coagulopathy. Early diagnosis will
necessitate aggressive supportive treat-ment in preparation for definitive treat-ment with surgery for restoration of growth and development.
• Always exclude secondary causes of con-genital nephrotic syndrome because they tend to occur more frequent than primary causes showing better treatment response.
• Various mutations in CNS have been de-scribed; CNS-F resulting from nephrin gene mutations is not uncommon worldwide and affects both sexes equally. Genetic counsel-ling and antenatal screening for congeni-tal nephrotic syndrome - Finnish type with
TSH >100 0.95-6.52mIU/L
FT4 5.8 7.6-16.1pmol/L
FT3 2.9 4.5-10.5pmol/L
PTH 103.4 1.3-9.3pmol/L
Lipids
Total Cholesterol 13.36 mmol/L
Triglycerides 6.55 mmol/L
LDL-Cholesterol 9.19 mmol/L
HDL-Cholesterol 0.68 mmol/L
Complete blood count
WBC 20.56 6-18x10⁹L
Hb 8.0 10.7-13g/L
MCV 93.3 70-86fl
Haematocrit 0.255 0.32-0.420
Platelet 656 180-440x10⁹L
Iron 4.9 9.0-21.5 umol/L
Transferrin <0.70 1.49-3.82 g/L
Ferritin 34 36-84 ug/L
eJIFCC2017Vol28No2pp156-163Page 163
Tumelo M. Satekge, Olivia Kiabilua, Gertruida van Biljon, Komala Pillay, Tahir S. PillayA toddler with anasarca caused by congenital nephrotic syndrome
haplotype analysis is often required and should therefore be considered early on.
• In congenital nephrotic syndrome, thyroid hormones and Vitamin D status must be evaluated.
• Renal biopsy is mandatory in CNS to further differentiate and support diagnosis and to better estimate the severity of clinical pro-gression regarding renal failure.
REFERENCES1. Spahiu L, Merovci B, Jashari H, Kepuska AB, Rugova BE. Congenital nephrotic syndrome - finish type. Med Arch 2016;70:232-4.
2. Rapola J. Congenital nephrotic syndrome. Pediatric ne-phrology 1987;1:441-6.
3. Wang JJ, Mao JH. The etiology of congenital nephrotic syndrome: Current status and challenges. World J Pediatr 2016;12:149-58.
4. Tryggvason K. Unraveling the mechanisms of glomeru-lar ultrafiltration: Nephrin, a key component of the slit diaphragm. J Am Soc Nephrol 1999;10:2440-5.
5. Holthofer H, Ahola H, Solin ML, Wang S, Palmen T, Lui-mula P, et al. Nephrin localizes at the podocyte filtration
slit area and is characteristically spliced in the human kid-ney. Am J Pathol 1999;155:1681-7.
6. Siddall EC, Radhakrishnan J. The pathophysiology of edema formation in the nephrotic syndrome. Kidney in-ternational 2012;82:635-42.
7. Bockenhauer D. Over- or underfill: Not all nephrotic states are created equal. Pediatric nephrology 2013;28:1153-6.
8. Mahmoodi BK, ten Kate MK, Waanders F, Veeger NJ, Brouwer JL, Vogt L, et al. High absolute risks and predic-tors of venous and arterial thromboembolic events in patients with nephrotic syndrome: Results from a large retrospective cohort study. Circulation 2008;117:224-30.
9. Wheeler DC, Bernard DB. Lipid abnormalities in the nephrotic syndrome: Causes, consequences, and treat-ment. Am J Kidney Dis 1994;23:331-46.
10. Ito S, Kano K, Ando T, Ichimura T. Thyroid function in children with nephrotic syndrome. Pediatric nephrology 1994;8:412-5.
11. Nielsen CA, Jensen JE, Cortes D. Vitamin d status is insufficient in the majority of children at diagnosis of ne-phrotic syndrome. Dan Med J 2015;62.
12. Slaughenhoupt BL, Lohrasbi FF, Harrison HL, Van Sav-age JG. Urologic management of congenital nephrotic syndrome of the finnish type. Urology 1998;51:492-4.
Editor-in-chiefGábor L. KovácsInstitute of Laboratory Medicine, Faculty of Medicine, University of Pécs, Hungary
Assistant Editor Case Editor Harjit Pal Bhattoa Reinhard B. RaggamDepartment of Laboratory Medicine Department of Internal Medicine University of Debrecen, Hungary Division of Angiology, University of Graz, Austria
Editorial BoardKhosrow Adeli, The Hospital for Sick Children, University of Toronto, Canada
Borut Božič, University Medical Center, Lubljana, Slovenia
Edgard Delvin, CHU Sainte-Justine Research Center, Montréal, Québec, Canada
Nilda E. Fink, Universidad Nacional de La Plata, Argentina
Ronda Greaves, School of Health and Biomedical Sciences, RMIT University, Victoria, Australia
Mike Hallworth, Shrewsbury, United Kingdom
Andrea R. Horvath, Prince of Wales Hospital and School of Medical Sciences, University of New South Wales, Sydney, Australia
Ellis Jacobs, Alere Inc., New York, USA
Allan S. Jaffe, Mayo Clinic, Rochester, USA
Bruce Jordan, Roche Diagnostics, Rotkreuz, Switzerland
János Kappelmayer, Faculty of Medicine, University of Debrecen, Hungary
Evelyn Koay, National University, Singapore
Gary Myers, Joint Committee for Traceability in Laboratory Medicine, USA
Maria D. Pasic, Laboratory Medicine and Pathobiology, University of Toronto, Canada
Maria del C. Pasquel Carrera, College of Chemists, Biochemists and Pharmacists, Pichincha, Ecuador
Oliver Racz, University of Kosice, Slovakia
Rosa Sierra Amor, Laboratorio Laquims, Veracruz, Mexico
Sanja Stankovic, Institute of Medical Biochemistry, Clinical Center of Serbia, Belgrade, Serbia
Danyal Syed, Ryancenter, New York, USA
Grazyna Sypniewska, Collegium Medicum, NC University, Bydgoszcz, Poland
Jillian R. Tate, Queensland Royal Brisbane and Women’s Hospital, Herston, Australia
The eJIFCC is a member of the Committee on Publication Ethics (COPE).
The eJIFCC (Journal of the International Federation of Clinical Chemistry) is an electronic journal with frequent updates on its home page. Our articles, debates, reviews and editorials are addressed to clinical laboratorians. Besides offering original scientific thought in our featured columns, we provide pointers to quality resources on the World Wide Web.
Contents may not be reproduced without the prior permission of the Communications and Publications Division (CPD) of the IFCC.


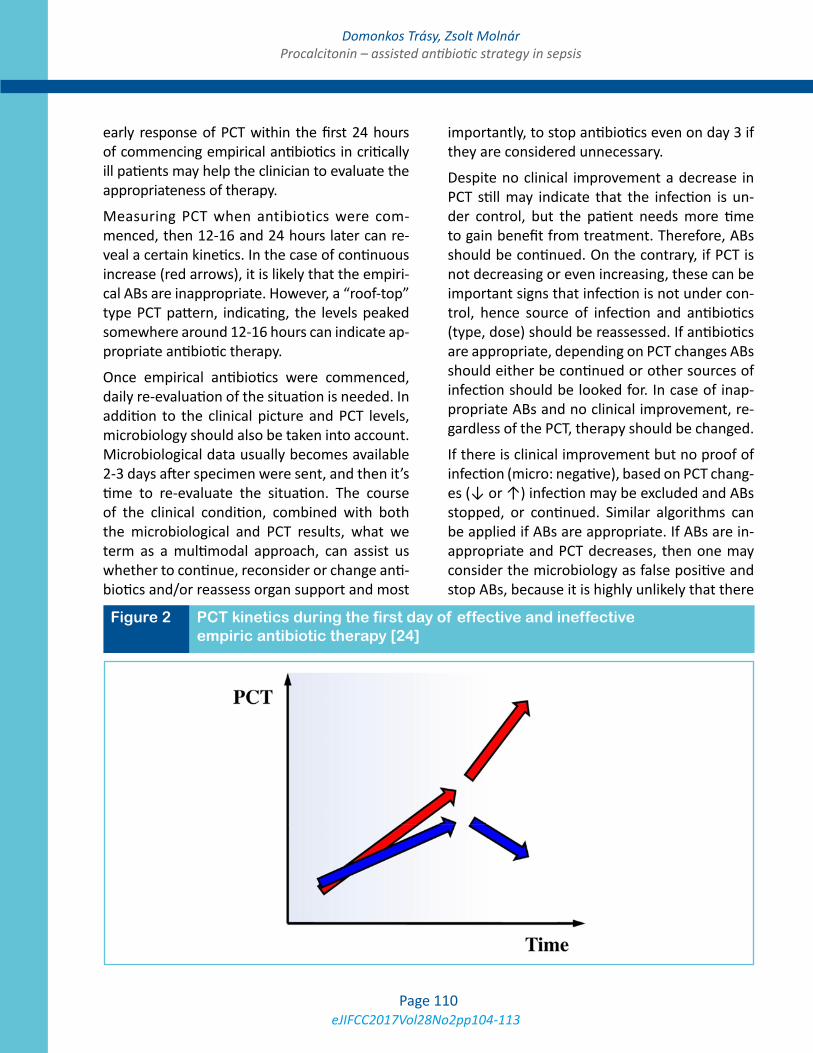


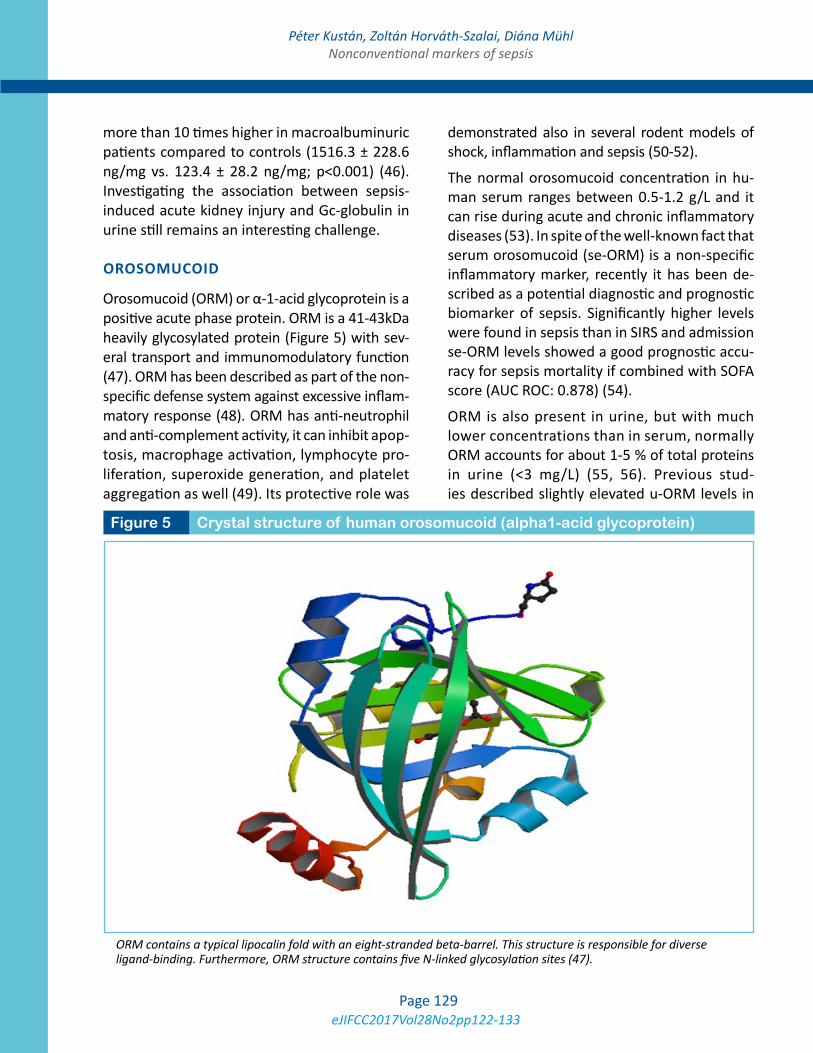


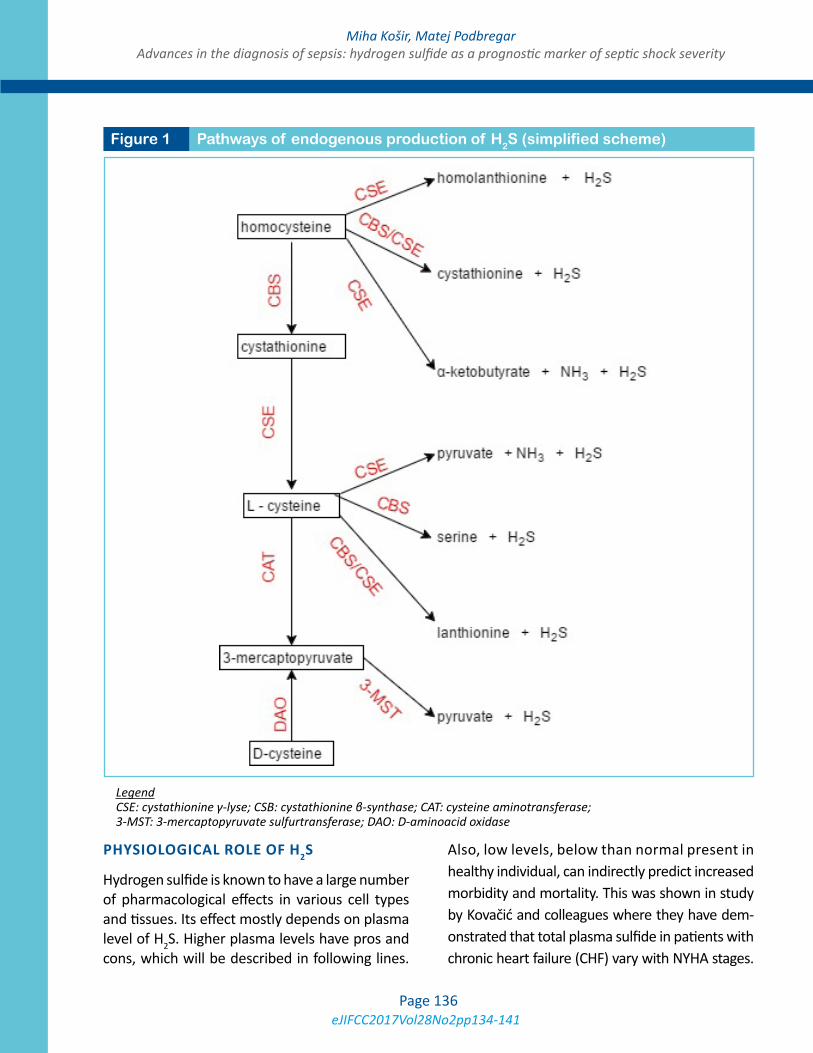


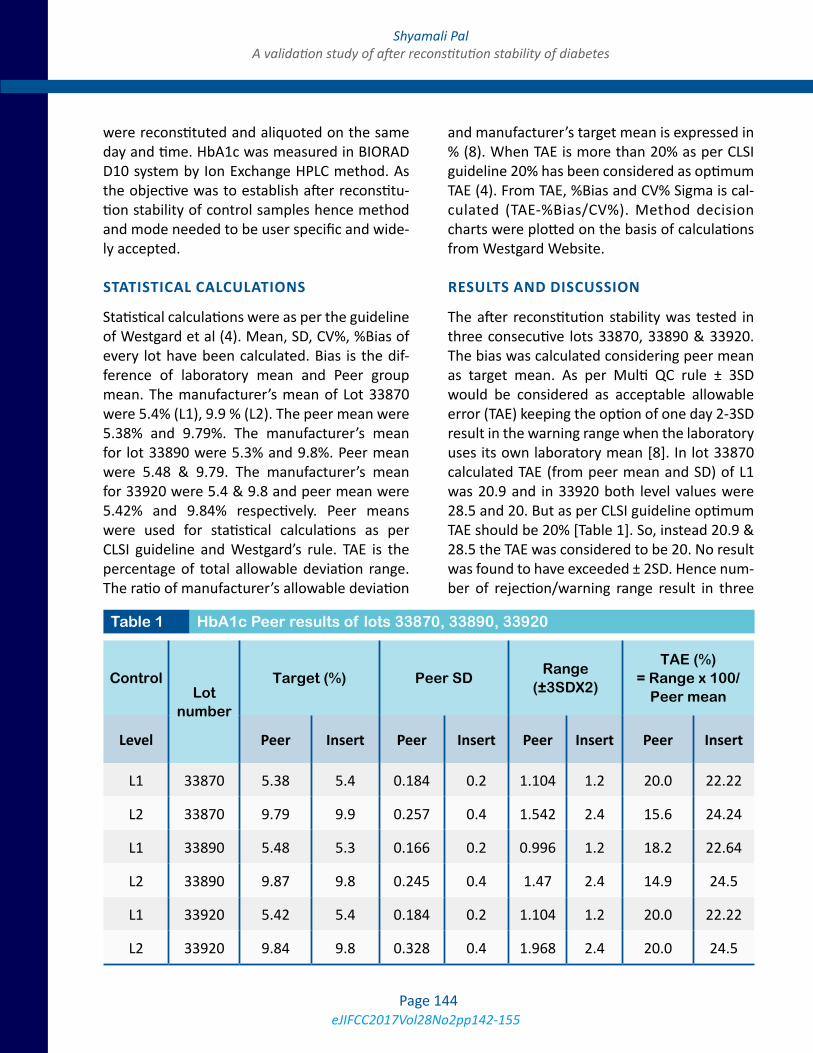


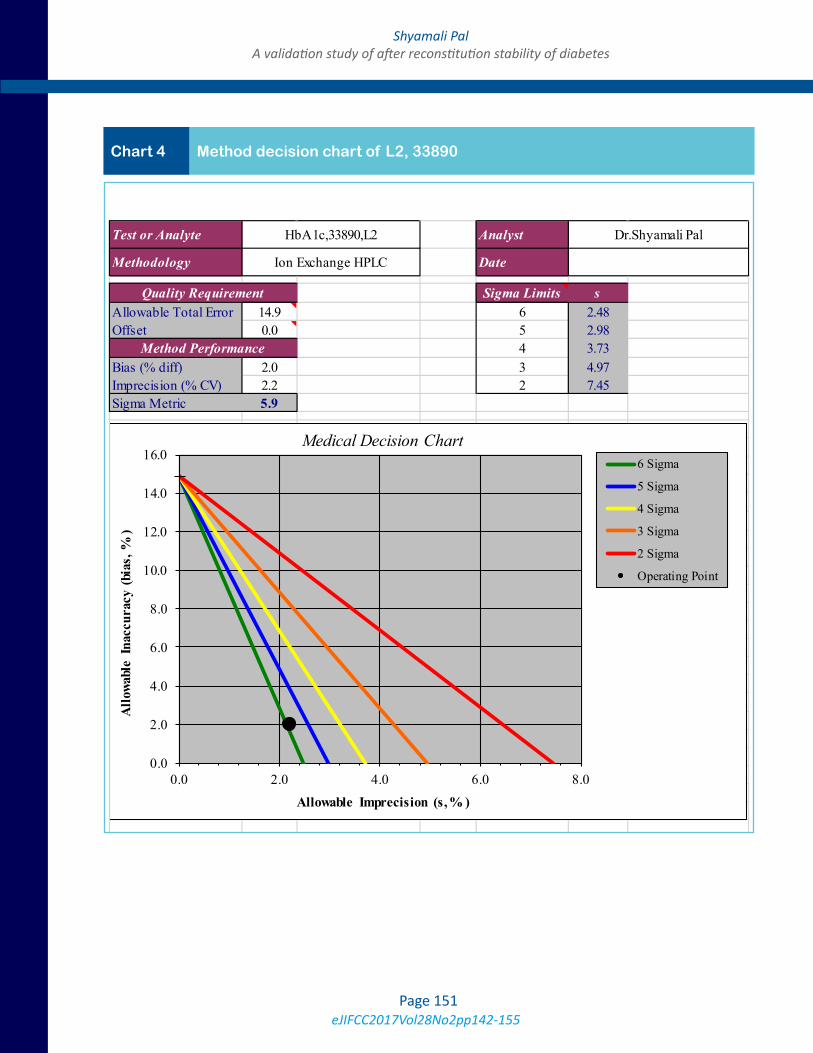


![1877.] Medicine. 241 MEDICINE.](https://static.documents.pub/doc/80x56/6248decce7f255195063a334/1877-medicine-241-medicine.jpg)


