EDM INTERNATIONAL Socie ´te ´ d’Investissement a ` Capital Variable Luxembourg Annual Report, including Audited Financial Statements as at December 31, 2016 11-13 Boulevard de la Foire L-1528 Luxembourg R.C.S. Luxembourg B-50523 No subscription may be accepted solely on the basis of these financial statements. Subscriptions are only valid if based on the issued prospectus, the key investor information document (KIID), accompanied by the latest unaudited semi-annual report and the most recent annual report, including the audited financial statements if published thereafter.
Transcript
EDM INTERNATIONAL
Societe d’Investissement a Capital Variable
Luxembourg
Annual Report, including Audited Financial Statements
as at December 31, 2016
11-13 Boulevard de la Foire
L-1528 Luxembourg
R.C.S. Luxembourg B-50523
No subscription may be accepted solely on the basis of these financial statements. Subscriptions are only valid if based on the issued
prospectus, the key investor information document (KIID), accompanied by the latest unaudited semi-annual report and the most recent
annual report, including the audited financial statements if published thereafter.
Table of Contents
Management and Administration 4
Information to Shareholders 5
Historic Volatility 6
Net Remuneration of Bank Accounts 7
Comparative of Fees on the Average Net Assets 8
Comparative Performances 13
Director’s Report 14
Report of the Reviseur d’entreprises agree 17
Combined Statement of Net Assets 19
Combined Statement of Operations and Changes in Net Assets 22
Changes in the Number of Shares 25
Statistics 25
EDM International - Strategy Fund
Statement of Investments 31
Investments Breakdowns 33
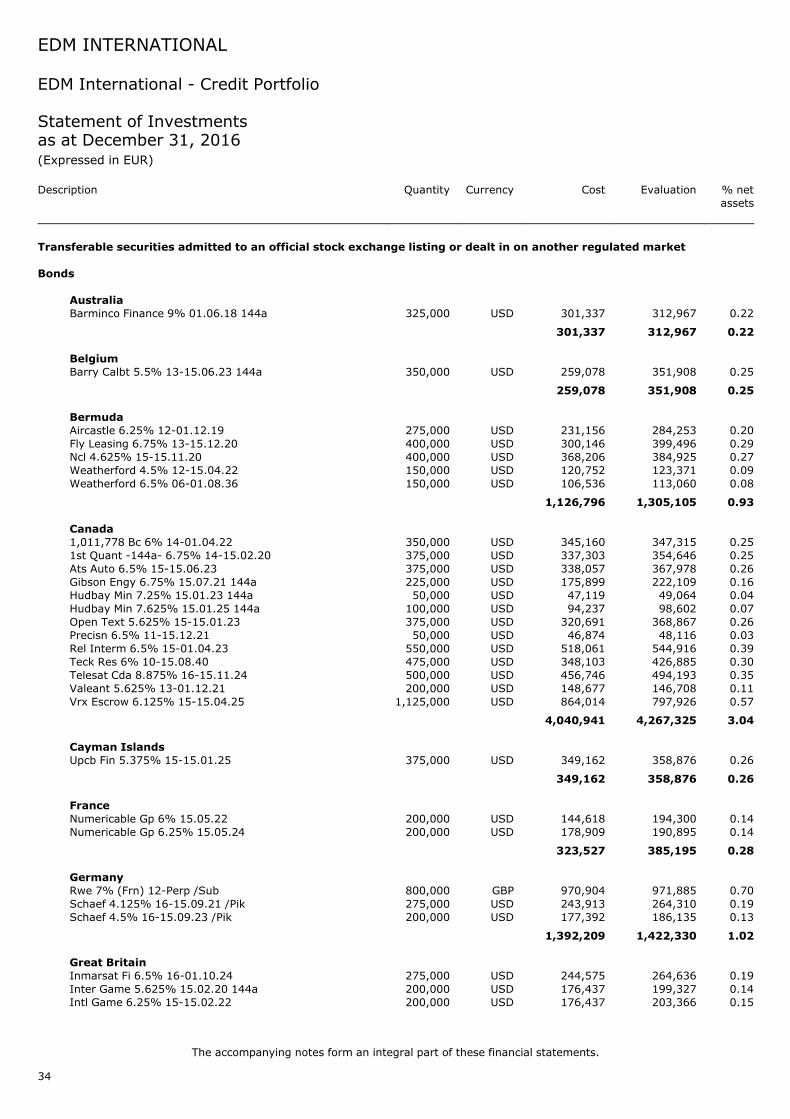
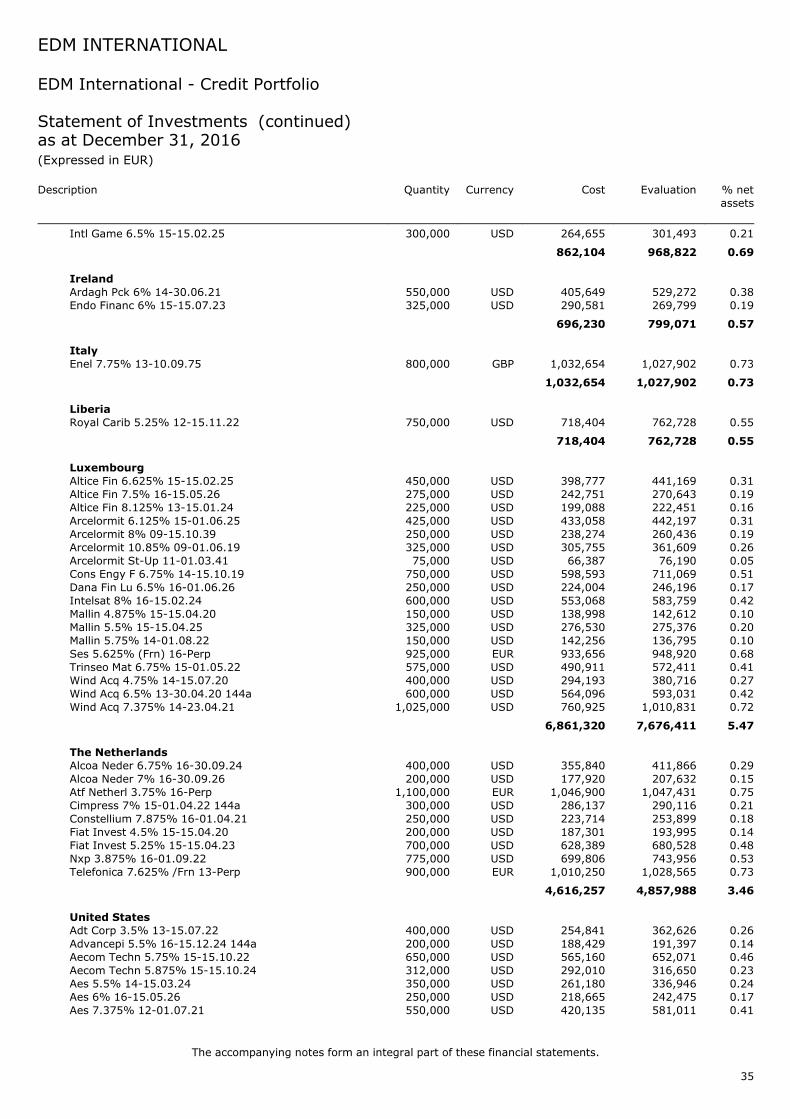
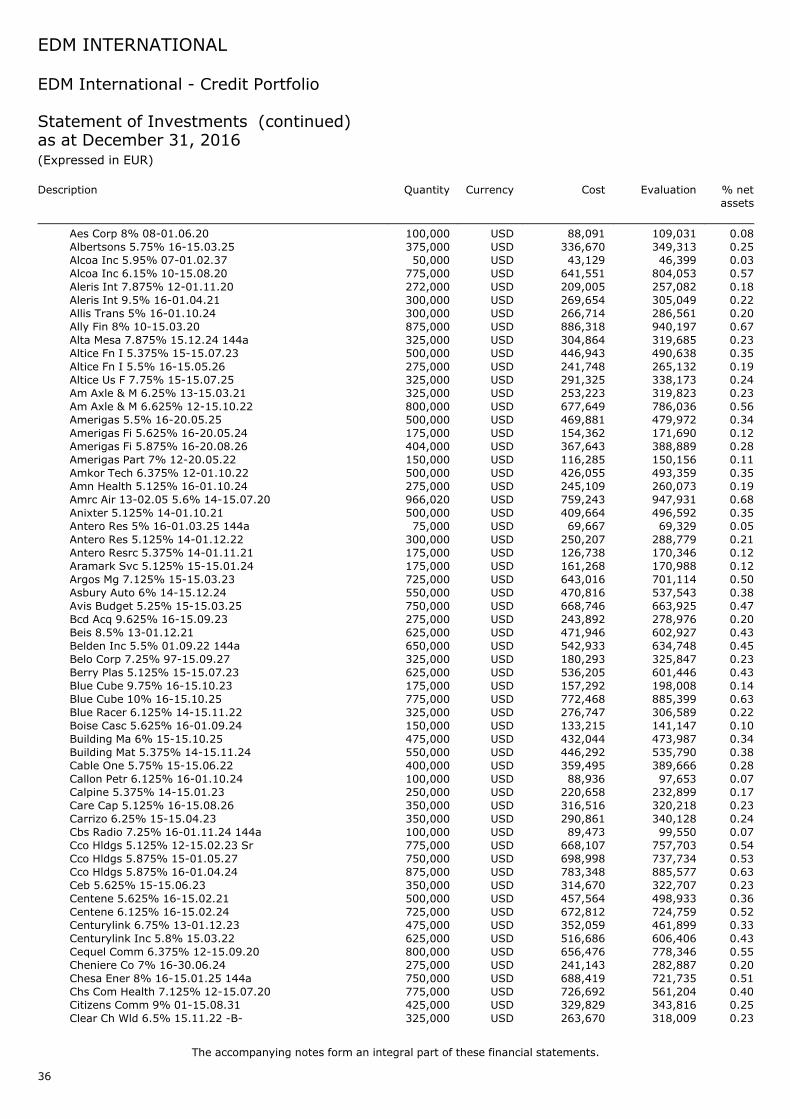
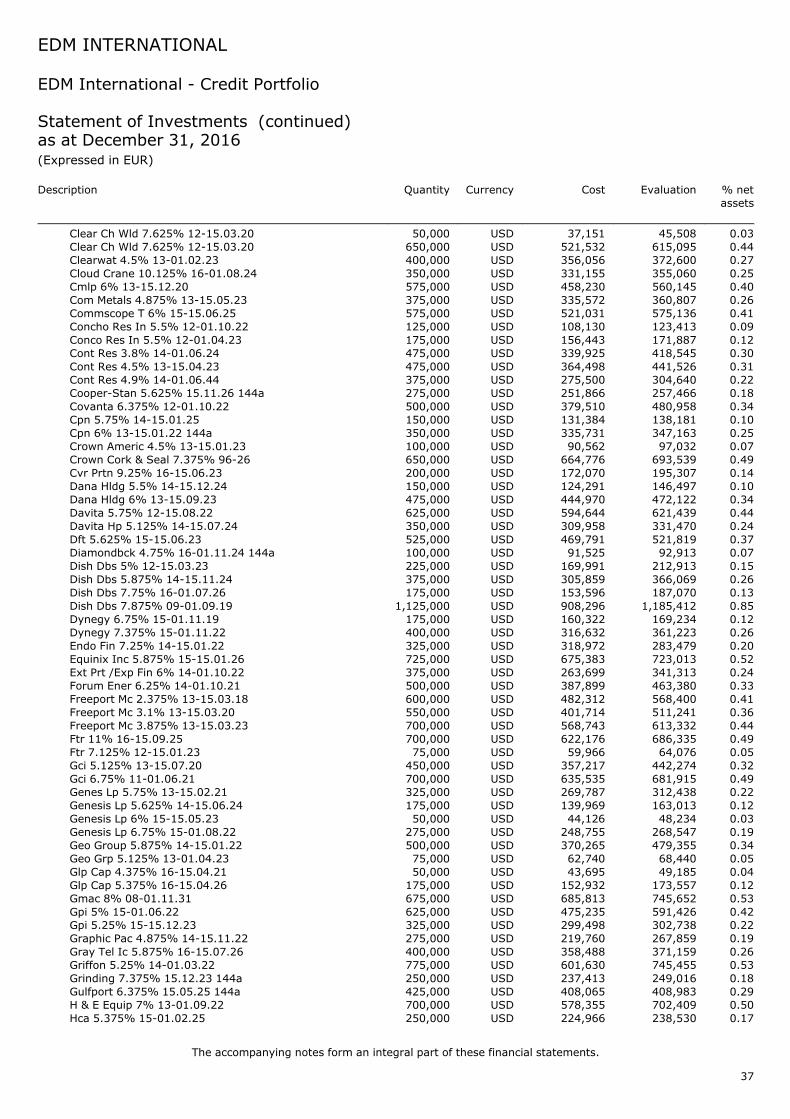
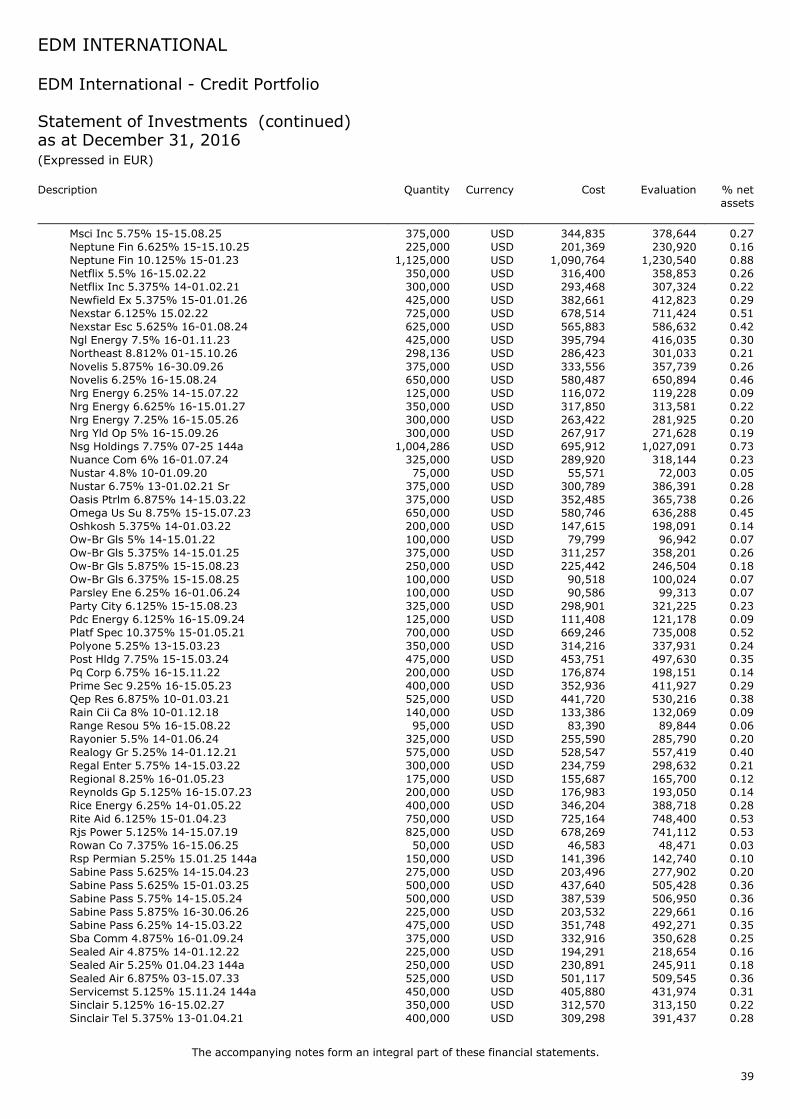
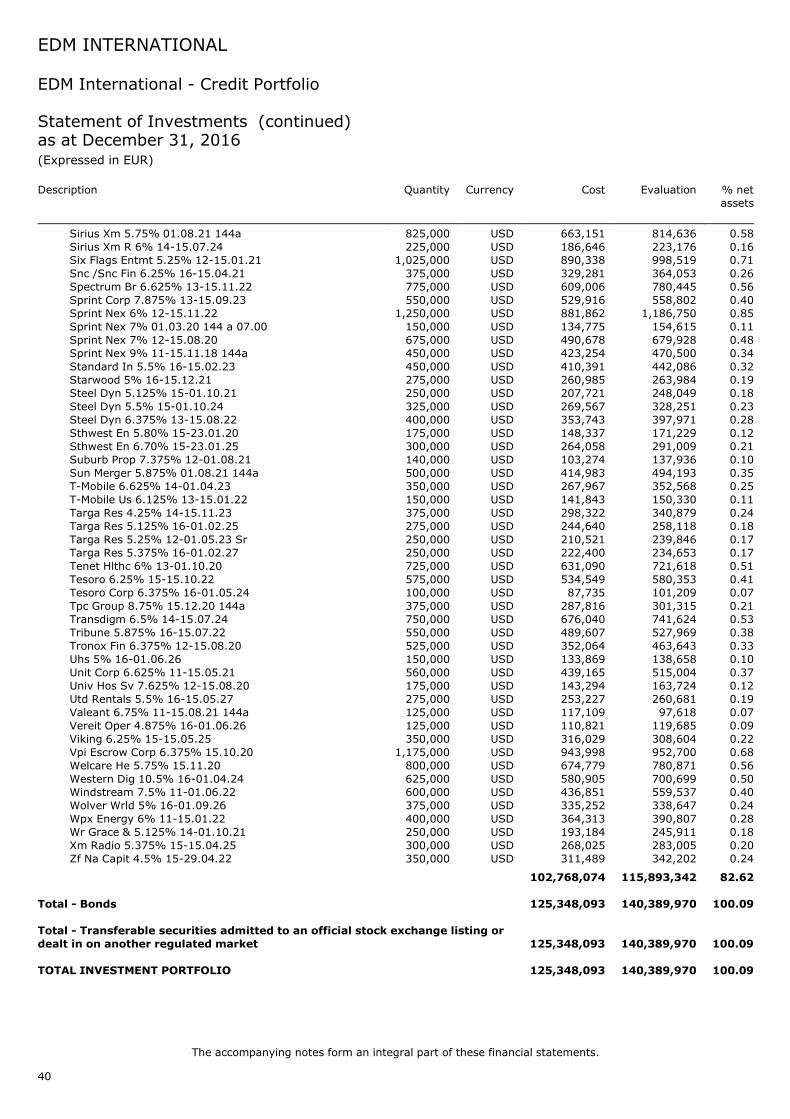
EDM International - Credit Portfolio
Statement of Investments 34
Investments Breakdowns 41
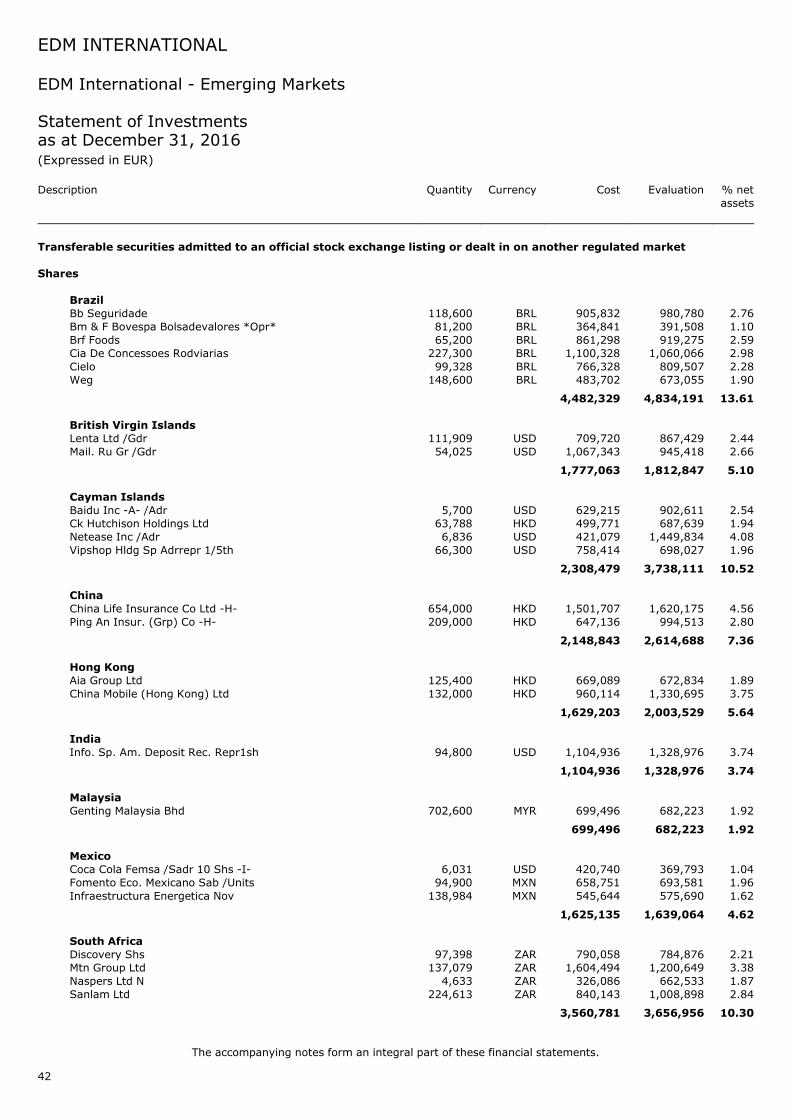
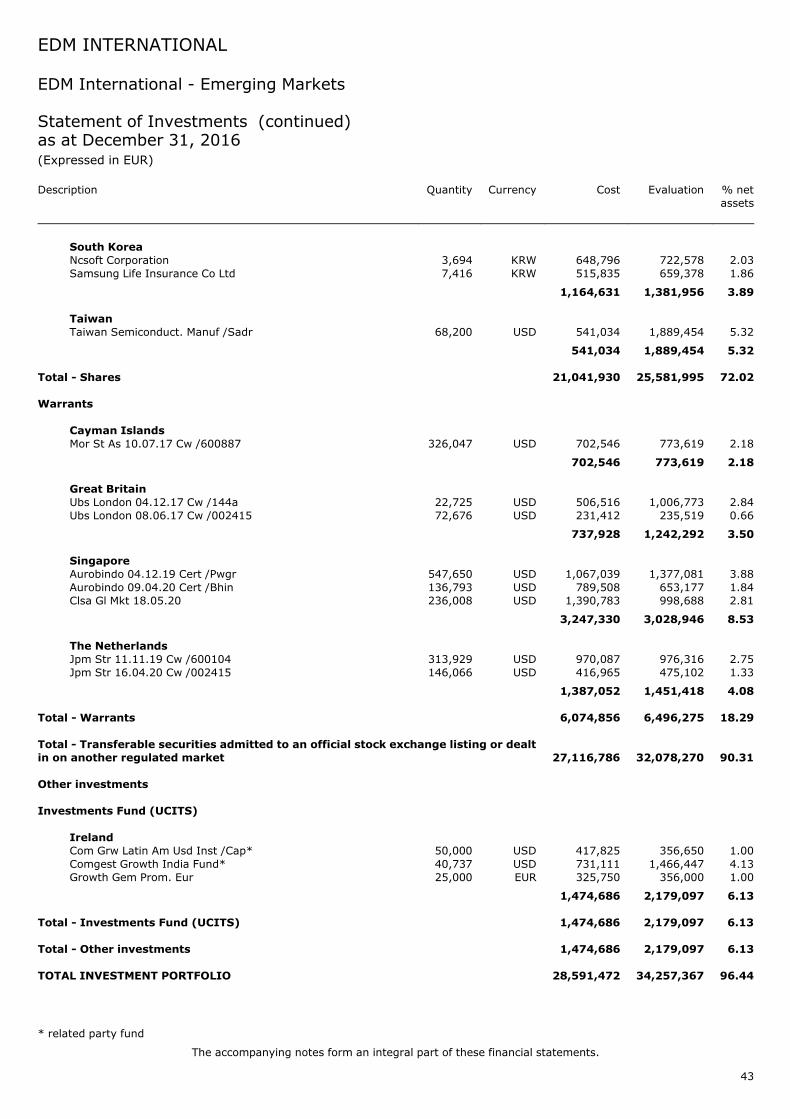
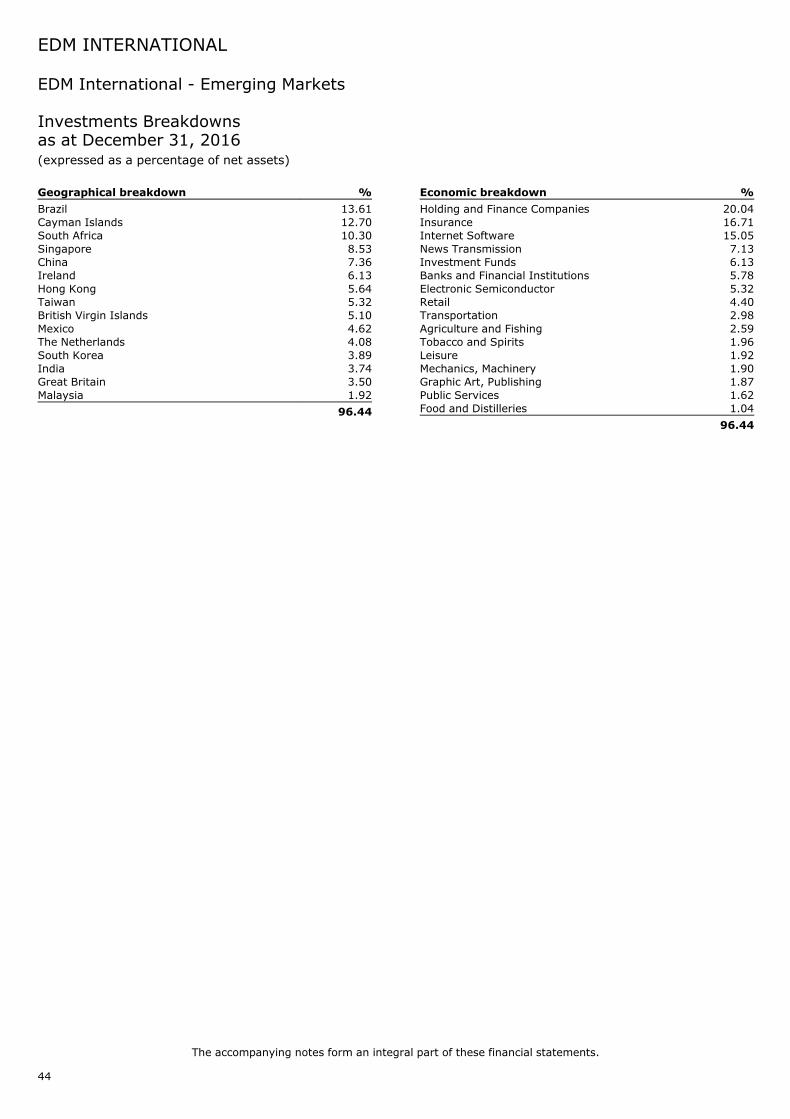
EDM International - Emerging Markets
Statement of Investments 42
Investments Breakdowns 44
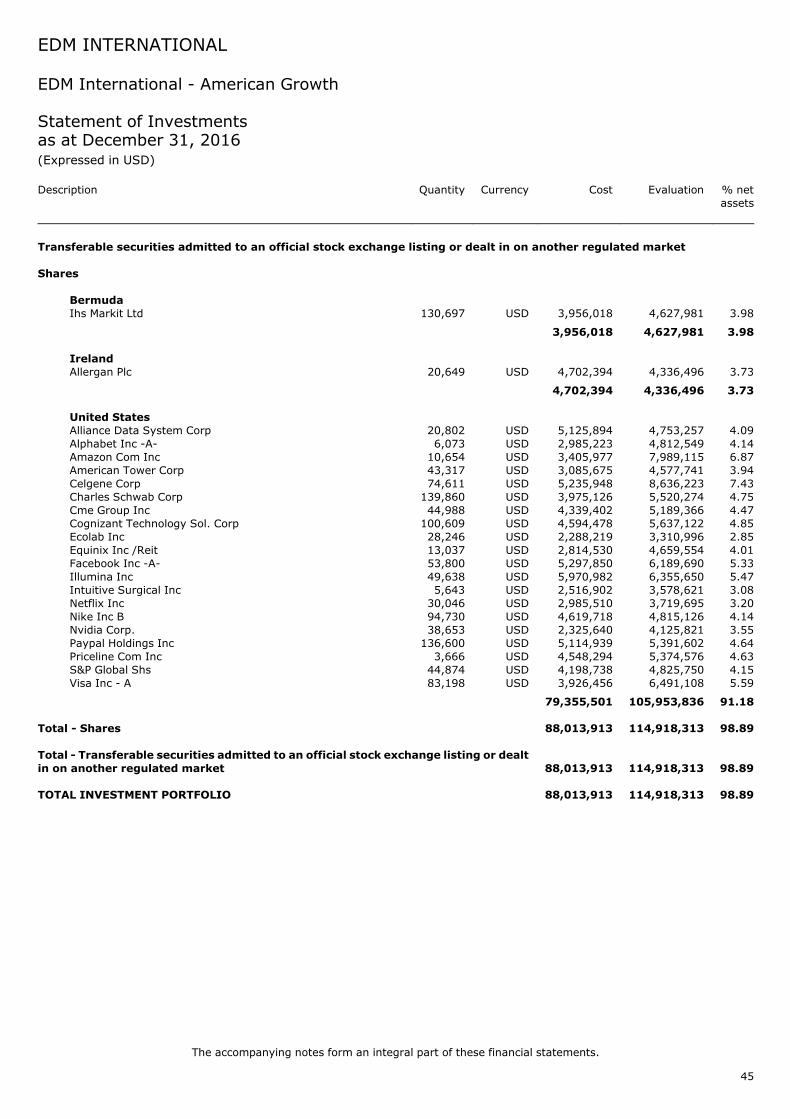
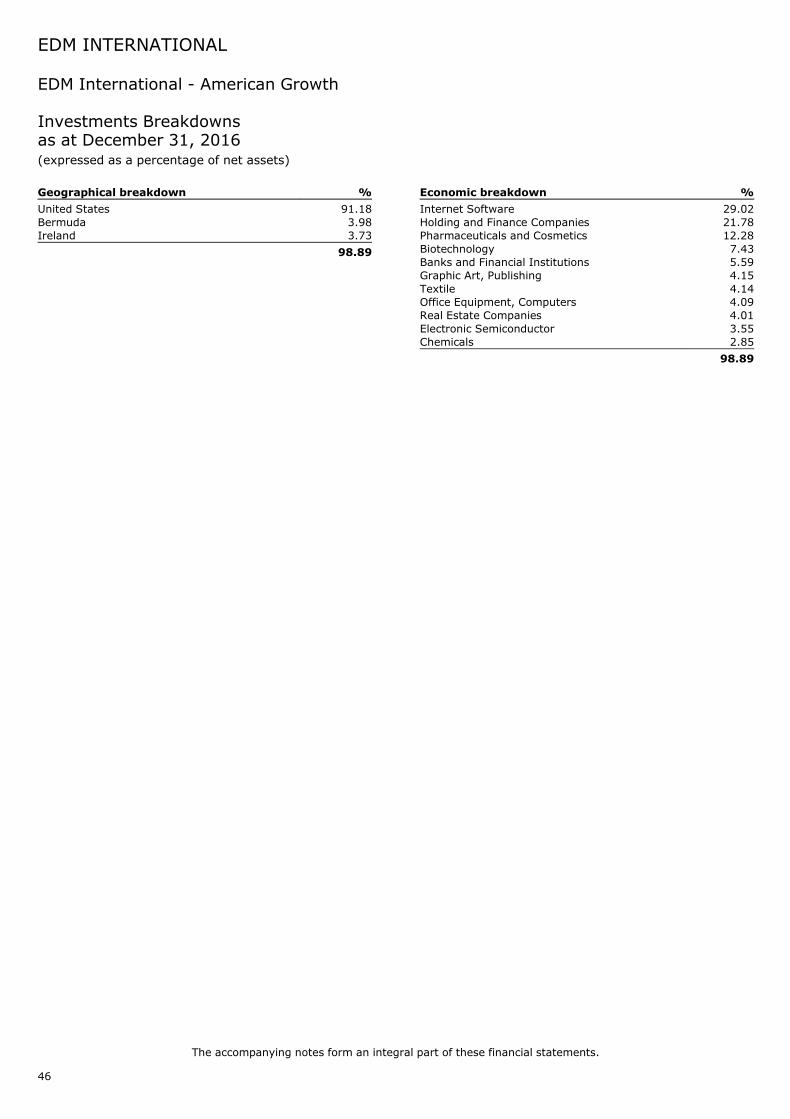
EDM International - American Growth
Statement of Investments 45
Investments Breakdowns 46
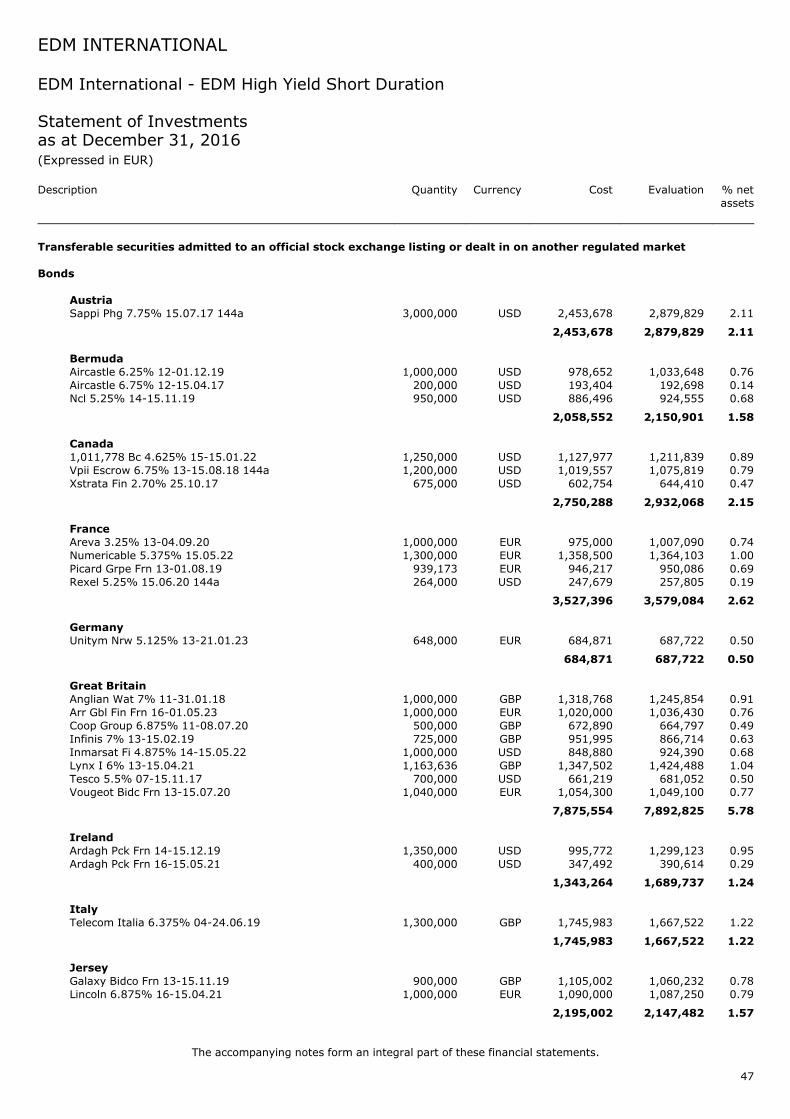
EDM International - EDM High Yield Short Duration
Statement of Investments 47
Investments Breakdowns 51
EDM International - Gamma
Statement of Investments 52
Investments Breakdowns 54
EDM International - Spanish Equity
Statement of Investments 55
Investments Breakdowns 56
EDM International - Latin American Equity Fund
Statement of Investments 57
Investments Breakdowns 59
Notes to the Financial Statements 60
Information for Shareholders 68
EDM INTERNATIONAL
Management and Administration
Chairman:
Mr. Antonio Estabanell Buxo, DirectorEDM Holding S.A., Barcelona, Spain
Directors:
Mr. Lluis Fortuny Salvador, DirectorEDM Gestion, S.A., S.G.I.I.C., Barcelona, Spain
Mr. Fernando Vega Gamez, DirectorEDM Gestion, S.A., S.G.I.I.C., Madrid, Spain
Mr. Paul De Quant, Partner of The Director’s OfficeMDO Services, S.A., Luxembourg,Grand Duchy of Luxembourg
Registered Office:
11-13 Boulevard de la Foire, L-1528 LuxembourgR.C.S. Number B-50523
Management Company (since January 11, 2016):
MDO Management Company, societe anonyme19, rue de Bitbourg,L-1273 LuxembourgGrand Duchy of Luxembourg
Investment Managers:
For the EDM International - Emerging Markets Sub-Fund:Comgest S.A.56, rue de Londres75008 ParisFrance
For the EDM International - Credit Portfolio and EDMInternational - EDM High Yield Short Duration Sub-Funds:Muzinich & Co. Ltd.8 Hanover Street,London W1S 1YQUnited Kingdom
For the EDM International - Gamma,EDM International - Strategy Fund,EDM International - Spanish Equity andEDM International - Latin American Equity Fund Sub-Funds:EDM Gestion, S.A., S.G.I.I.C.Av. Diagonal, 399, 3˚, 1a08008 BarcelonaSpain
For the EDM International - American Growth Sub-Fund:Edgewood Management Llc350 Park Avenue18th FloorNew York, NY 10022United States of America
Master Fund:
EDM INVERSION, FIRepresented by its management companyEDM Gestion, S.A., S.G.I.I.C.,Av. Diagonal, 399, 3˚ 1a08008 BarcelonaSpain
Sub-Investment Managers:
For the Credit Portfolio and EDM High Yield Short DurationSub-Funds:Muzinich & Co. Inc.450 Park AvenueNew York, NY 10022United States of America
Investment Management Support Agent:
EDM Fund Management S.A.11-13, Boulevard de la FoireL-1528 LuxembourgGrand Duchy of Luxembourg
Custodian and Central Administration:
RBC Investor Services Bank S.A.14, Porte de FranceL-4360 Esch-sur-AlzetteGrand Duchy of Luxembourg
Registrar and Transfer Agent:
RBC Investor Services Bank S.A.14, Porte de FranceL-4360 Esch-sur-AlzetteGrand Duchy of Luxembourg
Each Sub-Fund’s net asset value per share, as well as issue, redemption and conversion values are made public everyvaluation date at the Company’s registered office.
Financial notices are published in the countries where the Company is sold, and notably in a Luxembourg newspaper (theLuxemburger Wort) in the Grand Duchy of Luxembourg.
The financial year of the Company starts on the first day of January in each year and ends on the last day of December ofthe same year.
The Company publishes a detailed annual report, including audited financial statements giving account of its operationsand the management of its assets, and including the combined statement of Net Assets and combined statement ofOperations and Changes in Net Assets, in euros, as well as a detailed listing of each Sub-Fund’s portfolio assets and thereport of the Reviseur d’entreprises agree and notes to these financial statements.
In addition, at the end of each six-month period, the Company publishes a semi-annual report including, notably, thenotes, the listing of the assets held, changes in the net assets over the period, the number of shares outstanding and thenumber of shares issued and redeemed since the previous report.
The Annual General Meeting of Shareholders is held each year at the Company’s registered office, or at another location inLuxembourg, which is indicated on the invitation.
The Annual General Meeting of Shareholders is held on the fourth Tuesday of May at 9:00 am, or if this falls on a bankholiday, the next bank business day.
All registered shareholders are notified of all General Meetings of Shareholders by post, at the address given in theregister of the Company’s shareholders, at least eight days prior to the General Meeting of Shareholders.
Notices are also published in the Memorial C, Register of Companies and Associations of the Grand Duchy of Luxembourg(‘‘The Memorial’’) until May 31, 2016. Since June 1, 2016, Registre de Commerce et des Societes as well as in theLuxemburger Wort and in newspapers in each country where the Company is sold.
A detailed schedule of the changes in the statement of investment for each Sub-Fund is available free of charge uponrequest, at the Company’s registered office.
EDM INTERNATIONAL
5
Histo
ricVolatility
overthePast
FiveYears
(2012-2016)
Stra
tegyFund
(in
EUR)
CreditPortfo
lio(in
EUR)
EmergingMarkets
(in
EUR)
ClassREUR
ClassIEUR
ClassRUSD
ClassAEUR
ClassBUSD
ClassAEUR
NAV/share
ClassR
Volatility
NAV/share
ClassI
Volatility
NAV/share
ClassR
Volatility
NAV/share
ClassA
Volatility
NAV/share
ClassB
Volatility
NAV/share
ClassA
Volatility
inSub-Fundcurre
ncy
EUR
%EUR
%EUR
%EUR
%EUR
%EUR
%
atDecember31,2012
302.90
2.98
1,027,852.44
-*1
--
237.21
1.15
81.18
-*2
84.52
4.26
atDecember31,2013
351.43
1.82
1,207,974.66
1.83
--
251.04
1.50
82.52
1.84
87.89
2.84
atDecember31,2014
356.91
2.23
1,242,689.13
2.30
83.67
-*4
251.90
1.21
94.15
1.04
99.10
3.65
atDecember31,2015
388.44
4.60
1,370,087.82
4.60
100.37
6.99
245.96
1.58
101.67
3.57
96.72
6.18
atDecember31,2016
358.11
3.32
1,279,483.50
3.34
96.21
3.98
267.27
1.06
115.09
1.56
103.77
4.36
Americ
anGrowth
(in
USD)
EDMHighYield
ShortDuratio
n(in
EUR)
Gamma
(in
USD)
ClassAUSD
ClassBEUR
ClassAEUR
ClassAUSD
NAV/share
ClassA
Volatility
NAV/share
ClassB
Volatility
NAV/share
ClassA
Volatility
NAV/share
ClassA
Volatility
inSub-Fundcurre
ncy
USD
%USD
%EUR
%USD
%
atDecember31,2012
114.76
3.70
194.08
5.40
70.79
0.56
112.27
1.34
atDecember31,2013
156.77
2.64
275.89
3.74
73.00
0.53
123.55
1.36
atDecember31,2014
175.85
3.14
272.47
3.98
72.69
0.46
124.82
1.20
atDecember31,2015
191.14
4.09
266.80
4.73
72.91
0.65
122.68
2.77
atDecember31,2016
194.01
4.00
259.41
5.15
74.82
0.48
114.59
3.28
SpanishEquity
*3
(in
EUR)
Latin
Americ
anEquity
Fund
(in
USD)*3
ClassREURShares*5
ClassIEURShares*5
ClassIUSD
ClassIEUR
ClassRUSD
ClassREUR
NAV/share
ClassR
Volatility
NAV/share
ClassI
Volatility
NAV/share
ClassI
Volatility
NAV/share
ClassI
Volatility
NAV/share
ClassR
Volatility
NAV/share
ClassR
Volatility
inSub-Fundcurre
ncy
EUR
%EUR
%USD
%USD
%USD
%USD
%
atDecember31,2012
--
--
--
--
--
--
atDecember31,2013
--
--
--
--
--
--
atDecember31,2014
96.68
-*4
97.54
-*4
85.87
-*4
122.98
-*4
88.37
-*4
121.49
-*4
atDecember31,2015
99.33
4.71
101.28
4.71
59.39
5.30
85.07
5.30
60.35
5.29
82.96
5.75
atDecember31,2016
111.04
3.14
114.40
3.14
72.64
7.17
104.04
7.18
72.85
7.17
100.15
7.17
*1Novolatility
because
thevolatility
iscalcu
latedoverthelast
12monthsandthisshare
class
hasbeencre
atedonOcto
ber
29,2012.
*2Novolatility
because
thevolatility
iscalcu
latedoverthelast
12monthsandthisshare
class
hasbeencre
atedonApril
13,2012.
*3Novolatility
because
thevolatility
iscalcu
latedoverthelast
12monthsandthese
sub-fu
ndswere
launchedasatMarch
3,2014.
*4Novolatility
because
thevolatility
iscalcu
latedoverthelast
12monthsandthese
share
classe
shavebeenlauncheddurin
gtheyear2014.
*5Changedenominatio
nofshare
class
with
effe
ctivedate
January
11,2016.
EDMINTERNATIONAL
6
NetRemuneratio
nofBankAcco
unts
overthePast
FiveYears
(2012-2016)
Stra
tegyFund
CreditPortfo
lioEmergingMarkets
(in
EUR)
(in
EUR)
(in
EUR)
atDecember31,2012
-(1,002)
(492)
atDecember31,2013
-(2,202)
(313)
atDecember31,2014
(5,534)
(389)
(6)
atDecember31,2015
(51,095)
(7,954)
(1,522)
atDecember31,2016
(32,123)
(4,774)
(2,143)
Americ
anGrowth
EDMHighYield
Short
Duratio
n*1
Gamma
(in
USD)
(in
EUR)
(in
USD)
atDecember31,2012
(477)
(926)
-atDecember31,2013
(51)
(803)
-atDecember31,2014
(603)
(504)
(29)
atDecember31,2015
(715)
(6,928)
(144)
atDecember31,2016
(25)
(8,394)
(60)
SpanishEquity
*1
Latin
Americ
an
Equity
Fund*1
(in
EUR)
(in
USD)
atDecember31,2012
--
atDecember31,2013
--
atDecember31,2014
(941)
-atDecember31,2015
(5,524)
15
atDecember31,2016
(20,403)
(134)
*1These
sub-fu
ndswere
launchedasatMarch
3,2014.
EDMINTERNATIONAL
7
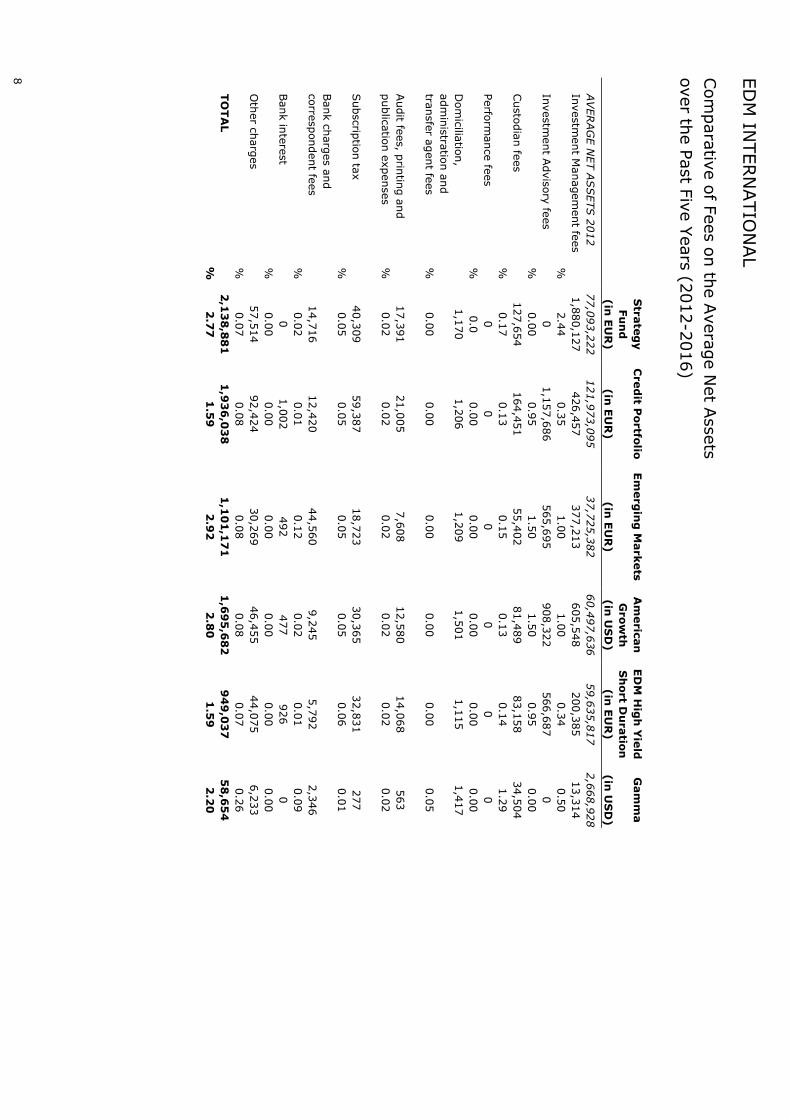
Comparativ
eofFeesontheAverageNetAsse
ts
overthePast
FiveYears
(2012-2016)
Stra
tegy
CreditPortfo
lioEmergingMarkets
Americ
an
EDMHighYield
Gamma
Fund
Growth
ShortDuratio
n
(in
EUR)
(in
EUR)
(in
EUR)
(in
USD)
(in
EUR)
(in
USD)
AVERAGENETASSETS2012
77,093,222
121,973,095
37,725,382
60,497,636
59,635,817
2,668,928
Investm
entManagementfees
1,880,127
426,457
377,213
605,548
200,385
13,314
%2.44
0.35
1.00
1.00
0.34
0.50
Investm
entAdviso
ryfees
01,157,686
565,695
908,322
566,687
0%
0.00
0.95
1.50
1.50
0.95
0.00
Custo
dianfees
127,654
164,451
55,402
81,489
83,158
34,504
%0.17
0.13
0.15
0.13
0.14
1.29
Perfo
rmance
fees
00
00
00
%0.0
0.00
0.00
0.00
0.00
0.00
Domicilia
tion,
1,170
1,206
1,209
1,501
1,115
1,417
administra
tionand
transfer
agentfees
%0.00
0.00
0.00
0.00
0.00
0.05
Auditfees,prin
tingand
17,391
21,005
7,608
12,580
14,068
563
publica
tionexpenses
%0.02
0.02
0.02
0.02
0.02
0.02
Subscrip
tiontax
40,309
59,387
18,723
30,365
32,831
277
%0.05
0.05
0.05
0.05
0.06
0.01
Bankchargesand
corre
spondentfees
14,716
12,420
44,560
9,245
5,792
2,346
%0.02
0.01
0.12
0.02
0.01
0.09
Bankinterest
01,002
492
477
926
0%
0.00
0.00
0.00
0.00
0.00
0.00
Othercharges
57,514
92,424
30,269
46,455
44,075
6,233
%0.07
0.08
0.08
0.08
0.07
0.26
TOTAL
2,138,881
1,936,038
1,101,171
1,695,682
949,037
58,654
%2.77
1.59
2.92
2.80
1.59
2.20
EDMINTERNATIONAL
8
Stra
tegy
CreditPortfo
lioEmergingMarkets
Americ
an
EDMHighYield
Gamma
Fund
Growth
ShortDuratio
n
(in
EUR)
(in
EUR)
(in
EUR)
(in
USD)
(in
EUR)
(in
USD)
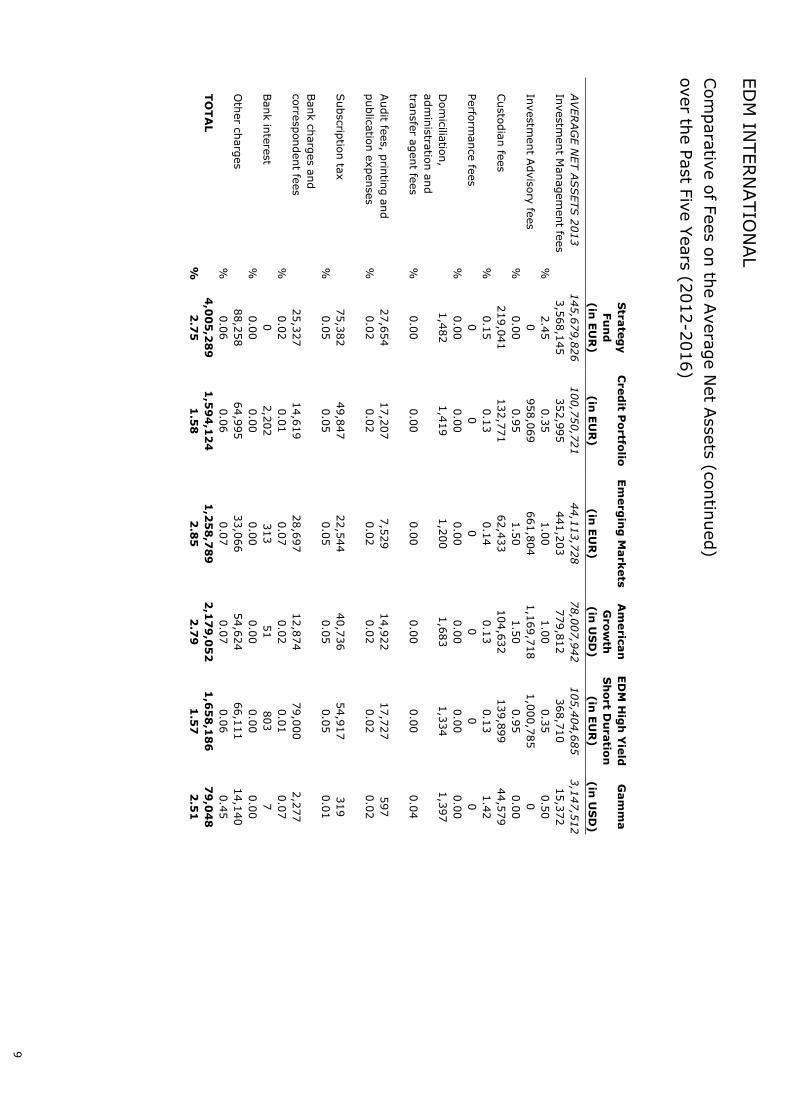
AVERAGENETASSETS2013
145,679,826
100,750,721
44,113,728
78,007,942
105,404,685
3,147,512
Investm
entManagementfees
3,568,145
352,995
441,203
779,812
368,710
15,372
%2.45
0.35
1.00
1.00
0.35
0.50
Investm
entAdviso
ryfees
0958,069
661,804
1,169,718
1,000,785
0%
0.00
0.95
1.50
1.50
0.95
0.00
Custo
dianfees
219,041
132,771
62,433
104,632
139,899
44,579
%0.15
0.13
0.14
0.13
0.13
1.42
Perfo
rmance
fees
00
00
00
%0.00
0.00
0.00
0.00
0.00
0.00
Domicilia
tion,
1,482
1,419
1,200
1,683
1,334
1,397
administra
tionand
transfer
agentfees
%0.00
0.00
0.00
0.00
0.00
0.04
Auditfees,prin
tingand
27,654
17,207
7,529
14,922
17,727
597
publica
tionexpenses
%0.02
0.02
0.02
0.02
0.02
0.02
Subscrip
tiontax
75,382
49,847
22,544
40,736
54,917
319
%0.05
0.05
0.05
0.05
0.05
0.01
Bankchargesand
corre
spondentfees
25,327
14,619
28,697
12,874
79,000
2,277
%0.02
0.01
0.07
0.02
0.01
0.07
Bankinterest
02,202
313
51
803
7%
0.00
0.00
0.00
0.00
0.00
0.00
Othercharges
88,258
64,995
33,066
54,624
66,111
14,140
%0.06
0.06
0.07
0.07
0.06
0.45
TOTAL
4,005,289
1,594,124
1,258,789
2,179,052
1,658,186
79,048
%2.75
1.58
2.85
2.79
1.57
2.51
EDMINTERNATIONAL
9
Comparativ
eofFeesontheAverageNetAsse
ts(co
ntin
ued)
overthePast
FiveYears
(2012-2016)
Stra
tegy
CreditPortfo
lioEmergingMarkets
Americ
an
EDMHighYield
Gamma
SpanishEquity
*Latin
Americ
a
Fund
Growth
ShortDuratio
nEquity
Fund*
(in
EUR)
(in
EUR)
(in
EUR)
(in
USD)
(in
EUR)
(in
USD)
(in
EUR)
(in
USD)
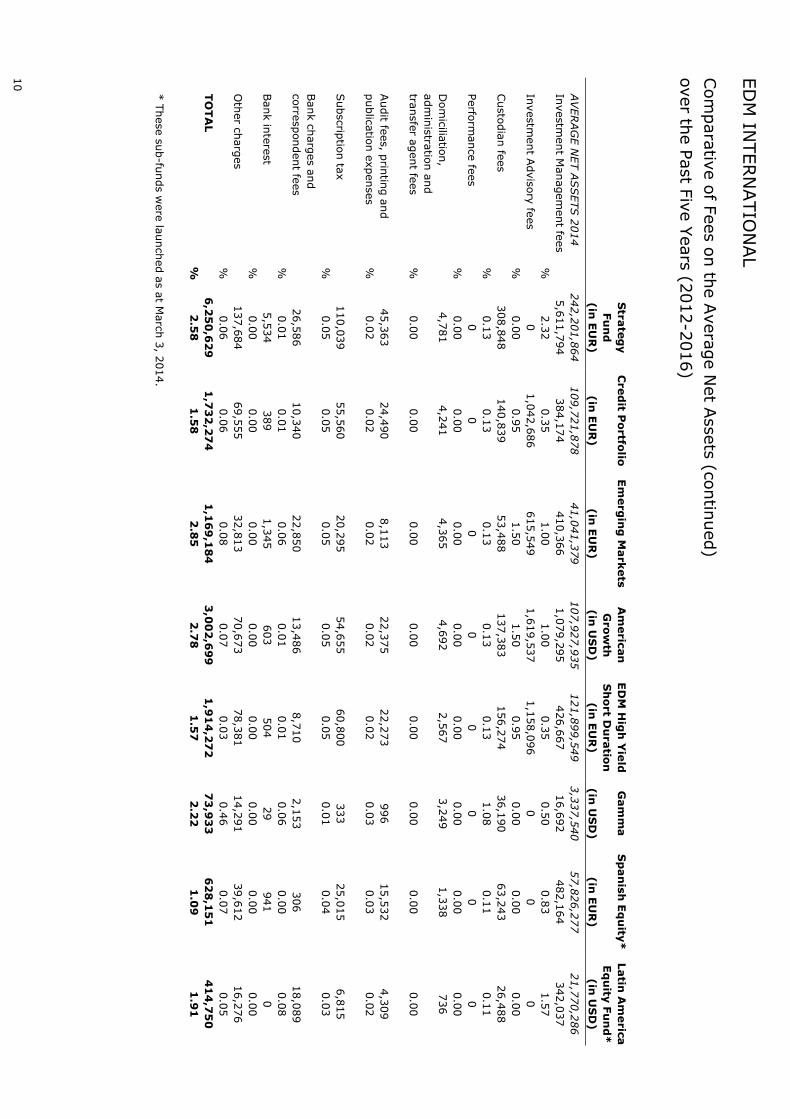
AVERAGENETASSETS2014
242,201,864
109,721,878
41,041,379
107,927,935
121,899,549
3,337,540
57,826,277
21,770,286
Investm
entManagementfees
5,611,794
384,174
410,366
1,079,295
426,667
16,692
482,164
342,037
%2.32
0.35
1.00
1.00
0.35
0.50
0.83
1.57
Investm
entAdviso
ryfees
01,042,686
615,549
1,619,537
1,158,096
00
0%
0.00
0.95
1.50
1.50
0.95
0.00
0.00
0.00
Custo
dianfees
308,848
140,839
53,488
137,383
156,274
36,190
63,243
26,488
%0.13
0.13
0.13
0.13
0.13
1.08
0.11
0.11
Perfo
rmance
fees
00
00
00
00
%0.00
0.00
0.00
0.00
0.00
0.00
0.00
0.00
Domicilia
tion,
4,781
4,241
4,365
4,692
2,567
3,249
1,338
736
administra
tionand
transfer
agentfees
%0.00
0.00
0.00
0.00
0.00
0.00
0.00
0.00
Auditfees,prin
tingand
45,363
24,490
8,113
22,375
22,273
996
15,532
4,309
publica
tionexpenses
%0.02
0.02
0.02
0.02
0.02
0.03
0.03
0.02
Subscrip
tiontax
110,039
55,560
20,295
54,655
60,800
333
25,015
6,815
%0.05
0.05
0.05
0.05
0.05
0.01
0.04
0.03
Bankchargesand
corre
spondentfees
26,586
10,340
22,850
13,486
8,710
2,153
306
18,089
%0.01
0.01
0.06
0.01
0.01
0.06
0.00
0.08
Bankinterest
5,534
389
1,345
603
504
29
941
0%
0.00
0.00
0.00
0.00
0.00
0.00
0.00
0.00
Othercharges
137,684
69,555
32,813
70,673
78,381
14,291
39,612
16,276
%0.06
0.06
0.08
0.07
0.03
0.46
0.07
0.05
TOTAL
6,250,629
1,732,274
1,169,184
3,002,699
1,914,272
73,933
628,151
414,750
%2.58
1.58
2.85
2.78
1.57
2.22
1.09
1.91
*These
sub-fu
ndswere
launchedasatMarch
3,2014.
EDMINTERNATIONAL
10
Comparativ
eofFeesontheAverageNetAsse
ts(co
ntin
ued)
overthePast
FiveYears
(2012-2016)
Stra
tegy
CreditPortfo
lioEmergingMarkets
Americ
an
EDMHighYield
Gamma
SpanishEquity
*Latin
Americ
a
Fund
Growth
ShortDuratio
nEquity
Fund*
(in
EUR)
(in
EUR)
(in
EUR)
(in
USD)
(in
EUR)
(in
USD)
(in
EUR)
(in
USD)
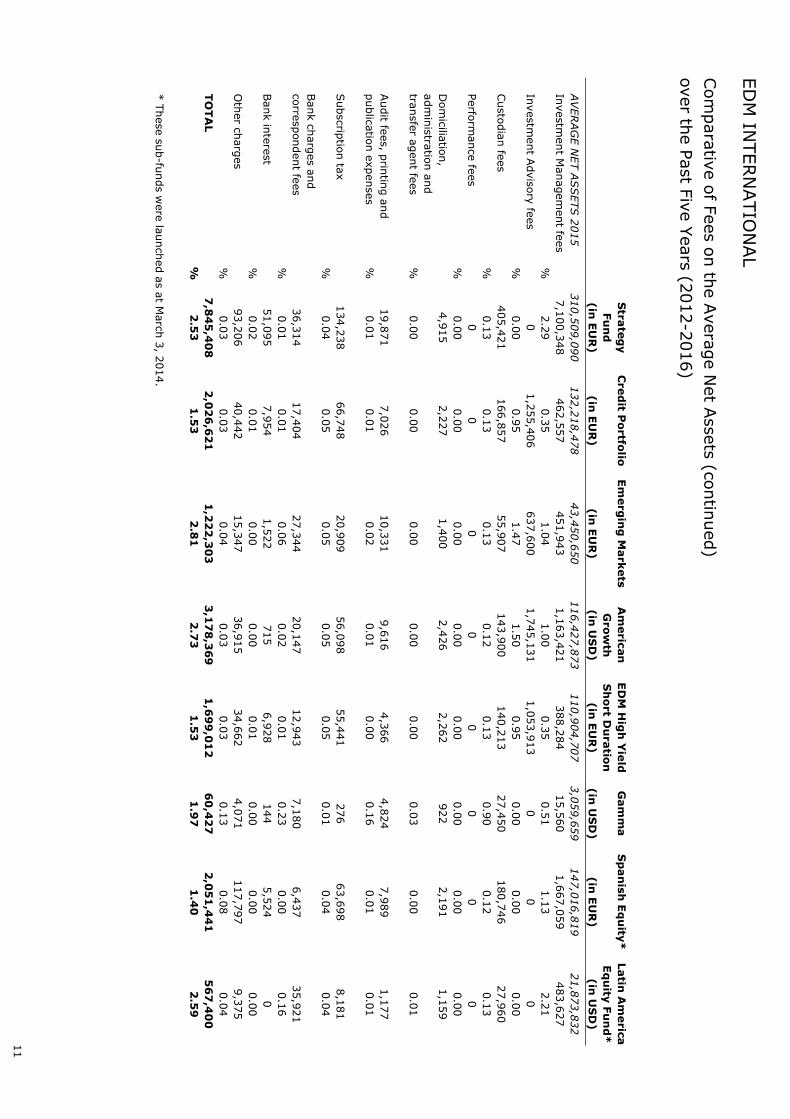
AVERAGENETASSETS2015
310,509,090
132,218,478
43,450,650
116,427,873
110,904,707
3,059,659
147,016,819
21,873,832
Investm
entManagementfees
7,100,348
462,557
451,943
1,163,421
388,284
15,560
1,667,059
483,627
%2.29
0.35
1.04
1.00
0.35
0.51
1.13
2.21
Investm
entAdviso
ryfees
01,255,406
637,600
1,745,131
1,053,913
00
0%
0.00
0.95
1.47
1.50
0.95
0.00
0.00
0.00
Custo
dianfees
405,421
166,857
55,907
143,900
140,213
27,450
180,746
27,960
%0.13
0.13
0.13
0.12
0.13
0.90
0.12
0.13
Perfo
rmance
fees
00
00
00
00
%0.00
0.00
0.00
0.00
0.00
0.00
0.00
0.00
Domicilia
tion,
4,915
2,227
1,400
2,426
2,262
922
2,191
1,159
administra
tionand
transfer
agentfees
%0.00
0.00
0.00
0.00
0.00
0.03
0.00
0.01
Auditfees,prin
tingand
19,871
7,026
10,331
9,616
4,366
4,824
7,989
1,177
publica
tionexpenses
%0.01
0.01
0.02
0.01
0.00
0.16
0.01
0.01
Subscrip
tiontax
134,238
66,748
20,909
56,098
55,441
276
63,698
8,181
%0.04
0.05
0.05
0.05
0.05
0.01
0.04
0.04
Bankchargesand
corre
spondentfees
36,314
17,404
27,344
20,147
12,943
7,180
6,437
35,921
%0.01
0.01
0.06
0.02
0.01
0.23
0.00
0.16
Bankinterest
51,095
7,954
1,522
715
6,928
144
5,524
0%
0.02
0.01
0.00
0.00
0.01
0.00
0.00
0.00
Othercharges
93,206
40,442
15,347
36,915
34,662
4,071
117,797
9,375
%0.03
0.03
0.04
0.03
0.03
0.13
0.08
0.04
TOTAL
7,845,408
2,026,621
1,222,303
3,178,369
1,699,012
60,427
2,051,441
567,400
%2.53
1.53
2.81
2.73
1.53
1.97
1.40
2.59
*These
sub-fu
ndswere
launchedasatMarch
3,2014.
EDMINTERNATIONAL
11
Comparativ
eofFeesontheAverageNetAsse
ts(co
ntin
ued)
overthePast
FiveYears
(2012-2016)
Stra
tegy
CreditPortfo
lioEmergingMarkets
Americ
an
EDMHighYield
Gamma
SpanishEquity
*1
Latin
Americ
a
Fund
Growth
ShortDuratio
nEquity
Fund*1
(in
EUR)
(in
EUR)
(in
EUR)
(in
USD)
(in
EUR)
(in
USD)
(in
EUR)
(in
USD)
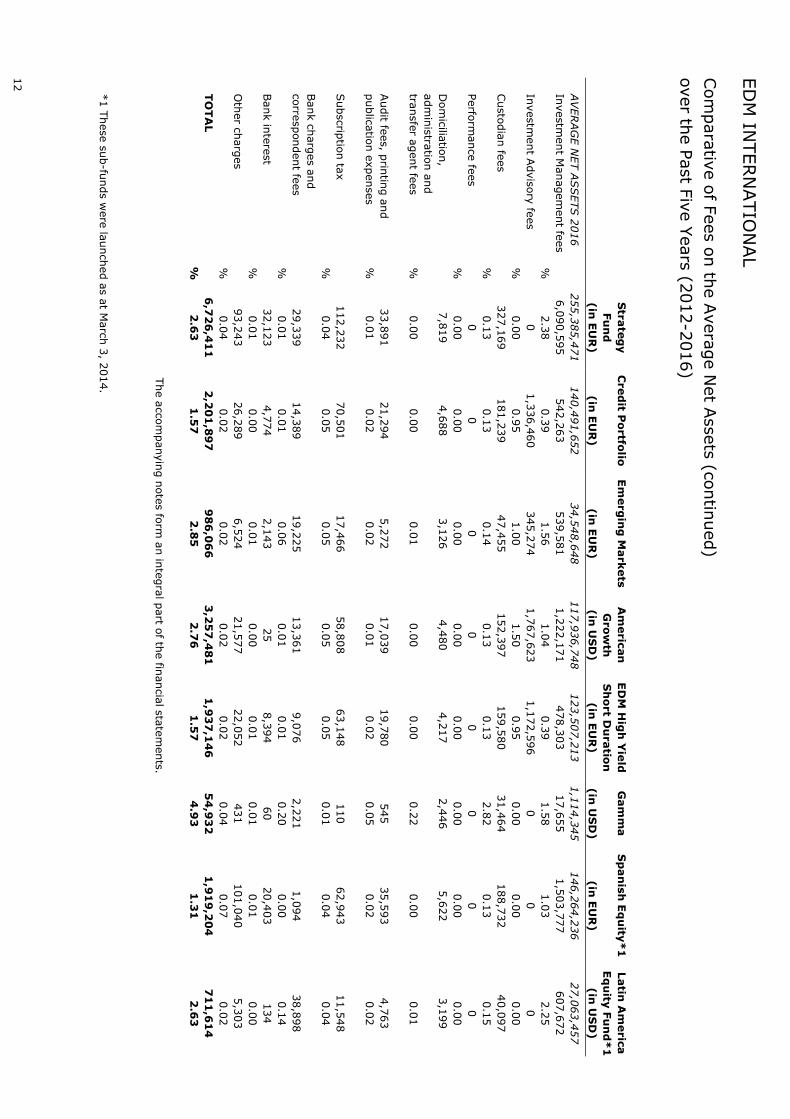
AVERAGENETASSETS2016
255,385,471
140,491,652
34,548,648
117,936,748
123,507,213
1,114,345
146,264,236
27,063,457
Investm
entManagementfees
6,090,595
542,263
539,581
1,222,171
478,303
17,655
1,503,777
607,672
%2.38
0.39
1.56
1.04
0.39
1.58
1.03
2.25
Investm
entAdviso
ryfees
01,336,460
345,274
1,767,623
1,172,596
00
0%
0.00
0.95
1.00
1.50
0.95
0.00
0.00
0.00
Custo
dianfees
327,169
181,239
47,455
152,397
159,580
31,464
188,732
40,097
%0.13
0.13
0.14
0.13
0.13
2.82
0.13
0.15
Perfo
rmance
fees
00
00
00
00
%0.00
0.00
0.00
0.00
0.00
0.00
0.00
0.00
Domicilia
tion,
7,819
4,688
3,126
4,480
4,217
2,446
5,622
3,199
administra
tionand
transfer
agentfees
%0.00
0.00
0.01
0.00
0.00
0.22
0.00
0.01
Auditfees,prin
tingand
33,891
21,294
5,272
17,039
19,780
545
35,593
4,763
publica
tionexpenses
%0.01
0.02
0.02
0.01
0.02
0.05
0.02
0.02
Subscrip
tiontax
112,232
70,501
17,466
58,808
63,148
110
62,943
11,548
%0.04
0.05
0.05
0.05
0.05
0.01
0.04
0.04
Bankchargesand
corre
spondentfees
29,339
14,389
19,225
13,361
9,076
2,221
1,094
38,898
%0.01
0.01
0.06
0.01
0.01
0.20
0.00
0.14
Bankinterest
32,123
4,774
2,143
25
8,394
60
20,403
134
%0.01
0.00
0.01
0.00
0.01
0.01
0.01
0.00
Othercharges
93,243
26,289
6,524
21,577
22,052
431
101,040
5,303
%0.04
0.02
0.02
0.02
0.02
0.04
0.07
0.02
TOTAL
6,726,411
2,201,897
986,066
3,257,481
1,937,146
54,932
1,919,204
711,614
%2.63
1.57
2.85
2.76
1.57
4.93
1.31
2.63
Theacco
mpanyingnotesform
anintegralpartofthefin
ancia
lsta
tements.
*1These
sub-fu
ndswere
launchedasatMarch
3,2014.
EDMINTERNATIONAL
12
Comparativ
eofFeesontheAverageNetAsse
ts(co
ntin
ued)
overthePast
FiveYears
(2012-2016)
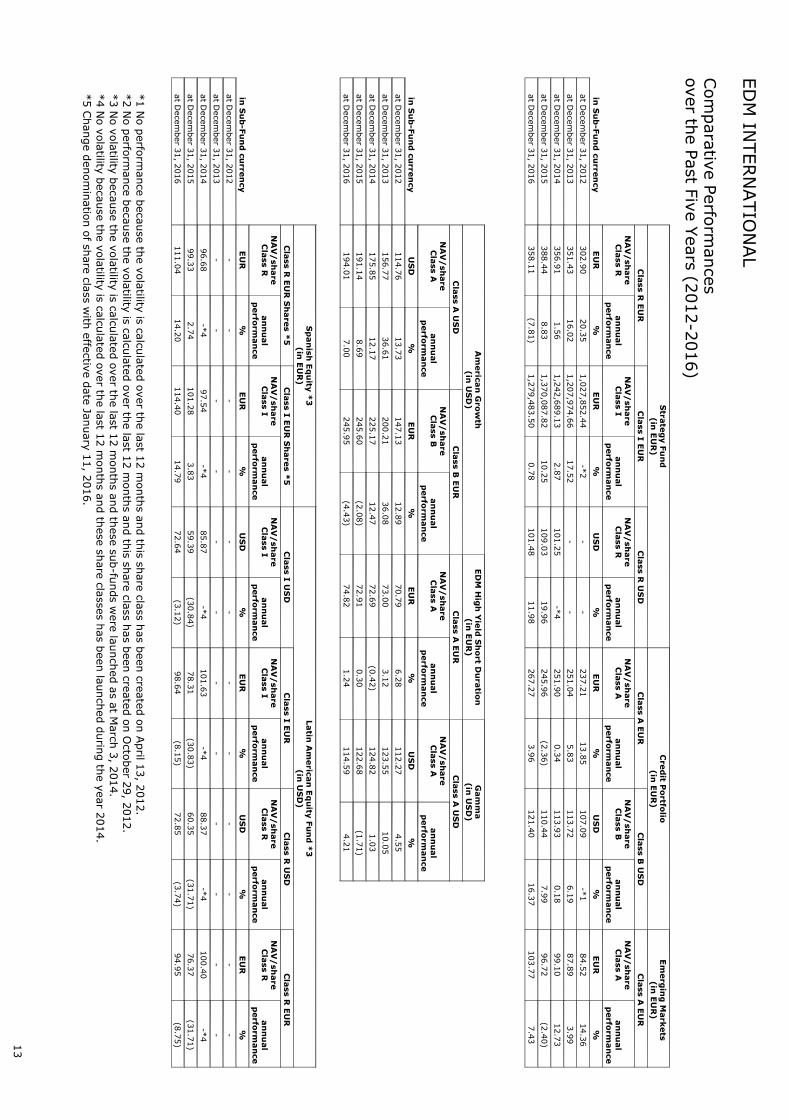
Comparativ
ePerfo
rmances
overthePast
FiveYears
(2012-2016)
Stra
tegyFund
(in
EUR)
CreditPortfo
lio(in
EUR)
EmergingMarkets
(in
EUR)
ClassREUR
ClassIEUR
ClassRUSD
ClassAEUR
ClassBUSD
ClassAEUR
NAV/share
ClassR
annual
perfo
rmance
NAV/share
ClassI
annual
perfo
rmance
NAV/share
ClassR
annual
perfo
rmance
NAV/share
ClassA
annual
perfo
rmance
NAV/share
ClassB
annual
perfo
rmance
NAV/share
ClassA
annual
perfo
rmance
inSub-Fundcurre
ncy
EUR
%EUR
%USD
%EUR
%USD
%EUR
%
atDecember31,2012
302.90
20.35
1,027,852.44
-*2
--
237.21
13.85
107.09
-*1
84.52
14.36
atDecember31,2013
351.43
16.02
1,207,974.66
17.52
--
251.04
5.83
113.72
6.19
87.89
3.99
atDecember31,2014
356.91
1.56
1,242,689.13
2.87
101.25
-*4
251.90
0.34
113.93
0.18
99.10
12.73
atDecember31,2015
388.44
8.83
1,370,087.82
10.25
109.03
19.96
245.96
(2.36)
110.44
7.99
96.72
(2.40)
atDecember31,2016
358.11
(7.81)
1,279,483.50
0.78
101.48
11.98
267.27
3.96
121.40
16.37
103.77
7.43
Americ
anGrowth
(in
USD)
EDMHighYield
ShortDuratio
n(in
EUR)
Gamma
(in
USD)
ClassAUSD
ClassBEUR
ClassAEUR
ClassAUSD
NAV/share
ClassA
annual
perfo
rmance
NAV/share
ClassB
annual
perfo
rmance
NAV/share
ClassA
annual
perfo
rmance
NAV/share
ClassA
annual
perfo
rmance
inSub-Fundcurre
ncy
USD
%EUR
%EUR
%USD
%
atDecember31,2012
114.76
13.73
147.13
12.89
70.79
6.28
112.27
4.55
atDecember31,2013
156.77
36.61
200.21
36.08
73.00
3.12
123.55
10.05
atDecember31,2014
175.85
12.17
225.17
12.47
72.69
(0.42)
124.82
1.03
atDecember31,2015
191.14
8.69
245.60
(2.08)
72.91
0.30
122.68
(1.71)
atDecember31,2016
194.01
7.00
245.95
(4.43)
74.82
1.24
114.59
4.21
SpanishEquity
*3
(in
EUR)
Latin
Americ
anEquity
Fund*3
(in
USD)
ClassREURShares*5
ClassIEURShares*5
ClassIUSD
ClassIEUR
ClassRUSD
ClassREUR
NAV/share
ClassR
annual
perfo
rmance
NAV/share
ClassI
annual
perfo
rmance
NAV/share
ClassI
annual
perfo
rmance
NAV/share
ClassI
annual
perfo
rmance
NAV/share
ClassR
annual
perfo
rmance
NAV/share
ClassR
annual
perfo
rmance
inSub-Fundcurre
ncy
EUR
%EUR
%USD
%EUR
%USD
%EUR
%
atDecember31,2012
--
--
--
--
--
--
atDecember31,2013
--
--
--
--
--
--
atDecember31,2014
96.68
-*4
97.54
-*4
85.87
-*4
101.63
-*4
88.37
-*4
100.40
-*4
atDecember31,2015
99.33
2.74
101.28
3.83
59.39
(30.84)
78.31
(30.83)
60.35
(31.71)
76.37
(31.71)
atDecember31,2016
111.04
14.20
114.40
14.79
72.64
(3.12)
98.64
(8.15)
72.85
(3.74)
94.95
(8.75)
*1Noperfo
rmance
because
thevolatility
iscalcu
latedoverthelast
12monthsandthisshare
class
hasbeencre
atedonApril
13,2012.
*2Noperfo
rmance
because
thevolatility
iscalcu
latedoverthelast
12monthsandthisshare
class
hasbeencre
atedonOcto
ber
29,2012.
*3Novolatility
because
thevolatility
iscalcu
latedoverthelast
12monthsandthese
sub-fu
ndswere
launchedasatMarch
3,2014.
*4Novolatility
because
thevolatility
iscalcu
latedoverthelast
12monthsandthese
share
classe
shasbeenlauncheddurin
gtheyear2014.
*5Changedenominatio
nofshare
class
with
effe
ctivedate
January
11,2016.
EDMINTERNATIONAL
13
DIRECTOR’S REPORT
The environment in 2016
The year 2016 will be remembered by two events that were unexpected: Brexit and the election of Donald Trump as 45thPresident of the United States. The biggest initial economic worries (weaker than expected Chinese economic growth andthe fall in oil prices) recovered quickly. There was no hard landing in China and finally the oil price rebounded, reassuringinvestors.
US GDP did not decelerate much and data was fairly positive growing +1.6%, which represents the seventh year ofpositive numbers in a row. Unemployment rate has fallen to 4.6% as the economy adds new jobs. The combination offiscal and tax policies could provide further stimulus.
In Europe the region is still growing at +1.6% but we should see an acceleration in 2017 and 2018.
Emerging Markets accelerated +4.3% as commodities and resources rebounded. The only big economy delivering rednumbers was Brazil, but it is anticipating a good recovery for 2017.
Monetary policies in Europe and USA have desynchronised further. The Fed increased rates in December for the secondtime in 10 years and the BCE kept its deposit rate (negative) and expanded their QE programme. Markets are anticipatingthree more increases in the US rates while in Europe rates will remain very low at least for the rest of the year.
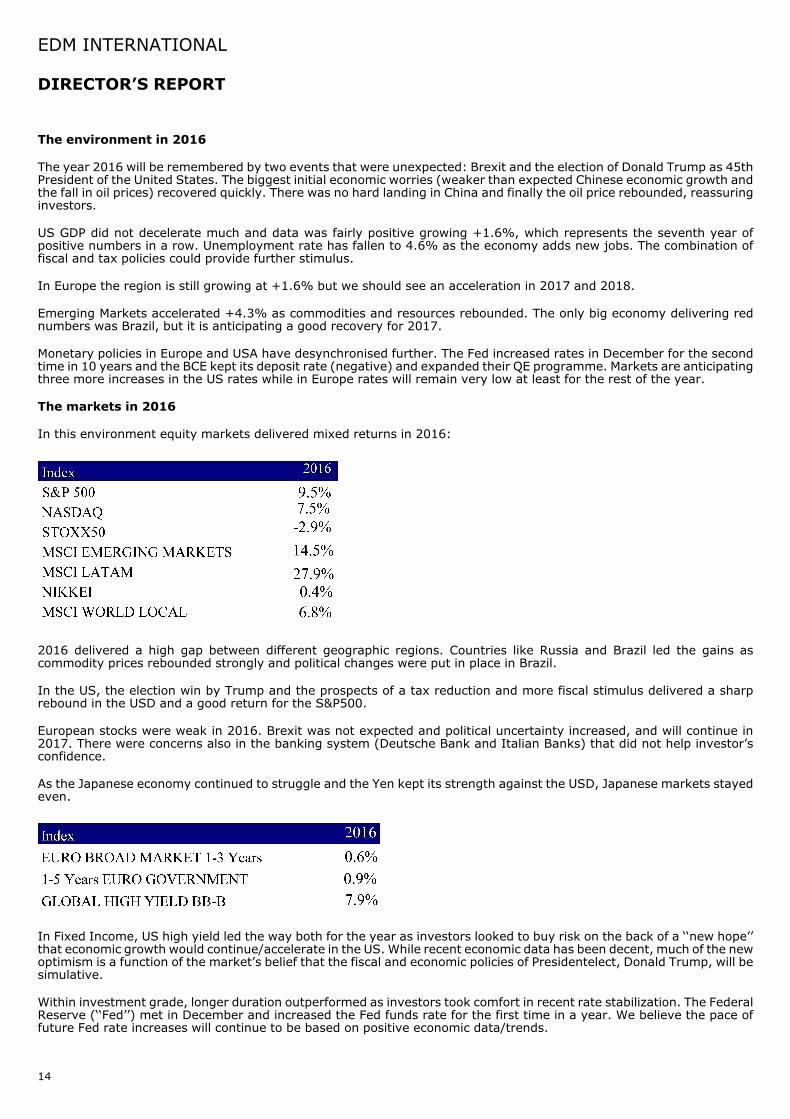
The markets in 2016
In this environment equity markets delivered mixed returns in 2016:
2016 delivered a high gap between different geographic regions. Countries like Russia and Brazil led the gains ascommodity prices rebounded strongly and political changes were put in place in Brazil.
In the US, the election win by Trump and the prospects of a tax reduction and more fiscal stimulus delivered a sharprebound in the USD and a good return for the S&P500.
European stocks were weak in 2016. Brexit was not expected and political uncertainty increased, and will continue in2017. There were concerns also in the banking system (Deutsche Bank and Italian Banks) that did not help investor’sconfidence.
As the Japanese economy continued to struggle and the Yen kept its strength against the USD, Japanese markets stayedeven.
In Fixed Income, US high yield led the way both for the year as investors looked to buy risk on the back of a ‘‘new hope’’that economic growth would continue/accelerate in the US. While recent economic data has been decent, much of the newoptimism is a function of the market’s belief that the fiscal and economic policies of President�elect, Donald Trump, will besimulative.
Within investment grade, longer duration outperformed as investors took comfort in recent rate stabilization. The FederalReserve (‘‘Fed’’) met in December and increased the Fed funds rate for the first time in a year. We believe the pace offuture Fed rate increases will continue to be based on positive economic data/trends.
EDM INTERNATIONAL
14
In Europe we saw major European rates rally during December (yields down). While European governments andinvestment grade corporates generated solid, positive performance, high yield outperformed. The European Central Bank(‘‘ECB’’) unexpectedly lowered its monthly target Quantitative Easing (‘‘QE’’) program while at the same time extendedthe timing of the program beyond what the market had expected.
Our SICAV
The management style for the SICAV has not changed during the year. Our strategy consists in investing in high qualityassets, trying not to overpay for this good companies, expecting markets to reward its quality in the medium term. Inequities we are convinced that sustained earnings growth will be the main driver for price appreciation. By selecting highquality growth stocks we expect to over perform the market in the long term.
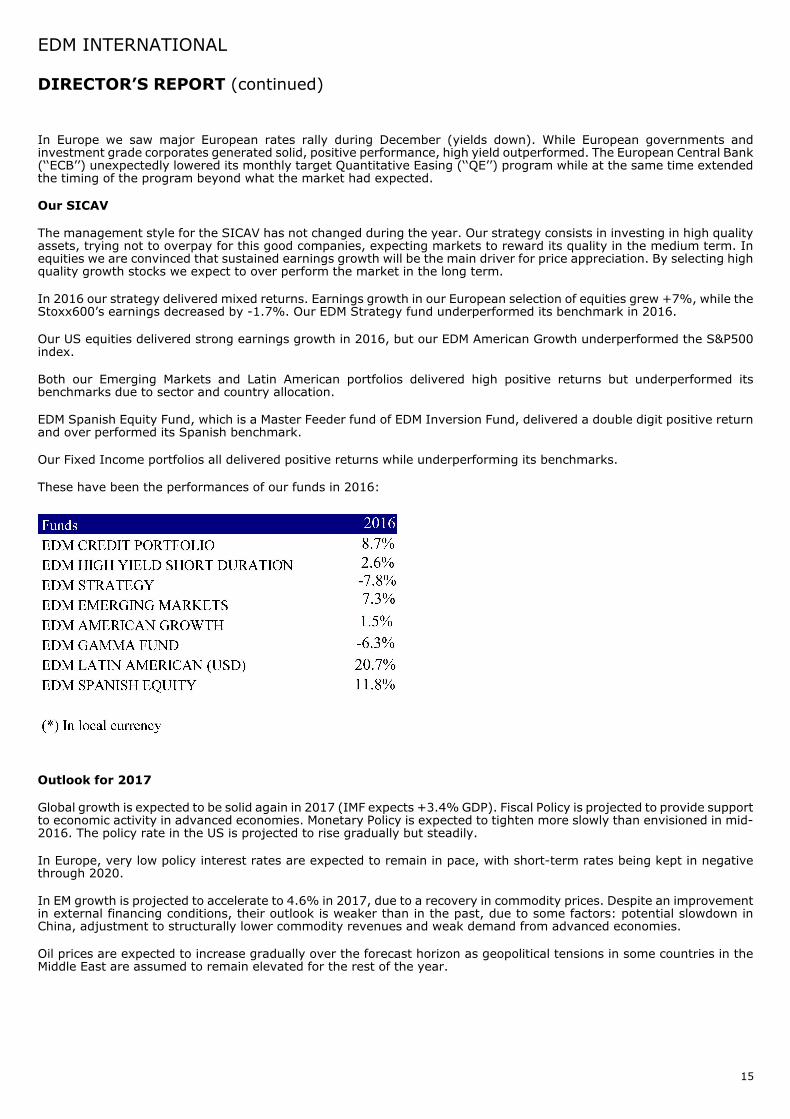
In 2016 our strategy delivered mixed returns. Earnings growth in our European selection of equities grew +7%, while theStoxx600’s earnings decreased by -1.7%. Our EDM Strategy fund underperformed its benchmark in 2016.
Our US equities delivered strong earnings growth in 2016, but our EDM American Growth underperformed the S&P500index.
Both our Emerging Markets and Latin American portfolios delivered high positive returns but underperformed itsbenchmarks due to sector and country allocation.
EDM Spanish Equity Fund, which is a Master Feeder fund of EDM Inversion Fund, delivered a double digit positive returnand over performed its Spanish benchmark.
Our Fixed Income portfolios all delivered positive returns while underperforming its benchmarks.
These have been the performances of our funds in 2016:
Outlook for 2017
Global growth is expected to be solid again in 2017 (IMF expects +3.4%GDP). Fiscal Policy is projected to provide supportto economic activity in advanced economies. Monetary Policy is expected to tighten more slowly than envisioned in mid-2016. The policy rate in the US is projected to rise gradually but steadily.
In Europe, very low policy interest rates are expected to remain in pace, with short-term rates being kept in negativethrough 2020.
In EM growth is projected to accelerate to 4.6% in 2017, due to a recovery in commodity prices. Despite an improvementin external financing conditions, their outlook is weaker than in the past, due to some factors: potential slowdown inChina, adjustment to structurally lower commodity revenues and weak demand from advanced economies.
Oil prices are expected to increase gradually over the forecast horizon as geopolitical tensions in some countries in theMiddle East are assumed to remain elevated for the rest of the year.
EDM INTERNATIONAL
15
DIRECTOR’S REPORT (continued)
Inflation will increase developed markets, but will remain under control.
In this environment, European Government bond yields should continue to remain low, but risks will be on the rise, asthey are at historical minimum levels. In the US they have already started its rise and will continue to do so.
For 2017 we expect that our selection of quality growth equities will continue to deliver steady earnings growth. Weexpect to achieve positive performance in our equity portfolios as valuations remain attractive.
The Board of Directors of the Company
April 20, 2017
The information stated in this report is historical and not necessarily indicative of future performance.
EDM INTERNATIONAL
16
DIRECTOR’S REPORT (continued)
Deloitte. REPORT OF THE RÉVISEUR D'ENTREPRISES AGRÉÉ
To the Shareholders of EDM International 11-13 Boulevard de la Foire L-1528 Luxembourg LUXEMBOURG
Deloitte Audit Société à responsabilité limitée
560, rue de Neudorf L-2220 Luxembourg BP. 1173 L-1011 Luxembourg
Following our appointment by the annual general meeting of the Shareholders dated May 24, 2016, we have audited the accompanying financial statements of EDM International (the "Company"), which comprise the statement of net assets and the statement of investments and other net assets as at December 31, 2016 and the combined statement of operations and the statement of changes in net assets for the year then ended, and a summary of significant accounting policies.
Responsibility of the Board of Directors of the of the SICAV for the financial statements
The Board of Directors of the SICAV is responsible for the preparation and fair presentation of these financial statements in accordance with Luxembourg legal and regulatory requirements relating to the preparation of the financial statements and for such internal control as the Board of Directors of the SICAV determines is necessary to enable the preparation of financial statements that are free from material misstatement, whether due to fraud or error.
Responsibility of the réviseur d'entreprises agréé
Our responsibility is to express an opinion on these financial statements based on our audit. We conducted our audit in accordance with International Standards on Auditing as adopted for Luxembourg by the Commission de Surveillance du Secteur Financier. Those standards require that we comply with ethical requirements and plan and perform the audit to obtain reasonable assurance about whether the financial statements are free from material misstatement.
An audit involves performing procedures to obtain audit evidence about the amounts and disclosures in the financial statements. The procedures selected depend on the réviseur d'entreprises agréé's judgement, including the assessment of the risks of material misstatement of the financial statements, whether due to fraud or error. In making those risk assessments, the réviseur d'entreprises agréé considers internal control relevant to the entity's preparation and fair presentation of the financial statements in order to design audit procedures that are appropriate in the circumstances, but not for the purpose of expressing an opinion on the effectiveness of the entity's internal control. An audit also includes evaluating the appropriateness of accounting policies used and the reasonableness of accounting estimates made by the Board of Directors of the SICAV, as well as evaluating the overall presentation of the financial statements.
We believe that the audit evidence we have obtained is sufficient and appropriate to provide a basis for our audit opinion.
Opinion
In our opinion, the financial statements give a true and fair view of the financial position of EDM International and of each of its Sub-Funds as at December 31, 2016 and of the results of their operations and changes in their net assets for the year then ended in accordance with Luxembourg legal and regulatory requirements relating to the preparation of the financial statements.
Société à responsabilité limitée au capital de 35.000 € RCS Luxembourg B 67.895 Autorisation d'établissement. 10022179
17
Deloitte.
REPORT OF THE RÉVISEUR D'ENTREPRISES AGRÉÉ (continued) Other information
The Board of Directors of the SICAV is responsible for the other information. The other information comprises the information included in the annual report but does not include the financial statements and our report of réviseur d'entreprises agréé thereon.
Our opinion on the financial statements does not cover the other information and we do not express any form of assurance conclusion thereon.
In connection with our audit of the financial statements, our responsibility is to read the other information and, in doing so, consider whether the other information is materially inconsistent with the financial statements or our knowledge obtained in the audit or otherwise appears to be materially misstated. If, based on the work we have performed, we conclude that there is a material misstatement of this other information, we are required to report this fact. We have nothing to report in this regard.
itte Audit, Cabinet de révision agréé
ayer, Réviseur d'Entreprises Agréé
April 20, 2017
18
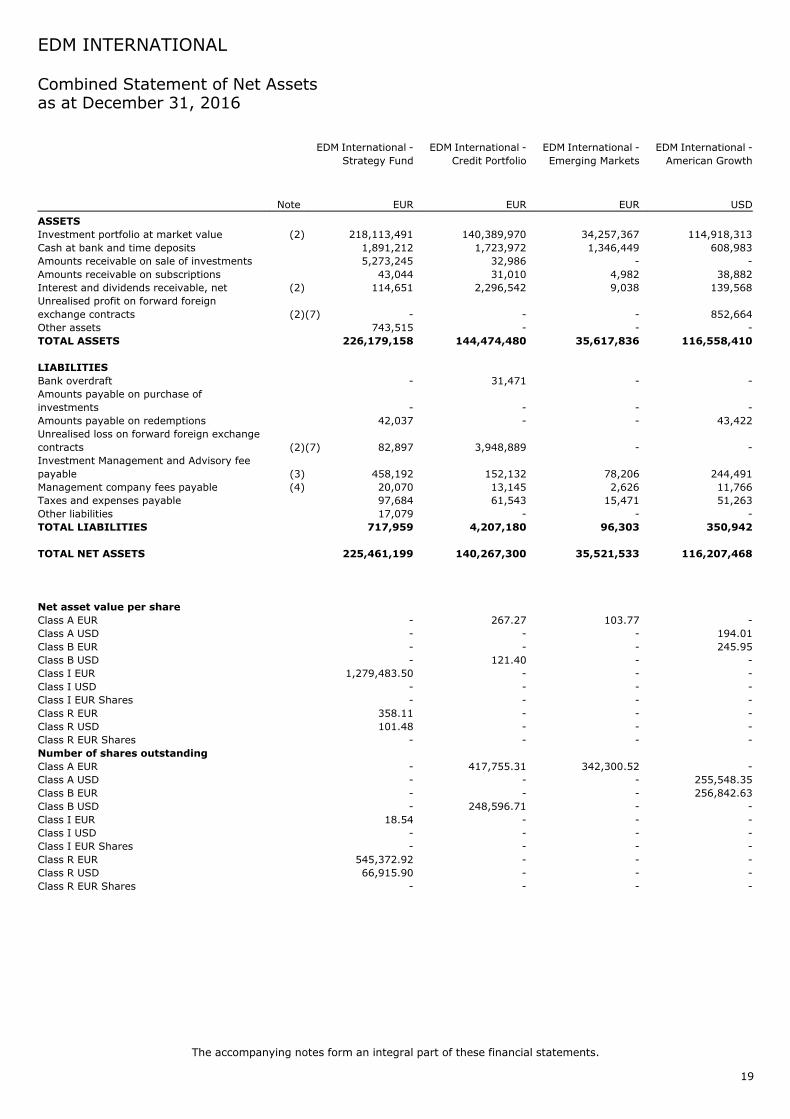
Combined Statement of Net Assetsas at December 31, 2016
EDM International -Strategy Fund
EDM International -Credit Portfolio
EDM International -Emerging Markets
EDM International -American Growth
Note EUR EUR EUR USD
ASSETS
Investment portfolio at market value (2) 218,113,491 140,389,970 34,257,367 114,918,313Cash at bank and time deposits 1,891,212 1,723,972 1,346,449 608,983Amounts receivable on sale of investments 5,273,245 32,986 - -Amounts receivable on subscriptions 43,044 31,010 4,982 38,882Interest and dividends receivable, net (2) 114,651 2,296,542 9,038 139,568Unrealised profit on forward foreignexchange contracts (2)(7) - - - 852,664Other assets 743,515 - - -TOTAL ASSETS 226,179,158 144,474,480 35,617,836 116,558,410
LIABILITIES
Bank overdraft - 31,471 - -Amounts payable on purchase ofinvestments - - - -Amounts payable on redemptions 42,037 - - 43,422Unrealised loss on forward foreign exchangecontracts (2)(7) 82,897 3,948,889 - -Investment Management and Advisory feepayable (3) 458,192 152,132 78,206 244,491Management company fees payable (4) 20,070 13,145 2,626 11,766Taxes and expenses payable 97,684 61,543 15,471 51,263Other liabilities 17,079 - - -TOTAL LIABILITIES 717,959 4,207,180 96,303 350,942
TOTAL NET ASSETS 225,461,199 140,267,300 35,521,533 116,207,468
Net asset value per share
Class A EUR - 267.27 103.77 -Class A USD - - - 194.01Class B EUR - - - 245.95Class B USD - 121.40 - -Class I EUR 1,279,483.50 - - -Class I USD - - - -Class I EUR Shares - - - -Class R EUR 358.11 - - -Class R USD 101.48 - - -Class R EUR Shares - - - -Number of shares outstanding
Class A EUR - 417,755.31 342,300.52 -Class A USD - - - 255,548.35Class B EUR - - - 256,842.63Class B USD - 248,596.71 - -Class I EUR 18.54 - - -Class I USD - - - -Class I EUR Shares - - - -Class R EUR 545,372.92 - - -Class R USD 66,915.90 - - -Class R EUR Shares - - - -
EDM INTERNATIONAL
The accompanying notes form an integral part of these financial statements.
19
EDM International -EDM High YieldShort Duration
EDM International -Gamma
EDM International -Spanish Equity*
EDM International -Latin American
Equity Fund
Note EUR USD EUR USD
ASSETS
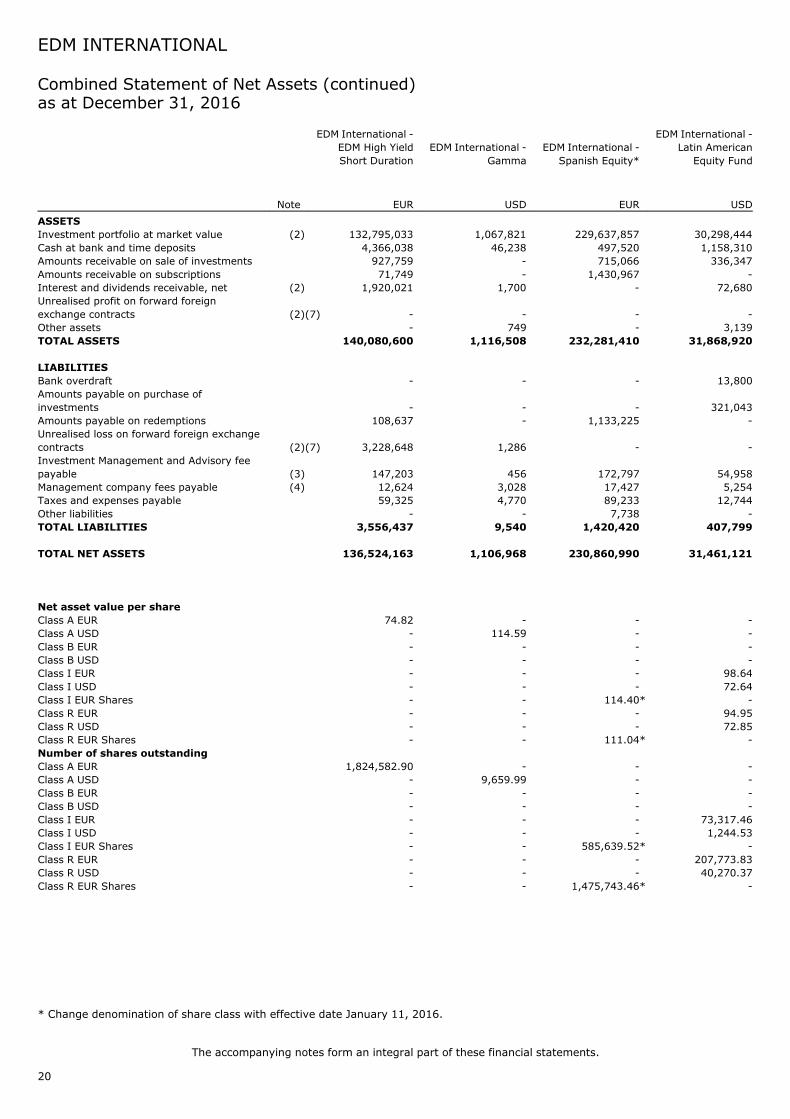
Investment portfolio at market value (2) 132,795,033 1,067,821 229,637,857 30,298,444Cash at bank and time deposits 4,366,038 46,238 497,520 1,158,310Amounts receivable on sale of investments 927,759 - 715,066 336,347Amounts receivable on subscriptions 71,749 - 1,430,967 -Interest and dividends receivable, net (2) 1,920,021 1,700 - 72,680Unrealised profit on forward foreignexchange contracts (2)(7) - - - -Other assets - 749 - 3,139TOTAL ASSETS 140,080,600 1,116,508 232,281,410 31,868,920
LIABILITIES
Bank overdraft - - - 13,800Amounts payable on purchase ofinvestments - - - 321,043Amounts payable on redemptions 108,637 - 1,133,225 -Unrealised loss on forward foreign exchangecontracts (2)(7) 3,228,648 1,286 - -Investment Management and Advisory feepayable (3) 147,203 456 172,797 54,958Management company fees payable (4) 12,624 3,028 17,427 5,254Taxes and expenses payable 59,325 4,770 89,233 12,744Other liabilities - - 7,738 -TOTAL LIABILITIES 3,556,437 9,540 1,420,420 407,799
TOTAL NET ASSETS 136,524,163 1,106,968 230,860,990 31,461,121
Net asset value per share
Class A EUR 74.82 - - -Class A USD - 114.59 - -Class B EUR - - - -Class B USD - - - -Class I EUR - - - 98.64Class I USD - - - 72.64Class I EUR Shares - - 114.40* -Class R EUR - - - 94.95Class R USD - - - 72.85Class R EUR Shares - - 111.04* -Number of shares outstanding
Class A EUR 1,824,582.90 - - -Class A USD - 9,659.99 - -Class B EUR - - - -Class B USD - - - -Class I EUR - - - 73,317.46Class I USD - - - 1,244.53Class I EUR Shares - - 585,639.52* -Class R EUR - - - 207,773.83Class R USD - - - 40,270.37Class R EUR Shares - - 1,475,743.46* -
EDM INTERNATIONAL
The accompanying notes form an integral part of these financial statements.
20
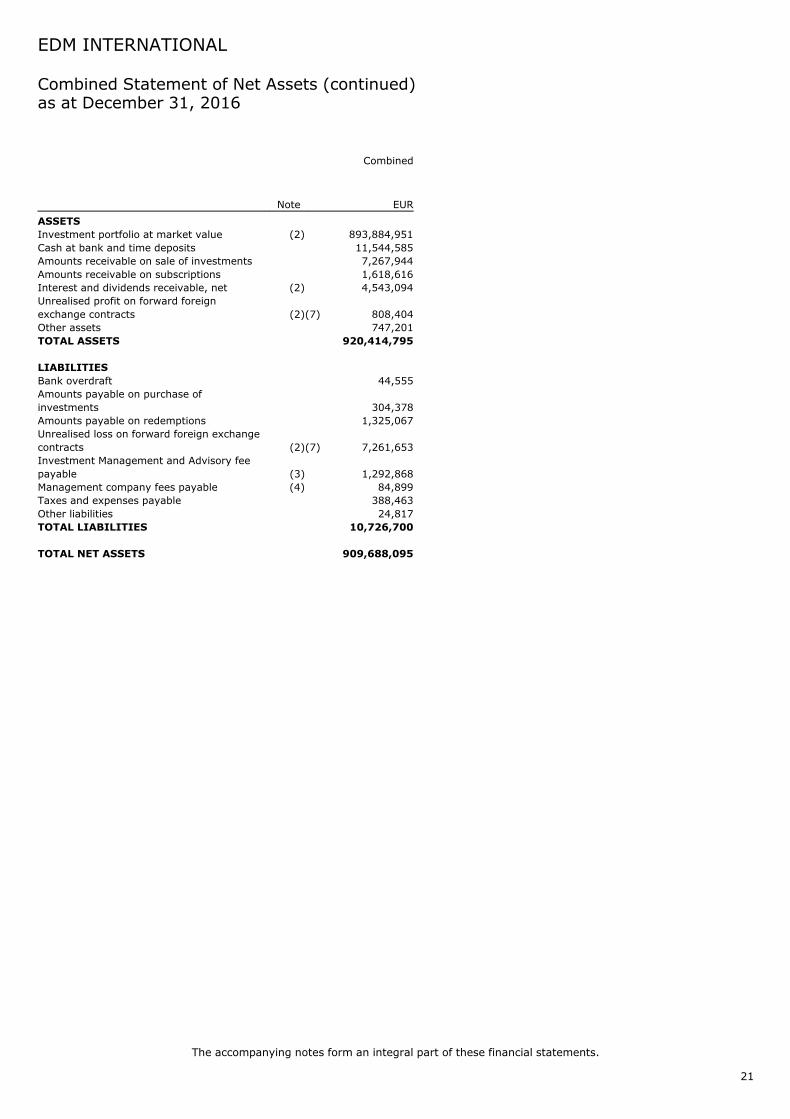
Combined Statement of Net Assets (continued)as at December 31, 2016
* Change denomination of share class with effective date January 11, 2016.
Combined
Note EUR
ASSETS
Investment portfolio at market value (2) 893,884,951Cash at bank and time deposits 11,544,585Amounts receivable on sale of investments 7,267,944Amounts receivable on subscriptions 1,618,616Interest and dividends receivable, net (2) 4,543,094Unrealised profit on forward foreignexchange contracts (2)(7) 808,404Other assets 747,201TOTAL ASSETS 920,414,795
LIABILITIES
Bank overdraft 44,555Amounts payable on purchase ofinvestments 304,378Amounts payable on redemptions 1,325,067Unrealised loss on forward foreign exchangecontracts (2)(7) 7,261,653Investment Management and Advisory feepayable (3) 1,292,868Management company fees payable (4) 84,899Taxes and expenses payable 388,463Other liabilities 24,817TOTAL LIABILITIES 10,726,700
TOTAL NET ASSETS 909,688,095
EDM INTERNATIONAL
The accompanying notes form an integral part of these financial statements.
21
Combined Statement of Net Assets (continued)as at December 31, 2016
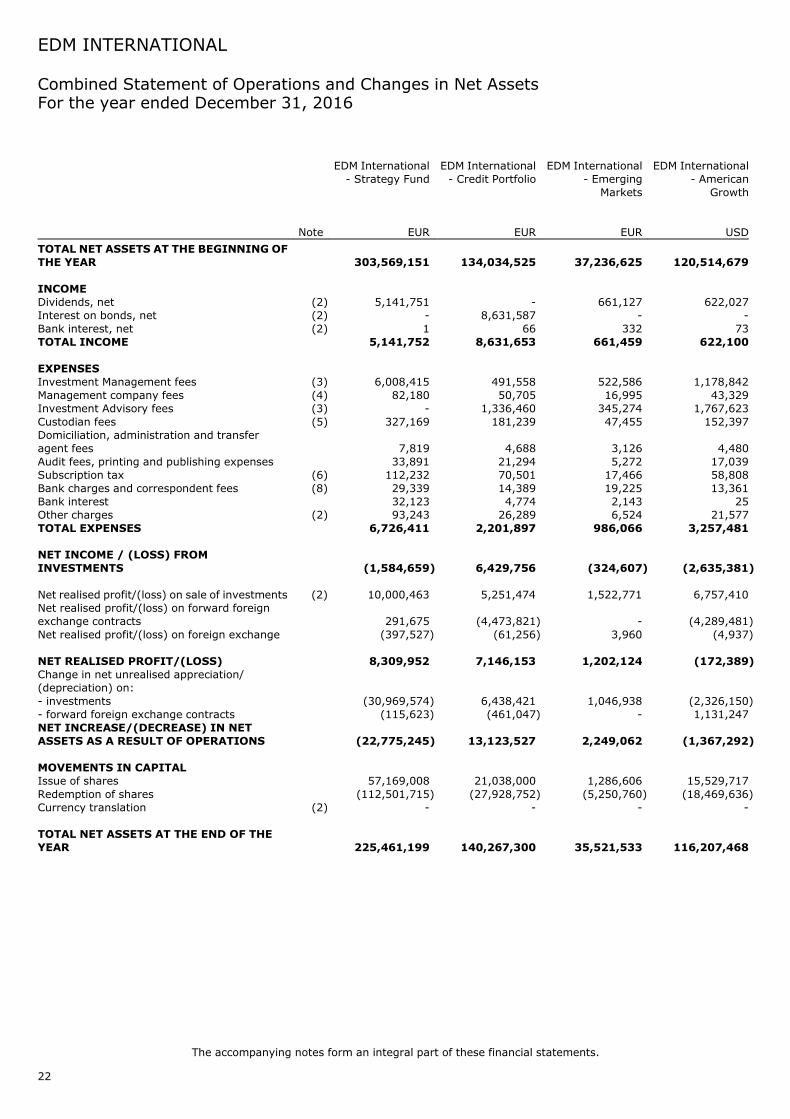
Combined Statement of Operations and Changes in Net AssetsFor the year ended December 31, 2016
EDM International- Strategy Fund
EDM International- Credit Portfolio
EDM International- Emerging
Markets
EDM International- American
Growth
Note EUR EUR EUR USD
TOTAL NET ASSETS AT THE BEGINNING OFTHE YEAR 303,569,151 134,034,525 37,236,625 120,514,679
INCOMEDividends, net (2) 5,141,751 - 661,127 622,027Interest on bonds, net (2) - 8,631,587 - -Bank interest, net (2) 1 66 332 73TOTAL INCOME 5,141,752 8,631,653 661,459 622,100
NET INCOME / (LOSS) FROMINVESTMENTS (1,584,659) 6,429,756 (324,607) (2,635,381)
Net realised profit/(loss) on sale of investments (2) 10,000,463 5,251,474 1,522,771 6,757,410Net realised profit/(loss) on forward foreignexchange contracts 291,675 (4,473,821) - (4,289,481)Net realised profit/(loss) on foreign exchange (397,527) (61,256) 3,960 (4,937)
NET REALISED PROFIT/(LOSS) 8,309,952 7,146,153 1,202,124 (172,389)Change in net unrealised appreciation/(depreciation) on:- investments (30,969,574) 6,438,421 1,046,938 (2,326,150)- forward foreign exchange contracts (115,623) (461,047) - 1,131,247NET INCREASE/(DECREASE) IN NETASSETS AS A RESULT OF OPERATIONS (22,775,245) 13,123,527 2,249,062 (1,367,292)
MOVEMENTS IN CAPITALIssue of shares 57,169,008 21,038,000 1,286,606 15,529,717Redemption of shares (112,501,715) (27,928,752) (5,250,760) (18,469,636)Currency translation (2) - - - -
TOTAL NET ASSETS AT THE END OF THEYEAR 225,461,199 140,267,300 35,521,533 116,207,468
EDM INTERNATIONAL
The accompanying notes form an integral part of these financial statements.
22
EDM International- EDM High YieldShort Duration
EDM International- Gamma
EDM International- Spanish Equity
EDM International- Latin American
Equity Fund
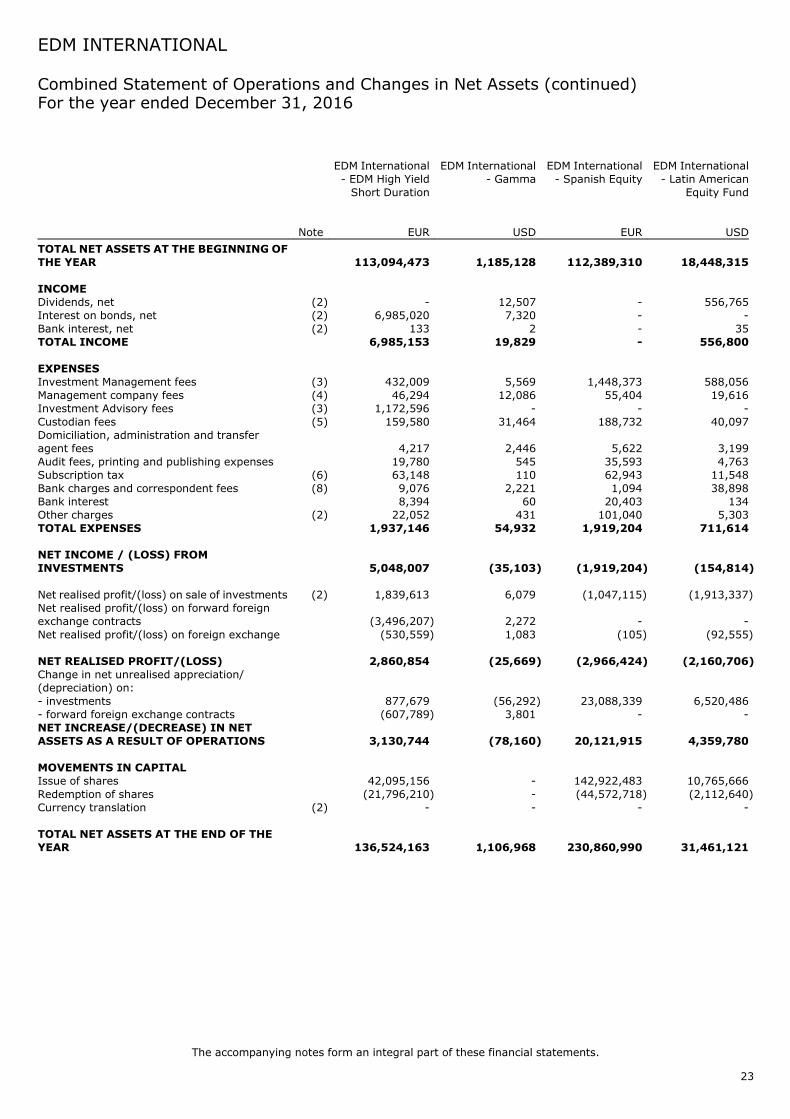
Note EUR USD EUR USD
TOTAL NET ASSETS AT THE BEGINNING OFTHE YEAR 113,094,473 1,185,128 112,389,310 18,448,315
INCOMEDividends, net (2) - 12,507 - 556,765Interest on bonds, net (2) 6,985,020 7,320 - -Bank interest, net (2) 133 2 - 35TOTAL INCOME 6,985,153 19,829 - 556,800
NET INCOME / (LOSS) FROMINVESTMENTS 5,048,007 (35,103) (1,919,204) (154,814)
Net realised profit/(loss) on sale of investments (2) 1,839,613 6,079 (1,047,115) (1,913,337)Net realised profit/(loss) on forward foreignexchange contracts (3,496,207) 2,272 - -Net realised profit/(loss) on foreign exchange (530,559) 1,083 (105) (92,555)
NET REALISED PROFIT/(LOSS) 2,860,854 (25,669) (2,966,424) (2,160,706)Change in net unrealised appreciation/(depreciation) on:- investments 877,679 (56,292) 23,088,339 6,520,486- forward foreign exchange contracts (607,789) 3,801 - -NET INCREASE/(DECREASE) IN NETASSETS AS A RESULT OF OPERATIONS 3,130,744 (78,160) 20,121,915 4,359,780
MOVEMENTS IN CAPITALIssue of shares 42,095,156 - 142,922,483 10,765,666Redemption of shares (21,796,210) - (44,572,718) (2,112,640)Currency translation (2) - - - -
TOTAL NET ASSETS AT THE END OF THEYEAR 136,524,163 1,106,968 230,860,990 31,461,121
EDM INTERNATIONAL
The accompanying notes form an integral part of these financial statements.
23
Combined Statement of Operations and Changes in Net Assets (continued)For the year ended December 31, 2016
Combined
Note EUR
TOTAL NET ASSETS AT THE BEGINNING OFTHE YEAR 829,338,281
INCOMEDividends, net (2) 6,932,339Interest on bonds, net (2) 15,623,547Bank interest, net (2) 636TOTAL INCOME 22,556,522
Net realised profit/(loss) on sale of investments (2) 22,165,596Net realised profit/(loss) on forward foreignexchange contracts (11,743,021)Net realised profit/(loss) on foreign exchange (1,076,892)
NET REALISED PROFIT/(LOSS) 14,316,333Change in net unrealised appreciation/(depreciation) on:- investments 4,405,049- forward foreign exchange contracts (108,329)NET INCREASE/(DECREASE) IN NETASSETS AS A RESULT OF OPERATIONS 18,613,053
MOVEMENTS IN CAPITALIssue of shares 289,441,694Redemption of shares (231,564,045)Currency translation (2) 3,859,112
TOTAL NET ASSETS AT THE END OF THEYEAR 909,688,095
EDM INTERNATIONAL
The accompanying notes form an integral part of these financial statements.
24
Combined Statement of Operations and Changes in Net Assets (continued)For the year ended December 31, 2016
Changes in the Number of Shares for the year ended December 31, 2016
EDM International -Strategy Fund
EDM International -Credit Portfolio
EDM International -Emerging Markets
Capitalisation Class A EURNumber of shares outstanding at the beginning of the year - 463,294.47 384,992.15Number of shares issued - 46,865.97 12,799.74Number of shares repurchased - (92,405.13) (55,491.37)Number of shares outstanding at the end of the year - 417,755.31 342,300.52
Capitalisation Class A USDNumber of shares outstanding at the beginning of the year - - -Number of shares issued - - -Number of shares repurchased - - -Number of shares outstanding at the end of the year - - -
Capitalisation Class B EURNumber of shares outstanding at the beginning of the year - - -Number of shares issued - - -Number of shares repurchased - - -Number of shares outstanding at the end of the year - - -
Capitalisation Class B USDNumber of shares outstanding at the beginning of the year - 197,523.07 -Number of shares issued - 88,421.67 -Number of shares repurchased - (37,348.03) -Number of shares outstanding at the end of the year - 248,596.71 -
Capitalisation Class I EURNumber of shares outstanding at the beginning of the year 27.91 - -Number of shares issued 3.08 - -Number of shares repurchased (12.45) - -Number of shares outstanding at the end of the year 18.54 - -
December 31, 2016 - Net asset value per shareCapitalisation Class A EUR - 267.27 103.77Capitalisation Class A USD - - -Capitalisation Class B EUR - - -Capitalisation Class B USD - 121.40 -Capitalisation Class I EUR 1,279,483.50 - -Capitalisation Class I USD - - -Capitalisation Class I EUR Shares - - -Capitalisation Class R EUR 358.11 - -Capitalisation Class R USD 101.48 - -Capitalisation Class R EUR Shares - - -
EDM INTERNATIONAL
The accompanying notes form an integral part of these financial statements.
25
EDM International -Strategy Fund
EDM International -Credit Portfolio
EDM International -Emerging Markets
Capitalisation Class I USDNumber of shares outstanding at the beginning of the year - - -Number of shares issued - - -Number of shares repurchased - - -Number of shares outstanding at the end of the year - - -
Capitalisation Class I EUR SharesNumber of shares outstanding at the beginning of the year - - -Number of shares issued - - -Number of shares repurchased - - -Number of shares outstanding at the end of the year - - -
Capitalisation Class R EURNumber of shares outstanding at the beginning of the year 661,455.83 - -Number of shares issued 146,178.67 - -Number of shares repurchased (262,261.58) - -Number of shares outstanding at the end of the year 545,372.92 - -
Capitalisation Class R USDNumber of shares outstanding at the beginning of the year 83,611.52 - -Number of shares issued 6,270.24 - -Number of shares repurchased (22,965.86) - -Number of shares outstanding at the end of the year 66,915.90 - -
Capitalisation Class R EUR SharesNumber of shares outstanding at the beginning of the year - - -Number of shares issued - - -Number of shares repurchased - - -Number of shares outstanding at the end of the year - - -
EDM International -Strategy Fund
EDM International -Credit Portfolio
EDM International -Emerging Markets
EUR EUR EURDecember 31, 2015 - Net asset value per share
Capitalisation Class A EUR - 245.96 96.72Capitalisation Class A USD - - -Capitalisation Class B EUR - - -Capitalisation Class B USD - 110.44 -Capitalisation Class I EUR 1,370,087.82 - -Capitalisation Class I USD - - -Capitalisation Class R EUR 388.44 - -Capitalisation Class R USD 109.03 - -
December 31, 2014 - Net asset value per shareCapitalisation Class A EUR - 251.90 99.10Capitalisation Class A USD - - -Capitalisation Class B EUR - - -Capitalisation Class B USD - 113.93 -Capitalisation Class I EUR 1,242,689.13 - -Capitalisation Class I USD - - -Capitalisation Class R EUR 356.91 - -Capitalisation Class R USD 101.25 - -
EDM INTERNATIONAL
The accompanying notes form an integral part of these financial statements.
26
Changes in the Number of Shares for the year ended December 31, 2016(continued)
Statistics (continued)
EDM International -American Growth
EDM International -EDM High Yield Short
DurationEDM International -
GammaCapitalisation Class A EURNumber of shares outstanding at the beginning of the year - 1,551,253.77 -Number of shares issued - 569,532.32 -Number of shares repurchased - (296,203.19) -Number of shares outstanding at the end of the year - 1,824,582.90 -
Capitalisation Class A USDNumber of shares outstanding at the beginning of the year 279,400.75 - 9,659.99Number of shares issued 28,983.06 - -Number of shares repurchased (52,835.46) - -Number of shares outstanding at the end of the year 255,548.35 - 9,659.99
Capitalisation Class B EURNumber of shares outstanding at the beginning of the year 251,539.75 - -Number of shares issued 38,546.26 - -Number of shares repurchased (33,243.38) - -Number of shares outstanding at the end of the year 256,842.63 - -
Capitalisation Class B USDNumber of shares outstanding at the beginning of the year - - -Number of shares issued - - -Number of shares repurchased - - -Number of shares outstanding at the end of the year - - -
Capitalisation Class I EURNumber of shares outstanding at the beginning of the year - - -Number of shares issued - - -Number of shares repurchased - - -Number of shares outstanding at the end of the year - - -
December 31, 2016 - Net asset value per shareCapitalisation Class A EUR - 74.82 -Capitalisation Class A USD 194.01 - 114.59Capitalisation Class B EUR 245.95 - -Capitalisation Class B USD - - -Capitalisation Class I EUR - - -Capitalisation Class I USD - - -Capitalisation Class I EUR Shares - - -Capitalisation Class R EUR - - -Capitalisation Class R USD - - -Capitalisation Class R EUR Shares - - -
EDM INTERNATIONAL
The accompanying notes form an integral part of these financial statements.
27
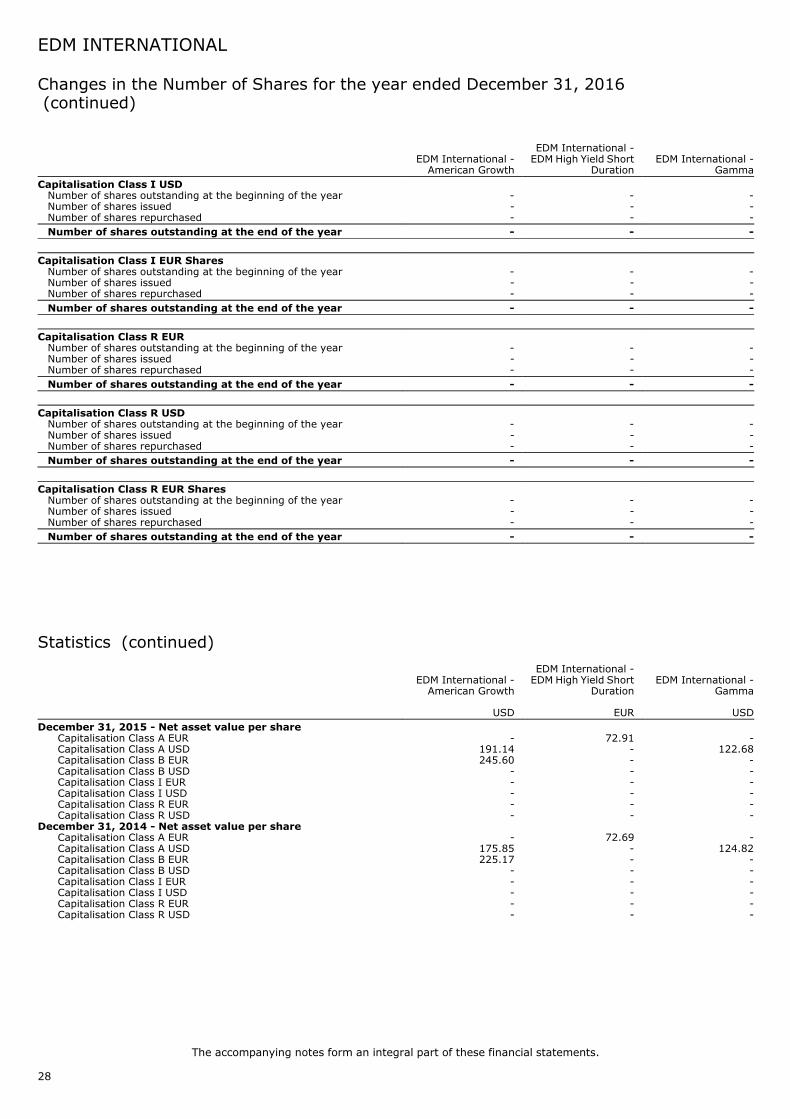
Changes in the Number of Shares for the year ended December 31, 2016(continued)
Statistics (continued)
EDM International -American Growth
EDM International -EDM High Yield Short
DurationEDM International -
GammaCapitalisation Class I USDNumber of shares outstanding at the beginning of the year - - -Number of shares issued - - -Number of shares repurchased - - -Number of shares outstanding at the end of the year - - -
Capitalisation Class I EUR SharesNumber of shares outstanding at the beginning of the year - - -Number of shares issued - - -Number of shares repurchased - - -Number of shares outstanding at the end of the year - - -
Capitalisation Class R EURNumber of shares outstanding at the beginning of the year - - -Number of shares issued - - -Number of shares repurchased - - -Number of shares outstanding at the end of the year - - -
Capitalisation Class R USDNumber of shares outstanding at the beginning of the year - - -Number of shares issued - - -Number of shares repurchased - - -Number of shares outstanding at the end of the year - - -
Capitalisation Class R EUR SharesNumber of shares outstanding at the beginning of the year - - -Number of shares issued - - -Number of shares repurchased - - -Number of shares outstanding at the end of the year - - -
EDM International -American Growth
EDM International -EDM High Yield Short
DurationEDM International -
Gamma
USD EUR USDDecember 31, 2015 - Net asset value per share
Capitalisation Class A EUR - 72.91 -Capitalisation Class A USD 191.14 - 122.68Capitalisation Class B EUR 245.60 - -Capitalisation Class B USD - - -Capitalisation Class I EUR - - -Capitalisation Class I USD - - -Capitalisation Class R EUR - - -Capitalisation Class R USD - - -
December 31, 2014 - Net asset value per shareCapitalisation Class A EUR - 72.69 -Capitalisation Class A USD 175.85 - 124.82Capitalisation Class B EUR 225.17 - -Capitalisation Class B USD - - -Capitalisation Class I EUR - - -Capitalisation Class I USD - - -Capitalisation Class R EUR - - -Capitalisation Class R USD - - -
EDM INTERNATIONAL
The accompanying notes form an integral part of these financial statements.
28
Changes in the Number of Shares for the year ended December 31, 2016(continued)
Statistics (continued)
EDM International -Spanish Equity*
EDM International -Latin American
Equity FundCapitalisation Class A EURNumber of shares outstanding at the beginning of the year - -Number of shares issued - -Number of shares repurchased - -Number of shares outstanding at the end of the year - -
Capitalisation Class A USDNumber of shares outstanding at the beginning of the year - -Number of shares issued - -Number of shares repurchased - -Number of shares outstanding at the end of the year - -
Capitalisation Class B EURNumber of shares outstanding at the beginning of the year - -Number of shares issued - -Number of shares repurchased - -Number of shares outstanding at the end of the year - -
Capitalisation Class B USDNumber of shares outstanding at the beginning of the year - -Number of shares issued - -Number of shares repurchased - -Number of shares outstanding at the end of the year - -
Capitalisation Class I EURNumber of shares outstanding at the beginning of the year - 59,869.74Number of shares issued - 13,447.72Number of shares repurchased - -Number of shares outstanding at the end of the year - 73,317.46
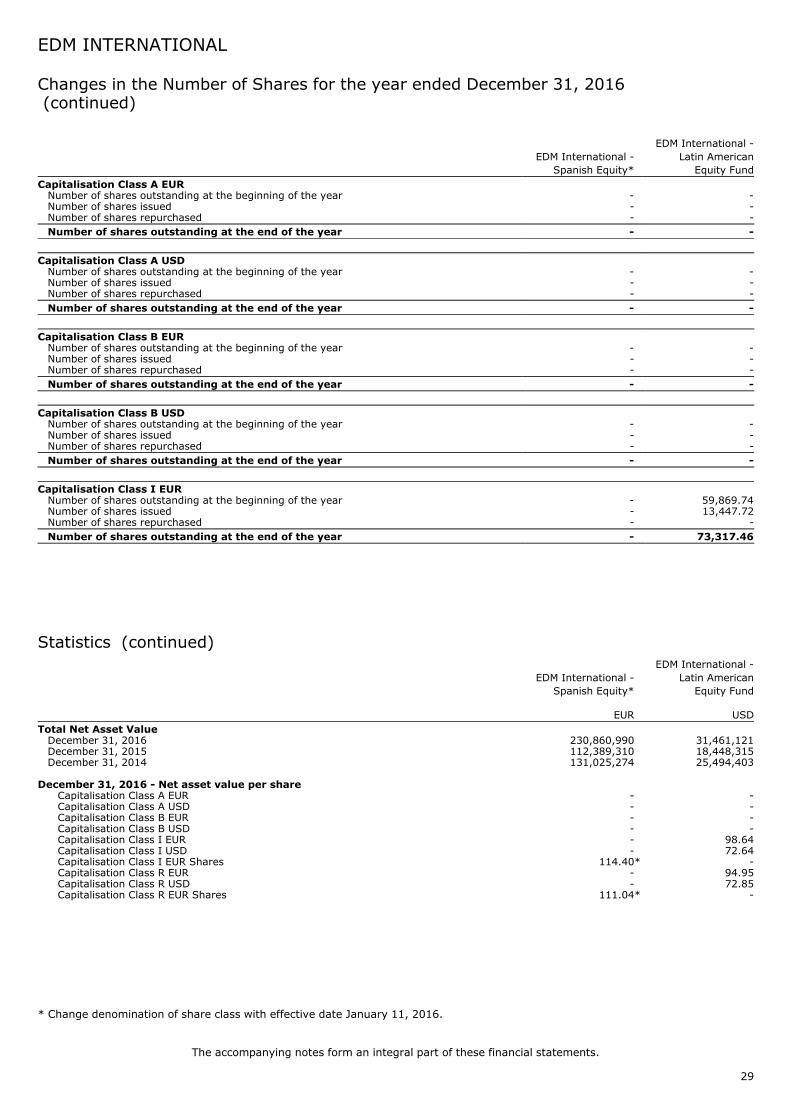
December 31, 2016 - Net asset value per shareCapitalisation Class A EUR - -Capitalisation Class A USD - -Capitalisation Class B EUR - -Capitalisation Class B USD - -Capitalisation Class I EUR - 98.64Capitalisation Class I USD - 72.64Capitalisation Class I EUR Shares 114.40* -Capitalisation Class R EUR - 94.95Capitalisation Class R USD - 72.85Capitalisation Class R EUR Shares 111.04* -
EDM INTERNATIONAL
The accompanying notes form an integral part of these financial statements.
29
Changes in the Number of Shares for the year ended December 31, 2016(continued)
Statistics (continued)
* Change denomination of share class with effective date January 11, 2016.
EDM International -Spanish Equity*
EDM International -Latin American
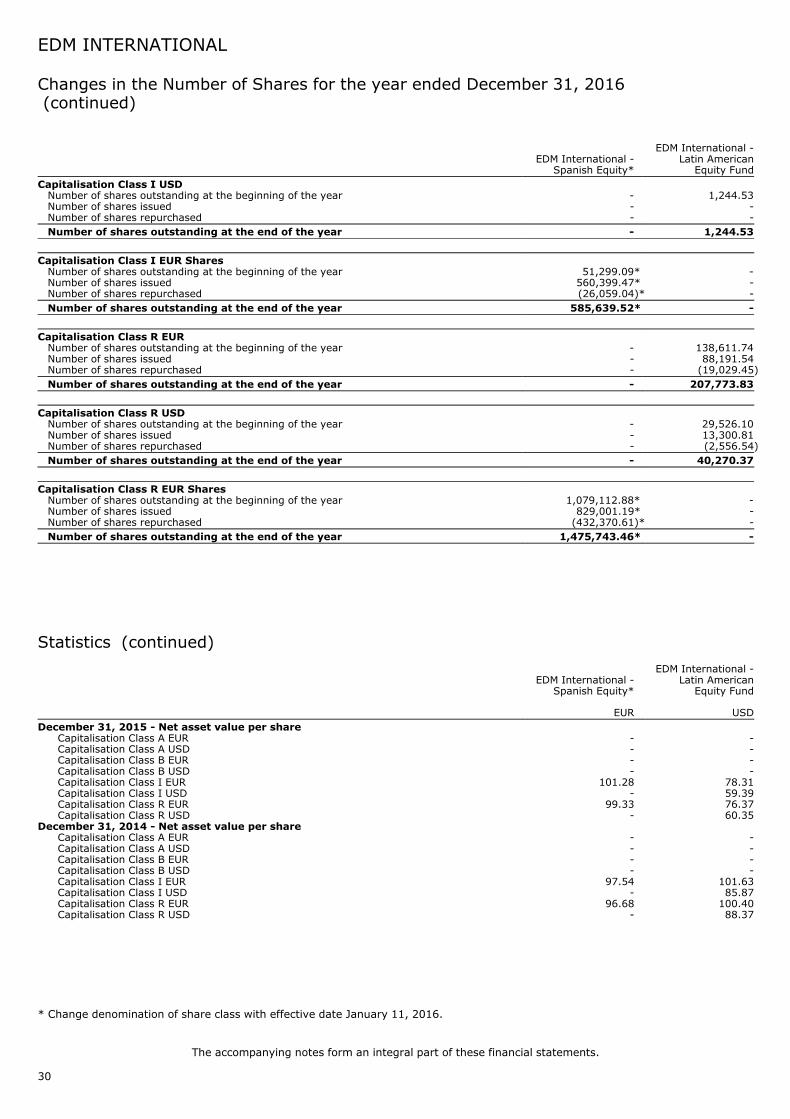
Equity FundCapitalisation Class I USDNumber of shares outstanding at the beginning of the year - 1,244.53Number of shares issued - -Number of shares repurchased - -Number of shares outstanding at the end of the year - 1,244.53
Capitalisation Class I EUR SharesNumber of shares outstanding at the beginning of the year 51,299.09* -Number of shares issued 560,399.47* -Number of shares repurchased (26,059.04)* -Number of shares outstanding at the end of the year 585,639.52* -
Capitalisation Class R EURNumber of shares outstanding at the beginning of the year - 138,611.74Number of shares issued - 88,191.54Number of shares repurchased - (19,029.45)Number of shares outstanding at the end of the year - 207,773.83
Capitalisation Class R USDNumber of shares outstanding at the beginning of the year - 29,526.10Number of shares issued - 13,300.81Number of shares repurchased - (2,556.54)Number of shares outstanding at the end of the year - 40,270.37
Capitalisation Class R EUR SharesNumber of shares outstanding at the beginning of the year 1,079,112.88* -Number of shares issued 829,001.19* -Number of shares repurchased (432,370.61)* -Number of shares outstanding at the end of the year 1,475,743.46* -
EDM International -Spanish Equity*
EDM International -Latin American
Equity Fund
EUR USDDecember 31, 2015 - Net asset value per share
Capitalisation Class A EUR - -Capitalisation Class A USD - -Capitalisation Class B EUR - -Capitalisation Class B USD - -Capitalisation Class I EUR 101.28 78.31Capitalisation Class I USD - 59.39Capitalisation Class R EUR 99.33 76.37Capitalisation Class R USD - 60.35
December 31, 2014 - Net asset value per shareCapitalisation Class A EUR - -Capitalisation Class A USD - -Capitalisation Class B EUR - -Capitalisation Class B USD - -Capitalisation Class I EUR 97.54 101.63Capitalisation Class I USD - 85.87Capitalisation Class R EUR 96.68 100.40Capitalisation Class R USD - 88.37
EDM INTERNATIONAL
The accompanying notes form an integral part of these financial statements.
30
Changes in the Number of Shares for the year ended December 31, 2016(continued)
Statistics (continued)
* Change denomination of share class with effective date January 11, 2016.
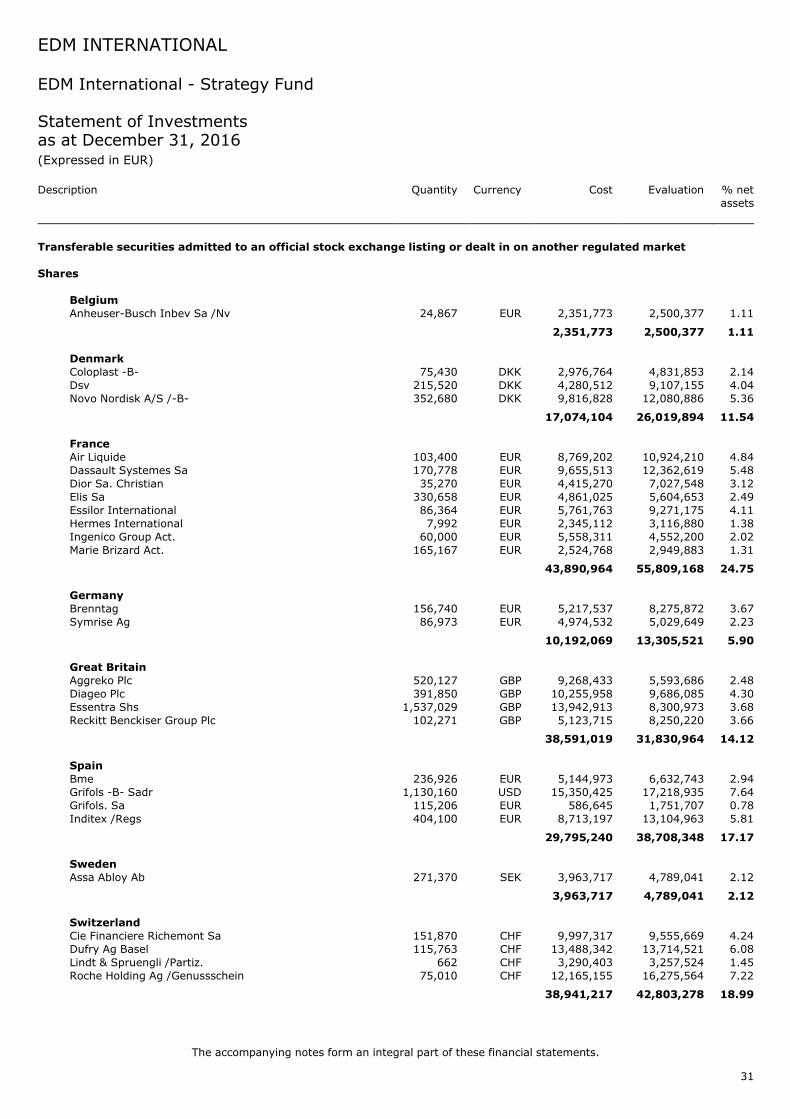
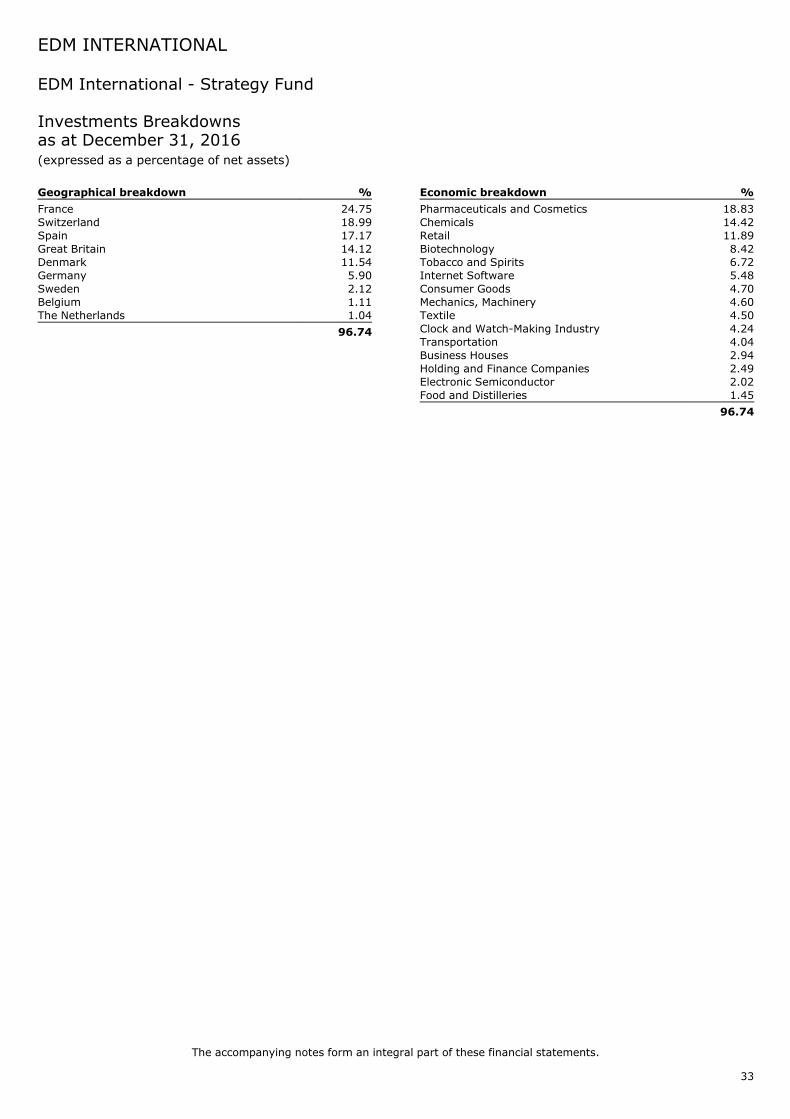
EDM International - Strategy Fund
Statement of Investmentsas at December 31, 2016(Expressed in EUR)
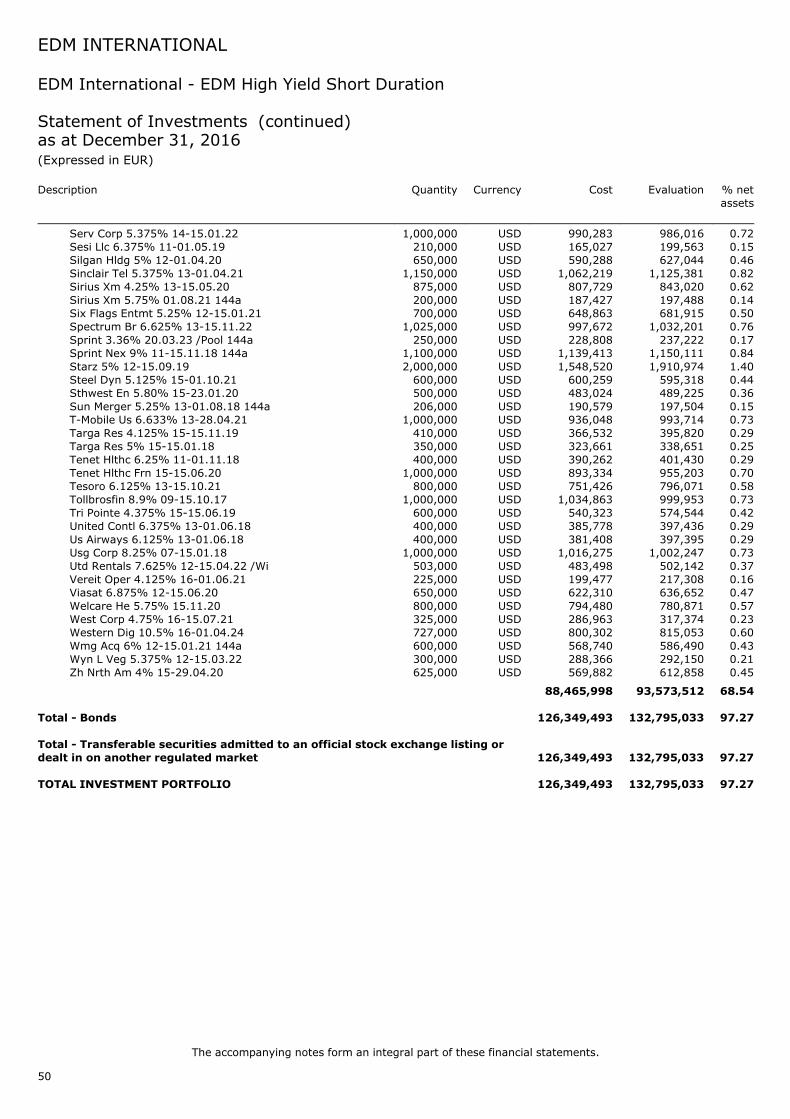
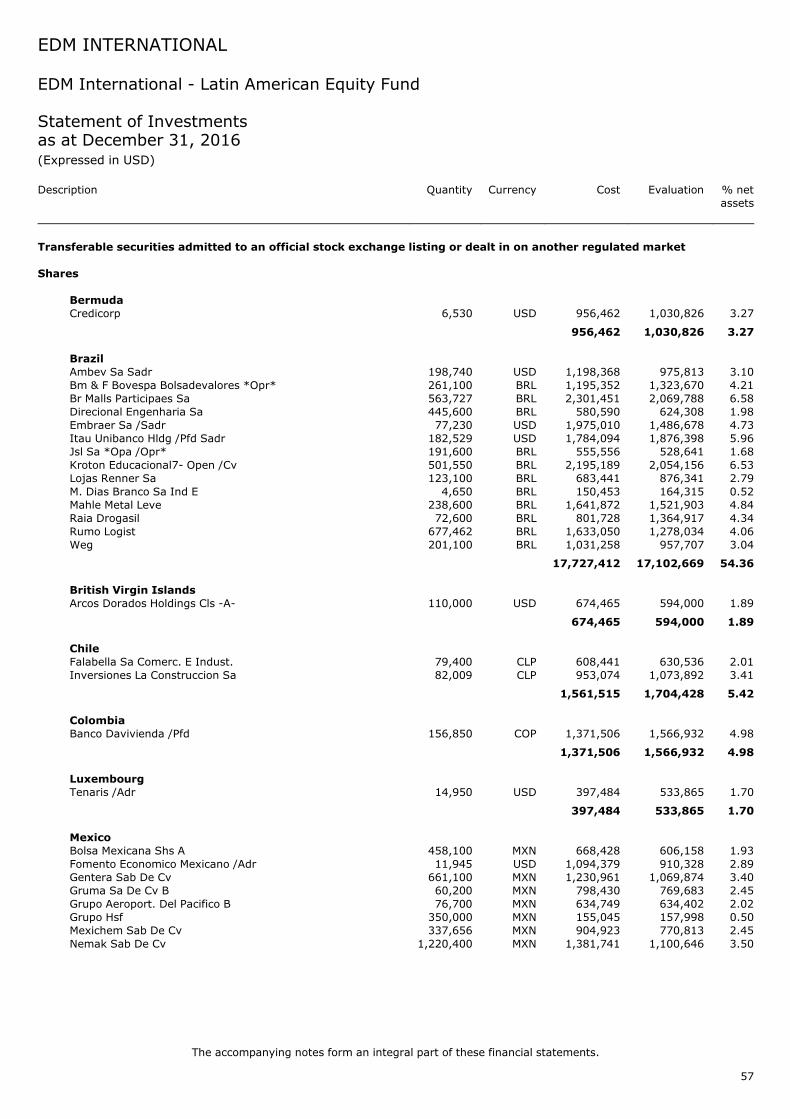
Total - Transferable securities admitted to an official stock exchange listing ordealt in on another regulated market 126,349,493 132,795,033 97.27
TOTAL INVESTMENT PORTFOLIO 126,349,493 132,795,033 97.27
EDM INTERNATIONAL
The accompanying notes form an integral part of these financial statements.
50
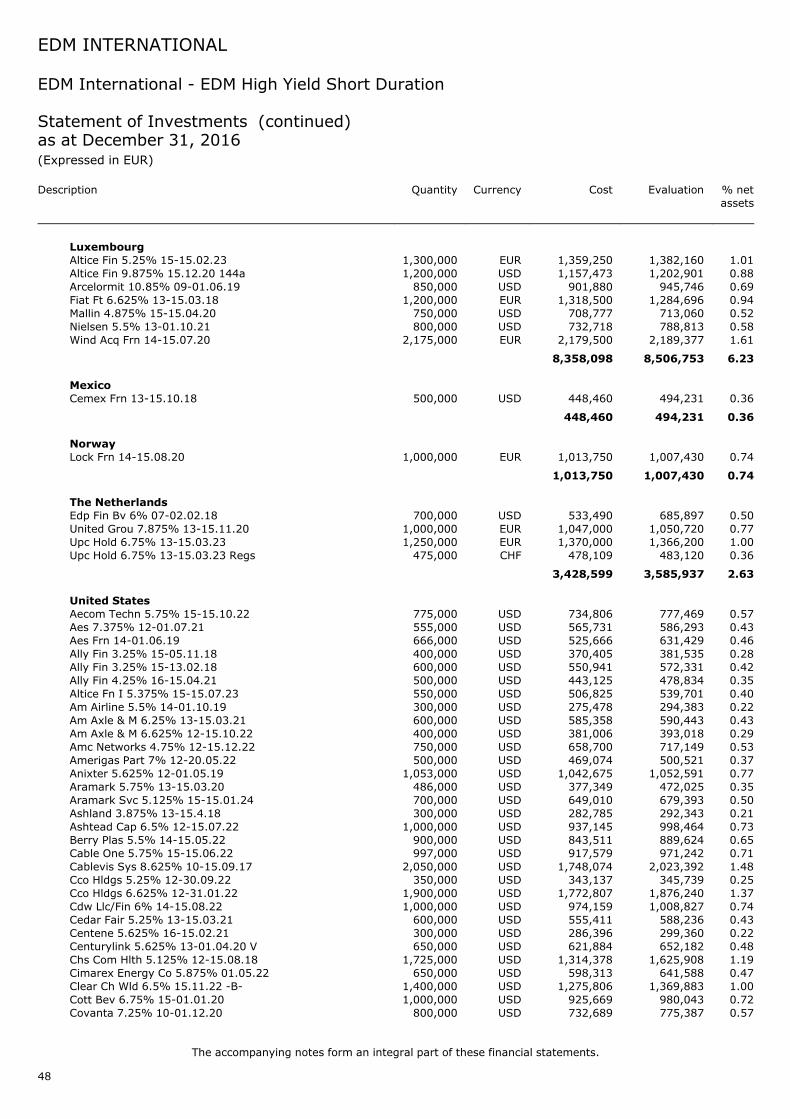
EDM International - EDM High Yield Short Duration
Statement of Investments (continued)as at December 31, 2016(Expressed in EUR)
EDM International - EDM High Yield Short Duration
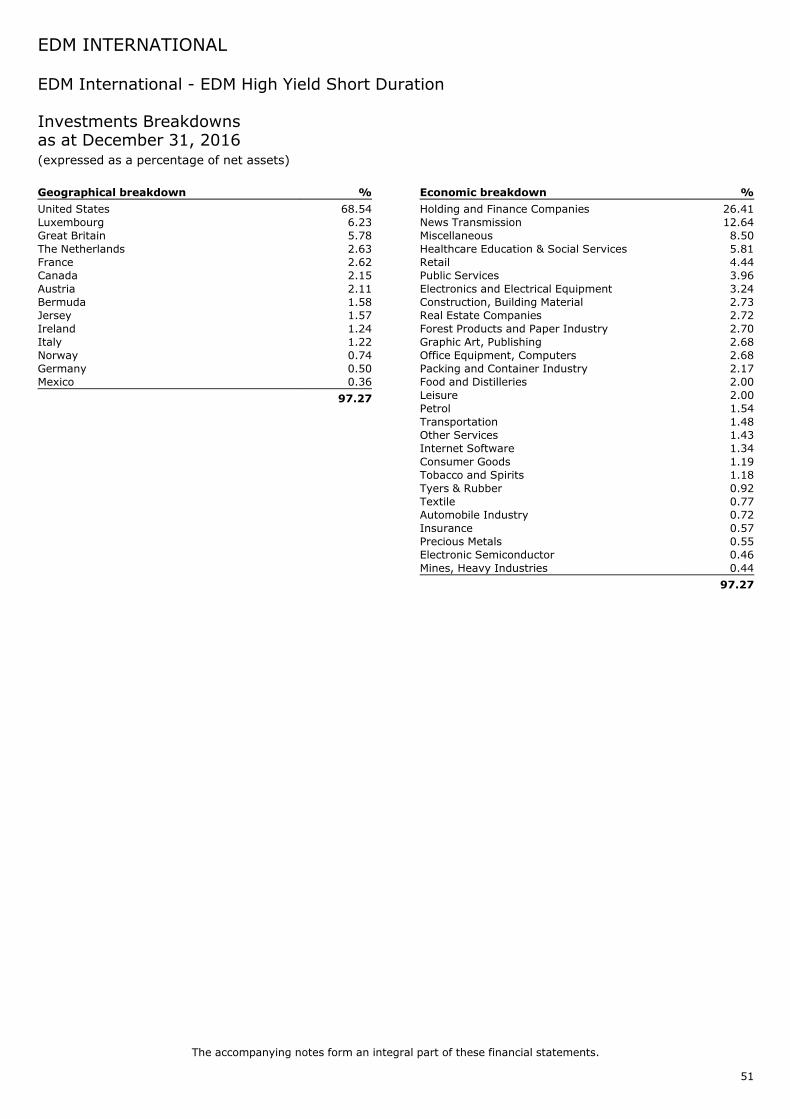
Investments Breakdownsas at December 31, 2016(expressed as a percentage of net assets)
Geographical breakdown %
United States 68.54Luxembourg 6.23Great Britain 5.78The Netherlands 2.63France 2.62Canada 2.15Austria 2.11Bermuda 1.58Jersey 1.57Ireland 1.24Italy 1.22Norway 0.74Germany 0.50Mexico 0.36
97.27
Economic breakdown %
Holding and Finance Companies 26.41News Transmission 12.64Miscellaneous 8.50Healthcare Education & Social Services 5.81Retail 4.44Public Services 3.96Electronics and Electrical Equipment 3.24Construction, Building Material 2.73Real Estate Companies 2.72Forest Products and Paper Industry 2.70Graphic Art, Publishing 2.68Office Equipment, Computers 2.68Packing and Container Industry 2.17Food and Distilleries 2.00Leisure 2.00Petrol 1.54Transportation 1.48Other Services 1.43Internet Software 1.34Consumer Goods 1.19Tobacco and Spirits 1.18Tyers & Rubber 0.92Textile 0.77Automobile Industry 0.72Insurance 0.57Precious Metals 0.55Electronic Semiconductor 0.46Mines, Heavy Industries 0.44
97.27
EDM INTERNATIONAL
The accompanying notes form an integral part of these financial statements.
51
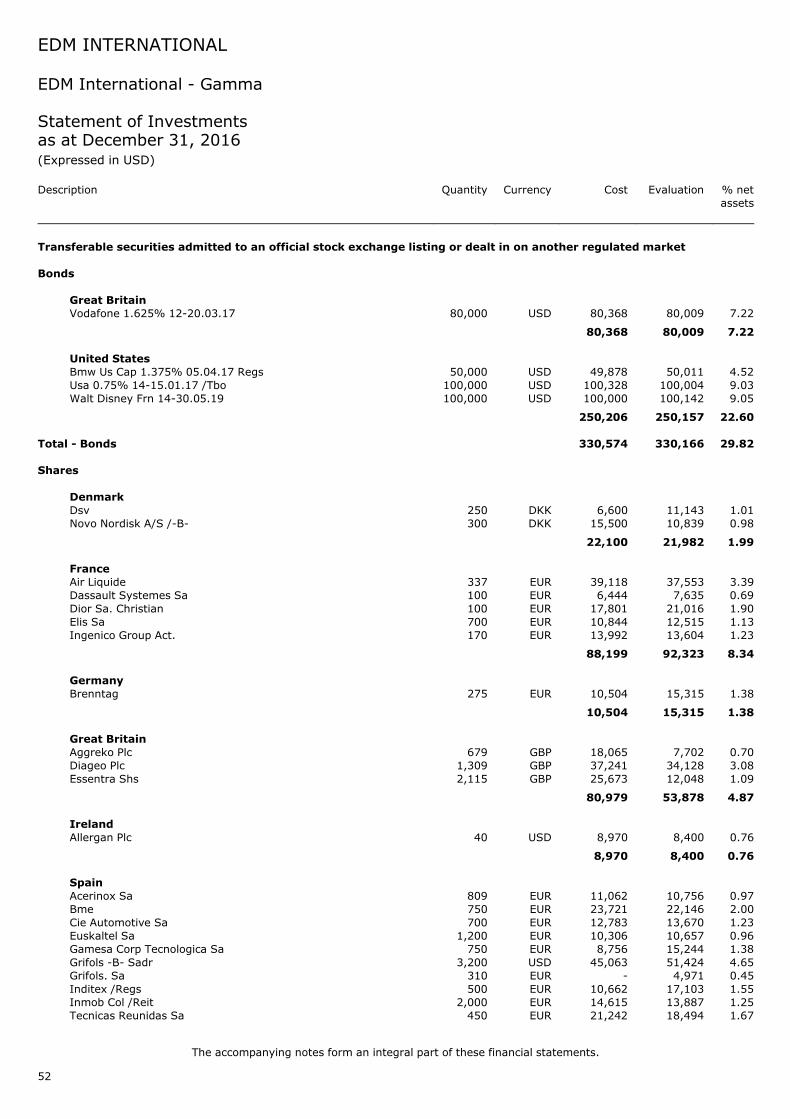
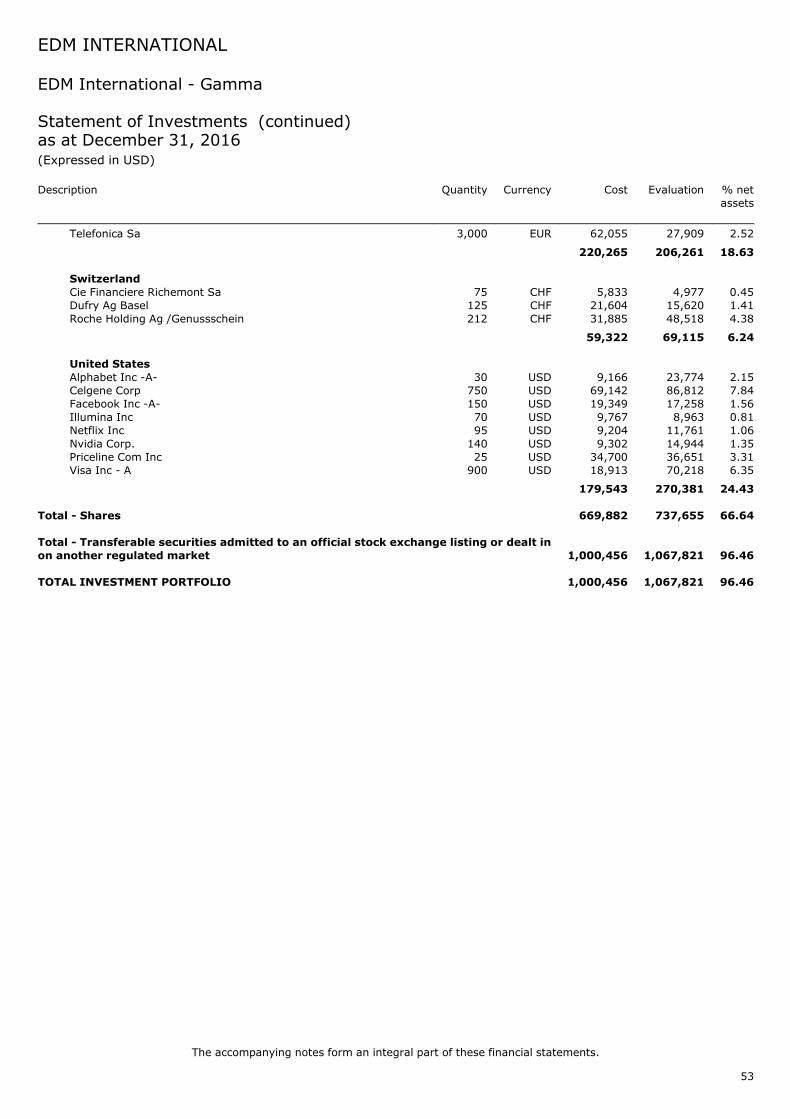
EDM International - Gamma
Statement of Investmentsas at December 31, 2016(Expressed in USD)
Total - Transferable securities admitted to an official stock exchange listing or dealt inon another regulated market 1,000,456 1,067,821 96.46
TOTAL INVESTMENT PORTFOLIO 1,000,456 1,067,821 96.46
EDM INTERNATIONAL
The accompanying notes form an integral part of these financial statements.
53
EDM International - Gamma
Statement of Investments (continued)as at December 31, 2016(Expressed in USD)
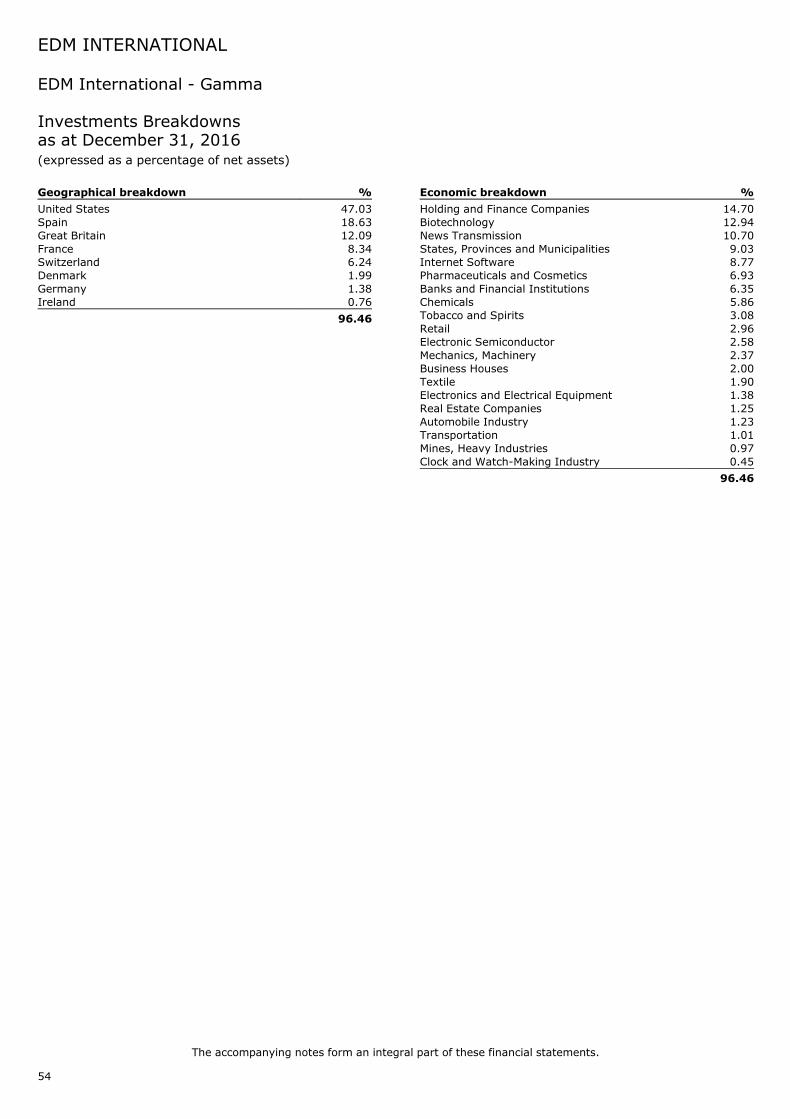
EDM International - Gamma
Investments Breakdownsas at December 31, 2016(expressed as a percentage of net assets)
Geographical breakdown %
United States 47.03Spain 18.63Great Britain 12.09France 8.34Switzerland 6.24Denmark 1.99Germany 1.38Ireland 0.76
96.46
Economic breakdown %
Holding and Finance Companies 14.70Biotechnology 12.94News Transmission 10.70States, Provinces and Municipalities 9.03Internet Software 8.77Pharmaceuticals and Cosmetics 6.93Banks and Financial Institutions 6.35Chemicals 5.86Tobacco and Spirits 3.08Retail 2.96Electronic Semiconductor 2.58Mechanics, Machinery 2.37Business Houses 2.00Textile 1.90Electronics and Electrical Equipment 1.38Real Estate Companies 1.25Automobile Industry 1.23Transportation 1.01Mines, Heavy Industries 0.97Clock and Watch-Making Industry 0.45
96.46
EDM INTERNATIONAL
The accompanying notes form an integral part of these financial statements.
54
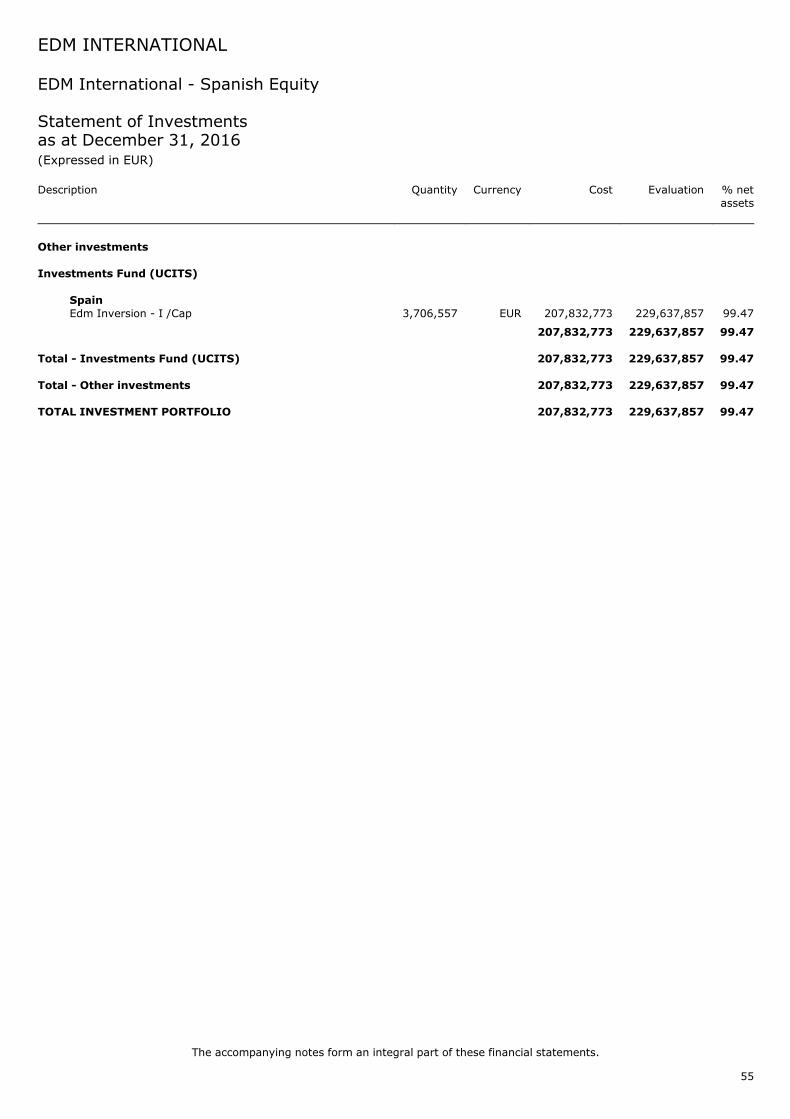
EDM International - Spanish Equity
Statement of Investmentsas at December 31, 2016(Expressed in EUR)
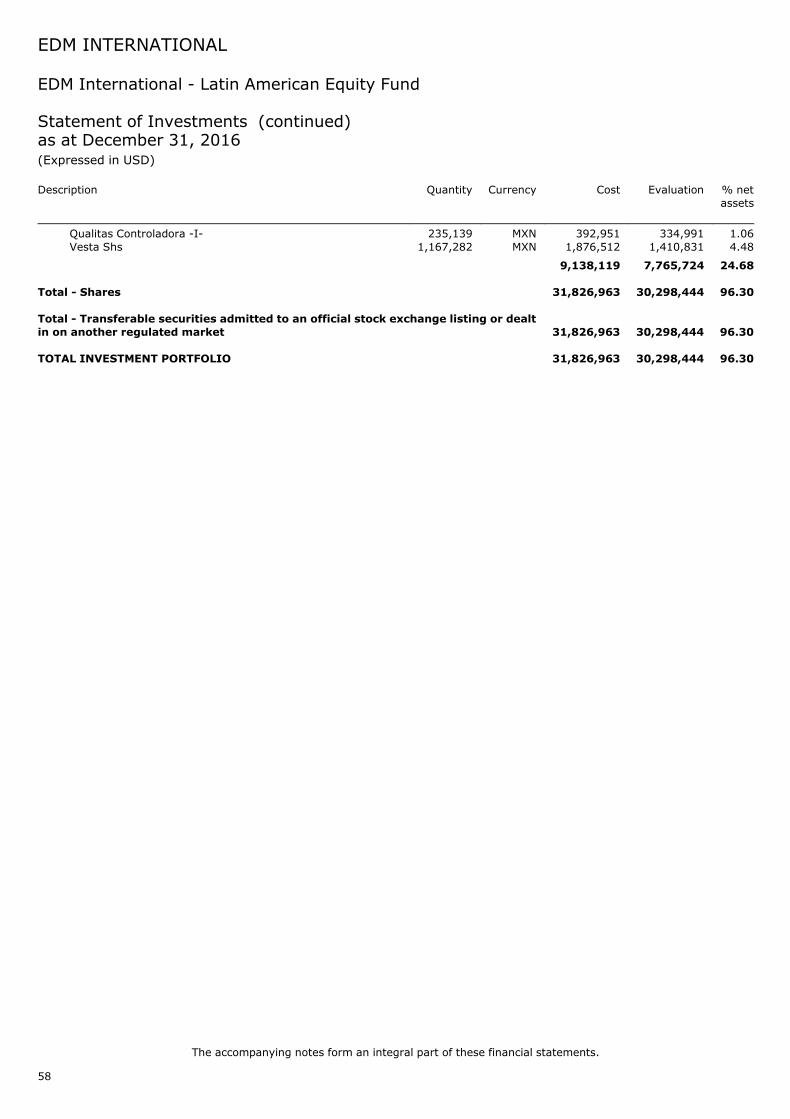
Total - Transferable securities admitted to an official stock exchange listing or dealtin on another regulated market 31,826,963 30,298,444 96.30
TOTAL INVESTMENT PORTFOLIO 31,826,963 30,298,444 96.30
EDM INTERNATIONAL
The accompanying notes form an integral part of these financial statements.
58
EDM International - Latin American Equity Fund
Statement of Investments (continued)as at December 31, 2016(Expressed in USD)
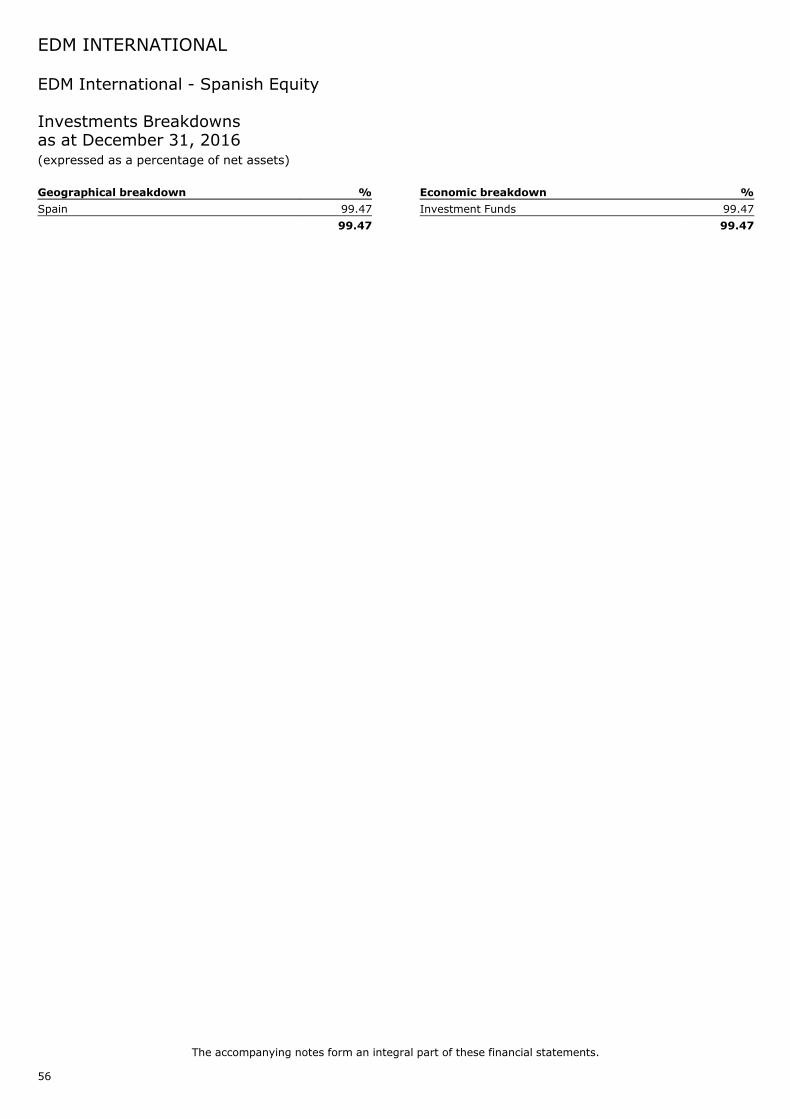
EDM International - Latin American Equity Fund
Investments Breakdownsas at December 31, 2016(expressed as a percentage of net assets)
Geographical breakdown %
Brazil 54.36Mexico 24.68Chile 5.42Colombia 4.98Bermuda 3.27British Virgin Islands 1.89Luxembourg 1.70
96.30
Economic breakdown %
Holding and Finance Companies 28.23Real Estate Companies 11.06Mechanics, Machinery 7.88Transportation 7.76Other Services 6.53Tobacco and Spirits 5.99Retail 4.80Aerospace Technology 4.73Pharmaceuticals and Cosmetics 4.34Automobile Industry 3.50Banks and Financial Institutions 3.27Food and Distilleries 2.45Construction, Building Material 1.98Mines, Heavy Industries 1.70Insurance 1.06Consumer Goods 0.52Leisure 0.50
96.30
EDM INTERNATIONAL
The accompanying notes form an integral part of these financial statements.
59
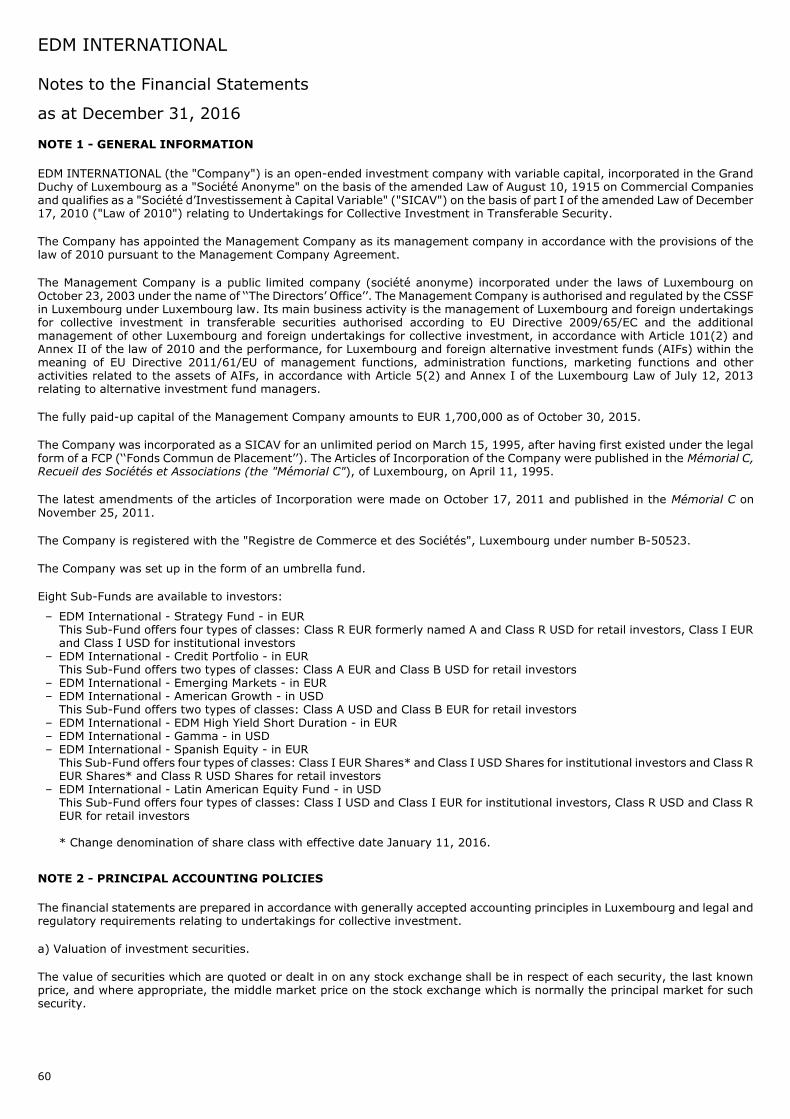
Notes to the Financial Statements
as at December 31, 2016
NOTE 1 - GENERAL INFORMATION
EDM INTERNATIONAL (the "Company") is an open-ended investment company with variable capital, incorporated in the GrandDuchy of Luxembourg as a "Societe Anonyme" on the basis of the amended Law of August 10, 1915 on Commercial Companiesand qualifies as a "Societe d’Investissement a Capital Variable" ("SICAV") on the basis of part I of the amended Law of December17, 2010 ("Law of 2010") relating to Undertakings for Collective Investment in Transferable Security.
The Company has appointed the Management Company as its management company in accordance with the provisions of thelaw of 2010 pursuant to the Management Company Agreement.
The Management Company is a public limited company (societe anonyme) incorporated under the laws of Luxembourg onOctober 23, 2003 under the name of ‘‘The Directors’ Office’’. The Management Company is authorised and regulated by the CSSFin Luxembourg under Luxembourg law. Its main business activity is the management of Luxembourg and foreign undertakingsfor collective investment in transferable securities authorised according to EU Directive 2009/65/EC and the additionalmanagement of other Luxembourg and foreign undertakings for collective investment, in accordance with Article 101(2) andAnnex II of the law of 2010 and the performance, for Luxembourg and foreign alternative investment funds (AIFs) within themeaning of EU Directive 2011/61/EU of management functions, administration functions, marketing functions and otheractivities related to the assets of AIFs, in accordance with Article 5(2) and Annex I of the Luxembourg Law of July 12, 2013relating to alternative investment fund managers.
The fully paid-up capital of the Management Company amounts to EUR 1,700,000 as of October 30, 2015.
The Company was incorporated as a SICAV for an unlimited period on March 15, 1995, after having first existed under the legalform of a FCP (‘‘Fonds Commun de Placement’’). The Articles of Incorporation of the Company were published in the Memorial C,Recueil des Societes et Associations (the "Memorial C"), of Luxembourg, on April 11, 1995.
The latest amendments of the articles of Incorporation were made on October 17, 2011 and published in the Memorial C onNovember 25, 2011.
The Company is registered with the "Registre de Commerce et des Societes", Luxembourg under number B-50523.
The Company was set up in the form of an umbrella fund.
Eight Sub-Funds are available to investors:
– EDM International - Strategy Fund - in EURThis Sub-Fund offers four types of classes: Class R EUR formerly named A and Class R USD for retail investors, Class I EURand Class I USD for institutional investors
– EDM International - Credit Portfolio - in EURThis Sub-Fund offers two types of classes: Class A EUR and Class B USD for retail investors
– EDM International - Emerging Markets - in EUR– EDM International - American Growth - in USDThis Sub-Fund offers two types of classes: Class A USD and Class B EUR for retail investors
– EDM International - EDM High Yield Short Duration - in EUR– EDM International - Gamma - in USD– EDM International - Spanish Equity - in EURThis Sub-Fund offers four types of classes: Class I EUR Shares* and Class I USD Shares for institutional investors and Class REUR Shares* and Class R USD Shares for retail investors
– EDM International - Latin American Equity Fund - in USDThis Sub-Fund offers four types of classes: Class I USD and Class I EUR for institutional investors, Class R USD and Class REUR for retail investors
* Change denomination of share class with effective date January 11, 2016.
NOTE 2 - PRINCIPAL ACCOUNTING POLICIES
The financial statements are prepared in accordance with generally accepted accounting principles in Luxembourg and legal andregulatory requirements relating to undertakings for collective investment.
a) Valuation of investment securities.
The value of securities which are quoted or dealt in on any stock exchange shall be in respect of each security, the last knownprice, and where appropriate, the middle market price on the stock exchange which is normally the principal market for suchsecurity.
EDM INTERNATIONAL
60
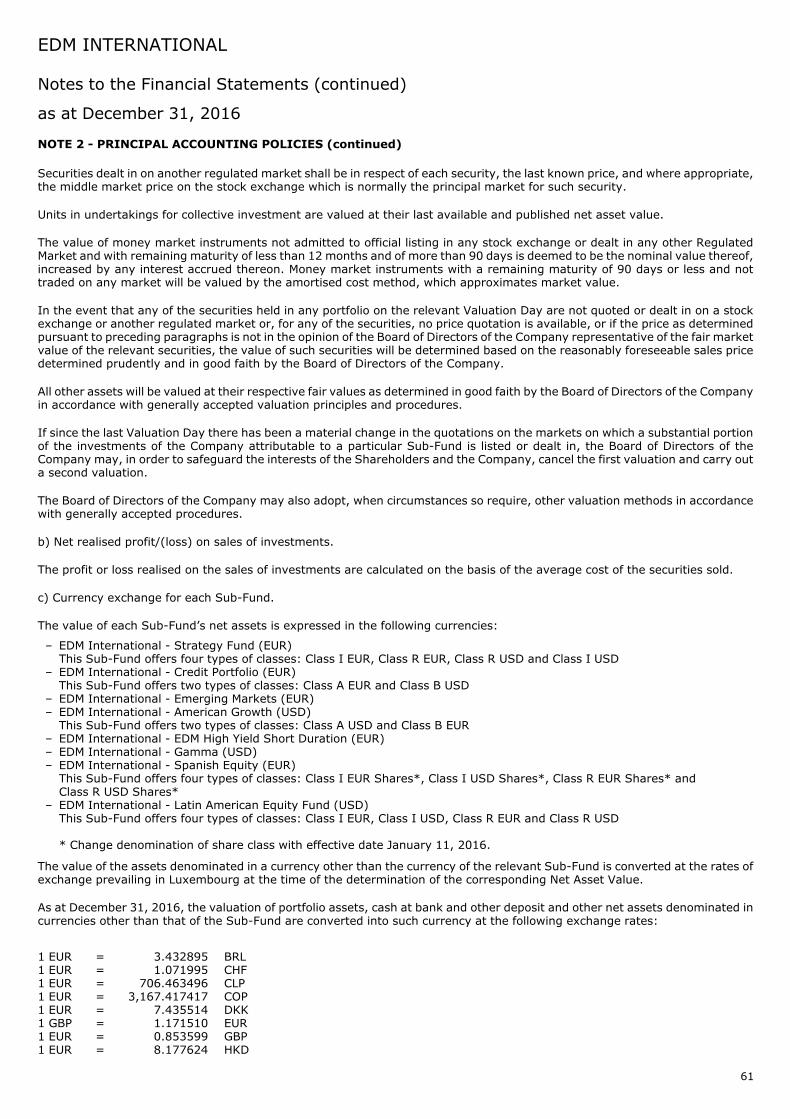
NOTE 2 - PRINCIPAL ACCOUNTING POLICIES (continued)
Securities dealt in on another regulated market shall be in respect of each security, the last known price, and where appropriate,the middle market price on the stock exchange which is normally the principal market for such security.
Units in undertakings for collective investment are valued at their last available and published net asset value.
The value of money market instruments not admitted to official listing in any stock exchange or dealt in any other RegulatedMarket and with remaining maturity of less than 12 months and of more than 90 days is deemed to be the nominal value thereof,increased by any interest accrued thereon. Money market instruments with a remaining maturity of 90 days or less and nottraded on any market will be valued by the amortised cost method, which approximates market value.
In the event that any of the securities held in any portfolio on the relevant Valuation Day are not quoted or dealt in on a stockexchange or another regulated market or, for any of the securities, no price quotation is available, or if the price as determinedpursuant to preceding paragraphs is not in the opinion of the Board of Directors of the Company representative of the fair marketvalue of the relevant securities, the value of such securities will be determined based on the reasonably foreseeable sales pricedetermined prudently and in good faith by the Board of Directors of the Company.
All other assets will be valued at their respective fair values as determined in good faith by the Board of Directors of the Companyin accordance with generally accepted valuation principles and procedures.
If since the last Valuation Day there has been a material change in the quotations on the markets on which a substantial portionof the investments of the Company attributable to a particular Sub-Fund is listed or dealt in, the Board of Directors of theCompany may, in order to safeguard the interests of the Shareholders and the Company, cancel the first valuation and carry outa second valuation.
The Board of Directors of the Company may also adopt, when circumstances so require, other valuation methods in accordancewith generally accepted procedures.
b) Net realised profit/(loss) on sales of investments.
The profit or loss realised on the sales of investments are calculated on the basis of the average cost of the securities sold.
c) Currency exchange for each Sub-Fund.
The value of each Sub-Fund’s net assets is expressed in the following currencies:
– EDM International - Strategy Fund (EUR)This Sub-Fund offers four types of classes: Class I EUR, Class R EUR, Class R USD and Class I USD
– EDM International - Credit Portfolio (EUR)This Sub-Fund offers two types of classes: Class A EUR and Class B USD
– EDM International - Emerging Markets (EUR)– EDM International - American Growth (USD)This Sub-Fund offers two types of classes: Class A USD and Class B EUR
– EDM International - EDM High Yield Short Duration (EUR)– EDM International - Gamma (USD)– EDM International - Spanish Equity (EUR)This Sub-Fund offers four types of classes: Class I EUR Shares*, Class I USD Shares*, Class R EUR Shares* andClass R USD Shares*
– EDM International - Latin American Equity Fund (USD)This Sub-Fund offers four types of classes: Class I EUR, Class I USD, Class R EUR and Class R USD
* Change denomination of share class with effective date January 11, 2016.
The value of the assets denominated in a currency other than the currency of the relevant Sub-Fund is converted at the rates ofexchange prevailing in Luxembourg at the time of the determination of the corresponding Net Asset Value.
As at December 31, 2016, the valuation of portfolio assets, cash at bank and other deposit and other net assets denominated incurrencies other than that of the Sub-Fund are converted into such currency at the following exchange rates:
Individual financial statements are prepared for each Sub-Fund in that Sub-Fund’s currency. In order to present the Company’ssituation as a whole, these financial statements are combined after conversion into the Company’s reference currency, which isthe EUR.
The difference between the opening net assets stated at the rate of exchange used for translation into EUR asof December 31, 2015 and December 31, 2016 is shown as currency translation in the combined statement of operations andchanges in net assets.
e) Acquisition cost of investment securities.
The acquisition cost of investment securities denominated in currencies other than that Sub-Fund’s currency is converted intosuch currency at the exchange rate prevailing on the day of purchase.
f) Income from investments.
Dividends are recognized as income on the date the securities are first quoted ex-dividend. Interest is accrued for each net assetvaluation.
g) Forward foreign exchange contracts.
Profit or loss arising from un-matured forward foreign exchange contracts are determined on the basis of the applicable forwardexchange rates at the valuation date, and are recorded in the statement of net assets.
h) Income recognition
Dividends are recorded at ex-date. Interests on bonds are accrued on a prorata basis pursuant to the terms of the underlyinginvestment. Income is recorded net of respective withholding taxes, if any. Bank interests are accounted on an accrual basis.Other income is mainly composed of the reimbursement of withholding taxes reclaimed to tax authorities of concerned countries.They are recorded in the Statement of Operations and Changes in Net Assets at settlement date.
i) Other Charges
Other charges are mainly composed of investment compliance fees, CSSF fees, distribution fees and other stock exchangemaintenance fees.
j) Formation expenses / setting-up costs
The fees and costs incurred in connection with the establishment and launch of any additional Sub-Fund shall be borne by therelevant Sub-Fund and shall be amortised over the first five (5) Financial Years following the launch of that Sub-Fund.
NOTE 3 - INVESTMENT MANAGEMENT FEE AND ADVISORY FEE
The Investment Managers are entitled to receive a monthly Investment Management Fee at an annual rate applicable on theaverage monthly net assets as described below:
Comgest, S.A.- 1.00% for EDM International - Emerging Markets
EDM INTERNATIONAL
62
Notes to the Financial Statements (continued)
as at December 31, 2016
NOTE 3 - INVESTMENT MANAGEMENT FEE AND ADVISORY FEE (continued)
EDM Gestion, S.A., S.G.I.I.C.- 0.50% for EDM International - Gamma- 2.50% for EDM International - Strategy Fund Class R- 1.25% for EDM International - Strategy Fund Class I- 1.25% for EDM International - Spanish Equity Class R EUR Shares*- 0.25% for EDM International - Spanish Equity Class I EUR Shares*
* Change denomination of share class with effective date January 11, 2016.
- 2.50% for EDM International - Latin American Equity Fund Class R- 1.25% for EDM International - Latin American Equity Fund Class I
Muzinich & Co. Inc.- 0.35% for EDM International - Credit Portfolio- 0.35% for EDM International - EDM High Yield Short Duration
Edgewood Management Llc- 1.00% for EDM International - American Growth
The Investment Advisor is entitled to a monthly Investment Advisory Fee based on each Sub-Fund’s average net assets, at anannual rate of:
EDM International - Credit Portfolio 0.95%EDM International - Emerging Markets 1.50%EDM International - American Growth 1.50%EDM International - EDM High Yield Short Duration 0.95%
EDM International - Strategy Fund, EDM International - Gamma, EDM International - Spanish Equity and EDM International -Latin American Equity Fund are not subject to any Investment Advisory fee.
NOTE 4 - MANAGEMENT COMPANY FEE
On January 11, 2016, the Company has appointed MDO Management Company S.A. as its management company in accordancewith the provisions of chapter 15 of the amended Law of December 17, 2010. From that date, the Company becomes anexternally managed SICAV.
Fees to be paid to the Management Company
The SICAV shall pay or cause to be paid to the Management Company fees out of the assets of the SICAV for the execution of itsduties as the SICAV’s designated management company under this Agreement, such fees amounting to the annual percentagerates of the net asset value of the SICAV as set out below.
The management fees is as follows:
– 6 bps per annum under management up to EUR 50 million– 5 bps per annum for assets under management between EUR 50 million and EUR 100 million– 4 bps per annum for assets under management between EUR 100 million and EUR 250 million– 3 bps per annum for assets under management between EUR 250 million and EUR 500 million– 2 bps per annum for assets under management between EUR 500 million and EUR 800 million– 1.5 bps per annum for assets under management between EUR 800 million and EUR 1.5 billion– 1 bp per annum for assets under management above EUR 1.5 billion
A minimum fee of EUR 15,000 p.a. per sub-fund will be charged.
The management fee will be calculated quarterly as the average of the month-end Net Asset Value of the previous quarter andinvoiced quarterly in arrears.
In addition, the Management Company is entitled to a fee of EUR 11,000 p.a. per sub-fund using the commitment approach forthe additional performance of risk management and investment compliance services.
The fees payable to the Management Company are exclusive of VAT or similar charges, which, if chargeable, shall be charged inaddition where appropriate at the rate for the time being applicable.
EDM INTERNATIONAL
63
Notes to the Financial Statements (continued)
as at December 31, 2016
NOTE 5 - CUSTODIAN FEES
The Company pays fees to RBC Investor Services Bank S.A. for its rendering of services as Custodian and Central AdministrativeAgent, in accordance with normal banking practices in Luxembourg. These fees are annual fees calculated on the average netassets of the different Sub-Funds and are payable on a monthly basis as per the following rates:
- 0.18% per annum on the assets of the Company between 0 and EUR 50 millions- 0.15% per annum on the assets of the Company between EUR 50 millions and EUR 100 millions- 0.12% per annum on the assets of the Company up to EUR 100 millions with a minimum of EUR 25,000 per annum per sub-fund, to be charged to each Sub-Fund in proportion to the assets of each Sub-Fund.
NOTE 6 - SUBSCRIPTION TAX
The Sub-Funds of the Company are liable in Luxembourg to an annual tax ("taxe d’abonnement") of 0.05% of their net assets,payable quarterly and calculated on the basis of the net assets of the Sub-Funds at the end of the relevant quarter.
Such tax rate is reduced to a rate of 0.01% in respect of the assets attributable to such Sub-Funds that are reserved forinstitutional investors within the meaning of, and as provided for in, article 174 of the Law of 2010. The tax is payable quarterlyand calculated on the Net Asset Value of the relevant Sub-Fund at the end of the relevant quarter.
No taxe d’abonnement is paid on the part of the assets of any Sub-Fund invested in other Luxembourg undertakings for collectiveinvestment that already pay a taxe d’abonnement.
NOTE 7 - FORWARD FOREIGN EXCHANGE CONTRACTS
At December 31, 2016, the Sub-Fund EDM International – Strategy Fund had the following outstanding forward foreignexchange contracts:
At December 31, 2016, the Sub-Fund EDM International – Gamma had the following outstanding forward foreign exchangecontract:
Purchase currencyPurchaseamount
Salecurrency Sale amount
Maturitydate
Sub-fundcurrency
Unrealized(Loss)
USD 199,681 EUR 190,000 17/03/2017 USD (1,286)
USD (1,286)
All forward foreign exchange contracts were conducted with the counterparty RBC IS Luxembourg.
NOTE 8 - TRANSACTION COSTS
For the year ended December 31, 2016, the following Sub-Funds of the Company incurred transaction costs relating to purchaseor sale of transferable securities, money market instruments, derivatives or other eligible assets as follows:
EDM International - Strategy Fund 303,576.05 EUREDM International - Credit Portfolio (3,798.10) EUREDM International - Emerging Markets 38,671.21 EUREDM International - American Growth 57,826.08 USDEDM International - EDM High Yield Short Duration 815.79 EUREDM International - Gamma 861.61 USDEDM International - Spanish Equity 3.82 EUREDM International - Latin American Equity Fund 105,275.35 USD
These transaction costs are composed of brokerage costs and are included in cost of securities.
Furthermore, in accordance with the practices of the bond markets, a bid-offer spread is applied to securities purchase or saletransactions. According to this principle, the selling and buying prices applied by the broker to a given transaction are notidentical and the difference between them constitutes the broker’s remuneration.
The transaction amounts included under the heading "Bank charges and correspondent fees" in the "Statement of Operationsand Changes in Net Assets" are composed of transaction fees (transaction fees paid to the custodian or sub-custodian) that arenot included in the table above.
EDM INTERNATIONAL
65
Notes to the Financial Statements (continued)
as at December 31, 2016
NOTE 9 - INFORMATION ACCORDING TO THE ESMA’S ‘‘GUIDELINES ON ETFS AND OTHER UCITS ISSUES’’
During the financial year, no techniques for efficient portfolio management (according to ESMA guidelines) were applied.
On December 31, 2016, the Company was not invested in any derivatives and during the year under review, the Company did notperform any derivative transactions, except the Forward foreign exchange contracts that are disclosed in note 7 to the FinancialStatements. No collateral was received that could be attributed to the Company’s counterparty risk.
NOTE 10 - MASTER/FEEDER STRUCTURE
The Feeder
The Sub-Fund EDM International - Spanish Equity (‘‘The Feeder’’) is a feeder sub-fund pursuant to article 77 (1) of the law of2010 and at all times invests at least 85% of its assets in units of the Master Fund (EDM INVERSION, FI) which qualifies as a‘‘master UCITS’’ within the meaning of Directive 2009/65/EC.
The Feeder may hold up to 15% of its assets in ancillary liquid assets, including cash, cash equivalents and short-term bankdeposits. The objective of the Feeder is to achieve capital appreciation through investment in the Master Fund. The investmentobjective and policy of the Master Fund, its organisation and risk profile are summarised in the section "Master Fund" below. Theresidual assets of the Feeder consists in ancillary liquid assets, as described above, as may be required from time to time fordealing liquidity purposes and payment of costs and expenses of the Sub-Fund. The Feeder intends to minimize the level ofancillary liquid assets held for these purposes. The Feeder did not enter into financial derivative instruments.
If and to the extent that voting rights attached to units of the Master Fund are exercised on behalf of the Feeder, a summarydescription of the strategies followed in the exercise of such rights, as well as the actions taken on the basis of those strategies,will be made available to Shareholders upon their specific request addressed to the Company. It is expected that theperformance of the Feeder is broadly in line with that of the Master Fund subject to its level of investment in the Master Fund andsafe for additional fund expenses at the level of the Feeder, which will affect its performance.
The Master
The Master Fund is a collective investment institution structured as separate capital with no legal personality, established andexisting under the laws of Spain, registered with the Spanish supervisory authority Comision Nacional del Mercado de Valores(CNMV) under registration number 46. It was established on January 21, 1987 and is regulated and authorised by the CNMV as aUCITS fund. The Master Fund has been authorised by the CNMV as a "master UCITS" within the meaning of the relevantprovisions of Directive 2009/65/EC. As a consequence, the Master Fund must, at all times, (i) have at least one feeder UCITSamong its unitholders, (ii) not itself become a feeder UCITS, and (iii) not hold shares or units of a feeder UCITS. The Master Fundinvests in equities listed on a Spanish Stock Exchange.
Complete information about the Master Fund, including prospectus and financial statements, can be obtained free of charge onthe Spanish website www.edm.es, on the website of the CNMV (regulator) and also at distributor level.
The ownership of The Master Fund by The Feeder as at December 31, 2016 equals to 49.15%.
Aggregate expenses
The accumulated fees applied to the Master Fund and to its investees shall not exceed 2.25% of the equity in the case of themanagement fee. The actual management and depositary fees are:
Sub-class
InvestmentManagement Fee p.a.(Feeder)
Management Fee p.a.(Master) Total
EDM International – Spanish Equity Class R EUR Shares* 1.25% 1.00% 2.25%EDM International – Spanish Equity Class I EUR Shares* 0.25% 1.00% 1.25%
Sub-classCustodian Fee p.a.(Feeder)
Depositary Fee p.a.(Master) Total
EDM International – Spanish Equity Class R EUR Shares* 0.12% 0.15% 0.27%EDM International – Spanish Equity Class I EUR Shares* 0.12% 0.15% 0.27%
* Change denomination of share class with effective date January 11, 2016.
EDM INTERNATIONAL
66
Notes to the Financial Statements (continued)
as at December 31, 2016
NOTE 10 - MASTER/FEEDER STRUCTURE (continued)
The annualized aggregate Total Expenses Ratios (‘‘TER’’) for the year ended December 31, 2016 amounted to:
Sub-class TER Feeder TER Master Total
EDM International – Spanish Equity Class R EUR Shares* 1.57% 1.10% 2.67%EDM International – Spanish Equity Class I EUR Shares* 0.51% 1.10% 1.61%
The total expenses of the Master Fund for the year ended December 31, 2016 amounted to 5,869,269 EUR, amongst which2,884,746 based on the percentage (%) of ownership as at December 31, 2016.
* Change denomination of share class with effective date January 11, 2016.
NOTE 11 - RISK EXPOSURE (unaudited)
The Company uses a risk management procedure in accordance with the Law of 2010 and other applicable regulations, inparticular CSSF Circular 11/512. This risk management procedure provides for the measurement and control of the overall risk ofall funds using the commitment approach or the Value at Risk approach. The methodology used in order to calculate the GlobalExposure is the commitment approach for all the Sub-Funds of the Company.
NOTE 12 - SIGNIFICANT EVENTS
On January 11, 2016, the Company has appointed MDO Management Company S.A. as its management company in accordancewith the provisions of chapter 15 of the amended Law of December 17, 2010. From that date, the Company becomes anexternally managed SICAV.
NOTE 13 - SFTR (EU REGULATION N 2015/2365) (unaudited)
During the year to which this report relates, the Fund did not engage in transactions which are subject to EU regulation N 2015/2365 on the transparency of securities financing transactions and of reuse. Accordingly, no global, concentration or transactiondata, or information on the reuse or safekeeping of collateral is required to be reported.
EDM INTERNATIONAL
67
Notes to the Financial Statements (continued)
as at December 31, 2016
Information for Shareholders
INFORMATION CONCERNING THE REMUNERATION POLICY:
European Directive 2014/91/EU amending Directive 2009/65/EC on undertakings for collective investment in transferablesecurities, which is applicable to the fund, came into force on March 18, 2016. It is implemented in national law under theLuxembourg Act of May 10, 2016 implementing Directive 2014/91/EU. Due to these new regulations, the fund is required topublish information relating to the remuneration of identified employees within the meaning of the Act in the annual report. Themanagement company will have such remuneration-related information by the time of the next annual financial statement, sothat this information will be included in the fund’s next annual report. It is expected that the management company’sremuneration policy will be available on the website http://www.mdo-manco.com in early August 2016.