Educa&onal and Labour Market Challenges and Prospects for Aboriginal Young Adults in Canada Andrew Sharpe Centre for the Study of Living Standards Presenta&on Prepared for The Millennials’ Challenge: Young Adults and Intergenera&onal Fairness Queen’s Interna&onal Ins&tute on Social Policy August 2426, 2015
Transcript
Educa&onal and Labour Market Challenges and Prospects for
Aboriginal Young Adults in Canada
Andrew Sharpe Centre for the Study of Living Standards
Presenta&on Prepared for The Millennials’ Challenge: Young Adults and
Intergenera&onal Fairness Queen’s Interna&onal Ins&tute on Social Policy
August 24-‐26, 2015
Overview of Presenta&on I. Introduc&on and Context II. Educa&onal AQainment of Aboriginal Young Adults III. Labour Market Performance of Aboriginal Youth IV. CSLS Es&mates of Closing the Aboriginal Educa&on
Gap V. Factors Affec&ng the Labour Market Prospects of
Aboriginal Young People A. Commodity Prices B. Retraining Opportuni&es C. Educa&on D. Social Support
VI. Conclusion 2
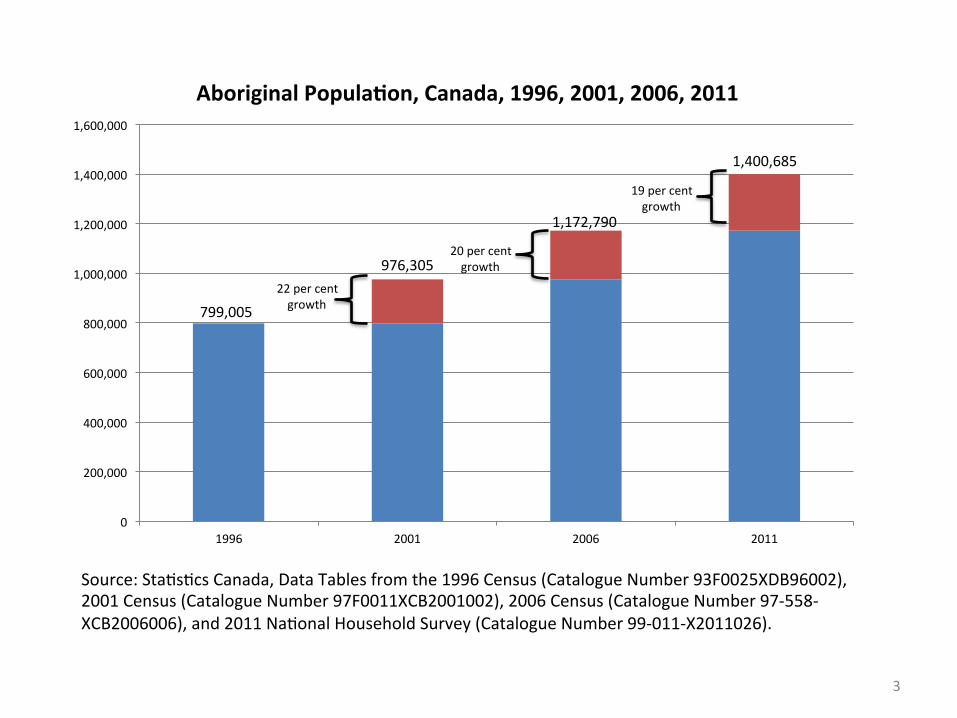
Source: Sta&s&cs Canada, Data Tables from the 1996 Census (Catalogue Number 93F0025XDB96002), 2001 Census (Catalogue Number 97F0011XCB2001002), 2006 Census (Catalogue Number 97-‐558-‐XCB2006006), and 2011 Na&onal Household Survey (Catalogue Number 99-‐011-‐X2011026).
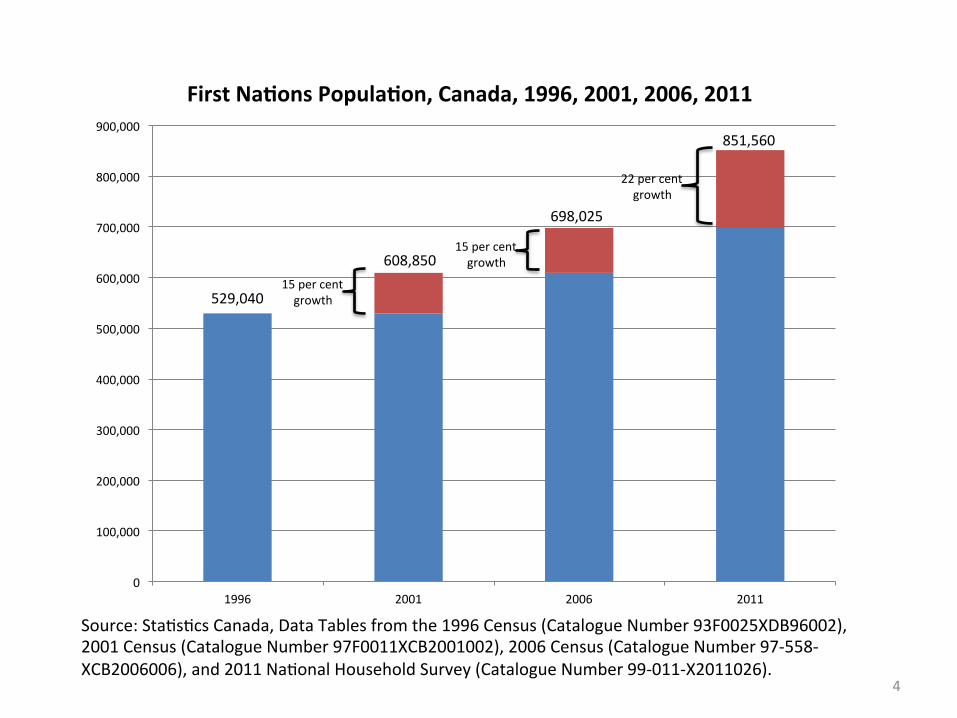
Source: Sta&s&cs Canada, Data Tables from the 1996 Census (Catalogue Number 93F0025XDB96002), 2001 Census (Catalogue Number 97F0011XCB2001002), 2006 Census (Catalogue Number 97-‐558-‐XCB2006006), and 2011 Na&onal Household Survey (Catalogue Number 99-‐011-‐X2011026).
529,040
608,850
698,025
851,560
0
100,000
200,000
300,000
400,000
500,000
600,000
700,000
800,000
900,000
1996 2001 2006 2011
First Na.ons Popula.on, Canada, 1996, 2001, 2006, 2011
15 per cent growth
15 per cent growth
22 per cent growth
4
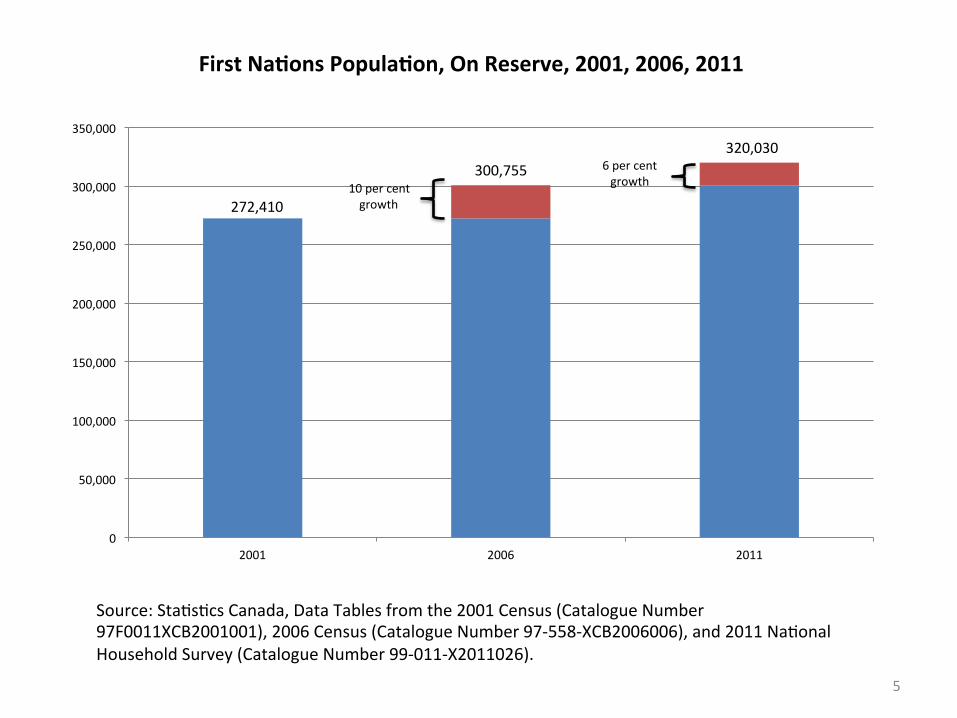
Source: Sta&s&cs Canada, Data Tables from the 2001 Census (Catalogue Number 97F0011XCB2001001), 2006 Census (Catalogue Number 97-‐558-‐XCB2006006), and 2011 Na&onal Household Survey (Catalogue Number 99-‐011-‐X2011026). 5
272,410
300,755 320,030
0
50,000
100,000
150,000
200,000
250,000
300,000
350,000
2001 2006 2011
First Na.ons Popula.on, On Reserve, 2001, 2006, 2011
10 per cent growth
6 per cent growth
Source: Sta&s&cs Canada, Data Tables from the 2001 Census (Catalogue Number 97F0011XCB2001001), 2006 Census (Catalogue Number 97-‐558-‐XCB2006006), and 2011 Na&onal Household Survey (Catalogue Number 99-‐011-‐X2011026). 6
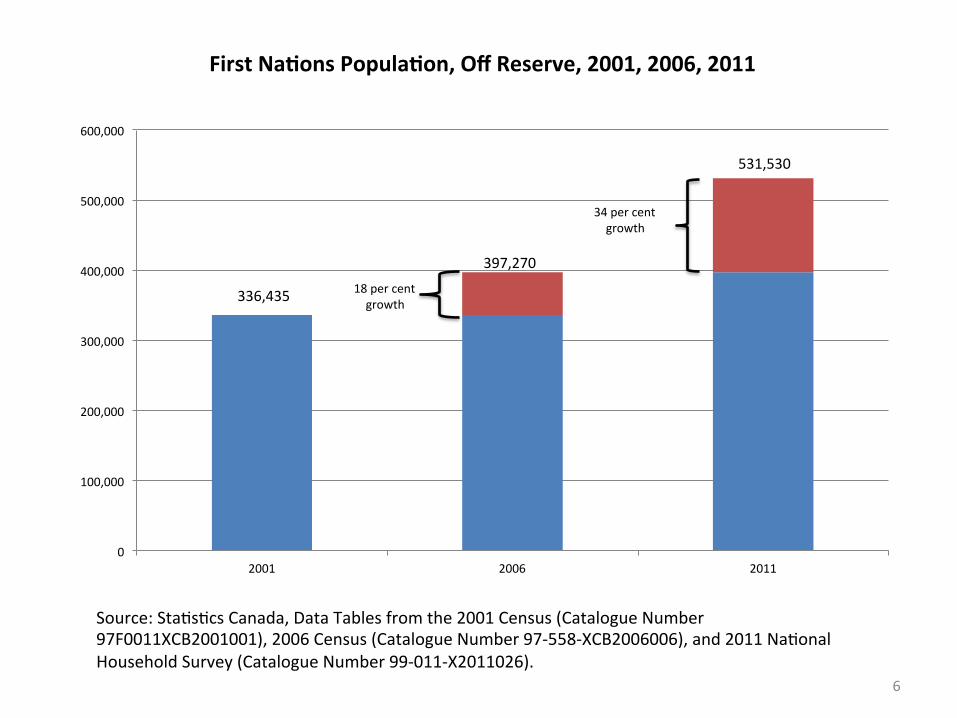
336,435
397,270
531,530
0
100,000
200,000
300,000
400,000
500,000
600,000
2001 2006 2011
First Na.ons Popula.on, Off Reserve, 2001, 2006, 2011
18 per cent growth
34 per cent growth
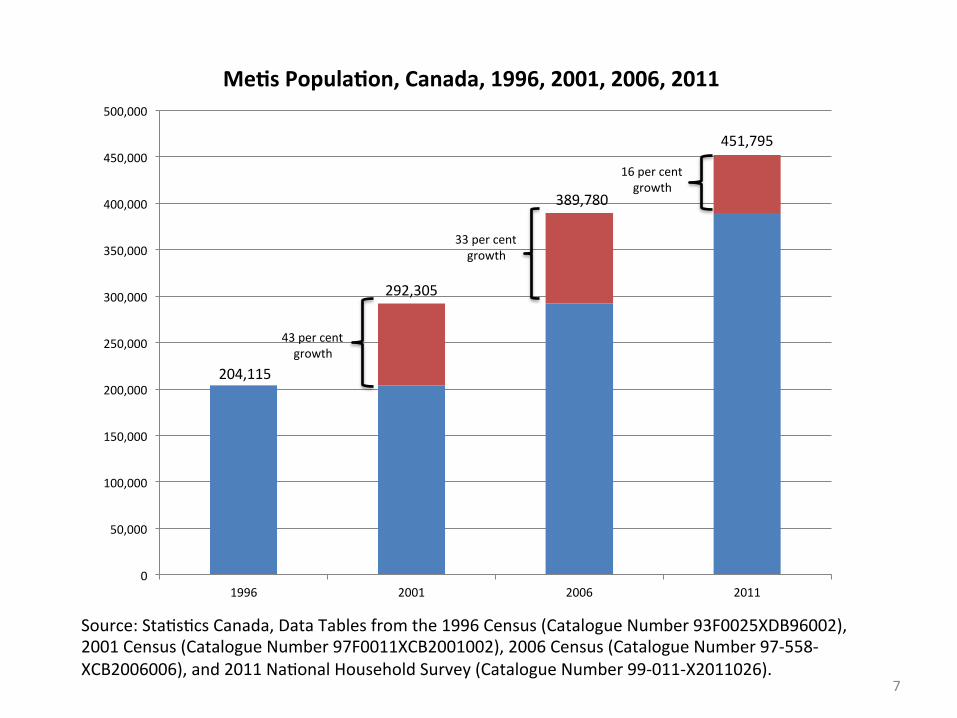
Source: Sta&s&cs Canada, Data Tables from the 1996 Census (Catalogue Number 93F0025XDB96002), 2001 Census (Catalogue Number 97F0011XCB2001002), 2006 Census (Catalogue Number 97-‐558-‐XCB2006006), and 2011 Na&onal Household Survey (Catalogue Number 99-‐011-‐X2011026).
204,115
292,305
389,780
451,795
0
50,000
100,000
150,000
200,000
250,000
300,000
350,000
400,000
450,000
500,000
1996 2001 2006 2011
Me.s Popula.on, Canada, 1996, 2001, 2006, 2011
43 per cent growth
33 per cent growth
16 per cent growth
7
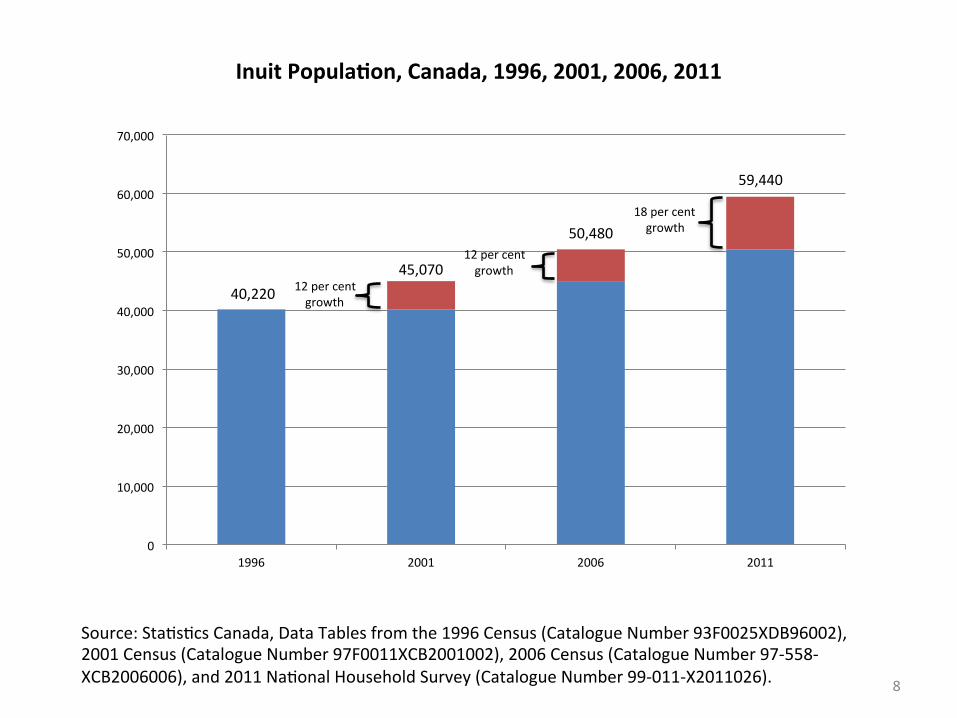
Source: Sta&s&cs Canada, Data Tables from the 1996 Census (Catalogue Number 93F0025XDB96002), 2001 Census (Catalogue Number 97F0011XCB2001002), 2006 Census (Catalogue Number 97-‐558-‐XCB2006006), and 2011 Na&onal Household Survey (Catalogue Number 99-‐011-‐X2011026).
40,220 45,070
50,480
59,440
0
10,000
20,000
30,000
40,000
50,000
60,000
70,000
1996 2001 2006 2011
Inuit Popula.on, Canada, 1996, 2001, 2006, 2011
12 per cent growth
12 per cent growth
18 per cent growth
8
Source: Sta&s&cs Canada, Data Tables from the 1996 Census (Catalogue Number 93F0025XDB96002), 2001 Census (Catalogue Number 97F0011XCB2001002), 2006 Census (Catalogue Number 97-‐558-‐XCB2006006), and 2011 Na&onal Household Survey (Catalogue Number 99-‐011-‐X2011026).
2.8
3.3
3.8
4.3
0.0
0.5
1.0
1.5
2.0
2.5
3.0
3.5
4.0
4.5
1996 2001 2006 2011
Aboriginal Share of Total Canadian Popula.on, 1996, 2001, 2006, 2011 (%)
9
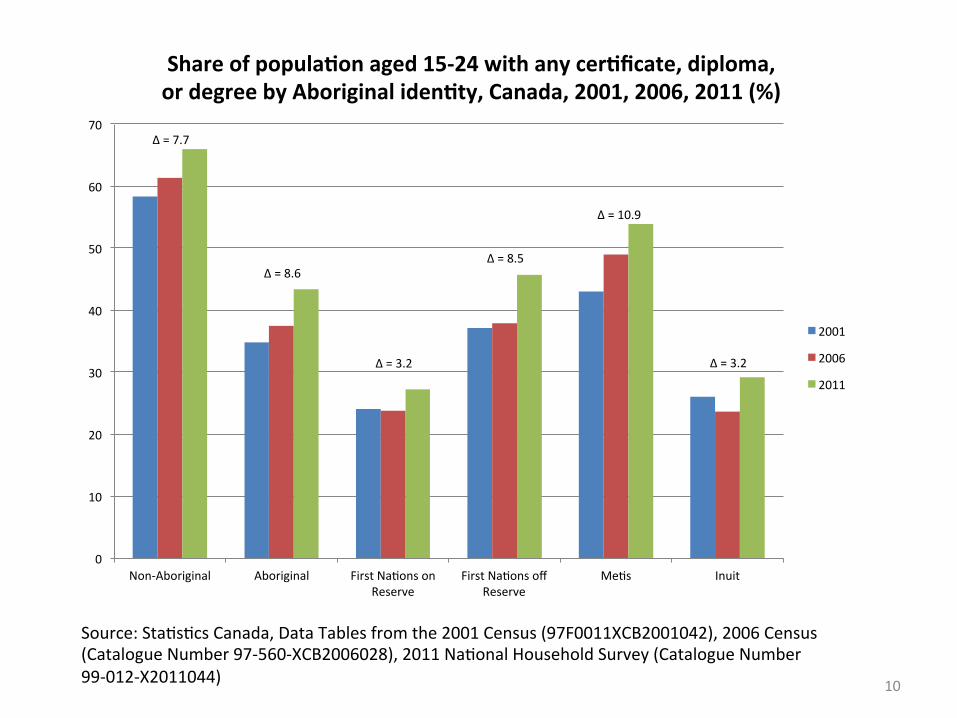
Source: Sta&s&cs Canada, Data Tables from the 2001 Census (97F0011XCB2001042), 2006 Census (Catalogue Number 97-‐560-‐XCB2006028), 2011 Na&onal Household Survey (Catalogue Number 99-‐012-‐X2011044)
Δ = 7.7
Δ = 8.6
Δ = 3.2
Δ = 8.5
Δ = 10.9
Δ = 3.2
0
10
20
30
40
50
60
70
Non-‐Aboriginal Aboriginal First Na&ons on Reserve
First Na&ons off Reserve
Me&s Inuit
Share of popula.on aged 15-‐24 with any cer.ficate, diploma, or degree by Aboriginal iden.ty, Canada, 2001, 2006, 2011 (%)
2001
2006
2011
10
Source: Sta&s&cs Canada, Data Tables from the 2006 Census (Catalogue Number 97-‐560-‐XCB2006028), 2011 Na&onal Household Survey (Catalogue Number 99-‐012-‐X2011044)
Δ = 2.4
Δ = 5.8
Δ = 3.1
Δ = 7.7
Δ = 4.9
Δ = 5.1
0
10
20
30
40
50
60
70
80
90
100
Non-‐Aboriginal Aboriginal First Na&ons on Reserve
First Na&ons off Reserve
Me&s Inuit
Share of popula.on aged 20-‐24 with any cer.ficate, diploma, or degree by Aboriginal iden.ty, Canada, 2006 and 2011 (%)
2006
2011
11
Source: Sta&s&cs Canada, Data Tables from the 2011 Na&onal Household Survey (Catalogue Number 99-‐012-‐X2011044). Some provinces / territories excluded due to small sample size.
0
20
40
60
80
100
MB SK AB CA YT ON BC QC NB NS NL
First Na.ons aged 20-‐24 with any cer.ficate, diploma, or degree, Canadian provinces and
territories, 2011 (%)
Panel A: Off Reserve
0
20
40
60
80
100
NT MB NL AB QC SK CA ON BC NS NB PE
Panel B: On Reserve
12
Source: Sta&s&cs Canada, Data Tables from the 2001 Census (97F0011XCB2001042), 2006 Census (Catalogue Number 97-‐560-‐XCB2006028), 2011 Na&onal Household Survey (Catalogue Number 99-‐012-‐X2011044)
13
Δ = 12.3
Δ = 8.9
Δ = 0.0
Δ = 9.0
Δ = 13.1
Δ = 2.1
0
10
20
30
40
50
60
70
80
Non-‐Aboriginal Aboriginal First Na&ons on Reserve
First Na&ons off Reserve
Me&s Inuit
Share of popula.on aged 25-‐44 with at least a post-‐secondary creden.al, 2001, 2006, 2011, Canada
2001
2006
2011
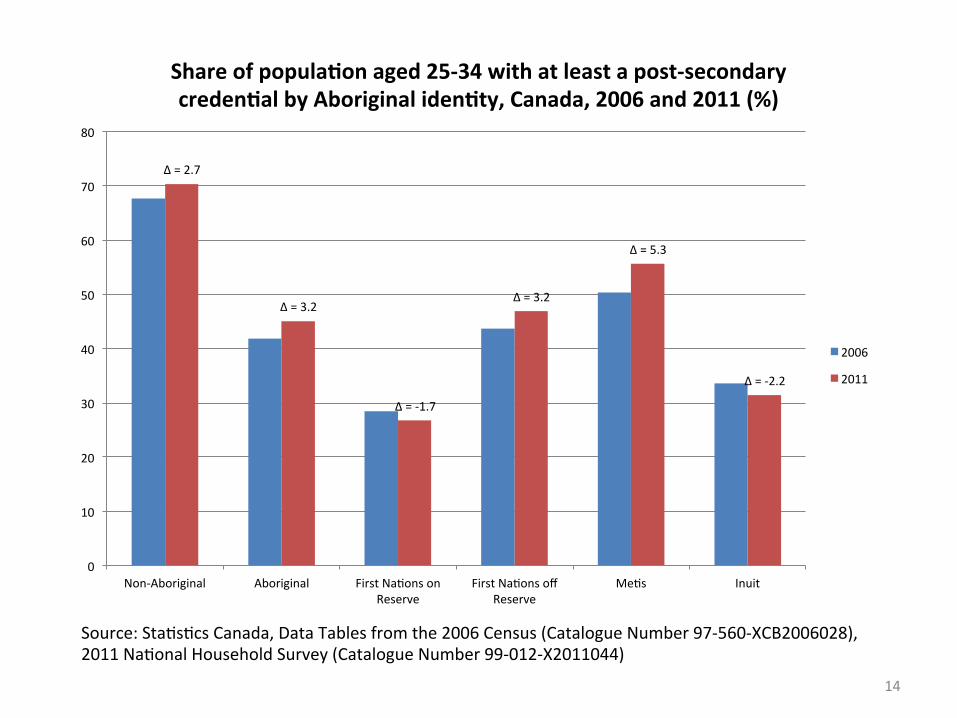
Source: Sta&s&cs Canada, Data Tables from the 2006 Census (Catalogue Number 97-‐560-‐XCB2006028), 2011 Na&onal Household Survey (Catalogue Number 99-‐012-‐X2011044)
Δ = 2.7
Δ = 3.2
Δ = -‐1.7
Δ = 3.2
Δ = 5.3
Δ = -‐2.2
0
10
20
30
40
50
60
70
80
Non-‐Aboriginal Aboriginal First Na&ons on Reserve
First Na&ons off Reserve
Me&s Inuit
Share of popula.on aged 25-‐34 with at least a post-‐secondary creden.al by Aboriginal iden.ty, Canada, 2006 and 2011 (%)
2006
2011
14
Source: Sta&s&cs Canada, Data Tables from the 2011 Na&onal Household Survey (Catalogue Number 99-‐012-‐X2011044). Some provinces / territories excluded due to small sample size.
0
20
40
60
80
100
MB PE NT SK YT AB BC CA NB ON NS QC NL
First Na.ons aged 25-‐34 with any post-‐secondary creden.al, Canadian provinces and territories, 2011
(%)
Panel A: Off Reserve
0
20
40
60
80
100
MB NL AB SK CA PE NT NB BC ON QC NS
Panel B: On Reserve
15
Source: Sta&s&cs Canada, Data Tables from the 2001 Census (97F0011XCB2001042), 2006 Census (Catalogue Number 97-‐560-‐XCB2006028), 2011 Na&onal Household Survey (Catalogue Number 99-‐012-‐X2011044)
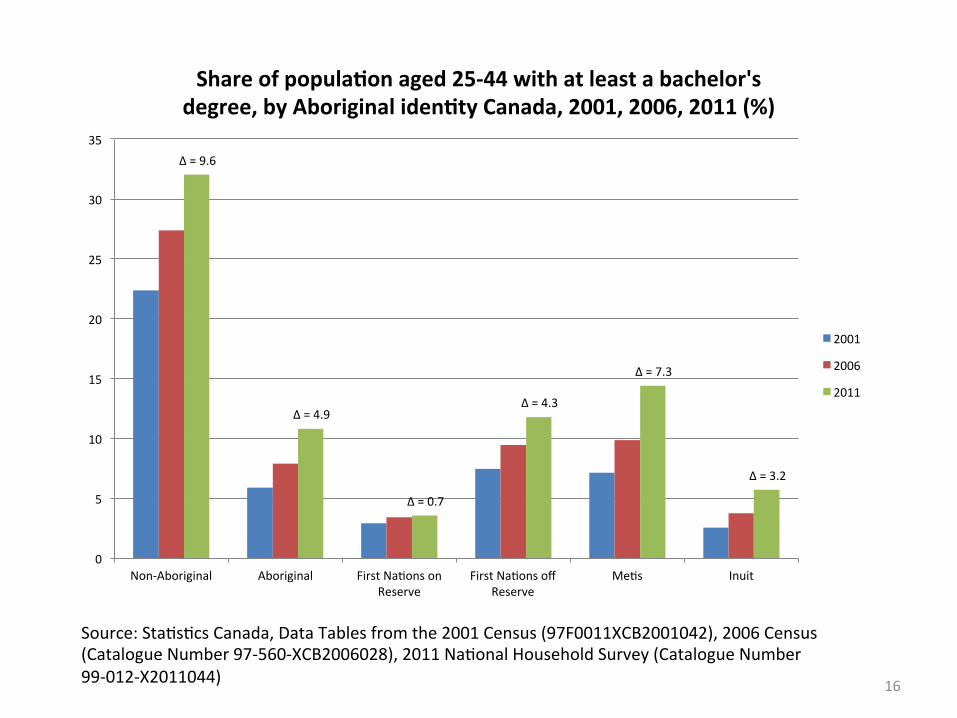
Δ = 9.6
Δ = 4.9
Δ = 0.7
Δ = 4.3
Δ = 7.3
Δ = 3.2
0
5
10
15
20
25
30
35
Non-‐Aboriginal Aboriginal First Na&ons on Reserve
First Na&ons off Reserve
Me&s Inuit
Share of popula.on aged 25-‐44 with at least a bachelor's degree, by Aboriginal iden.ty Canada, 2001, 2006, 2011 (%)
2001
2006
2011
16
Source: Sta&s&cs Canada, Data Tables from the 2006 Census (Catalogue Number 97-‐560-‐XCB2006028), 2011 Na&onal Household Survey (Catalogue Number 99-‐012-‐X2011044)
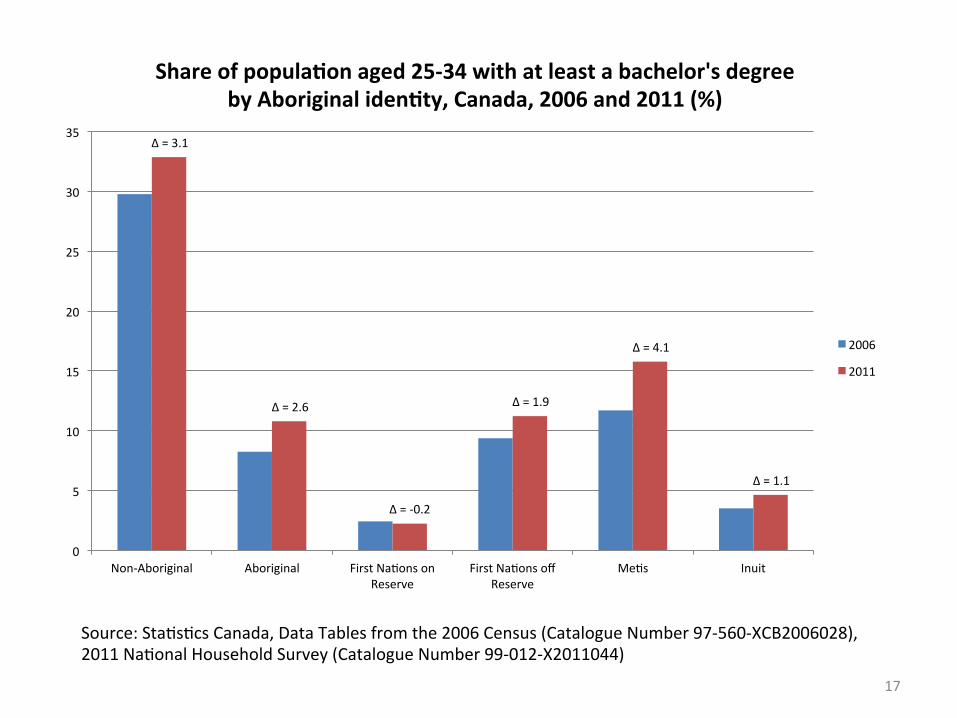
Δ = 3.1
Δ = 2.6
Δ = -‐0.2
Δ = 1.9
Δ = 4.1
Δ = 1.1
0
5
10
15
20
25
30
35
Non-‐Aboriginal Aboriginal First Na&ons on Reserve
First Na&ons off Reserve
Me&s Inuit
Share of popula.on aged 25-‐34 with at least a bachelor's degree by Aboriginal iden.ty, Canada, 2006 and 2011 (%)
2006
2011
17
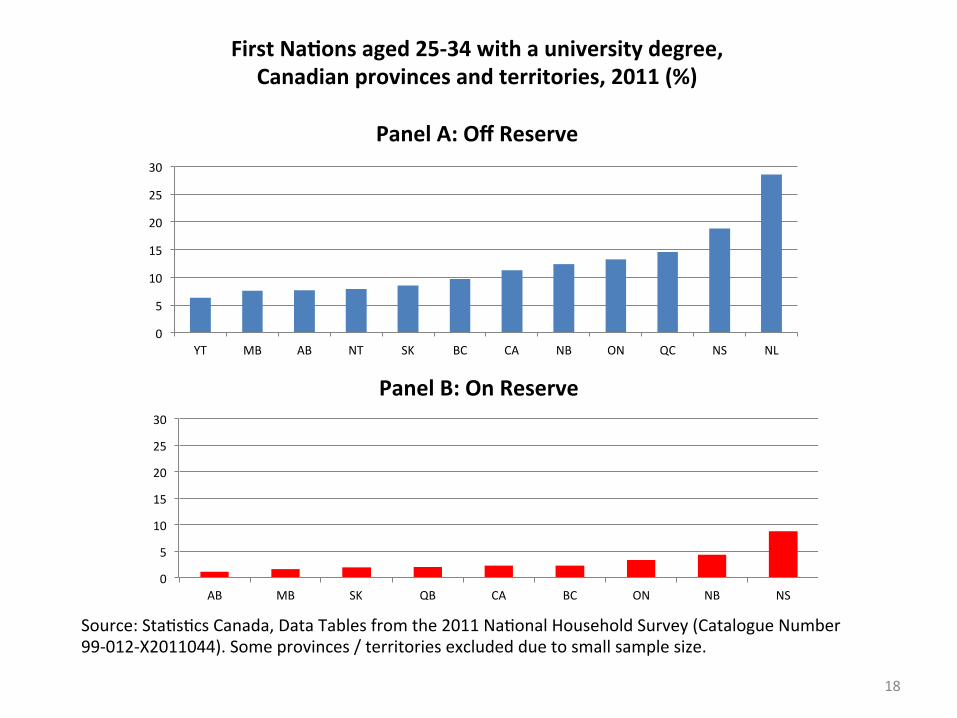
Source: Sta&s&cs Canada, Data Tables from the 2011 Na&onal Household Survey (Catalogue Number 99-‐012-‐X2011044). Some provinces / territories excluded due to small sample size.
0
5
10
15
20
25
30
YT MB AB NT SK BC CA NB ON QC NS NL
First Na.ons aged 25-‐34 with a university degree, Canadian provinces and territories, 2011 (%)
Panel A: Off Reserve
0
5
10
15
20
25
30
AB MB SK QB CA BC ON NB NS
Panel B: On Reserve
18
Source: Sta&s&cs Canada, Data Tables from the 2011 Na&onal Household Survey (Catalogue Number 99-‐012-‐X2011044).
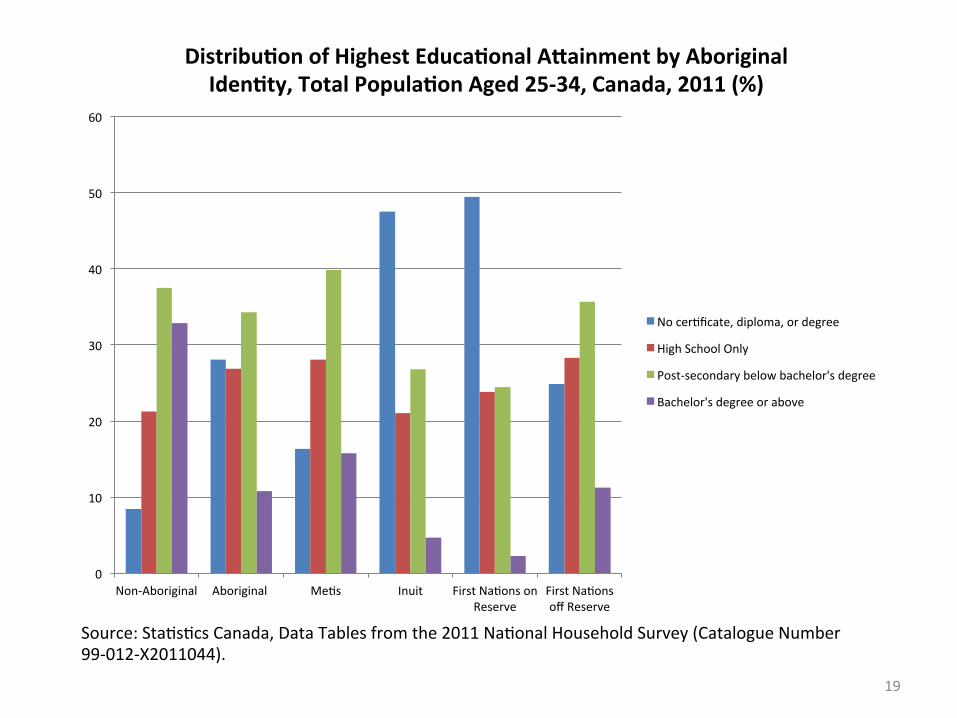
0
10
20
30
40
50
60
Non-‐Aboriginal Aboriginal Me&s Inuit First Na&ons on Reserve
First Na&ons off Reserve
Distribu.on of Highest Educa.onal AXainment by Aboriginal Iden.ty, Total Popula.on Aged 25-‐34, Canada, 2011 (%)
No cer&ficate, diploma, or degree
High School Only
Post-‐secondary below bachelor's degree
Bachelor's degree or above
19
Source: Sta&s&cs Canada, Data Tables from the 2011 Na&onal Household Survey (Catalogue Number 99-‐012-‐X2011044).
0
5
10
15
20
25
30
35
40
45
Non-‐Aboriginal Aboriginal Me&s Inuit First Na&ons on Reserve
First Na&ons off Reserve
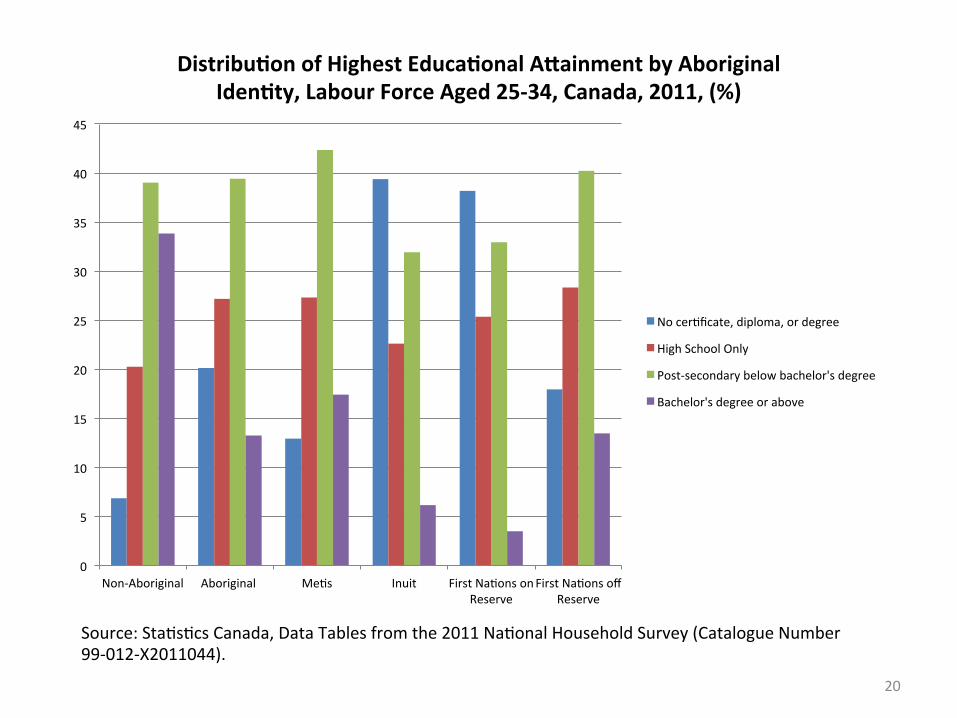
Distribu.on of Highest Educa.onal AXainment by Aboriginal Iden.ty, Labour Force Aged 25-‐34, Canada, 2011, (%)
No cer&ficate, diploma, or degree
High School Only
Post-‐secondary below bachelor's degree
Bachelor's degree or above
20
Source: Sta&s&cs Canada, Data Tables from the 2011 Na&onal Household Survey (Catalogue Number 99-‐012-‐X2011044).
0
10
20
30
40
50
60
70
80
Non-‐Aboriginal
Aboriginal Me&s Inuit First Na&ons on Reserve
First Na&ons off Reserve
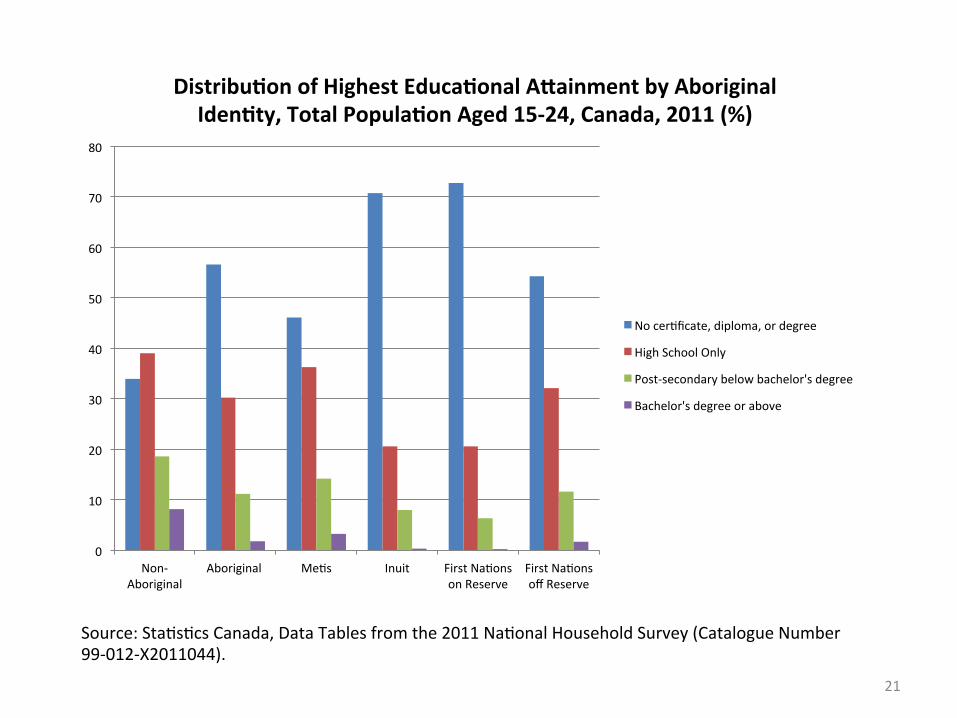
Distribu.on of Highest Educa.onal AXainment by Aboriginal Iden.ty, Total Popula.on Aged 15-‐24, Canada, 2011 (%)
No cer&ficate, diploma, or degree
High School Only
Post-‐secondary below bachelor's degree
Bachelor's degree or above
21
Source: Sta&s&cs Canada, Data Tables from the 2011 Na&onal Household Survey (Catalogue Number 99-‐012-‐X2011044).
0
10
20
30
40
50
60
Non-‐Aboriginal Aboriginal Me&s Inuit First Na&ons on Reserve
First Na&ons off Reserve
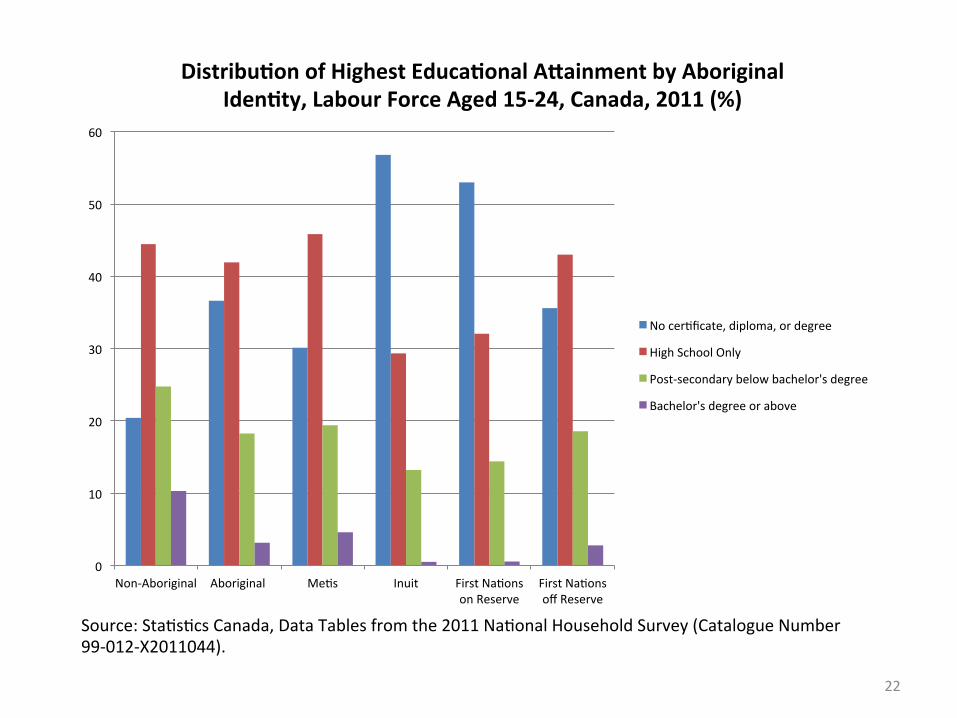
Distribu.on of Highest Educa.onal AXainment by Aboriginal Iden.ty, Labour Force Aged 15-‐24, Canada, 2011 (%)
No cer&ficate, diploma, or degree
High School Only
Post-‐secondary below bachelor's degree
Bachelor's degree or above
22
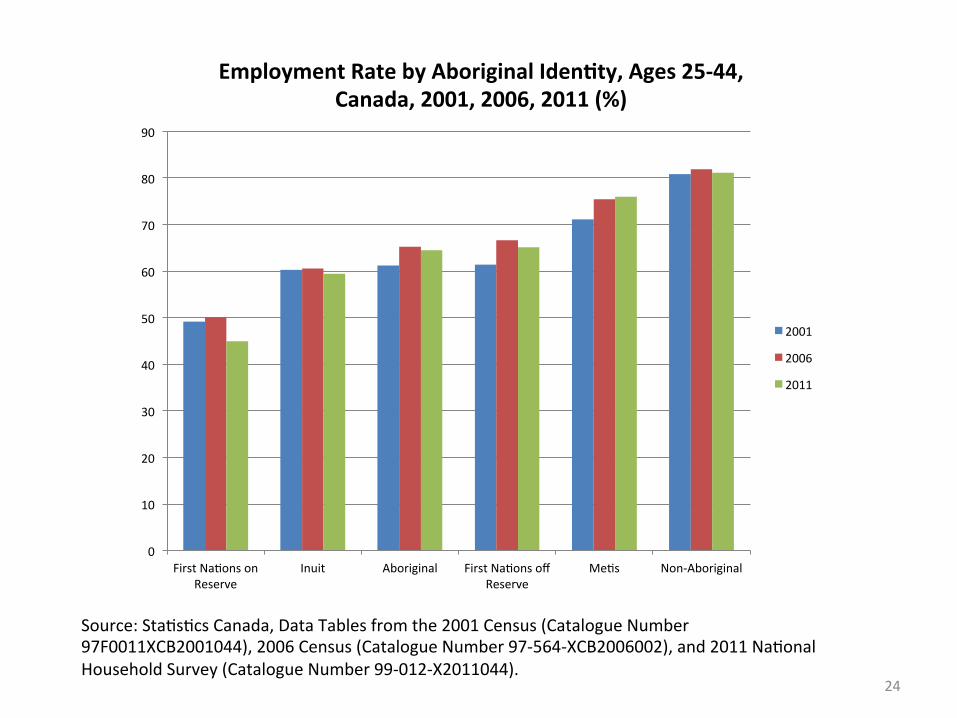
Source: Sta&s&cs Canada, Data Tables from the 2001 Census (Catalogue Number 97F0011XCB2001044), 2006 Census (Catalogue Number 97-‐564-‐XCB2006002), and 2011 Na&onal Household Survey (Catalogue Number 99-‐012-‐X2011044).
0
10
20
30
40
50
60
70
80
90
100
First Na&ons on Reserve
Inuit Aboriginal First Na&ons off Reserve
Me&s Non-‐Aboriginal
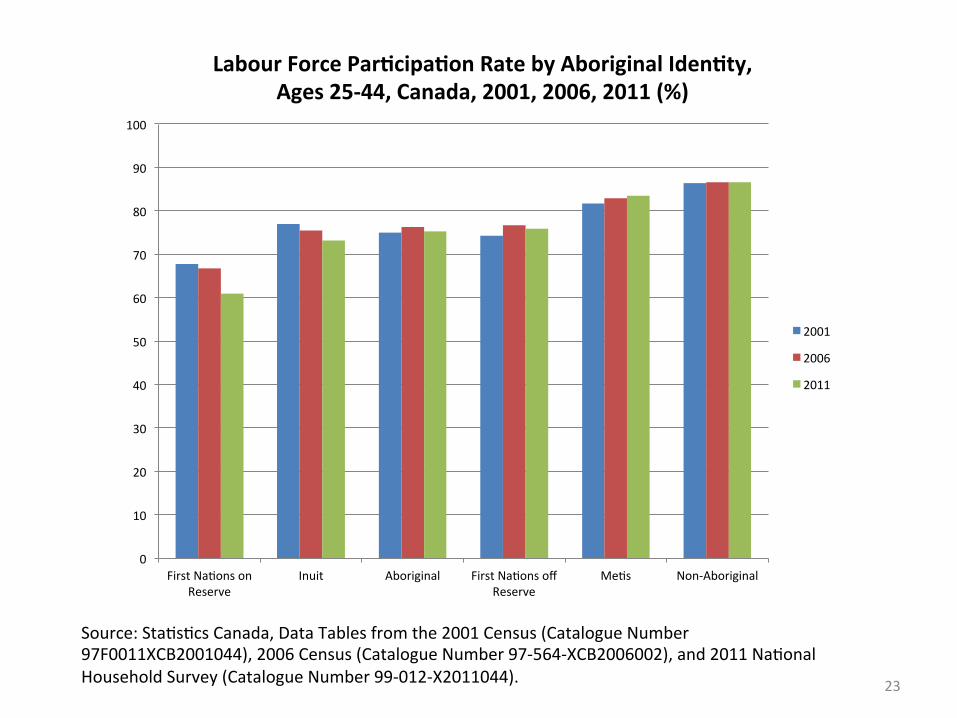
Labour Force Par.cipa.on Rate by Aboriginal Iden.ty, Ages 25-‐44, Canada, 2001, 2006, 2011 (%)
2001
2006
2011
23
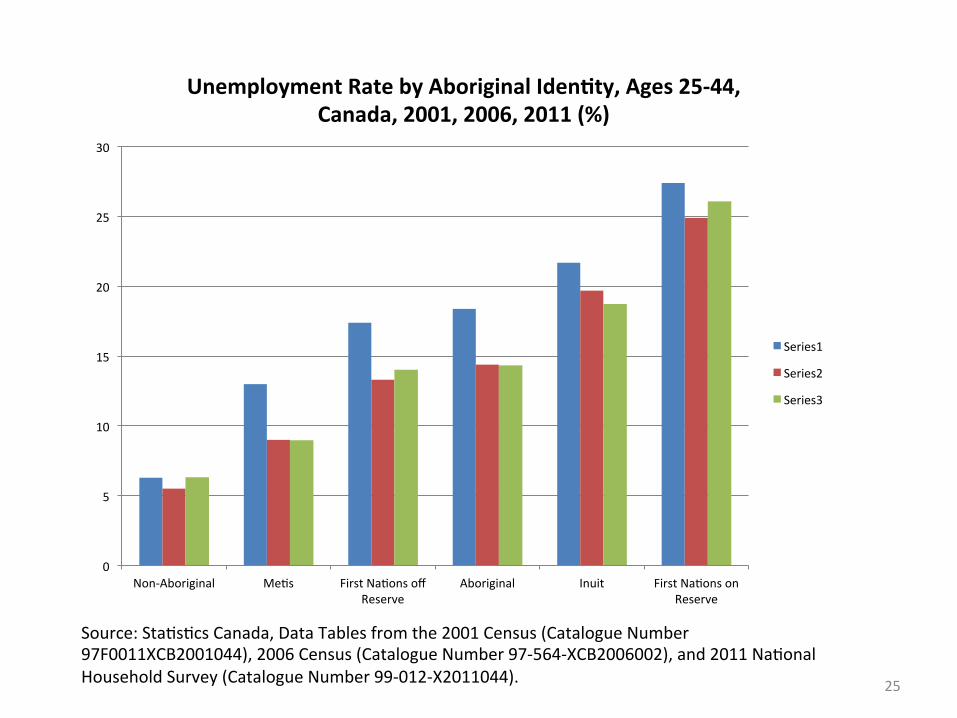
Source: Sta&s&cs Canada, Data Tables from the 2001 Census (Catalogue Number 97F0011XCB2001044), 2006 Census (Catalogue Number 97-‐564-‐XCB2006002), and 2011 Na&onal Household Survey (Catalogue Number 99-‐012-‐X2011044).
Source: Sta&s&cs Canada, Data Tables from the 2001 Census (Catalogue Number 97F0011XCB2001044), 2006 Census (Catalogue Number 97-‐564-‐XCB2006002), and 2011 Na&onal Household Survey (Catalogue Number 99-‐012-‐X2011044).
Source: Sta&s&cs Canada, Data Tables from the 2001 Census (Catalogue Number 97F0011XCB2001044), 2006 Census (Catalogue Number 97-‐564-‐XCB2006002), and 2011 Na&onal Household Survey (Catalogue Number 99-‐012-‐X2011044).
0
5
10
15
20
25
30
35
40
45
Non-‐Aboriginal Me&s Aboriginal First Na&ons off Reserve
Source: Sta&s&cs Canada, Data Tables from the 2011 Na&onal Household Survey (Catalogue Number 99-‐012-‐X2011044).
0
10
20
30
40
50
60
70
80
90
100
Non-‐Aboriginal Aboriginal Me&s Inuit First Na&ons on Reserve
First Na&ons off Reserve
Employment Rates by Aboriginal Iden.ty and Educa.onal AXainment, Ages 25-‐34, Canada, 2011 (%)
No cer&ficate, diploma, or degree
High School Only
Post-‐secondary below bachelor's degree
Bachelor's degree or above
27
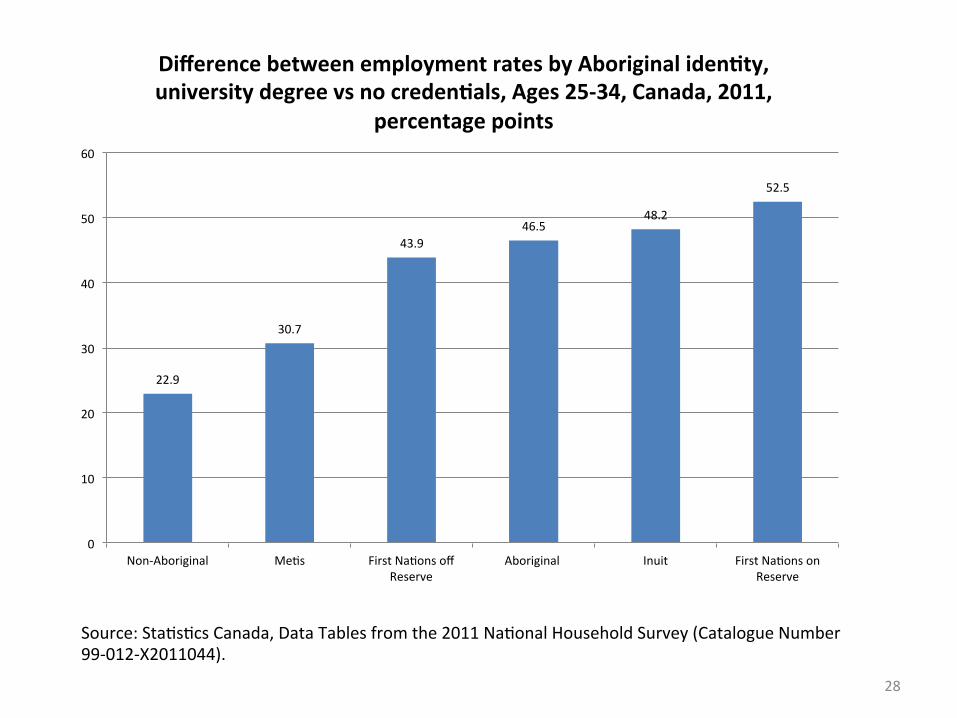
Source: Sta&s&cs Canada, Data Tables from the 2011 Na&onal Household Survey (Catalogue Number 99-‐012-‐X2011044).
22.9
30.7
43.9 46.5
48.2
52.5
0
10
20
30
40
50
60
Non-‐Aboriginal Me&s First Na&ons off Reserve
Aboriginal Inuit First Na&ons on Reserve
Difference between employment rates by Aboriginal iden.ty, university degree vs no creden.als, Ages 25-‐34, Canada, 2011,
percentage points
28
Source: Sta&s&cs Canada, Data Tables from the 2011 Na&onal Household Survey (Catalogue Number 99-‐012-‐X2011044).
0
10
20
30
40
50
60
70
80
90
100
Non-‐Aboriginal Aboriginal Me&s Inuit First Na&ons on Reserve
First Na&ons off Reserve
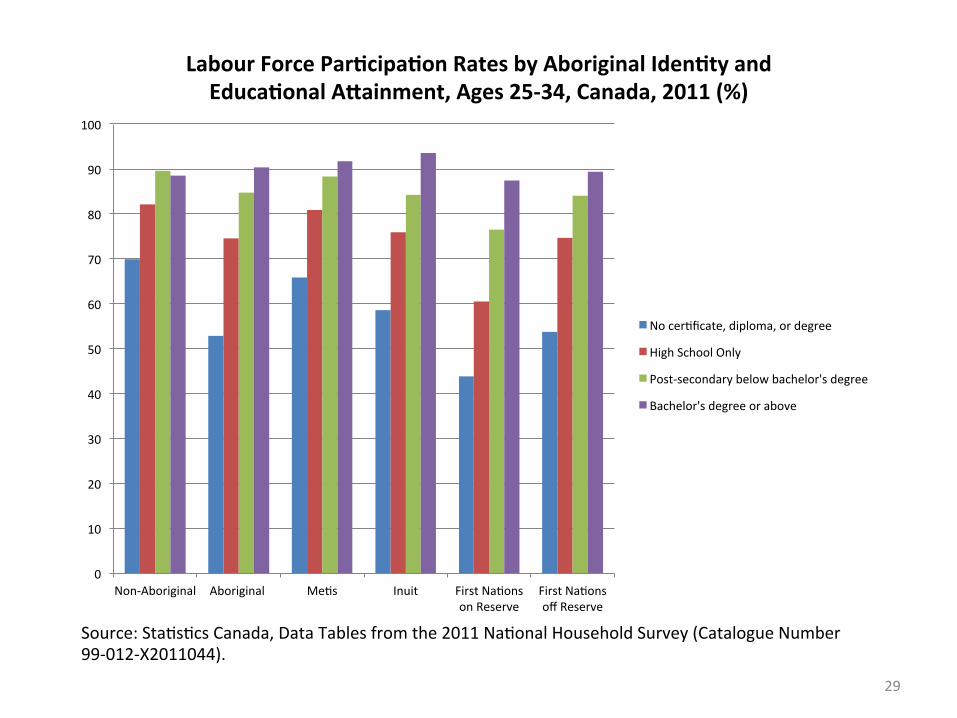
Labour Force Par.cipa.on Rates by Aboriginal Iden.ty and Educa.onal AXainment, Ages 25-‐34, Canada, 2011 (%)
No cer&ficate, diploma, or degree
High School Only
Post-‐secondary below bachelor's degree
Bachelor's degree or above
29
Source: Sta&s&cs Canada, Data Tables from the 2011 Na&onal Household Survey (Catalogue Number 99-‐012-‐X2011044).
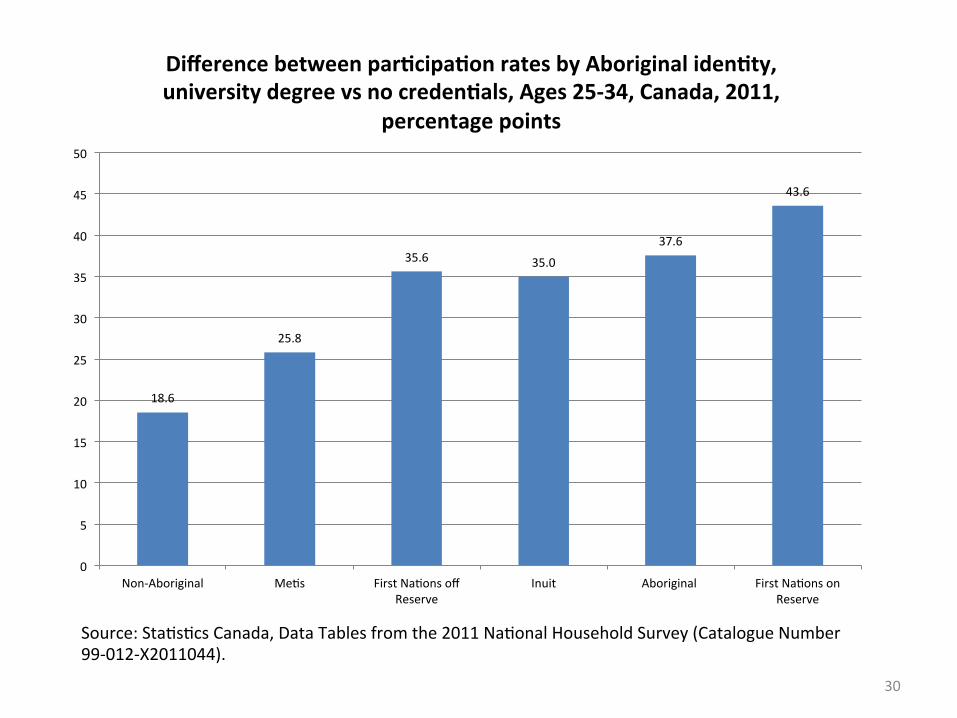
18.6
25.8
35.6 35.0
37.6
43.6
0
5
10
15
20
25
30
35
40
45
50
Non-‐Aboriginal Me&s First Na&ons off Reserve
Inuit Aboriginal First Na&ons on Reserve
Difference between par.cipa.on rates by Aboriginal iden.ty, university degree vs no creden.als, Ages 25-‐34, Canada, 2011,
percentage points
30
Source: Sta&s&cs Canada, Data Tables from the 2011 Na&onal Household Survey (Catalogue Number 99-‐012-‐X2011044).
0
5
10
15
20
25
30
35
40
45
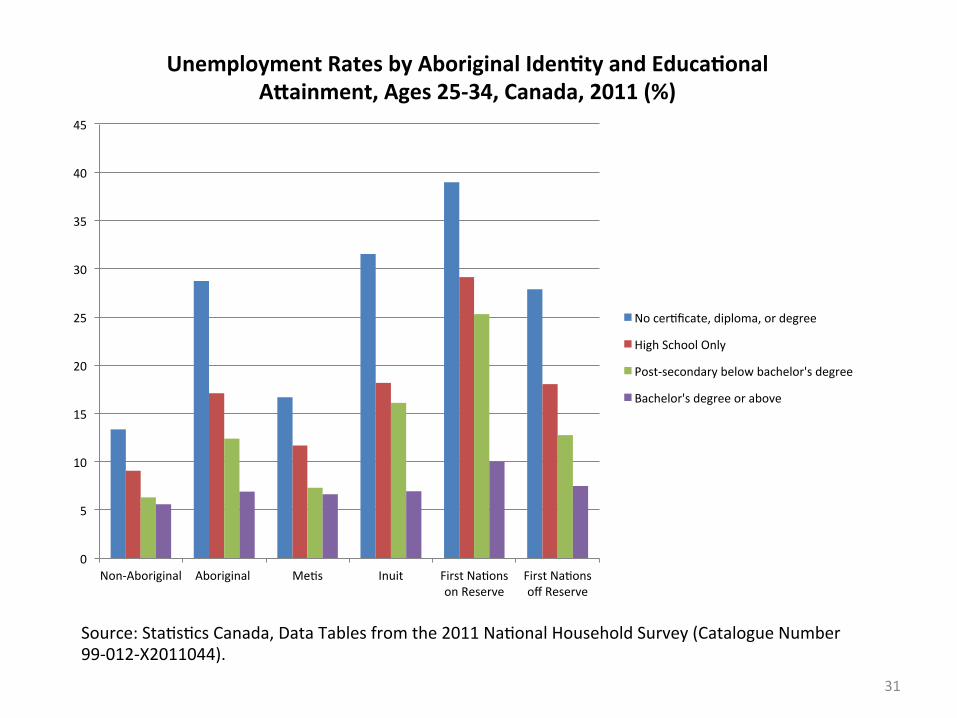
Non-‐Aboriginal Aboriginal Me&s Inuit First Na&ons on Reserve
First Na&ons off Reserve
Unemployment Rates by Aboriginal Iden.ty and Educa.onal AXainment, Ages 25-‐34, Canada, 2011 (%)
No cer&ficate, diploma, or degree
High School Only
Post-‐secondary below bachelor's degree
Bachelor's degree or above
31
Source: Sta&s&cs Canada, Data Tables from the 2011 Na&onal Household Survey (Catalogue Number 99-‐012-‐X2011044).
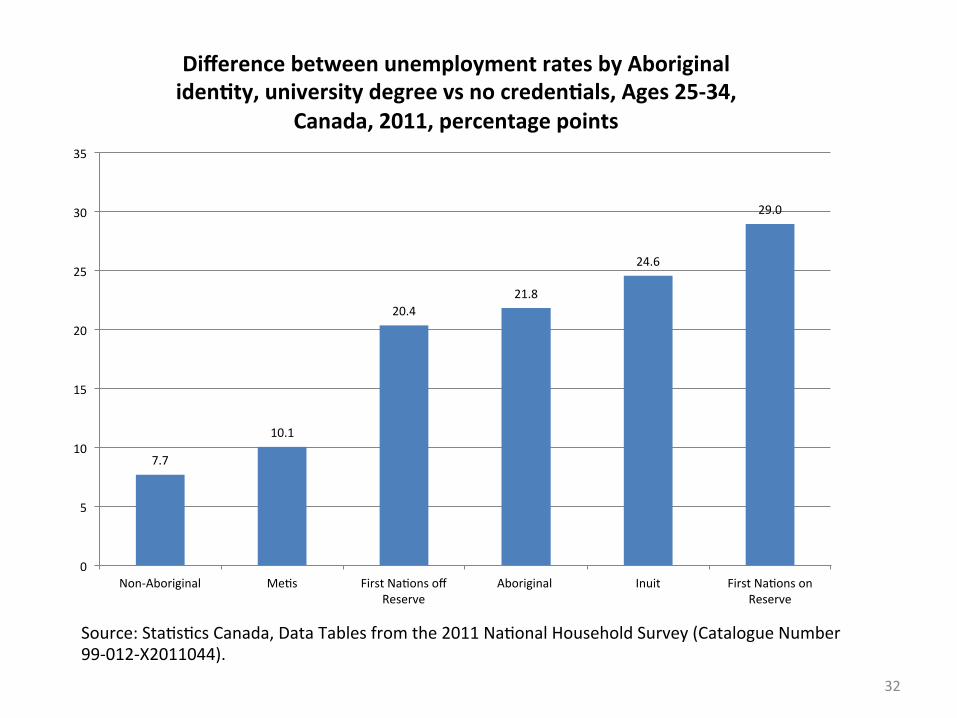
7.7
10.1
20.4 21.8
24.6
29.0
0
5
10
15
20
25
30
35
Non-‐Aboriginal Me&s First Na&ons off Reserve
Aboriginal Inuit First Na&ons on Reserve
Difference between unemployment rates by Aboriginal iden.ty, university degree vs no creden.als, Ages 25-‐34,
Canada, 2011, percentage points
32
Source: Sta&s&cs Canada, Data Tables from the 2011 Na&onal Household Survey (Catalogue Number 99-‐012-‐X2011044).
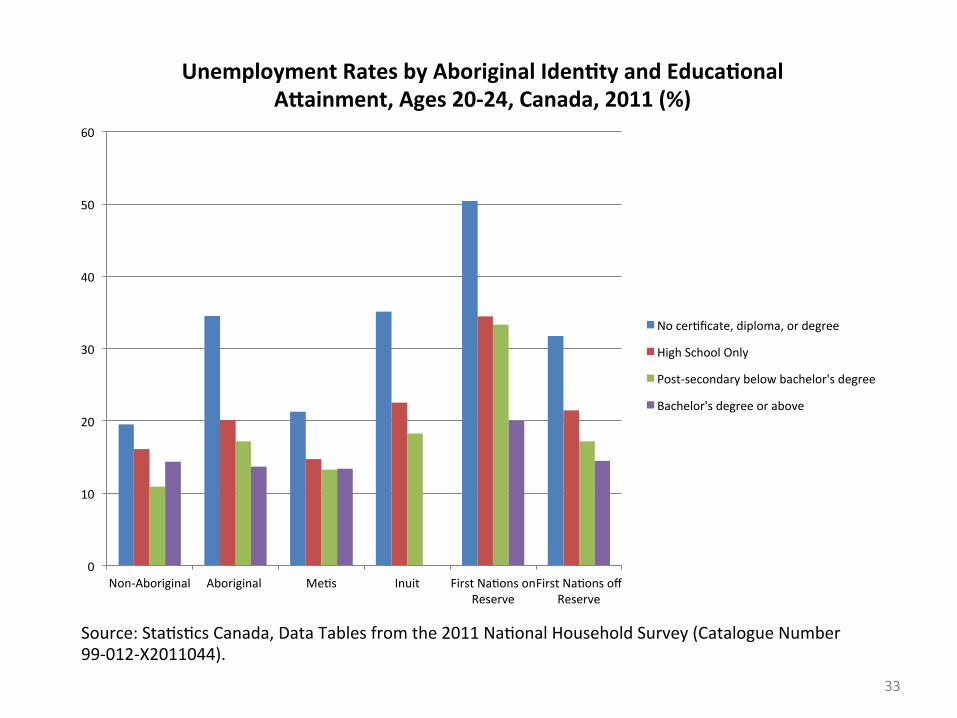
0
10
20
30
40
50
60
Non-‐Aboriginal Aboriginal Me&s Inuit First Na&ons on Reserve
First Na&ons off Reserve
Unemployment Rates by Aboriginal Iden.ty and Educa.onal AXainment, Ages 20-‐24, Canada, 2011 (%)
No cer&ficate, diploma, or degree
High School Only
Post-‐secondary below bachelor's degree
Bachelor's degree or above
33
Es&ma&ng the Gains from Closing the Educa&onal AQainment Gap
• The CSLS has released a series of reports es&ma&ng the economic benefits from closing the gap
• The most recent, Calver (2015), es&mated the benefits of closing a projected educa&on gap in 2031, based on recent trends in educa&onal aQainment
• Es&mates based upon data from the Na&onal Household Survey (2011), projec&ons of the Aboriginal popula&on in 2031 produced by Sta&s&cs Canada, and projec&ons of aggregate economic condi&ons by researchers at the university of Toronto
34
Es&ma&ng the Gains from Closing the Educa&onal AQainment Gap
• Assume that an Aboriginal person who aQains a higher level of educa&on will achieve (on average) the outcomes observed among the similar Aboriginal popula&on with that creden&al
• Controls for age, sex, and province/territory of residence
• Es&mates intended as aspira&onal, but are infeasible in prac&ce (unrealis&c to think sufficient numbers of those aged 25+ will go back to school and catch up).
35
Source: Calver, MaQhew (2015). “Closing the Aboriginal Educa&on Gap in Canada: Assessing Progress and Es&ma&ng the Economic Benefits,” CSLS Research Report 2015-‐03. These es&mates assume that the gaps condi&onal upon educa&on observed in the 2011 Na&onal Household Survey would remain.
Age in 2031 Employment (thousands)
GDP (2010 dollars, billions)
Average Aboriginal Employment Income (2010
dollars)
15+ 89.97 $28.34 $11,623
25-‐34 in 2031 (about 9-‐18 today) 17.98 $4.48 $8,412
Poten&al Gains from Elimina&ng the Aboriginal Educa&onal AQainment Gap by 2031, Canada
36
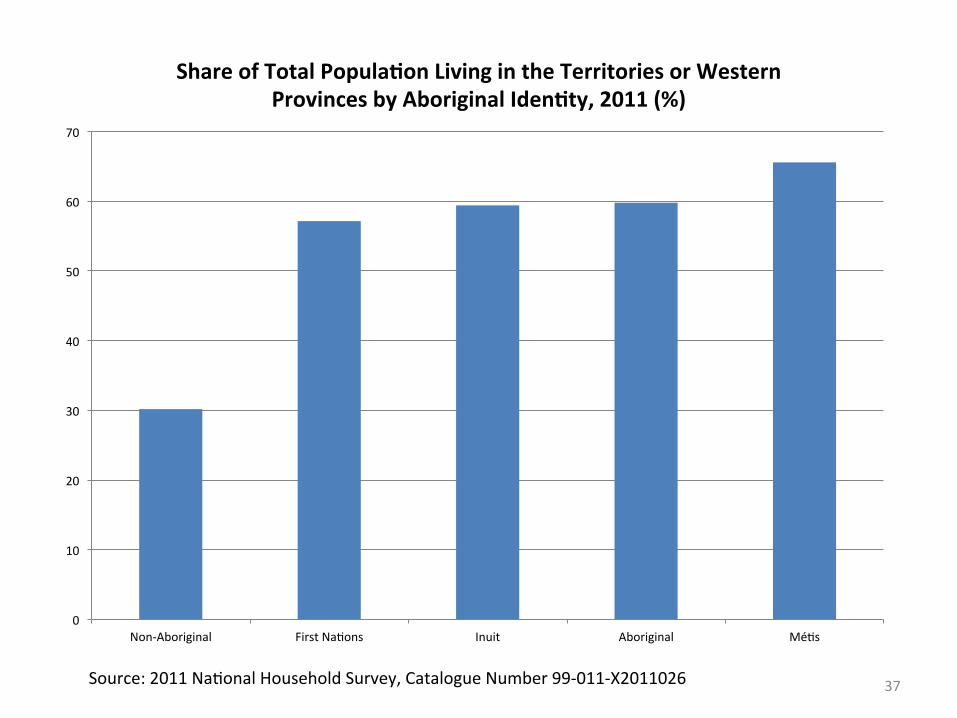
Source: 2011 Na&onal Household Survey, Catalogue Number 99-‐011-‐X2011026
0
10
20
30
40
50
60
70
Non-‐Aboriginal First Na&ons Inuit Aboriginal Mé&s
Share of Total Popula.on Living in the Territories or Western Provinces by Aboriginal Iden.ty, 2011 (%)
37
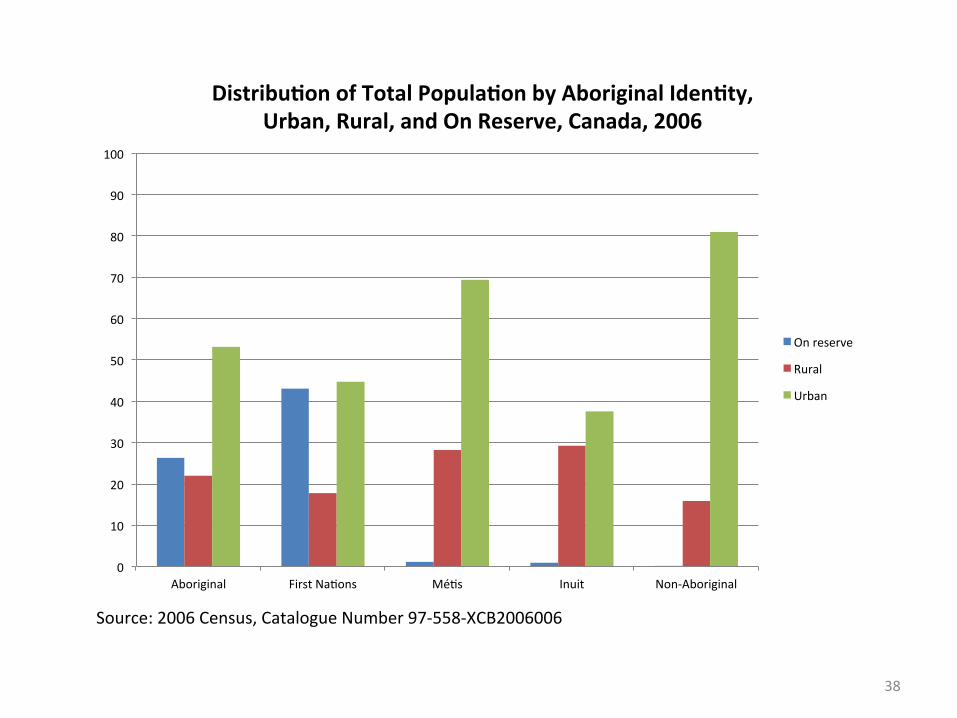
Source: 2006 Census, Catalogue Number 97-‐558-‐XCB2006006
0
10
20
30
40
50
60
70
80
90
100
Aboriginal First Na&ons Mé&s Inuit Non-‐Aboriginal
Distribu.on of Total Popula.on by Aboriginal Iden.ty, Urban, Rural, and On Reserve, Canada, 2006
On reserve
Rural
Urban
38
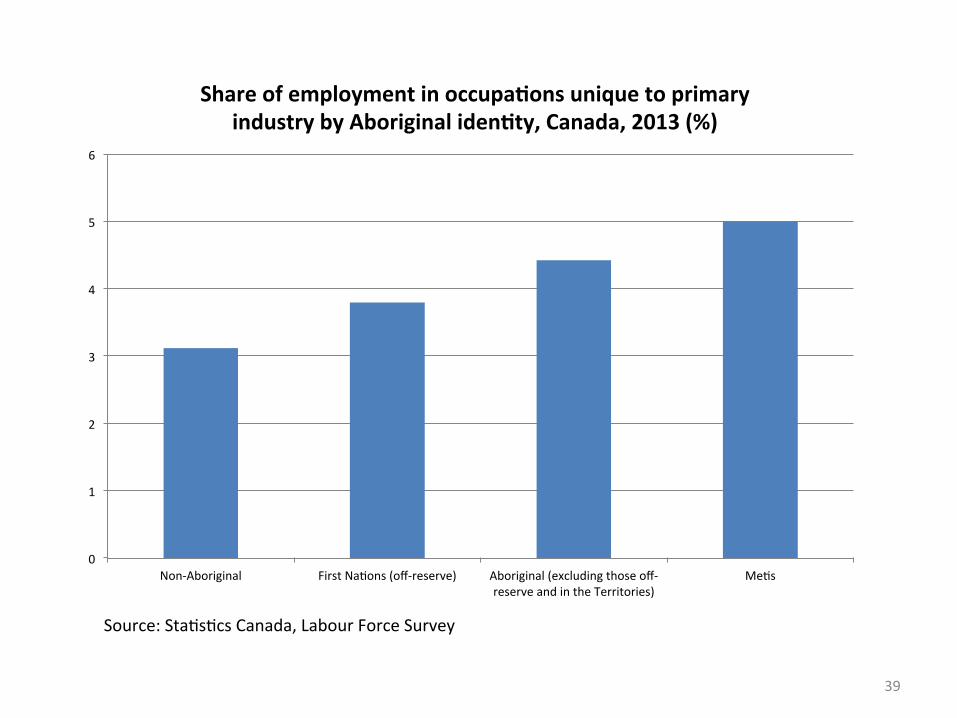
Source: Sta&s&cs Canada, Labour Force Survey
0
1
2
3
4
5
6
Non-‐Aboriginal First Na&ons (off-‐reserve) Aboriginal (excluding those off-‐reserve and in the Territories)
Me&s
Share of employment in occupa.ons unique to primary industry by Aboriginal iden.ty, Canada, 2013 (%)
39
Aboriginal Skills and Training Employment Strategy (ASETS)
• Aboriginal agreement holders design and deliver employment programs and services suited to the needs of their clients
• All Aboriginal people, regardless of status or loca&on, may access its programs and services, which include: – skills development – training for high-‐demand jobs – job finding – programs for youth – programs for urban and Aboriginal people with disabili&es – access to child care
40
Private Sector Ini&a&ves
Example: Zibi redevelopment project in OQawa / Ga&neau. • Project being developed on tradi&onally Algonquin land
• Developer has signed agreement with Algonquins of Ontario sta&ng that it will hire and train Aboriginal tradespeople, generate opportuni&es for Aboriginal business and entrepreneurship, and create mentorship programs for Aboriginal youth (OQawa Ci&zen, August 20th, 2015)
41
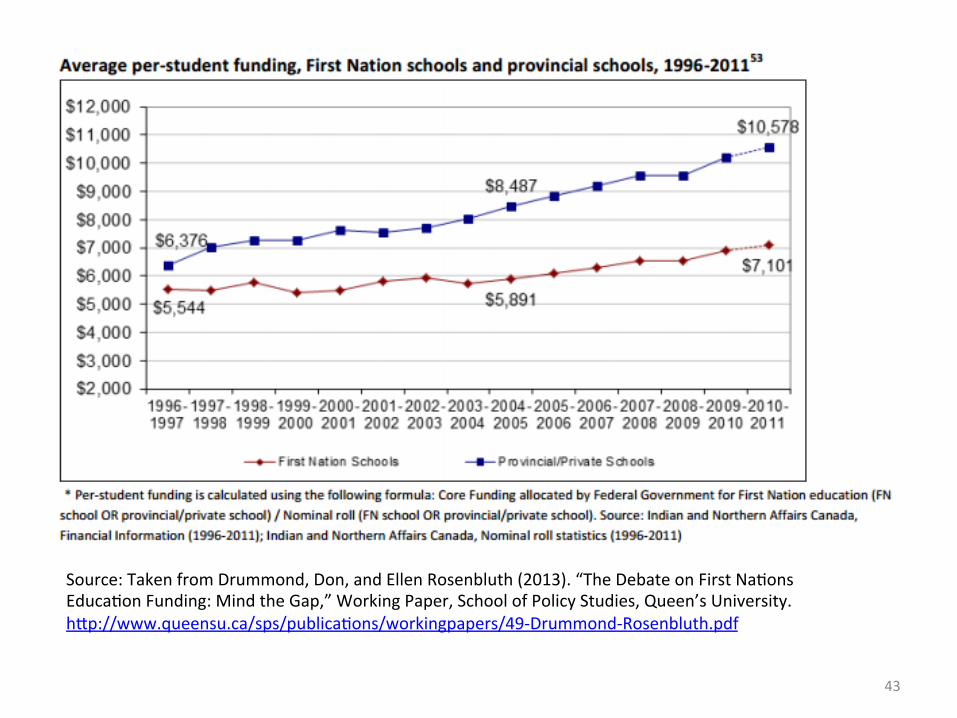
Source: Taken from Drummond, Don, and Ellen Rosenbluth (2013). “The Debate on First Na&ons Educa&on Funding: Mind the Gap,” Working Paper, School of Policy Studies, Queen’s University. hQp://www.queensu.ca/sps/publica&ons/workingpapers/49-‐Drummond-‐Rosenbluth.pdf
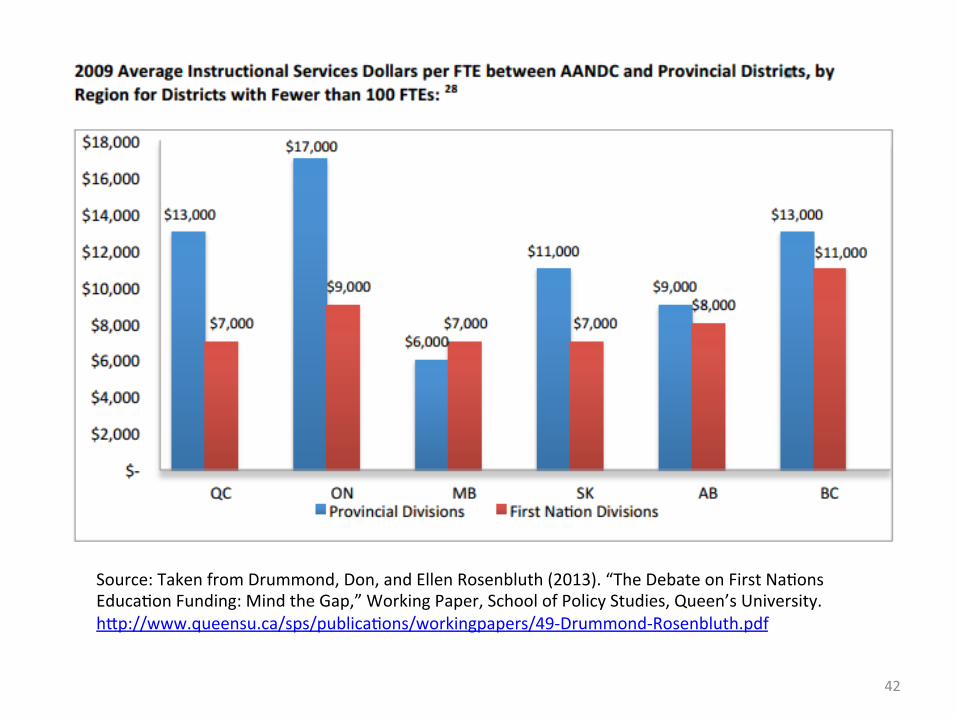
42
Source: Taken from Drummond, Don, and Ellen Rosenbluth (2013). “The Debate on First Na&ons Educa&on Funding: Mind the Gap,” Working Paper, School of Policy Studies, Queen’s University. hQp://www.queensu.ca/sps/publica&ons/workingpapers/49-‐Drummond-‐Rosenbluth.pdf
43
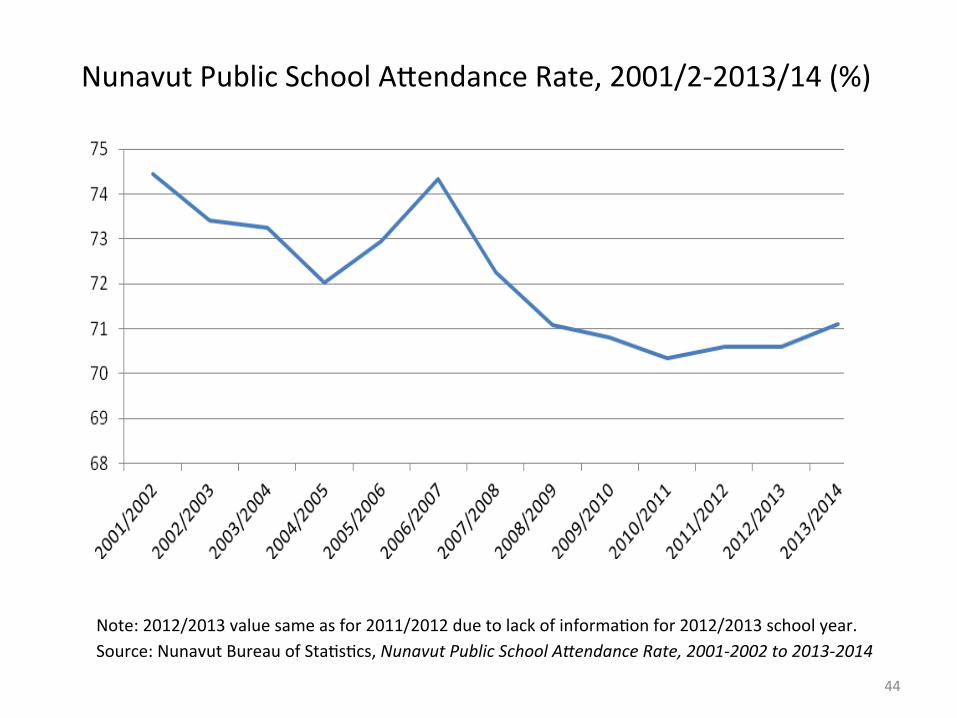
Note: 2012/2013 value same as for 2011/2012 due to lack of informa&on for 2012/2013 school year. Source: Nunavut Bureau of Sta&s&cs, Nunavut Public School A1endance Rate, 2001-‐2002 to 2013-‐2014
Nunavut Public School AQendance Rate, 2001/2-‐2013/14 (%)
44
Recent CSLS Research on Aboriginal Issues
• Calver, MaQhew (2015). “Closing the Aboriginal Educa&on Gap in Canada: Assessing Progress and Es&ma&ng the Economic Benefits,” CSLS Research Report 2015-‐03. Prepared for Aboriginal Affairs and Northern Development Canada. hQp://www.csls.ca/reports/csls2015-‐03.pdf
• Thomas, Jasmin (2015). “Benchmarking Mé&s Economic and Social Development,” CSLS
Research Report 2015-‐07. Prepared for the Mé&s Na&onal Council. hQp://www.csls.ca/reports/csls2015-‐07.pdf
• Thomas, Jasmin (forthcoming). “Review of Best Prac&ces in Labour Market Forecas&ng with an
Applica&on to the Canadian Aboriginal Popula&on.” Prepared for the Na&onal Associa&on of Friendship Centres.
• McKellips, Fanny (forthcoming). “Aboriginal Labour Market Informa&on in Canada: An
Overview.” Prepared for the Na&onal Associa&on of Friendship Centres. • Palesch, Nico (forthcoming). “Crea&ng Opportunity in Inuit Nunangat: Moving Past the Crisis in
Inuit Educa&on and Labour Market Outcomes.” Prepared for Inuit Tapiriit Kanatami