At the lower secondary level, class sizes differ significantly among OECD countries and in other G20 countries.
Class size continues to be at the forefront of the educational and political agenda for schools, school districts, school boards, education policy makers, parents and other stakeholders. Indeed, class size is a factor that may influence parents’ choice of a school over another. Smaller class sizes are generally perceived as allowing teachers to spend more time with each student and less time in classroom management, thereby providing better instruction tailored to the students’ individual needs, and ensuring higher performance. In this respect, class size may be viewed as an indicator of the quality of a school system.
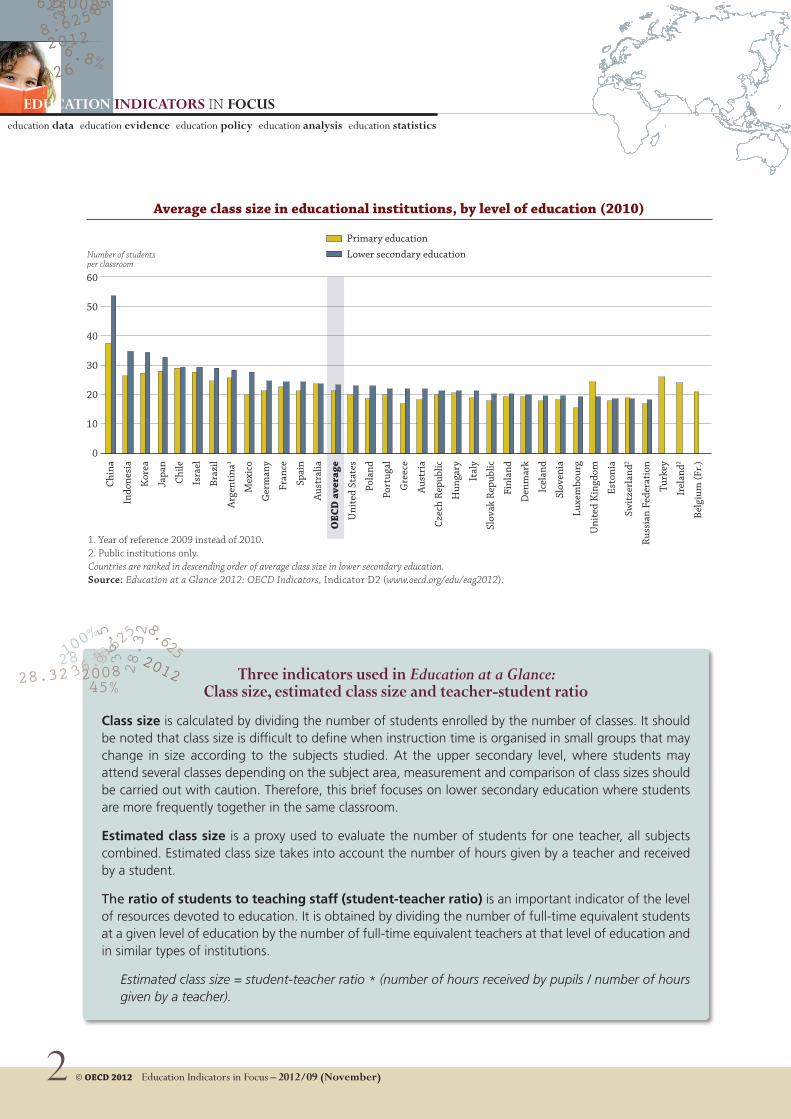
At the lower secondary level and among all OECD countries with comparable data, the average class size varies from 20 students or fewer in Denmark, Estonia, Finland, Iceland, Luxembourg, Slovenia, Switzerland (public institutions) and the United Kingdom, to more than 34 students in Korea. The contrast is even more striking
with other G20 countries which provided data (i.e. Argentina, Brazil, China, Indonesia and the Russian Federation); in China, for instance, the number of students per
class reaches the 50 students mark (see Indicator D2 in OECD, 2012).
It is worth noting that classes tend to be smaller in primary education, the number of students per class growing by two or more students
between the primary and the lower secondary level. This trend has intensified between 2000 and 2010, particularly among countries that traditionally reported bigger class sizes, such as Japan and Korea.
In OECD countries, the average class size at the lower secondary level is 23 students, but there are significant differences between countries, ranging from over 32 in Japan and Korea to 19 or below in Estonia, Iceland, Luxembourg, Slovenia and the United Kingdom.
Class size, together with students’ instruction time, teachers’ teaching time and teachers’ salaries, is one of the key variables that policy makers can use to control spending on education. Between 2000 and 2009, many countries invested additional resources to decrease class size; however, student performance has improved in only a few of them.
Reducing class size is not, on its own, a sufficient policy lever to improve the performance of education systems, and is a less efficient measure than increasing the quality of teaching.
education data education evidence education policy education analysis education statistics
Average class size in educational institutions, by level of education (2010)
1. Year of reference 2009 instead of 2010.2. Public institutions only.Countries are ranked in descending order of average class size in lower secondary education.Source: Education at a Glance 2012: OECD Indicators, Indicator D2 (www.oecd.org/edu/eag2012).
Lower secondary education
Primary education
Chi
na
Indo
nesi
a
Kor
ea
Japa
n
Chi
le
Isra
el
Braz
il
Arg
enti
na1
Mex
ico
Ger
man
y
Fran
ce
Spai
n
Aus
tral
ia
OEC
D a
vera
ge
Uni
ted
Stat
es
Pola
nd
Port
ugal
Gre
ece
Aus
tria
Czec
h R
epub
lic
Hun
gary
Ital
y
Slov
ak R
epub
lic
Finl
and
Den
mar
k
Icel
and
Slov
enia
Luxe
mbo
urg
Uni
ted
Kin
gdom
Esto
nia
Swit
zerl
and2
Rus
sian
Fed
erat
ion
Turk
ey
Irel
and2
Belg
ium
(Fr.)
three indicators used in Education at a Glance: class size, estimated class size and teacher-student ratio
Class size is calculated by dividing the number of students enrolled by the number of classes. It should be noted that class size is difficult to define when instruction time is organised in small groups that may change in size according to the subjects studied. At the upper secondary level, where students may attend several classes depending on the subject area, measurement and comparison of class sizes should be carried out with caution. Therefore, this brief focuses on lower secondary education where students are more frequently together in the same classroom.
Estimated class size is a proxy used to evaluate the number of students for one teacher, all subjects combined. Estimated class size takes into account the number of hours given by a teacher and received by a student.
The ratio of students to teaching staff (student-teacher ratio) is an important indicator of the level of resources devoted to education. It is obtained by dividing the number of full-time equivalent students at a given level of education by the number of full-time equivalent teachers at that level of education and in similar types of institutions.
Estimated class size = student-teacher ratio * (number of hours received by pupils / number of hours given by a teacher).
education data education evidence education policy education analysis education statistics
Reducing class size and increasing teachers’ salaries are the two main reforms undertaken in OECD countries over the last decade…
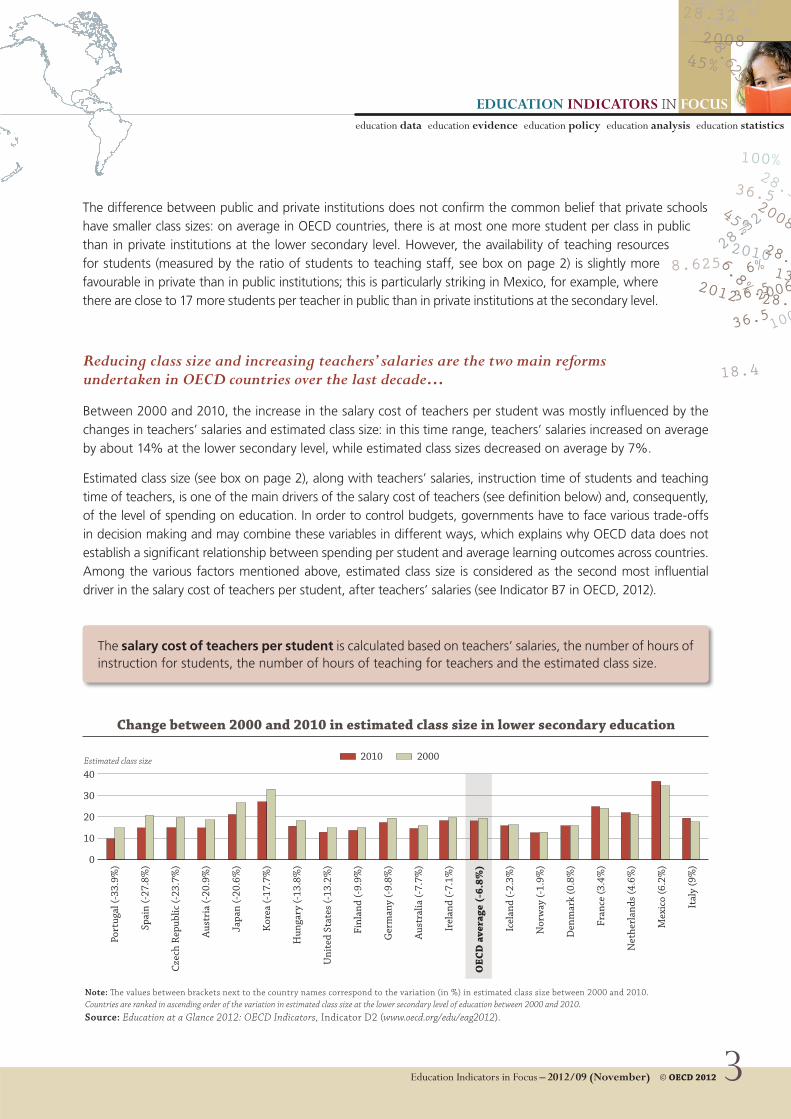
Between 2000 and 2010, the increase in the salary cost of teachers per student was mostly influenced by the changes in teachers’ salaries and estimated class size: in this time range, teachers’ salaries increased on average by about 14% at the lower secondary level, while estimated class sizes decreased on average by 7%.
Estimated class size (see box on page 2), along with teachers’ salaries, instruction time of students and teaching time of teachers, is one of the main drivers of the salary cost of teachers (see definition below) and, consequently, of the level of spending on education. In order to control budgets, governments have to face various trade-offs in decision making and may combine these variables in different ways, which explains why OECD data does not establish a significant relationship between spending per student and average learning outcomes across countries. Among the various factors mentioned above, estimated class size is considered as the second most influential driver in the salary cost of teachers per student, after teachers’ salaries (see Indicator B7 in OECD, 2012).
The salary cost of teachers per student is calculated based on teachers’ salaries, the number of hours of instruction for students, the number of hours of teaching for teachers and the estimated class size.
40
30
20
10
0
Estimated class size
Change between 2000 and 2010 in estimated class size in lower secondary education
Note: �e values between brackets next to the country names correspond to the variation (in %) in estimated class size between 2000 and 2010.Countries are ranked in ascending order of the variation in estimated class size at the lower secondary level of education between 2000 and 2010.Source: Education at a Glance 2012: OECD Indicators, Indicator D2 (www.oecd.org/edu/eag2012).
20002010
Port
ugal
(-33
.9%
)
Spai
n (-
27.8
%)
Czec
h R
epub
lic (-
23.7
%)
Aus
tria
(-20
.9%
)
Japa
n (-
20.6
%)
Kor
ea (-
17.7
%)
Hun
gary
(-13
.8%
)
Uni
ted
Stat
es (-
13.2
%)
Finl
and
(-9.
9%)
Ger
man
y (-
9.8%
)
Aus
tral
ia (-
7.7%
)
Irel
and
(-7.
1%)
OEC
D a
vera
ge (
-6.8
%)
Icel
and
(-2.
3%)
Nor
way
(-1.
9%)
Den
mar
k (0
.8%
)
Fran
ce (3
.4%
)
Net
herl
ands
(4.6
%)
Mex
ico
(6.2
%)
Ital
y (9
%)
The difference between public and private institutions does not confirm the common belief that private schools have smaller class sizes: on average in OECD countries, there is at most one more student per class in public than in private institutions at the lower secondary level. However, the availability of teaching resources for students (measured by the ratio of students to teaching staff, see box on page 2) is slightly more favourable in private than in public institutions; this is particularly striking in Mexico, for example, where there are close to 17 more students per teacher in public than in private institutions at the secondary level.
EducatioN iNdicators IN focuseducation data education evidence education policy education analysis education statistics
Coming next month:The social outcomes of learning
For more information, contact:Elisabeth Villoutreix ([email protected])
See:OECD (2009), Creating Effective Teaching and Learning environments: First Results from TALIS, OECD Publishing.OECD (2010), PISA 2009 Results: What Makes a School Successful? Resources, Policies and Practices (Volume IV), PISA, OECD Publishing.OECD (2012), Education at a Glance 2012: OECD Indicators, OECD Publishing.
Visit:www.oecd.org/edu
the bottom line
In the past few years, a number of factors have triggered a reduction in class size in many OECD countries. In some cases, this resulted from demographic changes and declining student numbers while in other cases, geographical variables were at play. There has also been general public pressure from parents to lower the size of classes. However, evidence from the OECD Teaching and Learning International Survey (TALIS) has shown that, independently of their class size, the lack of qualified teachers is also a serious concern in many countries. Thus, in countries with below-average class sizes (22 students and less), such as Austria, Estonia and Italy, a significant percentage of teachers worked in schools whose principal reported that a lack of qualified teachers hindered instruction (see Table 2.5 in OECD, 2009).
In addition, among countries with above-average class sizes (see Table 2.4 in OECD, 2009), an above-average proportion of school principals considered a lack of qualified teachers as a factor hindering instruction, notably in Mexico (64%) and Turkey (78%). By contrast, in Korea – another country with a high average class size (34 students) –, only about 19% of teachers worked in schools whose principal reported that a lack of qualified teachers hindered instruction, one of the lowest percentages among TALIS countries.
Thus, reducing class size is not, on its own, a sufficient guarantee to improve the quality of education systems. But what is the impact on student performance?
Apart from optimising public resources, reducing class size to increase student achievement is an approach that has been tried, debated, and analysed for several decades. Class size may affect how much time and attention a teacher can give to individual students, as well as the social dynamics between students.
However, findings from the OECD Programme for International Student Assessment (PISA) suggest that systems prioritising higher teacher quality over smaller classes tend to perform better, which confirms other research showing that raising teacher quality is a more effective measure to improve student outcomes. The examples of Japan and Korea are compelling: the school systems of these two countries, which show comparatively high levels of spending by educational institutions, tend to prioritise teachers’ salaries over class size. Both countries report higher than average student performance in PISA (see Figure IV.3.7 in OECD, 2010).
… and it appears that increasing the quality of teaching is often a more efficient policy lever to improve student performance than reducing class size.
in a period of economic crisis and tightened public budgets, while analyses of oEcd data do not establish a significant relationship between spending per student and average learning outcomes across countries, Pisa data shows that high-performing education systems are commonly prioritising the quality of teachers over class size.