73
| Date post: | 11-Oct-2018 |
| Category: |
Documents |
| Upload: | truongkiet |
| View: | 214 times |
| Download: | 0 times |


1
Education and Training Monitor 2013
ec.europa.eu/education/monitor

2
The 2013 Education and Training Monitor was prepared by the unit ‘Statistics, studies and surveys' with the help of thematic units within the Directorate-General of Education and Culture (DG EAC).
DG EAC was assisted by the Eurydice unit from the Education and Culture Executive Agency (EACEA), the JRC’s Centre for Research on Lifelong Learning (CRELL) and Eurostat. The members of the Standing Group on Indicators and Benchmarks (SGIB) were consulted during the drafting phase.

3
Foreword Education and training are a source of future growth and employment and are becoming key success factors for the Europe 2020 Strategy. In times of budget constraints it comes as no
surprise that the spotlight is on spending. Yet it is precisely in such times that growth-enhancing policies, such as education, should be a top priority: spending on education is an investment, not a cost. As many EU Member States are forced to cut back, the need to scrutinise the effectiveness
and efficiency of our education and training systems becomes all the more relevant as we endeavour to do more with less. The wealth of data provided by this Education and Training Monitor supports Member States in this
effort. It enables countries to compare investments in education and training systems against their outcomes and identifies ways of maximising efficiency. It particularly enables countries to assess their performance compared to other countries, regarding the specific recommendations they
received during the last European Semester. The EU level benchmarks set for 2020 provide standards for comparison, encouraging the
exchange of information and stimulating peer learning. Cross-country policy research serves to demonstrate how each Member State performs on the basis of the ET 2020 benchmarks and, more importantly, strives to bring to light the most successful policy measures within education and training across Europe.
This year's Monitor is published on the eve of the launch of a new 7-year programme supporting Europe’s cooperation in education, training, youth and sports. Erasmus+ demonstrates the EU’s
commitment to education. Compared to its predecessor, the budget of the new programme will increase by approximately 40%, to more than €14 billion over the 2014-2020 period.
This publication also comes at the point when Member States and the Commission are discussing the European Structural and Investment Funds 2014-2020. The Commission’s task will be to make sure that these funds have real impact on education and training systems in Europe. This will only
happen if countries design a strategy for education with clear, concrete and measureable targets;
milestones for each education level and age-group; and time-frames for implementation, with tools for monitoring progress.
I believe that the Education and Training Monitor 2013 is a tool that will prove invaluable in facilitating decision-makers across Europe to reform their education systems, guaranteeing high-quality and equitable education and training for all our citizens.
Androulla Vassiliou European Commissioner for Education, Culture, Multilingualism and Youth

4
Contents Key findings 5
Volume I
1. Introduction 9
2. Investing in skills and qualifications 13
2.1. Investing in education and training in a context of economic crisis 13
2.2. Opening up education and training through new technologies 17
2.3. Tools for transparency of skills and qualifications 21
3. Tackling early school leaving and raising the bar in school education 25
3.1. Reducing the share of early leavers from education and training 25
3.2. Improving early childhood education and care 31
3.3. Strengthening the teaching profession 33
3.4. Laying the foundations for skills development 34
4. Emphasising effectiveness and quality in the modernisation of higher
education
39
4.1. Increasing tertiary education attainment 39
4.2. Meeting the challenge of effective resource allocation in higher education 43
4.3. Promoting learning mobility in higher education 47
5. Facilitating the transition from education to work through vocational
education and training
52
5.1. Reshaping vocational education and training 52
5.2. Enhancing the employability of young people 55
5.3. Fostering entrepreneurship education 58
6. Upgrading skills through lifelong learning 62
6.1. Taking a closer look at the Survey of Adult Skills 62
6.2. Raising adult participation in lifelong learning 66
Annex 71
Volume II
Country reports ec.europa.eu/education/monitor

5
Key findings
The European Union's Strategy to boost growth and jobs – Europe 2020 – aims to tackle the crisis and build a stronger, more competitive Europe. To meet these objectives, people have to be
equipped with the skills and qualifications they need on today's labour market, and even more so on tomorrow's global knowledge-based economy. Skills and qualifications are one of the key factors determining Europe's economic success.
However, the difficult economic context casts its shadow on the financing of education and training. The Commission has called on Member States repeatedly to give priority to growth-friendly expenditure. In July 2013, 17 Member States were given a country-specific
recommendation, urging them to pursue growth-friendly fiscal policies. In practice, however, spending on education and training, a growth-enhancing mechanism by design, is decreasing or stagnating. This is particularly worrying as it puts at risk Europe's return to smart, sustainable and
inclusive growth. After all, world-class education and training requires investing substantial resources.
Education outcomes can be measured in terms of skills or qualifications. The Europe 2020 Strategy focusses on qualifications by setting out a twofold headline target on early school leaving and tertiary education attainment, to be reached by 2020. First, the share of early school leavers is to be decreased to below 10%. In 2012, Europe stood at 12.7%, down from 13.4% the
previous year. The target seems to be within reach, but about 5 and half million citizens is still leaving school prematurely, which makes it hard for them to find employment. Second, the EU is making good progress towards the target to increase tertiary attainment to 40%. The EU now
stands at 35.7%, up from 34.5% the year before. However, it will be a challenge to combine the increase in numbers with a solid quality of higher education.
Another way to measure education outcomes is by looking at skills. New findings from the OECD’s Survey of Adult Skills (PIAAC) expose a weakness: the skills of Europe's working-age population are not in line with the needs and requirements of the labour market. Today Europe is facing a serious skills gap that risks hampering growth and employment in the future; and the least skilled
workers, who are in the most urgent need of up-skilling to be employable, tend not to take part in training. To close this skills gap and bring adult skills in line with the general expectations and needs of our modern economy will require substantial investment over many years.
To secure the necessary investments for skills and qualifications is not easy. In part, the solution will be to scrutinise spending in light of the various education outcomes. Another approach will be
to introduce efficiency measures that have to potential to transform investments into stronger outcomes. Efficiency measures can help to meet the twin challenge of pursuing fiscal consolidation and investing in growth-enhancing policies.
As an example of such efficiency measures, Europe would benefit from overcoming remaining barriers that are due to the myriad of existing diplomas, certificates and qualifications. Despite the existence of a large number of policies and instruments, there still remain obstacles for individuals
to move between countries, across different education sub-systems, and from education to work. Europe needs better transparency and recognition of skills and qualifications. Efforts towards a European Area for Skills and Qualifications will enhance the effective recognition of competences
and qualifications and support the free movement of learners and workers. Another example of efficiency measures will be to link the worlds of work and education more closely, in order to curb and even prevent youth unemployment, which is one of Europe's most
pressing problems. To ensure that education and training systems provide high-quality and labour
market relevant skills, they have to be adjusted to respond better to economic developments; if possible, they have to detect or anticipate emerging trends in order to secure in time a stable
supply of relevant skills. This will help to avoid shortages of qualified labour and skills mismatches.

6
The policy messages set out in the analysis above are supported by 10 key findings that emerge
from the second annual Education and Training Monitor.
The consolidation of public finance and youth unemployment challenge European
education and training systems …
1. Sixteen Member States decreased their education expenditure at some
stage between 2008 and 2011, with six of them showing further significant budget
decreases in 2012 (EL, IT, CY, LV, PT, UK-WLS). Cutbacks in spending per student across
Europe started to be most prevalent in tertiary education (12 Member States) between
2008 and 2010. Whereas the majority of Member States decreased spending per student
for at least one level of education, BG, ES, HR, IT, LV and RO cut down on all levels from
primary to tertiary in this period.
2. The employment rate of recent graduates with at least upper secondary
education stands at 75.7%, down from 82.0% in 2008. An advantage of
tertiary education attainment over upper secondary education attainment is still visible in
all Member States. However, across the EU, 21% of people with tertiary qualifications are
active in jobs that usually require lower qualifications. This suggests that, in spite of the
high levels of unemployment, there is also evidence of skills mismatches.
3. The transition from education to work can be facilitated through quality
traineeships, apprenticeships and dual learning models. Students from
vocational education and training programmes have a better transition from education to
work in Member States with developed work-based learning (e.g. DK, DE, NL and AT).
Many Member States are working on reforms that build on the experiences of these
countries.
… while analysis of the twofold Europe 2020 headline target underlines the need
to link the worlds of work and education more closely, …
4. Early school leavers are struggling to move between the worlds of work
and education. The rate of early leavers from education and training stands at 12.7%.
However, between 2009 and 2012, IT, DE, FR and CY have been making little progress and
HU, RO and BE have even shown an increase in their early school leaving rates. The
biggest challenge lies in the transition from school to work, with the unemployment rate
amongst early school leavers at 40.1%, and from work back to learning, with only 0.8% of
18 to 24 year-olds in non-formal learning after having left formal education.
5. A global race for talent changes the landscape of higher education. With the
tertiary attainment rate now at 35.7%, the policy focus is shifting towards improving
completion rates (still below 70% in many Member States), further enhancing quality and
relevance and promoting the international mobility of students. International mobility in
higher education increases the probability of mobility after graduation and can help in
tackling skills mismatches and bottlenecks across the European labour market.

7
… the current skills diagnosis reveals serious underperformance in the basic and
transversal skills that are crucial on the European labour market, …
6. 20% of 16 to 65 year-olds is unable to exceed a basic level of literacy and
24% is unable to do so in numeracy. The results from the Survey of Adult Skills
underline the need for lifelong learning. However, skills levels and participation in adult
learning are strongly connected in many countries, confirming that lifelong learning is still
not profited from by those who would benefit from it most. Adult participation in lifelong
learning stands at only 9.0% and is most prevalent amongst the young and highly
educated.
7. Only half of the EU population aged 15 years and above agree that their
school education helped them to develop entrepreneurial competences. Virtually all countries that show an above-average performance in entrepreneurial attitude
also have above-average percentage participation, at school or university, in courses or
activities concerning entrepreneurship. Efforts to develop entrepreneurial skills are needed
to support new business creation, employee innovation within existing companies and to
improve employability levels of the young. Entrepreneurship education is a tool to drive up
the economic benefits of education.
… and important cross-sectorial issues still impede progress of Europe’s
education and training systems.
8. Inequalities persist in European education and training systems. Evidence
suggests that many education and training systems in Europe are marked by inequalities,
reflected by strong disadvantages in the skills and qualifications of social groups such as
young people with a migrant background. There is also wide variation between different
Member States in their success at addressing the problem. These inequalities have severe
consequences for individuals, for economic progress and for social cohesion.
9. Rethinking how we attract, educate and support teachers, school leaders
and teacher educators is a pressing issue, with the teaching profession across
Europe strongly affected by demographic trends. In many Member States, the majority of
teachers currently in employment are in the highest age brackets. In IT, DE, EE and NL, for
example, more than 45% of the teaching workforce is in the 50+ category and in IT, BG,
DE and ES there are very few teachers under the age of 30.
10. Europe is lagging behind in the development of Open Educational
Resources (OER) and Massive Open Online Courses (MOOCs). Although digital
technologies are fully embedded in the way people interact, work and trade, they are not
being fully exploited in European education and training systems. While 70% of teachers in
the EU recognise the importance of training in ICT-supported pedagogies, only 20% of
students are taught by digitally confident and supportive teachers.

8
Targets in education and training
Current Target
Headline t
arg
et
1 Early leavers from education and training
The share of the population aged 18-24 fulfilling the following two conditions: (1) the highest level of education or training attained equals International Standard Classification of Education (ISCED) level 0, 1, 2 or 3c short; (2) respondents
declared not having received any education or training in the four weeks preceding the survey. Data comes from the EU Labour Force Survey.
12.7% (2012) Below 10% (2020)
2 Tertiary education
attainment
The share of the population aged 30-34 years who have successfully completed university or university-like (tertiary-
level) education that equals International Standard Classification of Education (ISCED) level 5 or 6. Data comes from the EU Labour Force Survey.
35.7% (2012) At least 40% (2020)
Oth
er
targ
ets
1 Early childhood education and care
The share of the population aged 4 to the age when the compulsory education starts who are participating in early education. Data comes from the UOE data collection.
93.2% (2011) 95% (2020)
2 Achievement in reading, maths and science
The share of 15-year-olds failing to reach Level 2 in reading, mathematics and science as measured by the OECD’s Programme for International Student Assessment (PISA).
Reading: 19.6% (2009) Maths: 22.2% (2009)
Science: 17.7% (2009) 15% (2020)
3 Employment rate of
recent graduates
The share of employed people aged 20-34 having successfully completed upper secondary or tertiary education 1 to 3 years
before the reference year of the survey and who are no longer in education or training. Data comes from the EU Labour Force Survey.
75.7% (2012) 82% (2020)
4 Adult participation in
lifelong learning
The share of the population aged 25-64 who stated that they
received formal or non-formal education or training in the four weeks preceding the survey. Data comes from the EU Labour Force Survey.
9.0% (2012) 15% (2020)
9
1. Introduction
The challenge of doing more with less The on-going crisis challenges European education and training systems from two different angles.
Firstly, Member States have to consolidate public finance while investing in growth-enhancing policies1. Secondly, the EU is faced with a youth unemployment rate of 23.2%, representing a huge untapped resource and a social crisis that Europe cannot allow to persist2. Education and training, with its impact on productivity and innovation, is a growth-enhancing mechanism by design and
contributes to the employability of young and old. Yet more than half of the Member States have decreased their investments in education and training.
These two key challenges require Europe to strengthen the outcomes of its various education and training systems and to adapt them more flexibly to the changing needs of the labour market. In other words, European education and training systems will have to become more relevant and
adaptable, while at the same time fighting for sustained investments as the crisis continues. This is the main argument for modernising our education and training systems3 and for Member States to debate efficiency measures in order to enhance returns to education investments. The 2013 Annual Growth Survey recalled the efficiency of education expenditure and pointed towards policy levers
that, amongst others, link the worlds of work and education more closely4. While the primary responsibility for the reform process lies at national level, the EU offers
significant support. Starting in 2014, a new generation of programmes will be in place to offer financial support to Member States. Erasmus+, the new single programme for EU cooperation and mobility in education, training, youth and sports for 2014-2020, demonstrates the EU’s
commitment to education even in times of severe fiscal constraint: the budget for the new programme will increase by approximately 40%, to more than 14 billion for the seven years. Furthermore, the next generation of European Structural and Investment Funds will assist Member States in addressing shortcomings in the field of education and training and to give precedence to
the priority areas that have been pin-pointed in the country-specific recommendations5. These country-specific recommendations, proposed by the Commission and adopted by the
Council, are based on an assessment of each Member State's key challenges and aim at offering tailor-made guidance. Many of these recommendations call on Member States to combat early school leaving, increase tertiary attainment, improve their school or vocational education and
training system by making their outcomes more relevant for the labour market, and secure the necessary funding for investments in education. The recommendations are the key EU-level policy tool for driving reforms at the national level. Reporting on the implementation of the country-specific recommendations by the Member States is carried out in the context of the European
Semester6. The annual Education and Training Monitor, in turn, contributes to the analytical basis.
Strengthening the evidence-base
The strategic framework for European cooperation in education and training (ET 2020) was re-vamped in 2012 to bring it in line with the EU Strategy for growth and jobs, and to support Member States in their reform efforts7. One objective has been to strengthen the evidence-base and analytical capacity of ET 2020, on which the next country-specific recommendations can draw.
This is the aim of the Education and Training Monitor series, the first edition of which was presented in November 20128.
1 Moving Europe beyond the crisis (COM(2013) 350 final). The package was adopted by the Council on 19 June 2013. 2 Working together for Europe’s young people: A call to action on youth unemployment (COM(2013) 447 final). 3 Rethinking Education: Investing in skills for better socio-economic outcomes (COM(2012) 669 final). 4 Annual Growth Survey 2013 (COM(2012) 750 final). Priorities were affirmed in the Council Conclusions on investing in
education and training (OJ 2013/C 64/06). 5 The financial support offered by the European Structural and Investment Funds, in particular the European Social
Fund and the European Regional Development Fund, will help Member States to maintain an appropriate level of growth-friendly investments.
6 See http://ec.europa.eu/europe2020/making-it-happen/country-specific-recommendations/index_en.htm. 7 See the May 2009 Council Conclusions (2009/C 119/02) and the 2012 Joint Report of the Council and the
Commission on the implementation of ET 2020 (2012/C 70/05). 8 See http://ec.europa.eu/education/news/rethinking/sw373_en.pdf.

10
At the request of the Council, the Education and Training Monitor is an annual report presented every autumn by the Commission Services, setting out, in a succinct document, progress on the ET 2020 benchmarks and core indicators, including the Europe 20209 headline target on education and
training (see Table 1.1). The Education and Training Monitor illustrates the evolution of education and training systems across Europe, with a particular focus on the country-specific recommendations adopted in the field of education and training. It contributes to the analytical
basis for the next European Semester and provides input to national debates.
As such, the annual Education and Training Monitor is an instrument to foster and encourage evidence-based policy making, implementing the methodology of the Joint Assessment Framework
(JAF) – the monitoring tool for the Europe 2020 strategy – to help ensure a consistent and transparent assessment of progress across Member States10.
The second edition of the annual Education and Training Monitor consists of comparative analyses on the basis of the twofold Europe 2020 headline target on education and training and the formally adopted ET 2020 benchmarks. These benchmarks and indicators, summarised in Table 1.1, are closely inter-related and contribute directly to the policy debate on youth unemployment. Beyond
these benchmarks and indicators, the 2013 Monitor reflects recent progress in the political agenda, linking to the latest policy documents11.
The Education and Training Monitor 2013 is accompanied by an online visualisation tool12. This tool makes it possible to quickly evaluate the performance and progress of Member States in relation to the Europe 2020 and ET 2020 targets. The online visualisation tool complements the Education and
Training Monitor and enables readers to compare, for example, particular sub-groups, countries, and their performance at a given point in time.
Outline of the Education and Training Monitor 2013
Chapter 2 assesses the trends in public and private expenditure, and covers two cross-sectorial opportunities to increase efficiency in education and training systems. These opportunities are part
of the shift towards open and flexible learning: opening up education and training through digital
technologies and implementing tools for transparency of skills and qualifications. The two subsequent sector-specific chapters cover school education and higher education and above all prioritise the twofold Europe 2020 headline target in education and training. Chapter 3
addresses the headline target on early leavers from education and training, followed by early childhood education and care, the teaching profession and the determinants of basic skills and foreign language skills. Chapter 4 examines the headline target on tertiary education attainment,
followed by a closer look at resource allocation and learning mobility in higher education. The final two chapters have a strong labour market orientation, moving from employability and its
most prominent determinants to continued learning. Chapter 5 covers vocational education and training (VET), the transition from education to work and the contribution of entrepreneurship education. Chapter 6 highlights the European dimension of the OECD Survey of Adult Skills (PIAAC) by analysing the skill levels of the European working-age population. It also shows trends in adult
learning and continuing vocational training, following the benchmark on adult participation in lifelong learning.
9 Europe 2020: A strategy for smart, sustainable and inclusive growth (COM(2010) 2020 final). 10 In this year’s Education and Training Monitor, the cross-national JAF analysis is of a purely descriptive nature, using
scatterplots to compare Member States’ current performance and recent change, and looking at particular subgroups in the population. However, the 28 country reports are added as Volume II primarily to shed more light on the broader context and the determinants underlying Member States’ current performance and recent change as regards particular indicators. Here, the JAF analysis mainly concerns the twofold Europe 2020 headline target, but from next
year onwards this standardised approach will be applied to other ET 2020 benchmarks as well. Moreover, DG EAC is working to extent its quantitative JAF approach to incorporate a more qualitative, system-level assessment, which will further strengthen the analytical capacity and deepen the problem analysis in the next edition of the Education and Training Monitor.
11 In particular, the Commission Communications European higher education in the world (COM(2013) 499 final) and Opening Up Education: Innovative teaching and learning for all through new technologies and open educational resources (COM(2013) 654 final; SWD(2013) 341).
12 The visualisation tool is part of the Online Education and Training Monitor, which can be found here: http://ec.europa.eu/education/monitor.
11
Country reports
The 28 individual country reports represent Volume II of the Monitor and summarise the performance of each Member State as regards the main benchmarks and indicators monitored in this report13. At the same time, various examples of key challenges, particularly good outcomes,
and reform areas, as mentioned in the country reports, have been taken up in the 2013 Monitor.
The country reports pinpoint the main challenges the different Member States face in education and training and outline the most significant measures adopted to respond to these challenges.
Information is provided on trends in financing education and training, with a special focus on investing in skills and qualifications. Furthermore, each country report features a detailed assessment on school education and higher education in line with the twofold Europe 2020
headline target in education and training. The last part of each country report has a strong labour market orientation, as it discusses the transition from education to work, the employment rate of recent graduates, reforms in vocational education and training and trends in adult learning and continuing vocational training.
The specific information used in the country reports provides both quantitative and qualitative evidence, based on a broad range of data sources. The monitoring methodology builds on
indicators of the Joint Assessment Framework (JAF). The 28 country reports contribute both to the monitoring of the implementation of country-specific recommendations resulting from the 2013 European Semester and to the strengthening of the analytical basis for the next European
Semester.
13 The 28 country reports are part of the Online Education and Training Monitor, which can be found here:
http://ec.europa.eu/education/monitor.

12
Table 1.1. Performance summary benchmarks and indicators
EU average
HIGHEST performer
LOWEST performer
2009 2012 2012 2012
Europe 2020 headline targets
Early leavers from education and training Europe 2020 headline target: less than 10%
14.2% 12.7% 4.2% 24.9%
Tertiary education attainment Europe 2020 headline target: at least 40%
32.1% 35.7% 51.1% 21.7%
ET 2020 benchmarks
Early childhood education and care ET 2020 target: 95%
91.7% 93.2%11 100%11 70.6%11
Low achievers in basic skills ET 2020 target: 15%
Reading 19.6% : 8.1%09 41.0%09
Maths 22.2% : 7.8%09 47.1%09
Science 17.7% : 6.0%09 41.4%09
Learning mobility IVET Leonardo da Vinci
outbound 0.6% 0.7%11 7.1%11 0.1%11
Higher education Erasmus inbound : 1.1%11 8.4%11 0.0%11
Inbound degree mobile students
: 7.0%11 40.6%11 0.5%11
Employment rate of recent graduates ET 2020 target: 82%
78.3% 75.7% 91.9% 42.9%
Adult participation in lifelong learning ET 2020 target: 15%
9.2% 9.0% 31.6% 1.4%
Proposed ET 2020 benchmark14
Foreign language skills ISCED 2 students at proficiency
level B1 or higher in first foreign
language1
: 43.5%11 82.7%11 9.3%11
ISCED 2 students learning a second foreign language
58.6% 60.8%10 100%11 0.0%11
Other ET 2020 indicators
Investment in education and training
General government expenditure on education (% of GDP)
5.5% 5.3%11 7.8%11 3.6%11
Expenditure on educational institutions per student in € PPS
ISCED 1-2 5,732 €08 6,021 €10 15,262 €10 1,674 €10
ISCED 3-4 6,964 €08 7,123 €10 13,203 €10 1,680 €10
ISCED 5-6 9,309 €08 9,168 €10 15,068 €10 2,956 €10
Digital competences Pupils in grade 4 (ISCED 1) using
computers at school 60.7%07 : 85.8%07 21.9%07
Individuals aged 16-74 with high computer skills2
25.0% 26.0% 42.0% 8.0%
Entrepreneurial competences
Individuals aged 18-64 who believe to have the required skills and knowledge to start a business
42.3%a 42.0%a 54.0% 30.0%
Vocational education and training Share of vocational students at ISCED 3
49.6% 50.3%11 76.1%11 12.7%11
Skills for future labour markets Projected change in employment 2010-2020
High qualification : 19.1% 38.0% -8.8%
Medium qualification : 4.6% 39.3% -18.7%
Low qualification : -20.2% 26.4% -42.9%
Adult skills Low achievers in basic skills
Literacy : 19.9% 10.6% 27.7%
Numeracy : 23.6% 12.8% 31.7%
Problem solving in technology-rich environments
: 26.9% 19.1% 38.0%
Source: CEDEFOP, EAC, European Survey on Language Competences (ESLC), Eurostat (LFS-ISS-UOE), IEA TIMSS, Global Entrepreneurship Monitor, OECD (PISA). Notes: 07=2007; 08=2008; 09=2009; 10=2010; 11=2011; e=estimate; a=unweighted average; b=break; p=provisional; 1=average of skills tested in reading, listening, writing; 2= having carried out 5-6 specific computer related activities. See the corresponding sections in the Monitor for the number of countries incorporated in each EU average presented in this table.
14 SWD(2012) 372 final.

13
2. Investing in skills and qualifications Sustaining public investment in education is a challenging task within the current economic
context. Public spending on education is essential for growth and employment as a more skilled
and educated workforce will support further productivity gains, innovation and wealth. Low-skilled workers, conversely, run an increasing risk of becoming unemployed in the face of labour markets
that are ever more demanding in terms of skills and qualifications. Member States face different demographic15, economic and social challenges to improve the returns to their investments in education and training. Regardless, combining fiscal consolidation and growth-enhancing investment by definition requires improving the efficiency of public expenditure.
This edition of the Education and Training Monitor looks at the trends in public and private expenditure on education and training (section 2.1) and subsequently provides insights into the
main outcomes of education and training in terms of skills and qualifications. Rather than defining efficiency by simply relating these investments and outcomes16, the Education and Training Monitor sheds light on various efficiency measures that have the potential to transform investments into
stronger outcomes. Two examples are opening up education through new technologies and removing obstacles to have skills and qualifications recognised across borders. Section 2.2 evaluates whether Europe is sufficiently reaping the benefits of new technologies in
order to open up education to new groups of learners and to make teaching and learning more engaging, innovative and effective. Digital technologies can improve efficiency through economies of scale, expanding access to a wider number of people at lower costs. Section 2.3 addresses how
transparency and recognition of skills and qualifications acquired through different learning pathways can be fostered through the implementation and further coordination of European policy instruments such as qualification frameworks, quality assurance frameworks, credit systems and
tools for validation on non-formal and informal learning, paving the way for a future European Area of Skills and Qualifications.
2.1. Investing in education and training in a context of economic crisis Spending on education is an investment in the future. EU Member States need to continue investing in education, research and innovation while pursuing the consolidation of public budgets.
Underinvestment in human capital risks undermining Europe's prospect for smart, inclusive and sustainable growth in the future as underlined by the European Commission in the last three Annual Growth Surveys and the country-specific recommendations issued in the context of the
European Semester17. The empirical evidence shows that Member States are tackling this challenge in different ways. Growth-friendly public expenditure is a key concern under Europe 202018 but the situation of public finance across the EU requires differentiated approaches.
A key question is how Member States have adapted their public education spending to respond to the crisis. Two kinds of indicators are considered for this purpose: (1) education expenditure in absolute values and as a percentage of GDP as a proxy for the commitment of Member States to
invest in human capital and (2) education expenditure per student as a measure of the actual level of spending on educational institutions per study level. The comparison covers three to four years to encompass the 2009 drop in GDP growth and the delays in national processes to adjust public
expenditure on education to recent economic trends.
15 See Table A.1 in the Annex and chapter 2 of the 2012 Education and Training Monitor on demographic change and
education spending (http://ec.europa.eu/education/lifelong-learning-policy/monitor12_en.htm). 16 There is a considerable time lag between a change in investment and its first likely effect on a particular cohort of
students; and multiple measures to be considered for such an effect, whether skills, qualifications, or given
benchmarks and indicators. In 2014, the JRC’s Centre for Research on Lifelong Learning (CRELL) Joint Research Centre will, on behalf of DG EAC, investigate whether more sophisticated econometric models can bring to light the relationship between investment and outcomes in a more reliable and meaningful way.
17 The 2013 country-specific recommendations, approved by the Council, can be found at: http://ec.europa.eu/europe2020/making-it-happen/country-specific-recommendations/index_en.htm. The package
was adopted by the Council on 19 June 2013. Significant amounts were earmarked in the 2014-2020 European Programme Erasmus+, the European Social Fund (ESF) and the European Regional Development Fund (ERDF) to support investments in education and training and measures to improve efficiency of education spending.
18 Key areas for comparing Member States' performance are fiscal policy, long-term sustainability and taxation.

14
Sixteen Member States
decreased their education
expenditure at some stage between 2008 and 2011
Firstly, looking at public education expenditure in real terms or as a percentage of GDP19 shows that investment in education tended to shrink overall in many European
countries. Evidence shows that budgets decreased further from 2011. BG, IT and RO already had decreasing values over the period 2008-2011; this was also the case for EL and
SK from 2009 or 2010 (albeit not yet down to 2008 values).
RO reinvested in education in 2011 although keeping to low levels.
While eleven countries have managed to keep their spending on education at a higher or comparable level in absolute terms from 2008 to 2011 (BE, CZ, DE, FR, LU, MT, NL, AT, SI, FI and SE – see table 2.1), cuts in education expenditure were significant during this period in EE, IE, LV
and HU as well as in BG, EL, IT and RO where spending levels in relation to the GDP were already low and have been cut further. DK, ES, CY, LT, PL, PT, SK and UK made cuts at some stage between 2008 and 2011 which is reflected in a reduction of education spending as a percentage of GDP in 2011. ES, PT, SK and UK had significant cuts in 2011.
The fall in education spending in recent years in these sixteen Member States represents a worrying trend and calls for strengthening the efficiency of education investment and supporting
innovation and competitiveness20. This is of particular relevance in the context of limited GDP growth forecasts for 2014.
Figure 2.1. Public expenditure on education as a percentage of GDP (2010- 2011)21
Source: Eurostat (Government finance statistics; online data code: gov_a_exp). Notes: No comparable data for HR. Countries are ranked in ascending order according to public expenditure on education in % of GDP in 2010.
More recent figures available at national level22 show that the budget continued to decrease by more than 5% between 2011 and 2012 in six of the sixteen Member States mentioned above for all education levels (EL, IT, CY, LV, PT, UK-WLS) as well as in HR and for tertiary education in two
other Member States (CZ, IE). Education spending increased by 5% or more only in BE (German speaking Community), LU and MT. These trends, as well as changes in 2013 national budgets, explain why, in the context of the 2013 European Semester, it was recommended pursuing or implementing growth-friendly policies in BG, EE, HU, LT, IT, RO, FI, SE and UK; improving the
efficiency of public spending in DE, FR, and SK; and protecting growth-enhancing expenditure in future budgets in MT, NL, PL and SI.
19 Eleven Member States had a level of public education spending below the EU average of 5.3% of GDP in 2011 (BG,
CZ, DE, IE, EL, ES, IT, LU, HU, RO and SK). On the other hand, in some Member States public expenditure on education exceeded the average by a considerable margin. It was between 6% and 7% of GDP in BE, EE, FR, PT, SI, SE, FI and UK. In CY, expenditure even amounted to 7.2% and in DK to 7.8% of GDP.
20 COM(2013) 350 final. 21 Based on breakdowns of expenditure data according to the Classification of the Functions of Government (COFOG).
According to the COFOG, education expenditure covers pre-primary, primary, secondary and tertiary education, education not definable by level, subsidiary services to education and R&D in education.
22 Eurydice (2013), Funding of Education in Europe, 2000-2012 (changes in budgets in constant prices).
-1,0
0,0
1,0
2,0
3,0
4,0
5,0
6,0
7,0
8,0
-1,0
0,0
1,0
2,0
3,0
4,0
5,0
6,0
7,0
8,0
RO BG EL DE SK IT CZ ES LU IE EU HU PL AT MT NL LV LT FR BE FI SI EE UK SE PT CY DK
Decrease between 2010 and 2011 in percentage points Increase between 2010 and 2011 in percentage points
% o
f G
DP

15
BG, ES, HR,
IT, LV and RO cut down on
all levels from
primary to
tertiary education
Secondly, when looking at public education expenditure per student and by education level23, data availability allows only for a 2008-2010 analysis. Nevertheless, the concerns expressed above were already visible before the
real impact of the crisis on education and training budgets. On average, Member States spent about 6,900 € per student in 2010 (about 9,600 € per student in tertiary education compared to about 5,100 € for primary and
6,100 € for secondary education). Education spending per student was down
in seven Member States between 2008 and 2010 when considering averages for all educational levels (Figure 2.2). This was the case in countries with existing low levels like BG, HR, IT, LV and RO as well as in ES for primary,
secondary and tertiary education.
Overall education spending per student was also down in EE although the decrease concerned
primary education. In nine other Member States, spending per student decreased for certain educational levels only. This was the case in BE, CZ, CY, NL, AT and SE for tertiary education (see Table 2.1), in CY, LT, LU and AT for upper secondary education, and in SI for primary and lower secondary education.
Table 2.1. Government expenditure on education (2008-2011) and annual expenditure per student
in € PPS (2010-2008)
Government expenditure on
education in absolute terms
Expenditure on educational institutions
Primary and lower secondary
Upper secondary and post-secondary non tertiary education
Tertiary
change 2008-
2010 %
change 2010-
2011 %
in € PPS / student 2010
change 2008-
2010 %
in € PPS / student 2010
change 2008-
2010 %
in € PPS / student 2010
change 2008-
2010 %
European Union 4.5 0.4 6,131 6.9 7,128 3.0 9,638 3.5
Belgium 6.4 5.1 6,818 2.2 8,476 3.1 11,691 -0.5
Bulgaria -6.3 2.1 2,190 -6.2 2,148 -4.8 3,763 -22.1
Czech Republic 4.8 5.6 4,136 9.9 4,464 6.2 5,881 -5.8
Denmark 16.2 -1.0 8,598 8.2 9,177 5.0 14,617 5.8
Germany 8.9 3.1 6,240 15.6 8,373 4.3 12,357 2.6
Estonia -10.3 5.7 4,108 -7.3 5,355 9.9 5,038 11.9
Ireland -9.7 -3.6 : : : : : :
Greece -7.3 -4.4 : : : : : :
Spain 3.0 -2.3 6,207 -0.3 7,938 -8.5 10,301 -1.3
France 8.7 2.1 6,039 4.0 9,825 4.1 11,606 4.8
Croatia : : 3,285 -3.8 3,485 -3.8 5,233 -28.4
Italy -0.2 -3.2 6,467 -8.4 6,660 -6.5 7,379 -1.1
Cyprus 11.2 -0.5 9,260 9.1 10,849 -0.4 9,933 -4.0
Latvia -27.1 5.5 3,533 -15.1 3,365 -19.2 4,315 -12.0
Lithuania -10.0 6.3 3,295 4.1 3,291 -7.0 5,066 6.9
Luxembourg 19.0 5.1 15,262 19.6 13,203 -15.5 : :
Hungary -2.1 -4.7 : : : : : :
Malta 16.5 5.1 7,713 23.3 5,444 1.3 11,719 21.0
Netherlands 5.9 1.2 7,279 7.1 9,048 2.2 13,219 -4.9
Austria 7.5 2.4 8,774 7.6 9,136 -1.9 11,895 -3.1
Poland -3.9 2.6 4,279 20.2 3,735 15.9 5,951 28.5
Portugal 13.9 -11.3 4,684 10.9 6,258 8.6 7,742 6.9
Romania -33.5 30.5 1,674 -24.6 1,680 -20.2 2,956 -19.5
Slovenia 3.6 2.4 6,971 -2.3 5,670 3.1 7,296 14.0
Slovakia 31.4 -5.2 4,168 35.8 3,466 5.6 5,318 3.7
Finland 7.2 3.0 6,997 5.2 6,094 4.3 12,874 6.7
Sweden 5.8 9.1 7,634 4.4 7,945 1.7 15,068 -4.0
United Kingdom 2.1 -3.6 7,585 8.6 7,642 6.1 12,781 7.1
Source: Eurostat (Government finance statistics; online data code: gov_a_exp and UOE; online data code: educ_fitotin). Notes: See Eurostat on line metadata for a precise definition of education expenditure in each source. No comparable data for HR on Government expenditure on education. PT 2009 data are used for expenditure on educational institutions in primary and
secondary education. For IT, data on expenditure on educational institutions cover public institutions only (except in tertiary education) and data excludes post-secondary non-tertiary education. EU aggregate are calculated without IE, EL, LU and HU.
23 Expenditure on educational institutions per student provides complementary information on trends across education
levels and Member States considering demographic factors and enrolment in educational programmes. The indicator adopted here is the annual expenditure on public and private educational institutions per pupil/student in Purchasing Power Standards, based on full-time equivalents. In 2009, 77% of this expenditure was devoted to personnel expenditure at EU level (see also Section 3.3).
16
Tuition fees and enterprise sponsorship
accounted for 14% of
total spending on educational institutions
There is a need for
national debates on
the funding of education and training
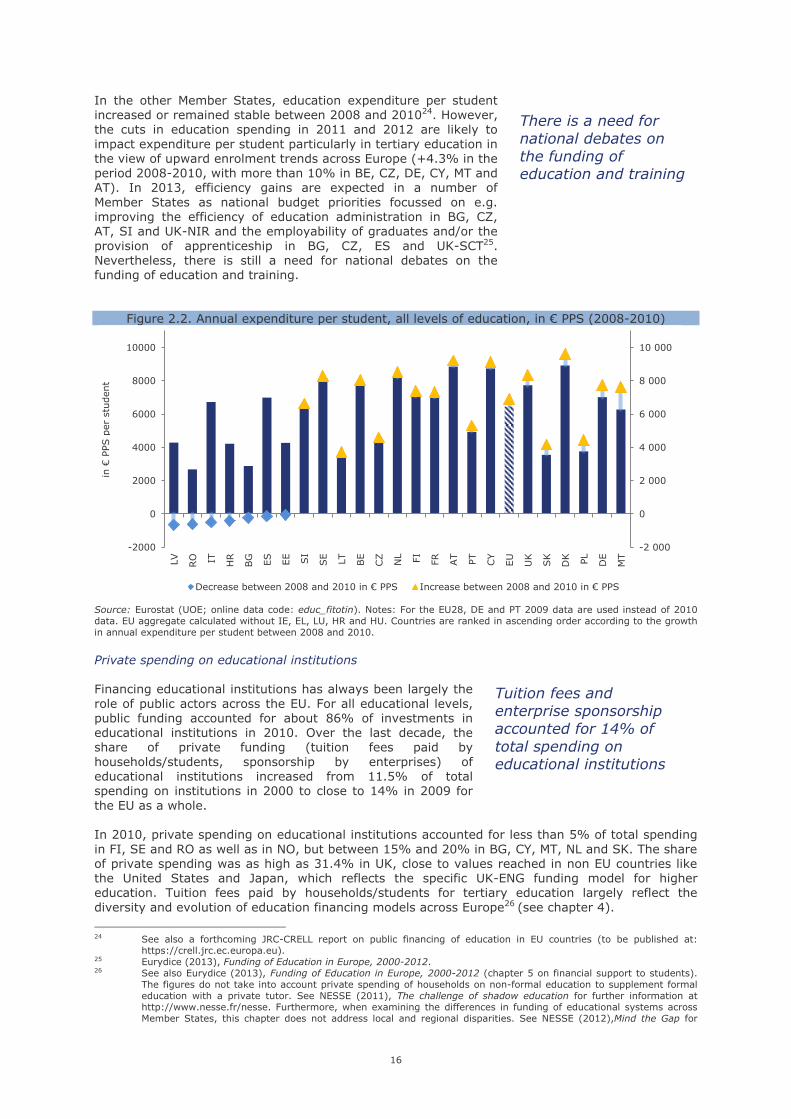
In the other Member States, education expenditure per student increased or remained stable between 2008 and 201024. However, the cuts in education spending in 2011 and 2012 are likely to
impact expenditure per student particularly in tertiary education in the view of upward enrolment trends across Europe (+4.3% in the period 2008-2010, with more than 10% in BE, CZ, DE, CY, MT and
AT). In 2013, efficiency gains are expected in a number of
Member States as national budget priorities focussed on e.g. improving the efficiency of education administration in BG, CZ, AT, SI and UK-NIR and the employability of graduates and/or the
provision of apprenticeship in BG, CZ, ES and UK-SCT25. Nevertheless, there is still a need for national debates on the funding of education and training.
Figure 2.2. Annual expenditure per student, all levels of education, in € PPS (2008-2010)
Source: Eurostat (UOE; online data code: educ_fitotin). Notes: For the EU28, DE and PT 2009 data are used instead of 2010 data. EU aggregate calculated without IE, EL, LU, HR and HU. Countries are ranked in ascending order according to the growth in annual expenditure per student between 2008 and 2010.
Private spending on educational institutions Financing educational institutions has always been largely the
role of public actors across the EU. For all educational levels, public funding accounted for about 86% of investments in educational institutions in 2010. Over the last decade, the share of private funding (tuition fees paid by
households/students, sponsorship by enterprises) of educational institutions increased from 11.5% of total spending on institutions in 2000 to close to 14% in 2009 for
the EU as a whole. In 2010, private spending on educational institutions accounted for less than 5% of total spending
in FI, SE and RO as well as in NO, but between 15% and 20% in BG, CY, MT, NL and SK. The share of private spending was as high as 31.4% in UK, close to values reached in non EU countries like the United States and Japan, which reflects the specific UK-ENG funding model for higher education. Tuition fees paid by households/students for tertiary education largely reflect the
diversity and evolution of education financing models across Europe26 (see chapter 4).
24 See also a forthcoming JRC-CRELL report on public financing of education in EU countries (to be published at:
https://crell.jrc.ec.europa.eu). 25 Eurydice (2013), Funding of Education in Europe, 2000-2012. 26 See also Eurydice (2013), Funding of Education in Europe, 2000-2012 (chapter 5 on financial support to students).
The figures do not take into account private spending of households on non-formal education to supplement formal education with a private tutor. See NESSE (2011), The challenge of shadow education for further information at http://www.nesse.fr/nesse. Furthermore, when examining the differences in funding of educational systems across Member States, this chapter does not address local and regional disparities. See NESSE (2012),Mind the Gap for
-2 000
0
2 000
4 000
6 000
8 000
10 000
-2000
0
2000
4000
6000
8000
10000
LV
RO IT HR
BG
ES
EE SI
SE
LT
BE
CZ
NL FI
FR
AT
PT
CY
EU
UK
SK
DK PL
DE
MT
Decrease between 2008 and 2010 in € PPS Increase between 2008 and 2010 in € PPS
in €
PPS p
er
stu
dent

17
A more advanced use of computers
during lessons is still not commonplace in many countries
Figure 2.3. Share of private expenditure on educational institutions (2010)
Source: Eurostat (UOE). Notes: Private expenditure corresponds to transfers from private sources to educational institutions. This includes private fees for educational services as well as public funding via subsidies to households.
In relation to further use of a mix of private and public sources, the European Commission
underlined the need for strengthening the knowledge triangle between education, research and business in the European Union in its Communication on European Higher Education in the World27. This was already the aim of recommendations made to BG, EE and SK within the context of the 2013 European Semester in order to foster effective knowledge transfer.
Private spending on educational institutions stands to face significant changes in coming years with the development of new relationships between educational institutions, households and
enterprises. Significant efficiency gains can be expected with the increasing role of ICT in education and training and Open Educational Resources (see section 2.2) and with a better transferability between educational institutions, companies and sectors of skills acquired across different learning
platforms and pathways (see section 2.3).
2.2. Opening up education and training through new technologies Today new technologies offer unprecedented opportunities to make learning more effective, inclusive and engaging. Digital technologies can improve effectiveness of resources through economies of scale, expanding access to a wider number of people (e.g. through MOOCs28 and
other Open Educational Resources (OER)) at lower costs or allowing teachers to focus on what they do best by automating or offloading more routine tasks. ICT can be used to foster more creative and innovative methods of learning (including personalised and collaborative learning)29, and it has
the potential to facilitate collaboration, exchange and access to learning resources.
A huge potential for the modernisation of education and training As highlighted in the Communication on Opening Up Education30, Europe is not fully exploiting the potential offered by new technologies and the upsurge across the globe of digital content in order
to better fulfil learners' needs, cater for more individualised learning paths and offer high quality education.
Even if data from TIMSS 201131 show that the use of computers at school (in grade 4) has increased, the differences across countries remain significant. In UK-ENG nearly all grade 4 students use ICT at
school, whereas in AT, LT, SI and RO less than half of the students do so. To fully benefit from the
further information at http://www.nesse.fr/nesse.
27 European higher education in the world (COM(2013) 499 final). 28 Massive Online Open Courses. 29 See e.g. JRC-IPTS (2012) Innovating Learning: Key Elements for Developing Creative Classrooms in Europe
(http://ftp.jrc.es/EURdoc/JRC72278.pdf). 30 Opening Up Education: Innovative teaching and learning for all through new technologies and open educational
resources (COM(2013) 654 final). 31 Trends in International Mathematics and Science Study by the IEA (http://timss.bc.edu/). See also Section 3.4.
0%
5%
10%
15%
20%
25%
30%
35%
UK CY MT NL SK BG ES DE PL CZ LT SI LV FR IT AT IE PT EE HR DK BE RO SE FI IS CH NO
EU28

18
Only 1 in 5 are
taught by digitally
confident and
supportive teachers
potential of new technology, the question of how ICT is used in learning is even more pertinent than asking if ICT is used. With respect to science teaching, data from TIMSS 2011 show certain limitations to the level of integration of new technologies in lessons. More advanced use of
computers to conduct experiments or simulations of natural phenomena is far less commonplace than other types of use during lessons32.
Results from the 2011-12 Survey of Schools: ICT in Education33 show that students’ frequency of
ICT-based activities for learning in the classroom increase when schools have specific formal policies to use ICT in their teaching and learning and, even more importantly, implement concrete support measures at school level (such as facilitating teachers' participation in training, availability
of an ICT coordinator, etc.). However, in the EU only around 30% of students at grade 4 and around 25% at the other grades (grade 8 and 11) are in such digitally supportive schools and as much as 35% of students are in schools characterised by both weak policy and weak support.
As mentioned in relation to the results from TIMSS 2011, the key issue is to really integrate ICT as a teaching and learning tool in mainstream practices, which does not simply mean more electronic devices or more broadband connections. The combination of innovative pedagogies with an
effective use of digital tools and content can boost education and training in terms of quality, equity and efficiency.
Table 2.2. Use of computers in school and during science lessons (%)
% of grade 4 students who use computers at school
% of grade 4 students using computers at least monthly during science lessons (TIMSS 2011)
TIMSS 2007 TIMSS 2011
To Look Up
Ideas and
Information
To Do Scientific
Procedures or Experiments
To Study
Natural
Phenomena Through
Simulations
To Practice
Skills and Procedures
Belgium (Flemish) : 68.8 78 (3.3) 21 (3.3) 26 (3.4) 56 (3.8)
Czech Republic 51.1 69.6 45 (4.1) 22 (3.4) 16 (3.0) 37 (4.2)
Denmark 78.8 79.8 71 (3.4) 25 (3.7) 37 (4.5) 45 (3.9)
Germany 37.5 51.0 54 (3.2) 14 (2.4) 15 (2.4) 23 (2.9)
Ireland : 69.8 55 (3.9) 29 (3.5) 35 (3.4) 30 (3.5)
Spain : 60.7 33 (3.5) 21 (3.2) 20 (3.3) 29 (3.5)
Croatia : 26.8 13 (2.2) 7 (1.5) 5 (1.4) 12 (2.3)
Italy 63.2 60.0 28 (3.1) 21 (2.8) 18 (2.7) 23 (2.9)
Lithuania 21.9 37.9 45 (4.1) 30 (3.3) 21 (2.8) 41 (3.8)
Hungary 42.9 78.1 34 (3.5) 14 (2.5) 15 (2.6) 27 (3.2)
Malta : 80.3 65 (0.1) 50 (0.1) 39 (0.1) 59 (0.1)
Netherlands 83.2 85.6 58 (5.0) 13 (3.4) 16 (3.4) 27 (4.5)
Austria 37.4 42.8 60 (3.5) 20 (2.6) 20 (2.8) 32 (3.3)
Poland : 56.9 16 (2.8) 7 (2.0) 11 (2.5) 13 (2.8)
Portugal : 59.9 46 (5.3) 29 (3.9) 30 (4.2) 39 (4.3)
Romania : 37.8 23 (3.5) 21 (3.2) 21 (3.3) 23 (3.5)
Slovenia 33.3 45.3 37 (3.6) 12 (2.1) 20 (2.7) 21 (3.0)
Slovakia 46.7 70.0 42 (3.2) 17 (2.3) 24 (2.7) 43 (3.2)
Finland : 80.6 59 (3.7) 17 (2.7) 15 (2.2) 42 (3.5)
Sweden 58.5 66.8 49 (4.6) 11 (3.1) 10 (2.5) 21 (3.5)
UK (England) 85.8 96.6 68 (5.0) 40 (4.8) 51 (5.1) 43 (4.8)
UK (Northern Ireland) : 97.3 73 (3.9) 47 (4.0) 42 (4.3) 53 (4.4)
Source: IEA (TIMMS 2007 and 2011).
The Communication on Opening Up Education stresses the role of teachers as key agents for such change. The results from the 2011-12 Survey of Schools underpin this. While 70% of teachers in the EU recognise the
importance of training in ICT-supported pedagogies, only around 20% of students are taught by digitally confident and supportive teachers having high access to ICT and facing low obstacles to their use at school. However,
the survey also shows that teachers who are highly confident and positive about the use of ICT can overcome low access to equipment and other
obstacles affecting the provision of ICT use in teaching and learning.
32 Similar findings from TIMSS (2007) are analysed in Eurydice report (2011), Key data on Learning and Innovation
through ICT at School in Europe 2011. 33 European Commission (2013), Survey of Schools: ICT in Education. Benchmarking Access, Use and Attitudes to
Technology in Europe’s Schools (Study carried out for the Commission by the European Schoolnet and the University of Liège).

19
Teacher training
on the
pedagogical use
of ICT is rarely compulsory
Current experiences show that sharing and collaborating are proven to be successful in changing attitudes and introducing new innovate ways of teaching and learning34. This is demonstrated by the strong engagement of teachers in the communities of practices of the e-Learning Portal35 or of
the e-Twinning36, with more than 200,000 registered users and 100,000 schools. An Electronic Platform for Adult Learning in Europe is also in development. The 2011-12 Survey of Schools found that around 30% of students at grade 4, 8 and 11 are taught by teachers having participated in
online communities for professional exchange amongst other teachers, there is thus scope for
further strengthening teachers’ participation in these collaborative practices. The 2011-12 Survey of Schools shows that teacher training on the
pedagogical use of ICT is rarely compulsory (only for 25-30% of teachers depending on the grade). Teachers’ participation in courses on the pedagogical use of ICT in teaching and learning also varies
considerably between countries. In LT, around 70% of students or more across all grades are taught by teachers who have undertaken such courses (with similarly high figures for one or more grades in ES, EE, SI and LV). By contrast, only around one third of students across all
grades in BE are taught by teachers who have participated in these types of courses (figures of less than 30% can also be found for one or more grade in AT, LU, FR, EL and IT).
The impact and new possibilities offered by technological advances is also felt in higher education and in adult learning. As underlined in the two Communications on European Higher Education in
the World and Opening Up Education, the appearance of phenomena like MOOCs is pushing for a globalisation of educational markets. In the US, the three main MOOC providers offer around 400 courses, with 3 million users worldwide, and Europe is currently lagging behind. Few European universities are providing MOOCs (e.g. only 9 are involved in Coursera37) and a recent EUA
survey38 shows that many European universities are not even aware of what a MOOC is. To strengthen the evidence-base in the area of technological advances in higher education and adult learning, the Commission is launching various studies this year to strengthen the evidence-base in
the area of technological advances in higher education and adult learning. In order for society and individuals to make full use of the competences acquired through online learning and OER,
recognition of such learning will be considered in the development of the European policy
instruments (see chapter 2.3). Digital competences
If learners of all ages are to benefit fully from the opportunities for more engaging, effective and inclusive learning offered by new technologies, digital competences are a prerequisite. The 2012 Communication on Rethinking Education39 emphasised the importance of building the right skills for
the 21st century, and developing digital competence is part and parcel of this set of skills, knowledge and attitudes.
Recent results on 8th and 11th grade pupils' confidence in their ICT skills are available from the 2011-12 Survey of Schools: ICT in Education40. As can be seen in Figure 2.4, the results show that pupils express higher confidence in their ability to use the internet safely and lower confidence in their social media skills than in the other ICT skills they were asked about.
The analysis of the survey results finds a positive link between confidence in these ICT skills and the use of ICT at home and at school. Students with high access/use of ICT both at home and at
school are more confident in their ICT skills than those who only report high access/use at home and not at school, or low access/use both at home and at school. These students are not only
34 See e.g. chapter 4 of European Commission (2013): Study of the impact of eTwinning on participating pupils,
teachers and schools. 35 See http://www.elearningeuropa.info. 36 See http://www.etwinning.net. 37 http://www.eua.be/news/13-02-
25/Massive_Open_Online_Courses_MOOCs_EUA_to_look_at_development_of_MOOCs_and_trends_in_innovative_learning.aspx.
38 Ibid. 39 COM (2012) 669 final. 40 European Commission (2013), Survey of Schools: ICT in Education. Benchmarking Access, Use and Attitudes to
Technology in Europe’s Schools (Study carried out for the Commission by the European Schoolnet and the University of Liège).

20
Digitally supportive
schools can help
foster digitally
confident and
supportive students
confident in their digital competences, but are also positive about the impact of using ICT in teaching and learning, i.e. they are digitally confident and supportive students.
Figure 2.4. Average pupil confidence in using ICT skills (Grade 8, 2011-12)
Source: European Commission (2013): “Survey of Schools: ICT in Education. Benchmarking Access, Use and Attitudes to Technology in Europe’s Schools”. Note: All EU28 countries are included except DE, HR, NL and UK.
Across EU countries, on average 30–35% of students are digitally confident and supportive students (Figure 2.5). The highest percentage of such students is observed in grade 11 general education (36% compared with 29% at grade 11 vocational and 31% at grade 8). Yet
there are important variations between countries. The highest percentage is found in DK at all grades, whereas AT, BE, FI and IE are amongst the lower five countries for both grade 8 and grade 11 (general
education). The results from the survey also demonstrate that educational systems with a high percentage of digitally supportive schools include a large percentage of digitally confident and supportive
students. This is particularly clear for grade 11 general education, as
shown in Figure 2.5.
Figure 2.5. Mapping of countries according to their percentage of students in digitally supportive schools and percentage of digitally confident and supportive students
Source: European Commission (2013): “Survey of Schools: ICT in Education. Benchmarking Access, Use and Attitudes to
Technology in Europe’s Schools”. Note: The plot covers grade 11 of general education, 2011-12. All EU28 countries are included except DE, HR, NL and UK.
The Commission proposes in the Communication on Opening up Education to develop – in close cooperation with stakeholders and Member States – digital competency frameworks, including a
3,1
6
3,0
5
2,5
5
2,8
8
2,5
8
2,1
3 2,9
3
2,6
4
2,1
7
2,7
8
2,4
2
1,8
3
1,00
1,50
2,00
2,50
3,00
3,50
4,00
Pupils with high access/use at school& home
Pupils with low access/use at school& high access/use at home
Pupils with low access/use at school& home
Scale
1-4
(f
rom
"not
at
all"
to "
a lot"
)
Safe internet use Responsible internet use Operational skills Social media skills
AT
BE
BG
HR CY
CZ
DK
EE
FI FR
EL
HU
IE
IT
LV
LT
MT
NO
PL
PT RO
SK
SI
ES
SE
TR
EU
0
10
20
30
40
50
60
70
80
90
100
0 10 20 30 40 50 60 70 80 90 100
% d
igitally s
upport
ive s
chools
(g
rade 1
1 g
enera
l education)
% digitally confident and supportive students (grade 11 general education)

21
self-assessment citizens’ tool41. Such instruments would further support policy development to foster competences and to facilitate documentation of digital competences, e.g. for validation and recognition purposes. The importance of transparency and recognition of what individuals know
and can do is discussed more widely in the subsequent section. One in four adults in the 17 EU Member States that participated in the Survey of Adult Skills
(PIAAC) showed very low to no skills in problem solving in technology-rich environments. This
consists of 14% that could only perform very simple tasks (below proficiency level 1) and another 13% that lacked any computer experience or had such low levels of proficiency that they could not take the computer based test.
The Survey of Adult Skills also showed that the use of ICT both at work and at home is one of the strongest determinants of reading literacy skills, just after education attainment. The more
individuals tend to engage in the use of information communication technology, the higher their literacy skills and vice versa. Good literacy skills ease the use of ICT for retrieving and using information, while frequent ICT use may contribute to improving or at least maintaining literacy abilities. Further results from the Survey of Adult Skills are discussed in section 6.1.
2.3. Tools for transparency of skills and qualifications
In the last decade, several European policies and instruments have been developed and are being implemented in the context of the ET 2020 strategic framework and the Bologna process that aim to support the mobility of learners and workers through better transparency and easier recognition
of what they know and can do. Providing individuals with the opportunity to develop their skills in a flexible way and have those skills clearly understood and recognised across borders (both sectorial and geographical) will reduce skills mismatches and increase the efficiency in education and
training systems. European qualifications frameworks (EQF42 and QF EHEA43) based on a learning outcome approach provide a reference point for the comparison of individual qualifications and qualification systems
across countries. European credit systems (ECTS44 and ECVET45) support learners in shaping their own learning pathway through accumulation of credits – whether within a certain institution, from institution to institution, from country to country, or between different contexts of learning (i.e.
formal, non-formal and informal learning). Common European quality assurance arrangements (ESG46, EQAR47 and EQAVET48) contribute to improving mutual trust in education and qualifications systems, thus facilitating recognition across borders. The Europass framework, including the
Europass CV and the European Skills Passport49, provides important documentation tools for citizens to describe their acquired knowledge, skills, competences and qualifications in a more transparent and structured way.
Important progress in the implementation and use of the above mentioned policies and tools can be identified. However, the analysis below also depicts certain remaining challenges and lends support to closer coherence and coordination between the different tools and services, as called for
in the “Rethinking Education” Communication, which announced the creation of a European Area for Skills and Qualifications. The European Area for Skills and Qualifications is to support the drive to achieve transparency and recognition of skills and qualifications within and across national
borders, in all sub-systems of education and training as well as on the labour market.
41 See also the report JRC-IPTS (2013) DIGCOMP: A Framework for Developing and Understanding Digital Competence
in Europe (http://ftp.jrc.es/EURdoc/JRC83167.pdf). 42 European Qualifications Framework for lifelong learning, launched by the Recommendation of the European
Parliament and the Council of 23 April 2008. 43 Qualifications Framework for the European Higher Education Area agreed by ministers responsible for higher
education within the Bologna Process in 2005. 44 European Credit Transfer and Accumulation System - the credit system for higher education used in the European
Higher Education Area, involving all countries engaged in the Bologna Process. 45 European Credit System for Vocational Education and Training adopted by the Recommendation of the European
Parliament and the Council of 19 June 2009. 46 European Standards and Guidelines for Quality Assurance in Higher Education developed by ENQA (European Quality
Assurance Network in higher education) and endorsed by ministers of higher education in the Bologna Process in 2009.
47 European Quality Assurance Register for Higher Education – which was established in March 2008. 48 European Quality Assurance for Vocational Education and Training adopted by the Recommendation of the European
Parliament and Council of 18 June 2009. 49 Decision no 2241/2004/EC of the European Parliament and of the Council of 15 December 2004 on a single
community framework for the transparency of qualifications and competences (Europass).

22
ECTS is not yet fully in
line with the
learning
outcomes approach
Among 36 countries50 that participate in the EQF, 20 countries have already adapted their national qualification levels to the EQF and 7 countries are planning to follow them by the end of 2013. By the end of 2014, it is foreseen that 32 countries will have referenced to the EQF, including all
Member States. Half of the 20 countries that have already referenced the EQF have also self-certified to the QF EHEA in a single process relating their qualifications levels to both the EQF and the QF EHEA51.
There are important subsequent steps required to make the qualifications frameworks function in practice. So far, 7 countries have started to indicate EQF levels in their new certificates, diplomas and Europass documents issued, and in national qualifications databases.
Table 2.3. Status of the implementation of the European Qualifications Framework
National Qualification Frameworks referenced to the EQF? Countries
Completed 20 countries: AT, BE-fl, BG, CZ, DE, DK, EE, FR, HR, IE, IT, LT, LU, LV, MT, NL, PL, PT, SI, UK
To be completed by end 2013 7 countries: BE-fr, CY, EL, ES, FI, RO + IS, NO
To be completed in 2014 5 countries: HU, SE, SK + MK, TK
Implementation of EQF in documents and national qualifications databases
Countries
EQF level in new certificates, diplomas 3 countries: CZ, DK, LT
EQF level in Europass supplements (Certificate Supplements and Diploma Supplements)
5 countries: CZ (cs), DK (ds), EE (ds), FR (cs), IE (ds)
EQF level in national qualifications databases 4 countries: CZ, DK, FR, UK
Complementing the EQF recommendation, the Council Recommendation on the validation of non-
formal and informal learning52 invites Member States to develop new arrangements by 2018 and to allow citizens to obtain qualifications on the basis of validated learning outcomes. The Member States with the most advanced arrangements include FR, PT, NL, FI and LU. Several other
countries are also making significant progress, but some are still at a starting point and there is often still a lack of transparency around the rules and procedures of recognition of skills and
qualifications. The state-of-play of validation practices in Europe will continue to be mapped
through regular reviews and updates of the European Inventory on the validation of non-formal and informal learning53, in cooperation with the Member States. The extensive use of the tools in the Europass framework is instrumental in providing citizens with
relevant and recognised documentation tools. The Europass portal has been visited by almost 60 million people since its launch in February 2005 and the Europass CV is the most iconic document: it has been used by more than 24 million people since its launch in 2005. However, it remains a
challenge that Europass is not sufficiently well-known by employers. Part of the Europass framework, the European Skills Passport was implemented in 2012. As of early July 2013, more than 800 000 passports have been created by citizens.
The implementation of the European credit transfer systems in higher education (ECTS) and VET (ECVET) are at different stages. The 2012 Bologna Process Implementation Report concludes that “a look at the implementation of ECTS as
a transfer and accumulation system shows that it is almost completed. Yet, linking credits with learning outcomes is not completed […]”. The report found that there were nine systems – amongst them AT, BE fr, BE nl, CZ, DE and PT –
where all parts of programmes are linked with learning outcomes in less than 50 % of programmes, and three countries – amongst them HU and SK – where no links were made to learning outcomes54.
As regards ECVET, the preparatory phase of implementation has started in all European countries (ECVET coordination points are being set up, and detailed roadmaps for ECVET implementation are emerging)55. The ECVET Recommendation invites the Commission to evaluate the implementation
50 28 Member States, 5 candidate countries, CH, LI and NO. 51 See also pp. 45-46 of the 2012 Bologna Process Implementation Report at: http://www.ehea.info/Uploads/(1)/Bologna%20Process%20Implementation%20Report.pdf. 52 OJ 2012/C 398/01. 53 http://www.cedefop.europa.eu/en/about-cedefop/projects/validation-of-non-formal-and-informal-learning/european-
inventory.aspx. 54 See also Figure 2.16 and 2.17 on p. 48 of the same report. 55 Cedefop (2012), The development of ECVET in Europe (see: http://www.cedefop.europa.eu/EN/Files/6114_en.pdf).

23
of ECVET five years after its launch. The Commission will launch the evaluation on ECVET in mid-2013 and report in 2014. The parallel implementation of the two credit systems does however leave room for improved consolidation and coherence in order to strengthen permeability across
sub-systems. The importance of a holistic vision also applies to the European quality assurance instruments
(ESG, EQAR and EQAVET). External evaluations of EQAVET and quality assurance arrangements in
higher education are on-going. For these instruments to fulfil their purpose of contributing to mutual trust in education and qualification systems, the principles they enshrine should be applied evenly and understood in the same way across education systems, while also respecting the
autonomy of national governments in this area. The exchange of information and debate between the world of education and training and the world
of the labour market is still occasional and under–developed in many countries. To facilitate such exchange it is important to have a common language (on knowledge, skills and competences) and easily accessible and up-to-date information on skills supply and skills needs for the near and medium-term future. The various instruments above, and in particular the qualifications
frameworks and the learning outcomes approach, have indeed promoted communication on skills need and skills supply in the labour market. However, further action is taken to address this challenge, most notably the European Skills Panorama56 and the European Skills, Competences,
Qualifications and Occupations taxonomy (ESCO)57. The European Skills Panorama was launched in December 2012 and gathers comprehensive
intelligence on skills supply and skills needs in various sectors and occupations of the labour market. It is used by a wide range of actors including bodies responsible for education and employment policies, job and career guidance centres and education and training institutions. Since the launch the European Skills Panorama website has had on average around 600 daily
visitors. ESCO aims to describe the most relevant skills, competences and qualifications needed for several
thousand occupations and provide a common language bridging education and the labour market. ESCO has the potential to bring benefits to both jobseekers, employers and education and training
institutions, for example by allowing a more precise description of skills sets held by individuals or
required by employers or a better adaptation of training initiatives and career guidance services to the needs of the labour market. A first version of ESCO will become available in October 2013. A full ESCO covering all economic sectors is planned to be completed in 25 languages in 2017.
56 See http://euskillspanorama.ec.europa.eu/. 57 See http://ec.europa.eu/social/main.jsp?langId=en&catId=89&newsId=852.
Policy lessons With public debt in the EU expected to reach 90.6% of GDP in 2014 and economic growth to
remain moderate (1.4%), all Member States are confronted with the double challenge of consolidation public finance while investing in growth-enhancing policies. Education and training, on average, is granted 5.3% of GDP (2011). As the crisis persists, many Member
States consider reducing education expenditure as an option to reduce budget deficits, running the risk of compromising sustained growth in the years to come.
Sixteen Member States decreased their education expenditure at some stage between 2008 and 2011, with six of them showing further significant budget decreases in 2012 (EL, IT, CY, LV, PT, UK-WLS). Cutbacks in spending per student across Europe started to be most prevalent in tertiary education (12 Member States) between 2008 and 2010. Whereas the majority of
Member States decreased spending per student for at least one level of education, BG, ES, HR, IT, LV and RO cut down on all levels from primary to tertiary in this period.
Europe is lagging behind in the development of Open Educational Resources (OER) and Massive Open Online Courses (MOOCs). Although digital technologies are fully embedded in the way people interact, work and trade, they are not being fully exploited in European education and
training systems. While 70% of teachers in the EU recognise the importance of training in ICT-supported pedagogies, only 20% of students are taught by digitally confident and supportive teachers.

24
Policy lessons (continued)
Despite the existence of a large number of tools for the transparency and recognition of skills
and qualifications there still exist obstacles for individuals to move between countries, across
different education sub-systems and from education to work. In a fully developed European Area for Skills and Qualifications anybody should be able to move freely and have their competences and qualifications quickly recognised for further learning and adequately understood and assessed by employers, supported through European transparency and
recognition tools for skills and qualifications.

25
3. Tackling early school leaving and raising
the bar in school education
This chapter looks at the main challenge in school education; raising the bar for a strong start for
everyone. The cornerstone – and starting point in section 3.1 – is the performance of Member States in relation to the Europe 2020 headline target and national targets on early leavers from education and training. Section 3.2 examines the provision of early childhood education and care,
which has been identified as one of the most effective measures to give children a good start in education. Moving from prevention to intervention, section 3.3 takes a look at the teaching workforce. Lastly, section 3.4 looks at how these various determinants of low attainment also
affect the development of foundation skills at a young age.
3.1. Reducing the rate of early leavers from education and training Completing upper secondary education is recommended as the minimum entrance qualification when making the crucial transition from education to the labour market (chapter 5). There is ample evidence that early leavers from education and training58 are more at risk of unemployment and
social exclusion, resulting in monetary and non-monetary costs to themselves and, in the longer run, to society59. This is why an early school leaving rate of less than 10.0% is one of the Europe 2020 headline targets.
In 2012, nearly 5.5 million young people across the EU between 18 and 24 years old had not finished upper secondary education and
were no longer in formal or non-formal education and training. The EU average rate of early leavers from education and training was 12.7% in 2012; down 0.7 percentage points from 2011. This improvement is mainly due to progress in some larger Member
States and hides negative trends in a number of other countries.
Figure 3.1. Early school leaving (2012)
Source: Eurostat (LFS).
Since 2009, the EU has on average decreased its early school leaving rate by 1.5 percentage points, which is an average annual progress of 3.7%. Knowing that the EU early school leaving rate needs to be below 10.0% by 2020, it is possible to calculate the minimum annual progress that the
EU as a whole will have to make on average between 2009 and 2020. Figure 3.2 plots the recent
change in early school leaving rates (2009-2012) against the current performance (2012) of each country. This enables a more comprehensive comparison between current performance and recent
change, keeping in mind the headline target and the minimum annual progress necessary to reach it by 2020.
58 The terms early school leavers and early leavers from education and training are used interchangeably. 59 Reducing Early School Leaving in the EU, authored in 2011 by GHK at the request of the European Parliament.
0
5
10
15
20
25
30
ES MT PT IT RO UK EU BG BE FR HU EL CY DE EE LV IE DK FI NL LU AT SE LT PL CZ SK SI HR
2012 National target Headline target
5.5 million young
people have left
school without
finishing upper secondary education

26
Figure 3.2. Early school leaving: current performance and recent change
Source: JRC-CRELL and DG EAC calculations based on Eurostat (LFS) data. Member States having already achieved their national targets are marked in green. Countries are shown according to their 18-24 cohort size, with five categories. Further notes: the average annual change rate is artificial for countries with a break in series, i.e. NL (2010) and LV (2011).
In terms of current performance and recent change regarding the rates of early leavers from education and training, four groups of Member States can be distinguished. Firstly, Member States with early school leaving rates above 10% in 2012 in addition to little progress or even stagnation in recent years. Amongst these countries, IT, DE, FR and CY are falling behind the minimum
progress necessary for the EU as a whole to reach the headline target by 2020. Of these four Member States, the early school leaving rate in IT is by far the highest, resulting in a 2013 country-specific recommendation60 to step up efforts to prevent early school leaving.
In this same group, BE, RO and HU are faring even worse; early school leaving rates in these countries have
actually been increasing in recent years. In the 2013 country-specific recommendations, RO and HU have been urged to implement a national strategy on early school leaving. BE, in the meantime, has been taking
steps towards a comprehensive strategy61. Secondly, Member States with early school leaving rates above 10% but nevertheless significant
progress in recent years. This group, found in the upper left quadrant of Figure 3.2, can be divided into two parts.
Despite considerable progress in recent years, ES (24.9%), MT62 (22.6%) and PT (20.8%) still have rates above 20%. ES and MT display the highest early school leaving rates amongst all Member States and have been asked in the 2013 country-specific recommendations to stregthen their efforts to tackle the problem, notably by setting up more comprehensive monitoring systems.
PT has achieved the strongest improvement of all countries since 2009. Early school leaving rates in UK, BG, EL, EE and LV are above 10% but have decreased significantly
in recent years. In these countries, the average annual change rate between 2009 and 2012 has been higher than the minimum progress required for the EU as a whole to meet the headline target.
60 The 2013 country-specific recommendations, approved by the Council, can be found at: http://ec.europa.eu/europe2020/making-it-happen/country-specific-recommendations/index_en.htm. The package
was adopted by the Council on 19 June 2013. 61 See the country report on BE that accompanies this Education and Training Monitor at: http://ec.europa.eu/education/monitor. 62 The Maltese series on early leavers from education and training have been revised. The revision concerns the
classification of certain qualifications at secondary level. No new national target has been set as of yet.
BG
CZ
DK
DE EE
IE
EL
ES
FR
IT
LV
LT
LU
HU
MT
NL
AT PL
PT
RO
SI SK
FI SE
UK
BE
HR
EU CY
0
5
10
15
20
25
-14,0 -12,0 -10,0 -8,0 -6,0 -4,0 -2,0 0,0 2,0 4,0
Average annual change in early school leaving rate (%) over the period 2009-2012
Early s
chool le
avin
g r
ate
2012
Headline target
Min
imum
pro
gre
ss n
eeded
Improving | Getting worse
In Belgium, Romania and
Hungary, early school leaving
rates have been increasing

27
Thirdly, Member States that show early school leaving rates below 10% but stagnation in recent years. In CZ, LU, SE, PL, HR and SK, the rate of early school leaving has even increased. Amongst
these countries, PL is still to reach its national target of 4.5%.
Table 3.1. Early leavers from education and training (%)
2009 2012 2020
Total Total Males Females Native-born
Foreign-born
Target EU Non EU
Sub- total
EU28 14.2 12.7p 14.4p 10.9p 11.5p 22.8p 26.5p 25.4p < 10.0
Belgium 11.1 12.0 14.4 9.5 10.6 17.4 26.0 22.6 9.5
Bulgaria 14.7 12.5 12.1 13.0 12.6 : : : 11.0
Czech Republic 5.4 5.5 6.1 4.9 5.5 (10.0) (8.5) (9.3) 5.5
Denmark 11.3 9.1 10.8 7.4 9.0 : (11.7) 10.1 < 10.0
Germany 11.1 10.5p 11.1p 9.8p 9.1p : : : < 10.0
Estonia 13.9 10.5 14.0 7.1 10.6 : : : 9.5
Ireland 11.6 9.7 11.2 8.2 9.2 15.1 : 12.3 8.0
Greece 14.5 11.4 13.7 9.1 8.3 (24.7) 45.8 42.0 9.7
Spain 31.2 24.9 28.8 20.8 21.4 39.1 41.1 40.7 15.0
France 12.2 11.6 13.4 9.8 10.8 23.5 22.7 22.9 9.5
Croatia 3.9 4.2 (4.6) (3.6) 4.2 : : : 4.0
Italy 19.2 17.6 20.5 14.5 14.8 35.4 40.5 39.1 15.0-16.0
Cyprus 11.7 11.4 16.5 7.0 8.1 21.6 19.5 20.7 10.0
Latvia 13.9 10.5 14.5 6.2 10.6 : : : 13.4
Lithuania 8.7 6.5 8.2 (4.6) 6.4 : : : < 9.0
Luxembourg 7.7b 8.1p 10.7p 5.5p 7.1p (11.1) : 10.6p < 10.0
Hungary 11.2 11.5 12.2 10.7 11.4 : : : 10.0
Malta 27.1n 22.6 27.5 17.6 22.7 : : : -
Netherlands 10.9 8.8p 10.2p 7.3p 8.6p 13.0p 11.9p 12.2p < 8.0
Austria 8.7 7.6 7.9 7.3 6.0 (10.2) 21.5 17.7 9.5
Poland 5.3 5.7p 7.8p 3.5p 5.7p : : : 4.5
Portugal 31.2 20.8 27.1 14.3 20.9 : 19.4 20.3 10.0
Romania 16.6 17.4 18.0 16.7 17.4 : : : 11.3
Slovenia 5.3 4.4 5.4 (3.2) 4.2 : (10.3) (10.1) 5.0
Slovakia 4.9 5.3 6.0 4.6 5.3 : : : 6.0
Finland 9.9 8.9 9.8 8.1 8.7 : : (14.9) 8.0
Sweden 7.0 7.5 8.5 6.3 6.7 (10.3) 13.1 12.8 < 10.0
United Kingdom 15.7 13.5 14.6 12.4 13.7 16.1 9.9 12.2 -
Montenegro : : : : : : : : -
Iceland 21.3 20.1 23.6 16.5 19.3 32.6 : 28.1 -
MK 16.2 11.7 11.1 12.3 : : : : -
Serbia : : : : : : : : -
Turkey 44.3 39.6 36.1 43.0 : : : : -
Norway 17.6 14.8 17.6 11.9 14.6 20.1 15.3 17.1 -
Switzerland 9.1d 5.5 5.7 5.3 3.7 8.9 17.1 14.1 -
Source: Eurostat (LFS). Intermediate breaks in time series for NL (2010) and LV (2011). Notes: "b" = break in time series; "p" = provisional; "()" = Data lack reliability due to small sample size; ":" = data either not available or not reliable due to very small sample size; “d” = definition differs; “n” = national data.
Fourthly, Member States that have early school leaving rates below 10% and have also made significant further progress in recent years. In this group, LT, NL, DK, AT, FI, IE and SI all show a
decreasing trend while already having reached the headline target. Amongst these countries, IE, FI and NL have not yet met their national target, which is set at, or below, 8% for all three. In terms of policy development, the above mentioned groups of countries face different challenges
depending on their education and training systems, economic situation and structure of local labour markets. Although there is an overall tendency to address early school leaving in a more comprehensive manner, few Member States have developed and implemented comprehensive
strategies to tackle the problem63. NL and IE have had comprehensive approaches to reducing early school leaving rates for some years. AT has recently adopted a new strategy to tackle the problem and BG and MT are about to do so. FR has significantly increased its commitment,
63 As suggested in the Council Recommendation on policies to reduce early school leaving (2011/C 191/01), the
Commission Communication "Tackling early school leaving: A key contribution to the Europe 2020 Agenda" (COM(2011)18), and the Commission working document "Reducing early school leaving" (SEC(2011)96).

28
improving the evidence-base for identifying young people at risk and ensuring a broad range of measures in the area of prevention, intervention and compensation.
Other policies adopted across Europe that can help tackle early school leaving include measures addressing the specific needs of children with a migrant background (BE fr, FI, CZ, FR, UK); measures to reduce early
tracking (MT, AT) and grade retention (BE fr, LT); and measures to
improve vocational education and training (VET) systems. The latter includes improving guidance systems (LV, LT); facilitating the transition to the labour market (FI, NL); and strengthening the permeability between
general and vocational education (MT, PL). PT and ES have increased access to VET especially for students struggling in general education.
The gender pattern in the early school leaving rate Taking a closer look at the early leavers from education and training, a striking disparity remains
between male and female early school leaving rates, with boys clearly at higher risk of leaving school before finishing upper secondary education than girls (Table 3.1). The male/female difference has slowly decreased over time (from 3.8 percentage points in 2009 to 3.5 percentage
points in 2012), but is still prominent in all Member States except BG. The disparity is greatest in CY, LV and PL, with male early school leaving risks more than twice as high as those for females. Between 2009 and 2012, the gender divide has increased most in LV, CY and LU and decreased
most in SI, IE and DK. These gender patterns coincide with overall differences between boys and girls in education attainment and needs further reflection.
The disadvantage for foreign-born students It is found that across the EU, early school leaving rates amongst the foreign-born population are
more than twice as high as the early school leaving rates for the native-born population, hinting at worrysome socioeconomic discrepancies between the two groups. The native-born/foreign-born disparity has slightly decreased (from 14.7 percentage points in 2009 to 13.9 percentage points in
2012), but is still astounding in a number of Member States64. The difference is by far worst in EL,
followed by AT, IT and CY. Calculations show that the EU as a whole would be 30% closer to reaching its Europe 2020 target of reducing the early school leaving to below 10% if the gap between foreign-born and native-born were closed, and some countries would even meet their
national targets65. Identifying ways of tackling the problem, a recent study on newly arrived migrant children demonstrated that inclusive education systems are better equipped to integrate migrant children successfully and to support them effectively in school education66.
The increasing age effect in early school leaving rates
When looking at the early school leaving rates by age, the analysis shows that (1) early school leaving rates increase with age and that (2) every birth cohort yields on average lower risks of leaving school early when compared to the previous birth cohort. However, the data also suggests
that the decrease in early school leaving rates between 2009 and 2012 has not been the same across the 18 to 24 year old age group. As Figure 3.3 illustrates, Europe has on average been most successful in tackling early school leaving amongst 18- and 19-year-olds (a decrease of 17.6% and
16.1% respectively). Amongst 23- and 24-year-olds, on the other hand, progress has been much more difficult (a decrease of 6.1% and 8.4% respectively).
These results imply that schools manage to keep students in
education longer, whether because of policies against early school leaving or because of the on-going crisis. But the limited change for 23- and 24-year olds implies that Europe on average has not found a
way to attract individuals back into education and training, be it
64 It has to be noted that across Europe, the foreign-born sub-group is very diverse, affected by historical migration
patterns that are often incomparable between Member States. Some of the foreign-born early school leavers (age group 18 to 24) did not even go to school in the host country. Moreover, the categorisation of foreign-born early school leavers confounds related issues, such as language spoken at home, socioeconomic status and access to learning support.
65 Based on a report prepared for the Directorate-General for Home Affairs, Using EU Indicators of Immigrant Integration (http://ec.europa.eu/ewsi/UDRW/images/items/docl_37216_243039941.pdf).
66 Authored in 2013 by the Public Policy and Management Institute (PPMI) on behalf of the European Commission (http://ec.europa.eu/education/more-information/doc/migrants/report_en.pdf).
Vocational
pathways are
being explored in
order to reduce
early school leaving rates
Schools increasingly
manage to keep students in education longer...

29
formal or non-formal. Otherwise the progress in the older age groups would have been much stronger.
Figure 3.3. Early school leaving trends by age (2009-2012)
Source: Eurostat (LFS). Note: the dashed bars on top of the 2012 early school leaving rates denote the respective rates for 2009, 2010 and 2011 (from top to bottom).
Non-formal learning amongst early school leavers Early school leavers are by definition no longer in formal education or in
non-formal education. Some of the 18 to 24 year-olds with lower secondary education attainment at most, however, are not in formal education anymore but do follow some kind of non-formal training (see
Figure 3.4). These individuals are not counted toward a country’s early
school leaving rate. Non-formal learning, however, can function as a second chance for individuals leaving formal education early67. Figure 3.4 shows that non-formal learning is not prevalent amongst 18 to 24 year
olds. There is untapped potential here that could help low-schooled individuals improve their chances on the labour market.
Figure 3.4. Early school leaving: breakdown by employment status (2012)
Source: Eurostat (LFS). Notes: Countries are ranked in ascending order of early school leaving rates. **Not counted towards the early school leaving rate.
67 See the report Learning from second chance education: making use of good practices in second chance education to
prevent early school leaving, authored for the European Commission by the Ecorys consortium.
0
2
4
6
8
10
12
14
16
18
18 19 20 21 22 23 24
Earl
y s
chool le
avin
g r
ate
(%
)
Age
0,0
5,0
10,0
15,0
20,0
25,0
30,0
35,0
40,0
45,0
ES MT PT IT RO UK EU BG BE FR HU EL CY EE LV DE IE DK FI NL LU AT SE LT PL CZ SK SI HR TR IS NOMK CH
Unemployed Inactive Employed Non-formal learning (including second-chance programmes)**
… But second chance education
remains under-
exploited
17.6% decrease
since 2009
16.1% decrease
since 2009
12.3% decrease
since 2009
10.5% decrease
since 2009
11.5% decrease
since 2009
6.1% decrease
since 2009
8.4% decrease
since 2009

30
Unemployment amongst early school leavers
Figure 3.4 also shows the employment status of early leavers from education and training. Across the EU, the unemployment rate amongst early school leavers was 40.1% in 2012, against an overall youth unemployment rate of 22.8%68. Studies show that these
heightened unemployment risks are part of a cascade of events that often starts long before an individual leaves the education and training system and continues long thereafter with lengthier and
more frequent unemployment spells, more unattractive working conditions, and higher risks of social exclusion69.
The road to 2020 Analysis using a new econometric model developed by the European Commission's Joint Research
Centre (JRC)70 shows that the development of early school leaving over time and across Europe is strongly affected by parental education and the risk of subsequent unemployment. Assuming that these effects remain the same in the near future, and taking into account the projected changes in
education of the parental cohort and the unemployment risks, it is possible to forecast the rate of early school leavers up to 2020 in a way that is more meaningful than a rudimentary linear trend (see Figure 3.5).
Figure 3.5. Early school leaving: forecast and linear trend
Source: JRC-CRELL. Notes: the fan chart depicts a 30% confidence interval, with light blue shading added for the 60% confidence interval. The dashed line denotes the linear trend.
Based on the model set-up described above, the current forecasting exercise
paints a relatively optimistic picture for the majority of Member States as regards their likelihood of reaching the national targets listed in table 3.1. The results show that 15 Member States have a high probability (AT, LU, SE, SI) or quite high probability (BG, CY, DK, FR, EL, IE, IT, LT, LV, NL SK) of
reaching the national targets. 7 other Member States (BE, CZ, DE, EE, FI, HU, PL) have 2020 forecasts which draw close to the targets, meaning that the chances of reaching the targets could be labelled only as “fair”. The remaining
countries (ES, PT and RO) have a low (<35%) probability of reaching their national targets for early school leaving. Evaluating Member States against the EU-wide target of “below 10%” provides more or less the same
distribution of probabilities. Of course, these forecasts merely provide us with a simulation of the probable development in early school leaving rates if policy does not change in the meantime. For the strong performers this
means that current efforts will have to be sustained until 2020 and for the weak performers this means there is still the opportunity to strengthen efforts and introduce comprehensive policy
measures. This section points towards the need for flexible pathways that increase access to work-
68 Individuals below the age of 25. 69 Reducing Early School Leaving in the EU (2011). 70 The econometric model is the result of a first exercise undertaken by the JRC’s Centre for Research on Lifelong
Learning (CRELL), based on a methodology that is to be further refined in the future. For the full technical report, see https://crell.jrc.ec.europa.eu.
0
5
10
15
20
25
2000 2005 2010 2015 2020
Future success in tackling early
school leaving
hinges on the
awareness of
unemployment
risks
The unemployment
rate amongst early
school leavers is
almost twice the
overall youth unemployment rate
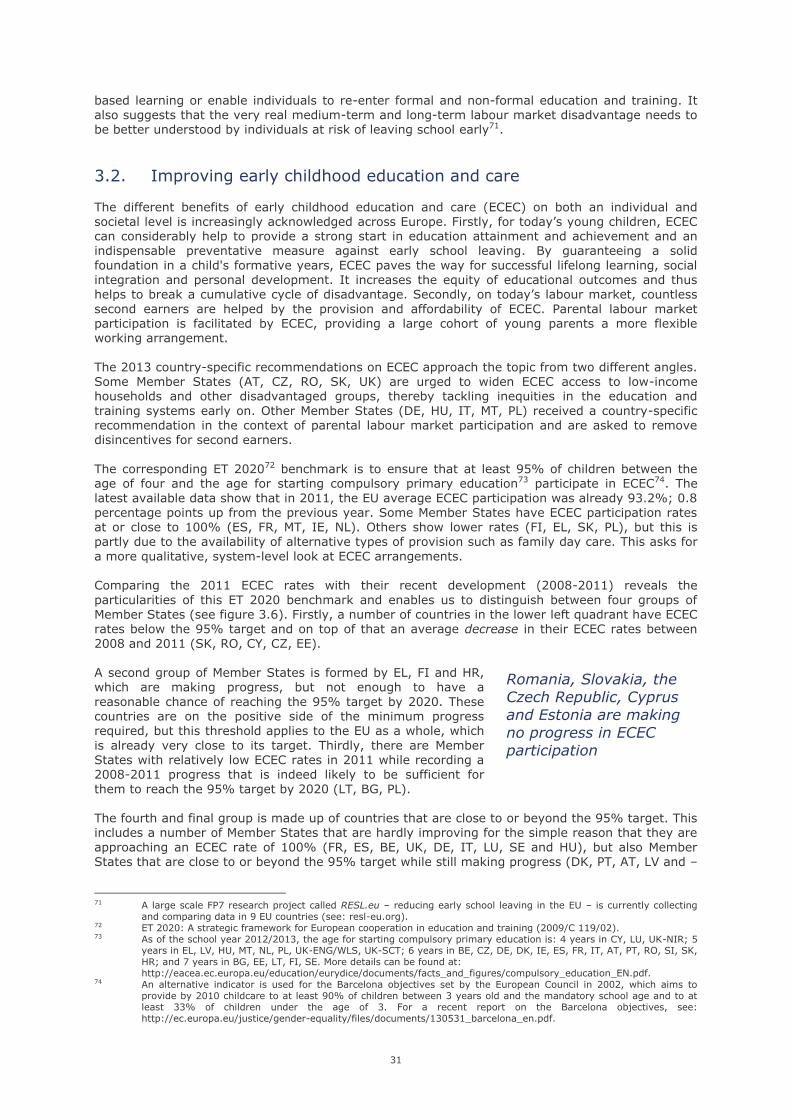
31
based learning or enable individuals to re-enter formal and non-formal education and training. It also suggests that the very real medium-term and long-term labour market disadvantage needs to be better understood by individuals at risk of leaving school early71.
3.2. Improving early childhood education and care
The different benefits of early childhood education and care (ECEC) on both an individual and societal level is increasingly acknowledged across Europe. Firstly, for today’s young children, ECEC can considerably help to provide a strong start in education attainment and achievement and an indispensable preventative measure against early school leaving. By guaranteeing a solid
foundation in a child's formative years, ECEC paves the way for successful lifelong learning, social integration and personal development. It increases the equity of educational outcomes and thus helps to break a cumulative cycle of disadvantage. Secondly, on today’s labour market, countless
second earners are helped by the provision and affordability of ECEC. Parental labour market participation is facilitated by ECEC, providing a large cohort of young parents a more flexible working arrangement.
The 2013 country-specific recommendations on ECEC approach the topic from two different angles. Some Member States (AT, CZ, RO, SK, UK) are urged to widen ECEC access to low-income households and other disadvantaged groups, thereby tackling inequities in the education and
training systems early on. Other Member States (DE, HU, IT, MT, PL) received a country-specific recommendation in the context of parental labour market participation and are asked to remove disincentives for second earners.
The corresponding ET 202072 benchmark is to ensure that at least 95% of children between the age of four and the age for starting compulsory primary education73 participate in ECEC74. The
latest available data show that in 2011, the EU average ECEC participation was already 93.2%; 0.8 percentage points up from the previous year. Some Member States have ECEC participation rates at or close to 100% (ES, FR, MT, IE, NL). Others show lower rates (FI, EL, SK, PL), but this is partly due to the availability of alternative types of provision such as family day care. This asks for
a more qualitative, system-level look at ECEC arrangements. Comparing the 2011 ECEC rates with their recent development (2008-2011) reveals the
particularities of this ET 2020 benchmark and enables us to distinguish between four groups of Member States (see figure 3.6). Firstly, a number of countries in the lower left quadrant have ECEC rates below the 95% target and on top of that an average decrease in their ECEC rates between
2008 and 2011 (SK, RO, CY, CZ, EE). A second group of Member States is formed by EL, FI and HR, which are making progress, but not enough to have a
reasonable chance of reaching the 95% target by 2020. These countries are on the positive side of the minimum progress required, but this threshold applies to the EU as a whole, which
is already very close to its target. Thirdly, there are Member States with relatively low ECEC rates in 2011 while recording a 2008-2011 progress that is indeed likely to be sufficient for
them to reach the 95% target by 2020 (LT, BG, PL). The fourth and final group is made up of countries that are close to or beyond the 95% target. This includes a number of Member States that are hardly improving for the simple reason that they are
approaching an ECEC rate of 100% (FR, ES, BE, UK, DE, IT, LU, SE and HU), but also Member States that are close to or beyond the 95% target while still making progress (DK, PT, AT, LV and –
71 A large scale FP7 research project called RESL.eu – reducing early school leaving in the EU – is currently collecting
and comparing data in 9 EU countries (see: resl-eu.org). 72 ET 2020: A strategic framework for European cooperation in education and training (2009/C 119/02). 73 As of the school year 2012/2013, the age for starting compulsory primary education is: 4 years in CY, LU, UK-NIR; 5
years in EL, LV, HU, MT, NL, PL, UK-ENG/WLS, UK-SCT; 6 years in BE, CZ, DE, DK, IE, ES, FR, IT, AT, PT, RO, SI, SK, HR; and 7 years in BG, EE, LT, FI, SE. More details can be found at:
http://eacea.ec.europa.eu/education/eurydice/documents/facts_and_figures/compulsory_education_EN.pdf. 74 An alternative indicator is used for the Barcelona objectives set by the European Council in 2002, which aims to
provide by 2010 childcare to at least 90% of children between 3 years old and the mandatory school age and to at least 33% of children under the age of 3. For a recent report on the Barcelona objectives, see: http://ec.europa.eu/justice/gender-equality/files/documents/130531_barcelona_en.pdf.
Romania, Slovakia, the
Czech Republic, Cyprus
and Estonia are making
no progress in ECEC
participation

32
to a lesser extent – SI). Since some of the larger Member States are part of this group, the weighted EU average is also very close to it.
Figure 3.6. Early childhood education and care: current performance and recent change
Source: JRC-CRELL and DG EAC calculations based on Eurostat (UOE) data. Notes: Countries are shown according to their 5-6 cohort size, with five categories. MT has been excluded from this scatterplot as its 2011 ECEC rate is – due to a break in series – unrelated to its 2008-2010 percentage change. IE is excluded because of methodological revisions in 2010 and 2011. EL is included only with its 2010-2011 percentage change.
The road to 2020 Even a simple linear trend is enough to see that the ET 2020 target of 95% should be reached
before 2020. After all, the 2011 ECEC rate was only 1.8 percentage points away from the target. With universal ECEC as a plausible scenario for the not too distant future, it becomes all the more important to focus not on the participation of ECEC but rather the quality of ECEC provision. As will
be emphasised in section 3.4, many of the benefits of ECEC participation is conditional on the quality of provision and the early learning activities children are engaged in. Recent developments in the field of ECEC have indeed been focusing on factors affecting quality75. Here, the evidence-base needs to be strengthened by providing internationally comparable data closely examining the
question of quality; what is the nature of activities in which children are engaged and who is providing the support?
In this context, various projects are currently underway76. A forthcoming Eurydice report, Key Data on ECEC 2014, draws on existing research
in order to provide insights into what constitutes high quality ECEC. Based on the data collected for the report and the reforms captured through
75 The thematic working group on ECEC working within the Open Method of Coordination is addressing quality issues set
out in the latest policy documents (COM(2011)66 final and OJ 2011/C 175/03). The group is currently developing a European Quality Framework that will cover areas such as access, workforce, curriculum, evaluation and monitoring,
and funding. 76 Apart from the Eurydice work mentioned here, the OECD and the International Association for the Evaluation of
Educational Achievement (IEA) are also conducting research on the quality of ECEC provision. In order to collect more data on ECEC for international comparison and consolidate information on how countries measure quality and assess their progress in improving it, the OECD Review of Policies and Practices for Monitoring and Evaluating Quality in Early Learning and Development is being carried out from 2013-14. Parallel to this, the IEA cross-national Early Childhood Education Study will collect information on the systems, contexts, and results of early childhood education from a range of sources enabling the development of indicators in three key dimensions: availability, reach, and inclusion; quality; and outcomes.
BG
CZ
DK DE
EE
EL
ES FR
IT
LV
LT
LU
HU
NL
AT
PL
PT
RO
SI
SK
FI
SE
UK BE
HR
EU
CY
70
75
80
85
90
95
100
-3,0 -2,0 -1,0 0,0 1,0 2,0 3,0 4,0 5,0 6,0
Average annual change in ECEC rate (%) over the period 2008-2011
The quality of ECEC provision should
be prioritised by strengthening the
evidence-base and following up with
annual monitoring
ET 2020 benchmark
Early c
hildhood e
ducation a
nd c
are
rate
2011
Getting worse | Improving
Min
imum
pro
gre
ss n
eeded

33
Eurypedia77, it is clear that steps are being taken in an effort to improve the quality of provision provided for young children including reviewing central guidelines, revising child/staff ratios, increasing the number of specialised staff and reforming governance aspects. Finally, most
European countries have implemented measures to support disadvantaged children in ECEC, varying from language training through to the provision of additional staff or funds.
3.3. Strengthening the teaching profession Teaching staff are arguably the most important in-school factor affecting the learning outcomes of students. They have an indispensable role to play in any intervention measure tackling early school
leaving, whether related to school climate, supportive and individualised learning environments, early warning systems, or cooperation with parents. Moreover, the salaries of teachers account for around 70% of current spending on education. Within the context of increased pressure on public
budgets and the irrefutable role of teaching staff in the performance of education and training systems, the investment in the teaching profession should be made in the most effective and efficient way, fostering a high quality, well-educated and well-led teaching workforce78.
Member States need to establish or indeed reinforce mechanisms not only to attract, select and recruit the best candidates, but also to educate them well and ensure they are supported in their professional development throughout their careers. In 2013, three Member States received
country-specific recommendations on the teaching profession, urging them to improve the quality of teaching (PL), reform teachers’ professional and career development (IT) and to attract young people into the profession (SK).
Structured induction programme
A structured induction programme, providing professional, social and personal support in the early years, is one mechanism that can help newcomers adjust to the profession, improve overall quality, and tackle the issue of teacher retention faced by several countries. In only 16 Member
States (DE, EE, IE, FR, IT, HR, CY, LU, MT, AT, PT, RO, SI, SK, SE, and UK) do teachers beginning
their career have access to a structured induction programme, usually directly after gaining their qualification. In FR, IT, LU, MT, PT and UK induction is also considered a probationary period and
thus linked to obtaining a permanent contract. In most countries, with the exception of MT and AT, induction applies to all beginning teachers at all levels of education.
Continuing professional development On-going, individualised professional learning is fundamental and while
it has gained considerable importance over the years it warrants further action79. It is now considered a professional duty in 28 education systems. In 8 European education systems, teacher participation in
continued learning is clearly linked to promotion or a system of advancement for a higher grade. However, in only six Member States (LU, HU, MT, PT, RO and FI) are the exact minimum number of hours each teacher is expected to attend courses specified and in just three
Member States (NL, SI and UK-SCT), a minimum number of hours for continued learning is considered a right.
Quality leadership The quality of leadership has been shown to affect both the motivation and quality of teaching.
Student achievement on PISA tests was higher when teaching staff were held accountable through the involvement of school leaders and external inspectors in monitoring lessons. It is therefore vital that countries ensure that adequate systems are in place to induct school leaders and support
them in their role, but the picture across Europe is extremely diverse and these systems are currently few and far between. Furthermore, continuing professional development for school
77 European encyclopaedia on national education systems; see: https://webgate.ec.europa.eu/fpfis/mwikis/eurydice/index.php/Main_Page. 78 Findings in this section are taken from Eurydice (2011/12), Teachers' and School Heads' Salaries and Allowances in
Europe and Eurydice (2013), Key data on Teachers and School Leaders in Europe. 79 The results of the OECD Teaching and Learning International Survey 2013 (TALIS) will be released in June 2014 and
will provide key data on the professional development of teachers.
Only in the
Netherlands,
Slovenia and Scotland,
teacher’s
continued learning
is considered a
right

34
leaders is key to enabling them to cope with a changing leadership profile and increased responsibilities.
Teacher educators Those responsible for educating teachers should themselves have attained a high academic
standard and possess solid practical experience of teaching, as well as the competences that good teaching requires. However, in most Member States there is little explicit policy provision either to define what quality means in the work of a teacher educator, or what are the necessary
recruitment and selection requirements. Few Member States have set standards for teacher educators or defined the competences required to be allowed to work as a teacher educator. Almost no Member States collect data about this key profession.
Demographic change
Rethinking how we attract, educate and support teachers, school leaders and teacher educators is a hugely pressing issue, with the teaching profession across Europe strongly affected by demographic
trends. As can be seen in Figure 3.7, in many Member States, the majority of teachers currently in employment are in the highest age brackets (40-49 and older than 50). In IT, DE, EE and NL, for example, more than 45% of the teaching workforce is in the 50+
category and in IT, BG, DE and ES there are very few teachers under the age of 30.
Figure 3.7. Age distribution of teachers in lower and upper secondary education (2011)
Source: Eurostat (UOE). Online data code: educ_thpertch. Note: Teachers in public and private institutions at ISCED level 2-3.
The current demographic profile of teachers in Europe means that some Member States will shortly
have to recruit large numbers of new teaching staff – in all subjects – to fill the gap left by a wave of teacher retirement. This pending wave of retirements, coupled with the relatively low status of the teaching profession in many countries, and a declining number of applicants for teacher
education, could lead to serious teacher shortages80 and risks accentuating the lack of adequately trained staff in subjects such as science, maths, ICT and foreign languages.
3.4. Laying the foundations for skills development This final section assesses the determinants of education achievement, represented by basic skills – reading, mathematics and science – and foreign language skills. Ensuring that these foundation
skills are achieved by all will serve to level the playing field and is a gateway to employment and social inclusion.
80 See Eurydice (2013), Key Data on Teachers and School Leaders (http://eacea.ec.europa.eu/education/eurydice/documents/key_data_series/151EN.pdf).
0%
10%
20%
30%
40%
50%
60%
70%
80%
90%
100%
MT PT CY PL UK LU RO ES SI IE FR BE HU FI SK CZ SE LT LV BG AT NL EE DE IT CH NO IS
Teachers aged below 30 Teachers aged 30-39 Teachers aged 40-49 Teachers aged 50 and over
In Italy, Germany, Estonia and the
Netherlands, more
than 45% of the
teaching workforce is
aged 50 years or more
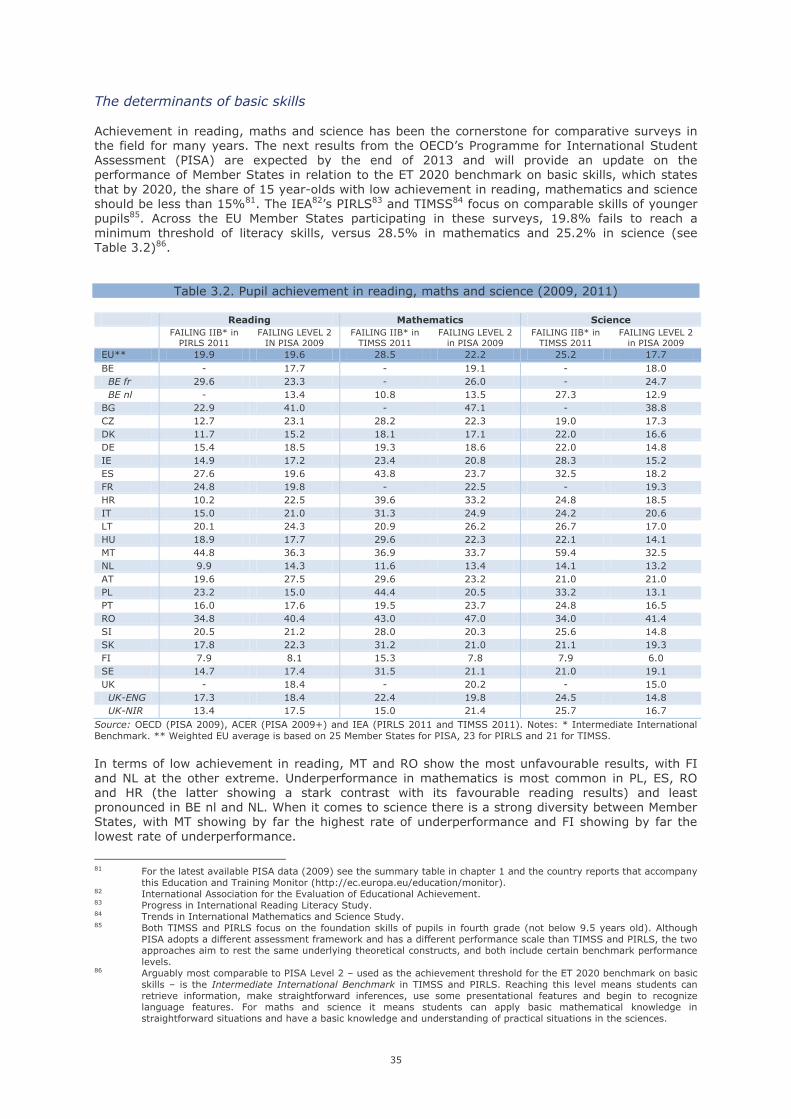
35
The determinants of basic skills
Achievement in reading, maths and science has been the cornerstone for comparative surveys in the field for many years. The next results from the OECD’s Programme for International Student Assessment (PISA) are expected by the end of 2013 and will provide an update on the performance of Member States in relation to the ET 2020 benchmark on basic skills, which states
that by 2020, the share of 15 year-olds with low achievement in reading, mathematics and science should be less than 15%81. The IEA82’s PIRLS83 and TIMSS84 focus on comparable skills of younger pupils85. Across the EU Member States participating in these surveys, 19.8% fails to reach a
minimum threshold of literacy skills, versus 28.5% in mathematics and 25.2% in science (see Table 3.2)86.
Table 3.2. Pupil achievement in reading, maths and science (2009, 2011)
Reading Mathematics Science
FAILING IIB* in
PIRLS 2011
FAILING LEVEL 2
IN PISA 2009
FAILING IIB* in
TIMSS 2011
FAILING LEVEL 2
in PISA 2009
FAILING IIB* in
TIMSS 2011
FAILING LEVEL 2
in PISA 2009
EU** 19.9 19.6 28.5 22.2 25.2 17.7
BE - 17.7 - 19.1 - 18.0
BE fr 29.6 23.3 - 26.0 - 24.7
BE nl - 13.4 10.8 13.5 27.3 12.9
BG 22.9 41.0 - 47.1 - 38.8
CZ 12.7 23.1 28.2 22.3 19.0 17.3
DK 11.7 15.2 18.1 17.1 22.0 16.6
DE 15.4 18.5 19.3 18.6 22.0 14.8
IE 14.9 17.2 23.4 20.8 28.3 15.2
ES 27.6 19.6 43.8 23.7 32.5 18.2
FR 24.8 19.8 - 22.5 - 19.3
HR 10.2 22.5 39.6 33.2 24.8 18.5
IT 15.0 21.0 31.3 24.9 24.2 20.6
LT 20.1 24.3 20.9 26.2 26.7 17.0
HU 18.9 17.7 29.6 22.3 22.1 14.1
MT 44.8 36.3 36.9 33.7 59.4 32.5
NL 9.9 14.3 11.6 13.4 14.1 13.2
AT 19.6 27.5 29.6 23.2 21.0 21.0
PL 23.2 15.0 44.4 20.5 33.2 13.1
PT 16.0 17.6 19.5 23.7 24.8 16.5
RO 34.8 40.4 43.0 47.0 34.0 41.4
SI 20.5 21.2 28.0 20.3 25.6 14.8
SK 17.8 22.3 31.2 21.0 21.1 19.3
FI 7.9 8.1 15.3 7.8 7.9 6.0
SE 14.7 17.4 31.5 21.1 21.0 19.1
UK - 18.4 - 20.2 - 15.0
UK-ENG 17.3 18.4 22.4 19.8 24.5 14.8
UK-NIR 13.4 17.5 15.0 21.4 25.7 16.7
Source: OECD (PISA 2009), ACER (PISA 2009+) and IEA (PIRLS 2011 and TIMSS 2011). Notes: * Intermediate International Benchmark. ** Weighted EU average is based on 25 Member States for PISA, 23 for PIRLS and 21 for TIMSS.
In terms of low achievement in reading, MT and RO show the most unfavourable results, with FI
and NL at the other extreme. Underperformance in mathematics is most common in PL, ES, RO and HR (the latter showing a stark contrast with its favourable reading results) and least pronounced in BE nl and NL. When it comes to science there is a strong diversity between Member States, with MT showing by far the highest rate of underperformance and FI showing by far the
lowest rate of underperformance.
81 For the latest available PISA data (2009) see the summary table in chapter 1 and the country reports that accompany
this Education and Training Monitor (http://ec.europa.eu/education/monitor). 82 International Association for the Evaluation of Educational Achievement. 83 Progress in International Reading Literacy Study. 84 Trends in International Mathematics and Science Study. 85 Both TIMSS and PIRLS focus on the foundation skills of pupils in fourth grade (not below 9.5 years old). Although
PISA adopts a different assessment framework and has a different performance scale than TIMSS and PIRLS, the two approaches aim to rest the same underlying theoretical constructs, and both include certain benchmark performance levels.
86 Arguably most comparable to PISA Level 2 – used as the achievement threshold for the ET 2020 benchmark on basic skills – is the Intermediate International Benchmark in TIMSS and PIRLS. Reaching this level means students can retrieve information, make straightforward inferences, use some presentational features and begin to recognize language features. For maths and science it means students can apply basic mathematical knowledge in straightforward situations and have a basic knowledge and understanding of practical situations in the sciences.

36
More importantly for the purposes of this section, TIMSS 2011 and PIRLS 2011 feature an extensive background questionnaire that provides a wealth of information on the various underlying drivers
of student achievement in reading, maths and science87. As regards student background, attending ECEC and – more specifically – engaging in early literacy and numeracy exercises
before starting primary school prove to be crucial in raising later
achievement. This strengthens the argument not only for universal participation in early childhood education and care, but also for a closer look at the quality of its provision (section 3.2).
Household resources for learning, covering parental education, parental occupation, books in the home and study supports, are also strongly related to the development of these foundation skills.
The equity dimension that transpires through this finding emphasises the need to level the playing field as early as possible. This again has implications for quality ECEC provision, specifically targeted towards low-income families and other disadvantaged groups.
When it comes to schools, resource shortages clearly affect reading, maths and science achievement. The TIMSS 2011 data show that the percentage of grade 4 students attending a school in which the head indicated that they are sometimes affected by a shortage or inadequacy
of teachers with a specialisation in science was greater than 15% in the majority of participating countries. In IT, MT, NL and PT, these percentages were highest, between 30% and 40%88. School heads themselves, meanwhile, positively affect overall achievement outcomes with a commitment
to academic success, lending credence to the importance of leadership as emphasised in the previous section. But it is also the school climate that influences overall achievement scores. Problems with school
discipline and safety are strongly related to low achievement. Across all participating countries in TIMSS and PIRLS, students reported that bullying – one of the school problems with a negative impact on student achievement – occurred either about monthly (32%) or about weekly (20%).
Unlike school resources, school climate has been given little attention in comparative studies, even though its effect on overall achievement is at least as strong.
The determinants of foreign language skills Poor language skills constitute a fundamental obstacle to learning mobility and domestic and
international employability, preventing individuals from seizing professional opportunities abroad and in enterprises or organisations active at an international level. With this in mind, the Commission has proposed to monitor student proficiency in the first foreign language and the
uptake of a second foreign language at lower secondary level89. One of the key objectives of the twofold language benchmark will not be to compare between Member States, but rather to monitor the progress of each education system over time in a comparable and transparent way.
Member States must ensure that quantity and quality of foreign language learning is scrutinised and that teaching and learning is geared towards practical, real life application90. Foreign language skills should be taken into account in the effort to equip young people with the competences
needed to meet labour market demands, as reflected in the recent Communication on youth unemployment91 and a number of 2013 country-specific recommendations92.
Despite the widely acknowledged benefits of language skills, data show a strong variation with regards to foreign language teaching and learning across Member States. The results from the first European Survey on Language Competences (ESLC), published in June 2012, show that the share
of pupils reaching the level 'independent user' in the first foreign language ranged from 9% in UK-
87 See PIRLS 2011: International Results in Reading (http://timssandpirls.bc.edu/pirls2011/international-results-
pirls.html), TIMSS 2011: International Results in Mathematics (http://timssandpirls.bc.edu/timss2011/international-results-mathematics.html) and TIMSS 2011: International Results in Science.
(http://timssandpirls.bc.edu/timss2011/international-results-science.html). 88 The possible responses being: not affected; somewhat affected; affected a lot. 89 For more information on the proposal see the Commission working document Language Competence for
employability, mobility and growth (SWD(2012) 327). 90 Rethinking Education: Investing in skills for better socio-economic outcomes (COM(2012) 669 final). 91 COM(2013) 447 final. 92 The 2013 country-specific recommendations, approved by the Council, can be found at: http://ec.europa.eu/europe2020/making-it-happen/country-specific-recommendations/index_en.htm. The package
was adopted by the Council on 19 June 2013.
Early learning activities before
primary school are
crucial in the
development of basic skills

37
ENG and 14% in FR to 82% in both MT and SE93. As for the second foreign language, the percentage of students learning two or more foreign languages in lower secondary education is extremely diverse across Member States (see Figure 3.8). In 2011, this was over 90% of students
in CY, EL, FI, IT, LU, and RO whereas countries such as AT, HU, IE fell at the other end of the spectrum with numbers barely reaching 10%.
Secondary analysis of the ESLC data conducted by the JRC’s
Centre for Research on Lifelong Learning (CRELL)94 confirms that, amongst other factors, achievement in the target language is positively influenced by: an early start to language learning;
positive student perception in relation to the quality of the lessons; greater exposure to media in the target language; perceived usefulness of the target language in particular for
entertainment; and parents' knowledge of the target language.
Figure 3.8. Percentage of pupils at ISCED 2 learning 2 or more foreign languages (2008, 2011)
Source: Eurostat (UOE). Online data code: educ_thfrlan. EU and EL: 2010 instead of 2011 data. AT, HR, PL and PT: 2009 instead 2008 data. No data for EE and DE available. Only languages regarded as foreign languages in the curriculum drawn up by the central education authorities are included. Languages taught outside the curriculum as optional subjects are not included. Furthermore, the analysis reveals the strong impact of socio-economic status on language
attainment. In only one participating country (NL) did socio-economic background not present any influence on students' achievement in their first foreign language. This stands to support previous research demonstrating that socio-economic status is strongly associated with a rise in proficiency
levels. The equity dimension is comparable to the one found for basic skills, stressing the need for targeted support to lower-income families and other disadvantaged groups. Within this context, Member States should step up efforts to ensure that both students and parents
have a clear vision of the value of language proficiency not only to enhance, but rather to enable future development, whether educational, professional, cultural, or social. Language learning, more than any other competence, does not lend itself to a 'one size fits all' solution and national and
local peculiarities will require tailored solutions taking into account historical, geopolitical and linguistic factors amongst others. Nevertheless, in addition to the basic skills discussed above, language competence should be considered part and parcel of the foundations all students should
acquire to enable further learning and future development.
93 See figure 6.4 in the 2012 Education and Training Monitor (SWD(2012) 373 final). The ESLC Final Report in addition
to national reports for the majority of participating education systems can be found at: http://ec.europa.eu/languages/eslc/.
94 The report can be found at https://crell.jrc.ec.europa.eu. The analysis was carried out on 13 adjudicated entities that participated in the ESLC survey and have English as their first foreign language: BE fr, BG, EE, EL, ES, FR, HR, MT, NL, PL, PT, SI, SE.
0
10
20
30
40
50
60
70
80
90
100
BEfr
UK HU AT IE BG CZ ES BEnl
HR SL SK FR EU LV PT SE NL PL LT DK MT CY RO EL FI IT LU
2008 2011
Foreign language
proficiency is helped by early exercises before primary school

38
Policy lessons The rate of early leavers from education and training stands at 12.7%. Schools manage to
keep students in education and training longer, but an on-going problem lies in the transition
from school to work – with 40.1% of early school leavers unemployed – and in second chance education – with only 0.8% of 18 to 24 year-olds in non-formal learning after having left
formal education. This calls for stronger links between the worlds of work and education. Participation in early childhood education and care (ECEC) stands at 93.2% and is close to its
2020 target of 95%. However, the evidence-base needs to be strengthened on the quality of ECEC provision and the criteria that make ECEC a strong start for individuals. New evidence shows that engaging in learning exercises prior to starting primary school proves to be crucial in raising later skills levels, in terms of both basic skills and foreign language skills.
Rethinking how we attract, educate and support teachers, school leaders and teacher
educators is a hugely pressing issue, with the teaching profession across Europe strongly
affected by demographic trends. In many Member States, the majority of teachers currently in employment are in the highest age brackets. In IT, DE, EE and NL, for example, more than 45% of the teaching workforce is in the 50+ category and in IT, BG, DE and ES, there are very few teachers under the age of 30.

39
4. Emphasising effectiveness and quality in
the modernisation of higher education
Globalisation and technological development are radically changing the landscape of higher
education. Demand for higher education is expected to continue to grow rapidly world-wide, putting the emphasis on Europe's ability to keep pace in modernising higher education within Europe and vis-à-vis the competition with emerging educational powers. Higher education provides
a key contribution to the Europe 2020 strategy with Europe's ambition to become a smart, sustainable and inclusive economy. The EU seeks to support this contribution by building partnerships within Europe and world-wide, by promoting international student mobility, and by
providing tools for ensuring compatibility and comparability for higher education institutions when they cross borders to co-operate with institutions in other countries95. The first part of this chapter focuses on the performance of Member States in relation to the
Europe 2020 and national targets for tertiary education attainment (section 4.1). Subsequently, section 4.2 examines the challenge of ensuring adequate and efficient funding of higher education against the backdrop of the economic crisis. Finally, in section 4.3, attention is drawn to recent
developments in the area of learning mobility, and in particular the pull factors attracting students to study in EU Member States including evidence on students coming from countries outside the EU.
4.1. Increasing tertiary education attainment
The EU average employment rate of recent graduates from tertiary education is 12.1 percentage points higher than that of recent graduates from upper secondary education (see chapter 5) and the rate of continued learning amongst adults with tertiary education attainment is double the rate for individuals with only upper secondary education attainment (see chapter 6). These are just two
illustrations of the positive economic and social impacts of higher education, which, in turn, explain why a tertiary education attainment rate of at least 40% is one of the Europe 2020 headline targets.
Figure 4.1. Tertiary education attainment levels or equivalent, aged 30-34 (%)
Source: Eurostat (Labour Force Survey). * The dashed additional bars for AT and DE denote the postsecondary attainment qualifications included in the definition of their respective national targets (ISCED 4 for DE and ISCED 4/4a for AT, both national data). For FR, the 50% national target refers to the age group 17-33 years old. For FI, the national target is defined more narrowly than the EU headline target and excludes technological institutes.
The 2012 figures show that tertiary education attainment among 30-34 year olds exceeds the 40% benchmark in nearly half of all EU Member States. Overall, the EU average reached 35.7% (see
95 The Communications Rethinking Education (COM (2012)) 669 final), Modernising Europe's Higher Education Systems
(COM (2011) 567 final) and European higher education in the world (COM(2013) 499 final) underline these aspects. See also OECD (2012), Education Indicators in Focus #5. It highlights the remarkable expansion of higher education, notably in G20 countries such as Argentina, Brazil, China, India, Indonesia, the Russian Federation, Saudi Arabia and South Africa.
0,0
10,0
20,0
30,0
40,0
50,0
60,0
IT RO MT HR SK CZ AT BG PT HU GR DE EU LV EE PL SI ES NL DK FR BE FI UK SE LT LU CY IE
ISCED 5a ISCED 5b ISCED 6 ISCED 4 * Headline target National target

40
Table 4.1), compared to 32.1% in 2009 and 23.5% in 2002. Moreover, 10 Member States have already reached their national target in this area (AT, CY, DE, DK, FI, LT, LU, LV, NL, and SE).
Figure 4.2 illustrates the current performance (2012) of Member States as regards their tertiary education attainment rate as well as recent change (2009-2012). The dashed vertical line illustrates the minimum average annual progress that would be necessary for the EU as a whole to
reach the 40% target by 2020 (2.0%). While the average annual progress between 2009 and 2012
was higher (3.6%) than this minimum progress required, it should be noted that the current EU average tertiary education attainment rate is still 4.2 percentage points below target. More importantly, as illustrated towards the end of this section, a linear trend – simply extrapolating the
recent pace of improvement into the future – is likely to overestimate the future development of the tertiary attainment rate across Europe.
Figure 4.2. Tertiary education attainment: current performance and recent change
Source: DG EAC and JRC/CRELL calculations based on Eurostat data. Member States having already achieved their national targets are marked in green. Countries are shown according to their 30-34 cohort size, with five categories. Further notes: the average annual change rate is artificial for countries with a break in series, i.e. MT (2010), NL (2010) and LV (2011). AT and DE are included in this chart without taking into account ISCED level 4A (AT and DE) or ISCED level 4B (DE).
On the basis of current performance and recent change, four groups of Member States can be distinguished. Firstly, Member
States which are underperforming in terms of current tertiary attainment rates and in addition have not made much progress in recent years. This group contains only BG, with a current
tertiary attainment rate of 26.9% and an average annual change between 2009 and 2012 of -1.2%.
Secondly, Member States that are still underperforming in terms of current tertiary attainment
rates while nevertheless showing significant progress in recent years. This group is quite diverse in regard to current performance and recent change, with increases between 2009 and 2012 ranging from 2.1% (MT) to 13.5% (CZ) and current performance from 21.7% (IT) to 39.1% (PL). EE
actually reached its national target in 2011 but fell slightly below the rate of 40% again in 2012. Thirdly, Member States with high current attainment rates at, or above, the 40% level but which
have lost momentum in recent years. This group includes countries like IE and FR, which have set
highly ambitious national targets (IE, for instance, is the best-performing country in 2012 but is yet to reach its 60% target). Against this background, only about half of the countries in the group have reached their national targets.
BE
BG
CY
CZ
DE
DK
EE
EL
ES
EU
FI FR
HR
HU
IE
IT
LT LU
LV
MT
NL
PL
PT
RO
SE
SI
SK
AT
UK
15,0
20,0
25,0
30,0
35,0
40,0
45,0
50,0
55,0
-2,0 0,0 2,0 4,0 6,0 8,0 10,0 12,0 14,0
Further increasing tertiary
attainment rates have
positive returns for individuals and societies
Headline target
Min
imum
pro
gre
ss n
eeded
Tert
iary
att
ain
ment
rate
2012
Average annual change in tertiary attainment rate (%) over the period 2009-2012

41
Finally, Member States that have reached the level of the headline target of 40% and are still making significant progress (LU, SE, CY, UK, LT). These countries have also reached their national targets when set96.
Table 4.1. Tertiary education attainment (%)
2009 2012 2020
Total Total Males Females Native-born
Foreign-born
Target EU Non EU
Sub-total
EU 28 32.1 35.7 31.5 39.9 36.4 36.4 31.5 33.1 40
Belgium 42.0 43.9 37.1 50.7 46.5 49.5 24.8 33.6 47
Bulgaria 27.9 26.9 20.5 33.6 26.8 : : : 36
Czech Republic 17.5 25.6 22.4 29.1 25.5 28.3 28.0 28.1 32
Denmark 40.7 43.0 33.7 52.6 43.5 57.4 34.9 39.3 40
Germany 29.4 31.9 31.0 32.9 33.2 : : : 42
Estonia 35.9 39.1 28.1 50.4 39.2 : (34.4) (36.6) 40
Ireland 48.9 51.1 44.0 57.9 49.7 48.4 68.7 55.0 60
Greece 26.5 30.9 27.6 34.2 33.9 (19.0) 8.4 10.3 32
Spain 39.4 40.1 35.0 45.3 45.4 27.3 20.9 22.6 44
France 43.2 43.6 38.5 48.6 44.6 38.9 37.1 37.4 50
Croatia 20.6 23.7 19.4 28.8 23.9 (52.8) (14.7) (22.2) 35
Italy 19.0 21.7 17.2 26.3 24.2 12.1 10.6 11.1 26
Cyprus 45.0 49.9 43.6 55.5 56.5 40.4 39.3 39.8 46
Latvia 30.1 37.0 26.0 48.1 37.3 : : (31.8) 34
Lithuania 40.6 48.7 40.7 56.4 48.3 : : : 40
Luxembourg 46.6b 49.6 50.4 48.9 41.7 57.3 47.4 55.4 40
Hungary 23.9 29.9 24.7 35.5 29.8 (35.8) : 36.7 30.3
Malta 21.0p 22.4 20.7 24.0 21.4 : (38.2) (38.0) 33
Netherlands 40.5 42.3p 39.9 44.8 44.3 46.0 29.0 32.9 40
Austria 23.5 26.3 26.0 26.6 26.8 35.3 17.1 24.8 38
Poland 32.8 39.1p 31.9 46.5 39.1 : : : 45
Portugal 21.1 27.2 24.3 30.1 27.7 31.8 19.6 23.6 40
Romania 16.8 21.8 20.5 23.2 21.8 : : : 26.7
Slovenia 31.6 39.2 29.5 49.6 41.2 : (9.4) (12.6) 40
Slovakia 17.6 23.7 19.4 28.2 23.7 : : : 40
Finland 45.9 45.8 36.7 55.4 47.0 35.1 31.4 33.0 42
Sweden 43.9 47.9 42.4 53.7 49.1 60.9 40.3 44.8 40
United Kingdom 41.5 47.1 44.0 50.2 44.3 49.9 58.9 55.2 :
Montenegro : : : : : : : : :
Iceland 41.7 42.8 34.5 51.2 45.5 26.0 40.8 30.8 :
MK 14.3 21.7 20.8 22.6 : : : : :
Serbia : : : : : : : : :
Turkey 14.7 18.0 19.8 16.2 : : : : :
Norway 47.0 47.6 39.9 55.9 48.6 49.6 39.8 43.8 :
Switzerland 43.4 43.8 47.2 40.5 45.1 52.0 31.6 42.1 :
Source: Eurostat (LFS). Intermediate breaks in time series for MT (2010), NL (2010) and LV (2011). Notes: "b" = break in time series; "p" = provisional; "()" = Data lack reliability due to small sample size; ":" = data either not available or not reliable due to very small sample size. For AT, DE, FI and FR, see the notes below Figure 4.1.
A gender pattern in tertiary education attainment Of the 12.4 million 30 to 34 year-olds with a tertiary education
qualification, 6.8 million are women, highlighting a significant gender difference in relation to obtaining a high-level education. Moreover, this difference is increasing, up by 0.7 percentage points from 2011. In fact,
women, taken as a separate group, achieved the 40% benchmark in 2012, 8 years ahead of the 2020 target date. The biggest gender differences in attainment are in EE, LV, DK, SI and FI, where the gap is
approaching a 20 percentage point difference. The female tertiary
attainment rate is higher in all countries with the exception of LU, CH and TR.
96 UK has not defined a national target.
Gender differences in tertiary
education spill over
in labour market segregations

42
Figure 4.3. Attainment by field of education (2012)
Source: Eurostat (LFS).
There are also very significant gender discrepancies in different fields of study, which inevitably has an impact on students' future occupational possibilities (see figure 4.3). As such, segregation or segmentation in education paths spills over into segregation in the labour market, with
engineering, scientific fields and related occupations being male dominated whereas professions related to the social sciences, education, health and welfare subjects are overwhelmingly female dominated.
A disadvantage for foreign-born students
At an aggregate EU level, there is also a significant difference in tertiary education attainment levels between native-born and foreign-born individuals; the latter have a particular disadvantage when born in countries outside the EU (see Table 4.1). While the overall gap is shrinking (from a
4.5 percentage point difference in 2011 to 3.5 in 2012), there is still a long way to go. The tertiary
attainment level of the foreign-born population compared to the native-born population is higher only in CZ, IE, HU, LU and the UK, and the tertiary attainment rates for the native-born are double of those of the foreign-born population in Member States such as EL, ES and IT.
This points to some very visible differences in the migration patterns within Europe with some countries as CZ, IE, HU, LU and UK attracting people with high skill levels, whereas other Member
States (notably IT) attract a lower skilled work force.
The road to 2020 Using a simple linear trend when predicting future tertiary attainment levels can be misleading and, in this case, might prove overly optimistic. In reality, development of tertiary education attainment
is driven by various underlying factors. Analysis using a new econometric model developed by the European Commission's Joint Research Centre (JRC)97 has shown that two of the most important factors affecting the development of tertiary attainment rates over time are the level of education
of the parental cohort and the expected wage premium gained from obtaining tertiary education (which can be measured using labour productivity as a proxy). Assuming that the relationship between the variables remains the same in the near future, and taking into account the projected
changes in education of the adult population and of the labour productivity, we can forecast the rate of tertiary education attainment up to 2020 and beyond in a more meaningful way. The econometric projection (see Figure 4.4) is more pessimistic than the linear trend for two
reasons. Firstly, over the last decade, younger cohorts have not improved their level of education as fast as older cohorts. As a consequence of ageing, we will see a slower improvement in the parental cohort’s average level of education in the years to come. Secondly, the increase in
productivity (and thus the wage premium that tertiary education graduates are likely to command) is slightly lower for the forecast period than for the past, mainly due to the on-going economic crisis. This is likely to reduce the comparative advantage of completing higher education and thus
97 The econometric model is the result of a first exercise undertaken by the JRC’s Centre for Research on Lifelong
Learning (CRELL), based on a methodology that is to be further refined in the future. For the full technical report, see https://crell.jrc.ec.europa.eu/.
0%
5%
10%
15%
20%
25%
30%
35%
Socialsciences;
business andlaw
Engineering;manufacturing
andconstruction
Health andwelfare
Humanities;languages and
arts
Science;mathematics
andcomputing
Teachertraining andeducationscience
Services Agricultureand veterinary
Females Males

43
impact on young people's study decisions. Taken together, these two underlying drivers lead to a slower improvement in the tertiary education attainment rate in the period up to 2020 than has been the case in the last decade.
At the same time, the JRC econometric model paints a relatively optimistic picture for the majority of Member States as regards their
likelihood of reaching the national targets listed in table 4.1.
According to the model, 15 Member States have a high probability (EE, FI, LT, LU, LV and SE) or quite high probability (CY, DK, ES, EL, HU, NL, PL, RO and SI) of reaching their national targets by 2020. 6
Member States have a fair probability (BE, BG, CZ, FR, IE and IT) and only 3 Member States have a quite low probability (MT, PT and SK) of reaching their national targets98.
This forecast only provides an illustration of the probable development in tertiary attainment rates taking into account the driving variables discussed. Moreover, it assumes policy does not change in the meantime. For the stronger performers this means that current efforts will have to be
sustained and for the weaker performers there is still the opportunity to strengthen efforts and introduce comprehensive policy measures, in particular to ensure current and future student cohorts successfully complete their studies.
Figure 4.4. Tertiary education attainment: projection and linear trend
Source: JRC-CRELL. Notes: the fan chart depicts a 30% confidence interval, with light blue shading added for the 60% confidence interval. The dashed line denotes the linear trend.
Indeed, from the specific perspective of achieving the Europe 2020 headline target, the policy debate has shifted from widening access to higher education (which remains absolutely crucial with a longer term perspective) to the effectiveness of the education systems in ensuring that students
who enter successfully obtain their final qualification. After all, many of 2020’s 30-34 year olds – now 23-27 - have already started or completed their tertiary education.
4.2. Meeting the challenge of effective resource allocation in higher
education For many years the number of enrolments (and graduates) in tertiary education has been rising
significantly, in Europe but also elsewhere in the world. Particularly within the context of the current economic crisis, the crucial questions are whether overall levels of resources have kept pace with this increase in student numbers (to help ensure quality) and how limited resources can be spent most efficiently. We consider these issues from three perspectives: (1) the absolute level
of higher education financing over time, including the latest data since the onset of the economic
crisis (2) trends in the level of private resources in higher education institutions and (3) completion rates for students finishing their higher education degree as a proxy for process efficiency.
98 AT and DE are not included in this summary assessment. Their inclusion of postsecondary attainment means that
these forecasts would underestimate their ability to reach the national targets on tertiary education attainment.
10
20
30
40
50
60
70
2000 2005 2010 2015 2020
A relatively optimistic
picture for reaching the 2020 target
should not hide the
fact that sustained efforts are necessary

44
Level of spending on higher education
On average in the EU the expenditure per student on tertiary education (see Figure 4.5) has remained broadly stable since the economic crisis hit in 2008. The country figures, however, show somewhat divergent trends. Cuts have been made in 6 out of 11 countries below the level of EU spending (HR, BG, RO, LV, CZ, IT) whereas higher spending countries such as AT, CY, ES, NL and
SE have also cut expenditure per student for tertiary education. The longer term trend since 2000 shows significant increases in absolute spending levels (in PPS per student) in most countries with the notable exception of IT and to a lesser extent NL.
Figure 4.5. Expenditure per student on tertiary education institutions in € PPS (2008-2010)
Source: Eurostat (UOE). Online data code: educ_fitotin. The expenditure includes public and private expenditure on both public and private tertiary education institutions. Countries are ranked in ascending order according to development between 2008 and 2010.
The 2013 country-specific recommendations emphasise strategic planning and effective spending in higher education for a number of countries, including measures regarding improved planning (AT);
better alignment of supply and demand with regards to the labour market (BG, RO, SK); and funding and cost-effectiveness of funding (CZ, DK, LV). For other countries, the country-specific recommendations emphasise the equity aspects of higher education, such as more support for disadvantaged students (HU) and to improve career and counselling services for students (IT).
The composition of higher education spending Examining expenditure structures within tertiary education in terms of how much is paid by public resources compared to private sources adds another interesting dimension (Table 4.2). In Europe,
finance for tertiary education is largely public (82.7% of overall expenditures), in contrast to the US where private sources are the main contributors to the budgets of tertiary education institutions (70.4%). In the US, the financial burden lies mainly with individual beneficiaries of tertiary education and their families (and to a lesser extent on other private funders) whereas in Europe it
is a collective burden borne primarily by tax payers. There are, however, noticeable differences within Europe, with the UK resembling the US more
than continental Europe. The share of public sources in total expenditure on educational institutions is particularly high in the Nordic countries (DK, FI, SE, IS and NO) and RO (90% or more).
The public-private split in higher education funding has remained stable since 2000 in a majority of
countries, although a few have changed towards a larger share of private spending on tertiary education. This is particularly noticeable in UK-ENG, but also in some Eastern European countries such as LT, PL, SK and to a lesser extent DE, AT, IE and IT. A few countries have moved in the
opposite direction as is the case for RO and CY (in the latter case due to the state also spending on places for CY students to study abroad).
-3 000
-1 000
1 000
3 000
5 000
7 000
9 000
11 000
13 000
15 000
-3000
-1000
1000
3000
5000
7000
9000
11000
13000
15000
HR
BG
RO
NL
SE
LV
CY
AT
CZ
ES IT BE
SK
DE
LT
EU
PT
FR
EE
DK FI
UK SI
PL
MT
Decrease between 2008 and 2010 in € PPS Increase between 2008 and 2010 in € PPS
in €
PPS p
er
stu
dent

45
Table 4.2. Relative proportions of public and private expenditure on educational institutions as a percentage, for tertiary education (2000, 2010)
2010 2000
Public
sources
Private sources
Public sources Private sources
Household
expenditure
Other private
expenditure
All private
sources
EU* 82.7 : : 17.3 : :
Belgium 89.8 4.7 5.6 10.2 85.1 14.9
Bulgaria 51.7 46.8 1.4 48.3 58.7 41.3
Czech Republic 78.8 9.4 11.8 21.2 85.4 14.6
Denmark 95.0 5.0 0.0 5.0 97.6 2.4
Germany 84.4 : : 15.6 91.8 8.2
Estonia 75.4 17.9 6.7 24.6 : :
Ireland 81.2 16.3 2.5 18.8 86.2 13.8
Greece : : : : 99.7 0.3
Spain 78.2 17.6 4.2 21.8 74.4 25.6
France 81.9 10.1 8.0 18.1 84.4 15.6
Croatia 76.0 24.0 0.0 24.0 : :
Italy 67.6 24.4 8.0 32.4 77.5 22.5
Cyprus 52.1 46.7 1.1 47.9 20.1 79.9
Latvia 60.2 37.7 2.1 39.8 59.4 40.6
Lithuania 68.7 26.1 5.2 31.3 100.0 0.0
Luxembourg : : : : : :
Hungary : : : : 76.6 23.4
Malta : : : : 98.6 1.4
Netherlands 71.8 14.7 13.5 28.2 75.0 25.0
Austria 87.8 2.6 9.5 12.2 96.3 3.7
Poland 70.6 22.5 6.9 29.4 100.0 0.0
Portugal 69.0 23.4 7.6 31.0 92.5 7.5
Romania 90.0 9.5 0.5 10.0 70.0 30.0
Slovenia 84.7 10.6 4.7 15.3 : :
Slovakia 70.2 11.8 18.0 29.8 91.3 8.7
Finland 95.9 0.0 0.0 4.1 97.2 2.8
Sweden 90.6 0.0 9.4 9.4 88.1 11.9
United Kingdom 25.2 56.1 18.7 74.8 67.7 32.3
Montenegro : : : : : :
Iceland 91.2 8.2 0.6 8.8 94.9 5.1
MK : : : : : :
Serbia : : : : : :
Turkey : : : : 95.4 4.6
Norway 96.0 3.3 0.7 4.0 96.2 3.8
Switzerland : : : : : :
US 29.6 58.1 12.3 70.4 : :
Source: Eurostat (UOE). Note: *EU average based on available country data. CY: includes private funding for students living abroad. USA: 2009 data.
In addition to spending on institutions, public authorities provide direct support to students in the
form of student grants and loans. Since 2000, at EU level there has been a slight increase in the financial aid for students as a percentage of total public expenditure on education. However, the proportions spent differ significantly between EU countries, with relatively high levels in the Nordic countries, NL and UK (as well as in CY) and noticeably lower levels in countries such as BG, CZ, EE,
EL, ES, FR, IE, and RO. Increases in private expenditure for tertiary education
institutions are not associated with decreases in public expenditure across Europe99. Moreover, the limited evidence currently available suggests that higher shares of
private expenditure (including tuition fees) do not seem to be associated with more limited access amongst disadvantaged groups. The latter is possibly related to the
availability of public loans, scholarships and grants100.
There is, however, a need for strengthening the evidence-
99 See OECD (2012), Education Indicators in Focus #8. 100 See OECD (2012), Education at a Glance 2012 (Indicator B5).
The evidence-base needs to
be strengthened on
equitable opportunities and
outcomes in relation to private spending, tuition fees and public loans

46
base, particularly on the effects of the crisis and on the longer-term effects for disadvantaged students (e.g. in relation to the burden of having to pay back student loans101).
Figure 4.6. Financial aid to students as percentage of total public expenditure on education at
tertiary level (ISCED 5 and 6)
Source: Eurostat (UOE). MT: 2003 instead of 2005 data, HR: 2003 instead of 2000 data, RO and SK: 2001 instead of 2000 data, TR: 2004 instead of 2005 data.
Completion rates in higher education If tertiary qualifications, and thereby attainment, are the main output of a higher education institution and public and private resources its main inputs, then efficiency can be improved by
examining 'the black box' between the investment and the outcome. Although measuring process efficiency is inherently complex, one way to approximate the efficiency of higher education institutions is to look at the completion rates; i.e. how many students finish their degrees once
they have entered a higher education programme102. Here, the assumption is that it is an
inefficient use of public resources when individuals start higher education courses but leave without a qualification by dropping out of the system. Low completion rates can therefore be seen as a
proxy for process inefficiency.
Figure 4.7. Completion rates in tertiary education (2011)
Source: OECD (2013), Education at a Glance 2013 (Table A4.1, www.oecd.org/edu/eag2013). Notes: SE: Includes students entering single courses who may never intend to study all courses needed for a degree (around one-third of all enrolments). DE, ES and FR: only type A education (ISCED 5A, bachelor and master types of education). For FR, the completion rate reaches 80% if those successfully reoriented to an ISCED level 5B qualification are taken into account.
Figure 4.7 shows significant differences in completion rates between countries (for which data are
available) with rates ranging from a level where only just more than half of those entering
101 As a comparison, the US famously has a total student loan debt around 1 trillion USD, exceeding both its total credit
card debt and car loan debt. 102 Other dimensions of process efficiency are applicable here and are covered elsewhere in the Education and Training
Monitor. Firstly, the development of Open Educational Resources (OER) and Massive Open Online Courses (MOOCs) (see Section 2.2) may have an impact on traditional funding models and also open up new opportunities to bring tertiary education courses to an even wider population in a particularly flexible and efficient manner. Secondly, the transparency and recognition of learning outcomes, even if obtained through informal or non-formal education, may increase skill levels (see Section 2.3).
0
10
20
30
40
50
60
EU
BE
BG
CZ
DK
DE
EE IE EL
ES
FR
HR IT CY
LV
LT
HU
MT
NL
AT
PL
PT
RO SI
SK FI
SE
UK IS NO
CH
TR
2000
2005
2010
0
10
20
30
40
50
60
70
80
90
DK ES FI DE TR BE nl NL CZ UK SK FR PT AT PL NO SE US HU
Total Men Women

47
succeeded (HU and SE) to comparatively higher rates of 75% or more in DK, ES, FI, DE and TR (but still with scope for improvement). It should be noted that not only do women enter the tertiary levels in higher numbers than men but they have also higher completion rates for all the
countries shown, significantly so in countries such as PL, PT, CZ, NL and BE nl. A recent report from the Network of Experts on Social Aspects of Education and Training (NESET)
offers a closer look at the underlying determinants of dropout from higher education103. The report
shows that lack of individual resources is the most significant factor leading students to drop out. Coming from a poor socioeconomic background is found to dominate all other factors including gender and ethnicity in leading to dropout. Secondly, the report emphasises that it is not widening
participation per se that causes dropout. The problem is rather a lack of attention to the needs of a more diverse student population and a lack of a student-centred approach in designing and delivering higher education programmes.
The evidence presented in this section provides a vivid illustration of the need for countries to consider how best to effectively employ resources within their systems in order to ensure students successfully obtain their qualifications and therefore contribute to a higher overall skill level in
society.
The overall picture emerging is one of divergent structures
within tertiary education and differing responses to an economic crisis which is far more prevalent in some parts of Europe than in others. Indeed, some countries are maintaining or even
increasing spending levels and the number of academic staff while others have pulled the brake. The findings above also demonstrate the important scope for peer learning in relation to spending on tertiary education and the incentives for learning.
4.3. Promoting learning mobility in higher education
Learning mobility provides a key contribution to EU education and training policies. It provides students from across Europe with international experience, to strengthen their networks and
to expand their horizons to other contexts within education and work104. This is valuable in itself and may contribute to a sense of European identity. But as new evidence shows, it can also
help tackle skills bottlenecks. Being mobile during higher education increases the probability of being mobile after graduation, as a recent report shows105. Across 16 Member States studied, learning mobility increases the likelihood of
subsequent work-related mobility by 14 percentage points. Both the Council Conclusions on the modernisation of higher education106 as well the recent
Commission Communication on European Higher Education in the World107 highlight the potential of mobility both within and beyond the EU to enhance students' prospects. Moreover, in the next multiannual programme Erasmus+ (2014-2020), 65% of the EU education and training budget is
earmarked for mobility schemes such as Grundtvig, Leonardo da Vinci, Erasmus and Erasmus Mundus108.
103 NESET (2013), Drop-out and Completion in Higher Education in Europe: supporting students from under-represented
groups (see: http://ec.europa.eu/education/news/20131017-neset_en.htm; and http://www.nesetweb.eu/). 104 Mobility and international networking is considered beneficial at all levels of tertiary education, including at doctorate
level. International networking and the importance of transferable skills and exposure to industry and other employment sectors are part of seven Principles for Innovative Doctoral Training developed by the Commission together with experts from industry, academia and national research ministries (http://ec.europa.eu/euraxess/pdf/research_policies/Principles_for_Innovative_Doctoral_Training.pdf).
105 See JRC-CRELL (2013), Does Student Mobility During Higher Education Pay? Evidence From 16 European Countries
(https://crell.jrc.ec.europa.eu); as well as OECD (2013), Education Indicators in Focus #14. For mobility at doctorate level the recent EU-wide study MORE2 provides findings on mobility patterns and career paths of researchers. Furthermore, the Commission’s Researchers’ Report 2013 provides information on national policies to address issues such as inward and outward mobility of researchers, attracting young people into science and equipping them with the right skills (http://ec.europa.eu/euraxess/index.cfm/services/researchPolicies).
106 OJ 2011/C 372/09. 107 COM(2013) 499 final. 108 The Commission's Erasmus Mundus programme provides grants/scholarships for students at master and doctorate
level coming from outside EU countries to study in the EU. It also encourages partnerships between educational
Learning mobility
increases the likelihood
of work-related mobility,
potentially helping in
tackling skills bottlenecks across
Europe
Effectiveness of tertiary
education could be
increased significantly if more students finish their degrees

48
The November 2011 Council Conclusions on an EU benchmark for learning mobility is based on three indicators; one targeting learning mobility in higher education, one concerning initial
vocational training mobility (see section 5.1), and an indicator on general youth mobility109. The Bologna Process has also set a target in the domain of higher education defined in a similar way to the EU target but for the wider scope of the Bologna countries (covering 47 European countries).
Table 4.3. International student mobility: enrolments and graduates in destination country (2011)
Degree enrolments
% of all students enrolled
Erasmus enrolments
% of all students enrolled
Graduates % of all
graduates
EU 1,399,991 7.0 222,236 1.1 : :
Belgium 37,866 8.2 7,837 1.7 : :
Bulgaria 10,345 3.6 781 0.3 : :
Czech Republic* 38,041 8.5 5,198 1.2 : :
Denmark 20,252 7.8 6,688 2.6 4,812 8.4
Germany** 181,220 7.1 24,733 0.9 30,386 5.8
Estonia 1,430 2.1 850 1.2 258 2.2
Ireland 12.695 6.5 5,381 2.7 4,409 7.4
Greece* 32,828 5.0 2,860 0.4 : :
Spain 62,636 3.2 37,432 1.9 6,006 1.6
France* 268,212 11.9 27,722 1.2 : :
Croatia 690 0.5 13 0.01 182 0.5
Italy*** 69,905 3.5 19,172 1.0 : :
Cyprus 8,990 28.0 611 1.9 1,078 18.2
Latvia 1,979 1.9 650 0.6 315 1.3
Lithuania 3,004 1.6 1,540 0.8 355 0.8
Luxembourg 2,468 40.6 408 6.7 502 38.9
Hungary 16,465 4.3 3,211 0.8 : :
Malta* 471 4.1 965 8.4 : :
Netherlands 38,367 4.9 9,189 1.2 7,003 5.0
Austria 53,036 14.7 5,383 1.5 6,965 10.9
Poland 20,711 1.0 7,583 0.4 3,375 0.5
Portugal 13,356 3.4 8,536 2.2 2,629 3.0
Romania 16,075 1.8 1,563 0.2 2,142 0.8
Slovenia 1,976 1.8 1,436 1.3 343 1.7
Slovakia 8,748 3.9 1,181 0.5 : :
Finland 14,124 4.6 6,805 2.2 2,268 4.6
Sweden 36,522 7.9 10,034 2.2 7,079 10.2
United Kingdom 419,946 16.9 24,474 1.0 173,688 23.0
Montenegro : : : : : :
Iceland 1,099 5.8 532 2.8 : :
MK : : : : : :
Serbia : : : : : :
Liechtenstein 777 79.0 56 5.7 197 76.4
Turkey* : 2.6 4,288 0.1 : :
Norway 3,407 1.5 4,281 1.9 1,285 3.2
Switzerland* 58943 22.9 15 0.0 8,903 11.3
USA 709,565 3.4 na : 165,113 5.2
Source: Eurostat (UOE), online data codes educ_momo_gen and educ_mofo_gen; and DG EAC (Erasmus enrolments). Note: “:” = missing. na: not applicable. EU average: estimate by DG EAC based on available data. * CZ, EL, FR, MT, CH, TR foreign citizens instead of mobile students. ** DE 2010 data. *** IT 2010 data, foreign citizens instead of mobile students. The number of foreign citizens is normally higher than the number of mobile students in tertiary education; so the EU estimate is a slight overestimate. International student mobility has two driving forces; the push factor – meaning the desire of
young people to go abroad and study or train in another country – and the pull factor; the ability of national education systems to attract students from abroad to study within their system. Currently, the available statistics on learning mobility only give a fragmented picture of
international mobility flows; the number of students enrolled abroad and graduating abroad (degree mobility) and the number of students who have enjoyed a study or training period abroad
institutions and promotes European higher education in the rest of the world
(http://ec.europa.eu/education/external-relation-programmes/mundus_en.htm). 109 The benchmark on learning mobility in higher education is defined as follows: By 2020, an EU average of at least
20% of higher education graduates should have had a period of higher education-related study or training (including work placements) abroad, representing a minimum of 15 ECTS credits or lasting a minimum of three months.

49
(credit mobility). Eurostat has recently agreed on a regulation with Member States which foresees the obligatory transmission of tertiary education mobility data by Member States in the near future. This means that benchmark data are still under development. Given the situation, this section
concentrates on examining how many mobile students and graduates are studying in EU Member States.
Table 4.3 shows, that across Europe, degree mobility is the most dominant form of learning
mobility but that the EU credit mobility programmes also contribute significantly. The UK is the country within the EU which attracts the most students from abroad. In 2011, nearly 174,000 mobile students graduated in the UK, more than in the United States (23% of the total graduate
population). There is a large gap between the UK and the next most popular EU Member States such as AT, SE and DK in terms of relative share of international graduates (around 10% of total graduates).
In addition, it should be noted that a few smaller countries (e.g. CY, LU) attract a relatively large proportion of international students. This is likely due to their geographical position, proximity to a larger neighbouring country, or explicit policy measures.
Worldwide mobility In recent decades, there has been a continual increase in learning mobility worldwide. Europe remains an attractive destination for mobile learners with a stable share of around 40-45% of the
internationally mobile student population, a population expected to grow from just below the current 4 million to 7 million by the end of the decade110.
Figure 4.8. International student mobility: enrolments in EU Member States (%, 2010)
Source: UNESCO Institute of Statistics.
Figure 4.8 shows that nearly 70% of the international students who studied in one of the EU Member States in 2010 (degree mobility) came from countries outside the EU. This percentage is more than 80% in countries such as BG, CY, FR, LT, SE, and SI. The high percentages of students
coming from outside the EU may be the direct result of explicit policies but is often due to specific historical circumstances such as former colonial ties (e.g. FR, UK and BE), or proximity to a large neighbour outside the EU (e.g. BG, CY and LT).
Figure 4.9 shows that EU Member States accommodate nearly 38% of the world's mobile students whereas students from the EU only make up 18% of the worldwide mobile student population going abroad. The United States and Canada are other big recipients of international students
whereas Asian countries (particularly East-Asia including China) supply a large part of the world's international students. This pattern has developed over recent decades and is becoming more pronounced.
Some European countries have adopted specific policies both at central level and at the higher education institutional level for attracting students from abroad. Examples of explicit internationalisation policies at both institutional and at country level are becoming more
110 UNESCO Institute of Statistics and Commission Communication European Higher Education in the World (COM(2013)
499 final). The actual level of international mobile students can only be estimated roughly given missing data from some countries worldwide and the use of different concepts for defining a mobile student.
0
5
10
15
20
25
30
35
40
45
extra EU intra EU

50
Policy lessons With the tertiary attainment rate now at 35.7%, the discussion is shifting towards improving
completion rates which for many European countries is below 70%. The fairly scattered evidence shows that there are ample possibilities for institutions and governments to improve the effectiveness of higher education in addition to the benefits for the individual in actually
gaining a qualification.
widespread throughout Europe with some countries setting explicit targets for attracting students and for sending their own students abroad. For example, it is envisaged that half of all students in DK will have followed a part of their studies abroad by 2020, and both universities and high level
vocational institutions in AT and LU make study or training abroad a compulsory part of the programme111.
At the EU level, student mobility from countries outside the EU has recently been facilitated by the
adoption of a Directive covering the harmonisation of rules governing the admission of third country nationals for study purposes. More concretely, this Directive determines the rules concerning the procedures for admitting third country nationals for a period exceeding three
months for the purposes of studies, pupil exchange, unremunerated training or voluntary service, thereby harmonising national legislation in this area112.
Figure 4.9. Distribution of mobile students in tertiary education by region of origin (2010)
Further progress remains necessary. Education programmes should be organised in such a way that international mobility can become a practical reality (e.g. the planning of a course should take
into account the possibility for such periods abroad). From the student perspective, the economic support offered (grant schemes) should be 'mobile' as well. Finally, language competences (Section 3.4) are essential for enabling effective international mobility.
111 For examples see Eurydice and Eurypedia: chapter on mobility and internationalisation (https://webgate.ec.europa.eu/fpfis/mwikis/eurydice/index.php/Mobility_and_Internationalisation). Also see
European Migration Network (2012), Immigration of International Students to the EU. 112 Council Directive 2004/114/EC of 13 December 2004 on the conditions of admission of third-country nationals for the
purposes of studies, pupil exchange, unremunerated training or voluntary service. See also SWD (2013) 77 final and detailed data on residence permits for third-country nationals (tables migr_resval and migr_resage; http://epp.eurostat.ec.europa.eu/portal/page/portal/population/data/database).
EU-27 17,9
Europe, non-EU 27
8,6
North America
3,1 Latin
America and
the Caribbean
6,4 Arab States
8,6 Sub-Saharan
Africa
8,4
Pacific 0,9
East Asia 31,1
Central, South and
West Asia 15,0
EU-27 37,8
Europe, non-EU 27
7,3
North America
21,7
Latin America and
the Caribbean
1,9
Arab States 5,9
Sub-Saharan
Africa 2,5
Pacific 8,9
East Asia 12,4
Central, South and
West Asia 1,4
Inbound mobility Outbound mobility
Source: UNESCO Institute of Statistics. Notes: The totals used are at world-level (3.6 million students for inbound; 3.2 million for outbound). The difference is due to the fact that the country of origin is unknown for some students.

51
Policy lessons (continued)
The evidence-base needs to be strengthened in the area of equitable opportunities and
outcomes in relation to private spending, tuition fees and public loans. The level of private
spending on tertiary education in Europe is low and has not increased markedly during the last decade. The limited data currently available suggests that increases in private funding do not decrease overall public funding and have limited effects on the equitable access to tertiary education. Further research is needed if Member States are to exploit funding possibilities
beyond relying on public funding. New evidence on international mobility of students confirms the positive effects of mobility at
both individual and societal level. Being mobile during higher education increases the probability of being mobile after graduation and may therefore help in tackling skills mismatches and bottlenecks across the European labour market.

52
5. Facilitating the transition from education
to work through vocational education
and training
In its recent Communications on youth unemployment113 and the social dimension of the Economic and Monetary Union114, the Commission stressed the need to foster the employability of young people, with as many as 17% of recent graduates115 unemployed in 2012 compared to 11% in
2008. The rise in unemployment is even more pronounced for people coming from upper secondary education (21% in 2012, 14% in 2008). Apprenticeships are one important driver of youth employability and should be significantly reinforced in upper secondary vocational programmes
across the EU. Evidence from Member States with strong vocational education and training (VET) systems shows the great potential of work-based learning to fight youth unemployment and increase the employability of young graduates.
This chapter focuses on labour market outcomes of formal education and underlines the need for higher labour market relevance of education and training systems. Section 5.1 emphasises the importance of combined school- and work-based learning and apprenticeship opportunities in order
to facilitate the transition from learning to work for millions of young Europeans. Subsequently, section 5.2 provides a closer look at the trends in employment rates of recent graduates, whether from upper secondary or tertiary education. Section 5.3, finally, stresses the need to develop
further entrepreneurial competences among young people, in order to equip them with a sense of initiative and an ability to transform ideas into action, contributing to their employability.
5.1. Reshaping vocational education and training In both the Rethinking Education Communication116 and the 2013 youth unemployment
Communication, the Commission called on Member States to step up efforts in developing world-
class vocational education and training to raise the quality of vocational skills, and in promoting work-based learning including quality traineeships, apprenticeships and dual systems117. Work- based learning in its various forms facilitates the transition from learning to work and plays a key
role in addressing skills shortages, in particular in sectors with growth potential. In the context of the 2013 European Semester, the country-specific recommendations for sixteen
Member States focused on increased provision of apprenticeships and work-based learning, improving employability of young people through the Youth Guarantee, and efforts to increase labour market relevance and attractiveness of VET118.
In its Communication on the Youth Employment Initiative of March 2013119, the Commission stressed the role of a Youth Guarantee120 in all Member States and the need for launching a European Alliance for Apprenticeships as well as the second-stage social partner consultation on a
Quality Framework on Traineeships121. The European Alliance for Apprenticeships is a multi-stakeholder initiative bringing together efforts of Member States, social partners, businesses and other relevant actors along with the European Commission to develop high-quality apprenticeship-
113 COM(2013) 447 final. 114 COM(2013) 690. 115 Those aged 20-34 who graduated within the last three years from upper secondary or tertiary education and who are
not in further education and training. 116 Rethinking Education: Investing in skills for better socio-economic outcomes (COM(2012) 669 final). 117 Combination of apprenticeships in a company and vocational education in an educational institution. For further
information, see the 2011 CEDEFOP report on the benefits of Vocational Education and Training at http://www.cedefop.europa.eu/EN/Files/5510_en.pdf.
118 The 2013 country-specific recommendations, approved by the Council, can be found at: http://ec.europa.eu/europe2020/making-it-happen/country-specific-recommendations/index_en.htm. The package
was adopted by the Council on 19 June 2013. The recommendations concern BE, BG, DK, ES, FR, IT, LV, LT, LU, MT, PL, RO, SE, SK, SI and UK.
119 COM(2013) 144 final. 120 COM(2012) 729 final. Member States should put in place measures to ensure that young people up to age 25 receive
a good quality offer of employment, continued education, an apprenticeship or a traineeship within four months of leaving school or becoming unemployed.
121 COM (2012) 728 final.

53
type training and excellence in work-based learning in VET. Within the Youth Guarantee Recommendation, adopted by the Council on 28 April 2013, apprenticeships are one of the four options for its implementation.
Both the Youth Employment package and the European Alliance for Apprenticeships are meant in particular to: (i) improve the quality, attractiveness and supply of apprenticeships; (ii) strengthen
the exchange of information and good practices amongst stakeholders of all EU Member States;
and (iii) give young people more opportunities to work and train abroad. Keeping up investments in work-based learning pays off as they
have proven to significantly improve the employability of young people in some Member States. Indeed, students from Vocational Education and Training programmes experience a better transition
from school to work in Member States having developed work-based learning, such as DK, CZ, DE, NL and AT (Table 5.1)122. In HU and SK, however, despite the provision of combined work- and school based programmes, youth unemployment ratios for recent
graduates from upper secondary education is still of particular concern, far above the rates for recent tertiary graduates. This suggests that the skills acquired by VET graduates might not be
considered as sufficiently relevant by employers.
Table 5.1. Students in school- and work-based learning and youth unemployment ratios
Percentage of ISCED 3 students in work-based VET programmes (2011)123
Unemployment ratios of recent graduates (2012)
Upper secondary
education Tertiary
education
Belgium 3.1 17.6 6.8
Czech Republic 31.8 17.4 (6.5)
Denmark 44.7 10.5 9.7
Germany 42.9 8.6 :
Estonia 0.3 22.7 (7.6)
Ireland 5.0 37.9 13.6
Spain 1.9 45.9 29.4
France 12.0 23.9 12.4
Hungary 16.6 28.5 9.9
Netherlands 20.9 6.2 5.6
Austria 34.8 6.3 :
Poland 6.6 26.7 12.5
Slovenia 0.1 (26.9) 16.9
Slovakia 29.0 34.2 15.7
Finland 11.7 14.7 7.8
Source: Eurostat (UOE and LFS). Notes: 2010 data are used for IE and NL; "()" = Data lack reliability due to small sample size; ":" = data not reliable due to very small sample size (below 3%). The unemployment ratio of recent graduates is calculated as the share of unemployed persons aged 20-34 with upper secondary (incl. post-secondary non tertiary) or tertiary qualifications out of the population of the same age and educational attainment level. The ratio refers to people who left education within the last three years and who are no longer in education and training. In eight Member States, less than 40% of graduates were from VET programmes at upper secondary level in 2010 (Figure 5.1). Providing more work-based learning in VET programmes will
obviously take different forms according to the field of study (e.g. alternance schemes, on the job training periods, on-site labs), in particular in programmes of a less technical nature. Increasing awareness of VET programmes in all fields among employers and promoting their involvement in the design and supply of work-based learning is of particular relevance in this context.
Provision in the European Union budget is earmarked to support this process: Member States can use the European Social Fund, the Youth Employment Initiative and the Erasmus+ programme
(2014-2020) to further improve the quality and efficiency of vocational education and training systems. Furthermore, a Review124 of existing apprenticeship and traineeship programmes is under
122 See also CEDEFOP (2012), From education to working life: the labour market outcomes of vocational education and
training. 123 In the UOE data collection, a VET programme is classified as "combined work- and school-based "if 25% or more of
the curriculum is presented outside the school environment. Programmes where the work-based component accounts for 90% or more of the curriculum are excluded from the UOE data collection. The category "Combined work- and school-based VET" is not applicable to the educational systems of BG, EL, IT and PT.
124 This will include an overview of available data. See the youth opportunities initiative and its technical assistance to
Work-based learning strengthens youth
employment and
should become a
central pillar of
vocational education
and training systems across Europe

54
development to identify the most successful and cost-effective approaches. A helpdesk on apprenticeship and traineeship schemes has already been set up to provide strategic, operational and policy-focused advice to stakeholders at national, regional and local level that are planning,
setting up, running or evaluating apprenticeship and traineeship schemes. Additionally, the Commission together with Member States' experts and CEDEFOP are developing guiding principles with respect to profiles and competence development of VET trainers for work-based learning.
Figure 5.1. Graduates in VET as a share of graduates from upper secondary education (2010)
Source: DG EAC calculation on the basis of Eurostat (UOE) data. Notes: the chart depicts the percentage of graduates in VET out of all graduates from upper secondary education and post-secondary non tertiary education (ISCED 3 and 4). Data by field of study not available for EL, HR, IT, PT and UK.
Learning mobility in initial vocational education and training The ET 2020125 benchmark on learning mobility in initial vocational education and training (IVET)126 sets concrete targets to be achieved by 2020 and many EU Member States have followed up on the
Europe-wide targets by setting their own national targets as well. Moreover, the Erasmus+
programme (2014-2020) aims to further foster cross-border vocational training.
Figure 5.2. Percentage of ISCED 3 students participating in Leonardo da Vinci programmes
Sources: DG EAC estimates based on Eurostat (UOE) and DG EAC data sources (http://ec.europa.eu/education/leonardo-da-vinci/statistics_en.htm). Notes: chart depicts the number of students participating in a Leonardo da Vinci project (selection database) as a percentage of students enrolled in initial vocational training programmes (ISCED 3 upper secondary vocational orientation). The benchmark for learning mobility in initial vocational training (IVET), defined as the vocational
orientation within upper secondary education (apprenticeships included), stipulates that by 2020
“an EU average of at least 6% of 18 to 34 year-olds with an initial vocational education and
set up apprenticeship schemes. See also the 2012 report on "apprenticeship supply in the Member States of the European Union".
125 ET 2020: A strategic framework for European cooperation in education and training (2009/C 119/02). 126 See: http://www.consilium.europa.eu/uedocs/cms_data/docs/pressdata/en/educ/126380.pdf.
0
10
20
30
40
50
60
70
80
90
100
CY LT LV UK PT MT HU EL EE DK BG ES PL IE FR DE EU LU SE IT SI FI CZ NL BE RO SK AT HR
Engineering, health, services Humanities, social sciences, administration
0%
1%
2%
3%
4%
5%
6%
7%
8%
CZ SK HU BE RO UK IT IE PT HR SE PL EU BG FI SI AT FR ES DK DE NL LU LV EL EE LT MT CY CH LI TR NO IS
2008 2011

55
training qualification should have had an initial VET-related study or training period (including work placements) abroad lasting a minimum of two weeks”.
Very little evidence exists concerning the actual magnitude of IVET mobility across the EU. Eurostat is presently undertaking efforts to measure the benchmark via a sample survey with the aim of providing feedback on the benchmark by the end of 2015.
The Leonardo da Vinci strand of the Lifelong Learning Programme – covering IVET mobility – provides some indication of the level and development of annual IVET mobility flows (Figure 5.2). However, a recent study on mobility developments in school education, vocational education and
training, adult education and youth exchanges commissioned by the European Commission, shows that the number of participants in schemes financed from other sources amount to nearly double the total participants in the EU action programmes127.
5.2. Enhancing the employability of young people
The year 2012 marked a further drop in employment rates of recent graduates in the European Union. The rate in 2012 was 75.7% for people aged 20-34 years and who had left education and training within the preceding three years, representing a decrease of 6.3 percentage points from 2008 (and 1.5 percentage points from 2011).
Compared to the overall population, the economic crisis had the most significant impact on the employment of young
people. This trend was even more pronounced amongst recent graduates. For young people with upper secondary education qualifications, the employment rates have decreased by 4.6
percentage points since 2008 for all young people, and have decreased by 7.8 percentage points for recent graduates. Since 2008, the decrease for all young people with tertiary qualifications has been 3.8 percentage points versus 5.4
percentage points for recent graduates. The situation for young people with at most lower secondary education is even more alarming (see chapter 3 on early school leaving).
Figure 5.3. Employment rates of recent graduates: current performance and recent change
Source: Eurostat (LFS online data code edat_lfse_24). Note : Countries are shown according to their 20-34 cohort size, with five categories.
127 http://ec.europa.eu/education/documents/more-information/mobility-study-report.pdf.
LU
LT
MT
EE
LV
SI
FI
SK
DK
IE
BG
SE
PT
AT
HU
EL
NL
CZ
ES
BE
RO
DE
FR
UK
IT
PL CY
EU
HR
40,0
50,0
60,0
70,0
80,0
90,0
100,0
-14,0 -12,0 -10,0 -8,0 -6,0 -4,0 -2,0 0,0 2,0 4,0
EU employment rate of
recent graduates is down by 8 percentage
points for upper
secondary education, 5
percentage points for tertiary education
Average annual change in employment rate of recent graduates (%) over the period 2009-2012
Em
plo
ym
ent
rate
of re
cent
gra
duate
s 2
012
ET 2020 Benchmark
Min
imum
pro
gre
ss n
eeded

56
In 2012, the Council adopted a benchmark on the employability of graduates from education and training with a view to better monitor the contribution of education and training to the transition from education to employment128. The target is that by 2020 82% of young Europeans aged 20-34,
graduating within the last three years and no longer in education or training, are in employment. After the sharp decrease in employment rates of recent graduates between 2008 and 2009 across
all countries, employment prospects for young graduates continued to deteriorate in many Member
States. This is demonstrated by Figure 5.3, which plots the recent change (2009-2012) against the 2012 values.
Eight Member States had employment rates of recent graduates that were above 82% in 2012: CZ, DK, DE, LU, MT, NL, AT and SE. BE, FI and UK remain close to the EU target. Since 2012, employment rates started to increase in CZ, FI, and UK (all educational levels); in BE, DK and AT
(for tertiary graduates); and in LU and MT (for upper secondary graduates). In DE and SE, rates increased significantly from 2009 to 2011 and remained high for all levels but decreased slightly between 2011 and 2012.
Employment rates of recent graduates were below 82% in other Member States. Some of these countries have experienced a continual decrease in their employment rates since 2009. This was particularly the case in EL, ES and PT (-22, -10 and -14 percentage points since 2009
respectively). More recently, employment rates have increased in BG, LV, and LT (all educational levels); in EE, and HU (for tertiary graduates); and in CY and RO (for upper secondary graduates).
While employment rates of recent graduates remain low in many countries, the transition from school to work is a particular issue for students from upper secondary programmes in BG, IE, EL, ES, HR, IT, LV and RO – with
employment rates below 60% in 2012. In the same countries as well as in HU, employment rates for upper secondary graduates were lower by 20 percentage points
when compared to their peers from tertiary education who reached employment rates close to 80% or above in
2012.
Figure 5.4. Employment rates of recent graduates by field of study (2009, 2012)
Source: Eurostat (LFS). Notes: Based on 1999 Eurostat Classification of fields of studies. The group “Humanities, social sciences, business” aggregates the categories 0 General Programmes, 1 Education, 2 Humanities and Arts, 3 Social Sciences, Business, Law. The group “Science, engineering, health, services” aggregates the categories 4 Science, Mathematics, Computing, 5 Engineering, Manufacturing, Construction, 6 Agriculture, Veterinary, 7 Health, Welfare, 8 Services. From left to
right, the four groups represented respectively 19.9%, 28.7%, 28.6% and 22.9% of EU recent graduates in 2012. The category "upper secondary" includes post-secondary non tertiary education and corresponds to ISCED 3-4. Tertiary corresponds to ISCED 5-6.
128 See: http://www.consilium.europa.eu/uedocs/cms_data/docs/pressdata/en/educ/130142.pdf.
60,0
65,0
70,0
75,0
80,0
85,0
90,0
Humanities, social sciences,business
Science, engeneering,health, services
Humanities, social sciences,business
Science, engeneering,health, services
UPPER SECONDARY TERTIARY
Decrease compared to 2009 2012
In 2012, employment rates were below 60% for recent
graduates from upper
secondary education in eight Member States
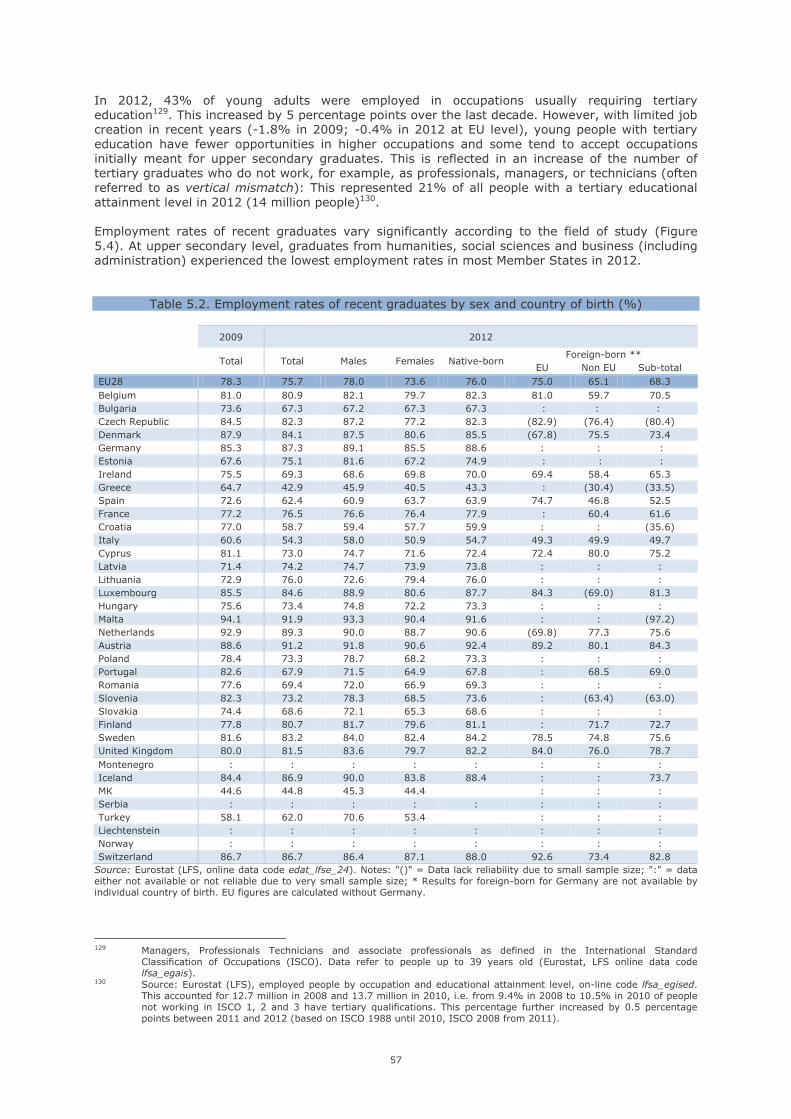
57
In 2012, 43% of young adults were employed in occupations usually requiring tertiary education129. This increased by 5 percentage points over the last decade. However, with limited job creation in recent years (-1.8% in 2009; -0.4% in 2012 at EU level), young people with tertiary
education have fewer opportunities in higher occupations and some tend to accept occupations initially meant for upper secondary graduates. This is reflected in an increase of the number of tertiary graduates who do not work, for example, as professionals, managers, or technicians (often
referred to as vertical mismatch): This represented 21% of all people with a tertiary educational
attainment level in 2012 (14 million people)130. Employment rates of recent graduates vary significantly according to the field of study (Figure
5.4). At upper secondary level, graduates from humanities, social sciences and business (including administration) experienced the lowest employment rates in most Member States in 2012.
Table 5.2. Employment rates of recent graduates by sex and country of birth (%)
2009 2012
Total Total Males Females Native-born Foreign-born **
EU Non EU Sub-total
EU28 78.3 75.7 78.0 73.6 76.0 75.0 65.1 68.3
Belgium 81.0 80.9 82.1 79.7 82.3 81.0 59.7 70.5
Bulgaria 73.6 67.3 67.2 67.3 67.3 : : :
Czech Republic 84.5 82.3 87.2 77.2 82.3 (82.9) (76.4) (80.4)
Denmark 87.9 84.1 87.5 80.6 85.5 (67.8) 75.5 73.4
Germany 85.3 87.3 89.1 85.5 88.6 : : :
Estonia 67.6 75.1 81.6 67.2 74.9 : : :
Ireland 75.5 69.3 68.6 69.8 70.0 69.4 58.4 65.3
Greece 64.7 42.9 45.9 40.5 43.3 : (30.4) (33.5)
Spain 72.6 62.4 60.9 63.7 63.9 74.7 46.8 52.5
France 77.2 76.5 76.6 76.4 77.9 : 60.4 61.6
Croatia 77.0 58.7 59.4 57.7 59.9 : : (35.6)
Italy 60.6 54.3 58.0 50.9 54.7 49.3 49.9 49.7
Cyprus 81.1 73.0 74.7 71.6 72.4 72.4 80.0 75.2
Latvia 71.4 74.2 74.7 73.9 73.8 : : :
Lithuania 72.9 76.0 72.6 79.4 76.0 : : :
Luxembourg 85.5 84.6 88.9 80.6 87.7 84.3 (69.0) 81.3
Hungary 75.6 73.4 74.8 72.2 73.3 : : :
Malta 94.1 91.9 93.3 90.4 91.6 : : (97.2)
Netherlands 92.9 89.3 90.0 88.7 90.6 (69.8) 77.3 75.6
Austria 88.6 91.2 91.8 90.6 92.4 89.2 80.1 84.3
Poland 78.4 73.3 78.7 68.2 73.3 : : :
Portugal 82.6 67.9 71.5 64.9 67.8 : 68.5 69.0
Romania 77.6 69.4 72.0 66.9 69.3 : : :
Slovenia 82.3 73.2 78.3 68.5 73.6 : (63.4) (63.0)
Slovakia 74.4 68.6 72.1 65.3 68.6 : : :
Finland 77.8 80.7 81.7 79.6 81.1 : 71.7 72.7
Sweden 81.6 83.2 84.0 82.4 84.2 78.5 74.8 75.6
United Kingdom 80.0 81.5 83.6 79.7 82.2 84.0 76.0 78.7
Montenegro : : : : : : : :
Iceland 84.4 86.9 90.0 83.8 88.4 : : 73.7
MK 44.6 44.8 45.3 44.4 : : :
Serbia : : : : : : : :
Turkey 58.1 62.0 70.6 53.4 : : :
Liechtenstein : : : : : : : :
Norway : : : : : : : :
Switzerland 86.7 86.7 86.4 87.1 88.0 92.6 73.4 82.8
Source: Eurostat (LFS, online data code edat_lfse_24). Notes: "()" = Data lack reliability due to small sample size; ":" = data either not available or not reliable due to very small sample size; * Results for foreign-born for Germany are not available by individual country of birth. EU figures are calculated without Germany.
129 Managers, Professionals Technicians and associate professionals as defined in the International Standard
Classification of Occupations (ISCO). Data refer to people up to 39 years old (Eurostat, LFS online data code lfsa_egais).
130 Source: Eurostat (LFS), employed people by occupation and educational attainment level, on-line code lfsa_egised. This accounted for 12.7 million in 2008 and 13.7 million in 2010, i.e. from 9.4% in 2008 to 10.5% in 2010 of people not working in ISCO 1, 2 and 3 have tertiary qualifications. This percentage further increased by 0.5 percentage points between 2011 and 2012 (based on ISCO 1988 until 2010, ISCO 2008 from 2011).

58
Employment perspectives were better for those with extended studies in that field; close to 80% for tertiary graduates. When comparing with 2009, the economic crisis has generally impacted
employment rates equally, with the exception of BE, IE, ES, IT, HU and NL where there has been a larger decrease for young people with upper secondary qualifications in the field of humanities, social
sciences and business. This calls for education and training systems
to ensure higher labour market relevance and to provide improved career and counselling services at early stages of upper secondary education, in closer collaboration with employers of all sectors.
More worrying, beyond the sharp increase of unemployment, is the large share of young graduates who are no longer in
education and training and who are not actively searching for work. The inactivity rates of recent graduates increased by one percentage point between 2008 and 2012. This was the case for all educational attainment levels, males and females, but in
particular for upper secondary education graduates (2.3 percentage points for males, 1.2 percentage points for females)131.
The 2012 employment rates continued to be higher for males than for females. However, the difference between male and female employment rates of recent graduates has tended to narrow
in the last 10 years, mainly due to a stronger decrease of employment rates for males since 2009. The disadvantage for recent female graduates increased from 2.7 percentage points in 2009 to 4.4 percentage points in 2012 at EU level (Table 5.2). This was largely due to the gender gap in employment rates for recent upper secondary graduates: from 3.6 percentage points in 2009 to
7.1 percentage points in 2012. The gender gap remained rather stable for recent tertiary graduates (3.9 percentage points in
2009 versus 4.3 percentage points in 2012). The gender gap increased sharply from 2009 in DK, EE, PL and UK (for upper secondary graduates); in PT and SI (for tertiary graduates); and in LU
(for all levels).
In all countries in 2012, with the exception of BG, IE, ES and LT, employment rates were higher for males than females. The gender gap was most prevalent in CZ, EE, IT, LU, PL and SI (between 7 and 14 percentage points). In FR, HR, LV, AT, NL and SE, the gender gap was smallest (between
0.2 and 1.7 percentage points) and slightly more favourable to women in BG (0.1 percentage points) and IE (1.2 percentage points). In IE, ES, LT and UK, 2012 employment rates of recent graduates from tertiary education were higher for females than for males (by 2 percentage points
or more). Gender gaps at these ages are, of course, closely related to the provision of quality early childhood education and care (ECEC) in each country for young parents (see chapter 3).
Since 2009, employment rates of recent graduates have decreased for both native-born and foreign-born individuals but this is more pronounced for the latter. The gap between native-born and foreign-born individuals was more acute in 2012 than previously. In all countries except CY and PT, native-born graduates had a higher likelihood of being employed than their foreign-born
counterparts. This was generally more noticeable among those born outside the European Union and was particularly the case in BE and ES.
5.3. Fostering entrepreneurship education The EU is promoting entrepreneurship education as one of the key factors for employability and
highlights the importance of advancing a European entrepreneurial culture by fostering the right mind-set and skills. Consequently, the Europe 2020 strategy has underlined the need to improve the entrepreneurial and innovative capabilities of European citizens through three flagships:
Innovation Union, Youth on the Move and An agenda for new skills and jobs. In the ET 2020 strategic framework, the fourth long-term strategic objective of EU education and training policies is enhancing creativity and innovation, including entrepreneurship, at all levels of
131 Source: Eurostat, inactivity rates of recent graduates, on-line code edat_lfse_26.
Besides the sharp
increase of
unemployment,
inactivity also
increased among recent graduates
Employment
opportunities still differ significantly
by field of study at
all educational levels

59
education and training. Entrepreneurship and a sense of initiative is the seventh of eight key competences for lifelong learning defined in the European reference framework and refers to an individual’s ability to turn ideas into action. It includes creativity, innovation and risk taking, as well
as the ability to plan and manage projects in order to achieve objectives. Entrepreneurship is becoming more important as the focus increases on the economic impact of
education and training, as well as its social impact. The 2013 Annual Growth Survey132 highlighted
that all young people should develop entrepreneurial skills for employability and new business creation. Further to this, the Rethinking Education Communication133 underlined the need to drive up the economic impact of education – and entrepreneurship education has been identified as one
tool to achieve this at both EU and Member State level. The importance of the entrepreneurship agenda is also highlighted through several of the 2013 country-specific recommendations134. Moreover, entrepreneurship education and skills is also highly visible as one of the three pillars in
the Entrepreneurship 2020 Action Plan.
Figure 5.5. Percentage of individuals aged 18 to 64 who believe to have the required skills and
knowledge to start a business (2012)
Source: Global Entrepreneurship Monitor 2012.
Self-efficacy, the belief in one's own ability to complete tasks and reach goals, is considered as an important driver of individuals' entrepreneurial activity. The 2012 results from the annual Global Entrepreneurship Monitor in figure 5.5 show that only in a handful of the Member States do more
than half of the adult population believe they have the required skills and knowledge to start a business. The decrease in this (business start-up focussed) self-efficacy measure for IT has been considerable (from 42% in 2010 to 30% in 2012), but overall the country patterns remain rather stable135. It is however not possible, based on the existing internationally comparable data, to draw
firm conclusions on the contribution of entrepreneurship education to entrepreneurial self-efficacy. As illustrated in Figure 5.6, recent results from the 2012 Flash Eurobarometer (354)
Entrepreneurship in the EU and beyond show that only half of the EU population aged 15 years and above agree that their school education helped them to develop a sense of initiative and a sort of entrepreneurial attitude, with 22% totally agreeing and 28% tending to agree. Young people (15-
24) agree to a larger extent (64%) than the rest of the population and so do those who are still studying (66% agree) or who left education after the age of 20 (55%)136. Compared with 2009, the EU average has
remained stable for the indicator on entrepreneurial attitude/sense of initiative, but in several of the Member States there
have been significant developments. LV and LT have had the most notable change, with
132 http://ec.europa.eu/europe2020/making-it-happen/annual-growth-surveys/index_en.htm. 133 http://ec.europa.eu/education/news/rethinking_en.htm. 134 The 2013 country-specific recommendations, approved by the Council, can be found at: http://ec.europa.eu/europe2020/making-it-happen/country-specific-recommendations/index_en.htm. The package
was adopted by the Council on 19 June 2013. 135 See Figure 2.8 in the Education and Training Monitor 2012 at: http://ec.europa.eu/education/news/rethinking/sw373_en.pdf. 136 For further qualitative information about entrepreneurship education at school, see Eurydice (2012), Entrepreneurship
Education at School in Europe: National Strategies, Curricula and Learning Outcomes.
0
10
20
30
40
50
60
IT DK FI FR BE DE SE RO LT HU NL EE HR LV IE PT UK ES AT SK SI PL
Only half of the EU population aged 15
and above agree that their school
education helped them develop entrepreneurial competences

60
the percentage in agreement increasing by almost 30 percentage points. UK has seen the largest drop (10 percentage points), bringing it further below the EU average.
Figure 5.6. Percentage of individuals 15 years+ agreeing that their school education has helped
them to develop a sense of initiative/sort of entrepreneurial attitude
Source: 2012 Flash Eurobarometer (354) Entrepreneurship in the EU and beyond.
There are marked differences between Member States. In 2012, the percentage agreeing that their school education helped them to develop a sense of initiative and a sort of entrepreneurial attitude ranged from 75% in PT to 35% in UK. Except for RO, all the countries that have a value above the EU average on the entrepreneurial attitude/sense of initiative indicator also have a higher
percentage than the EU average stating that they have taken part, at school or university, in any course or activity concerning entrepreneurship (defined as turning ideas into action, developing your own project). One should, however, be cautious about drawing firm conclusions on the impact
of entrepreneurship education based on this Eurobarometer data.
In general, most available data has a strong focus on the business
start-up dimension of entrepreneurship and is not clearly linked to the impact of the education environment. There is therefore a need to further strengthen the availability of internationally comparable indicators on entrepreneurship education and entrepreneurship as a key
competence137. This need is underlined in the forthcoming Commission Staff working document on entrepreneurship in education.
Nevertheless, studies, both at EU and Member State level complement the existing EU-wide indicators, and point to a positive link between entrepreneurship education and entrepreneurial competence and activity. A 2012 study on Effects and Impact of Entrepreneurship Programmes in
Higher Education138 covering nine institutions across Europe found that it seemed easier for entrepreneurship alumni to find a position in paid employment immediately after graduation (78% versus 59% for the control group). Furthermore, the study found that entrepreneurship alumni had a higher propensity to be running their own business (8% versus 3% for the control group) or to
have been involved in initiatives to start non-commercial projects (49% versus 38% for the control group).
Findings at national level in countries with well-developed monitoring structures for entrepreneurship education also illustrate the benefits of entrepreneurship education. Denmark is an example in point, and recent short-term findings from an on-going Danish longitudinal study139
on the impact of secondary and university level entrepreneurship education showed that entrepreneurship as a method140 has a positive effect on lower secondary pupils' school engagement. At university level, the study found that during their education, entrepreneurship
137 For a useful overview of indicators and data sources for entrepreneurship education in 10 Member States see
http://ec.europa.eu/education/more-information/doc/2011/entrepreneurship_en.pdf. 138 http://ec.europa.eu/enterprise/newsroom/cf/_getdocument.cfm?doc_id=7428. 139 The Danish Foundation for Entrepreneurship/Young Enterprise Danmark (2013), Impact of Entrepreneurship
Education in Denmark. 140 Entrepreneurship as a method is in the Danish study distinguished from more business start-up oriented
entrepreneurship education and includes the pupils being taught innovative thinking, developing and turning ideas into action and creating new activities.
0
10
20
30
40
50
60
70
80
2012 2009
The evidence-base
on
entrepreneurship education needs to be strengthened

61
students strengthen their entrepreneurial attitude and creative skills considerably more than otherwise comparable students who have not participated in entrepreneurship education, and that such education also leads to more students starting their own business.
Policy lessons The employment rate of recent graduates with at least upper secondary education stands at
75.7%, down from 82% in 2008. There is still a premium of tertiary education attainment over upper secondary education attainment but there is evidence of skills bottlenecks and mismatches, with 21% of people with tertiary qualifications active in jobs that are below their
qualifications. This calls for a better alignment of the supply and demand of skills and a higher labour market relevance of education and training systems.
The transition from school to work is a particular issue for students from upper secondary programmes in BG, IE, EL, ES, HR, IT, LV and RO – with employment rates below 60%. Students from vocational education and training programmes experience a better transition from education to work in Member States with developed work-based learning (e.g. DK, DE,
NL and AT). Work-based learning helps bring together the worlds of work and education.
Efforts to develop entrepreneurial skills are needed to support new business creation,
employee innovation within existing companies, to improve employability levels of the young and increase business creation. Only half of the EU population aged 15 years and above agree that their school education helped them to develop a sense of initiative and a sort of
entrepreneurial attitude. Improvements in the availability of internationally comparable data are needed to provide broader information on entrepreneurial self-efficacy and the impact of entrepreneurship education.

62
6. Upgrading skills through lifelong learning
6.1. Taking a closer look at the Survey of Adult Skills
In highlighting the challenge of skills supply, the 2012 Rethinking Education Communication141 recalled that "European education and training systems continue to fall short in providing the right skills for employability […]". Until now, evidence on the actual levels of key skills of the workforce
has been rather limited but the recent OECD Survey of Adult Skills (PIAAC)142, which was carried out with support from the European Commission, serves to close this gap. It provides comprehensive evidence on the levels of proficiency in 17 EU Member States143, plus other OECD
and partner countries, in the three key information processing skills of literacy, numeracy and problem solving in technology-rich environments.
Global performance of EU education systems On average, participating EU countries demonstrate similar performance to the US but slightly
worse than several non-EU OECD countries. Japan outperforms all other countries with its high share of performers at levels 3-5 and very few low performers. Large differences in the distribution of skills across participating EU countries exist. Three groups can be identified: (1) countries with high shares of top performing adults and low levels of low performers such as NL, FI and SE
(among which FI comes closest to Japan); (2) countries with varying patterns but whose results are not significantly different from the EU17 average, and (3) countries with few top performers and rather high shares of low performers such as ES and IT.
Figure 6.1. Share of the population 16 to 65 years-old at each level of proficiency in literacy
Source: Survey of Adult Skills (PIAAC). Notes: countries ordered by share of levels 1 and below combined. Missing: not taken the test.
In the domain of literacy (Figure 6.1), on average, one fifth of adults in the EU17 reaches at most proficiency level 1 out of 5144 (16% at level 1 and 4% below level 1). In the domain of numeracy
141 Rethinking Education: Investing in skills for better socio-economic outcomes (COM(2012) 669 final). 142 PIAAC is the Programme for the International Assessment of Adult Competencies. The Survey of Adult Skills directly
assesses the skills of about 5,000 individuals per participating country, representing the countries' working age population (16-65 year olds). The skills tested are literacy, numeracy and problem solving in technology-rich environments (solving problems in a computer environment). The survey also asks about the use of ICT at work and in everyday life, generic skills required at work, whether the skills and qualification match the work requirements and questions about e.g. education, work and the socio-economic background. The first round was carried out in 2011/2012 in 24 countries, among them 17 EU Member States, representing about 83% of the EU28 population. The
proficiency that respondents showed in the test is reported on a scale from 0 to 500 points, which is divided into "Skills levels" ("below 1" to "5" for literacy and numeracy; "below 1" to "3" for problem solving – see Table A.2 in the Annex). For more technical information see Volume II of the survey report: http://www.oecd.org/site/piaac.
143 Referred to in this section as "EU17": BE (Flanders), CZ, DK, DE, ES, EE, FR, IE, IT, CY, NL, AT, PL, SK, FI, SE and UK (England/Northern Ireland – 87% of the UK working age population). For FR, only limited results are available. As such, “EU16” refers to the same set of countries excluding FR. Other OECD countries: Australia, Canada, Japan, Korea, Norway, United States. The Russian Federation participated but no results are reported. "OECD" in this section refers to all participating OECD countries, unless stated differently.
144 See Table A.2 in the Annex for an explanation of the proficiency levels.
0%
10%
20%
30%
40%
50%
60%
70%
80%
90%
100%
Missing
Level 5
Level 4
Level 3
Level 2
Level 1
Below Level 1
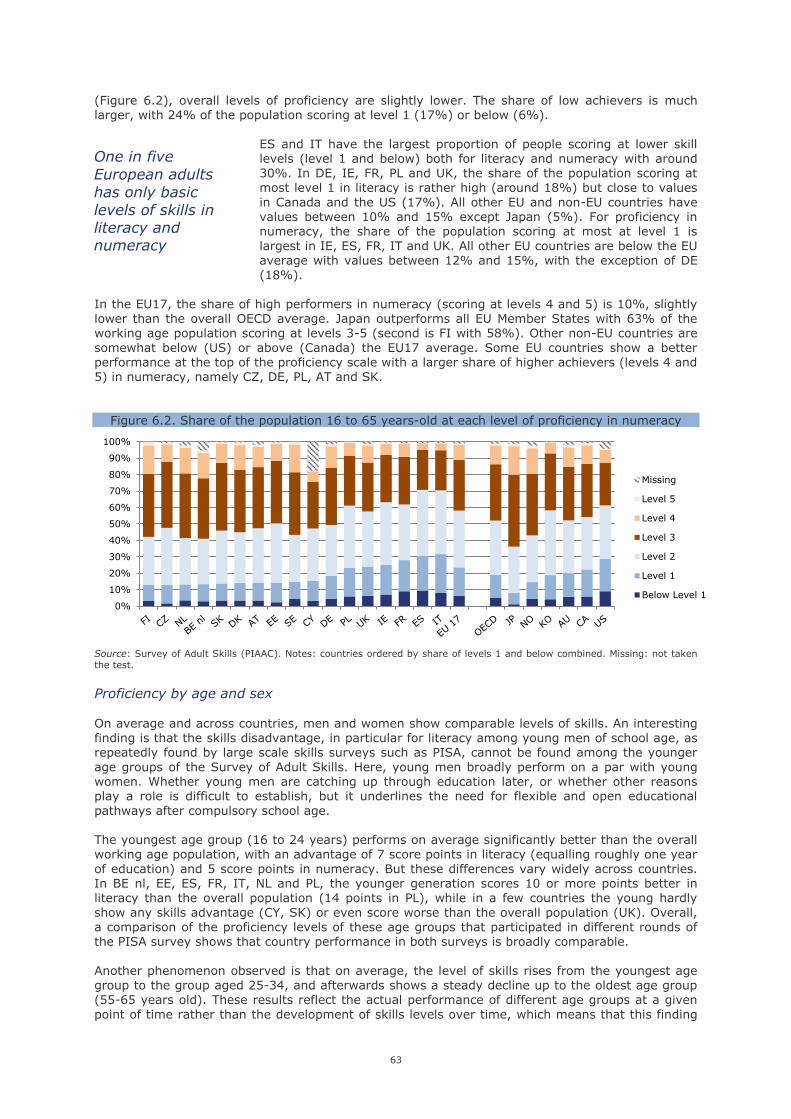
63
(Figure 6.2), overall levels of proficiency are slightly lower. The share of low achievers is much larger, with 24% of the population scoring at level 1 (17%) or below (6%).
ES and IT have the largest proportion of people scoring at lower skill levels (level 1 and below) both for literacy and numeracy with around 30%. In DE, IE, FR, PL and UK, the share of the population scoring at
most level 1 in literacy is rather high (around 18%) but close to values
in Canada and the US (17%). All other EU and non-EU countries have values between 10% and 15% except Japan (5%). For proficiency in numeracy, the share of the population scoring at most at level 1 is
largest in IE, ES, FR, IT and UK. All other EU countries are below the EU average with values between 12% and 15%, with the exception of DE (18%).
In the EU17, the share of high performers in numeracy (scoring at levels 4 and 5) is 10%, slightly lower than the overall OECD average. Japan outperforms all EU Member States with 63% of the working age population scoring at levels 3-5 (second is FI with 58%). Other non-EU countries are
somewhat below (US) or above (Canada) the EU17 average. Some EU countries show a better performance at the top of the proficiency scale with a larger share of higher achievers (levels 4 and 5) in numeracy, namely CZ, DE, PL, AT and SK.
Figure 6.2. Share of the population 16 to 65 years-old at each level of proficiency in numeracy
Source: Survey of Adult Skills (PIAAC). Notes: countries ordered by share of levels 1 and below combined. Missing: not taken the test.
Proficiency by age and sex
On average and across countries, men and women show comparable levels of skills. An interesting finding is that the skills disadvantage, in particular for literacy among young men of school age, as repeatedly found by large scale skills surveys such as PISA, cannot be found among the younger
age groups of the Survey of Adult Skills. Here, young men broadly perform on a par with young women. Whether young men are catching up through education later, or whether other reasons play a role is difficult to establish, but it underlines the need for flexible and open educational
pathways after compulsory school age. The youngest age group (16 to 24 years) performs on average significantly better than the overall working age population, with an advantage of 7 score points in literacy (equalling roughly one year
of education) and 5 score points in numeracy. But these differences vary widely across countries. In BE nl, EE, ES, FR, IT, NL and PL, the younger generation scores 10 or more points better in literacy than the overall population (14 points in PL), while in a few countries the young hardly
show any skills advantage (CY, SK) or even score worse than the overall population (UK). Overall,
a comparison of the proficiency levels of these age groups that participated in different rounds of the PISA survey shows that country performance in both surveys is broadly comparable.
Another phenomenon observed is that on average, the level of skills rises from the youngest age group to the group aged 25-34, and afterwards shows a steady decline up to the oldest age group (55-65 years old). These results reflect the actual performance of different age groups at a given
point of time rather than the development of skills levels over time, which means that this finding
0%
10%
20%
30%
40%
50%
60%
70%
80%
90%
100%
Missing
Level 5
Level 4
Level 3
Level 2
Level 1
Below Level 1
One in five
European adults
has only basic
levels of skills in literacy and numeracy

64
might point at two different explanations. Firstly, improvements in European education systems in recent decades might be equipping younger cohorts with better skills than the previous generations. Secondly, the lower proficiency for older cohorts might point to a decline in skills over
the working life, emphasising the importance of lifelong learning.
Proficiency of unemployed people
Those in employment have on average higher skills than the unemployed at EU level, by about half a proficiency level (17 points for literacy and 24 points for numeracy, equalling up to roughly 4
years of education). The gap is more pronounced in DE, SE and the UK for literacy (19, 30 and 26 points respectively) and for numeracy in the same countries (30, 32 and 33 points respectively) as well as in SK (27 points). In IE, ES, FR, IT and UK, youth unemployment rates are higher by 16
percentage points compared to people in the age bracket 25-74 (close to 30 percentage points higher in ES and IT). In these countries, a large share of young people (close to 20% or above) has low-skills in literacy or numeracy (i.e. at most at level 1).
Those in employment also have higher skills than inactive people at EU level. The gap is similar to that between employed and unemployed at EU level (17 points for literacy and 24 points for numeracy) but more pronounced in DK, NL, FI and SE (25 points or more for literacy and
numeracy) as well as in DE and ES (25 points for numeracy). In addition, the Survey shows that there is a substantial pool of highly skilled individuals who are out of the labour market (inactive) in some Member States. CZ, IT, PL and SK have large proportions of inactive people among the
high-skilled population (about 24%). This is below 15% in most of the other EU17 countries.
Impact of parental education and country of birth Parental education is almost as closely correlated to proficiency levels as educational attainment. Adults with highly educated parents reach on average higher scores than those with a less
advantageous socio-economic background. However, the strength of the association between skills proficiency and parental education varies widely across countries. Within the EU16 (EU17 less FR), it is strongest in DE and PL, whereas it is weakest in EE, CY and SE.
In all participating countries, foreign-born adults score lower than native-born adults, with the difference being on average half a proficiency level (25 points, which equates to about 4 years of education) in literacy. The differences are above EU average in some countries with large foreign-
born populations such as BE (FL), DK, DE, FR, NL and SE. The disadvantage for those who are born elsewhere is slightly more pronounced for numeracy with a 29 point difference. The wide variation in the proficiency scores of foreign-born adults across countries not only reflects the mere skills,
but also the composition of this group and the immigration history of the countries.
Skills and educational attainment across countries For the first time, the Survey of Adult Skills allows linking educational attainment of individuals, i.e. the formal
outcome of education, with their proficiency in key information processing skills like literacy and numeracy. This makes it possible to compare average proficiency
levels by education attainment within a given country, but also to compare proficiency levels across different countries, looking at comparable levels of education attainment (Figure 6.3).
When comparing results in literacy across countries, young tertiary graduates in FI, NL, SE, BE nl, AT, EE and DE score amongst the highest of any participating country in the survey, with tertiary
degree holders in FI reaching the lower end of level 4. Upper secondary graduates on average (EU16) perform at the lower end of level 3, scoring 20 points lower (equalling roughly three years of education) than tertiary graduates.
It is a striking finding that people with lower levels of education attainment in some countries outperform people with higher formal qualifications in other countries. For example, upper secondary graduates in FI and NL score better than tertiary graduates in IE, ES, IT, CY, SK and UK.
Literacy and numeracy skills
of graduates with comparable
degrees vary strongly across
countries, raising questions about the underlying causes

65
Comparing the skills levels of young people from different levels of education within countries also reveals large discrepancies. In SE, IT, AT and PL, tertiary graduates in literacy perform half a proficiency level better than upper secondary graduates (25 score points), with 32 points in BE nl.
In ES and DK, tertiary graduates outperform upper secondary graduates by no more than 12 score points.
Figure 6.3. Average proficiency in literacy (16-29 year-olds) by educational attainment
Source: Survey of Adult Skills (PIAAC). Note: countries are ordered by average score at tertiary education level.
Differences in performance between upper and lower secondary graduates within countries are
significantly larger. However, in PL almost no difference exists (upper secondary graduates performing only 2 points better); and in CZ, IE, CY and IT the difference is no larger than 14 points (roughly equalling two years of education). Large differences are found in ES, NL, AT and SE, where people with at most lower secondary education perform at least half a proficiency level (25
score points) below upper secondary graduates. The largest gap is found in the UK, where the skills gap between lower and upper secondary education is almost one proficiency level (45 points).
The survey reveals significant differences in the levels of skills at certain levels of education attainment across countries and within countries. However, it should be stressed that the results reflect an interplay of factors. Success in formal education opens up opportunities for individuals to
access high skill jobs, which in turn help maintain and develop high skills levels. And there are other factors that might override the impact of education, like work experience, long unemployment spells or non-formal learning. Nevertheless, the analysis does provide relevant information for the monitoring of education and training systems in the EU, particularly on the
performance of secondary and tertiary education systems and lifelong learning policies.
Proficiency in problem solving in technology rich environments
Across the EU17, 13% of the working age population either lacked any computer experience or had such low levels of proficiency that
they could not take the computer based test (Figure 6.4). This share ranges from less than 10% in DK, NL, FI, and SE to more than 20% in ES, CY, IT, PL and SK. On average across EU
countries145, 43% only showed basic levels of proficiency (scoring at level 1 or below). At the top end, in NL, FI and SE, more than 40% showed high proficiency (40% or more at levels 2 and 3),
outperforming all non-EU countries except NO.
Among the younger generation of 16 to 24 year-olds, the share of those with very low problem
solving skills (9%) or very little to no computer experience (4%) is much smaller than in the
overall population. However, compared to the overall working age population, roughly the same share of young adults (around 30%) has only low levels of proficiency in problem solving (level 1).
145 In ES, FR, CY and IT the module problem solving in technology-rich environments (ICT) was not applied. Computer
experience was also measured by the other survey tests.
200
225
250
275
300
325
350
FI NL SE BE nl AT EE DE CZ PL DK SK IE IT UK ES CY EU16
Mean s
core
poin
ts
Lower secondary Upper secondary Tertiary
Level 3
Level 2
Level 4
Level 1
High literacy and ICT
use are strongly connected, making
poor problem solving
skills of one fourth of
Europe's workforce a concern

66
Figure 6.4. Share of the population 16 to 65 years-old at each level of proficiency in problem solving in technology rich environments (%)
Source: Survey of Adult Skills (PIAAC). Notes: countries are ordered by share of 'Failed ICT core test/No experience'. Missing: test not taken. 'Opted out': participants chose the paper based version of test over the computer based version.
The survey also reveals a strong relationship between ICT use at or outside work and literacy proficiency. On average in the EU and rather consistently across countries, those who report the
strongest use of ICT at the workplace score about 14 points higher on the literacy scale than those who use ICT least at the workplace, independently of other factors such as age, education or sex146; a proficiency difference that corresponds to roughly two years of education.
6.2. Raising adult participation in lifelong learning Maintaining and upgrading skills through continued learning after initial education is crucial in light
of structural changes and technical developments, in order to stay employed, advance in one’s
career or to re-enter the labour market147. For these reasons, the ET 2020148 benchmark for adult participation in lifelong learning149 is 15% by 2020 - a target set “with a view to increasing the
participation of adults in lifelong learning, particularly that of the low-skilled”150. Indeed, whether looking at the average skill levels or the highest level of education attained151, continued learning is a necessity in the majority of Member States.
Lifelong learning is far from being a reality for most European citizens, which caused EU Member States to take action152. Between 2009 and 2012, the EU adult participation rate in lifelong learning
went down 0.3 percentage points – an average annual decrease of 1.1% – while in fact it should have increased on average 4.4% per year in order to reach the benchmark of 15% by 2020 (Figure 6.5).
Though part of this trend, for instance in PT and UK, is due to on-going harmonisation of the measurement of formal and non-formal education and training153 across Europe, neither current performance nor recent change meet the necessary requirements. In light of this, country-specific
recommendations on the topic of lifelong learning have been issued for a number of countries (BE, EE, ES, FI, FR, LU, PL, RO and SI).
146 Differences are adjusted for background characteristics such as age, education attainment, sex, immigration and
language background, etc. 147 See, for example, European Commission, Directorate-General for Research & Innovation (2013), Adult and continuing
education in Europe. Using public policy to secure a growth in skills (http://ec.europa.eu/research/social-sciences/pdf/kina25943enc.pdf).
148 ET 2020: A strategic framework for European cooperation in education and training (2009/C 119/02). 149 The percentage of the population aged 25-64 participating in formal or non-formal education and training during the
4 weeks prior to the EU Labour Force Survey. The ET 2020 Framework emphasises explicitly that benefit can also be drawn from the information on adult participation in lifelong learning gathered through the Adult Education Survey (See Annex 1 in 2009/C 119/02).
150 2009/C 119/02, Annex 1. 151 Across the EU, one in four individuals aged 25 to 64 has at most a lower secondary education attainment; more than
40% in PT, MT, ES and IT. See Figure A.1 in the Annex for a full distribution of education attainment across Europe. 152 OJ 2011/C 372/01. 153 Formal, non-formal and informal learning are defined in the Eurostat Classification of learning activities:
http://epp.eurostat.ec.europa.eu/portal/page/portal/product_details/publication?p_product_code=KS-BF-06-002.
0
10
20
30
40
50
60
70
80
90
100 Missing
Opted out
Level 3
Level 2
Level 1
Below 1
Failed ICT/Noexperience
Progress in adult
learning is lagging far behind the EU's commitment
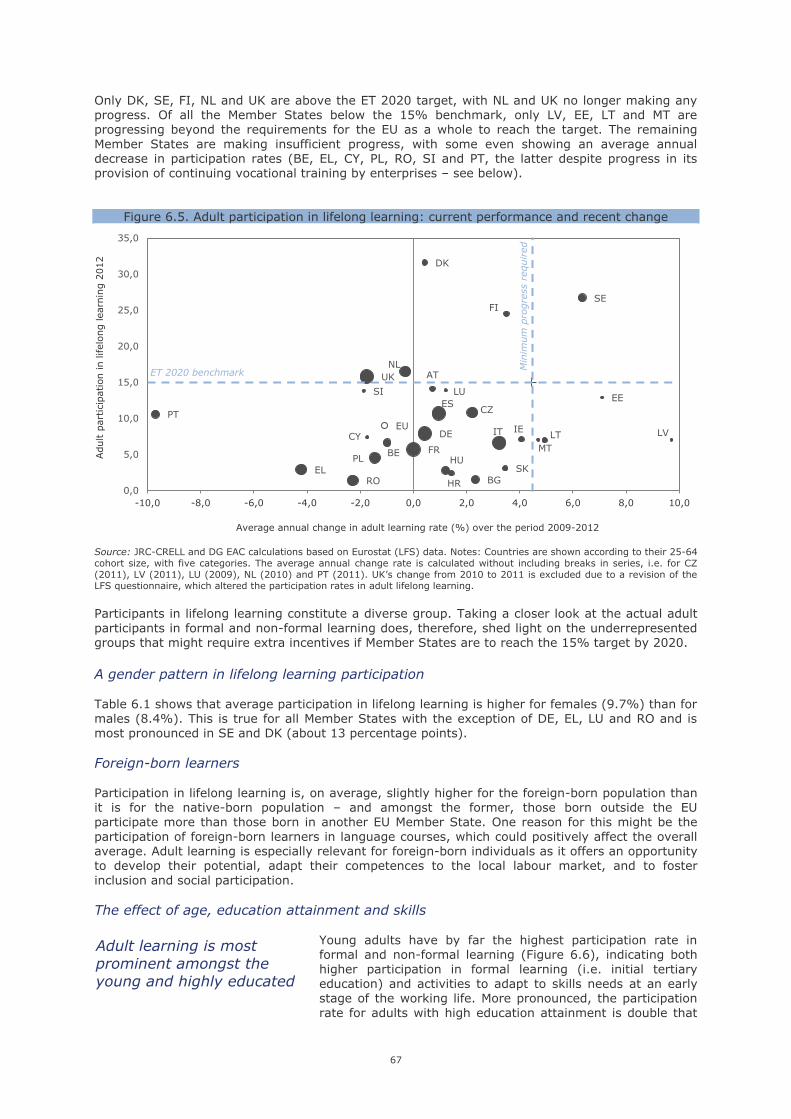
67
Only DK, SE, FI, NL and UK are above the ET 2020 target, with NL and UK no longer making any progress. Of all the Member States below the 15% benchmark, only LV, EE, LT and MT are progressing beyond the requirements for the EU as a whole to reach the target. The remaining
Member States are making insufficient progress, with some even showing an average annual decrease in participation rates (BE, EL, CY, PL, RO, SI and PT, the latter despite progress in its provision of continuing vocational training by enterprises – see below).
Figure 6.5. Adult participation in lifelong learning: current performance and recent change
Source: JRC-CRELL and DG EAC calculations based on Eurostat (LFS) data. Notes: Countries are shown according to their 25-64
cohort size, with five categories. The average annual change rate is calculated without including breaks in series, i.e. for CZ (2011), LV (2011), LU (2009), NL (2010) and PT (2011). UK’s change from 2010 to 2011 is excluded due to a revision of the LFS questionnaire, which altered the participation rates in adult lifelong learning.
Participants in lifelong learning constitute a diverse group. Taking a closer look at the actual adult
participants in formal and non-formal learning does, therefore, shed light on the underrepresented groups that might require extra incentives if Member States are to reach the 15% target by 2020.
A gender pattern in lifelong learning participation
Table 6.1 shows that average participation in lifelong learning is higher for females (9.7%) than for males (8.4%). This is true for all Member States with the exception of DE, EL, LU and RO and is most pronounced in SE and DK (about 13 percentage points).
Foreign-born learners
Participation in lifelong learning is, on average, slightly higher for the foreign-born population than it is for the native-born population – and amongst the former, those born outside the EU participate more than those born in another EU Member State. One reason for this might be the
participation of foreign-born learners in language courses, which could positively affect the overall average. Adult learning is especially relevant for foreign-born individuals as it offers an opportunity to develop their potential, adapt their competences to the local labour market, and to foster
inclusion and social participation.
The effect of age, education attainment and skills
Young adults have by far the highest participation rate in formal and non-formal learning (Figure 6.6), indicating both
higher participation in formal learning (i.e. initial tertiary education) and activities to adapt to skills needs at an early stage of the working life. More pronounced, the participation
rate for adults with high education attainment is double that
LU
LT
MT
EE
LV
SI
FI
SK
DK
IE
BG
SE
PT
AT
HU EL
NL
ES
BE
RO
DE
FR
UK
IT
PL
CY EU
CZ
HR 0,0
5,0
10,0
15,0
20,0
25,0
30,0
35,0
-10,0 -8,0 -6,0 -4,0 -2,0 0,0 2,0 4,0 6,0 8,0 10,0
Min
imum
pro
gre
ss r
equired
ET 2020 benchmark
Adult p
art
icip
ation in lifelo
ng learn
ing 2
012
Average annual change in adult learning rate (%) over the period 2009-2012
Adult learning is most
prominent amongst the young and highly educated

68
of medium-educated and four times that of low-educated adults. The latter illustrates the use of lifelong learning programmes to get ahead rather than to get by, which still does not match the emphasis on the low-skilled as set out in the ET 2020 strategic framework.
Table 6.1. Adult participation in lifelong learning by sex and country of birth (%)
2009 2012
Total Total Males Females Native-born
Foreign-born
EU Non EU Sub-total
EU 28 9.2 9.0p 8.3 9.7 8.9 9.8 11.0 10.6
Belgium 6.8 6.6 6.2 6.9 6.1 8.0 9.1 8.7
Bulgaria 1.4 1.5 1.4 1.5 1.5 : : :
Czech Republic 6.8 10.8 10.5 11.1 10.9 8.8 6.4 7.9
Denmark 31.2 31.6 25.4 37.8 31.6 30.2 32.1 31.5
Germany 7.8 7.9 8.0 7.8 8.2 : : :
Estonia 10.5 12.9 10.6 14.9 13.8 : 6.6 7.0
Ireland 6.3 7.1 6.7 7.4 6.7 6.9 12.3 8.5
Greece 3.3 2.9 3.1 2.7 3.1 (2.8) 1.3 1.6
Spain 10.4 10.7 9.9 11.6 11.2 7.2 9.2 8.6
France 5.7 5.7 5.4 6.0 5.8 4.5 5.1 5.0
Croatia 2.3 2.4 2.3 2.6 2.4 : (2.1) (2.3)
Italy 6.0 6.6 6.1 7.0 7.0 3.3 3.6 3.5
Cyprus 7.8 7.4 7.0 7.8 8.1 5.1 5.8 5.4
Latvia 5.3 7.0 6.0 7.9 7.3 : 5.1 5.2
Lithuania 4.5 5.2 4.3 5.9 5.2 : : :
Luxembourg 13.4b 13.9 14 13.8 15.6 11.7 15.5 12.4
Hungary 2.7 2.8 2.6 3.0 2.8 (4.3) : 4.2
Malta 6.1 7.0 6.7 7.4 7.1 : (7.9) 6.1
Netherlands 17.0 16.5p 16.0 17.0 16.2 18.6 17.7 17.9
Austria 13.8 14.1 13.0 15.2 14.7 16.4 8.8 11.7
Poland 4.7 4.5p 3.8 5.1 4.4 : : :
Portugal 6.5 10.6 10.3 10.9 10.2 12.0 14.8 14.1
Romania 1.5 1.4 1.4 1.3 1.4 : : :
Slovenia 14.6 13.8 11.5 16.1 14.6 (8.3) 5.7 5.9
Slovakia 2.8 3.1 2.7 3.5 3.0 : : :
Finland 22.1 24.5 20.7 28.4 24.3 25.7 29.7 28.0
Sweden 22.2p 26.7 20.0 33.5 26.7 22.9 28.0 26.5
United Kingdom 20.1 15.8 14.3 17.4 15.3 16.1 20.0 18.7
Montenegro : : : : : : : :
Iceland 25.1 27.3 23.5 31.0 28.1 23.8 14.7 20.5
MK 3.3 4.0 4.0 3.9 : : : :
Serbia : : : : : : : :
Turkey 2.3 3.2 3.2 3.1 : : : :
Liechtenstein : : : : : : : :
Norway 18.1 20.0 18.8 21.3 19.7 18.9 23.3 21.5
Switzerland 23.9i 29.9 31.1 28.7 32.9 26.2 21.2 24.0
Source: Eurostat (LFS online data code trng_lfse_01). Notes: Data cover formal and non-formal learning activities alike. Intermediate breaks in time series for the Czech Republic (2011), Latvia (2011), the Netherlands (2010), Luxembourg (2009) and Portugal (2011) and changes to the methodology in the UK (2011). Notes: "b" = break in time series; "p" = provisional; "()" = Data lack reliability due to small sample size; ":" = data either not available or not reliable due to very small sample size.
The Survey of Adult Skills (see section 6.1) confirms that those with higher skills have higher access rates to education and training154. An individual with high skills is, on average, more than five times as likely to attend adult learning activities compared to someone with
skills at the lowest level (below level 1). In DE, ES, IT, AT and PL, there is 5 to 7 times less chance for low-skilled workers to participate in job-related learning compared to high-skilled people, with the
difference being largest in SK. In other words, 20% of the EU population aged 16-65 (those with skills at level 1 and below) is caught in a low skills trap, which means that they are unlikely to leave
154 Based on one year preceding the interview. Due to survey design and time of data collection, results slightly differ
from those of the Adult Education Survey.
With little
likelihood of continuing
learning, adults
with low skills may
be caught in a "low skills trap"

69
the group of low-skilled workers. A key policy challenge is to help low-skilled adults to escape this trap.
Job-related learning Data on individuals from latest Adult Education Survey (AES) 2011 and data on enterprises from
the Continuing Vocational Training Survey (CVTS) 2010 reveal complementary evidence on adult learning with a focus on access to job-related education and training155 over a period of one year.
Figure 6.6. Adult participation in lifelong learning by education level and age (%)
Source: Eurostat (LFS online data code trng_lfse_01 and trng_lfse_03).
A closer look at adult learning activities based on the AES shows that on average the access rate in non-formal training is fifteen times that in
formal training (38.4% as opposed to 2.4%), with strong variations across
countries. While more than half (52.7%) of the non-formal activities were sponsored by enterprises, 28.4% was otherwise job-related, meaning that in total four out of five activities were job-related (81.4%). This is a
consistent phenomenon across Europe, ranging from slightly above 70% in EL and SI to more than 90% in BG, MT and SK.
High non-formal access rates (close to 50% or above) in a country tend to correspond with frequent job-related activities at the workplace (two thirds or more), which is the case in DK, DE, FR, NL, FI and SE. In BG, ES, IT, MT, SK and UK, job-related activities outside the workplace were predominant. They represented about half of more of all non-formal activities, much more than the
EU average. Access rates to non-formal learning were below the EU average in these countries (close to 34%; 24% in BG) except in SK and UK (close to 40%).
More generally, there are still large gaps in access rates by employment status. 45.2% of employed people aged 25-64 had a non-formal learning activity, almost double the rate of
unemployed people (22.9%) according to the AES. This gap was even larger in BG, LT, HU, PL and SK; only one third of the access rate of employed people. In these countries, as well as in EL, less than 15% of the unemployed received training in 2011
(17% in HU). As regards access to formal learning, the employed and unemployed had about the same opportunities in 2011; close to 6% at EU level, with 16% or more in DK, PT, SE and UK.
155 The analysis in this section covers only formal and non-formal learning, in line with the ET 2020 benchmark on adult
learning. This excludes informal learning; any intentional learning resulting from activities related to work, family or leisure that is not organised or structured in terms of objectives, time or learning support. Informal learning is, however, an increasingly important dimension of continued learning. With the increasing availability of digital devices and ICT-based learning resources, informal learning becomes more important for adult lifelong learning policies.
0
2
4
6
8
10
12
14
16
18
Low education(ISCED 1-2)
Mediumeducation
(ISCED 3-4)
High education(ISCED 5-6)
25-34 years 35-44 years 45-54 years 55-64 years
2012 Decrease compared to 2009
Education level Age group
Four out of five
adult learning
activities in Europe are job-related
Only 1 in 5
unemployed had a non-formal learning
activity in 2011 at EU
level; no more than 1
in 7 in BG, EL, LT, HU, PL and SK
70
Policy lessons New evidence from the Survey of Adult Skills shows that low achievement in literacy and
numeracy is alarming for many Member States. Across the seventeen EU Member States
participating in the survey, 20% of 16 to 65 year-olds is unable to exceed a basic level of literacy and 24% is unable to do so in numeracy.
Striking differences in literacy and numeracy proficiency of young adults with comparable educational attainment across countries raise questions about the underlying causes.
These results underline the need for lifelong learning. However, skills levels and participation in adult learning are strongly connected in many countries, confirming that lifelong learning is
still not profited from by those who would benefit from it most. Adult participation in lifelong learning stands at only 9% and is most prevalent amongst the young and highly educated.
On average, two thirds of enterprises in the EU provide continuing vocational training. It is less than a third in BG, EL, PL and RO. Only one in five unemployed had a non-formal learning
activity in 2011; no more than one in seven in BG, EL, LT, HU, PL and SK.
Engagement of enterprises in continuing vocational training (CVT)
Participation in job-related training is dependent on learning opportunities at the workplace (i.e. during working time or paid at least partially by enterprises), which is reflected in the latest CVTS results156. On average two thirds of enterprises in the EU provided continuing vocational training in 2010. It was less than a third in BG, EL, PL and RO, and, conversely, 70% or more in BE, CZ, DE,
ES, FR, CY, LU, NL, AT, FI, SE and UK. In BG, PL and RO, a high share of employees had access to
CVT (above EU average), while a comparatively low share of enterprises offered training, pointing at an active role of larger enterprises in CVT in these countries. In EL, HR, LT and
HU the share of enterprises providing training and the share of employees having access to CVT within these enterprises was significantly below average. Looking at the intensity of CVT, these countries were close to the EU average (EL, HR) or
above (LT, HU).
Limited average hours per participant (15 hours or less per year) was recorded in CZ, ES and LV.
MT, PT and SI were the countries with the highest number of training hours per year (37 to 42). Costs of CVT activities represented 0.9% of labour costs in 2010 on average in the EU, with more
than 1% in FR, HU, NL and MT157. This includes direct costs incurred for the organisation of courses as well as contributions paid to mutual funds and payments from such funds or other financial subsidies. On average for all enterprises providing training or not, average contributions were higher than average subsidies in FR, HU and RO (close to 0.5% of labour costs). Furthermore,
about one third of enterprises reported that public measures, mostly of financial nature, had a direct impact on their CVT plans.
Across the EU, no more than 40% of enterprises declared having a training plan or budget in 2010. In IT, HU, LV, LT, MT and RO more than 35% and in BG and PL more than 50% of enterprises reported that they did not provide any CVT because the skills of the employees matched the
current needs of the enterprise. These results underline that CVT still has to be promoted further and that a solid assessment of future changes in skills needs is required.
156 The Continuing Vocational Training Survey (CVTS 2010) reports CVT activities in the past 12 months. 157 http://epp.eurostat.ec.europa.eu/statistics_explained/index.php/Continuing_vocational_training_statistics.
Two thirds of European
enterprises provide
continuing vocational
training, with huge
variations across countries, ranging from 31% to 87%

71
Annex
Table A.1. Population trends by five-year age groups
Less than 5 years old 5 to 14 years old 15 to 24 years old 25 to 34 years old
2010 2015 2020 2010 2015 2020 2010 2015 2020 2010 2015 2020
EU28 4.6 : : -4.1 : : -3.6 : : -1.5 : :
EU27 4.6 0.8 -2.5 -4.1 1.5 2.6 -3.5 -6.8 -4.2 -1.6 -1.6 -3.6
BE 9.4 4.8 2.0 -1.4 4.7 6.2 4.0 0.6 -1.9 1.1 3.5 2.5
BG 10.8 1.3 -11.7 -11.2 6.5 4.6 -12.2 -21.7 -11.9 -2.7 -7.4 -13.4
CZ 21.2 2.0 -6.6 -12.4 12.9 10.9 -3.6 -14.8 -11.6 -1.4 -10.3 -4.8
DK -0.6 -4.0 1.2 -2.2 -1.6 -1.6 13.5 4.6 -2.2 -9.0 -1.2 8.8
DE -6.7 -2.7 -0.7 -7.9 -6.8 -4.0 -4.4 -8.8 -6.5 -3.2 3.2 -3.7
EE 17.2 2.6 -5.8 -11.6 11.3 9.2 -10.4 -24.2 -12.4 4.0 6.3 -10.0
IE 18.9 3.9 -8.0 8.4 12.2 9.5 -11.9 -6.9 14.5 14.9 -14.0 -20.2
EL 9.9 0.8 -7.4 -2.4 5.9 5.4 -13.3 -5.9 -2.0 -4.0 -13.1 -13.0
ES 13.3 -3.3 -9.3 8.4 10.0 3.2 -8.0 -5.6 4.3 0.2 -16.9 -11.4
FR 2.0 1.4 -0.6 2.9 2.0 1.7 -1.8 -2.4 1.1 -3.5 3.8 -1.0
HR 4.1 : : -8.6 : : -8.3 : : 3.5 : :
IT 4.1 -2.3 -4.7 2.0 3.6 0.5 -0.2 0.3 0.7 -10.0 -7.0 -0.4
CY 12.0 13.4 5.3 -7.6 -1.7 11.1 10.9 -7.3 -11.3 16.3 5.3 -0.6
LV 13.5 -5.2 -7.2 -19.0 8.7 3.8 -9.2 -27.7 -19.2 2.3 6.2 -8.8
LT 6.2 10.2 -3.6 -22.2 -6.8 9.0 -3.2 -18.8 -21.9 -1.9 6.2 -2.5
LU 2.6 7.3 4.4 4.4 1.5 3.3 10.3 8.6 1.9 8.9 6.4 3.0
HU 2.4 -2.3 -5.1 -10.4 -1.2 -0.1 -5.2 -9.4 -10.1 -2.9 -11.0 -3.7
MT 1.2 1.7 -1.2 -13.3 -7.2 2.0 -1.1 -8.8 -13.5 7.7 -0.3 -1.1
NL -8.5 -0.5 1.2 -0.5 -2.3 -4.2 4.1 1.5 -0.5 -8.5 4.1 4.0
AT -1.2 -1.4 1.6 -7.9 -4.8 -1.0 1.2 -2.2 -6.7 -1.4 2.3 2.0
PL 8.8 6.6 -6.4 -16.4 -2.5 7.8 -12.7 -16.7 -16.4 10.2 -0.6 -11.2
PT -6.1 -7.9 -6.4 0.3 -1.4 -6.2 -11.0 -3.4 1.4 -3.9 -12.1 -9.0
RO 2.2 -2.7 -7.9 -8.8 -0.9 -0.1 -11.1 -20.8 -8.5 -2.3 -1.6 -10.7
SI 14.5 8.2 -5.2 -6.3 7.3 10.9 -11.3 -12.2 -6.2 3.7 -3.2 -10.5
SK 7.8 7.5 -5.6 -16.4 -1.5 7.9 -9.3 -15.5 -15.8 4.8 -4.4 -8.1
FI 5.1 4.5 1.5 -6.4 1.0 4.7 1.2 -1.6 -6.2 7.1 1.2 1.0
SE 12.9 7.3 5.1 -8.8 8.9 8.6 13.4 -4.6 -9.5 -0.6 10.0 9.8
UK 12.0 5.4 3.0 -5.5 4.0 8.6 5.2 -3.1 -5.0 1.6 10.0 3.8
Source: Eurostat (Demographic statistics; online data code: demo_pjangroup and proj_10c2150p).
Figure A.1. The distribution of education attainment for individuals aged 25-64 (2012)
Source: Eurostat (LFS).
0%
10%
20%
30%
40%
50%
60%
70%
80%
90%
100%
PT MT ES IT EL BE FR NL EU IE RO CY DK UK LU HR BG HU SE AT FI SI DE LV PL EE SK CZ LT TR MK IS NO CH
Lower secondary education Upper secondary education Tertiary education

72
Table A.2. Survey of Adult Skills - Brief description of proficiency levels and score points
Level Score range Literacy Numeracy
5 500 to 376 Adults are able to e.g. perform tasks that involve searching for and integrating information across multiple, dense texts;
constructing syntheses of similar and contrasting ideas or points of view, or evaluating evidence and arguments.
Adults can e.g. understand complex representations, and abstract and formal mathematical and statistical ideas, sometimes embedded in complex texts. They
can integrate several types of mathematical information where considerable translation is required.
4 375 to 326 Adults can perform multiple-step operations to integrate, interpret, or synthesise information from complex or lengthy continuous, non-continuous, mixed, or multiple-type texts that involve conditional and/or competing information.
Adults understand a broad range of mathematical information that may be complex, abstract or embedded in unfamiliar contexts. They can perform tasks involving multiple steps and select appropriate problem-solving strategies and processes.
3 325 to 276 Adults can understand and respond to dense or lengthy texts, including continuous, non-continuous or multiple pages. They understand text structures and rhetorical devices and can identify, interpret or evaluate one or more pieces of information and make appropriate inferences.
Adults can complete tasks that require an understanding of mathematical information that may be less explicit, embedded in contexts that are not always familiar, and represented in more complex ways. They can perform tasks requiring several steps and that may involve a choice of problem-solving strategies.
2 275 to 226 Adults can integrate two or more pieces of information based on criteria, compare and contrast or reason about information and make low-level inferences. They can navigate within digital texts to access and identify information from various parts of a document.
Adults can perform tasks that require identifying and acting upon mathematical information and ideas embedded in a range of common contexts where the mathematical content is fairly explicit or visual with relatively few distractors. The tasks may require applying two or more steps.
1 225 to 176 Adults can read relatively short digital or print continuous, non-continuous, or mixed texts to locate a single piece of information, which is identical to or synonymous with the information given in the question or directive.
Adults at Level 1 can complete tasks involving basic mathematical processes in common, concrete contexts where the mathematical content is explicit with little text and minimal distractors. They can perform one-step or simple processes involving e.g. counting, sorting and basic arithmetic operations.
Below 1 Below 176
Individuals can read brief texts on familiar topics and locate a single piece of specific information identical in form to information in the question or directive. They are not required to understand the structure of sentences and only basic vocabulary knowledge is required.
Adults can only cope with very simple tasks set in concrete, familiar contexts where the mathematical content is explicit and that require only simple processes such as counting; sorting; performing basic arithmetic operations with whole numbers or money.
Level Score range Problem solving in technology rich environments
3 500 to 340 Adults complete tasks involving multiple applications, a large number of steps, impasses, and the discovery and use of ad hoc commands in a novel environment.
2 340 to 291 Adults can complete problems that have explicit criteria for success, a small number of applications, and several steps and operators. They can handle unexpected outcomes or impasses.
1 290 to 241 Adults can complete tasks in which the goal is explicitly stated and for which the necessary operations are performed in a familiar environment. They can solve problems whose solutions involve a small number of steps.
Below 1 Below 241 Tasks are based on well-defined problems involving the use of only one function within a generic interface to meet one explicit criterion. Few steps are required and no sub-goal has to be generated.
Failed ICT core
- Adults had prior computer experience but failed the ICT core test, which assesses basic ICT skills. Therefore, they did not take part in computer-based assessment, but took the paper-based version of the assessment.
No computer experience
- Adults reported having no prior computer experience; therefore, they took the paper-based version of the assessment, which does not include the problem solving in technology-rich environment domain.
Opted out - Adults in this category opted to take the paper-based test without first taking the ICT core
assessment, even if they reported some prior experience with computers.
Source: OECD (2013), International report on the Survey of Adult Skills, Volume II.


