16
Education Choice and Competition Index 2016 Summary and Commentary Grover J. (Russ) Whitehurst March 2017

Education Choice and Competition Index 2016
Summary and Commentary
Grover J. (Russ) WhitehurstMarch 2017

2Education Choice and Competition Index 2016
IntroductionThe 2016 Education Choice and Competition Index (ECCI) is the fifth release of an annual compilation of data on the condition of K-12 school choice in the geographical areas served by the nation’s 100 largest school districts. The ECCI captures information on:
• The extent of choice, including the availability and mix of:
• traditional public schools• magnet schools• charter schools• affordable private schools• online education
• The characteristics of the process by which parents and students choose schools, measured against an ideal in which there is:
• no default (everyone must choose)• a common application• rich and valid information on school
performance (including test results that incorporate student academic growth and are comparable across all schools)
• clear presentation of information (including support for less educated parents)
• an assignment algorithm that maximizes the match between the preferences expressed by parents for their children and the resulting school assignments for students
• The degree to which district funding and management processes favor the growth of popular schools at the expense of unpopular schools, including:
• weighted student-based funding in which a high proportion of the total local, state, and federal funding follows students to their schools of choice
• processes for closing unpopular schools
• The availability of subsidies for the costs of choice for poor families, particularly for transportation

3Education Choice and Competition Index 2016
There would be no reason for the ECCI if the traditional school district model of delivery of public education was the monolith that it represented until recently. In the traditional district model that completely dominated public education through the end of the 20th century, publicly-funded education for each state was provided entirely by school districts governed by elected school boards. Each district had an exclusive franchise to provide education services within its geographical boundaries. Within their boundaries, districts managed individual schools that themselves were organized as exclusive franchises within their own geographical student assignment zones.1
The upshot of the traditional system was that parents availing themselves of public education for their children had no choice of where their children would go to school given their place of residence. A family moving to a home in a new district or changing their place of residence within their existing district or planning for their child to start school could consult a map to determine within which school’s boundaries their home was found and know with virtual certainty that the school their child would attend would be the one in whose attendance zone they lived.
This model is still prevalent and has many advocates, certainly including the unions that represent adults whose job security and future prospects are most secure in the traditional district model. As Randi
Weingarten, president of the American Federation of Teachers, recently put it, the nation can either “provide all families with access to great neighborhood public schools” or promote “dangerous, destructive approaches…to undermine and privatize public education.”2 So posed, the choice of policymakers is between the traditional school district model and destructive alternatives.
There is no question that alternatives to the traditional school district model are destructive of the traditional school district model. Whether they are harmful, neutral, or helpful to students, families, and the nation is, in the end, an empirical question. Or, rather, it is a series of empirical questions with likely different answers that are conditional on the particular alternatives in play; their place in the overall system in which students are educated; the characteristics of the students being educated; the backgrounds and training of the teachers involved; the curriculum and mission of a school; and local political, cultural, and economic circumstances. In short, the traditional district model may sometimes be the best delivery mechanism and sometimes not. What works best for whom under what circumstances is not vouched safe by knowing whether parents exercised school choice or had their child assigned to a neighborhood school.
The ECCI is not designed to answer causal questions about what system or education delivery mechanism works best. Rather, it

4Education Choice and Competition Index 2016
describes what is happening on the ground and ranks large districts on the degree and quality of the environment they provide for parents who want to choose the schools their children attend.
But descriptive information can have implications for policy and practice even though it does not support strong causal conclusions. For example, evidence that street flooding at high tide is increasing in Miami is actionable without knowing whether the changes are due to rising sea levels, subsidence of land, changes in the gulf stream, or some combination of these and other factors.3 And just as a graph showing a rising frequency of high tide flooding in Miami does not stand alone in helping policymakers decide what actions they should consider, so too the interpretation of the descriptive information on school choice captured by the ECCI is aided by other research and sources of information.
In that context, this report is arranged in two parts. The first presents findings from the 2016 ECCI. In the second part, I draw lessons from trends in the ECCI and from related research. Those lessons, which are my interpretations of the contextualized findings from the ECCI, are intended for policymakers and others concerned with the future of school choice in the U.S.
Highlights of resultsThe ECCI can be accessed and utilized most powerfully through the interactive web site, which allows a variety of customizable views of the data and provides definitions and details for each of the multi-faceted dimensions on which geographical areas are measured and scored. This report highlights major findings.
Note that the ECCI provides scores for the geographical area (usually a city or county but sometimes a portion of a city or county) that is coterminous with the boundaries of the public school district identified in parentheses in the tables that follow. Characteristics of the district itself as an administrative entity, e.g., whether it allows parents to choose among traditional public schools, play a dominant role in the score that is obtained. But factors that are not under the control of the district also contribute to the score, e.g., the availability of affordable private schools; the possibility for taking online courses provide by a state-sanctioned entity; a public transportation system that makes it possible for students without private transportation to attend a school at a distance from their home. Thus, the ECCI addresses the question of what the environment for school choice is like in, for instance, Washington, DC, not just the question of the degree to which the policies and practices of the District of Columbia Public Schools support school choice. We subsequently use the shorthand of “districts” to refer to the geographical/political units being scored.
5Education Choice and Competition Index 2016
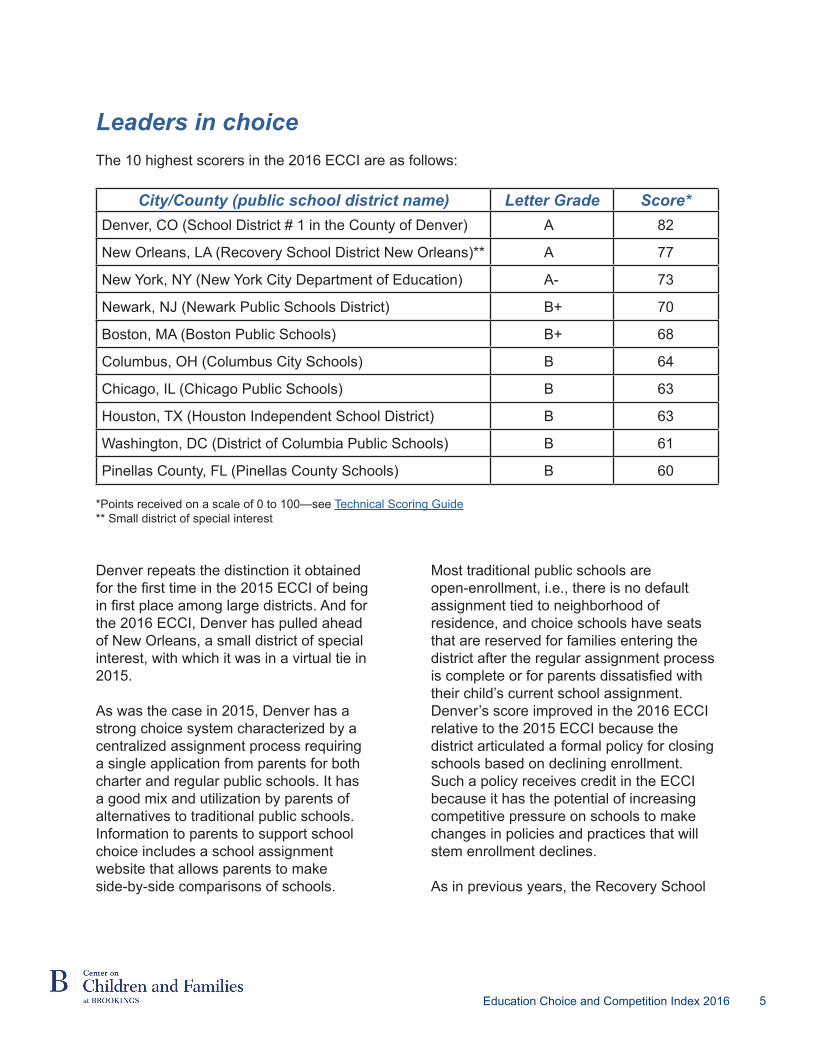
Leaders in choiceThe 10 highest scorers in the 2016 ECCI are as follows:
City/County (public school district name) Letter Grade Score*Denver, CO (School District # 1 in the County of Denver) A 82
New Orleans, LA (Recovery School District New Orleans)** A 77
New York, NY (New York City Department of Education) A- 73
Newark, NJ (Newark Public Schools District) B+ 70
Boston, MA (Boston Public Schools) B+ 68
Columbus, OH (Columbus City Schools) B 64
Chicago, IL (Chicago Public Schools) B 63
Houston, TX (Houston Independent School District) B 63
Washington, DC (District of Columbia Public Schools) B 61
Pinellas County, FL (Pinellas County Schools) B 60
*Points received on a scale of 0 to 100—see Technical Scoring Guide** Small district of special interest
Denver repeats the distinction it obtained for the first time in the 2015 ECCI of being in first place among large districts. And for the 2016 ECCI, Denver has pulled ahead of New Orleans, a small district of special interest, with which it was in a virtual tie in 2015.
As was the case in 2015, Denver has a strong choice system characterized by a centralized assignment process requiring a single application from parents for both charter and regular public schools. It has a good mix and utilization by parents of alternatives to traditional public schools. Information to parents to support school choice includes a school assignment website that allows parents to make side-by-side comparisons of schools.
Most traditional public schools are open-enrollment, i.e., there is no default assignment tied to neighborhood of residence, and choice schools have seats that are reserved for families entering the district after the regular assignment process is complete or for parents dissatisfied with their child’s current school assignment. Denver’s score improved in the 2016 ECCI relative to the 2015 ECCI because the district articulated a formal policy for closing schools based on declining enrollment. Such a policy receives credit in the ECCI because it has the potential of increasing competitive pressure on schools to make changes in policies and practices that will stem enrollment declines.
As in previous years, the Recovery School

6Education Choice and Competition Index 2016
District serving New Orleans has received a grade of A. The Recovery District has a high availability of choice, with all of its public schools being charters (which are universally schools of choice). It also has a good supply of affordable private schools, and vouchers for private school attendance available from the state. The school assignment process in New Orleans maximizes the match between parental preference and school assignment through a sophisticated centralized computer matching algorithm. There is no default school assignment (everyone must choose),
a common application, and information on school performance that includes test results for children attending private schools. Information on school performance is clearly presented with support for parents in understanding and navigating the choice process. Transportation expenses to schools of choice are covered through free public transportation tokens or yellow bus service. New Orleans experienced a small decline in its score in the 2016 ECCI relative to 2015 due to its report that none of its schools participate in the option provided by the state to take online courses, and because the district website that supports parent choice of schools had many dead links and instances of inaccessible performance information on schools. Partially offsetting the declines in score due
to these factors was an increase due to improved school quality.
New to the top 10 list this year are Columbus and Chicago, while Baltimore and Tucson dropped off. In each case, the changes in score were relatively small but enough to bring the district into or move it just out of the leadership group.
Chicago showed a score increase due to its decision to include data on student growth among the information on school performance provided to parents on its website. Typically, districts only provide parents with school-level information on how students score on end-of-the-year tests, not how much progress students have shown in particular schools over the course of the school year. End-of-year scores by themselves heavily reflect family background, whereas measures of student progress better reflect what is added by the school. By adding information on student growth to its website, Chicago has provided parents with an important new source of information to support school choice decisions.
Likewise, the score for Columbus increased because the district provides easy access to student progress data for parents choosing schools. As well, the district documented for the first time a policy of having specific funds follow students to their schools of choice. A policy that links school budgets to school enrollments in the context of school choice introduces incentives for principals and staff at individual schools to try to attract and retain students, whereas a policy that leaves school budgets static in the face of declining or rising enrollments, or that is arbitrary and mysterious, provides disincentives for schools to try to affect their popularity.
Denver has pulled ahead of New Orleans, a small district of special interest, with which it was in a virtual tie in 2015.
7Education Choice and Competition Index 2016
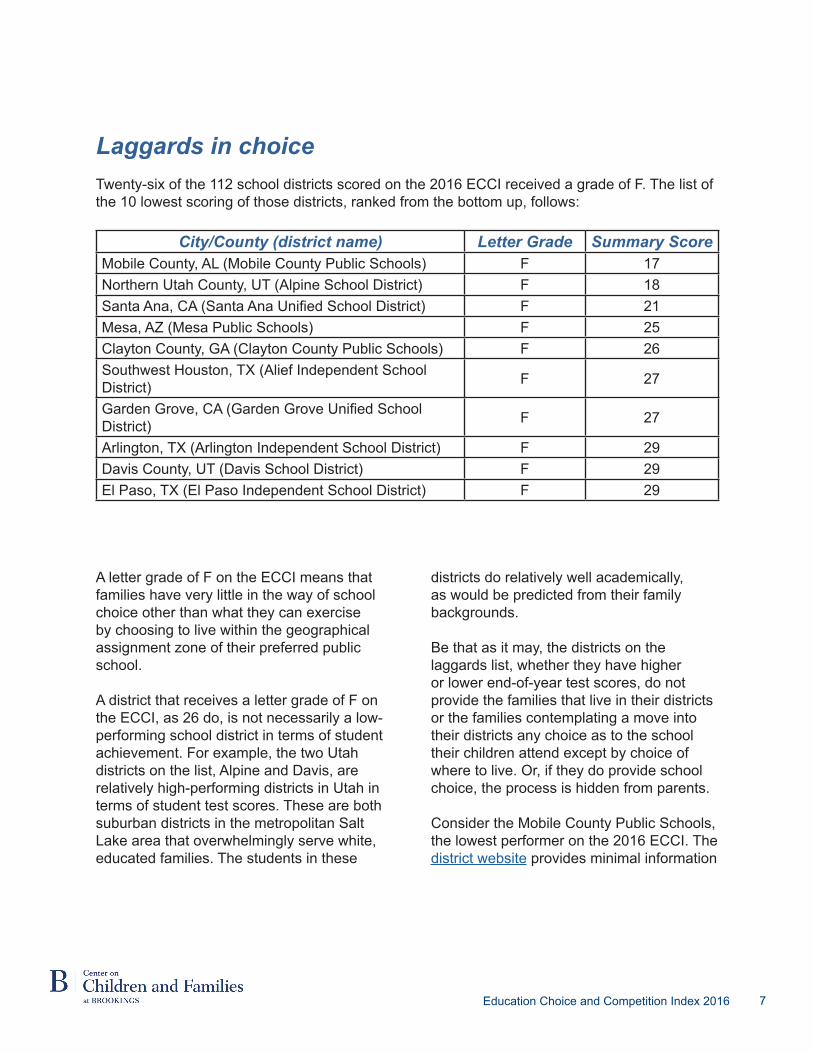
Laggards in choiceTwenty-six of the 112 school districts scored on the 2016 ECCI received a grade of F. The list of the 10 lowest scoring of those districts, ranked from the bottom up, follows:
City/County (district name) Letter Grade Summary ScoreMobile County, AL (Mobile County Public Schools) F 17Northern Utah County, UT (Alpine School District) F 18Santa Ana, CA (Santa Ana Unified School District) F 21Mesa, AZ (Mesa Public Schools) F 25Clayton County, GA (Clayton County Public Schools) F 26Southwest Houston, TX (Alief Independent School District) F 27
Garden Grove, CA (Garden Grove Unified School District) F 27
Arlington, TX (Arlington Independent School District) F 29Davis County, UT (Davis School District) F 29El Paso, TX (El Paso Independent School District) F 29
A letter grade of F on the ECCI means that families have very little in the way of school choice other than what they can exercise by choosing to live within the geographical assignment zone of their preferred public school.
A district that receives a letter grade of F on the ECCI, as 26 do, is not necessarily a low-performing school district in terms of student achievement. For example, the two Utah districts on the list, Alpine and Davis, are relatively high-performing districts in Utah in terms of student test scores. These are both suburban districts in the metropolitan Salt Lake area that overwhelmingly serve white, educated families. The students in these
districts do relatively well academically, as would be predicted from their family backgrounds.
Be that as it may, the districts on the laggards list, whether they have higher or lower end-of-year test scores, do not provide the families that live in their districts or the families contemplating a move into their districts any choice as to the school their children attend except by choice of where to live. Or, if they do provide school choice, the process is hidden from parents. Consider the Mobile County Public Schools, the lowest performer on the 2016 ECCI. The district website provides minimal information

8Education Choice and Competition Index 2016
on how students are assigned to schools, not even school geographical boundaries or bus routes. There is no information on school performance. There are schools on the district’s website identified as Signature Academies and magnet schools, with no indication of what they do or how a student would gain access to them other than via broken links to applications and admissions policies. The district’s website describes no policies under which a parent dissatisfied with her child’s school assignment would seek a reassignment. The district’s policies for funding schools are not evident, and the website links it provides to its accreditation documents are all broken. From the perspective of someone interested in understanding how the district works and how it is performing,
much less from the view of parents trying to access a school they think would best serve their child’s needs, there is virtually no useful information available from the district’s website. School choice appears to be available in Mobile County, at least for the subset of schools called academies and magnets, but the rules of the game and the information to support informed choice among available options are largely absent.
This is not a story that is in any way unique to Mobile County, AL. In far too many school districts (26 in the ECCI), school choice is either unavailable or operates under severe information constraints that lead to only knowledgeable and active parents being able to play the school assignment game.
District MoversTwo districts experienced changes in their choice environments between the 2015 and 2016 data collections for the ECCI that were substantive enough to produce large changes in scores and letter grades. These are:
City/County (district name) Last Year's Grade
This Year's Grade
Improvement in Score Points
Camden, NJ (Camden City School District) F B- 41Clark County, NV (Clark County School District) F C- 10

9Education Choice and Competition Index 2016
Clark County’s increase in score was largely due to Nevada’s Educational Choice Scholarship program, which was enacted and launched in 2015. Under this program, which is funded through state tax credits to businesses that choose to donate to scholarship organizations, individual students are eligible for a scholarship voucher of up to $7,755 to attend a private school. This existence of this state program impacts Clark County’s score on the ECCI by increasing the availability of alternatives to traditional public schools.
Camden, NJ experienced a dramatic increase in score and grade on the 2016 ECCI by virtue of rolling out a new process for school search, application, and assignment. In prior years, school choice in Camden was a trying process for parents, with 17 different applications and deadlines, and with information scattered across different websites or available only on paper by request. Under Camden Enrollment, there is one application for regular public schools, public charter schools, and some private Catholic schools; one deadline; and a fair method of school assignment.
In the future, Camden could improve its score and become a top 10 choice city on the ECCI by requiring that every family of a student wanting a seat in a public school in Camden participate in the choice process at transition points (entry into kindergarten, middle school, and high school). In the present incarnation of Camden Enrollment, families need to choose a school only if a
child is entering the system for the first time in kindergarten. Students already in the system whose parents do not participate in the choice process receive a default assignment to their neighborhood school.
Choice systems that retain default assignments to neighborhood schools for families that choose not to express their preferences for school assignment are subject to outcomes that are not equitable. One source of inequity is that parents who live in the neighborhoods of the best schools can capture seats in those schools and reduce the availability of seats for students living in other neighborhoods simply by sitting out the choice process. Another significant problem is that parents who choose to choose in a system in which school choice is optional may be better informed and more actively involved in their children’s education than parents who do not go to the trouble of making a choice. These active parents compete for seats in the best schools for their children, whereas non-participating parents who live in neighborhoods with weak schools consign their children to a school assignment that is closest to where the family lives, regardless of the quality of the school. If a goal of school choice is to provide greater advantage to students who live in poor neighborhoods with bad schools, a system that doesn’t require choice from all families shortchanges families whose children most need access to a better school than the one in their neighborhood.

10Education Choice and Competition Index 2016
Choice is a growth trend
The ECCI has been reported for the 100+ largest school districts in the U.S. for five consecutive years. Trend lines for many components that make up the ECCI are available back to the 2000-2001 school year. The following graph represents the proportion of districts in the ECCI for which we have data each year that, at a minimum,
allow parents of students who receive a default school assignment based on a geographical attendance zone to easily express their preferences for other schools and to gain admission to those schools, if they are oversubscribed, through a lottery. That proportion has roughly doubled from 0.29 to 0.56 during the last 16 years.
Commentary: Four lessons on school choice from ECCI data
0.29
0.56
0
0.1
0.2
0.3
0.4
0.5
0.6
Proportion of large school districts allowing school choice

11Education Choice and Competition Index 2016
This upward trend in the availability of school choice in regular public schools is mirrored in other measures of growth in schools of choice and programs that support school choice. For example, there are now 10 large public school districts in which the enrollment share for charter schools is at least 30 percent of total public school enrollment, up from just one such district a decade ago.4 Likewise, there has been exponential growth in private school choice programs receiving public funding through vouchers, education savings accounts, tax credit scholarships, and tax credits—10
such programs in 2000 vs. 61 this year, and roughly half a million students served by such programs this year compared to less than 100,000 in the year 2000.5
There is no question empirically that opportunities for parents to choose among traditional public schools for their children, to choose a charter school, and to receive a financial subsidy to attend a private school have grown leaps and bounds in the last 15-20 years. The traditional school district model is no longer the monopoly it used to be.
Opponents of school choice typically lead with the argument that every child deserves a great neighborhood school. But the proposition that every school can be great flies in the face of hard evidence and considerable experience across almost every sector of the economy. Even separate units delivering supposedly the same product in industries in which the service provided is supposed to be uniform show substantial variance in outcomes. For example, Intel has been so vexed by the variability in yield in its chip plants that it tries to clone successful plants completely, right down to the color of the paint on the walls.6
In a variation on this theme that is closer to home, Kevin Huffman, the former commissioner of education in Tennessee, has complained about criticisms of state
pre-K programs for not being uniformly of high quality. He notes that Tennessee’s pre-K is “roughly analogous to all of its schooling. Like most states, we have some good programs, some bad and a large smattering of average…Why would we think we can build a ‘high-quality’ program for all the nation’s 4-year-olds when decades of effort have failed to produce universal high-quality in any other grades?”7
The following graph represents the distribution of the average public school quality in each of the ECCI districts relative to the average school quality for the state in which each ECCI district is located. What we see is a distribution that has the general outline of a normal curve. This is the distributional form that is found whenever a large number of schools or districts are compared. In Huffman’s words, some
Universal access to a great neighborhood school is a pipedream

12Education Choice and Competition Index 2016
good, some bad, and a large smattering of average. We do not know how to create or sustain uniformly great neighborhood schools. There is no existing proof that we do, and strong empirical evidence that the performance of schools varies substantially everywhere there are large numbers of schools to compare. An education reform agenda based on the assumption that the solution to the nation’s education challenges
is to provide a great neighborhood school for every child is fanciful.
School choice is one way of addressing the reality of the normal curve of school performance by giving parents the opportunity of moving their children out of schools that are in the lower tail of the distribution.
0
5
10
15
20
25
30
10 20 30 40 50 60 70 80 90
Num
ber o
f sch
ool d
istr
icts
/citi
es/c
ount
ies
Percentile
Percentile of average school in each ECCI district relative to schools in the whole state

13Education Choice and Competition Index 2016
Republicans in Congress and the states, and now the Trump administration, are enthusiastic supporters of policies to support private school choice, including vouchers, education savings accounts, and tax-credit scholarships, whereas Democrats strongly oppose such programs but generally are supportive of charter schools.
Despite the political fervor associated with taxpayer support of private schools, attendance at private schools has been declining for the last 15 years, particularly for elementary and middle school students. Thus, in simple statistical terms, nearly all the progress in practical opportunities for parents to choose schools has been through mechanisms that operate in the public sector: charter schools, which did not exist 20 years ago, magnet schools, and open-
enrollment systems in which the assignment of students to schools is accomplished by a process in which parents either express their preferences ex-ante or can request a re-assignment if they are dissatisfied with the school to which the district assigns their child. Private school vouchers are politically contentious everywhere and illegal in some states. Further, the seat capacity of private schools, which presently serve less than 10 percent of students, is limited with respect to the need and demand for schools of choice.
The ECCI tracks the number of students within each of its districts that attend private schools, public charter schools, and traditional public schools. As illustrated in the following graph, students in the nation’s 100+ largest school districts are
Public school choice is the field of opportunity
Traditional public81%
Private9%
Charter public10%
Proportion of total student enrollment in types of schools in ECCI districts

14Education Choice and Competition Index 2016
The opportunity for parents to choose the school their child attends can put forces in play that are dormant in the traditional school district model. These include competition among schools for students, which can lead to schools that are more oriented to satisfying parents and students than would be the case when schools have an exclusive franchise over a particular geographical catchment area; enhanced opportunities for innovation in areas such as length of the school day and credentialing requirements for teachers that are outside the regulatory boundaries of traditional public schools; increased focus in curriculum, instruction, and school climate on particular groups of students (e.g., black students from low-income families and neighborhoods) that constitute nearly all of the enrollees of some schools of choice; and opportunities to attract and reward school leaders who are entrepreneurial. Each of these forces and opportunities
can lead to better schools, but there is no guarantee that they will.
The same forces and opportunities can be negative. Competition among charter schools for customers, which ideally takes the form of showing potential enrollees that the school is high performing, has occasionally taken the form of awarding cash bonuses, laptops, raffle tickets, and bicycles to those who choose the school.8 The absence of the constraints on administrative actions that, ideally, can lead to innovation, can also lead to a workplace in which teacher turnover is substantially higher than in traditional public schools. 9 Choice can lead to schools that are more homogenous in terms of student race and family income than is the case in schools to which students are assigned based on a geographical catchment area.10 And parents and students may choose schools based on characteristics such as demographics
Choice is a precondition, not a panacea
overwhelmingly (91 percent) in public schools (10 percent in charter public schools and 81 percent in traditional public school). As indicated in the first figure presented above, 56 percent of the ECCI districts allow choice within the traditional public schools. All of the charter public schools are chosen.
This means that school choice has a very firm and growing foothold in districts and cities that had, 20 years ago, been entirely
served under the traditional school district model that afforded no choice except through a family’s ability to live close to a school they preferred.
Advocates of school choice should take note of the reality that for the foreseeable future the greatest opportunities for the expansion of choice are in the public school sector through furthering the reach of open enrollment.

15Education Choice and Competition Index 2016
and extracurricular activities rather than based on their performance as teaching and learning institutions.11 Further, it is possible to have a choice system in which all the choices are bad or in which the choices are between schools that are largely indistinguishable in focus and approach.
This means that policymakers and advocates who wish to transform the education delivery system from the traditional district model to a choice model cannot rest on their laurels when they’ve introduced charter schools or open enrollment in traditional public schools or private school vouchers. Choice is merely the precondition for new systems of delivering education, not a guarantee of the success of those systems relative to the traditional school district model. Once choice is in place, considerable attention has to be paid to how parents choose schools, the portfolio of schools that are available, the processes and data by which schools receive signals of success, and the politics of choice.
The advantages of school choice flow from having the dynamism of a market replace
the stasis of a monopoly. But it would be a mistake to think of parents choosing a school for their child as akin to their choosing their child’s shoes. Think of school choice as more like choosing a child’s pediatrician than shopping for a typical consumer good—we want parents to have a choice and we want the choices parents make to give providers an incentive to improve. But in education as well as health care we also need top-down mechanisms to insure an appropriate supply of services and providers, to weed out ineffective or harmful practices and practitioners, to produce research and development to support new knowledge and more effective approaches, and to manage the system so that it is broadly equitable in access and outcomes. The expansion of school choice is not a repudiation and abandonment of the role of government in the provision of an adequate education for the nation’s K-12 students. It does, however, require a rethinking and redesign of how the government carries out its responsibilities, and a commitment to nurturing processes that promote the improvement of schools over time and with experience.

16Education Choice and Competition Index 2016
References1 http://www.aei.org/wp-content/uploads/2017/03/Analyzing-an-Educational-Revolution.pdf
2 http://www.aft.org/news/weingarten-speaks-future-public-education
3 http://www.rsmas.miami.edu/news-events/press-releases/2016/new-study-shows-increased-flooding-accelerated-sea-level-rise-in-miami-over/
4 http://www.publiccharters.org/wp-content/uploads/2015/11/enrollmentshare_web.pdf
5 https://www.edchoice.org/wp-content/uploads/2017/02/The-ABCs-of-School-Choice-1.pdf
6 https://www.wsj.com/articles/SB1035753241671796951
7 https://www.washingtonpost.com/posteverything/wp/2016/02/04/democrats-love-universal-pre-k-and-dont-seem-to-care-that-it-may-not-work/?utm_term=.e3eb36e86724
8 https://www.nytimes.com/2016/06/29/us/for-detroits-children-more-school-choice-but-not-better-schools.html?_r=0
9 http://citylimits.org/2014/08/20/why-charter-schools-have-high-teacher-turnover/
10 https://www.brookings.edu/wp-content/uploads/2016/10/ccf_20161021segregation_version-10_211.pdf
11 http://educationresearchalliancenola.org/files/publications/ERA1402-Policy-Brief-What-Schools-Do-Families-Want-3.pdf
We would like to thank the Walton Family Foundation for supporting this project. Data collection for the 2016 ECCI was carried out for Brookings by Basis Policy Research. We are appreciative of the efforts of Basis and the cooperation of the districts surveyed by Basis in producing the information on which the 2016 ECCI is based.


