53
1 IMPACT OF EDUCATION IN MINORITY LANGUAGES ON THE INTERNAL AND EXTERNAL MIGRATIONS OF NATIONAL MINORITIES Goran Basic PhD Belgrade, 2015

1
IMPACT OF EDUCATION IN MINORITY
LANGUAGES ON THE INTERNAL AND EXTERNAL
MIGRATIONS OF NATIONAL MINORITIES
Goran Basic PhD
Belgrade, 2015

2
This publication has been developed with the assistance of the Swiss Agency for
Development and Cooperation (SDC), International Organization for Migration (IOM)
and the United Nations Development Programme (UNDP), within the framework of a
joint global project “Introducing Migration in National Development Strategies”. The
content of this publication does not necessarily reflect the views of SDC, IOM or UNDP,
or of their member states.

3
CONTENT
1. INTRODUCTION AND NOTES ON METHODOLOGY 3
2. INTERNAL AND EXTERNAL MIGRATIONS
OF NATIONAL MINORITIES IN CONTEMPORARY SERBIA 6
2.1. Basic demographic data on
national minority populations 6
2.2. External migrations and changes in population structure 8
2.3. Migrations and education of national minorities 8
2.3.1. Albanian national minority 17
2.3.2. Bosniak national minority 17 2.3.3. Bulgarian and Vlach national minority 23 2.3.4. Romanian national minority 26 2.3.5. Hungarian national minority 28 2.3.6. Slovak national minority 31 2.3.7. Rusyn national minority 33
2.3.8. Croatian national minority 35
2.3.9. Smaller national minorities
– Macedonians, Bunjevci, Czechs and Ukrainians 38
2.3.10. Roma national minority 40
3. CONCLUSIONS ON THE IMPACT OF EDUCATION IN
NATIONAL MINORITY LANGUAGES ON EXTERNAL
MIGRATIONS 42
4
1. INTRODUCTION AND NOTES ON METHODOLOGY
The Report on Impact of Education in Minority Languages on External and
Internal Migrations of National Minorities has been produced on the initiative of
the Ministry of Education, Science and Technological Development. In 2014, the
Ministry adopted an Action Plan requesting the identification of facts related to
the education in minority languages, as well as the subsequent drafting of an
action plan for improvement of the education for national minorities at all levels.
The right of national minorities to education in their mother tongues is provided
by the Constitution of the Republic of Serbia1, laws regulating the position of
national minorities2 and their minority self-governments3, as well as by laws and
regulations proscribing the educational activities at different levels of schooling
and other issues of importance for education of national minorities4. However,
the systematic fulfilment of those rights in the institutions implementing
educational activities is impeded by lack of alignment between regulations,
disorganization in certain areas of education, and other external and internal
factors. This results in a steady decline of the number of students deciding to
listen to lessons in minority languages. Namely, the decline in the number of
1 “Official Gazette of RS“, No. 98/2006. 2 The Law on the Protection of Rights and Freedoms of National Minorities (“Official Gazette of FRY“, No. 11/2002, “ Official Gazette of SM“, No. 1/2003 – Constitutional Charter, and “Official Gazette of RS“, No. 72/2009 – second law and 97/2013 – ruling of the Constitutional Court 3 Law on National Councils of National Minorities “Official Gazette of RS“, No. 72/2009, 20/2014 - ruling of the Constitutional Court and 55/2014. 4 Law on the Foundations of the Education System (“Official Gazette of RS“, No. 72/2009, 52/2011 and 55/2013); Law on Preschool Education “Official Gazette of RS“, No.18/2010 from 03/26/2010); Law on Textbooks and other Teaching Materials (“Official Gazette of RS“, No. 72/2009); Law on Elementary Education (“Official Gazette of RS“, 55/2013); Law on High Education (“Official Gazette of RS“, No. 76/2005, 97/2008, 44/2010, 93/2012, 89/2013. Authentic interpretation - 100/2007-4. Decision – CC RS No. 380/2005 - 53/2011-104); The Law on Students' and Pupils' Standard “Official Gazette of RS“, no. 18/2010 and 55/2013) and others
5
students opting for this type of teaching has been noticed in the most of minority
communities where children have a right to full education in mother tongue, to
bilingual education (in both Serbian and minority language), or to take a subject
“Minority Language with Elements of National Culture“.
The reasons for this drop in the number of students taking lessons in minority
languages have not been investigated, but various assumptions exist. One of the
assumptions is that a rising number of students are deciding to continue with
their studies abroad after graduating from elementary/secondary school where
they took their lessons in minority language. This especially relates to Albanian
and Hungarian students who are increasingly enrolling in Albanian schools in
Kosovo, Albania or Macedonia, and Hungarian schools in Hungary respectively.
At the same time, it has been noticed that these students, in spite of the fact that
they take Serbian language lessons throughout their schooling, do not speak the
majority language and are not prepared for social integration.
On the other hand, schooling in mother tongue in an ethically, culturally and
linguistically close environment usually results in permanent emigration from the
country. In this manner, education in mother tongue, whose educational
objectives do not differ from the general ones, and which should also contribute to
the preservation and empowerment of national minority identities, becomes the
exact opposite of this. Instead of empowering the national minority identity,
education contributes to the linguistic and cultural homogenization of the
minority group, its segregation and finally to external migrations accelerating
depopulation and “silent” assimilation of the minority.
The investigation of the assumption (hypothesis) that education in minority
languages contributes to the external migrations and depopulation of national
minorities has been conducted on the basis of:
− analysis of official documents5 and published papers6
5Population census – results segregated by nationality, SORS, Belgrade 2012; Third Periodical Report on the implementation of the Framework Convention for the Protection of National Minorities in Serbia, Council of Europe 2012; Third Periodical

6
− interviews with the representatives of national councils of national
minorities7
− interviews with Heads of School Administrations in Sombor, Novi Sad,
Pozarevac, Leskovac and Novi Pazar, and in the Institute for Pedagogy of
Vojvodina and the Provincial Secretariat for Education, Administration,
Regulations and National Minorities of the Government of AP Vojvodina8.
Report on the Implementation of European Charter on Regional of Minority Languages in the Republic of Serbia, Council of Europe 2015 (http://www.coe.int/t/dg4/education/minlang/Report/PeriodicalReports/SerbiaPR3_rs.pdf); ECRI General Policy Recommendation no. 10 on combating racism and racial discrimination in and through school education CoE, Strasbourg, 2007; Hague Recommendations on the Right of National minorities to Education; High Commissioner for National Minorities, OSCE, the Hague, 1996; laws and acts regulating the right to education of national minorities in Serbia (see footnote 4). 6Tanja Pavlov, Migracioni potencijal Srbije, Beograd, 2009; Uticaj demografskih i migracionih tokova na Srbiju, International Organization for Migrations, Belgrade, 2012; Biljana Sikimić, Naučno istraživanje migracija u Srbiji, SASA, Belgrade, 2014; Odliv mozgova iz Srbije – problemi i moguća rešenja, Group 484, Belgrade, 2010; Vladimir Stanković, Srbija u procesu spoljnih migracija, Statistical Office of the Republic of Serbia, belgrade, 2015; Ostvarivanje prava na obrazovanje pripadnika nacionalnih manjina na maternjem jeziku i pismu u istočnoj Hrvatskoj, Coalition for Protection of Human Rights, Osijek, 2006; Aleksandra Vujić, Obrazovanje pripadnika mađarske, slovačke, rumunske i rusinske nacionalne manjine u Vojvodini od 1974/75 godine, Institute for Pedagogy of Vojvodina, Novi Sad, 2011; Nedeljković Pravdić Marija, Manjinska obrazovna politika na Kosovu, Metodički vidici, Belgrade 2001 and others 7 The meetings were held as follows: National Council of Roma and Slovenian National Minority January 22; National Council of Slovak, Romanian, Greek and Montenegrin National Minority, January 23; National Council of Rusyn, Ukrainian and German National Minority, February 3; National Council of Hungarian, Bunjevci and Croatian National Minority, February; National Council of Czech and Macedonian National Minority, February 5; National Council of Vlach National Minority, February 11; National Council of Bosniak National Minority, February 19; National Council of Albanian National Minority, March 30. 8 Meeting at the Institute of Pedagogy was held on January 23, 2014; meetings in school administrations were held as follows: Sombor – January 23; Pozarevac – February 11; Novi Sad - February 13; Novi Pazar – February 19; Leskovac – March 30; Zajecar – April 30. The meeting with Deputy Provincial Secretary for Education, Administration, Regulations and National Minorities was held on February 13.

7
2. INTERNAL AND EXTERNAL MIGRATIONS
OF NATIONAL MINORITIES IN CONTEMPORARY SERBIA
2.1. Basic demographic data on national minority populations
According to the results of the 2011 Census, apart from 5,988,150 (83.32%) ethnic
Serbs, Serbia is also inhabited by 998,071 members of national minorities.
However, the number of national minority members exceeds a million if we take
into account the fact that ethnic Albanians living in the municipalities of
Bujanovac and Presevo (and which in 2002 numbered 54,779 people) have
boycotted the 2011 Census.
The most numerous minority communities in Serbia, i.e. those that make more
than 1% of the population are: Hungarians with 253,899 (3.53%), Roma with
147,604 (2.05%) and Bosniaks with 145,278 (2.02%) members. All other national
minority communities in Serbia are small and are experiencing a drop in
numbers. The Institute of Ethnography of SASA (Serbian Academy of Arts and
Science) organized a scientific convention on migration in Serbia in December of
2014, where it was presented, among other findings, that the consequences of
emigration had the biggest demographic impact on minority ethnic communities,
and that the majority of them, numbering between ten and twenty thousand
people, would disappear in the next few decades.9
Demographic indicators confirm this ominous, but warning fact. Between the two
population censuses (2002–2011) the number of ethnic Hungarians dropped by
13.4%, i.e. 39,000 people – from 293,300 to 253,900 inhabitants. The number of
Croatians in the same period declined by 18%, i.e. more than 12,000 inhabitants,
the number of Montenegrins by almost 50%, i.e. approximately 30,000 people. In
9 Biljana Sikimić, Naučno istraživanje migracija u Srbiji, SASA, Belgrade, 2014.
8
ten years, the Rusyn community was reduced by 1,639 persons, where their
number dropped from 15,905 to 14,246, the number of ethnic Ukrainians was
reduced by 450 people (from 5,354 to 4,903), and the number of Bunjevci was
reduced by 3,306 persons, i.e. their number dropped from 20,012 citizens
registered in the 2002 Census to 16,706 registered in 2011. According to the 2011
Census, there were 52,750 ethnic Slovaks living in Serbia. Their numbers dropped
by 10.6%, i.e. 6,271 persons in comparison with the previous census. Statistically
viewed, the number of Slovaks in total population of Serbia dropped from 0.787%
to 0.734%. However, if we compare these data with the ones on the number of
Slovaks in Serbia registered on the last six population censuses, it can easily be
seen that their numbers declined by 20,390 people since 1948.
The Bulgarians and Vlachs are also facing population decline. The Bulgarian
national minority concentrated mostly in Bosilegrad and Dimitrovgrad
municipalities, with larger communities in Surdulica and Babusnica
municipalities, has been reduced by 2,000 people, from 20,500 to 18,500. In
2002, after the “ethnicity awakening“, 40,100 Vlachs were registered, as opposed
to current number of 35,300.
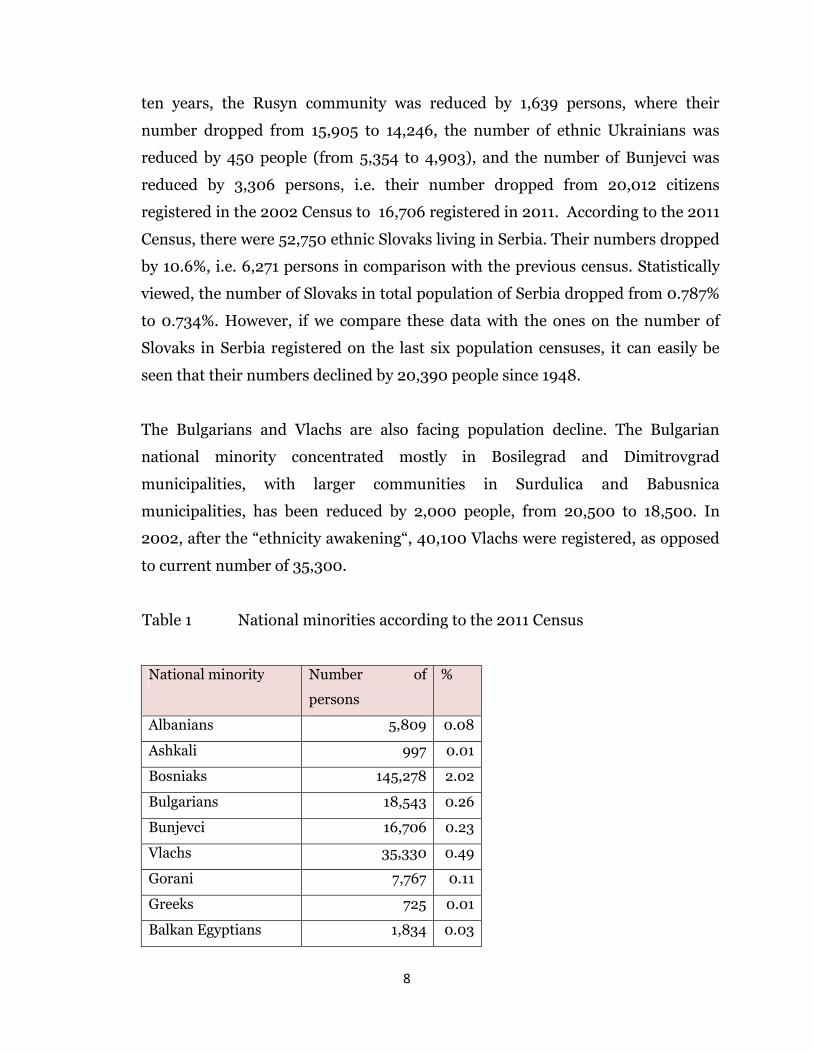
Table 1 National minorities according to the 2011 Census
National minority Number of
persons
%
Albanians 5,809 0.08
Ashkali 997 0.01
Bosniaks 145,278 2.02
Bulgarians 18,543 0.26
Bunjevci 16,706 0.23
Vlachs 35,330 0.49
Gorani 7,767 0.11
Greeks 725 0.01
Balkan Egyptians 1,834 0.03

9
Jews 787 0.01
Armenians 222
Yugoslavs 23,303 0.32
Hungarians 253,899 3.53
Macedonians 22,755 0.32
Muslims 22.301 0.31
Germans 4,064 0.06
Roma 147,604 2.05
Romanians 29,332 0.41
Russians 3.247 0.05
Rusyns 14,246 0.20
Slovaks 52,750 0.73
Slovenians 4,033 0.06
Turks 647 0.01
Ukrainians 4,903 0.07
Croats 57.900 0.81
Aromanians 243
Montenegrins 38,527 0.54
Czechs 1824 0.03
Shokci 607 0.01
Shopi 142
Source: Population census, 2011.
Population growth in absolute and relative numbers has been registered (as
previously mentioned) with Roma, and in absolute numbers with Bosniaks and
smaller national minorities: Muslims, Gorani, Balkan Egyptians and Turks.
2.2. External migrations and changes in population structure
According to the opinion of demographic analysts, the main causes of the decline
of minority populations, identical to the trends perceived with Serbian
population, are negative birth rate and external migrations. When mentioning

10
migrations, it should be noted that consequences of forced migrations in the
territory of ex-Yugoslavia are still evident, and that emigration to EU is gaining an
increasingly prominent role.
In the period between the last two population censuses, 146,500 persons who
have not been registered in 2011 Census have evidently left the country, and the
total number of external migrants amounts to 313,411 persons, 132,534 out of
which have emigrated in the last five years10.
If we take a look at the ethnical structure of emigrants, Bosniaks lead among those
who left Serbia with 7.2%, followed by Roma with 3.3% and Vlachs with 1.6% .
The reasons motivating emigration are economic in nature, and the most
attractive countries remain Austria, as the destination of 22.5% of the total
external migrant population, Germany (17.9%), Switzerland (13.1%), Italy (7.4%),
France (6.5%), USA and Sweden (4.3%), and Canada (2%). Hungary is the most
attractive of the neighbouring countries (1.7%), but the migrations towards
linguistically and culturally close countries created in the territory of ex-
Yugoslavia are gaining ground (6.3%).
If we compare areas (regions) of Serbia population is emigrating from, we can
notice that the majority of external migrants come from South Serbia - 215,000 or
69%. Emigration from the north of the country is much less pronounced– 98,000
or 31%. Migrants most often come from South and East Serbia– 111,000
(35.38%), then Sumadija and West Serbia with more than 104,000 (33.31%)
migrants. The total of migrants from both northern regions (Belgrade and
Vojvodina) is much lower - 50,000 migrants from Vojvodina (16.6%), and 48,000
from Belgrade (15.25%).
According to the research performed by Vladimir Stankovic in 2014 (based on
2011 census data), certain “regularities“ related to migration flows from specific
10 Vladimir Stankovic, Srbija u procesu spoljnih migracija, Statistical Office of the Republic of Serbia, Belgrade, 2015

11
parts of Serbia to neighbouring and other near-by countries are quite evident. The
population from Sumadija and West Serbia most often emigrates to Bosnia and
Herzegovina (58.89%), while migrants from Vojvodina prefer Croatia (59.95%).
The characteristics of these migration flows are defined by the ethnical structure
of Serbia's population, i.e. by the fact that a large number of Bosniaks live in West
Serbia, and a large number of ethnic Croats in Vojvodina. The link between
ethnicity and the direction of migratory movement is evident with ethnic
Hungarians who make up 95% of migrants deciding for temporary or permanent
move to Hungary.
Migrants moving to Montenegro most often come from the area of West Serbia
(39.68%) and Vojvodina (24.07%). The ethnic component plays an important role
in this case as well, since a significant number of Montenegrins is living in
Vojvodina, and a large number of Bosniaks from Sandzak i West Serbia descend
from Sandzak municipalities in Montenegro.
Migrants moving to Slovenia come from different parts of the country– 37.97%
from East Serbia, 25.70% from Vojvodina, and 24% from Sumadija and East
Serbia (ratio to the total number of external migrants).
The data provided in the aforementioned research by Vladimir Stankovic lead to a
conclusion that directions of external migrations exhibit certain trends based on
closeness of receiving countries, ethnic similarity of populations, common history,
traditional links between Serbia and certain receiving countries - all of this
indicated by the data on the ratio of ethnical Croats, Bosniaks and Hungarians to
the total number of migrants moving from Vojvodina to Croatia and Hungary.
Migrations of these citizens of Serbia towards neighbouring countries are caused
by economic reasons, favourable schooling environment, or other personal
reasons, but they are also fundamentally based on linguistic, ethnic, family and
other types of connections maintained between minorities and their home
countries.

12
However, we should note that the highest rate of emigrants is found in the
Bosniak community– 6.3%, followed by Roma – 3%, and Vlachs - 2%. A slightly
lower, but still quite high rate is present in the Hungarian minority community –
2.4%. If we compare these data with the ones on the share of these minorities in
the total population, we can notice clear signs warning us that, if these external
migrations were to continue, we could be facing a new wave of depopulation, in
spite of positive population trends noticed among some of these minorities
(Bosniaks, Roma).
Viewed from the point of education planning, it is important to note that as much
as 23.6% of Albanians, 25.7% of Bosniaks, 25.8% of Roma and 18.9% of Muslims
emigrating out of Serbia are children up to 14 years of age. It should also be
mentioned that the education level of external migrants is quite high, where as
much as 12% have university degrees, and 38,8% possess secondary school
diplomas. If we were to link ethnicity to education level of external migrants, we
would see that 7% of Roma, 2.1% of Albanians, 1.6% of Romanians, and 1.4% of
Vlachs are elementary school drop-outs. Roma (46%), Vlachs (51.1%) and
Romanians (43%) make the majority of external migrants without a secondary
school diploma. In the total structure of Bosniak external migrants 35% have only
elementary school diplomas, while such persons make up to 40.2% of Albanian
external migrants.11
If we look at the number of persons with secondary school degrees, the most
favourable structure of migrants can be found in the Bulgarian community
(62.2%), Rusyns (52%), Montenegrins (51.2%), and Macedonians (50.6%). We
can find the highest rates of college and university graduates among the
representatives of Hungarian minority– 8.9% with college and 24% with
university degrees, while 7.8% of Rusyn migrants have college, and 13.9%
university degrees. We can also find high percentages of migrants with university
11 Stankovic, Ibid

13
level degrees among Montenegrins (28.9%), Bulgarians (22,4%), Macedonians
(21.7%), Croats (18.2%) and Slovaks (17.6%).
We can notice that the share of university graduates in the total number of
external migrants within 16 national minorities is much higher than their share in
the educational structure of their community in the wider framework of total
population, which indicates that better educated minority representatives (who
are in average 28 years old) are leaving the country.12 The example of migrants
belonging to Hungarian national minority is quite notable, because “brain drain“
is evident in that community, i.e. we can note the biggest difference between the
share of highly educated persons in the total number of external migrants and in
the total population: 24% among the migrants, and 5.2% among the permanent
population. It is assumed that such demographic changes in the Hungarian
population in Vojvodina are caused by the desire of community members to
realize their personal plans through Hungary, an EU member state which is
actively stimulating their connection to their home country and culture, in a much
easier way than in Serbia.
The majority of migrants with college and university degrees find employment in
USA, Canada or West European countries, and the favourite regional destination
countries are Bosnia and Herzegovina (4.8% of these migrants) and Hungary
(4.4%). These persons belong to the migrant group that has most probably left the
country for good.
If we take a look at returnees, we can notice the highest share of Roma (52.8%)
and Vlachs (54.7%) without any education or only an elementary school diploma.
Allow us to remind the reader that the representatives of these minorities also
made up the majority of external migrants who finished only elementary school or
dropped out of school altogether. Among returnees with low education level we
12 Stankovic, Ibid

14
also find 37.9% of Romanians, 20.7% of Slovaks, 17.1% of Hungarians, 15% of
Rusyns, and 13.5% of Bulgarians.
If we compare the share of highly educated returnees (with college and university
degrees) with the national average of 18.9%, we can see that it is higher than the
said average among the Montenegrins (42%), Bulgarians (20.6%), Macedonians
(20.5%) and Serbs (20.4%).
External migrations impact the reduction of national minority populations.
Citizens of Roma, Bosniak and Hungarian nationality are those who most often
decide to temporarily or permanently leave the country. Migrants usually turn
towards economically developed EU countries, USA and Canada, but also towards
their home countries that often quite proactively support their diaspora (by
providing scholarships to students or by providing citizenship) which often
encourages national minority representatives to migrate.
The study of migration potential conducted in 200913 has demonstrated that 68%
of Serbian citizens have never considered leaving Serbia to migrate to a different
country, either on temporary or permanent basis. 12% of citizens have considered
emigrating, but eventually gave up on their plans. However, 19% of Serbia’s
citizens, i.e. 1,200,990 persons above 15 years of age, are considering emigration,
which represents the “total migration potential” of Serbia. However, if we were to
take a closer look at those 19% and investigate how often and how long they have
been thinking about emigrating, as well as how much they themselves believe that
they will leave Serbia in near future, we would have to halve that number (50% of
citizens constituting “the total migration potential“ think about emigration “very
rarely“ and “sometimes“, 54% have been considering it for more than 5 years, and
55% consider it “unlikely“ or “not very likely“ that they will actually emigrate).
The percentage of potential migrants who had begun preparing for emigration
was 6% or 379,260 person, which aligns with Stankovic’s data presented in the
study on consequences of external migrations based on 2011 Census.
13 Tanja Pavlov, Migracioni potencijal Srbije, Belgrade, 2009.

15
Migration potential identified in the 2009 study is much lower than the migration
potential identified by IOM in the Federal Republic of Yugoslavia in 199814 and
the migration potential of countries that joined EU in the last decade (Poland,
Czech Republic, Slovakia and Hungary), and is a bit higher than the migration
potential of Croatia identified in 2004, which can be contributed to differences in
political, economic and social context, especially the current financial crisis, but
also to different methodological approaches.
However, even though the migration potential is lower than in other countries in
the region and in comparison to the period two decades ago, it should be noted
that potential emigration of 380,000 people, which is the value of the identified
potential emigration capacity of Serbia, and the actual emigration between two
last censuses represents a significant loss of population which holds demographic,
political, economic and social impact on the country. Having in mind that external
migrations of national minorities members are quite frequent, and that they occur
in “enabling“ circumstances, it can be concluded that emigration consequences
will have an increasing impact on this part of Serbia’s population. If we link these
predictions to the data showing that members of specific national minorities,
primarily those living in the Autonomous Province of Vojvodina, belong the aging
population group, as well as to the data from the research of “Group 484“
according to which the persons who have not considered emigrating are mostly
older, with low education levels (housewives and senior citizens), and that the
identity of the average potential emigrant indicates a person from 15 to 39 years of
age, highly educated or pursuing a university degree15, without any options for a
14 When compared to the study implemented by IOM in 1998 on the territory of the Federal Republic of Yugoslavia, the research conducted by Tanja Pavlov in 2012 has demonstrated that a much smaller number of Serbia’s citizens was considering emigration (19% as opposed to 26% in IOM’s study), and that an even smaller portion has taken concrete steps towards actual migration (6% as opposed to 20% who had gathered pertinent information on the destination country in IOM’s study). 15 The study implemented by “Group 484” has indicated that 24% of respondents with university degrees and 33% of post-graduate and doctoral students were thinking of leaving the country.
16
job in their field of expertise, or employed with a monthly income ranging from
eighty to hundred and eighty Euro, than it becomes clear that conditions for
gradual “silent” assimilation of national minority population are met.
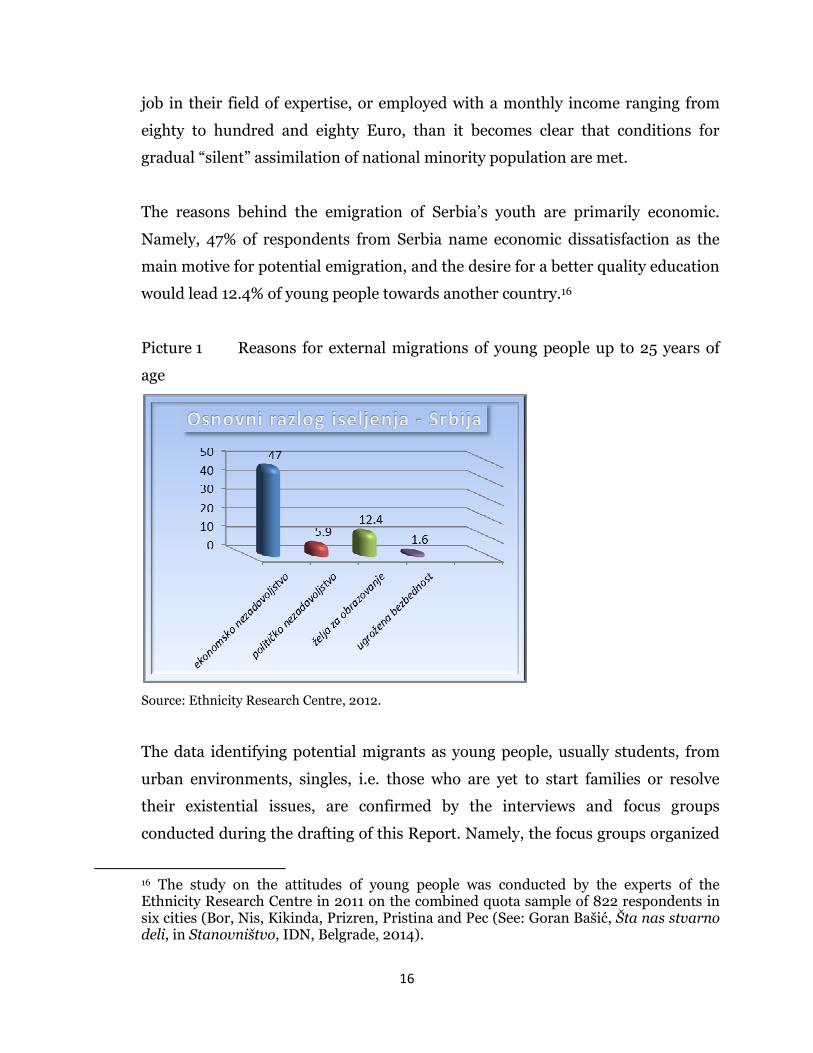
The reasons behind the emigration of Serbia’s youth are primarily economic.
Namely, 47% of respondents from Serbia name economic dissatisfaction as the
main motive for potential emigration, and the desire for a better quality education
would lead 12.4% of young people towards another country.16
Picture 1 Reasons for external migrations of young people up to 25 years of
age
Source: Ethnicity Research Centre, 2012.
The data identifying potential migrants as young people, usually students, from
urban environments, singles, i.e. those who are yet to start families or resolve
their existential issues, are confirmed by the interviews and focus groups
conducted during the drafting of this Report. Namely, the focus groups organized
16 The study on the attitudes of young people was conducted by the experts of the Ethnicity Research Centre in 2011 on the combined quota sample of 822 respondents in six cities (Bor, Nis, Kikinda, Prizren, Pristina and Pec (See: Goran Bašić, Šta nas stvarno deli, in Stanovništvo, IDN, Belgrade, 2014).

17
with the representatives of Albanian, Bosniak, Bunjevci, Bulgarian, Hungarian,
Slovak, Slovenian, Croatian, Czech, Rusyn, Romanian, Roma, and Ukrainian
national minority have demonstrated that, even though the national minority
institutions and public administration bodies (such as school administrations) do
not record the number of students discontinuing their schooling in Serbia after
completing elementary or secondary school, i.e. the number of those continuing
with their studies in other (usually their home) countries, it can be concluded that
Serbia is experiencing a considerable drain of young population.
2.3. Migrations and education of national minorities
The intensifying external, as well as internal migrations of national minorities
indicate the need for planning of public policies which should steer this process,
in line with exercise of human rights, towards the strengthening of connections
with Serbia and motives for remaining in the country. Drafting of plans for
stopping these migratory movements is very complex since this population group
is not impacted only by the usual economic emigration reasons, but also by the
cultural and linguistic closeness with their compatriots in home countries. Home
countries most often lead active diaspora-related policies and endeavour to
economically and culturally empower their nationals in neighbouring countries.
However, these measures often have an opposite effect to the desired one, i.e.
instead of creating conditions for the strengthening of ethnic and cultural identity
of minorities in the countries whose citizens they are, they encourage emigration
and weakening of the potential for preservation of minority identities.
Another unfavourable circumstance is reflected in the fact that consequences of
ethnical conflicts and ethnic distance are still felt in the region which encourages
ethnical homogenization and segregation. Internal migrations in Serbia during
the last two decades indicate the growth of increasingly ethnically homogenous
“minority“ hubs – the majority of Albanians and Bosniaks lives in five local self-
18
governments; Bulgarians, Rusyns and Slovaks in two each; Hungarians in six, and
Ukrainians in one.
For example, around 90% of the total number of Bosniaks in Serbia live in the city
of Novi Pazar and the municipalities of Sjenica and Tutin–77,443 Bosniaks living
in Novi Pazar make 77.12% of the total town population and 53% of the total
number of Bosniaks in Serbia. 28,041 Bosniaks living in the municipality of Tutin
make up 90% of the local population and almost 20% of the Bosniak population
in Serbia. In Sjenica, 19,498 Bosniaks make up 74% of the local population and
13.4% of the total Bosniak population. Situation in Medvedja, Presevo and
Bujanovac municipalities is quite similar, as they are inhabited by more than 90%
of the Albanian population in Serbia. Hungarians live in 39 local self-government
units, but the highest concentration of this population is recorded in neighbouring
municipalities at the north of Vojvodina: Ada (75.96%), Kanjiza (86.32%), Senta
(80.31%), Subotica (35.95%), Coka (49.71%), Mali Idjos (54.38%), Backa Topola
(58.03%) and others. The only ethnically dispersed national minority in Serbia
are the Roma which live in 92 local self-government units, and do not exceed 5.5%
of total population in any of those.
These data indicate that it is easy to organize education in minority languages in
ethnically homogeneous communities, and such educational policy is demanded
by the National Councils of National Minorities which consider education in
mother tongue as the basis and prerequisite for the preservation of minority
identity.
During the research we have conducted interviews with the representatives of
seventeen minority local government units (see footnote 4) which confirmed the
assumption that cultural and spatial homogenization contributes to the
strengthening of national identity, establishing of links with compatriots and
institutions in home countries, but while also contributing to a more intensive
emigration of national minority populations.

19
2.3.1. Albanian national minority
Representatives of the National Council of Albanian national minority have
pointed out that Albanian students who had completed secondary school in their
mother tongue usually continue with their schooling in Kosovo, in Albania and
Macedonia, or EU countries, where they also find employment. This is caused by
social segregation of Albanians in Serbia, high ethnic distance towards the
representatives of this national minority17, but also by certain self-ghettoization
which is deepened by, among other things, the lack of familiarity with Serbian
language. Internal migrations of ethnic Albanian population are negligible,
according to the words of the representatives of minority self-government of
Albanians in Serbia.
These attitudes are confirmed by the data on the number of children, students
who go to public schools in Serbia and take the classes in Albanian language. This
comparison indicates a continuous decline of the number of children and students
taking classes in Albanian. Since we do not have the data on the number of
children attending the final year of elementary and secondary schools and the
number of children enrolling in secondary schools (after elementary school) and
universities (after secondary schools) in the Republic of Serbia,18 we cannot
decidedly state that ethnic Albanian students always decide to continue with their
studies outside of the Serbian school system. Still, considering the exceptionally
high ethnic distance of Serbs towards Albanians and vice versa, as well as the fact
that very few students enrol at university departments conducting their courses in
Albanian, we can conclude, with a high degree of certainty, that this assumption is
true. Also, the results of population census19 indicate that the members of this
17 Istraživanje stavova građana prema diskriminaciji, Commissioner for Protection of Equality, Belgrade, 2014. 18
According to the data provided by the Coordination Centre for the South of Serbia at all four years of studies in departments of the Nis University’s Faculties of Economy and Law located in Medvedja there are 258 students enrolled in bilingual courses, but there are no data on the ethnicity of students. 19
2011 Population Census – nationality, data by municipality and town, Statistical Office of the Republic of Serbia, Belgrade, 2014

20
minority, outside of the aforementioned municipalities traditionally inhabited by
the Albanian population, also live in the city of Belgrade (1,252) and in the area of
the AP of Vojvodina (2,252) where no form of lessons in Albanian is organized.
What we lack in order to efficiently estimate the integration of Albanians in the
Serbian society, and thus the assessment of the outreach of education in Albanian,
are the data on participation of Albanians in the work of public services. These
data are neither recorded nor expressed by the Human Resources Office of the
Government of the Republic of Serbia, nor by the majority of other state
authorities.
Table 2: The number of institutions, groups and children in preschool institutions where educational work is organized in Albanian (2007–2012)
School year Number
of LSU
The number of preschool institutions
The number of
groups
The number of
children
2007/2008 3 5 56 997
2008/2009 3 5 54 958
2009/2010 3 5 54 843
2010/2011 3 5 54 843
2011/2012 3 5 54 843
According to the records of School administration of Leskovac which manages the
educational institutions in Bujanovac, Presevo and Medvedja, in 2014/2015 there
were 53 groups with 608 children which took preschool classes in Albanian in these
municipalities.

21
Table 3: The number of institutions, groups and children in preschool institutions where educational work is organized bilingually in Albanian and Serbian
School year Number
of LSU
The number of preschool institutions
The number of
groups
The number of
children
2007/2008 3 3 3 31
2008/2009 3 3 3 35
2009/2010 3 3 3 36
2010/2011 3 3 3 35
2011/2012 3 3 3 35
Table 4: The number of elementary schools, classes and students where lessons are provided in Albanian in 2007 - 2012 and 2015
School year Number
of LSU
The number of schools
The number of
classes
The number of
students
2007/2008 3 17 411 8.775
2008/2009 No data
2009/2010 3 17 416 8.327
2010/2011 3 17 416 8.327
2011/2012 3 17 416 8.327
2014/2015 3 16 341 5.546
Table 5: The number of secondary schools, classes and students where lessons are provided in Albanian in 2007 - 2012 and 2015
School year Number
of LSU
The number of schools
The number of
classes
The number of
children
2007/2008 3 4 - 2.863
2008/2009 3 4 - 3.517
2009/2010 3 4 3.825 3.825
2010/2011 3 4 127 3.825
2011/2012 3 5 127 3.825
2014/15 3 - 125 2.365

22
Table 6: The number of departments and students at universities where the courses are provided in Albanian 2009-2012
School year The Department of the
Economic faculty of University in Nis and Medvedja
The Department of the Law faculty of University in Nis and Medvedja
In total
2009/2010 4 7 11
2010/2011 4 7 11
2011/2012 4 7 11
2.3.2. Bosniak national minority
At the meeting with the representatives of Bosniak national minority they have
pointed out that this population tends to migrate towards BiH, Turkey and EU
countries, and that seasonal migrations to Montenegro are also present.
According to the representatives of Bosniak minority self-government, these
migrations are caused by economic reasons, but also by institutional ignoring of
Bosniak interests, as well as the neglecting of the Sandzak area which they
traditionally inhabit.
Education in Bosnian is being introduced in the educational system, and it is
difficult to predict the consequences of this type of teaching on the integration of
Bosniak national minority in the society on the basis of the results of enrolment in
newly founded kindergartens and elementary schools, especially due to lack of
structure of curricula in Bosnian. Bosnian and Serbian language belong to the
same language group, so there is no communication barrier between minority and
majority population, and the insisting of Bosniak minority elf-government on
introduction of Bosnian language in school at all levels and their opposition to the
idea of bilingual curriculum, should be understood in the context of all measures
this body is implementing with the goal of preserving and protecting the Bosniak
national identity in Serbia.
23
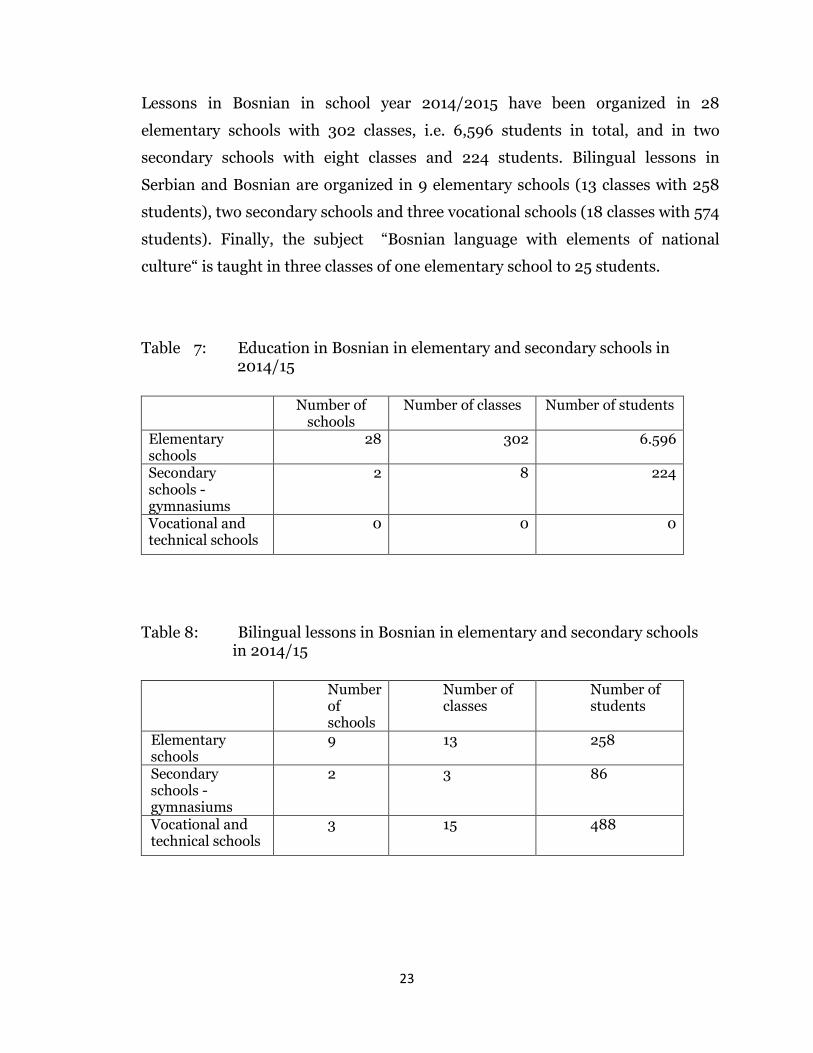
Lessons in Bosnian in school year 2014/2015 have been organized in 28
elementary schools with 302 classes, i.e. 6,596 students in total, and in two
secondary schools with eight classes and 224 students. Bilingual lessons in
Serbian and Bosnian are organized in 9 elementary schools (13 classes with 258
students), two secondary schools and three vocational schools (18 classes with 574
students). Finally, the subject “Bosnian language with elements of national
culture“ is taught in three classes of one elementary school to 25 students.
Table 7: Education in Bosnian in elementary and secondary schools in 2014/15
Number of schools
Number of classes Number of students
Elementary schools
28 302 6.596
Secondary schools - gymnasiums
2 8 224
Vocational and technical schools
0 0 0
Table 8: Bilingual lessons in Bosnian in elementary and secondary schools in 2014/15
Number of schools
Number of classes
Number of students
Elementary schools
9 13 258
Secondary schools - gymnasiums
2 3 86
Vocational and technical schools
3 15 488

24
Table 9: Bosnian language with elements of national culture in 2014/15
Number of schools
Number of classes Number of students
Elementary schools
1 3 25
Secondary schools -
gymnasiums
0 0 0
Vocational and technical schools
0 0 0
Table 10: Number of kindergartens where work with children is conducted in Bosnian in 2010 – 2012
School year Number
of LSU
Number of schools Number of
classes
Number of
children
2009/2010 2 2 61 1.030
2010/2011 3 3 96 2.250
2011/2012 3 4 112 2.420
Table 11: The number of elementary schools, classes and students
implementing lessons in Bosnian language in 2007 – 2012 period School year Number
of LSU
Number of schools Number of
classes
Number of
students
2007/2008 4 22 - 8.492
2008/2009 4 22 - 9.738
2009/2010 4 22 - 10.644
2010/2011 4 22 356 10.682
2011/2012 4 22 361 10.825
There are no courses in Bosnian at Serbian Universities, but the State university
of Novi Pazar is offering course “Bosnian language and elements of culture“
which has been elected by 40 students since the school year 2007/08.
25
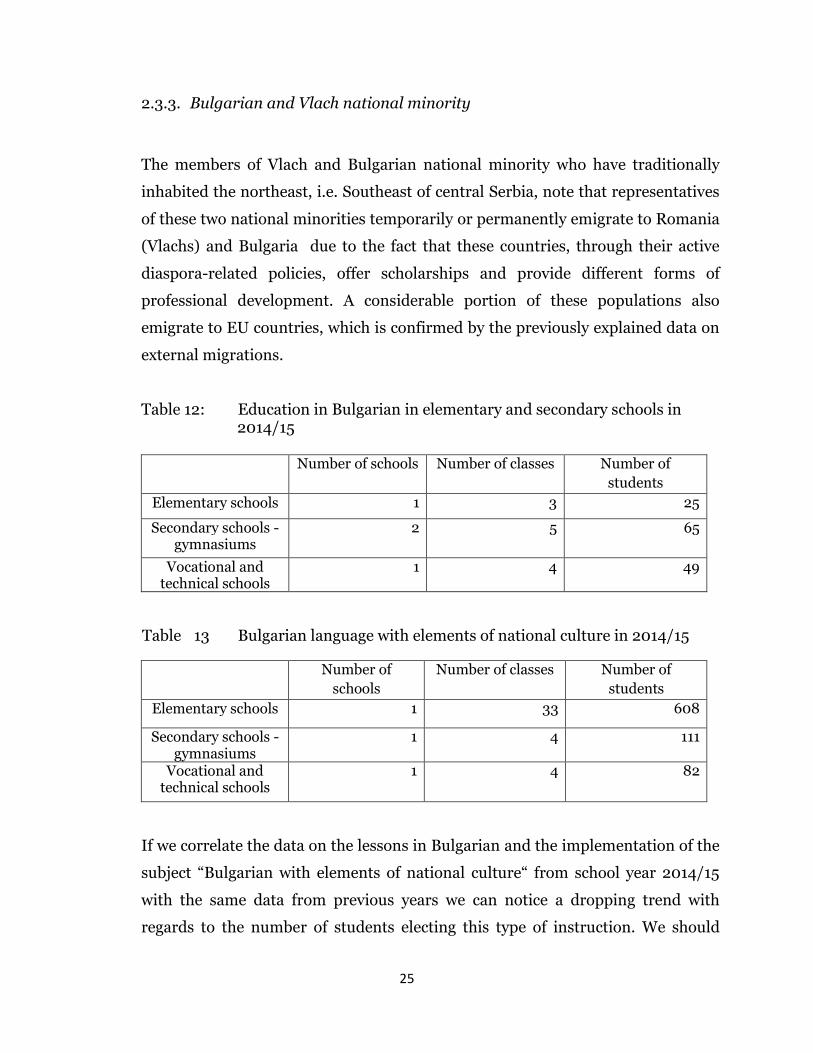
2.3.3. Bulgarian and Vlach national minority
The members of Vlach and Bulgarian national minority who have traditionally
inhabited the northeast, i.e. Southeast of central Serbia, note that representatives
of these two national minorities temporarily or permanently emigrate to Romania
(Vlachs) and Bulgaria due to the fact that these countries, through their active
diaspora-related policies, offer scholarships and provide different forms of
professional development. A considerable portion of these populations also
emigrate to EU countries, which is confirmed by the previously explained data on
external migrations.
Table 12: Education in Bulgarian in elementary and secondary schools in 2014/15
Number of schools Number of classes Number of
students
Elementary schools 1 3 25
Secondary schools - gymnasiums
2 5 65
Vocational and technical schools
1 4 49
Table 13 Bulgarian language with elements of national culture in 2014/15
Number of
schools
Number of classes Number of
students
Elementary schools 1 33 608
Secondary schools - gymnasiums
1 4 111
Vocational and technical schools
1 4 82
If we correlate the data on the lessons in Bulgarian and the implementation of the
subject “Bulgarian with elements of national culture“ from school year 2014/15
with the same data from previous years we can notice a dropping trend with
regards to the number of students electing this type of instruction. We should

26
especially highlight the fact that the number of secondary school students taking
lessons in Bulgarian in 2014/15 is equal to the half of students who elected this
type of instruction two years prior.
However, comparative data from the same period on the enrolment of students in
secondary schools where instruction is organized in Bulgarian indicate an
increase in the number of students from 87 in 2012 to 114 in school year
2014/2015.
Table 14: The number of elementary schools, classes and students implementing lessons in Bulgarian language in 2007 – 2012 period
School year Number
of LSU
Number of schools
Number of
classes
Number of
students
2007/2008 2 2 4 26
2008/2009 2 2 4 47
2009/2010 2 2 3 46
2010/2011 1 1 14 98
2011/2012 1 1 14 98
Table 15: The number of elementary schools, classes and students implementing the subject “Bulgarian with elements of national culture“20
20 The subject “Bulgarian language with elements of national culture” is delivered in elementary schools in four local self-government units: Babusnica, Dimitrovgrad, Ivanovo (Pancevo) and Surdulica.
School year Number
of LSU
Number of schools Number of
classes
Number of
children
2007/2008 2 2 - 672
2008/2009 2 2 - 675
2009/2010 2 2 - 1.330
2010/2011 4 5 57 736
2011/2012 4 5 57 736

27
In the elementary school in Ivanovo (in the city of Pancevo) the teaching of the
subject “Bulgarian with elements of national culture was organized in one class
for 10 students in school year 2014/15.
Table 16: The number of secondary schools, classes and students implementing lessons in Bulgarian language in 2007 – 2012 period
School year Number
of LSU
Number of schools Number of
classes
Number of
students
2009/2010 1 2 2 41
2010/2011 1 2 8 87
2011/2012 1 2 8 87
The course “Bulgarian language and literature“ is offered at the Faculty of
Philology of the University of Belgrade, within the Department for Serbian
language with South Slav Languages, Study programme for Bulgarian language
and Literature, module Bulgarian Language, Literature, Culture. In average 12
students enrol in Bulgarian language studies every school year, starting from
2007/08, and between 35 and 40 students are taking the studies in total at all
four years.
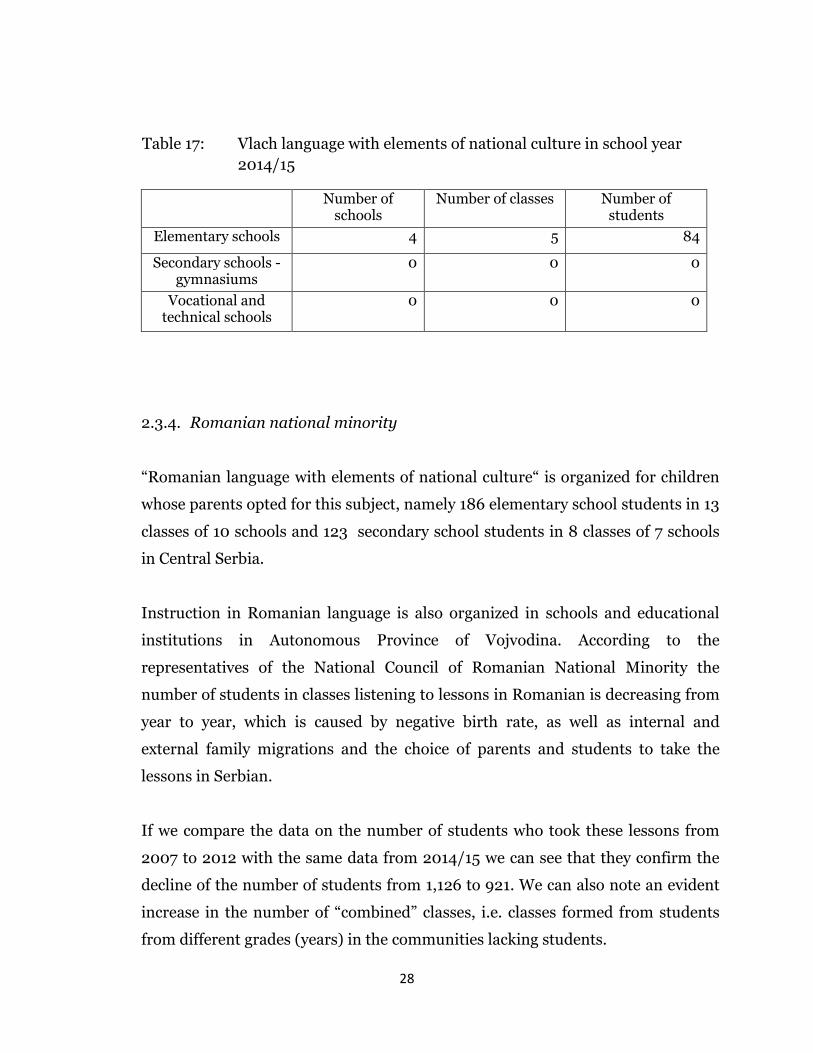
Lessons in Vlach language are organized in four elementary schools in three local
self-governments for 84 students. The lessons are provided by one teacher and
their delivery is exceptionally difficult due to the schedule which is not adapted to
the needs and time of neither the teacher nor the students. In spite of the fact that
a large number of citizens in Northeast Serbia speak Vlach language, few students
are choosing to study their mother tongue. According to the representatives of
National Vlach Council and the representatives of School Administrations in
Pozarevac and Zajecar this is caused by the status of the subject (optional, non-
mandatory), lack of textbooks, low number of teachers, but also by the social
pressure on parents to decide against choosing “Vlach speech with elements of
culture” as a subject for their children when filling in the questionnaire on
optional subjects.
28
Table 17: Vlach language with elements of national culture in school year
2014/15
Number of schools
Number of classes Number of students
Elementary schools 4 5 84
Secondary schools - gymnasiums
0 0 0
Vocational and technical schools
0 0 0
2.3.4. Romanian national minority
“Romanian language with elements of national culture“ is organized for children
whose parents opted for this subject, namely 186 elementary school students in 13
classes of 10 schools and 123 secondary school students in 8 classes of 7 schools
in Central Serbia.
Instruction in Romanian language is also organized in schools and educational
institutions in Autonomous Province of Vojvodina. According to the
representatives of the National Council of Romanian National Minority the
number of students in classes listening to lessons in Romanian is decreasing from
year to year, which is caused by negative birth rate, as well as internal and
external family migrations and the choice of parents and students to take the
lessons in Serbian.
If we compare the data on the number of students who took these lessons from
2007 to 2012 with the same data from 2014/15 we can see that they confirm the
decline of the number of students from 1,126 to 921. We can also note an evident
increase in the number of “combined” classes, i.e. classes formed from students
from different grades (years) in the communities lacking students.
29
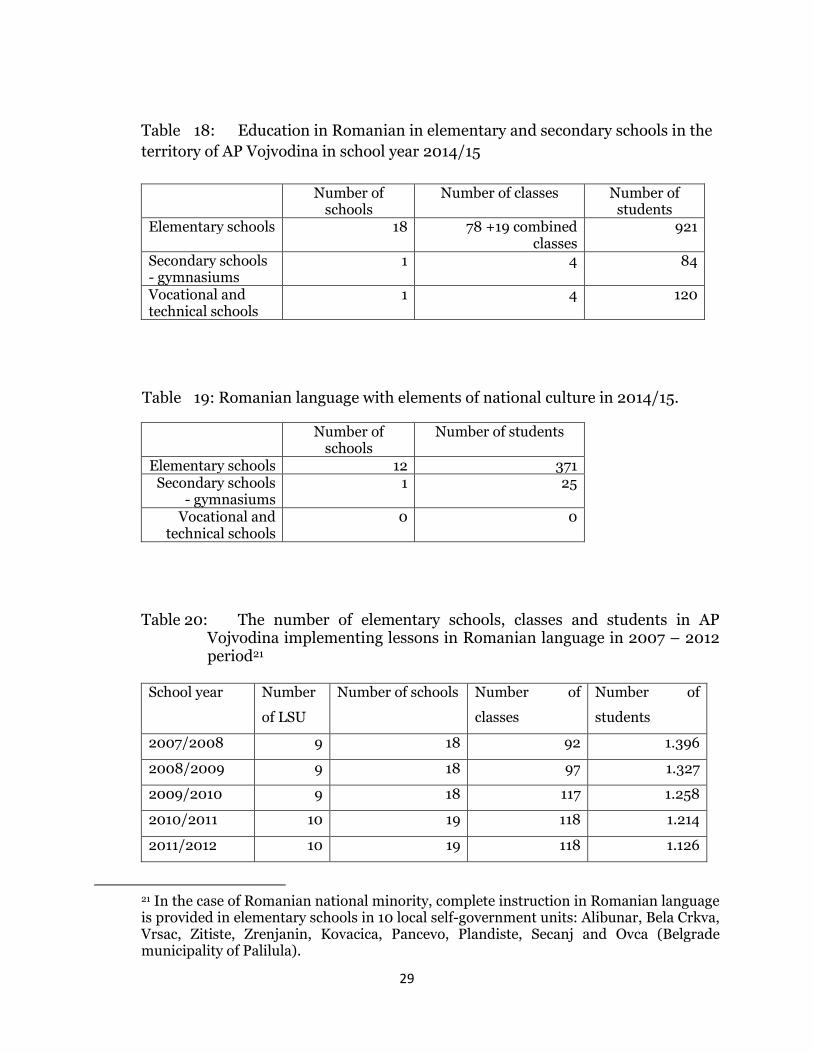
Table 18: Education in Romanian in elementary and secondary schools in the
territory of AP Vojvodina in school year 2014/15
Number of schools
Number of classes Number of students
Elementary schools 18 78 +19 combined classes
921
Secondary schools - gymnasiums
1 4 84
Vocational and technical schools
1 4 120
Table 19: Romanian language with elements of national culture in 2014/15.
Number of schools
Number of students
Elementary schools 12 371 Secondary schools
- gymnasiums 1 25
Vocational and technical schools
0 0
Table 20: The number of elementary schools, classes and students in AP Vojvodina implementing lessons in Romanian language in 2007 – 2012 period21
School year Number
of LSU
Number of schools Number of
classes
Number of
students
2007/2008 9 18 92 1.396
2008/2009 9 18 97 1.327
2009/2010 9 18 117 1.258
2010/2011 10 19 118 1.214
2011/2012 10 19 118 1.126
21 In the case of Romanian national minority, complete instruction in Romanian language is provided in elementary schools in 10 local self-government units: Alibunar, Bela Crkva, Vrsac, Zitiste, Zrenjanin, Kovacica, Pancevo, Plandiste, Secanj and Ovca (Belgrade municipality of Palilula).

30
Table 21: The number of elementary schools, classes and students in AP Vojvodina implementing the subject “Romanian with elements of national culture“22
Table 22: The number of elementary schools, classes and students
implementing lessons in Romanian language in 2007-2012 period 23 School year Number
of LSU
Number of schools Number of
classes
Number of
students
2007/2008 2 2 8 205
2008/2009 2 2 8 231
2009/2010 2 2 8 237
2010/2011 2 2 8 238
2011/2012 2 2 8 238
2.3.5. Hungarian national minority
At the meeting with the representatives of the National Council of Hungarian
National Minority we discussed the introduction of bilingual lessons which,
according to the opinion of the mayor and members of minority local self-
government, but also the teachers of Hungarian language, would reduce the
22 The subject “Romanian language with elements of national culture” is delivered in elementary schools in 9 local self-government units: Alibunar, Bac, Zitiste, Zrenjanin, Kovacica, Kovin, Plandiste, Secanj and Ovca (Belgrade municipality of Palilula). 23 In the case of Romanian students the complete instruction in Romanian language is delivered in secondary schools in Alibunar and Vrsac.
School year Number
of LSU
Number of schools Number of
classes
Number of
children
2007/2008 11 13 - 319
2008/2009 10 11 - 268
2009/2010 8 9 - 244
2010/2011 9 10 10 216
2011/2012 9 10 10 256

31
chances of Hungarian minority population to preserve their national identity.
Bilingual Serbian-Hungarian lessons are not desirable because, in the opinion of
the National Council members, they would open the door to assimilation. On the
other hand, bilingual lessons would be acceptable if organized in Hungarian and
another foreign language (such as English or German). The issue highlighted by
the representatives of Hungarian minority self-government, and which indicates
the homogenization of Hungarian ethnic and linguistic space in Northern
Vojvodina and the accelerated depopulation of Hungarian population in the areas
of Vojvodina they have traditionally inhabited, is that a decreasing number of
students is available for the forming of classes in Hungarian language in Novi Sad
and specific parts of Banat and Srem.
In AP Vojvodina teaching for children and students of Hungarian nationality is
organized through the classes in mother tongue and the delivery of the subject
“Hungarian language with elements of national culture“.
Table 23: Education in Hungarian in elementary and secondary schools in the
territory of AP Vojvodina in school year 2014/15
Number of schools
Number of classes Number of students
Elementary schools
74 884 + 37 comb. classes
14.308
Secondary schools - gymnasiums
10 65 1.235
Vocational and technical schools
27 245 4.967
Table 24: Hungarian language with elements of national culture in 2014/15.
Number of schools Number of students Elementary schools
57 2.604
Secondary schools - gymnasiums
- -
Vocational and technical schools
2 35
32
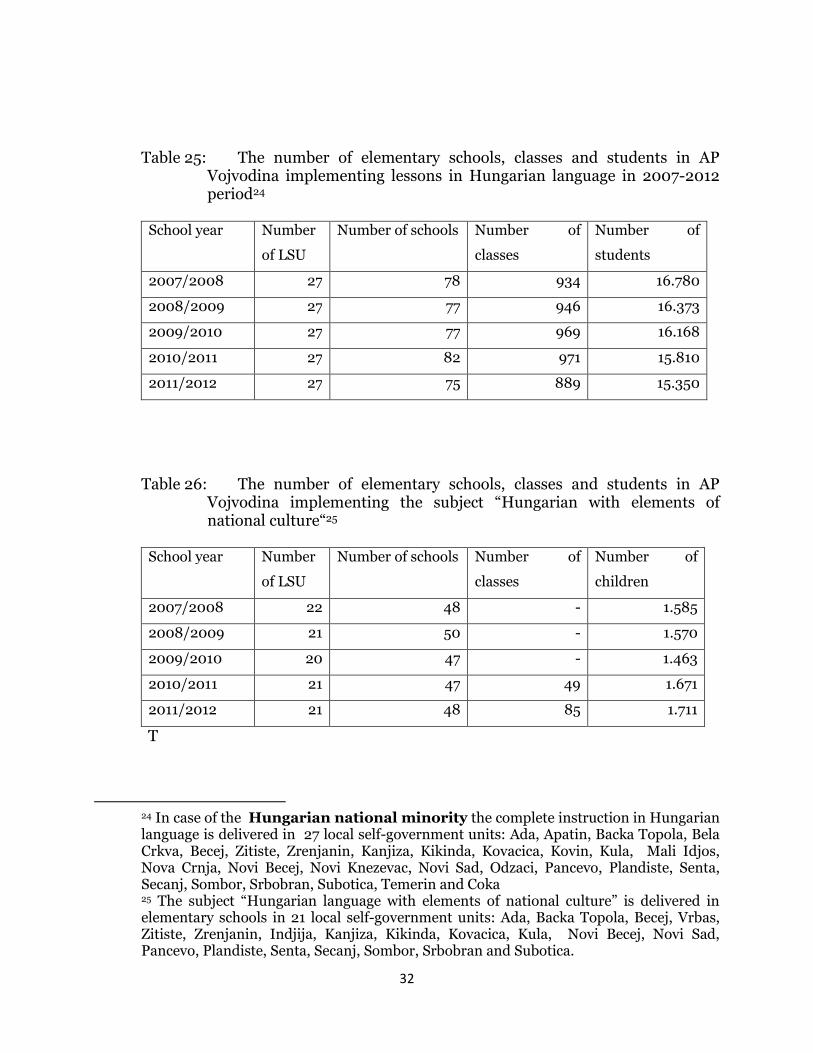
Table 25: The number of elementary schools, classes and students in AP Vojvodina implementing lessons in Hungarian language in 2007-2012 period24
School year Number
of LSU
Number of schools Number of
classes
Number of
students
2007/2008 27 78 934 16.780
2008/2009 27 77 946 16.373
2009/2010 27 77 969 16.168
2010/2011 27 82 971 15.810
2011/2012 27 75 889 15.350
Table 26: The number of elementary schools, classes and students in AP Vojvodina implementing the subject “Hungarian with elements of national culture“25
T
24 In case of the Hungarian national minority the complete instruction in Hungarian language is delivered in 27 local self-government units: Ada, Apatin, Backa Topola, Bela Crkva, Becej, Zitiste, Zrenjanin, Kanjiza, Kikinda, Kovacica, Kovin, Kula, Mali Idjos, Nova Crnja, Novi Becej, Novi Knezevac, Novi Sad, Odzaci, Pancevo, Plandiste, Senta, Secanj, Sombor, Srbobran, Subotica, Temerin and Coka 25 The subject “Hungarian language with elements of national culture” is delivered in elementary schools in 21 local self-government units: Ada, Backa Topola, Becej, Vrbas, Zitiste, Zrenjanin, Indjija, Kanjiza, Kikinda, Kovacica, Kula, Novi Becej, Novi Sad, Pancevo, Plandiste, Senta, Secanj, Sombor, Srbobran and Subotica.
School year Number
of LSU
Number of schools Number of
classes
Number of
children
2007/2008 22 48 - 1.585
2008/2009 21 50 - 1.570
2009/2010 20 47 - 1.463
2010/2011 21 47 49 1.671
2011/2012 21 48 85 1.711

33
Table 27: The number of secondary schools, classes and students in AP Vojvodina implementing lessons in Hungarian language in 2007-2012 period26
School year Number
of LSU
Number of schools Number of
classes
Number of
students
2007/2008 12 35 312 6.648
2008/2009 12 35 308 6.487
2009/2010 12 36 312 6.502
2010/2011 12 38 330 6.997
2011/2012 12 38 326 7.092
The number of students of Hungarian nationality taking classes in Hungarian is
constantly declining, and it has dropped from 16,780 in 78 elementary schools in
school year 2007/08 to 14,308 in 74 elementary schools in 2014/15. At the same
time, the number of students taking “Hungarian with elements of national
culture” is increasing– from 1,585 students in 48 elementary schools in 2007/08
to 2,607 students in 57 elementary schools in 2014/15. The number of secondary
school students taking classes in Hungarian language reached 7,092 in school
year 2011/12, but it experienced a sharp decline in the next two years, resulting in
6,211 students in school year 2014/15.
2.3.6. Slovak national minority
The representatives of National Council of Slovak National Minority also
highlighted the decline in the number of school children and a strong trend of
external migrations of student population to Slovakia, encouraged by favourable
scholarships and better employment opportunities. The problems with education
in Slovakian are related to the status of the subject “Slovak language with
elements of national culture“ (optional, non-mandatory subject) and the declining
26 In the case of Hungarian students the complete instruction in Hungarian language is delivered in secondary schools in 12 local self-government units: Ada, Backa Topola, Becej, Zrenjanin, Kanjiza, Novi Sad, Novi Knezevac, Senta, Sombor, Subotica, Temerin and Coka.
34
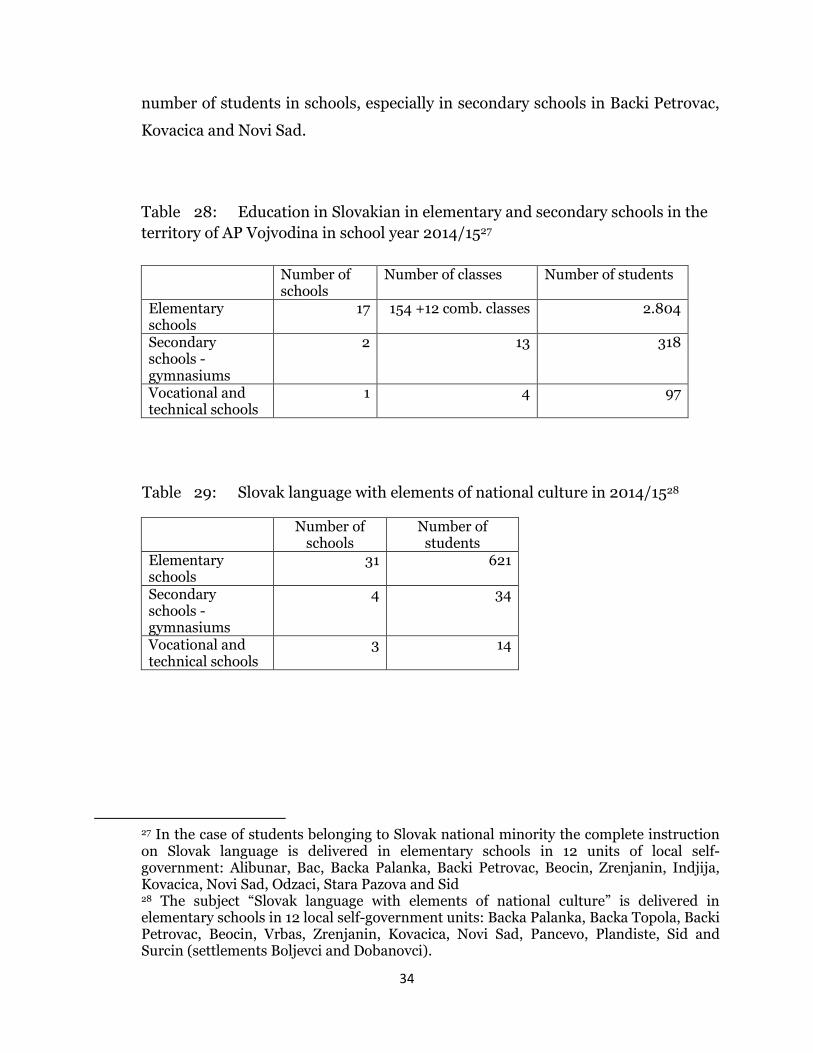
number of students in schools, especially in secondary schools in Backi Petrovac,
Kovacica and Novi Sad.
Table 28: Education in Slovakian in elementary and secondary schools in the
territory of AP Vojvodina in school year 2014/1527
Number of schools
Number of classes Number of students
Elementary schools
17 154 +12 comb. classes 2.804
Secondary schools - gymnasiums
2 13 318
Vocational and technical schools
1 4 97
Table 29: Slovak language with elements of national culture in 2014/1528
Number of schools
Number of students
Elementary schools
31 621
Secondary schools - gymnasiums
4 34
Vocational and technical schools
3 14
27 In the case of students belonging to Slovak national minority the complete instruction on Slovak language is delivered in elementary schools in 12 units of local self-government: Alibunar, Bac, Backa Palanka, Backi Petrovac, Beocin, Zrenjanin, Indjija, Kovacica, Novi Sad, Odzaci, Stara Pazova and Sid 28 The subject “Slovak language with elements of national culture” is delivered in elementary schools in 12 local self-government units: Backa Palanka, Backa Topola, Backi Petrovac, Beocin, Vrbas, Zrenjanin, Kovacica, Novi Sad, Pancevo, Plandiste, Sid and Surcin (settlements Boljevci and Dobanovci).

35
Table 30: The number of elementary schools, classes and students in AP Vojvodina implementing lessons in Slovak language in 2007-2012 period
School year Number
of LSU Number of schools Number of
classes
Number of
students
2007/2008 12 17 166 3.233
2008/2009 12 17 168 3.226
2009/2010 12 17 172 3.178
2010/2011 12 17 172 3.117
2011/2012 12 17 170 3.183
Table 31: The number of elementary schools, classes and students in AP Vojvodina implementing the subject “Slovak language with elements of national culture“
Table 32: The number of secondary schools, classes and students in AP Vojvodina implementing lessons in Slovak language in 2007-2012 period29
School year Number
of LSU Number of schools Number of
classes
Number of
students
2007/2008 2 2 14 379
2008/2009 2 2 13 341
2009/2010 2 2 14 344
2010/2011 3 3 15 353
2011/2012 3 4 15 381
29 In the case of Slovak students instruction in Slovak language is delivered in secondary schools in Backi Petrovac, Kovacica and Novi Sad.
School year Number
of LSU
Number of schools Number of
classes
Number of
children
2007/2008 11 34 - 588
2008/2009 10 37 - 616
2009/2010 11 38 - 620
2010/2011 12 39 39 663
2011/2012 12 39 39 548

36
Table 33: The number of secondary schools, classes and students in AP Vojvodina implementing the subject “Slovak language with elements of national culture“30
2.3.7. Rusyn national minority
The classes in Rusyn language are delivered in three elementary schools and one
secondary school to a total of 500 students, with a noticeable downward trend
regarding the number of students listening to lessons in their mother tongue, with
588 students in 2007/08, 587 in 2011/12 and finally 443 in school year 2014/15.
At the meeting with the representatives of the Rusyn National Council it was
stated that the number of school children is dropping due to external migrations
to (usually) Canada and internal migrations to big cities where the members of
Rusyn national minority, who are usually highly educated and trained, have better
chances for employment.
30 The subject “Slovak language with elements of national culture” is delivered in secondary schools in five local self-government units: Backa Palanka, Backi Petrovac, Kovacica, Stara Pazova and Sid.
School year Number
of LSU
Number of schools Number of
classes
Number of
children
2007/2008 2 7 18 182
2008/2009 2 6 12 161
2009/2010 2 6 12 131
2010/2011 5 7 17 335
2011/2012 5 7 17 331

37
Table 34: Education in Rusyn language in elementary and secondary schools
in the territory of AP Vojvodina in school year 2014/15
Number of schools
Number of classes
Number of students
Elementary schools
3 30 443
Secondary schools - gymnasiums
1 4 57
Vocational and technical schools
0 0 0
Table 35: Rusyn language with elements of national culture 2014/15
Number of schools
Number of students
Elementary schools
22 326
Secondary schools - gymnasiums
1 10
Vocational and technical schools
0 0
Table 36: The number of elementary schools, classes and students in AP Vojvodina implementing lessons in Rusyn language in 2007-2012 period31
School year Number
of LSU Number of schools Number of
classes
Number of
students
2007/2008 3 3 35 588
2008/2009 3 3 35 559
2009/2010 3 3 34 523
2010/2011 3 3 35 518
2011/2012 3 3 33 487
31 In the case of Rusyn students the complete instruction in Rusyn language is delivered in elementary schools in 3 local self –government units: Vrbas, Zabalj and Kula

38
Table 37: The number of elementary schools, classes and students in AP Vojvodina implementing the subject “Rusyn language with elements of national culture“32
Table
TTable 38: The number of secondary schools, classes and students in AP Vojvodina implementing lessons in Rusyn language in 2007-2012 period 33
Ta Table 39: The number of secondary schools, classes and students in AP Vojvodina implementing the subject “Rusyn language with elements of national culture“34
2
32 The subject “Rusyn language with elements of national culture” is delivered in elementary schools in 8 local self-government units: Backa Topola, Vrbas, Zabalj, Kula, Novi Sad, Sremska Mitrovica, Subotica and Sid. 33 In the case of Rusyn students the complete instruction in Rusyn language is delivered in the Gymnasium in Ruski Krstur. 34 The subject “Rusyn language with elements of national culture” is delivered in secondary schools in in Novi Sad and Sid.
School year Number
of LSU
Number of schools Number of
classes
Number of
children
2007/2008 7 22 - 286
2008/2009 7 24 - 216
2009/2010 7 27 - 266
2010/2011 7 27 33 257
2011/2012 8 28 41 334
School year Number
of LSU
Number of schools Number of
classes
Number of
children
2007/2008 1 1 4 69
2008/2009 1 1 4 60
2009/2010 1 1 4 60
2010/2011 1 1 4 60
2011/2012 1 1 4 65
School year Number
of LSU
Number of schools Number of
classes
Number of
children
2007/2008 1 1 1 3
2008/2009 2 2 2 25
2009/2010 2 2 2 41
2010/2011 2 2 3 70
2011/2012 2 2 3 72
39
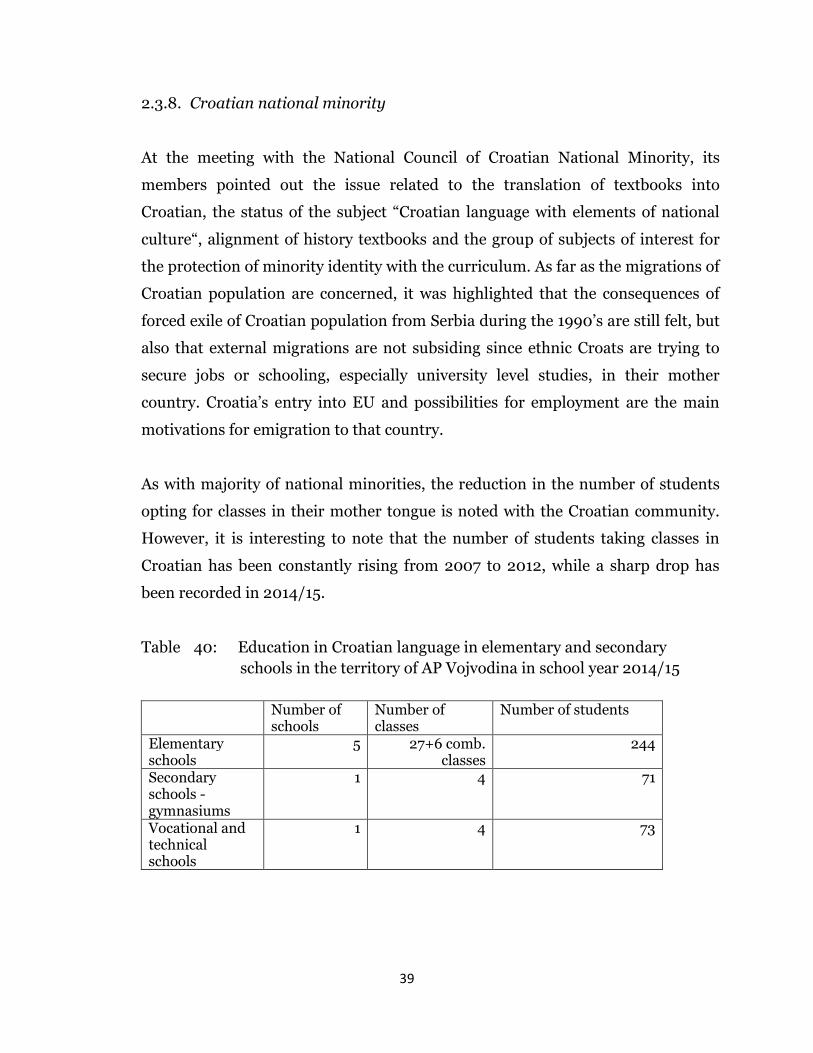
2.3.8. Croatian national minority
At the meeting with the National Council of Croatian National Minority, its
members pointed out the issue related to the translation of textbooks into
Croatian, the status of the subject “Croatian language with elements of national
culture“, alignment of history textbooks and the group of subjects of interest for
the protection of minority identity with the curriculum. As far as the migrations of
Croatian population are concerned, it was highlighted that the consequences of
forced exile of Croatian population from Serbia during the 1990’s are still felt, but
also that external migrations are not subsiding since ethnic Croats are trying to
secure jobs or schooling, especially university level studies, in their mother
country. Croatia’s entry into EU and possibilities for employment are the main
motivations for emigration to that country.
As with majority of national minorities, the reduction in the number of students
opting for classes in their mother tongue is noted with the Croatian community.
However, it is interesting to note that the number of students taking classes in
Croatian has been constantly rising from 2007 to 2012, while a sharp drop has
been recorded in 2014/15.
Table 40: Education in Croatian language in elementary and secondary
schools in the territory of AP Vojvodina in school year 2014/15
Number of schools
Number of classes
Number of students
Elementary schools
5 27+6 comb. classes
244
Secondary schools - gymnasiums
1 4 71
Vocational and technical schools
1 4 73
40
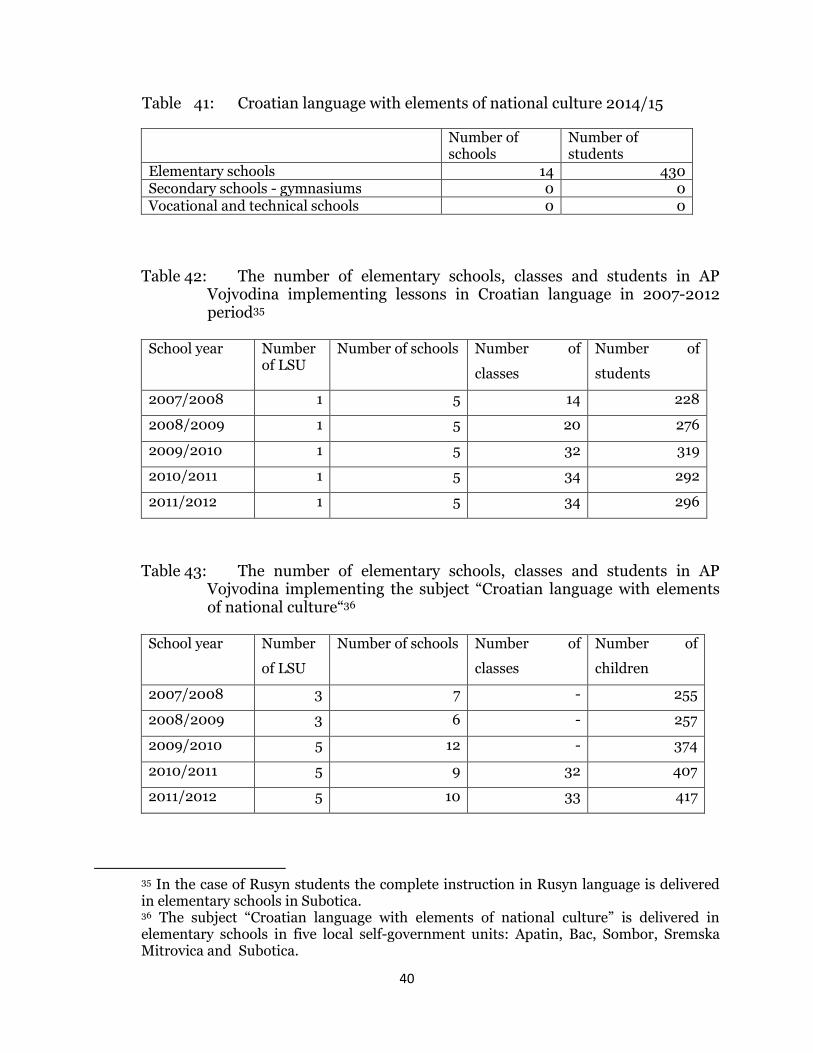
Table 41: Croatian language with elements of national culture 2014/15
Number of schools
Number of students
Elementary schools 14 430 Secondary schools - gymnasiums 0 0 Vocational and technical schools 0 0
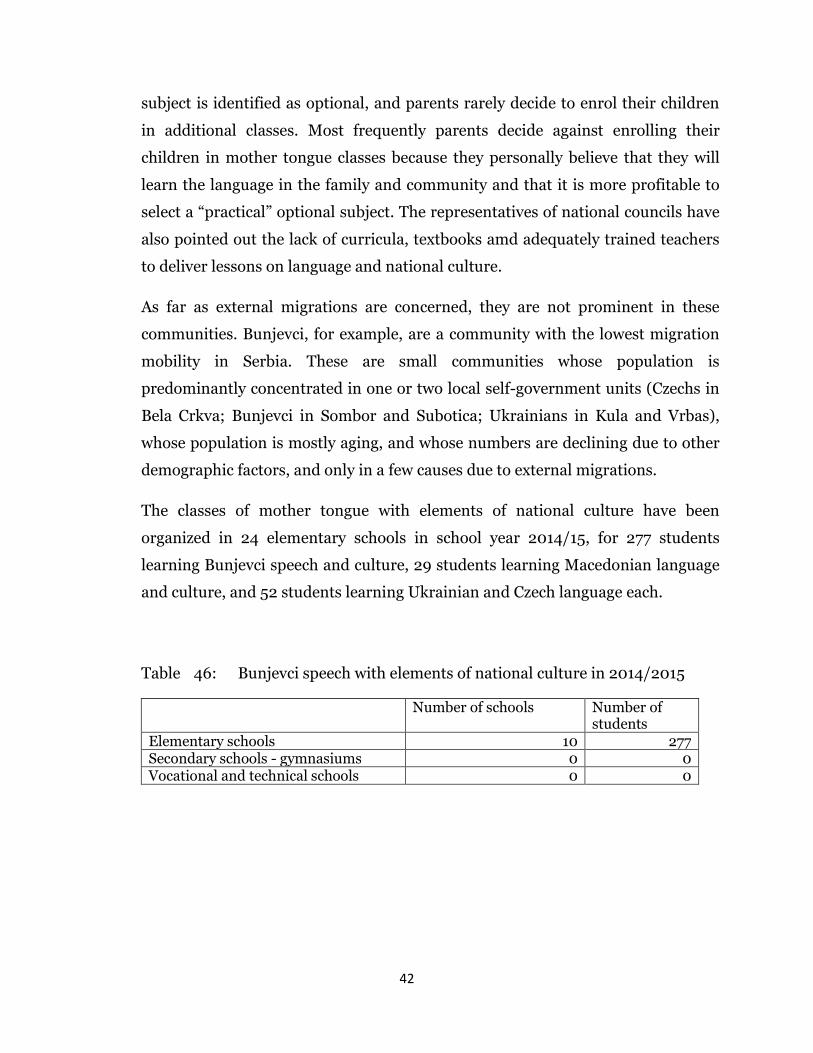
Table 42: The number of elementary schools, classes and students in AP
Vojvodina implementing lessons in Croatian language in 2007-2012 period35
School year Number
of LSU Number of schools Number of
classes
Number of
students
2007/2008 1 5 14 228
2008/2009 1 5 20 276
2009/2010 1 5 32 319
2010/2011 1 5 34 292
2011/2012 1 5 34 296
Table 43: The number of elementary schools, classes and students in AP
Vojvodina implementing the subject “Croatian language with elements of national culture“36
35 In the case of Rusyn students the complete instruction in Rusyn language is delivered in elementary schools in Subotica. 36 The subject “Croatian language with elements of national culture” is delivered in elementary schools in five local self-government units: Apatin, Bac, Sombor, Sremska Mitrovica and Subotica.
School year Number
of LSU
Number of schools Number of
classes
Number of
children
2007/2008 3 7 - 255
2008/2009 3 6 - 257
2009/2010 5 12 - 374
2010/2011 5 9 32 407
2011/2012 5 10 33 417

41
Table 44: The number of secondary schools, classes and students in AP Vojvodina implementing lessons in Croatian language in 2007-2012 period37
School year Number
of LSU Number of schools Number of
classes
Number of
students
2007/2008 1 1 1 15
2008/2009 1 1 2 43
2009/2010 1 1 2 32
2010/2011 1 2 6 97
2011/2012 1 3 7 128
Table 45: The number of secondary schools, classes and students in AP Vojvodina implementing the subject “Croatian language with elements of national culture“38
2.3.9. “Smaller” national minorities – Macedonians, Bunjevci, Czechs and
Ukrainians
At the meetings with representatives of National Councils of Bunjevci,
Macedonians, Ukrainians and Czechs they have highlighted the issue faced by the
small minority communities whose members have access to language lessons with
elements of national culture as the only form of education in minority language.
The small number of children applying for these classes is caused by the status of
the subject; namely, pursuant to legislation regulating the education system this
37 In the case of Croatian students, the complete instruction in Croatian language is delivered in secondary schools in Subotica. 38 The subject “Croatian language with elements of national culture” is delivered in secondary schools in Subotica.
School year Number
of LSU
Number of schools Number of
classes
Number of
children
2009/2010 1 1 1 4
2010/2011 1 1 1 4
2011/2012 1 6 6 37
42
subject is identified as optional, and parents rarely decide to enrol their children
in additional classes. Most frequently parents decide against enrolling their
children in mother tongue classes because they personally believe that they will
learn the language in the family and community and that it is more profitable to
select a “practical” optional subject. The representatives of national councils have
also pointed out the lack of curricula, textbooks amd adequately trained teachers
to deliver lessons on language and national culture.
As far as external migrations are concerned, they are not prominent in these
communities. Bunjevci, for example, are a community with the lowest migration
mobility in Serbia. These are small communities whose population is
predominantly concentrated in one or two local self-government units (Czechs in
Bela Crkva; Bunjevci in Sombor and Subotica; Ukrainians in Kula and Vrbas),
whose population is mostly aging, and whose numbers are declining due to other
demographic factors, and only in a few causes due to external migrations.
The classes of mother tongue with elements of national culture have been
organized in 24 elementary schools in school year 2014/15, for 277 students
learning Bunjevci speech and culture, 29 students learning Macedonian language
and culture, and 52 students learning Ukrainian and Czech language each.
Table 46: Bunjevci speech with elements of national culture in 2014/2015
Number of schools Number of students
Elementary schools 10 277 Secondary schools - gymnasiums 0 0 Vocational and technical schools 0 0

43
Table 47: The number of elementary schools, classes and students in AP Vojvodina implementing the subject “Bunjevci speech with elements of national culture” in 2007-2008
Table 48: Macedonian language with elements of national culture 2014/2015
Number of schools
Number of students
Elementary schools 2 29 Secondary schools - gymnasiums 0 0 Vocational and technical schools 0 0
Table 49: The number of elementary schools, classes and students in AP
Vojvodina implementing the subject “Macedonian language with elements of national culture“
Table 50: Ukrainian language with elements of national culture in 2014/2015
Number of schools
Number of students
Elementary schools 9 111 Secondary schools - gymnasiums 0 0 Vocational and technical schools 0 0
School year Number
of LSU
Number of schools Number of
classes
Number of
children
2007/2008 1 1 1 15
2008/2009 1 2 4 115
2009/2010 1 2 4 92
2010/2011 2 18 32 267
2011/2012 2 20 33 338
School year Number
of LSU
Number of schools Number of
classes
Number of
children
2010/2011 1 1 1 5
2011/2012 1 1 1 5

44
Table 51: The number of elementary schools, classes and students in AP Vojvodina implementing the subject “Ukrainian language with elements of national culture“
Table 52: Czech language with elements of national culture in 2014/2015
Number of schools
Number of students
Elementary schools
3 52
Secondary schools - gymnasiums
0 0
Vocational and technical schools
0 0
2.3.10. Roma national minority
At the meeting with National Council of Roma, its representatives have
highlighted the specific issues faced by the members of this national minority.
This is a very young population whose members live dispersed in the entire
territory of Serbia and who are extremely mobile. Their migration potential is
high and characterized by internal seasonal migrations toward large cities
(primarily Belgrade and Novi Sad), as well as external migrations to EU countries.
Migrations are primarily motivated by economic reasons, and caused by the
discrimination Roma are facing in their social life and when attempting to
exercise their rights, as well as by the low education levels presenting a barrier to
both employment and personal development.
School year Number
of LSU
Number of schools Number of
classes
Number of
children
2007/2008 4 9 - 228
2008/2009 4 9 - 105
2009/2010 4 9 - 114
2010/2011 5 11 17 97
2011/2012 5 10 16 120

45
Although an effort has been made during last few years to increase the coverage of
Roma children by elementary school education, and to promote their enrolment
into secondary schools and universities, the percentage of children dropping out
of elementary school remains high, children's achievements in schools are several
times lower than the achievements of children of other nationalities, legally
regulated support to children and their families is not adapted to their needs,
there are no affirmative measures for tangible support to families and students
during schooling, and the existing affirmative measures do not actually contribute
to improvement of Roma education.
With regards to instruction in Roma language, the National Council considers
that the subject “Roma language with elements of national culture” is an
acceptable form of education for the Roma community. However, even in the case
of this subject there are no conditions for the organization of lessons in line with
the teaching standards and legally proscribed requirements. The favourable
circumstance is that there are approved curricula and some textbooks. What
remains an issue is a lack of trained teachers who would deliver lessons in “Roma
language and elements of culture“. The majority of teachers teaching this subject
in 38 Vojvodina schools are not trained language teachers and lack the necessary
methodological skills to work with children.
The small number of children taking “Roma language and elements of culture” is
caused, as it was previously mentioned, by the non-mandatory, optional status of
this subject and by parents’ belief that it is better for children to take some other
subjects since they will learn the mother tongue in their families.
Table 53 Roma language with elements of national culture in 2014/2015
Number of schools
Number of students
Elementary schools
39 978
Secondary schools - gymnasiums
0 0
Vocational and technical schools
0 0
46
3. Conclusions on the impact of education in national minority languages on external migrations
The conducted research has demonstrated the causal connection between the
education in national minority languages and temporary or permanent
emigration of national minority population to their countries of origin. The
research has determined that external migrations are not favoured only by the
representatives of Albania and Hungarian national minority, who have access to
developed curricula in their mother tongues at all levels, but that the
representatives of Bosniak, Croatian, Vlach, Romanian, Roma and other national
minorities also often decide to emigrate. The number of persons with university
degrees among the migrants is rising, while returnees are mostly persons with
lower education levels.
The identified causality between the total education in mother tongue and
frequent migrations to countries of origin indicate another weakness of Serbia’s
multiculturalism policy. Namely, one of the key objectives of education on
national minority languages is the strengthening of their ethnic and cultural
identities and reduction of possibilities for assimilation. However, the emigration
of precisely those young professionals educated in their mother tongues weakens
the resistance of community to dissolution of identity.
On the other hand, we should keep in mind that as far as the process of deciding
whether to temporarily or permanently emigrate to the country of origin is
concerned, the decisive factor is not the lack of cultural, linguistic and formal and
normative obstacles to reception of emigrants in the society of the receiving
country, but instead economic motivation, lack of employment possibilities, low
earnings, ethnic distance and discrimination faced by minority members.
Although there are no studies (or at least no studies known to this author) of the
emigrants’ attitudes which would clearly indicate the personal motivation for
emigration, it seems that financial reasons overweigh the “ethnic” ones.
47
The fact that members of those minorities who speak languages close to Serbian
also opt for emigration, and that the external migrations are usually directed
towards other European countries, USA and Canada, indicate that the language
and ethnic background are not the key factors with regards to the choice of
destination country.
However, the decision of minority population on temporary or permanent
emigration is influenced by the experiences gained in ethnically and linguistically
homogeneous areas where there is a hidden, and often even clearly evident ethnic
distance towards the majority population and vice versa. Segregation policy of
multiculturalism, which is among other things implemented by separating
children in the education system, creates factual, as well as psychological,
obstacles to the inclusion of minority population in the social life outside of the
limits of their own ethnical and cultural community.
Such feeling, i.e. lack of individual readiness for social integration, which implies
the lack of familiarity with Serbian language in a large number of national
minority members, reduces the possibility for social integration. In such social
circumstances, the representatives of national minorities, especially the younger
population, seek the options for vertical and horizontal social mobility in their
countries of origin, where the obstacles to social integration are lower.
Internal migrations, especially in the case of Roma, which are characterized by
seasonal mobility, should not be, and yet are, a strong factor negatively impacting
the education of children and students. A temporary absence from the place of
residence should not imply the absence from school, because the educational
system includes the monitoring of student movement and manner of their
involvement in the teaching process in different schools. This is a case of a lack of
adjustment of the education system to the needs and circumstances in the Roma
community. In relation to this, it should be mentioned that the state, despite the
education system reform, has failed to develop mechanisms which would enable
the schooling and involvement of Roma students in line with the standards

48
adopted through the National Strategy for the Improvement of the Position of
Roma in the 2009-2015 period and the accompanying Education Action Plan.39
A response to the pronounced external migrations of minority population, as well
as to internal migration towards ethnically homogeneous minority culture centres
should be sought in the development of general economic and social
circumstances, development of the culture of human rights and implementation
of anti-discriminatory policies, strengthening of mutual trust between ethnic
groups, which among other things implies a focus on integrative multicultural
policy. Bilingual or multilingual curricula enabling equal learning of Serbian,
minority and foreign languages in specific parts of the country or in all schools is
especially appropriate for the policy focused on social integration of minorities.
Such policy requires a change of curricula, development of professionals capable
of working in a multicultural society, and the alignment of normative,
administrative and school system with the principles of integrative
multiculturalism (interculturality).
The question remains of how prepared the contemporary Serbian society is for
comprehensive changes of the cultural policy and the reform of multiple social
and administrative systems, including the educational one, aimed at enabling the
preservation of a multicultural society. External circumstances which have been
marked during the last few decades by ethnic homogenization of states in the
region and the spirit of “Eurocentrism” when faced with cultural changes do not
favour the establishment of the policy of integrative multiculturalism. However,
that does not mean that the existing gaps of the multiculturalism policy should
not be addressed, especially in relation to the policy of national minorities’
education and the migration policy. In that sense, while maintaining and
developing full education in minority language, we should simultaneously
strengthen bilingual education, which is identified in the law, but completely
neglected in practical education; create the conditions for top-quality delivery of
the subject “National minority language with elements of national culture“;
39 Strategy for the Improvement of the Position of Roma 2009-2015, Ministry of Human and Minority Rights, Belgrade, 2010.

49
implement Serbian language lessons for minority children being schooled in their
mother tongue, in order to eliminate language obstacles to their full social
integration awaiting them after the completion of elementary or secondary
education; and provide top-quality classes in language and culture of national
minorities for all students regardless of their ethnicity in multi-ethnic regions
traditionally inhabited by both Serbian and minority population.
The aforementioned suggestions do not advocate for impossible and unfeasible
changes in public education policies. They would contribute to social cohesion,
reduction of ethnic distance and empowering of total social resources for
preservation of identity of national minorities. External migrations would not be
completely eliminated with these reforms, since reasons motivating people to
emigrate are complex, and, as it was previously mentioned, do not imply only the
ethnic and linguistic closeness with compatriots in the country of the origin, but
would definitely alleviate their consequences.
50
List of tables and pictures
Tables
1 National minorities according to the 2011 Census
2 The number of institutions, groups and children in preschool institutions
where educational work is organized in Albanian (2007–2012)
3 The number of institutions, groups and children in preschool institutions
where educational work is organized bilingually in Albanian and Serbian
4 The number of elementary schools, classes and students where lessons are
provided in Albanian in 2007 - 2012 and 2015
5 The number of secondary schools, classes and students where lessons are
provided in Albanian in 2007 - 2012 and 2015
6 The number of departments and students at universities where the courses are provided in Albanian in 2009-2012
7 Education in Bosnian in elementary and secondary schools in 2014/15 8 Bilingual lessons in Bosnian in elementary and secondary schools in 2014/15 9 Bosnian language with elements of national culture 2014/15
10 Number of kindergartens where work with children is conducted in Bosnian in 2010 – 2012
11 The number of elementary schools, classes and students implementing lessons in Bosnian language in 2007 – 2012 period
12 Education in Bulgarian in elementary and secondary schools in 2014/15 13 Bulgarian language with elements of national culture in 2014/15
14 The number of elementary schools, classes and students implementing lessons in Bulgarian language in 2007-2012 period
15 The number of elementary schools, classes and students implementing the subject “Bulgarian with elements of national culture“
16 The number of secondary schools, classes and students implementing lessons in Bulgarian language in 2007-2012 period
17 Vlach language with elements of national culture in school year 2014/15
18 Education in Romanian in elementary and secondary schools in the territory
of AP Vojvodina in school year 2014/15
19 Romanian language with elements of national culture 2014/15
20 The number of elementary schools, classes and students in AP Vojvodina implementing lessons in Romanian language in 2007 – 2012 period
21 The number of elementary schools, classes and students in AP Vojvodina implementing the subject “Romanian with elements of national culture “
22 The number of secondary schools, classes and students implementing lessons in Romanian language in 2007-2012 period
23 Education in Hungarian in elementary and secondary schools in the territory of AP Vojvodina in school year 2014/15
24 Hungarian language with elements of national culture 2014/15 25 The number of elementary schools, classes and students in AP Vojvodina
implementing lessons in Hungarian language in 2007-2012 period

51
26 The number of elementary schools, classes and students in AP Vojvodina implementing the subject “Hungarian with elements of national culture“
27 The number of secondary schools, classes and students in AP Vojvodina implementing lessons in Hungarian language in 2007-2012 period
28 Education in Slovakian in elementary and secondary schools in the territory of AP Vojvodina in school year 2014/15/15
29 Slovak language with elements of national culture in 2014/15 30 The number of elementary schools, classes and students in AP Vojvodina
implementing lessons in Slovak language in 2007-2012 period 31 The number of elementary schools, classes and students in AP Vojvodina
implementing the subject “Slovak language with elements of national culture “ 32 The number of secondary schools, classes and students in AP Vojvodina
implementing lessons in Slovak language in 2007-2012 period 33 The number of secondary schools, classes and students in AP Vojvodina
implementing the subject “Slovak language with elements of national culture” 34 Education in Rusyn language in elementary and secondary schools in the territory of AP Vojvodina in school year 2014/15
35 Rusyn language with elements of national culture 2014/15
36 The number of elementary schools, classes and students in AP Vojvodina
implementing lessons in Rusyn language in 2007-2012 period
37 The number of elementary schools, classes and students in AP Vojvodina
implementing the subject “Rusyn language with elements of national culture“
38 The number of secondary schools, classes and students in AP Vojvodina
implementing lessons in Rusyn language in 2007-2012 period
39 The number of secondary schools, classes and students in AP Vojvodina
implementing the subject “Rusyn language with elements of national culture“
40 Education in Croatian language in elementary and secondary schools in the
territory of AP Vojvodina in school year 2014/15/15
41 Croatian language with elements of national culture 2014/15
42 The number of elementary schools, classes and students in AP Vojvodina
implementing lessons in Croatian language in 2007-2012 period
43 The number of elementary schools, classes and students in AP Vojvodina
implementing the subject “Croatian language with elements of national
culture”
44 The number of secondary schools, classes and students in AP Vojvodina
implementing lessons in Croatian language in 2007-2012 period
45 The number of secondary schools, classes and students in AP Vojvodina
implementing the subject “Croatian language with elements of national
culture “
46 Bunjevci speech with elements of national culture 2014/2015
47 The number of elementary schools, classes and students in AP Vojvodina implementing the subject “Bunjevci speech with elements of national culture” in 2007-2008
48 Macedonian language with elements of national culture in 2014/2015
52
49 The number of elementary schools, classes and students in AP Vojvodina implementing the subject “Macedonian language with elements of national culture”
50 Ukrainian language with elements of national culture in 2014/2015 51 The number of elementary schools, classes and students in AP Vojvodina
implementing the subject “Ukrainian language with elements of national culture “
52 Czech language with elements of national culture in 2014/2015 53 Roma language with elements of national culture in 2014/2015
Picture
1 Reasons for external migrations of young people up to 25 years of age

53
References Bašić, Goran i Pajvančić, Marijana, Od segregativne ka integrativnoj politici multikulturalnosti u Srbiji, Centar za istraživanje etniciteta, Beograd, 2015. Bašić, Goran, Kultura i ekonomski razvoj, Centar za istraživanje etniciteta, Beograd, 2015. Kupiszewski, Marek, Kupiszewska, Dorota, Nikitović, Vladimir, Uticaj demografskih i migracionih tokova na Srbiju, Međunarodna organizacija za migracije, Beograd, 2009.
Nedeljković Pravdić, Marija, Manjinska obrazovna politika na Kosovu, Metodički vidici, Beograd 2001; Nikitović, Vladinir, Mogući scenariji demografskog razvoja Srbije do 2020.", Demografski razvoj – Studijsko-analitička osnova – Strategija prostornog razvoja Republike Srbije, Geografski fakultet Univerziteta u Beogradu, 2009;
Pavlov, Tanja, Migracioni potencijal Srbije, Beograd, 2009; Uticaj demografskih i migracionih tokova na Srbiju, Međunarodna organizacija za migracije, Beograd, 2012; Pieterse, Jan Nedeverveen, Social capital and migration: Beyond ethnic economies, in Ethnicity, University of Illinois, 2003.
Rašević, Mirjana, Populaciona politika u Srbiji: stanje i očekivanja, u Stanovništvo, IDN, 2009;
Sikimić, Biljana, Naučno istraživanje migracija u Srbiji, SANU, Beograd, 2014; Stanković, Vladimir, Srbija u procesu spoljnih migracija, Republički zavod za statistiki, Beograd, 2015; Vujić, Aleksandra, Obrazovanje pripadnika mađarske, slovačke, rumunske i rusinske nacionalne manjine u Vojvodini od 1974/75 godine, Pedagoški zavod Vojvodine, Novi Sad, 2011;


