55
Running head: EDUCATION IN THE U.S. AND FINLAND 1 Education in the United States and Finland: A Comparative Analysis Deanna C. Childress Aurora University Spring 2010
Running head: EDUCATION IN THE U.S. AND FINLAND 1
Education in the United States and Finland:
A Comparative Analysis
Deanna C. Childress
Aurora University
Spring 2010

EDUCATION IN THE U.S. AND FINLAND 2
Abstract
This paper addresses selected factors contributing to the educational outcomes in the U.S. compared to Finland. The U.S. system is the focus, but it is compared and contrasted to the education system in Finland because the international comparisons of educational outcomes position Finland at the top of the list. Basic information related to education and employment in each country is provided, and the tools used to measure educational outcomes are explained. The literature review provides suggestions regarding the possible causes of educational disparities within the U.S., as well as the factors contributing to educational outcomes. In addition, the results of an empirical survey of college students’ opinions about the factors playing the most important role in shaping educational outcomes are presented, analyzed, and interpreted by means of selected sociological classical and contemporary theoretical perspectives.

EDUCATION IN THE U.S. AND FINLAND 3
Education in the United States and Finland: A Comparative Analysis
This analysis was conducted in order to examine educational disparities within the United
States (U.S.) education system. Within this system, there exists evidence of disparities between
funding, curriculum, and test scores. Some schools have higher or lower funding, varying
curriculum content, and a wide range of test scores, depending on the school. This thesis is
based on two major components: one based only on secondary sources & another one based on
data I generated by conducting an exploratory study of college students’ opinions about the
factors contributing to disparities in education and education outcomes. Both the literature
review and the survey focus solely on the U.S. system of education with no comparisons made to
the education system in any other country. The importance of the literature review rests on the
illustration of disparities in educational attainment within the U.S. education system and the
discussions surrounding these disparities. The survey is important because it provides an
appraisal of the assessment that college students have about the U.S. education system.
Knowing how college students assess the current education system is crucial to the future of the
U.S. education system because they are the future educators and leaders of the U.S.
I chose to assess the education system in Finland and compare it to the education system
in the United States because, although Finland has a smaller economy than the U.S., its students
have consistently scored higher than U.S. students on an international assessment called the
Program for International Student Assessment, or the PISA (Organization for Economic
Cooperation and Development [OECD], 2008). The PISA assesses students in different
countries to measure what they have learned in school in approximately the last 10 years of their
lives. This seems to be a good measure in determining the outcomes of an education system
because it measures the knowledge of students who are close to finishing high school.
EDUCATION IN THE U.S. AND FINLAND 4
In addition to tests that measure students’ academic performance in each country, other
tools are needed to gauge the outcomes of each education system. I explore other statistics,
including, but not limited to the following:
a. The rates of high school dropout and completion in each school system;
b. The rates of students who continue schooling by attending college;
c. The dropout and completion rates of these college students;
d. The employment rates for primary school graduates;
e. The types of jobs/careers that these graduates pursue; and
f. The amount of money that the population in each country makes based on level of
education.
The examination of each of the factors listed above provides us with a specific illustration of the
state of each country and the impact that the education system in each country has on the job
market. This provides important information about the disparities, or lack thereof, in educational
attainment in the U.S. and in Finland.
In addition to using statistics related to each system, I also examine the U.S. and Finland
by means of sources that explain:
a. The social, political, and cultural background of the systems of education in the United
States and Finland;
b. The specific impact of the Basic Education Act on the current system of education in
Finland;
c. The specific impact of the “No Child Left Behind” Act on the current system of
education in the US;
d. The structure of the education systems in the US and in Finland;
EDUCATION IN THE U.S. AND FINLAND 5
e. The goals and objectives of each system;
f. Government expenditures on education in each country; and
g. Academic ratings for the U.S. and Finland from the PISA.
Investigating these provisions gives a well-rounded view of the education systems in each
country and how they function. By assessing these factors, I should gain a reliable picture of the
outcomes of the education systems in the U.S. and in Finland.
Background
United States
To begin, I outline some of the main characteristics of the United States. The Central
Intelligence Agency (CIA) estimates that the U.S. has a population of approximately
307,212,123 people and is the third largest country in the world (2009). The U.S. population is
approximately 58.5 times larger than that of Finland. The U.S. has 97 males per 100 females.
The urban population consists of 82% of the total population. Approximately 79.96% of the
U.S. population is white, 15.1% Hispanic, 12.85% black, 4.43% Asian, 1.61% two or more
races, 0.97% American Indian or Alaskan native, and 0.18% native Hawaiian or other Pacific
islander (2007). The CIA estimates that Protestants make up 51.3% of the U.S. population,
Roman Catholics comprise 23.9%, Mormons encompass 1.7%, other Christians make up 1.6%,
Jewish comprise 1.7%, Buddhists comprise 0.7%, Muslims comprise 0.6%, other/unspecified
makes up 2.5%, unaffiliated encompass 12.1% of the population, and those with no religion
make up 4% of the total population (2007). The official language of the U.S. is English, and
82.1% of the population speaks English, while 10.7% speak Spanish.
The literacy level is defined by those aged 15 and over who can read and write (CIA,
2009). Ideally, the literacy rate in any country should be 100% because there is no reason why

EDUCATION IN THE U.S. AND FINLAND 6
anyone over age 15 would not be able to read or write. According to the CIA, the literacy rate in
the U.S. is 99% (2003). The school life expectancy is 16 years from primary to tertiary
schooling. The U.S. spends approximately 5.3% of its gross domestic product (GDP) on
education, and it ranks 57 in comparison to the rest of the world. The U.S. has a per capita GDP
of $46,400 and an official exchange rate GDP of $14.27 trillion. The labor force contains 154.5
million (includes unemployed) (2009). This is approximately 50% of the total U.S. population.
The breakdown of the labor force includes: farming, forestry, and fishing (22.6%);
manufacturing, extraction, transportation, and crafts (24.8%); managerial, professional, and
technical (37.3%); sales and office (24.2%); other services (17.6%). The unemployment rate is
9.4% (2009 est.) country comparison to the world: 109. Twelve percent of the population is
below the federal poverty line (U.S. federal poverty level is $13,530.00).
According to the CIA World Factbook (2009), the U.S. is a Constitution-based federal
republic with a strong democratic tradition. The U.S. is divided into 50 states and one district,
and dependent areas are American Samoa, Baker Island, Guam, Howland Island, Jarvis Island,
Johnston Atoll, Kingman Reef, Midway Islands, Navassa Island, Northern Mariana Islands,
Palmyra Atoll, Puerto Rico, Virgin Islands, and Wake Island. The U.S. gained independence
from Britain on July 4, 1776, and the U.S. Constitution was enacted in 1789. Any legal U.S.
citizen 18 years of age or older has the right to vote. U.S. citizens elect the President, Chief of
State and head of government, currently Barack H. Obama (since January 20, 2009), who serves
a four-year term and may serve a second term. The Vice President is Joseph Biden, and the
president and vice president are elected on the same ticket by a college of representatives from
each state.
The United States Education System
EDUCATION IN THE U.S. AND FINLAND 7
Primary (elementary), upper primary/lower secondary (middle), and secondary (high)
schools are governed by local school districts. Primary school usually takes the form of grades 1
through 4-7, middle school usually includes grades 6-8, and secondary school typically includes
grades 9-12. The principal, or headmaster in some cases, is in charge of the school, teachers and
teachers’ assistants work in the schools, and other administrative staff usually work in schools,
including counselors, librarians, computer/technology specialists, school nurses, food services
staff, and custodial staff (U.S. Department of Education, 2008). Within school districts, policies
and regulations tend to be uniform, but these may vary among school districts. States usually put
some regulations on the curriculum of schools within the entire state, but this may also vary
between states. This is the basic structure of the public school system in the U.S.
In addition to public schools, there are also private schools in the U.S. Private primary or
secondary schools are governed by their own board of trustees and receive no funding from the
state or government (U.S. Department of Education, 2008). Private schools determine their own
curricula and academic policies, and they make their own hiring and admissions policies. While
private schools have the room to act independently of the state education regulations, they
usually keep their standards close enough to the standards of public schools within their area to
easily facilitate transfer students and make sure students are as prepared for education at other
institutions in the area (i.e., a student coming from a private middle school to a public high
school will not have difficulty adjusting to the curriculum) and for postsecondary education.
Along with public and private schools, charter schools, magnet schools, and
homeschooling also exist within the U.S. education system. Over 3000 charter schools currently
exist in the U.S. Charter schools are public schools established by parent groups, communities,
or organizations to fulfill specific needs, serve special populations, or adhere to special curricula

EDUCATION IN THE U.S. AND FINLAND 8
or instructional practices (U.S. Department of Education, 2008). Charter schools receive public
funding, but they have room to operate independent of district regulations. Charter schools
operate according to an agreement, or charter, outlining the mission, program, student
population, and methods of evaluation (U.S. Department of Education). Charters usually last 3-5
years and can be renewed. Another type of school recognized within the U.S. education system
is the magnet school. Magnet schools are public schools that have a special educational theme,
mode of instruction, subject emphasis, or other characteristic, and they are not limited to
enrolling students from a specific district (U.S. Department of Education). The purpose of
magnet schools is to promote equal access to unique educational opportunities by minority
students who would not otherwise have this opportunity. Finally, homeschooling is also
recognized within the U.S. education system. The U.S. has a long history of homeschooling, as
this was the first method of teaching before schools were built (U.S. Department of Education).
According to the U.S. Department of Education, there are over one million students being
homeschooled every year. Parents or tutors are usually responsible for homeschooling students,
and homeschooling is regulated by each state. Students successfully completing their education
through homeschooling are recognized as secondary school graduates. Each state provides
homeschooling services, materials, and resources, including professional tutors, which contribute
to the effective education of students that are homeschooled.
The U.S. education system is based on a variety of laws at the federal level, the state
level, and the level of the individual institution (U.S. Department of Education, 2008). The U.S.
government has a narrow role in running the education system, as this is primarily in the hands
of each educational institution or district. The duty of the U.S. government is limited to:

EDUCATION IN THE U.S. AND FINLAND 9
Exercising leadership in promoting educational policies and reform efforts of national scope;
Administering federal assistance programs authorized and appropriated by Congress; Enforcing federal civil rights laws as they pertain to education; Providing information and statistics about education at the national and international
levels; and Providing technical expertise to the U.S. Department of State, U.S. Department of
Homeland Security, other federal agencies and Executive Office of the President in conducting the foreign affairs of the United States as these pertain to education and within the limited scope of federal power in this area (U.S. Department of Education).
The U.S. government has a very limited role in the structuring of the education system. There is
no mention of specific curriculum that should be included in all schools, there is no mention of
the requirements that all students, teachers and schools should meet, and there is no mention of
any direct interaction between the federal government and individual institutions. This means
that most of the structure and organization of the U.S. education system is dependent upon
smaller institutions, and this could explain some of the disparities in educational attainment. If
there is minimal regulation at the federal level, states, districts, and/or schools have the room to
function independently and have differing organization and curriculum. The federal government
does not: set any standards for academic content; set standards for admission, enrollment, or
graduation of students; inspect, accredit, or license educational institutions; or determine
educational budgets for states, localities, or institutions (U.S. Department of Education).
Without the regulation of these crucial elements of the education system, the U.S. government
fails at creating a unified system of education.
As briefly mentioned above, the prime operation of the U.S. educational institution is
based at the individual level. The institution is responsible for all academic matters with very
little government regulation and restriction. There are nearly 117,000 primary and secondary
schools, nearly 6,000 postsecondary career and technical schools, and just below 4,000 degree-

EDUCATION IN THE U.S. AND FINLAND 10
granting institutions of higher education in the U.S. (U.S. Department of Education, 2008). If we
have specific education guidelines and regulations at the individual level, this means that primary
and secondary school students throughout the U.S. may be taught using 117,000 different
teaching methods, theoretically. If each educational institution is responsible for setting
guidelines for itself, this could very well be the result: students from different high schools may
have the same diploma that is meant to represent their completion of a basic education, but
students obtaining diplomas from one institution may know the basics of quantum physics, while
students obtaining diplomas from the school ten miles away may only know basic algebra. This
is a problem.
While this thesis focuses solely on secondary high school, it should be noted that this
problem persists in institutions of higher education as well. Students may graduate with the
same degree, but the degree does mean that these students have the same knowledge base. This
issue is one of great severity in any case, but it achieves its highest level of severity when it
involves disparities in educational attainment among colleges and universities because this is the
training that students receive that is meant to prepare many of them for specific careers
immediately after completion. An example of one of these careers is an educator. The level of
education an education major receives matters profoundly, as it directly influences the level of
education that the next set of students will receive wherever this future educator decides to teach.
Going back to secondary education, the level of education that a high school student receives
also has a profound impact on the student’s ability to excel in the college program that he or she
chooses. Two students can graduate as the valedictorian of their classes, and they may go to the
same college or university, only to discover that life in college will be much more difficult for
one of these students because this student comes from a school that did not provide the same

EDUCATION IN THE U.S. AND FINLAND 11
level of quality education as the other valedictorian’s school. Here, I discuss the theory and
possibilities of the consequences of educational disparities, but this theory and possibility
discussed above represents the reality. This reality begins with a lack of country-wide
regulations being imposed onto schools. With individual school boards constructing an
educational system and format devoid of much federal provisions, the quality of education
systems remains the same: inconsistent.
The same scenario applies to early education programs. Preschool, or early childhood
education, is available in almost every community in the U.S. and most states require that public
early education programs are available through school districts (U.S. Dept. of Education).
Similar to primary, secondary and postsecondary educational institutions, there are no
specifications as to what should be taught within early education programs in the U.S. to prepare
children for elementary schools. Just as this lack of uniformity within the U.S. education system
creates disparities in educational attainment in secondary and postsecondary educational
institutions, this creates disparities at the start of primary education. This may be the most
crucial aspect of education because the rest of a student’s education depends on this foundation.
The main point is that it is problematic for educational institutions to develop an educational
curriculum and structure individually: this leads directly to educational disparities. Some of
these disparities may be alleviated by state regulation of educational institutions.
The state is held more much accountable than the federal government for organizing
schools and formulating curriculum in schools. The degree to which states and territories control
education depends on the constitutions, statutes, and regulations imposed by each state. Among
the duties performed by state authorities are:
Providing funding for public education at all levels;
EDUCATION IN THE U.S. AND FINLAND 12
Licensing or chartering private schools and public and private institutions of higher education;
Providing oversight and guidance to local school boards; Setting broad policies for school-level curricula, texts, standards, and assessments (but
not higher education); Licensing school teachers and other educational personnel; Overseeing the provision of educational services for persons living with disabilities,
adults needing basic education services, and other special needs populations; Setting the standards for examining and licensing persons seeking to work in any
regulated professional occupation; and Electing or appointing some or all of the members of the governing boards of public
higher education institutions and state boards of education (U.S. Department of Education, 2008).
Each state is responsible for organizing and regulating schools, while there is some
variability among school districts within states. Each individual institution is left with much of
the responsibility of structuring the institution and formulating the curriculum. The federal
government does have a limited role in the organization, structuring, and formulation of
education within schools, but the U.S. government has created education legislation, primarily
aimed to eliminate disparities between schools, districts, and states. In 1965, President Lyndon
B. Johnson passed the Elementary and Secondary Education Act (ESEA) as a part of the War on
Poverty. ESEA emphasizes equal access to education and establishes high standards and
accountability for schools. This law authorizes federally funded education programs that are
administered by each state. In 2002, Congress amended ESEA and reauthorized it as the No
Child Left Behind Act (Office of Superintendent of Public Instruction, 2009). The No Child Left
Behind (NCLB) Act, which is 670 pages long, is the most well known piece of legislation
impacting education in the U.S.
No Child Left Behind in the U.S.
The goal of the No Child Left Behind Act is “To close the achievement gap with
accountability, flexibility, and choice, so that no child is left behind” in the U.S. education

EDUCATION IN THE U.S. AND FINLAND 13
system (Weekly Compilation of Presidential Documents, 2002). NCLB highlights education
factors including: improving the academic achievement of the disadvantaged; preparing, training,
and recruiting high quality teachers and principals; language instruction for limited English
proficient and immigrant students; promoting informed parental choice and innovative programs;
flexibility and accountability of schools; Indian, native Hawaiian, and Alaska native education;
and the Impact Aid Program. Each of the provisions outlined in NCLB are basically references
to the funds that will be given to specific programs to meet the requirements outlined by NCLB
by the deadlines outlined in this act. This act focuses on specific groups that should not be “left
behind” other high-achieving students, but there is no focus on setting specific standards for all
students, and there is no focus on these high-achieving students. There are programs listed that
are meant to assist schools in educating low-achieving groups of students, but there is nothing
that aims at attempting to understand why these low-achieving groups of students have a lower
level of educational attainment, lower test scores, etc. There is no mention of the structure of
each of the programs outlined. The amounts of money are given, and the requirements that each
program should meet are given, but there is no specific breakdown of how the funds should
effectively be utilized. Money is given to programs that are meant to improve literacy, but there
is no mention of how schools can work with these programs to effectively improve literacy.
Also, the standards that schools should meet are provided, but there is no mention of specific
programs within schools or curricula that might help schools meet these standards. Upon
examining NCLB, we see the recurring theme in the U.S. education system: inconsistency. As
we know, this inconsistency in the formulation and regulation of educational institutions leads to
the disparities in educational achievement.
EDUCATION IN THE U.S. AND FINLAND 14
After taking a look at the U.S. system, questions arise concerning the success of this
education system. How successful is the U.S. education system if there are constant disparities
in educational attainment? How do we gauge the overall success of any education system? How
does the U.S. compare to other systems of education? The latter question may be answered by
comparing the scores of U.S. students to students from other countries on international
assessments. One international assessment referenced earlier, called the Programme for
International Student Assessment (PISA), students from over 30 countries, including the U.S.
and Finland, were surveyed, and Finland stands out because Finland’s students have scored the
highest on this assessment. Since the results of this assessment point to Finland as having the
most successful education system (based on educational achievement on this assessment only),
comparing Finland’s education system to the U.S. education system could provide valuable
insight about the structure of the U.S. education system and the source of educational disparities.
Finland
The CIA estimates that Finland has a population of approximately 5,250,275 people.
Finland’s country population comparison to the world is 112, being geographically the size of
the U.S. state of Montana. Finland’s population is 1.71% of the U.S. population. Finland has 96
males per 100 females. The urban population comprises 63% of the total population in Finland
(2003). Finland’s population is 93.4% Finn, 5.6% Swede, 0.5% Russian, 0.3% Estonian, 0.1%
Roma, and 0.1% Sami (2006). The official languages spoken in Finland are Finnish (91.2% of
total population) and Swedish (5.5%), and about 3.3% of the population speaks Sami or Russian.
Those who belong to the Lutheran Church of Finland comprise 82.5% of the total population,
members of the Orthodox Church make up 1.1%, other Christians make up 1.1%, 0.1% have
another religion not listed, and 15.1% of the population has no religion. The entire Finnish

EDUCATION IN THE U.S. AND FINLAND 15
population is literate by age 15, and the school life expectancy is 17 years. Finland spends 6.4%
of its GDP on education, which ranks 33 in the world. Finland has a GDP of $238.2 billion and
a per capita GDP of $34,900. The labor force in Finland is approximately 2.68 million people,
which is roughly %51 of the total population. The labor force is composed of: agriculture and
forestry (18.2%); industry (15.9%); construction (6.9%); commerce (15.9%); finance, insurance,
and business services (14.5%); transport and communications (6.9%); and public services
(32.7%). The unemployment rate in Finland was 6.4% in 2008 and estimated to be about 8.5%
in 2009. In Finland, class is difficult to identify because of the wide use of social service
programs and a high level of income equality (Encyclopedia of the Nations, 2009).
Finland is a republic with six provinces. Finland gained independence from Russia on
December 6, 1917, and Finland’s Constitution was enacted in 2000. Any citizen aged 18 or
older has the right to vote in Finland. The chief of state is President Tarja Halonen (since March
1, 2000), the Prime Minister is Matti Vanhanen, and the Deputy Prime Minister is Jyrki
Katainen. The president is elected by popular vote every 6 years, and is eligible for a second
term. The President appoints the prime minister and deputy prime minister. Finland differs
greatly from the U.S. in country composition, but it is still important to examine the structure of
Finland’s education system. Even though the countries differ in many areas, the education
systems can still be used for comparison.
Finland’s Education System
The Finnish school system is somewhat similar to the U.S. system of education. Students
start school when they are 6 years old in Finland’s system, and they also have the opportunity for
preschool education (International Association of Universities [IAU], 2006). Within the Finnish
system, students attend school until they are 16 years of age. Upon completing 9-year basic
EDUCATION IN THE U.S. AND FINLAND 16
education, students are able to choose between general upper secondary education and vocational
upper secondary education. General upper secondary school, called lukio or gymnasiet in
Finland, provides general education leading to the national Matriculation examination
(ylioppilastutkinto or studentexamen), which gives eligibility to all forms of higher education
(IAU, 2006). Vocational upper secondary education, called ammatillinen koulutus or
yrkesutbildning, may be organized in vocational education institutions or in the form of
apprenticeship training. A Vocational Qualification (ammatillinen perustutkinto/yrkesinriktad
grundexamen) takes three years to complete, and it gives eligibility to all forms of higher
education (IAU, 2006). Finland’s vocational education and training also allows for students to
obtain Further Vocational Qualifications (ammattitutkinto or yrkesexamen) and Specialist
Vocational Qualifications (erikoisammattitutkinto orspecialyrkesexamen), which can only be
taken as competence-based examinations and are mainly intended for employed adults (IAU,
2006). While Finland’s education is similar to that of the U.S. when it comes to primary
education (elementary and secondary schooling), it differs in that students have an opportunity to
prepare for institutions of higher education after completing primary education, not during this
process. Along with this, the education legislation in Finland should also be examined to find
the differences in the U.S. education legislation and the Finnish education legislation.
Basic Education in Finland
In contrast to the 670 page No Child Left Behind Act in the U.S., the Basic Education
Act is 22 pages long. The purpose of this act is to “support pupils’ growth into humanity and
into ethically responsible membership of society and to provide them with knowledge and skills
needed in life” (Basic Education Act, 2004). The statement at the opening of the NCLB Act
entails bridging the gaps between high and low achieving students. The Basic Education Act
EDUCATION IN THE U.S. AND FINLAND 17
states that education should follow a “unified national core curriculum” that is outlined in this
act, and that education providers “shall cooperate with the pupils’ parents/careers” (Basic
Education Act). The Finland school curriculum is specified and includes the following core
subjects: mother tongue and literature; the second national language; foreign languages;
environmental studies; health education; religious education or ethics; history; social studies;
mathematics; chemistry; biology; geography; physical education; music; arts; crafts; and home
economics. Provided by the Basic Education Act of Finland, all children have the right to obtain
pre-primary education (pre-schooling). In addition, teaching, the necessary textbooks and
learning materials, and school equipment and other materials shall be free of charge to the
student. With this information on the systems in the U.S. and in Finland, an analysis can be
made comparing the advantages and disadvantages of each system.
Comparing the United States and Finland
There are multiple areas where the U.S. and Finland are dissimilar when looking at
country characteristics alone. For one, the U.S. is over 50 times larger than Finland in
population. Also, the total GDP of the U.S. is about $14.27 trillion, and Finland’s is $238.2
billion, which again marks a large difference between these nations. At this level, the differences
in population and in economy highly impact the ways that each of these societies function. For
one, the size of the U.S. and the homogeneity of Finland may account for some of the differences
in educational disparities. Also, Finland provides social welfare at a much wider level than does
the U.S., which reduces income disparities in Finland. Even with the differing country
characteristics, there are some notes that may be taken from looking at the provisions of the No
Child Left Behind Act and the Basic Education Act.
EDUCATION IN THE U.S. AND FINLAND 18
One major difference between the No Child Left Behind Act in the U.S. and the Basic
Education Act in Finland is apparent even in the title given to each—one refers to disparities
within an education system, while the other refers to equity within an education system. NCLB
specifies many of the provisions relating to the amount of money that will be given to schools
and other organizations to try to “close the gaps between high- and low-achieving students,”
which can be detrimental to high-achieving students if educators are focused solely on low-
achieving students and making sure that there are not huge differences in educational
achievement (Weekly Compilation of Presidential Documents, 2002). Very different from the
NCLB Act, the Basic Education Act focuses on the specific criteria of the education curriculum
and, and the purpose of the entire education system, not just focusing on specific groups, but
outlining the same education for all, even though education providers may tailor the education
slightly within his or her own syllabus (Basic Education Act, 2004). Here, the obvious
difference on one hand is the focus on money and on eliminating disparities in achievement by
the No Child Left Behind Act and, on the other hand, the focus on a specific curriculum and this
being provided to all students free of charge to the student.
The high school graduation rates in selected OECD countries (including the U.S. and Finland)
are presented in the graph below:

EDUCATION IN THE U.S. AND FINLAND 19
The OECD country with the top high school graduation rate in Denmark with 96%, in Finland
the high school graduation rate is 91%, and in the U.S. the graduation rate is 72%. The
Conference Board of Canada (2010) compares the rates of the number of college graduates in 17
countries (Canada, Finland, U.S., Australia, Austria, Belgium, Denmark, France, Germany,
Ireland, Italy, Japan, Netherlands, Norway, Sweden, Switzerland, and U.K.), and shows that
Canada is at the top with 23.7% of its total population aged 25-64 with a college degree, 15.4%
of Finland’s population aged 25-64 has a college degree, and 9.4% of the U.S. population aged
25-64 has a college degree.
Assessments
Now that we have examined the education systems in each country directly, background
information is provided on the assessments used here for a greater understanding of how they are
administered, used, and interpreted. I will begin by providing an explanation of the PISA, which
is used to measure educational outcomes in this review. I will also explain Measuring Up 2008:
EDUCATION IN THE U.S. AND FINLAND 20
The National Report Card on Higher Education issued by the U.S. National Center for Public
Policy and Higher Education, which will be used to assess the educational disparities in the U.S.
education system.
Program for International Student Assessment
First, it should be noted that, while the Program for International Student Assessment is
prominently used for country comparison, it must be noted that it is only one international
assessment and is not infallible. Researchers from the Urban Institute have pointed to possible
flaws in the PISA: social scientists may have incorrectly interpreted the results from the PISA;
different countries administer the test to different populations; and the PISA is given on the basis
of age and not school grade. The In addition, PISA focuses on literacy and how concepts and
skills learned in the classroom are applied to real life circumstances, thus testing basic skills and
not specific knowledge. It is important to keep this in mind when using the PISA as a basis for
comparison of academic outcomes.
This test has been administered every 3 years since the year 2000 and is given to 15-year-
olds in many countries across the world. This age group is assessed because students are nearing
the end of their compulsory education in most of the countries assessed (OECD, 2008). PISA
provides internationally comparative information on the reading, mathematics and science
literacy of students in various countries (Stephens & Coleman, 2007). The goal of the PISA is to
measure the accomplishments of education systems by the time most students are finishing up
their primary education. PISA focuses on literacy and how concepts and skills learned in the
classroom are applied to real life circumstances. The PISA is sponsored by the Organization for
Economic Cooperation and Development (OECD), which represents the world’s most
industrialized countries. The PISA reports scores at the national level, and even though 57
EDUCATION IN THE U.S. AND FINLAND 21
countries participate in the PISA, only the results from the 30 countries that are members of the
OECD are used to compute the international average (Stephens & Coleman, 2007). PISA
specifically assesses students at the age of 15, regardless of school grade, while some other
international assessments survey students based on grade level. Within the scientific evaluation,
PISA assesses the ability to identify scientific issues, the ability to explain phenomena
scientifically, the ability to use scientific evidence, the level of knowledge about science,
knowledge of earth and space systems, knowledge of living systems, and knowledge of physical
systems. Within the scientific evaluation, PISA assesses the ability to identify scientific issues,
the ability to explain phenomena scientifically, the ability to use scientific evidence, the level of
knowledge about science, knowledge of earth and space systems, knowledge of living systems,
and knowledge of physical systems. This is important to note because schools in the U.S. may
not have the same focus or even teach some of these specific areas of scientific knowledge.
There were 5,611 students sampled for the 2006 PISA, and 166 schools represented by
these students. The countries that participated in the 2006 PISA were: Australia, the Czech
Republic, Finland, Greece, Ireland, Japan, Korea, Mexico, Portugal, Switzerland, Turkey (all
OECD members who only participated in the PISA); Argentina, Azerbaijan, Brazil, Chile,
Colombia, Croatia, Estonia, Jordan, Kyrgyz Republic, Macao-China, the Republic of
Montenegro, the Republic of Serbia, Thailand, Tunisia, Uruguay (all non-OECD members who
participated in the PISA only); Austria, Belgium, Canada, Denmark, France, Germany, Hungary,
Iceland, Italy, Luxemburg, the Netherlands, New Zealand, Norway, Poland, the Slovak Republic,
Spain, Sweden, the United Kingdom, and the United States (all members of the OECD who
participated in the PISA and in the PIRLS). PISA 2006 shows that there are no significant

EDUCATION IN THE U.S. AND FINLAND 22
changes in U.S. students’ mathematics scores since 2003 (Stephens & Coleman, 2007). Also,
the U.S. score is below the average for all the member countries of the OECD.
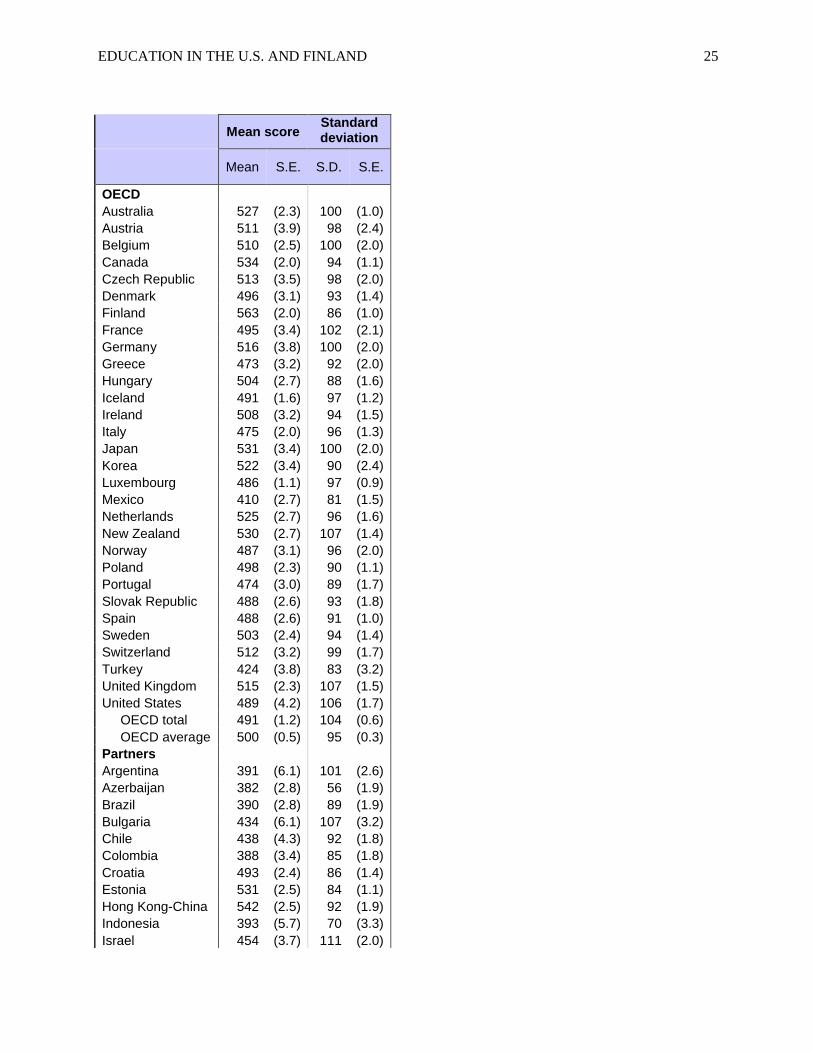
In science, Finland is ranked number 1 among all the OECD countries with an average
student score of 563, while the U.S. is ranked number 18 with an average student score of 489.
When looking at the average scores of students taking the 2006 PISA, Finland is still ranked
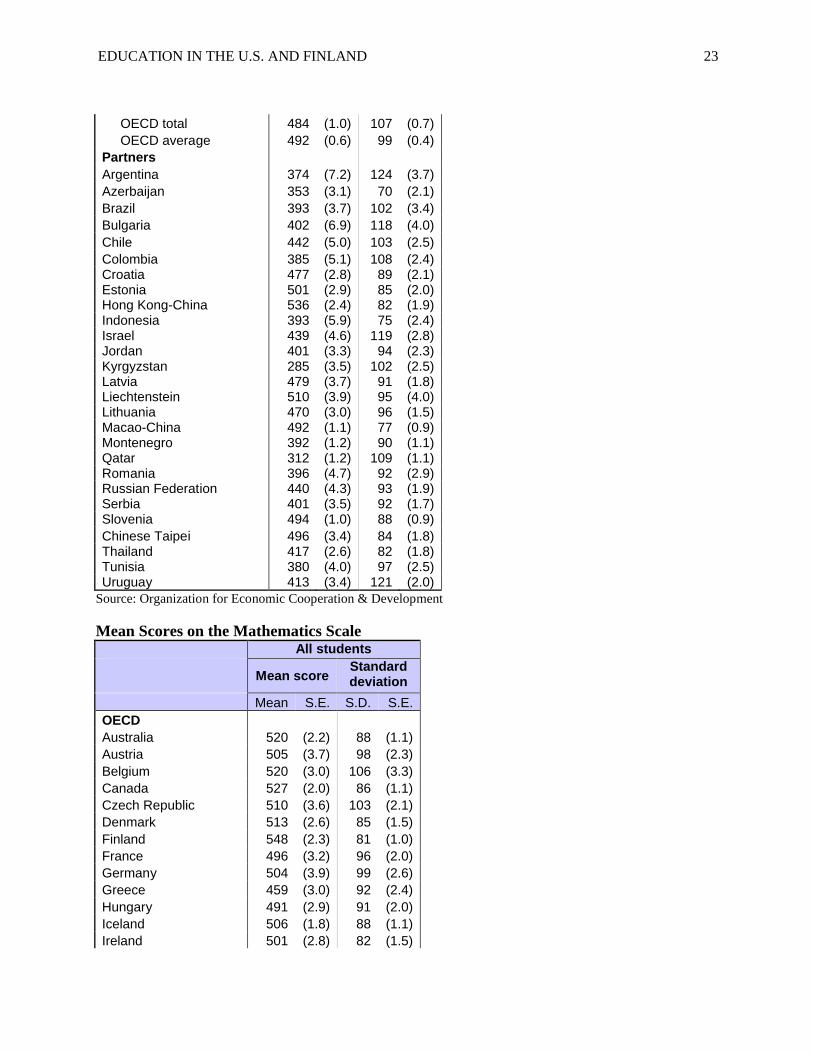
number 1, while the U.S. ranking falls to 24. The scores on the 2006 PISA are presented below.
Mean Score on the Reading ScaleAll students
Mean scoreStandard deviation
Mean S.E. S.D. S.E.OECDAustralia 513 (2.1) 94 (1.0)Austria 490 (4.1) 108 (3.2)Belgium 501 (3.0) 110 (2.8)Canada 527 (2.4) 96 (1.4)Czech Republic 483 (4.2) 111 (2.9)Denmark 494 (3.2) 89 (1.6)Finland 547 (2.1) 81 (1.1)France 488 (4.1) 104 (2.8)Germany 495 (4.4) 112 (2.7)Greece 460 (4.0) 103 (2.9)Hungary 482 (3.3) 94 (2.4)Iceland 484 (1.9) 97 (1.4)Ireland 517 (3.5) 92 (1.9)Italy 469 (2.4) 109 (1.8)Japan 498 (3.6) 102 (2.4)Korea 556 (3.8) 88 (2.7)Luxembourg 479 (1.3) 100 (1.1)Mexico 410 (3.1) 96 (2.3)Netherlands 507 (2.9) 97 (2.5)New Zealand 521 (3.0) 105 (1.6)Norway 484 (3.2) 105 (1.9)Poland 508 (2.8) 100 (1.5)Portugal 472 (3.6) 99 (2.3)Slovak Republic 466 (3.1) 105 (2.5)Spain 461 (2.2) 89 (1.2)Sweden 507 (3.4) 98 (1.8)Switzerland 499 (3.1) 94 (1.8)Turkey 447 (4.2) 93 (2.8)United Kingdom 495 (2.3) 102 (1.7)United States m m m m
EDUCATION IN THE U.S. AND FINLAND 23
OECD total 484 (1.0) 107 (0.7) OECD average 492 (0.6) 99 (0.4)PartnersArgentina 374 (7.2) 124 (3.7)Azerbaijan 353 (3.1) 70 (2.1)Brazil 393 (3.7) 102 (3.4)Bulgaria 402 (6.9) 118 (4.0)Chile 442 (5.0) 103 (2.5)Colombia 385 (5.1) 108 (2.4)Croatia 477 (2.8) 89 (2.1)Estonia 501 (2.9) 85 (2.0)Hong Kong-China 536 (2.4) 82 (1.9)Indonesia 393 (5.9) 75 (2.4)Israel 439 (4.6) 119 (2.8)Jordan 401 (3.3) 94 (2.3)Kyrgyzstan 285 (3.5) 102 (2.5)Latvia 479 (3.7) 91 (1.8)Liechtenstein 510 (3.9) 95 (4.0)Lithuania 470 (3.0) 96 (1.5)Macao-China 492 (1.1) 77 (0.9)Montenegro 392 (1.2) 90 (1.1)Qatar 312 (1.2) 109 (1.1)Romania 396 (4.7) 92 (2.9)Russian Federation 440 (4.3) 93 (1.9)Serbia 401 (3.5) 92 (1.7)Slovenia 494 (1.0) 88 (0.9)Chinese Taipei 496 (3.4) 84 (1.8)Thailand 417 (2.6) 82 (1.8)Tunisia 380 (4.0) 97 (2.5)Uruguay 413 (3.4) 121 (2.0)
Source: Organization for Economic Cooperation & Development
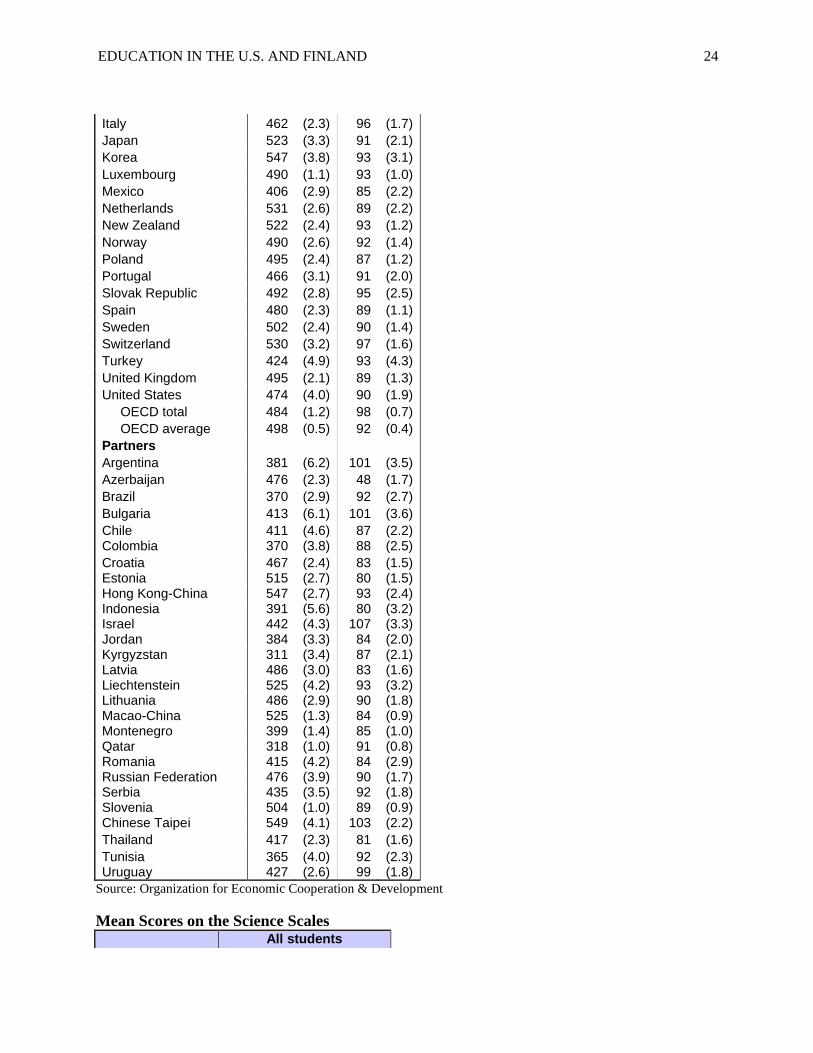
Mean Scores on the Mathematics ScaleAll students
Mean scoreStandard deviation
Mean S.E. S.D. S.E.OECDAustralia 520 (2.2) 88 (1.1)Austria 505 (3.7) 98 (2.3)Belgium 520 (3.0) 106 (3.3)Canada 527 (2.0) 86 (1.1)Czech Republic 510 (3.6) 103 (2.1)Denmark 513 (2.6) 85 (1.5)Finland 548 (2.3) 81 (1.0)France 496 (3.2) 96 (2.0)Germany 504 (3.9) 99 (2.6)Greece 459 (3.0) 92 (2.4)Hungary 491 (2.9) 91 (2.0)Iceland 506 (1.8) 88 (1.1)Ireland 501 (2.8) 82 (1.5)
EDUCATION IN THE U.S. AND FINLAND 24
Italy 462 (2.3) 96 (1.7)Japan 523 (3.3) 91 (2.1)Korea 547 (3.8) 93 (3.1)Luxembourg 490 (1.1) 93 (1.0)Mexico 406 (2.9) 85 (2.2)Netherlands 531 (2.6) 89 (2.2)New Zealand 522 (2.4) 93 (1.2)Norway 490 (2.6) 92 (1.4)Poland 495 (2.4) 87 (1.2)Portugal 466 (3.1) 91 (2.0)Slovak Republic 492 (2.8) 95 (2.5)Spain 480 (2.3) 89 (1.1)Sweden 502 (2.4) 90 (1.4)Switzerland 530 (3.2) 97 (1.6)Turkey 424 (4.9) 93 (4.3)United Kingdom 495 (2.1) 89 (1.3)United States 474 (4.0) 90 (1.9) OECD total 484 (1.2) 98 (0.7) OECD average 498 (0.5) 92 (0.4)PartnersArgentina 381 (6.2) 101 (3.5)Azerbaijan 476 (2.3) 48 (1.7)Brazil 370 (2.9) 92 (2.7)Bulgaria 413 (6.1) 101 (3.6)Chile 411 (4.6) 87 (2.2)Colombia 370 (3.8) 88 (2.5)Croatia 467 (2.4) 83 (1.5)Estonia 515 (2.7) 80 (1.5)Hong Kong-China 547 (2.7) 93 (2.4)Indonesia 391 (5.6) 80 (3.2)Israel 442 (4.3) 107 (3.3)Jordan 384 (3.3) 84 (2.0)Kyrgyzstan 311 (3.4) 87 (2.1)Latvia 486 (3.0) 83 (1.6)Liechtenstein 525 (4.2) 93 (3.2)Lithuania 486 (2.9) 90 (1.8)Macao-China 525 (1.3) 84 (0.9)Montenegro 399 (1.4) 85 (1.0)Qatar 318 (1.0) 91 (0.8)Romania 415 (4.2) 84 (2.9)Russian Federation 476 (3.9) 90 (1.7)Serbia 435 (3.5) 92 (1.8)Slovenia 504 (1.0) 89 (0.9)Chinese Taipei 549 (4.1) 103 (2.2)Thailand 417 (2.3) 81 (1.6)Tunisia 365 (4.0) 92 (2.3)Uruguay 427 (2.6) 99 (1.8)
Source: Organization for Economic Cooperation & Development
Mean Scores on the Science ScalesAll students
EDUCATION IN THE U.S. AND FINLAND 25
Mean scoreStandard deviation
Mean S.E. S.D. S.E.
OECDAustralia 527 (2.3) 100 (1.0)Austria 511 (3.9) 98 (2.4)Belgium 510 (2.5) 100 (2.0)Canada 534 (2.0) 94 (1.1)Czech Republic 513 (3.5) 98 (2.0)Denmark 496 (3.1) 93 (1.4)Finland 563 (2.0) 86 (1.0)France 495 (3.4) 102 (2.1)Germany 516 (3.8) 100 (2.0)Greece 473 (3.2) 92 (2.0)Hungary 504 (2.7) 88 (1.6)Iceland 491 (1.6) 97 (1.2)Ireland 508 (3.2) 94 (1.5)Italy 475 (2.0) 96 (1.3)Japan 531 (3.4) 100 (2.0)Korea 522 (3.4) 90 (2.4)Luxembourg 486 (1.1) 97 (0.9)Mexico 410 (2.7) 81 (1.5)Netherlands 525 (2.7) 96 (1.6)New Zealand 530 (2.7) 107 (1.4)Norway 487 (3.1) 96 (2.0)Poland 498 (2.3) 90 (1.1)Portugal 474 (3.0) 89 (1.7)Slovak Republic 488 (2.6) 93 (1.8)Spain 488 (2.6) 91 (1.0)Sweden 503 (2.4) 94 (1.4)Switzerland 512 (3.2) 99 (1.7)Turkey 424 (3.8) 83 (3.2)United Kingdom 515 (2.3) 107 (1.5)United States 489 (4.2) 106 (1.7) OECD total 491 (1.2) 104 (0.6) OECD average 500 (0.5) 95 (0.3)PartnersArgentina 391 (6.1) 101 (2.6)Azerbaijan 382 (2.8) 56 (1.9)Brazil 390 (2.8) 89 (1.9)Bulgaria 434 (6.1) 107 (3.2)Chile 438 (4.3) 92 (1.8)Colombia 388 (3.4) 85 (1.8)Croatia 493 (2.4) 86 (1.4)Estonia 531 (2.5) 84 (1.1)Hong Kong-China 542 (2.5) 92 (1.9)Indonesia 393 (5.7) 70 (3.3)Israel 454 (3.7) 111 (2.0)

EDUCATION IN THE U.S. AND FINLAND 26
Jordan 422 (2.8) 90 (1.9)Kyrgyzstan 322 (2.9) 84 (2.0)Latvia 490 (3.0) 84 (1.3)Liechtenstein 522 (4.1) 97 (3.1)Lithuania 488 (2.8) 90 (1.6)Macao-China 511 (1.1) 78 (0.8)Montenegro 412 (1.1) 80 (0.9)Qatar 349 (0.9) 84 (0.8)Romania 418 (4.2) 81 (2.4)Russian Federation 479 (3.7) 90 (1.4)Serbia 436 (3.0) 85 (1.6)Slovenia 519 (1.1) 98 (1.0)Chinese Taipei 532 (3.6) 94 (1.6)Thailand 421 (2.1) 77 (1.5)Tunisia 386 (3.0) 82 (2.0)Uruguay 428 (2.7) 94 (1.8)
Source: Organization for Economic Cooperation & Development
When looking at the results of the PISA, we see that students in the U.S. score much lower than
students in Finland, and that the student average in the U.S. is also below the OECD average.
While the PISA is only one assessment and may be flawed, it is still important to note that U.S.
students are not doing as well as students in many other countries, including Finland. There is
evidence that the PISA selects the brightest students in some of the other countries and that the
student composition is mixed in others. Even if this is the case, with the U.S. being a “world
power,” should the lowest achieving students in the U.S. not be able to compete with students
from other countries, highest-achieving or not? Ideally, the U.S. education system should
produce students who can compete internationally within the realm of higher education, and it
should produce workers who can compete internationally, or even just nationally, for jobs. Even
if the assessment is flawed, it still brings light to some of the problems within the U.S. education
system, resulting from educational disparities. Along with the PISA, other sources point out
problems within the U.S. education system. One of these sources is the National Report Card.
National Report Card
EDUCATION IN THE U.S. AND FINLAND 27
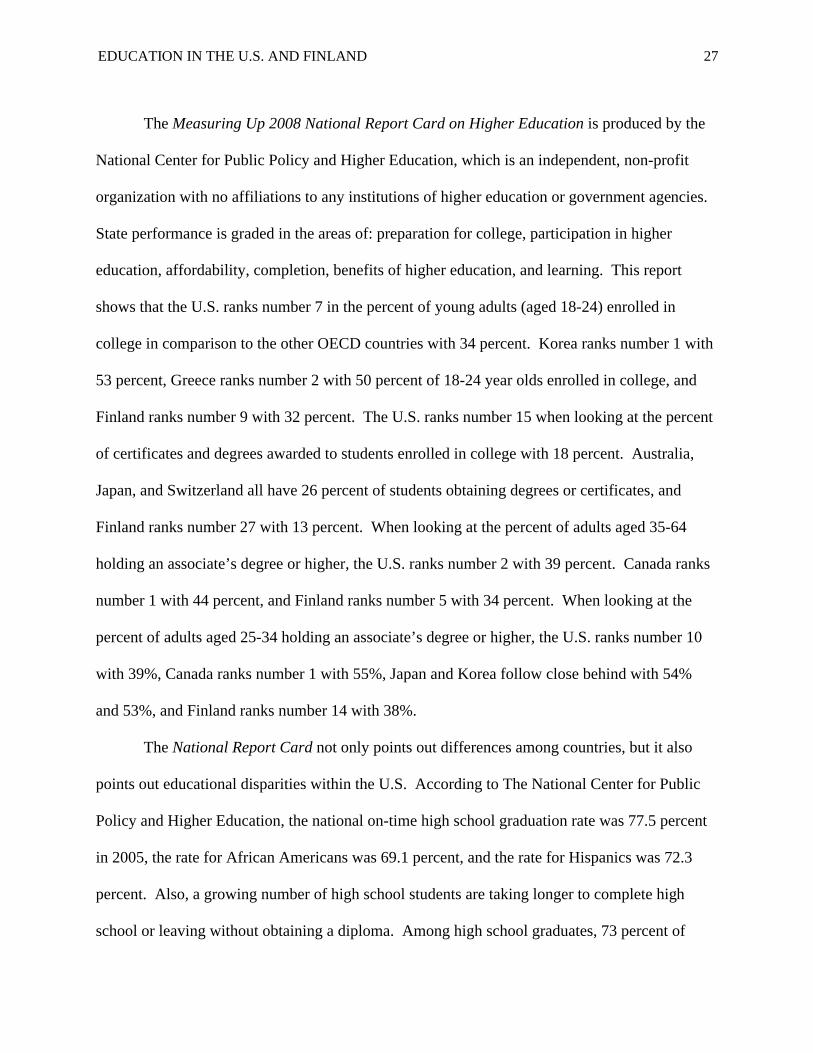
The Measuring Up 2008 National Report Card on Higher Education is produced by the
National Center for Public Policy and Higher Education, which is an independent, non-profit
organization with no affiliations to any institutions of higher education or government agencies.
State performance is graded in the areas of: preparation for college, participation in higher
education, affordability, completion, benefits of higher education, and learning. This report
shows that the U.S. ranks number 7 in the percent of young adults (aged 18-24) enrolled in
college in comparison to the other OECD countries with 34 percent. Korea ranks number 1 with
53 percent, Greece ranks number 2 with 50 percent of 18-24 year olds enrolled in college, and
Finland ranks number 9 with 32 percent. The U.S. ranks number 15 when looking at the percent
of certificates and degrees awarded to students enrolled in college with 18 percent. Australia,
Japan, and Switzerland all have 26 percent of students obtaining degrees or certificates, and
Finland ranks number 27 with 13 percent. When looking at the percent of adults aged 35-64
holding an associate’s degree or higher, the U.S. ranks number 2 with 39 percent. Canada ranks
number 1 with 44 percent, and Finland ranks number 5 with 34 percent. When looking at the
percent of adults aged 25-34 holding an associate’s degree or higher, the U.S. ranks number 10
with 39%, Canada ranks number 1 with 55%, Japan and Korea follow close behind with 54%
and 53%, and Finland ranks number 14 with 38%.
The National Report Card not only points out differences among countries, but it also
points out educational disparities within the U.S. According to The National Center for Public
Policy and Higher Education, the national on-time high school graduation rate was 77.5 percent
in 2005, the rate for African Americans was 69.1 percent, and the rate for Hispanics was 72.3
percent. Also, a growing number of high school students are taking longer to complete high
school or leaving without obtaining a diploma. Among high school graduates, 73 percent of

EDUCATION IN THE U.S. AND FINLAND 28
whites, 56 percent of blacks, and 58 percent of Hispanics enroll in college the following fall.
When looking at disparities based on family income, 91% of high school students from the
highest income bracket (above $100,000), 78% of students in the middle income bracket
($50,001-$100,000), and 52% of students from the lowest income bracket ($20,000 and below)
enroll in college. In addition, 59% of white students complete a bachelor’s degree within 6
years, while 47% of Hispanic students, 41% of black students, and 39% of Native American
students complete a bachelor’s degree within 6 years.
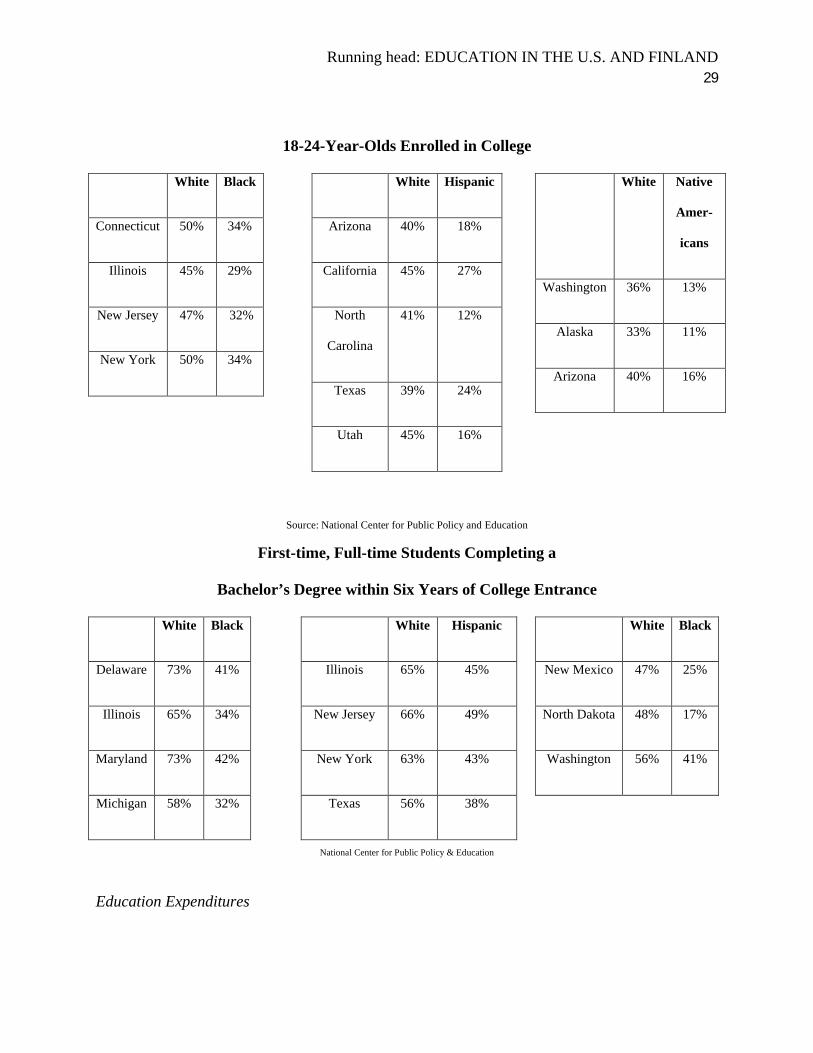
Measuring Up 2008 also shows the existence of gaps between educational achievement
based on racial/ethnic groups by state. For example, in Illinois 95% of white 18-24 year olds
have a high school credential, compared to 82% of blacks in the same age group. In Arizona,
93% of whites aged 18-24 have a high school credential, compared to only 69% of Hispanics. In
Illinois, 45% of whites aged 18-24 are enrolled in college, while only 29% of blacks aged 18-24
are enrolled in college. This report also shows the disparities in the percentage of students
completing a bachelor’s degree within 6 years or entrance. The report highlights some of the
major disparities between states. These disparities are outlined below in the figures below.
18-24-Year-Olds with a High School Credential
Whites Blacks
Illinois 95% 82%
Kansas 93% 79%
Michigan 91% 80%
New York 95% 85%
Source: National Center for Public Policy and Education
Whites Hispanics
Arizona 93% 69%
California 95% 75%
North Carolina 92% 56%
Texas 93% 74%
Running head: EDUCATION IN THE U.S. AND FINLAND 29
18-24-Year-Olds Enrolled in College
White Black
Connecticut 50% 34%
Illinois 45% 29%
New Jersey 47% 32%
New York 50% 34%
White Hispanic
Arizona 40% 18%
California 45% 27%
North
Carolina
41% 12%
Texas 39% 24%
Utah 45% 16%
White Native
Amer-
icans
Washington 36% 13%
Alaska 33% 11%
Arizona 40% 16%
Source: National Center for Public Policy and Education
First-time, Full-time Students Completing a
Bachelor’s Degree within Six Years of College Entrance
White Black
Delaware 73% 41%
Illinois 65% 34%
Maryland 73% 42%
Michigan 58% 32%
White Hispanic
Illinois 65% 45%
New Jersey 66% 49%
New York 63% 43%
Texas 56% 38%
National Center for Public Policy & Education
White Black
New Mexico 47% 25%
North Dakota 48% 17%
Washington 56% 41%
Education Expenditures
EDUCATION IN THE U.S. AND FINLAND 30
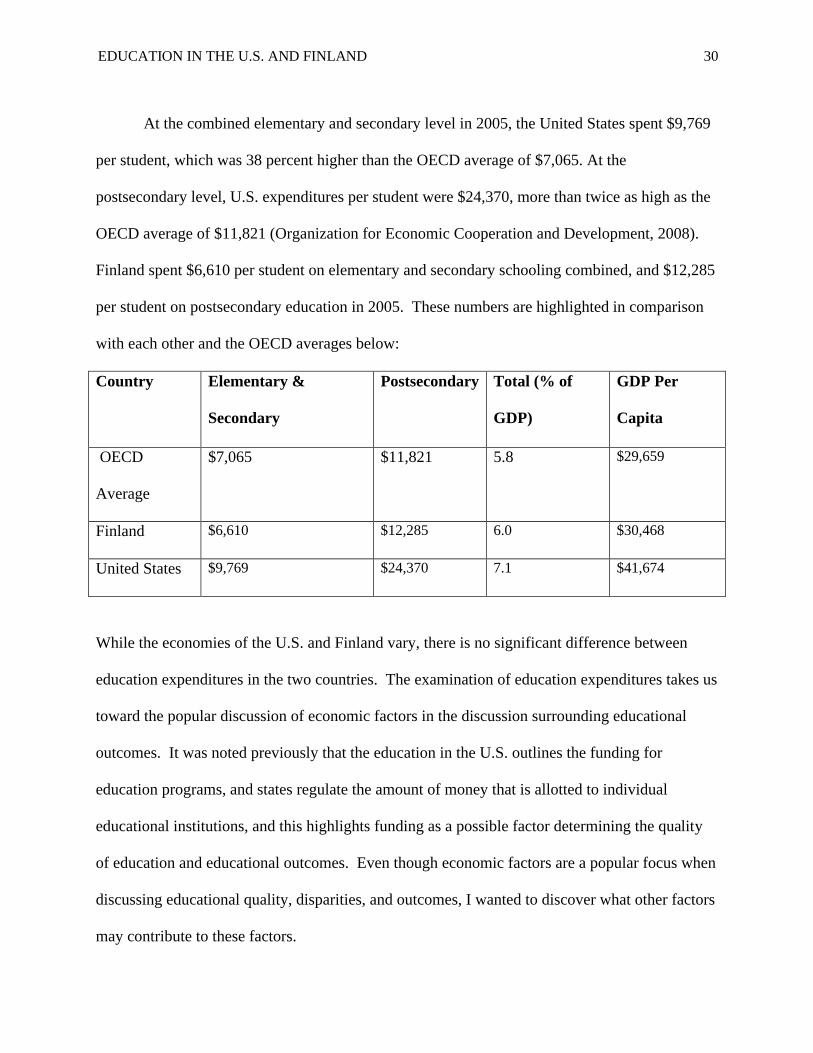
At the combined elementary and secondary level in 2005, the United States spent $9,769
per student, which was 38 percent higher than the OECD average of $7,065. At the
postsecondary level, U.S. expenditures per student were $24,370, more than twice as high as the
OECD average of $11,821 (Organization for Economic Cooperation and Development, 2008).
Finland spent $6,610 per student on elementary and secondary schooling combined, and $12,285
per student on postsecondary education in 2005. These numbers are highlighted in comparison
with each other and the OECD averages below:
Country Elementary &
Secondary
Postsecondary Total (% of
GDP)
GDP Per
Capita
OECD
Average
$7,065 $11,821 5.8 $29,659
Finland $6,610 $12,285 6.0 $30,468
United States $9,769 $24,370 7.1 $41,674
While the economies of the U.S. and Finland vary, there is no significant difference between
education expenditures in the two countries. The examination of education expenditures takes us
toward the popular discussion of economic factors in the discussion surrounding educational
outcomes. It was noted previously that the education in the U.S. outlines the funding for
education programs, and states regulate the amount of money that is allotted to individual
educational institutions, and this highlights funding as a possible factor determining the quality
of education and educational outcomes. Even though economic factors are a popular focus when
discussing educational quality, disparities, and outcomes, I wanted to discover what other factors
may contribute to these factors.

EDUCATION IN THE U.S. AND FINLAND 31
Literature Review
Literature is reviewed to assess the current literature that exists concerning college
students’ views of the most important factors affecting educational disparities. While there is a
profound number of sources published addressing factors affecting educational disparities, there
is practically no literature published that addresses college students’ opinions of factors affecting
educational disparities. College students are an important population to focus on when
discussing factors affecting educational disparities because they are the world’s future leaders,
specifically the world’s future educators and education policy-reformers. It is important to
survey college students to discover the amount of knowledge or the lack of knowledge that
college students have about factors that contribute to educational disparities amongst students,
amongst districts, and amongst states. I was unable to find any studies focusing specifically on
an assessment of college students’ opinions of factors affecting educational disparities or even on
college students’ opinions of educational disparities in general. The literature I present has
focused on: the level of educational disparities; the factors contributing to educational disparities
among students, among school districts, and among states; the factors contributing to providing a
quality education, with an emphasis on economic factors; and the structure of education systems
overall.
Because of the lack of literature concerning college students’ assessments of the factors
contributing to educational disparities and educational outcomes, this literature review focuses
just on the educational disparities and outcomes within the U.S. education system. Much
literature has been published that exemplifies disparities in educational achievement. Palardy
(2008) used data from a large-scale survey conducted by the National Educational Longitudinal
Study of 1988 to examine differential school effects among low, middle, and high social class
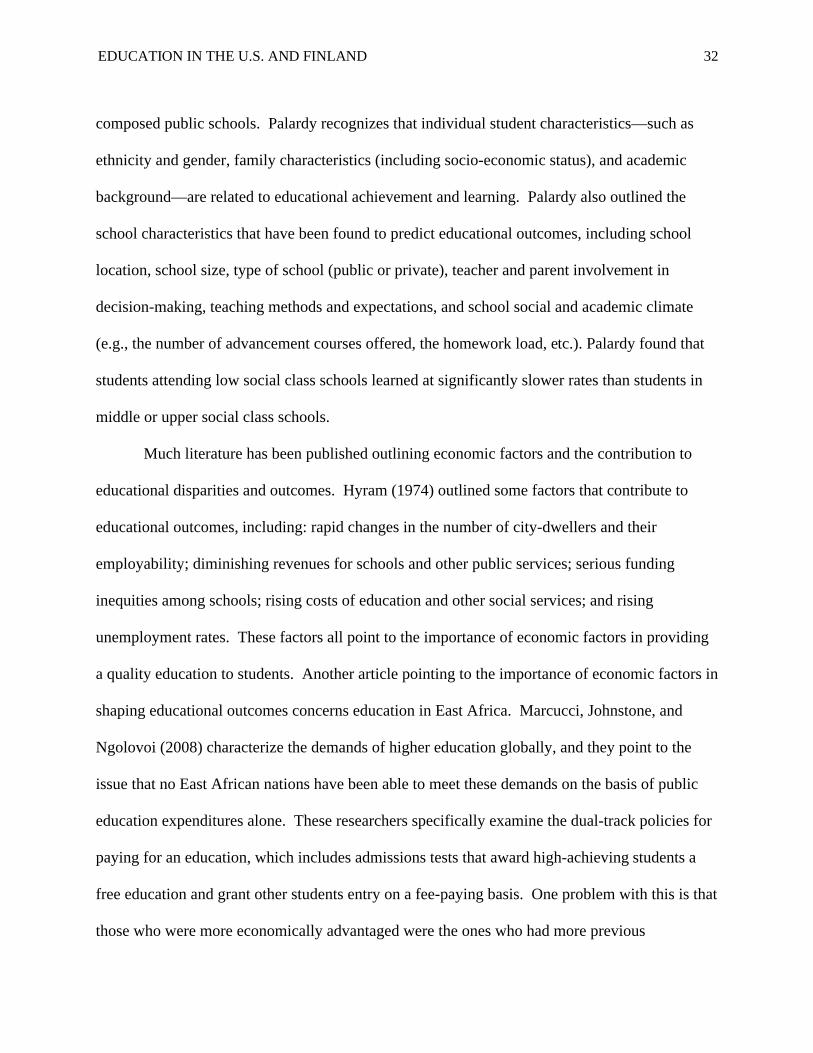
EDUCATION IN THE U.S. AND FINLAND 32
composed public schools. Palardy recognizes that individual student characteristics—such as
ethnicity and gender, family characteristics (including socio-economic status), and academic
background—are related to educational achievement and learning. Palardy also outlined the
school characteristics that have been found to predict educational outcomes, including school
location, school size, type of school (public or private), teacher and parent involvement in
decision-making, teaching methods and expectations, and school social and academic climate
(e.g., the number of advancement courses offered, the homework load, etc.). Palardy found that
students attending low social class schools learned at significantly slower rates than students in
middle or upper social class schools.
Much literature has been published outlining economic factors and the contribution to
educational disparities and outcomes. Hyram (1974) outlined some factors that contribute to
educational outcomes, including: rapid changes in the number of city-dwellers and their
employability; diminishing revenues for schools and other public services; serious funding
inequities among schools; rising costs of education and other social services; and rising
unemployment rates. These factors all point to the importance of economic factors in providing
a quality education to students. Another article pointing to the importance of economic factors in
shaping educational outcomes concerns education in East Africa. Marcucci, Johnstone, and
Ngolovoi (2008) characterize the demands of higher education globally, and they point to the
issue that no East African nations have been able to meet these demands on the basis of public
education expenditures alone. These researchers specifically examine the dual-track policies for
paying for an education, which includes admissions tests that award high-achieving students a
free education and grant other students entry on a fee-paying basis. One problem with this is that
those who were more economically advantaged were the ones who had more previous

EDUCATION IN THE U.S. AND FINLAND 33
educational opportunities and scored higher on these merit-based exams (2008). Marcucci,
Johnstone, and Ngolovoi found that these policies were helpful for some, but they did very little
to assist the poor with obtaining a quality higher education. This shows the importance of
economic factors in obtaining a quality education, and it shows the disparities in education
depending on socio-economic status.
Klein (2008) wrote an article examining the U.S. education budget proposed by former
President George H. W. Bush. Klein points out that the $59.2 billion budget proposed by Bush
would not be sufficient to fund special education programs or the No Child Left Behind Act.
This budget would also call for cuts in after school programs and the Career and Technical
Education program. This is a basic illustration of the focus on money alone as a factor
influencing educational outcomes.
Magnuson, Meyers, Ruhm, and Waldfogel (2007) focus on educational disparities among
students by examining inequalities in school readiness and the effects that this has on the
educational attainment of specific student populations. Researchers examine the increase in
education funding to find out whether or not it has had positive impact on educational disparities.
Researchers found that children from economically disadvantaged backgrounds experienced
larger positive effects from preschool programs than did their peers. Overall, preschool has
positive effects on all children, but the effects are more statistically significant for children from
economically disadvantaged backgrounds. This study demonstrates the need for preschool
programs in reducing or eliminating some of the disparities among students.
Driscoll and Salmon (2008) focus on educational disparities among school districts by
examining and explaining how increased state aid for education resulted in greater disparities
among school districts in Virginia. Researchers outline a specific policy that was enacted to
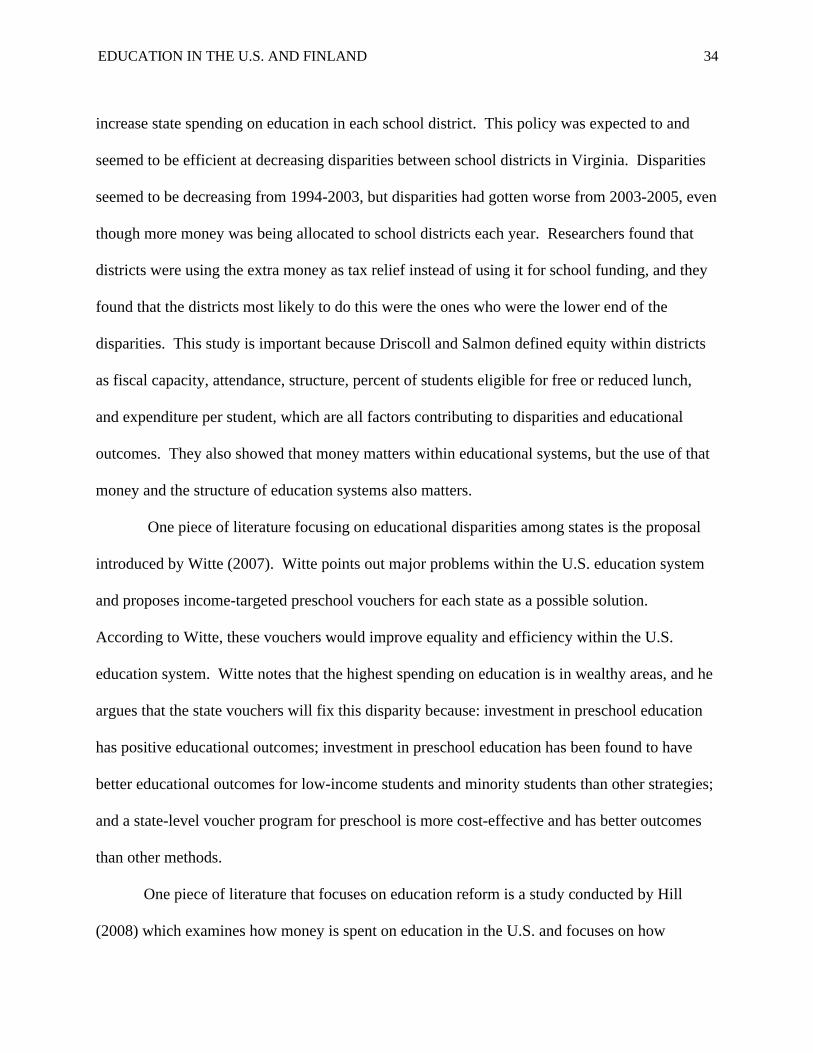
EDUCATION IN THE U.S. AND FINLAND 34
increase state spending on education in each school district. This policy was expected to and
seemed to be efficient at decreasing disparities between school districts in Virginia. Disparities
seemed to be decreasing from 1994-2003, but disparities had gotten worse from 2003-2005, even
though more money was being allocated to school districts each year. Researchers found that
districts were using the extra money as tax relief instead of using it for school funding, and they
found that the districts most likely to do this were the ones who were the lower end of the
disparities. This study is important because Driscoll and Salmon defined equity within districts
as fiscal capacity, attendance, structure, percent of students eligible for free or reduced lunch,
and expenditure per student, which are all factors contributing to disparities and educational
outcomes. They also showed that money matters within educational systems, but the use of that
money and the structure of education systems also matters.
One piece of literature focusing on educational disparities among states is the proposal
introduced by Witte (2007). Witte points out major problems within the U.S. education system
and proposes income-targeted preschool vouchers for each state as a possible solution.
According to Witte, these vouchers would improve equality and efficiency within the U.S.
education system. Witte notes that the highest spending on education is in wealthy areas, and he
argues that the state vouchers will fix this disparity because: investment in preschool education
has positive educational outcomes; investment in preschool education has been found to have
better educational outcomes for low-income students and minority students than other strategies;
and a state-level voucher program for preschool is more cost-effective and has better outcomes
than other methods.
One piece of literature that focuses on education reform is a study conducted by Hill
(2008) which examines how money is spent on education in the U.S. and focuses on how
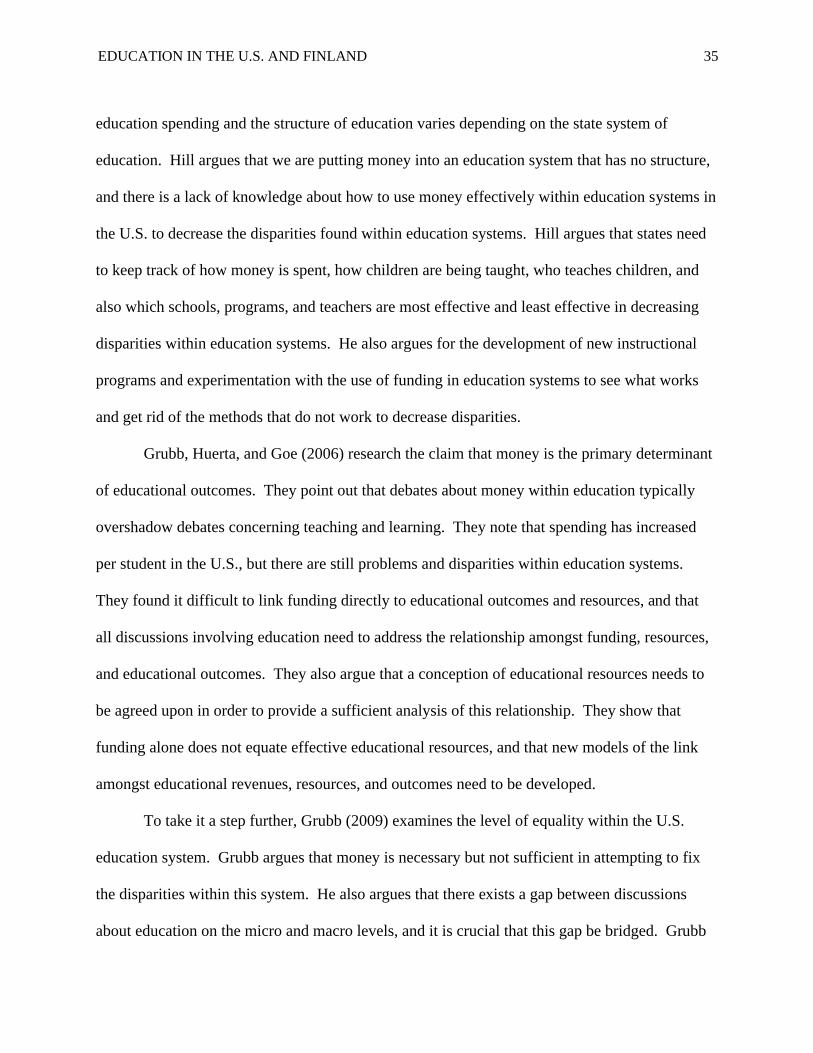
EDUCATION IN THE U.S. AND FINLAND 35
education spending and the structure of education varies depending on the state system of
education. Hill argues that we are putting money into an education system that has no structure,
and there is a lack of knowledge about how to use money effectively within education systems in
the U.S. to decrease the disparities found within education systems. Hill argues that states need
to keep track of how money is spent, how children are being taught, who teaches children, and
also which schools, programs, and teachers are most effective and least effective in decreasing
disparities within education systems. He also argues for the development of new instructional
programs and experimentation with the use of funding in education systems to see what works
and get rid of the methods that do not work to decrease disparities.
Grubb, Huerta, and Goe (2006) research the claim that money is the primary determinant
of educational outcomes. They point out that debates about money within education typically
overshadow debates concerning teaching and learning. They note that spending has increased
per student in the U.S., but there are still problems and disparities within education systems.
They found it difficult to link funding directly to educational outcomes and resources, and that
all discussions involving education need to address the relationship amongst funding, resources,
and educational outcomes. They also argue that a conception of educational resources needs to
be agreed upon in order to provide a sufficient analysis of this relationship. They show that
funding alone does not equate effective educational resources, and that new models of the link
amongst educational revenues, resources, and outcomes need to be developed.
To take it a step further, Grubb (2009) examines the level of equality within the U.S.
education system. Grubb argues that money is necessary but not sufficient in attempting to fix
the disparities within this system. He also argues that there exists a gap between discussions
about education on the micro and macro levels, and it is crucial that this gap be bridged. Grubb
EDUCATION IN THE U.S. AND FINLAND 36
acknowledges the role that money plays in contribution to educational disparities and outcomes,
but also emphasizes the importance of function of money within the U.S. education system.
Apple (1990) also focuses on the structure of education in the U.S. and the effects that the
U.S. economy has on education. Apple evaluates the school as an institution, the forms of
knowledge maintained within schools, and the qualities of the educator. These factors are
important factors in the analysis of the structure of educational systems. Apple argues that
schooling directly affects the economic advancement of society, and that schools contribute to
inequality because they are structured in a way to distribute different kinds of knowledge to
different groups of students. This provides a basis for understanding how the structure of
educational systems can impact educational outcomes and societal outcomes in the case that
economic factors are or are not the largest contributor to educational outcomes.
De Marrais and LeCompte (1999) provide a theoretical analysis of education systems,
using the perspectives of functionalism, conflict theory, interpretivist theory, and critical theory.
They attempt to provide a framework for understanding and explaining the causes of problems
existing within the U.S. education system. De Marrais and LeCompte also focus on the
organization of schooling, which is one factor that contributes to educational outcomes. They
examine school funding on the micro and macro levels, and provide evidence for the effect that
these structural factors have on educational outcomes.
These studies have been effective at outlining factors that contribute to educational
disparities and outcomes among students, within districts, within states, and the education system
overall. I would like to conduct a study to discover the factors that college students believe are
the factors determining educational disparities and outcomes, and which of these factors they
believe are most important. After learning which factors college students, the people who are

EDUCATION IN THE U.S. AND FINLAND 37
future educators and other world leaders, believe determine educational outcomes we can raise
awareness of their knowledge about these factors and affect change in the discussions
surrounding the quality of education in the U.S.
Summary of Lit Review
The review of literature shows that the discussion about factors concerning educational
disparities and educational achievement does revolve around economic factors. There exist
many other factors that contribute to educational outcomes and disparities within the U.S.
education system, but the majority of literature focuses on those relating to money. Some
researchers recognize the importance of examining how money is used within the U.S. education
system and the importance of examining the structure of education systems in evaluating its
success or failure. Some researchers also recognize that the curriculum needs more focus within
the discussion surrounding education in the U.S. The literature review highlights some of the
key factors affecting educational disparities and outcomes, but it would be interesting to know
what people perceive are the most important factors determining the quality of education and
contributing to educational disparities. For this purpose, an empirical survey was conducted to
assess college students’ evaluations of the U.S. education system, focusing solely on U.S. high
schools.
Method
Students were asked which factors they believe contribute the most to providing students
with a quality high school education. They were given eight options (internet access, money
spent on each student, diversity of student body, access to computers, class size, teacher salary,
updated classroom materials, and teaching methods), and they were able to add any one-three
factors they felt necessary in providing a quality education if it was not on the list provided.

EDUCATION IN THE U.S. AND FINLAND 38
Students were also asked how effectively they think that the U.S. education system prepares
students to enter the workforce and for college. Students were also asked to rate the level at
which their own high schools effectively gave them a quality education based on the factors they
chose as most important in providing students with a quality education. These ratings were
given on a scale of one to seven, and students were asked to provide an explanation for each
rating. Students were also asked what, if anything, needed to be done by U.S. high schools to
more effectively prepare students for the job market and for college. Finally, students were
asked the primary purpose of pursuing an education at a four-year college or university.
I hypothesized that many Aurora University students would choose money spent on each
student as one of the strongest factors contributing to a quality high school education. I do not
think that money is the most important factor, but I did hypothesize that many students would
think that money is the most important factor in determining a quality education. If this were
true, it would mean that countries that have a lower per capita gross domestic product (GDP)
than the U.S. should score lower on assessments like the PISA. But this is not the case. With
this survey, I set out to answer the following question: Why does the U.S. score so much lower
than other developed countries on international assessments like the PISA? I also hypothesized
that money does play a role in education outcomes, but only because the U.S. has structured its
education system in a way which makes money an important factor. Also, many students may
not pick money spent on each student as one of the top three factors in determining a quality
education, but they may choose factors directly related to money, such as access to computers
and updated classroom materials.

EDUCATION IN THE U.S. AND FINLAND 39
Data
I surveyed a total of 92 participants in the classroom setting at a small private suburban
college in the Midwest. The survey sample includes 16 participants who were age 18, 23
participants that were 19 years old, 26 participants that were 20 years old, 13 participants that
were 21 years old, 8 participants that were 22 years old, 2 that were 26 years old, one was 28
years old, one was 32 years old, and one was 54 years old with a mean age of 20.44. There were
Freshman/first-year students (22 of 92), Sophomore/second-year students (32/92), Junior/third-
year students (29/92), and Senior/fourth-year students (7/92) represented in this survey. The
majors represented by the participants were Elementary Education (26/92), Criminal Justice
(25/92), Psychology (3/92), Business (3/92), Political Science (2/92), History (7/92), Secondary
Education (2/92), Nursing (6/92), Health Science (2/92), Physical Education (1/92), Undecided
(4/92), Special Education (5/92), Theatre (1/92), Social Work (4/92), and Mathematics (1/92).
There were 18 participants who listed a second major, and they were Elementary Education
(2/18), Criminal Justice (1/18), Psychology (1/18), Business (1/18), Political Science (1/18),
History (3/18), Secondary Education (7/18), and Spanish (2/18). The ethnicities of the
participants were African-American/Black (7/92, 7.6% of participants), Hispanic/Latino (12/92,
13%), Caucasian/White (68/92, 73.9 %), and mixed race (3/92, 3.3%). Two participants did not
specify ethnicity. The countries represented by the participants were the United States (86/92,
93.5%), Mexico (4/92, 4.3%), Russia (1/92, 1.1%), and Peru (1/92, 1.1%). None of the
participants specified attending school in a country other than the U.S. There were 63 (68.5%)
traditional (non-transfer) students, 5 (5.4%) students who transferred from a four-year college at
the sophomore level, 10 (10.9%) students who transferred from a two-year college at the junior
EDUCATION IN THE U.S. AND FINLAND 40
level, 9 (9.8%) students who transferred from a two-year college at the sophomore level, and 5
(5.4%) students who transferred from a four-year college at the junior level.
When participants were asked to choose the most important factors in determining a
quality education, the following options were chosen as the number one most important factor:
internet access was chosen one time, money spent on each student was chosen 6 times, diversity
of student body was chosen 1 time, access to computers was chosen 1 time, class size was
chosen 11 times, updated classroom materials was chosen 11 times, teaching methods was
chosen 60 times, location was a factor that was added and chosen as number 1 by one student,
and none of the participants chose teacher salary as the number one factor in determining a
quality education. When looking at the factors that were chosen as either the most important,
second most important, or third most important factor in providing a quality high school
education, teacher salary was chosen a total of 3 times, money spent on each student was chosen
a total of 12 times, access to computers was chosen a total of 14 times, internet access was
chosen a total of 19 times, diversity of student body was chosen a total of 31 times, updated
classroom materials was chosen a total of 50 times, class size was chosen a total of 64 times, and
teaching methods was chosen a total of 81 times.
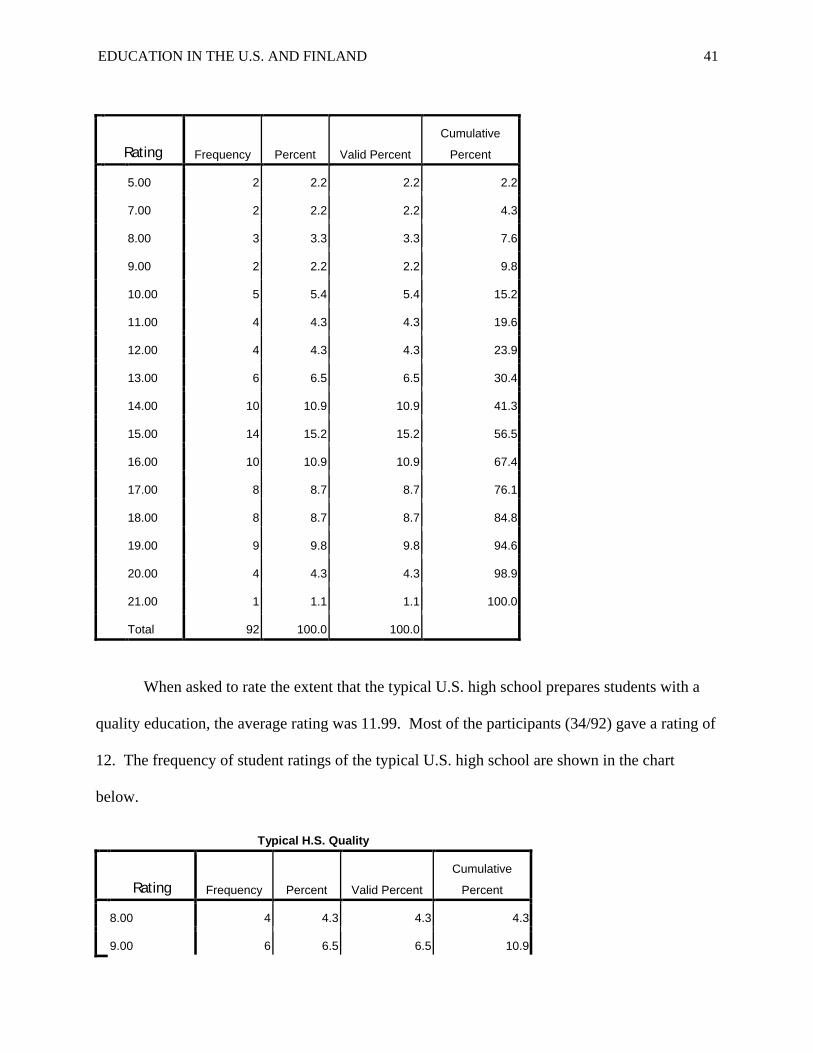
When participants were asked to rate the extent to which their high school provided them
with a quality education, the average rating on a scale from 3-21 was 14.65, where 3 is
considered to be poor quality, 12 is considered to be neutral, and 21 is considered to be high
quality. The rating occurring the most often was 15 (14/92 participants), and the frequency of
ratings is shown in the chart below.
Participant H.S. Quality
EDUCATION IN THE U.S. AND FINLAND 41
Rating Frequency Percent Valid Percent
Cumulative
Percent
5.00 2 2.2 2.2 2.2
7.00 2 2.2 2.2 4.3
8.00 3 3.3 3.3 7.6
9.00 2 2.2 2.2 9.8
10.00 5 5.4 5.4 15.2
11.00 4 4.3 4.3 19.6
12.00 4 4.3 4.3 23.9
13.00 6 6.5 6.5 30.4
14.00 10 10.9 10.9 41.3
15.00 14 15.2 15.2 56.5
16.00 10 10.9 10.9 67.4
17.00 8 8.7 8.7 76.1
18.00 8 8.7 8.7 84.8
19.00 9 9.8 9.8 94.6
20.00 4 4.3 4.3 98.9
21.00 1 1.1 1.1 100.0
Total 92 100.0 100.0
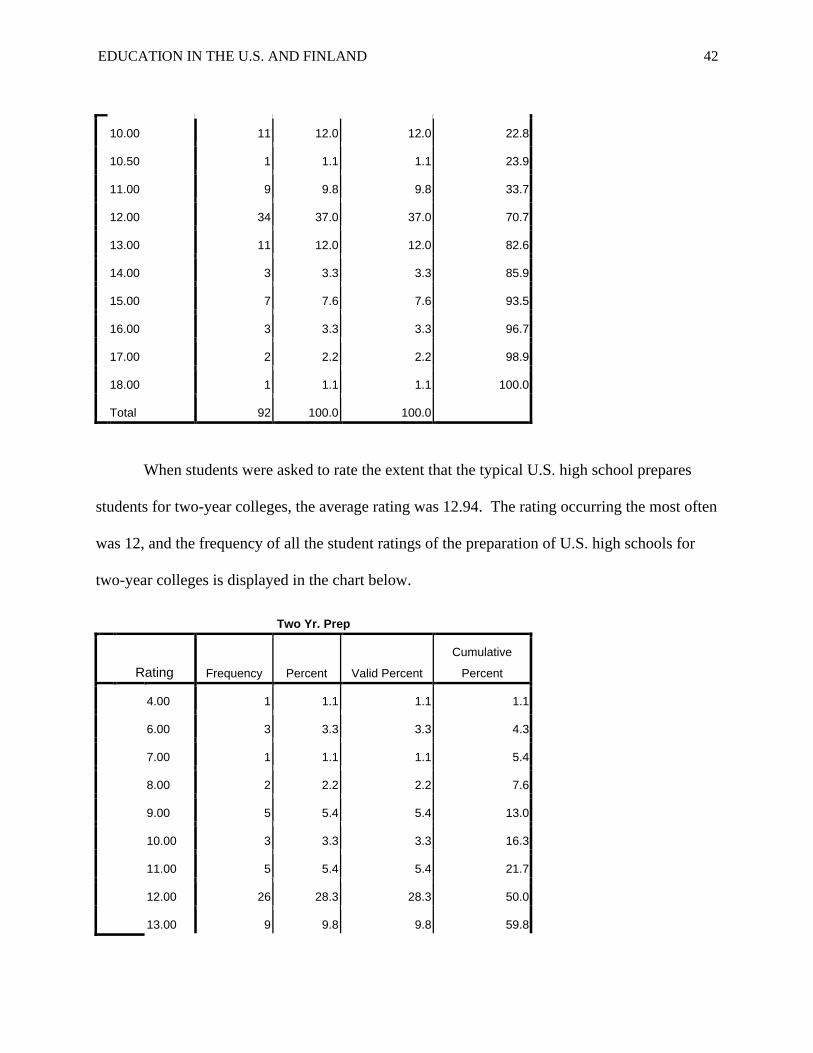
When asked to rate the extent that the typical U.S. high school prepares students with a
quality education, the average rating was 11.99. Most of the participants (34/92) gave a rating of
12. The frequency of student ratings of the typical U.S. high school are shown in the chart
below.
Typical H.S. Quality
Rating Frequency Percent Valid Percent
Cumulative
Percent
8.00 4 4.3 4.3 4.3
9.00 6 6.5 6.5 10.9
EDUCATION IN THE U.S. AND FINLAND 42
10.00 11 12.0 12.0 22.8
10.50 1 1.1 1.1 23.9
11.00 9 9.8 9.8 33.7
12.00 34 37.0 37.0 70.7
13.00 11 12.0 12.0 82.6
14.00 3 3.3 3.3 85.9
15.00 7 7.6 7.6 93.5
16.00 3 3.3 3.3 96.7
17.00 2 2.2 2.2 98.9
18.00 1 1.1 1.1 100.0
Total 92 100.0 100.0
When students were asked to rate the extent that the typical U.S. high school prepares
students for two-year colleges, the average rating was 12.94. The rating occurring the most often
was 12, and the frequency of all the student ratings of the preparation of U.S. high schools for
two-year colleges is displayed in the chart below.
Two Yr. Prep
Rating Frequency Percent Valid Percent
Cumulative
Percent
4.00 1 1.1 1.1 1.1
6.00 3 3.3 3.3 4.3
7.00 1 1.1 1.1 5.4
8.00 2 2.2 2.2 7.6
9.00 5 5.4 5.4 13.0
10.00 3 3.3 3.3 16.3
11.00 5 5.4 5.4 21.7
12.00 26 28.3 28.3 50.0
13.00 9 9.8 9.8 59.8
EDUCATION IN THE U.S. AND FINLAND 43
14.00 10 10.9 10.9 70.7
15.00 10 10.9 10.9 81.5
16.00 3 3.3 3.3 84.8
17.00 7 7.6 7.6 92.4
18.00 5 5.4 5.4 97.8
19.00 1 1.1 1.1 98.9
21.00 1 1.1 1.1 100.0
Total 92 100.0 100.0
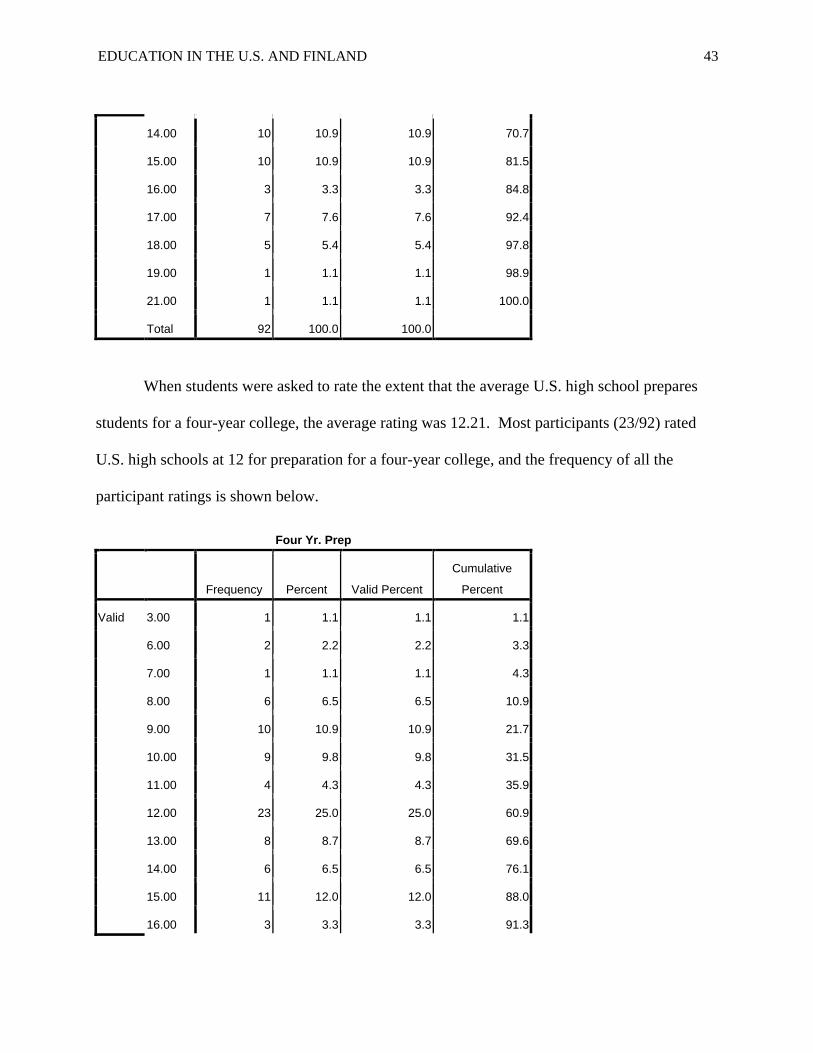
When students were asked to rate the extent that the average U.S. high school prepares
students for a four-year college, the average rating was 12.21. Most participants (23/92) rated
U.S. high schools at 12 for preparation for a four-year college, and the frequency of all the
participant ratings is shown below.
Four Yr. Prep
Frequency Percent Valid Percent
Cumulative
Percent
Valid 3.00 1 1.1 1.1 1.1
6.00 2 2.2 2.2 3.3
7.00 1 1.1 1.1 4.3
8.00 6 6.5 6.5 10.9
9.00 10 10.9 10.9 21.7
10.00 9 9.8 9.8 31.5
11.00 4 4.3 4.3 35.9
12.00 23 25.0 25.0 60.9
13.00 8 8.7 8.7 69.6
14.00 6 6.5 6.5 76.1
15.00 11 12.0 12.0 88.0
16.00 3 3.3 3.3 91.3
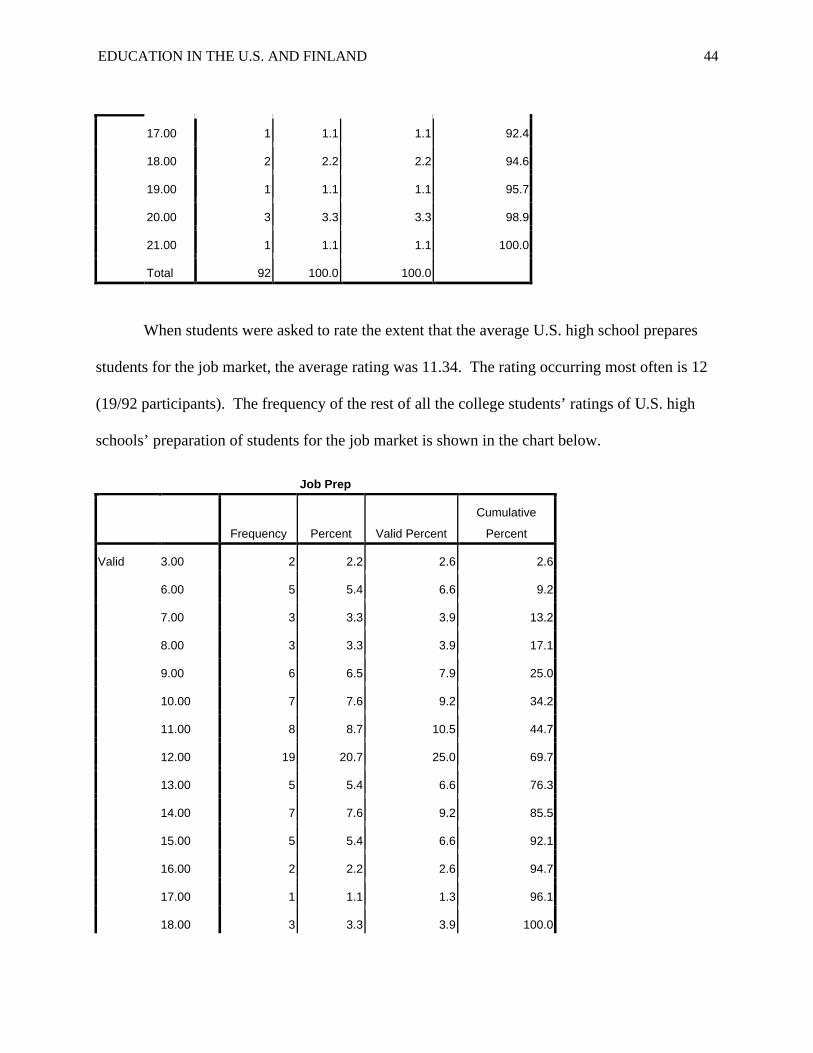
EDUCATION IN THE U.S. AND FINLAND 44
17.00 1 1.1 1.1 92.4
18.00 2 2.2 2.2 94.6
19.00 1 1.1 1.1 95.7
20.00 3 3.3 3.3 98.9
21.00 1 1.1 1.1 100.0
Total 92 100.0 100.0
When students were asked to rate the extent that the average U.S. high school prepares
students for the job market, the average rating was 11.34. The rating occurring most often is 12
(19/92 participants). The frequency of the rest of all the college students’ ratings of U.S. high
schools’ preparation of students for the job market is shown in the chart below.
Job Prep
Frequency Percent Valid Percent
Cumulative
Percent
Valid 3.00 2 2.2 2.6 2.6
6.00 5 5.4 6.6 9.2
7.00 3 3.3 3.9 13.2
8.00 3 3.3 3.9 17.1
9.00 6 6.5 7.9 25.0
10.00 7 7.6 9.2 34.2
11.00 8 8.7 10.5 44.7
12.00 19 20.7 25.0 69.7
13.00 5 5.4 6.6 76.3
14.00 7 7.6 9.2 85.5
15.00 5 5.4 6.6 92.1
16.00 2 2.2 2.6 94.7
17.00 1 1.1 1.3 96.1
18.00 3 3.3 3.9 100.0

EDUCATION IN THE U.S. AND FINLAND 45
Total 76 82.6 100.0
Missing System 16 17.4
Total 92 100.0
When students were asked if there is anything that needs to be done to improve the
quality of education offered by U.S. high schools to adequately prepare students for the job
market, students responses included: nothing; (10/92); giving more focus on academics and more
school work in classes (17/92); providing more specific and useful job/career information (3/92);
more college preparation classes (12/92); more business specific classes (2/92); more money or
equal funding for all schools (13/92); better resources (1/92); full reform of education system
(12/92); better teachers (8/92); minimize class size (2/92); one participant said yes something
needs to be done without specifying what it is that should be done; and 11 participants did not
answer this question.
Improve.Edu
Frequency Percent Valid Percent
Cumulative
Percent
Valid Nothing 10 10.9 12.3 12.3
More Work 17 18.5 21.0 33.3
Job Info 3 3.3 3.7 37.0
College Prep 12 13.0 14.8 51.9
Bus. Classes 2 2.2 2.5 54.3
Funding 13 14.1 16.0 70.4
Resources 1 1.1 1.2 71.6
Yes 1 1.1 1.2 72.8
Reform 12 13.0 14.8 87.7
Teachers 8 8.7 9.9 97.5
Class Size 2 2.2 2.5 100.0
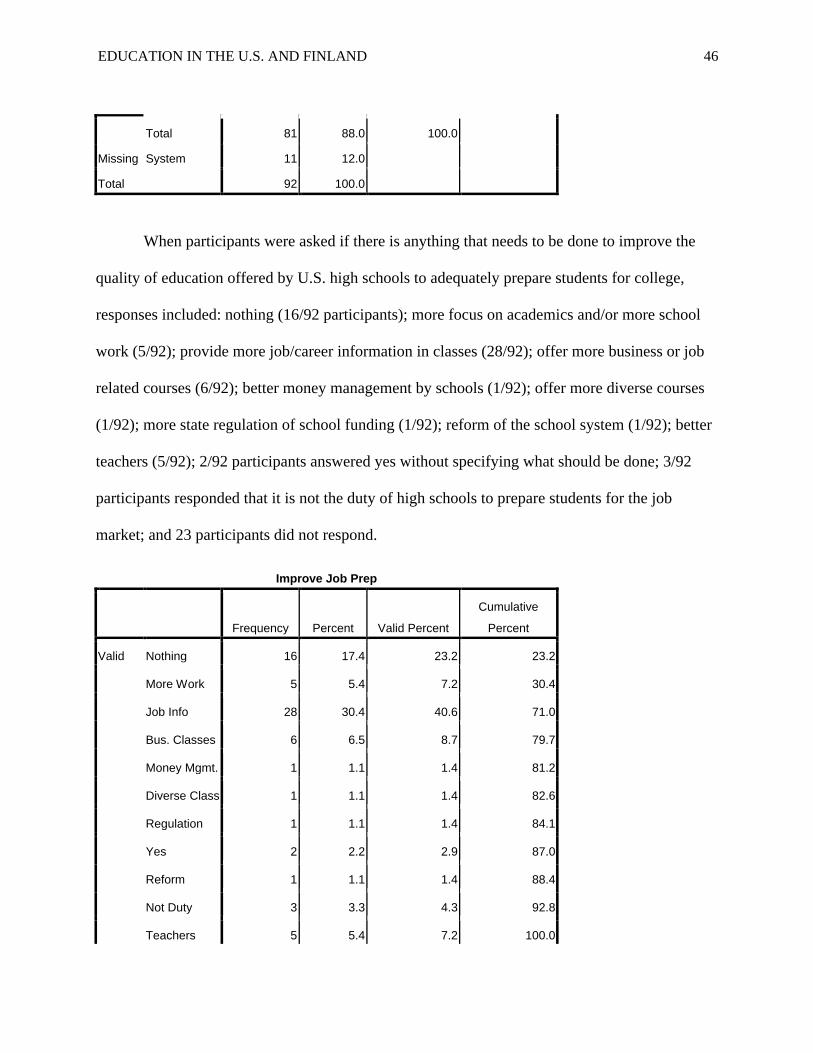
EDUCATION IN THE U.S. AND FINLAND 46
Total 81 88.0 100.0
Missing System 11 12.0
Total 92 100.0
When participants were asked if there is anything that needs to be done to improve the
quality of education offered by U.S. high schools to adequately prepare students for college,
responses included: nothing (16/92 participants); more focus on academics and/or more school
work (5/92); provide more job/career information in classes (28/92); offer more business or job
related courses (6/92); better money management by schools (1/92); offer more diverse courses
(1/92); more state regulation of school funding (1/92); reform of the school system (1/92); better
teachers (5/92); 2/92 participants answered yes without specifying what should be done; 3/92
participants responded that it is not the duty of high schools to prepare students for the job
market; and 23 participants did not respond.
Improve Job Prep
Frequency Percent Valid Percent
Cumulative
Percent
Valid Nothing 16 17.4 23.2 23.2
More Work 5 5.4 7.2 30.4
Job Info 28 30.4 40.6 71.0
Bus. Classes 6 6.5 8.7 79.7
Money Mgmt. 1 1.1 1.4 81.2
Diverse Class 1 1.1 1.4 82.6
Regulation 1 1.1 1.4 84.1
Yes 2 2.2 2.9 87.0
Reform 1 1.1 1.4 88.4
Not Duty 3 3.3 4.3 92.8
Teachers 5 5.4 7.2 100.0
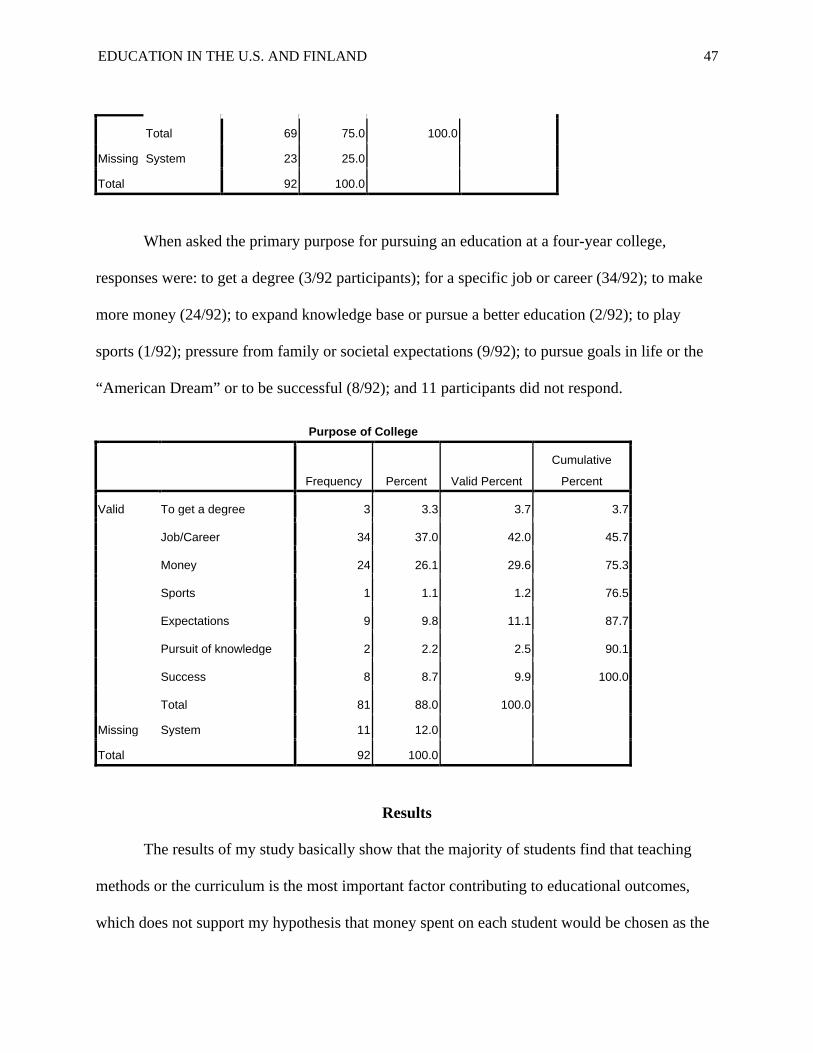
EDUCATION IN THE U.S. AND FINLAND 47
Total 69 75.0 100.0
Missing System 23 25.0
Total 92 100.0
When asked the primary purpose for pursuing an education at a four-year college,
responses were: to get a degree (3/92 participants); for a specific job or career (34/92); to make
more money (24/92); to expand knowledge base or pursue a better education (2/92); to play
sports (1/92); pressure from family or societal expectations (9/92); to pursue goals in life or the
“American Dream” or to be successful (8/92); and 11 participants did not respond.
Purpose of College
Frequency Percent Valid Percent
Cumulative
Percent
Valid To get a degree 3 3.3 3.7 3.7
Job/Career 34 37.0 42.0 45.7
Money 24 26.1 29.6 75.3
Sports 1 1.1 1.2 76.5
Expectations 9 9.8 11.1 87.7
Pursuit of knowledge 2 2.2 2.5 90.1
Success 8 8.7 9.9 100.0
Total 81 88.0 100.0
Missing System 11 12.0
Total 92 100.0
Results
The results of my study basically show that the majority of students find that teaching
methods or the curriculum is the most important factor contributing to educational outcomes,
which does not support my hypothesis that money spent on each student would be chosen as the

EDUCATION IN THE U.S. AND FINLAND 48
most important factor contributing to the quality of education. These results support the idea that
the structure of education determines educational outcomes more than economic factors. Many
participants did choose factors that were directly related to money (such as access to computers,
internet access, updated classroom materials, and class size) as one of the top three factors in
determining a quality education. This shows that students suggest that money does play a part in
providing a quality education whether directly or indirectly. Also, the majority of participants
rated the quality of their own high schools as higher than the quality of the typical high school.
Many of the participants also recognized the disparities in the quality of U.S. high schools in the
explanations of the ratings given on their surveys by making statements such as “I have no clue
how it is at other high schools,” “all student[s] aren’t given an equal amount of money [and]
being provided with less resources. It seems like schools are either really good or they are really
bad.” In addition to the survey highlighting students’ assessments of the U.S. education system,
it also brought light to the level of preparation of the participants completing the survey. Many
of the participants did not answer all of the questions on the survey, which all asked for written
explanations for the responses given, and one participant stated that “this survey is too long.”
Discussion
The review of literature and the results of the survey show that many factors contribute to
educational outcomes. While the majority of students surveyed did not identify money as one of
the most important contributing to educational outcomes, many of them identified factors that
directly relate to money, such as access to computers, class size, internet access, and updated
classroom materials. The schools with the most money will have more computers and internet
access, will be able to hire more teachers to keep class sizes lower, and will be able to purchase
updated classroom materials much more frequently than those with less money. Overall, the

EDUCATION IN THE U.S. AND FINLAND 49
results show that economic factors do impact the quality of education in the U.S., in addition to
other factors. One way to examine the impact of economic factors in shaping educational
outcomes is by considering the impact that capitalism in the U.S. has on education. Marx
focused on capitalism, but the basis of his argument lies in the concept of class conflict
(Appelrouth & Edles, 2008). Marx saw society composed of two classes—the owner and the
worker—who interacted on terms of domination and subordination. According to Marx,
capitalism inevitably leads to exploitation of workers, and wealth becomes concentrated in the
hands of the wealthy. According to Marx, the class conflict stemming from capitalism prevents
individuals from cultivating their natural talents and actualizing their full potential (Appelrouth
& Edles, 2008). If education is tied to money, this means that the wealthy have more educational
opportunities than the poor. The amount and quality of education that an individual can receive
will depend on the amount and quality of education that they can afford. Also, education is seen
as the key to a revolution that would eliminate class conflict. Antonio Gramsci argued that the
working class would develop class consciousness and eliminate class conflict through technical
education (Appelrouth & Edles). The relationship expressed here is paradoxical because access
to education is more widespread for the wealthy than for the poor, but the key to eliminating
class conflict is through education.
In addressing education as a tool for success, Harriet Martineau and W.E. Burghardt Du
Bois also provide a framework for analysis of education. Martineau describes education in the
U.S. as “the necessary qualification for the enjoyment of social privileges” (1838; 2004). This
supports the idea that education is a tool for success, or social privilege, but Martineau does not
agree that education should be linked to social privilege. Martineau argues that the extent of
universal education shows the level of liberty of a society, and that all should have access to an

EDUCATION IN THE U.S. AND FINLAND 50
education: education should be free to all (1838; 2004). Martineau also points out that everyone
does not have access to a quality education in the U.S. (true in the 1800s and still evident now),
and those who do have access to a higher quality education do not even always value this
education or use it for the good of society. Here, Martineau highlights problems with the U.S.
education system in the mid-1880s that still seem to exist today, but more importantly she
acknowledges education, free universal education, as the key to freedom in any given society.
Along with Martineau, W.E.B. Du Bois also highlights the importance of education in the
fight for liberty. Du Bois focused on racial oppression, and he argued that the ultimate evil was
stupidity (1903; 1986). He also argued that black people were held down by poverty and
ignorance, stressing the importance of education in gaining freedom from oppression. Du Bois
argues that it is the duty of those black individuals who have had an opportunity to pursue a
higher education to help liberate all black people from poverty, ignorance, and the oppression of
white people. He also called for reform of black institutions of higher education so that they
would provide a quality of education that compares to the education of the white person (1903;
1986). Here, a quality education is seen as a means for a more free and equal society.
Conclusion
One limitation of this study is that the PISA, which is used for primary analysis of
educational outcomes, only uses measurements of 30 out of the countries assessed. These 30
countries are members of the OECD, which is why they are used, and it biases the results of the
PISA because only the results from these industrialized countries are used for analysis. One
limitation of this study is that the figures used to determine educational disparities and outcomes
may not have included all of the factors that could be used to determine educational disparities
and outcomes. Therefore, some factors relevant to the discussion could be missing in this
EDUCATION IN THE U.S. AND FINLAND 51
analysis. Another limitation is that there are education acts besides the Basic Education Act in
Finland and the No Child Left Behind Act in the U.S. that would outline specific criteria and
details about the education systems in each country. One other limitation is that the survey
included in this analysis contained a convenience sample and cannot be generalized to other
populations, and the number of males and females participating in the survey was not specified.
In addition to these, the survey asked students to rate the quality of U.S. high schools based on
the factors they chose to define a quality education. This means that each participant defined
what it means to have a quality education for him- or herself. If there was an operational
definition provided for all participants to make their ratings, the results may have been different.
In this analysis, I found evidence that economic factors greatly impact educational
disparities and outcomes. I also found that other factors, like teaching methods and the way that
money is spent within an education system, greatly contributes to educational disparities and
outcomes. This analysis brings light to some of the discussion surrounding education by
focusing on disparities within the U.S. education system, the comparison of the U.S. system to
the one in Finland, and examining how a sample of undergraduate college students view the
quality of U.S. education. I hope that my analysis may serve as a tool to help increase the
consideration of restructuring of the ways our education system is financed. I also hope that my
analysis shifts the basis of the discussion surrounding the quality of education in the United
States. One issue that was mentioned briefly but was not elaborated in my analysis is the right to
education. Education should be addressed as a human rights issue. The Basic Education Act
outlines the fee universal education system in place in Finland, and in the U.S. education
depends on the amount of money paid for it because students have to pay for their own
educations. In Finland, education is regulated by the government, and the same quality of
EDUCATION IN THE U.S. AND FINLAND 52
education is provided to all, regardless of how much money the student can afford to pay for
schooling. This means that all materials that students need will be paid for by the government
and not by the students or the teachers themselves.
Also, all those who identified teaching methods as a factor in providing a quality
education and the need for quality teachers need to recognize that the current education system is
producing our future educators. If the education system was uniform and produced more
effective outcomes, then all teachers would be taught the same way to be able to effectively
educate their future students. If we start now by reforming the entire system and making
education a right for all and regulating the curriculum to nurture all students’ talents, this would
possibly eliminate the current disparities existing within the U.S. education system. Also, more
students might continue with schooling and become more productive members of society if they
are not plagued with the burden of figuring out how to pay for their education.

EDUCATION IN THE U.S. AND FINLAND 53
Bibliography
Appelrouth, S., & Edles, L. D. (Eds.). (2008). Classical and contemporary sociological theory.
Thousand Oaks, CA: Pine Forge Press.
Apple, M. W. (1990). Ideology and Curriculum. 2nd ed. New York: Routledge.
Cataldi, E.F., Laird, J., and KewalRamani, A. (2009). High School Dropout and Completion
Rates in the United States: 2007. (NCES 2009-064). National Center for Education
Statistics, Institute of Education Sciences, U.S. Department of Education. Washington,
DC. Retrieved [March 2010] from
http://nces.ed.gov/pubsearch/pubsinfo.asp?pubid=2009064
Central Intelligence Agency. The World Factbook: Finland. Retrieved from
https://www.cia.gov/library/publications/the-world-factbook/geos/fi.html
Central Intelligence Agency. The World Factbook: United States. Retrieved from
https://www.cia.gov/library/publications/the-world-factbook/geos/us.html#top
De Marrais, K. B. & LeCompte. (1999). The way schools work: A sociological analysis of
education. 3rd ed. New York: Longman.
Driscoll, L. G. & Salmon, R. G. (2008). How increased state equalization aid resulted in greater
disparities: An unexpected consequence for the commonwealth of Virginia. Journal of
Education Finance, 33(3), 238-261.
Huggins, N. (Ed.). (1986). Du Bois, William Edward Burghardt, 1868-1963. Writings: The
suppression of the African slave-trade; The souls of black folk; Dusk of dawn; Essays and
articles from The Crisis. New York: Library of America.
Grubb, W. N. (2009). The money myth. New York: Russell Sage Foundation.
EDUCATION IN THE U.S. AND FINLAND 54
Grubb, W. N., Huerta, L. A., & Goe, L. (2006). Straw into gold, revenues into results: Spinning
out the implications of the improved school finance. Journal of Education Finance,
31(4), 334-359.
Hill, P. T. (2008). Spending money when it’s not clear what works. Peabody Journal of
Education, 83(2), p. 238-258.
Hyram, G. H. (1974). Urban economic factors in education: The knowledge base for pre- and in-
service educational personnel. [Working Paper] U.S. Department of Health, Education, &
Welfare National Institute of Education.
International Association of Universities. (2006). World Higher Education Database: Finland.
Retrieved from http://www.euroeducation.net/prof/finco.htm
Klein, A. (2008). Bush education budget inadequate, Spellings is told. Education Week, 27(26),
19.
Magnuson, K., Meyers, M. K., Ruhm, C. J., & Waldfogel, J. (2007). Inequality in children’s
school readiness and public funding. Democracy & Education, 17(1), 55-63.
Marcucci, P., Johnstone, D. B., & Ngolovoi, M. (2008). Higher educational cost-sharing, dual-
track tuition fees, and higher educational access: The East African experience. Peabody
Journal of Education, 83(1), 101-116.
Martineau, H. (1838; 2004). How to observe. Morals and manners. London: Charles Knight and
Co.
National Center for Public Policy and Higher Education. (2008). Measuring Up 2008: The
National Report Card on Higher Education. Report # 08-4 retrieved from
http://www.highereducation.org/
Office of Superintendent of Public Instruction. (2009). About the elementary and secondary
education act. No Child Left Behind. Retrieved from http://www.k12.wa.us/esea/
EDUCATION IN THE U.S. AND FINLAND 55
Organization for Economic Cooperation and Development (OECD), Center for Educational
Research and Innovation. (2008). Education at a Glance, 2008: OECD Indicators, tables
B1.1b, B2.1, and X2.1. Retrieved from
http://nces.ed.gov/programs/coe/2009/section4/table-ifn-1.asp
Organization for Economic Cooperation & Development. PISA 2006 Results. [Data sets].
Retrieved from http://www.oecd.org/document/2/0,3343,en_32252351_32236191_
39718850_1_1_1_1,00.html#tables_figures_dbase
Palardy, G. J. (2008). Differential schools effects among low, middle, and high social class
composition schools: A multiple group, multilevel latent growth curve analysis. School
Effectiveness and School Improvement, 19(1), 21-49.
Statistics Finland. Current expenditure on regular education system increased in 2007. [Data
set]. Retrieved from http://www.stat.fi/til/kou_en.html
Stephens, M., & Coleman, M. (2007). Comparing PIRLS and PISA with NAEP in reading,
mathematics, and science (Working Paper). U.S. Department of Education. Washington,
DC: National Center for Education Statistics. Available at:
http://nces.ed.gov/Surveys/PISA/pdf/comppaper12082004.pdf
U.S. Department of Education. (2008). USNEI: Organization of U.S. Education. Retrieved from
http://www2.ed.gov/about/offices/list/ous/international/usnei/us/edlite-org-us.html
U.S. Department of Education, National Center for Education Statistics. (2009). Digest of
Education Statistics. [Data sets]. Retrieved from http://nces.ed.gov/programs/digest/
Weekly Compilation of Presidential Documents. No Child Left Behind Act of 2001, Vol. 38
(2002): Jan. 8, Presidential remarks.
Witte, J. F. (2007). A proposal for state, income-targeted, preschool vouchers. Peabody Journal
of Education, 82(4), 617-644.


