education data education evidence education policy education analysis education statistics
IN2014 (April)
EDUCATION INDICATORS FOCUS 21
How much are teachers paid and how much does it matter?
High-performing education systems tend to prioritise the quality of teachers over other inputs, most notably class size. Attractive salaries, as well as efficient social-benefits systems, are therefore important to make teaching a more appealing career choice and to retain effective teachers in the profession.
Teachers’ salaries increased in real terms between 2000 and 2011 in virtually all OECD countries, but mostly remain below those of other tertiary-educated workers.
Statutory salaries for lower secondary school teachers with 15 years of experience are 35% higher than starting salaries in OECD countries.
Among OECD countries, education systems that pay teachers more relative to their national income per capita tend to perform slightly better in mathematics as shown by the PISA study.
An increasing number of countries are now targeting salary increases to attract high-level graduates in the profession, to retain the best teachers or to assign the most experienced teachers to disadvantaged schools.
Equivalent USD converted using PPPs
1. Salary at top of scale and minimum training. For Switzerland, salaries after 11 years of expereience (and not 15 years).2. Actual base salaries.3. Year of reference 2010.Countries are ranked in descending order of teachers' salaries (for teachers with 15 years of experience) in lower secondary education.Source: OECD (2013), Education at a Glance 2013: OECD Indicators, Indicator D3 (www.oecd.org/edu/eag.htm).
Figure 1. Teachers’ salaries (minimum, after 15 years of exeperience and maximum) in lower secondary education (2011)
Annual statutory teachers' salaries, in public institutions, in equivalent USD converted using PPPs
140 000
120 000
100 000
80 000
60 000
40 000
20 000
0
Luxe
mbo
urg
Swit
zerl
and1
Ger
man
yN
ethe
rlan
dsCa
nada
Irel
and
Den
mar
kA
ustr
alia
Kor
ea1
Scot
land
Uni
ted
Stat
es2
Japa
nSp
ain
Belg
ium
(Fl.)
1
Aus
tria
Belg
ium
(Fr.)
Engl
and
New
Zea
land
Finl
and
OEC
D a
vera
gePo
rtug
alN
orw
ayFr
ance
Ital
ySw
eden
1,2
Slov
enia
Gre
ece
Icel
and
Isra
elM
exic
oC
hile
Czec
h R
epub
lic1
Pola
ndA
rgen
tina
2,3
Hun
gary
2
Slov
ak R
epub
licEs
toni
aIn
done
sia3
Starting salary and minimum training
Salary at top of scale and maximum quali�cationsSalary after 15 years of experience, minimum training
Teachers’ salaries represent the largest single cost in formal education and vary widely across countries. The statutory salaries of lower secondary school teachers with 15 years of experience in public institutions, before taxes and converted into USD using purchasing power parity (PPP), range from less than USD 15 000 in Estonia, Hungary, Indonesia and the Slovak Republic, to at least four times this amount (USD 60 000) in Germany, Luxembourg, the Netherlands and Switzerland (Figure 1).
Teachers’ salaries vary significantly between countries and increase with the level of education they teach
education data education evidence education policy education analysis education statistics
Teachers’ salaries still remain below those of other tertiary graduates
Career pay progression varies significantly between countries
In most OECD countries, the higher the level of education, the higher teachers’ salaries. For example, in Belgium, Denmark, Finland, Hungary, Indonesia, Poland and Switzerland, the statutory salary of an upper secondary school teacher with 15 years of experience is at least 25% higher than that of a primary school teacher with the same experience. The only exception to this pattern is in Israel where teachers’ salaries are lower at the upper secondary level than at other levels. This is largely the result of the gradual implementation of the 2008 “New Horizon” reform in pre-primary, primary and lower secondary schools, which increased teachers’ salaries in exchange for more working hours.
Teachers’ salaries significantly increased in real terms between 2000 and 2011 in most OECD countries and a tertiary qualification is now the norm to become a teacher at any level of education. However, on average, primary teachers in OECD countries earn only 82% of the average salary of a tertiary-educated, 25-64 year-old full-time, full-year worker. Lower secondary teachers earn 85% of that benchmark and upper secondary teachers 89%, although at this highest level, teachers in 11 of the 31 countries where figures are available earn as much, or more, than that benchmark salary (Figure 2). Relative salaries for teachers are highest in Korea, Luxembourg and Spain, where they are at least 20% higher than those of similarly educated workers.
School systems differ not only in how much they pay teachers but in the structure of their pay scales. For instance, some countries, such as Australia, the Czech Republic, Germany, Italy, the Nordic countries and the Slovak Republic, concentrate salary increases early on in a teacher’s career. Others, like Austria, France, Ireland,
Israel, Korea, Luxembourg and Mexico, offer higher rewards to more experienced teachers, while in a third group of countries, teachers’ pay increases steadily throughout their career (Figure 1).
The number of years it takes for a teacher to advance along the salary scale also varies substantially across countries. Lower secondary teachers in Australia, Denmark, Estonia, New Zealand and Scotland can reach the top of the salary scale within six to nine years, for example. In contrast, in Austria, France, Hungary, Israel, Italy, Japan, Korea, Portugal and Spain, it would take such teachers at least 34 years of service to reach the top of the salary scale.
After 15 years of teaching, statutory salaries for primary, lower and upper secondary teachers will be on average 34%, 35% and 37% higher, respectively, than their starting salaries. The top of the salary scales are, on average, 59%, 61% and 62% higher than starting salaries, respectively.
Ratio
Spai
n
Kor
ea
Luxe
mbo
urg
Port
ugal
Belg
ium
(Fl.)
Finl
and
Den
mar
k
Ger
man
y
Belg
ium
(Fr.)
New
Zea
land
Cana
da
Isra
el
Engl
and
Aus
tral
ia
OEC
D a
vera
ge
Swed
en
Net
herl
ands
Irel
and
Fran
ce
Slov
enia
Scot
land
Chi
le
Pola
nd
Nor
way
Uni
ted
Stat
es
Hun
gary
Ital
y
Aus
tria
Esto
nia
Icel
and
Czec
h R
epub
lic
Slov
ak R
epub
lic
Source: OECD (2013), Education at a Glance 2013: OECD Indicators, Indicator D3 (www.oecd.org/edu/eag.htm).
Figure 2. Ratio of teachers’ salaries in upper secondary education to earnings for full-time, full-year workers with tertiary education aged 25-64
(2011 or latest available year)
1.5
1.0
0.5
0.0
education data education evidence education policy education analysis education statistics
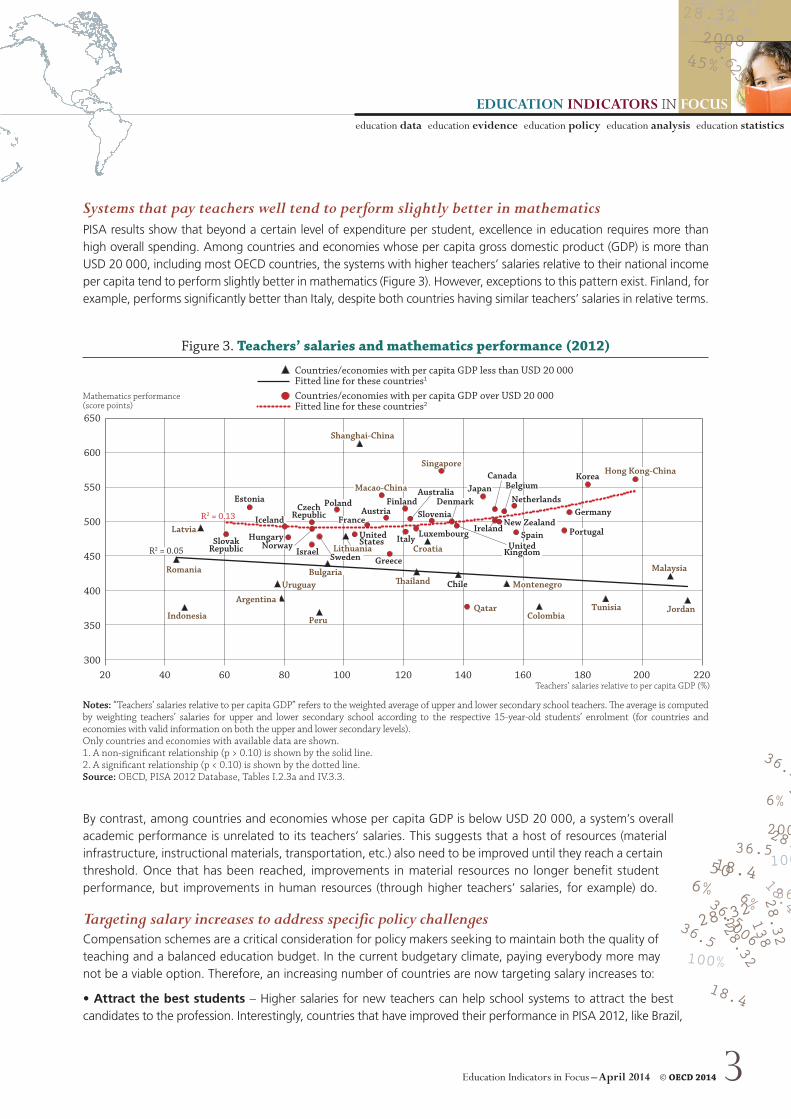
Systems that pay teachers well tend to perform slightly better in mathematicsPISA results show that beyond a certain level of expenditure per student, excellence in education requires more than high overall spending. Among countries and economies whose per capita gross domestic product (GDP) is more than USD 20 000, including most OECD countries, the systems with higher teachers’ salaries relative to their national income per capita tend to perform slightly better in mathematics (Figure 3). However, exceptions to this pattern exist. Finland, for example, performs significantly better than Italy, despite both countries having similar teachers’ salaries in relative terms.
650
600
550
500
450
400
350
300
Mathematics performance (score points)
Teachers’ salaries relative to per capita GDP (%)
Figure 3. Teachers’ salaries and mathematics performance (2012)
20 40 60 80 100 120 140 160 180 200 220
Notes: “Teachers’ salaries relative to per capita GDP” refers to the weighted average of upper and lower secondary school teachers. �e average is computed by weighting teachers’ salaries for upper and lower secondary school according to the respective 15-year-old students’ enrolment (for countries and economies with valid information on both the upper and lower secondary levels).Only countries and economies with available data are shown. 1. A non-significant relationship (p > 0.10) is shown by the solid line.2. A significant relationship (p < 0.10) is shown by the dotted line.Source: OECD, PISA 2012 Database, Tables I.2.3a and IV.3.3.
Countries/economies with per capita GDP less than USD 20 000 Fitted line for these countries1
Countries/economies with per capita GDP over USD 20 000Fitted line for these countries2
Luxembourg
NetherlandsAustria
France
Canada
Chile
United Kingdom
GreeceIsrael
PeruIndonesiaTunisia Jordan
Japan
Qatar
Uruguay
Argentina
Colombia
MalaysiaRomania
R2 = 0.05
R2 = 0.13
Hong Kong-China
Shanghai-China
Singapore
Estonia Finland
Korea
�ailand Montenegro
Sweden
Slovenia
Lithuania
Bulgaria
Norway
Macao-China
Slovak Republic Croatia
Czech Republic
PortugalSpainHungary
Australia
IcelandLatvia
Italy
New Zealand
Belgium
Germany
Ireland
DenmarkPoland
United States
By contrast, among countries and economies whose per capita GDP is below USD 20 000, a system’s overall academic performance is unrelated to its teachers’ salaries. This suggests that a host of resources (material infrastructure, instructional materials, transportation, etc.) also need to be improved until they reach a certain threshold. Once that has been reached, improvements in material resources no longer benefit student performance, but improvements in human resources (through higher teachers’ salaries, for example) do.
Targeting salary increases to address specific policy challenges Compensation schemes are a critical consideration for policy makers seeking to maintain both the quality of teaching and a balanced education budget. In the current budgetary climate, paying everybody more may not be a viable option. Therefore, an increasing number of countries are now targeting salary increases to:
• Attract the best students – Higher salaries for new teachers can help school systems to attract the best candidates to the profession. Interestingly, countries that have improved their performance in PISA 2012, like Brazil,
EducAtion indicAtors IN focuseducation data education evidence education policy education analysis education statistics
Colombia, Estonia, Israel, Japan and Poland, have all established strong policies to improve the quality of their teaching staff by raising the requirements to earn a teaching licence but also increasing salaries to make the profession more attractive to high-achieving students. Similarly, Singapore offers the top one-third of the secondary school graduating class a monthly stipend when they choose teacher education at university. The payment is comparable to the monthly starting salary for graduates in other fields, and in exchange they must commit to teaching for at least three years. The education authorities in England tackled a severe teacher shortage in 1997 by launching a powerful recruitment campaign and introducing grants (the “golden hello”) of up to GBP 4 000 for new teachers.
• Retain the best teachers – Attracting the best students into the profession is one challenge; retaining the most experienced ones is another. Teaching careers should benefit from both salary increases and a greater diversification of career structures. Such diversity can help meet school needs and also offer teachers more opportunities and recognition. In most countries, opportunities for promotion and new responsibilities are generally limited to teachers who want to stay in the classroom. Nevertheless, in some countries, such as Greece and Iceland, long service is rewarded by reduced teaching hours. In Portugal, teachers may receive a salary increase and a reduction in teaching time if they carry out special tasks or activities, such as educating student teachers and guidance counselling.
• Attract teachers to the schools with the most need – Teachers are increasingly awarded additional payments for taking on particular responsibilities or working conditions, such as teaching in more disadvantaged schools, particularly those located in very poor neighbourhoods. These schools often have difficulty attracting teachers and are more likely to have less-experienced teachers. For example, teachers’ salaries in Brazil increased by 13% on average this last decade, but by more than 60% in the poorer northeast region of the country, while in Estonia new teachers are offered an allowance of more than EUR 12 750 during the first three years of teaching to encourage them to teach in small towns and rural areas. These kinds of allowances are now provided in almost three-quarters of OECD countries.
Teachers’ salaries are only one part of the equation to improve teacher quality Paying teachers well is only part of the equation; school systems must also nurture and retain their best teachers by offering better work conditions than is currently the case. To this end, new teachers could be given structured induction programmes involving a reduced teaching load. Experienced teachers can be offered better career opportunities by developing in-service training.
The bottom line: Countries have to pay their teachers well if they are to achieve excellence, justifying recent trends for increased teacher salaries. Nevertheless, pay levels still remain below those of other tertiary graduates, especially in primary education, and the current financial crisis constrains additional increases, so policy makers are using targeted salary increases to address specific policy challenges.
This paper is published under the responsibility of the Secretary-General of the OECD. The opinions expressed and arguments employed herein do not necessarily reflect the official views of OECD member countries.
This document and any map included herein are without prejudice to the status of or sovereignty over any territory, to the delimitation of international frontiers and boundaries and to the name of any territory, city or area.
The statistical data for Israel are supplied by and under the responsibility of the relevant Israeli authorities. The use of such data by the OECD is without prejudice to the status of the Golan Heights, East Jerusalem and Israeli settlements in the West Bank under the terms of international law.
For more informationOECD (2013), PISA 2012 Results: What Makes Schools Successful (Volume IV): Resources, Policies and Practices, PISA, OECD Publishing, Paris.OECD (2013), Education at a Glance 2013: OECD Indicators, OECD Publishing, Paris.OECD (2011), Building a High-Quality Teaching Profession: Lessons from around the World, OECD Publishing, Paris.Contact Eric Charbonnier ([email protected])
Visitwww.oecd.org/edu/eag.htmPISA in FocusTeaching in Focus
Coming next monthHow much time do students spend in the classroom?