32
re :think edu Summer 2017 Education is moving online, triggering an explosion in data and questions on how to use it.
re:thinkedu
Summer 2017
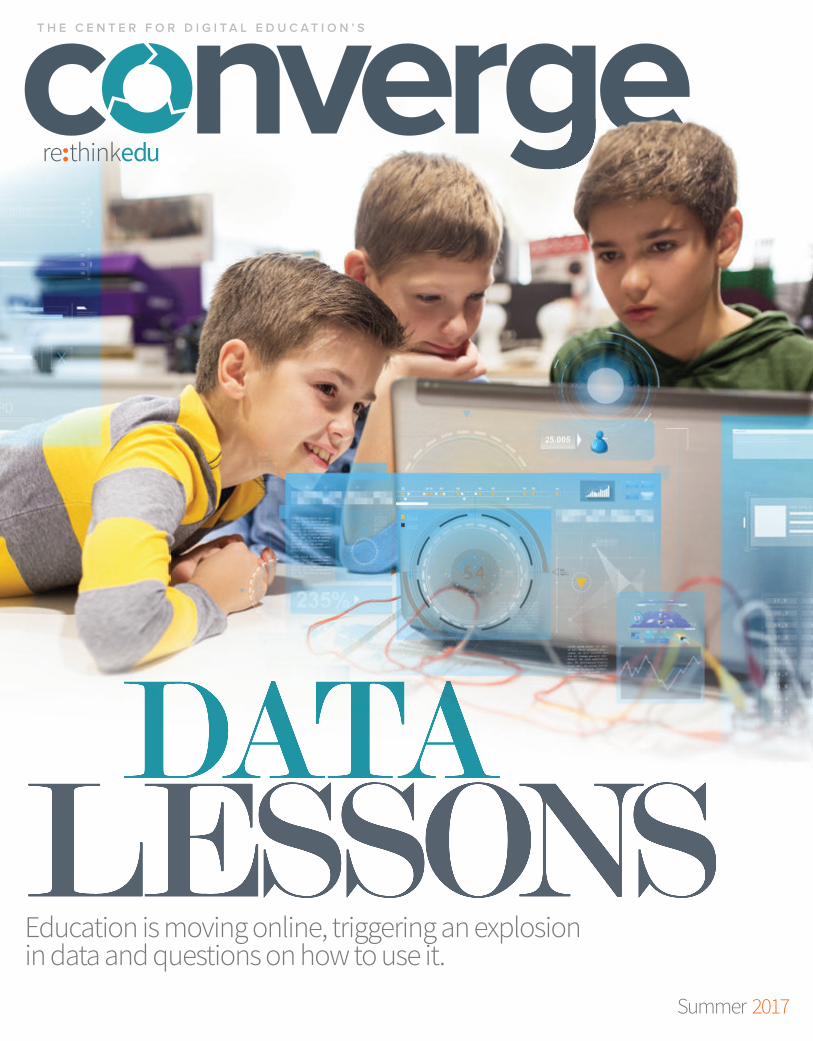
Education is moving online, triggering an explosion in data and questions on how to use it.
CON06_Cov.indd 6 6/14/17 10:04 AM

COVER IMAGE: SHUTTERSTOCK.COM
312
18
23
26
29
30 SHUTTERSTOCK.COMCHRISTOPHER BEAUCHAMP
CONTENTS
4Education’s New Data Experts The emerging role of the
data scientist could have
a big impact on education,
thanks to the data
explosion in public
schools and
universities.
INTRODUCTION
Data DrivenKecia Ray talks about why
it’s important to be intentional
with education data.
The Power of InformationHow higher education is using
analytics to improve student
outcomes.
By Jennifer Snelling
From the ShadowsStudents in foster care risk
dropping out and falling behind
when schools and child welfare
systems don’t share data. But
California and other states are
working to fix the problem.
By Tanya Roscorla
Setting a New PACEData is a key ingredient in New
Hampshire’s ground-breaking pilot
project that redefines how student
performance is measured.
By Julia McCandless
Diversity in the C-SuiteChanging careers isn’t easy,
but Melissa Woo shift ed from
biophysics to technology and has
become a trailblazing CIO.
By Julia McCandless
COLUMN
Denver’s Parent PortalSome lessons on helping parents
support students.
By Kipp Bentley
DATA
High MarksSchool districts reveal digital
priorities and practices for 2017
STAN KAADY
2 Converge » SUMMER 2017
Th
e C
en
ter
for
Dig
ita
l E
du
cati
on
’s C
on
verg
e (
US
PS
PI
#1
18
6)
is p
ub
lish
ed
qu
art
erl
y b
y e
.Re
pu
bli
c I
nc
, 1
00
Blu
e R
avi
ne
Rd
, F
ols
om
, C
A 9
56
30
. C
op
yrig
ht
20
16
by
e.R
ep
ub
lic
In
c.
All
rig
hts
re
serv
ed
. P
eri
od
ica
l p
ost
ag
e p
en
din
g a
t F
ols
om
, C
A a
nd
ad
dit
ion
al
off
ice
s.
PO
ST
MA
ST
ER
: S
en
d a
dd
ress
ch
an
ge
s to
: C
on
verg
e,
10
0 B
lue
Ra
vin
e R
d,
Fo
lso
m,
CA
95
63
0.
SU
BS
CR
IPT
ION
S:
Su
bsc
rip
tio
n i
nq
uir
ies
sho
uld
be
dir
ect
ed
to
Co
nve
rge
, A
ttn
: C
irc
ula
tio
n D
ire
cto
r, 1
00
Blu
e R
avi
ne
Rd
, F
ols
om
, C
A 9
56
30
, (9
16
) 9
32
-13
00
.
Summer 2017
CON06_02.indd 2 6/14/17 1:37 PM
100 Blue Ravine RoadFolsom, CA 95630916-932-1300www.erepublic.com
Page #
__________Designer __________Creative Dir.
__________Editorial __________Prepress
__________Other ____________OK to go
5 25 50 75 95 100 5 25 50 75 95 100 5 25 50 75 95 100 5 25 50 75 95 100
BLACKYELLOW
MAGENTACYAN
CMY grey T1 T2 T3
I N T R O
Everywhere we turn, we create and use data. It happens when we drive down the
highway, use our cellphones, make a purchase at a store or seek Wi-Fi hot spots.
The Internet of Things (IoT) has arrived, bringing us smart devices including cars,
thermostats and refrigerators that are constantly generating data from many
locations. Educational campus environments are no diff erent, collecting data to
improve products, services and learning.
In the last issue of Converge, we talked about data privacy and security on
campus, but in this issue, we dive a little deeper and consider how we engage with
data. In the past, we have used data in a more reflective and perhaps passive way.
Today, we are transitioning to a more intentional and proactive way of using data.
To do so, we must consider the data’s source. More importantly, we must consider
how this shift in mindsets changes the way we think about data because it is
everywhere, connecting to everything. From K-12 to higher education, leaders are
looking for ways to link student data and measure achievement and outcomes.
For this reason, we have focused on both the opportunities and challenges of data
use. Our stories will help readers understand what the experts say about these
important issues as they move forward in modernizing their own processes that
govern the use and collection of data.
One significant outcome of these eff orts has been an increased interest in
employing data scientists in K-12 and higher education. As the need for data
expertise grows, this emerging role will only expand. Meanwhile, higher education
is looking to use data more eff ectively to improve student outcomes because
some funding is now based on graduation results rather than enrollment. In
K-12 education, for example, the New Hampshire PACE Pilot program uses data
for accountability in new ways that are now allowed under the Every Student
Succeeds Act (ESSA).
Educators also need data to break down academic results into subgroups so
they can spot trends for students who might normally be overlooked, including
those in foster care. State education departments and child welfare agencies have
not traditionally shared data on these students in both directions. Under ESSA,
schools are required to report outcomes annually, which means solutions and
processes need to be put in place to not only comply with the law, but also help
these students succeed in practical ways.
Using data in new ways continues to change and move forward. Convergeis meant to serve as a resource to start conversations and share best practices,
which is how we all learn and transform education together. We hope this issue
sparks not only your interest but also great conversations as you develop and
refine your data strategies.
The Center for Digital Education is a national research and advisory institute specializing in K-12 and higher education technology trends, policy and funding. The center provides education and industry leaders with decision support and actionable insight to help eff ectively incorporate new technologies. www.centerdigitaled.com
Dr. Kecia Ray
Executive Director, Center for Digital Education
Publisher: Alan Cox [email protected]
Executive Director: Kecia Ray [email protected]
Deputy Executive Director: Danni [email protected]
Deputy Executive Director: Susan Gentz
Editorial
Editor: Tod Newcombe [email protected]
Managing Editor: Tanya [email protected]
Chief Copy Editor: Miriam Jones [email protected]
Copy Editor: Lauren Harrison [email protected]
Editorial Assistant: Janine [email protected]
Contributing Writers: Adam Stone, Jennifer Snelling, Julia McCandless, Kipp Bentley, Tanya Roscorla
Design
Chief Design Offi cer: Kelly Martinelli [email protected]
Graphic Designer Pubs: Kale Mendonca [email protected]
Sr. Designer Custom: Crystal Hopson [email protected]
Production Director: Stephan Widmaier [email protected]
Production Manager: [email protected]
Publishing
Sr. Dir. of Sales Operations:Andrea [email protected]
Business Development: Maggie Ransier [email protected]
Content Studio Managing Editor:Jeana [email protected]
Dir. of Web Marketing: Zach Presnall [email protected]
Web Advertising Mgr: Adam [email protected]
Subscription Coord.: Eenie Yang [email protected]
Corporate
CEO: Dennis McKenna [email protected]
President: Cathilea [email protected]
CAO: Lisa [email protected]
CFO: Paul Harney [email protected]
Executive VP: Alan [email protected]
Chief Content Offi cer: Paul [email protected]
Deputy Chief Content Offi cer: Steve Towns [email protected]
VP Research: Todd Sander [email protected]
centerdigitaled.com 3
CON06_03.indd 3 6/14/17 10:17 AM
100 Blue Ravine RoadFolsom, CA 95630916-932-1300www.erepublic.com
Page #
__________Designer __________Creative Dir.
__________Editorial __________Prepress
__________Other ____________OK to go
5 25 50 75 95 100 5 25 50 75 95 100 5 25 50 75 95 100 5 25 50 75 95 100
BLACKYELLOW
MAGENTACYAN
CMY grey T1 T2 T3

EXPEducation’s
NewDATAS
HU
TT
ER
ST
OC
K.C
OM
4 Converge » SUMMER 2017
CON06_Feature_DataScienceProduction.indd 4 5/30/17 4:16 PM
100 Blue Ravine RoadFolsom, CA 95630916-932-1300www.erepublic.com
Page #
__________Designer __________Creative Dir.
__________Editorial __________Prepress
__________Other ____________OK to go
5 25 50 75 95 100 5 25 50 75 95 100 5 25 50 75 95 100 5 25 50 75 95 100
BLACKYELLOW
MAGENTACYAN
CMY grey T1 T2 T3

The emerging role of the data scientist could have a big impact on education, thanks to the data explosion in public schools and universities.
PERTSTA
F or education to make good on the promise of a data-driven future, a new role needs to emerge
within the leadership ranks. While a few universities and a handful of school districts presently employ “data scientists” or other similarly titled professionals, this position — which is rapidly gaining ground in government and in diverse industry verticals — has yet to take deep root in education.
Depending on what level of education you investigate and who you talk to, the data scientist is either a boon to its future or a position without a purpose. But there’s no question that data, used the right way, is knowledge, and how it’s used in education could change its course for years to come. More signifi cantly, how the data is interpreted and analyzed makes it important to understand the role, current and future, of the data scientist.
In the K-12 world, data scientists may have to fi ght to prove their worth. While the business community has begun to invest in data as a driver of success, many educators feel lukewarm about it. They’ve been collecting data for years, and it’s mostly been used
centerdigitaled.com 5
By Adam Stone
CON06_Feature_DataScienceProduction.indd 5 5/30/17 4:16 PM
100 Blue Ravine RoadFolsom, CA 95630916-932-1300www.erepublic.com
Page #
__________Designer __________Creative Dir.
__________Editorial __________Prepress
__________Other ____________OK to go
5 25 50 75 95 100 5 25 50 75 95 100 5 25 50 75 95 100 5 25 50 75 95 100
BLACKYELLOW
MAGENTACYAN
CMY grey T1 T2 T3
to penalize them. “We have used it as a zinger, a way to shut down schools and fi re superintendents,” said Kecia Ray, director of the Center for Digital Education (the Center is part of e.Republic, Converge’s parent company).
These professionals will be highly educated. Eighty-eight percent of data scientists have at least a master’s degree, and 46 percent have Ph.D.s, according to recruiting fi rm Burtch Works. But it will take more than just a knowledge of how the numbers work to succeed in this fi eld, experts say.
Even those willing to admit the possible usefulness of data still come to the table with little understanding of its potential. “Because we have focused so much on collecting and reporting, we don’t have people well trained in the synthesizing, analyzing and interpreting roles,” Ray said.
So the K-12 data scientist will have to be an educator, someone who is willing and able to help teachers understand and engage in data in new, more meaningful ways. Data scientists also will have to be big thinkers, individuals capable of envisioning far-reaching uses for their eff orts.
“In K-12, our ideas have to scale to large numbers,” said Andrew Berning, a research scientist in K-12 Learning Analytics at the University of Texas at Arlington. “There are 5.5 million K-12 students in Texas, and some of our districts have 100,000 students. If the data scientists are going to be worth their salt, they are going to have to be able to scale their ideas across all the backgrounds and the levels of readiness that kids bring to school.”
Considering that potential large-scale impact, Berning believes most K-12 data scientists should be positioned fairly high in the administration. “They will always have to report to the instructional side of the house, but it should probably be a cabinet-level position reporting to the superintendent,” he said. “It should be on a par with the chief technology offi cer.”
From such a lofty perch, data scientists will need to deliver
more than just good ideas and interesting reports: They will need to deliver outcomes. Given the media hype around artifi cial intelligence, big data and all the related buzzwords, educators are going to expect data scientists to make a noticeable diff erence.
“They need to show good working models,” said Leo Brehm, CIO/CTO of the Public Schools of Northborough and Southborough in Massachusetts. “That means they need to show how data can take the logistical burden off teachers. Teachers want to reach their students, and if you can free up their time to explore and make connections, they will be on board with that.”
Experts in higher education echo this thirst for tangible results. They say data scientists will need to be skilled in presenting information in ways that educators can readily put to use. “It’s one thing to create data that sits in tables, and it’s something else to be able to visualize that information,” said Susan Metros, a former associate vice provost and former associate CIO for Technology Enhanced Learning at the University of Southern California. “If we are really going to be able to
understand data and compare it and adopt it into practice, people are going to have to be able to see it, to compare it, to interact with it in ways that are meaningful.”
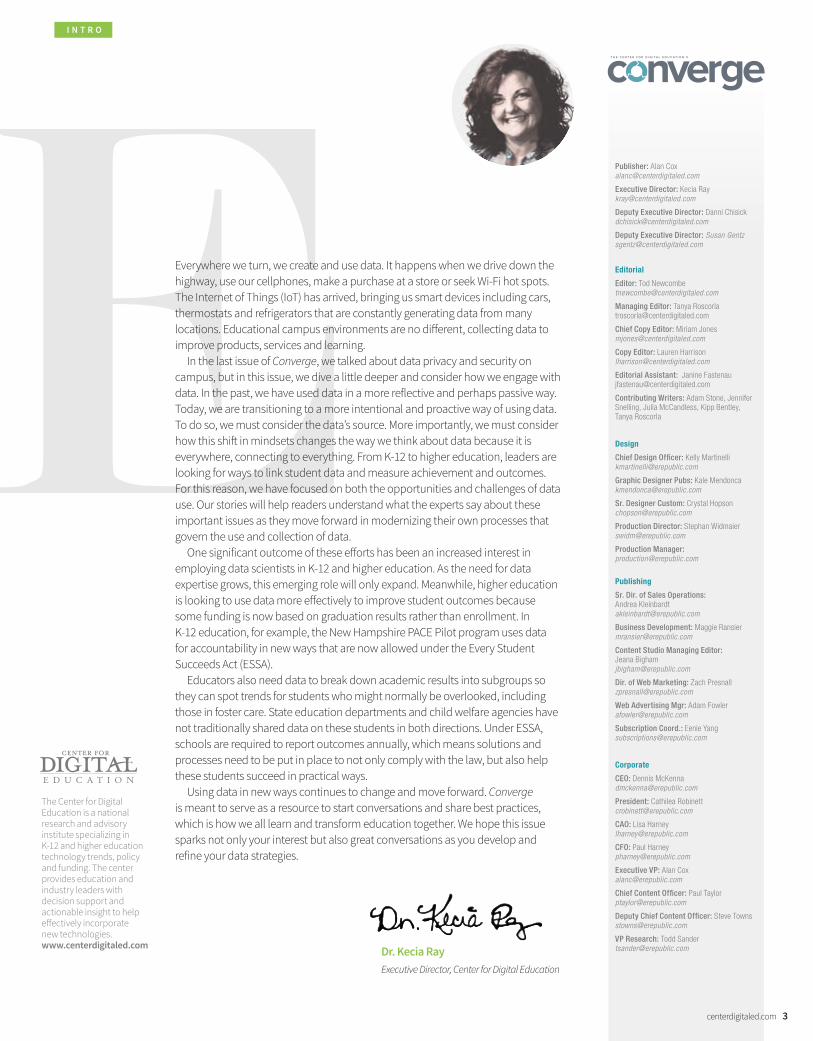
Data scientists will need to be discreet. They will need to be remarkably sensitive to the requirements for privacy and confi dentiality that surround their work. “There is a growing call for open access, but with education, just like with medical data, you can’t really have that,” said Alex J. Bowers, an associate professor of education leadership at Teachers College, Columbia University.
They’ll also be expected to respond to such calls for openness while at the same time keeping
individual student data locked up tight. Bowers suggested the way to strike the balance is to keep data private, but give open access to all the algorithms and analyses that school districts use. This invites the public to be a part of the process, while still respecting discretion.
Overcoming Skepticism
The role of the education data scientist becomes more apparent when you consider the fact that educators at all levels stand knee-deep in data. Colleges have enrollment information, fi nancial data and a range of personal metrics. In K-12, “you know where students live, their household fi nancial status, how many parents they have. Then you have all this academic data, qualitative and qualitative, about how they respond in math and history and science and reading,” said Ray.
Administrators at the New York Institute of Technology use data to make real-estate decisions. The Public Schools of Northborough and Southborough leans on data to maximize its technology investments, while Georgia public schools leverage data to give teachers a 360-degree view of students’ progress.
E D U C A T I O N ’ S N E W D A T A E X P E R T S
ALEX J. BOWERS Associate professor of education leadership at Teachers College, Columbia University
6 Converge » SUMMER 2017
CON06_Feature_DataScienceProduction.indd 6 5/30/17 4:16 PM
100 Blue Ravine RoadFolsom, CA 95630916-932-1300www.erepublic.com
Page #
__________Designer __________Creative Dir.
__________Editorial __________Prepress
__________Other ____________OK to go
5 25 50 75 95 100 5 25 50 75 95 100 5 25 50 75 95 100 5 25 50 75 95 100
BLACKYELLOW
MAGENTACYAN
CMY grey T1 T2 T3

But challenges are inherent in the emerging wave of data-driven education. Teachers may be wary after years of seeing student metrics wielded like a club and test scores used as a rationale for penalizing districts.
Some are skeptical of data scientists’ ability to peer deeply enough into the inner workings of education. “In an online course, I can tell you how many minutes someone spent on a page,” said Metros. “But they could have been checking Facebook or having three other conversations at the same time.”
In higher education, data scientists are tapping metrics to improve student outcomes, but the push goes far beyond that. Schools are using data to better manage their facilities, fi ne-tune online courses and allocate their course off erings.
At the New York Institute of Technology, Mark C. Hampton, vice president for planning, analytics and decision support, has tapped into analytics to fi nd more classroom space. With campuses on Long Island and Manhattan, where space is always at a premium, data can make a diff erence.
“It’s not like we can just pitch a tent. We need to have a very concrete plan, and absent this data, we haven’t been able to do that,” he said. A recent dive into the data showed that classes in the health professions are among the school’s strongest performers. “As a direct result of these analyses, the conversations have turned to be about getting them more space.”
Tristan Denley is using data to ensure students can maximize the number of courses they take. As vice chancellor for academic aff airs at the Tennessee Board of Regents, he is responsible for 46 schools, including six universities, 13 community colleges and 27 colleges of applied technology.
“To enable students to take a fuller schedule, you have to do more than just say, ‘Take a fuller schedule.’ If you want them to do that, and you want them to take the right classes, you need to crank the numbers,” he said.
Denley uses a mix of off -the-shelf software products to dig deep into
course utilization data, to see who is taking what courses and also to see where students get stuck. “We have to off er the courses students need in suffi cient capacity, at diff erent times, during the day and in the evening, online and on branch campuses. There is real hard science sitting behind those decisions,” he said.
Such analyses could cut right to the heart of the academic enterprise. “The challenge in higher ed is about capacity,” Ray said. “In order to keep all these people employed and all these buildings running, we have to fi ll a certain number of seats. So how do you recruit and retain students, with the right ratio of people paying cash and taking loans and taking grants, all while being fi nancially stable enough to attract the best faculty and build the best facilities?”
Data can help schools to meet that high mark. Some also see a role for data in improving student outcomes across both online and traditional higher education. “We are able to identify students within three key classes and know whether or not they are going to graduate,” said Todd Gary,
a visiting scholar in data science at WPC Healthcare, serving in the Offi ce of Research at Middle Tennessee State University. “We can do it in the fi rst semesters of freshman year. If you look at how they are doing in a writing class, a math class and the fi rst class in their major, that is all you need, and if you have that, then you can do the early intervention.”
Such predictive algorithms rely on the availability of rich sources of data. Universities already have metrics aplenty, and lately the rise of online learning has brought with it a signifi cant new data stream in support of educators’ eff orts. Who looked at what course materials, when and for how long? It’s all measurable, and such data is especially helpful given that teachers in an online setting often do not have as close a connection to their students as do their brick-and-mortar peers.
“When you teach an online course, you often don’t actually know the students personally. The interaction is very diff erent from an in-person class,” said Manfred Minimair, associate professor and program director for
E D U C A T I O N ’ S N E W D A T A E X P E R T S
ST
AN
KA
AD
Y
ROBERT SWIGGUMCIO of the Georgia Department of Education
centerdigitaled.com 7
CON06_Feature_DataScienceProduction.indd 7 6/1/17 10:33 AM
100 Blue Ravine RoadFolsom, CA 95630916-932-1300www.erepublic.com
Page #
__________Designer __________Creative Dir.
__________Editorial __________Prepress
__________Other ____________OK to go
5 25 50 75 95 100 5 25 50 75 95 100 5 25 50 75 95 100 5 25 50 75 95 100
BLACKYELLOW
MAGENTACYAN
CMY grey T1 T2 T3

data visualization and analysis at Seton Hall University. Online educators can close the gap by digging into the information they do have available. “You can actually track when do they open some document, how often do they see it, what time of day. You can learn more about their study habits because everything is being tracked.”
The New and Unexpected in K-12
In the K-12 world, data can challenge educators and administrators to view old problems in new ways. For example, conventional wisdom says the way to combat principal turnover is by paying principals more. The data say otherwise, according to Bowers. He ran a data analytics project to understand why principals leave their jobs and found that the ones who complain about being underpaid also are among the least eff ective leaders.
“At a policy level, this means that the idea of paying principals
E D U C A T I O N ’ S N E W D A T A E X P E R T S
The world of ed tech
is being dramatically
reshaped by the
application of data.
Take for instance
Brainly, whose online K-12
social learning platform
draws 80 million students
a month from 35 countries.
Students use the site
to exchange curated
questions and answers
about academic topics.
“We have about
30 million answered
questions and 8,000
new questions daily.
So we have a lot of data
to analyze in terms of
the content,” said Erik
Choi, Brainly’s principal
researcher. “We also let
our users ‘friend’ each
other, so we have a lot of
data on who is friending
whom. We also have more
than 1,000 moderators
curating our content,
so we have information
about why this answer
is bad, why this question
is bad.”
Site operators are
developing algorithms
to automatically detect
the quality of questions
and answers. They
integrate dozens of data
points in order to quickly
discard bad answers,
speedily approve winning
replies, and focus their
moderators’ energies
on the middle zone:
Questions and answers
that require a little bit
of attention. These
predictive models make
for dramatically improved
eff iciencies.
The site also uses data
to improve engagements.
By quantifying a student’s
answering activity, social
interactions and other
variables, it’s possible
to deliver more eff ective
information.
“We can message
them that they are at a six
out of 10 in terms of their
learning activities, and
tell them the steps they
can take to improve their
learning score,” he said.
“Proper interventions can
improve each individual’s
learning process, and data
can help to drive that.”
more might end up keeping people in those jobs who aren’t the best people for those jobs,” Bowers said.
That’s just one small example of the new and unexpected ways modern data analytics can change the K-12 picture. Others, meanwhile, are looking to data science to shape how school districts spend their precious IT dollars.
In the Public Schools of Northborough and Southborough, for example, Brehm recently started using the ed tech accountability platform CatchOn to track how apps were being used. While the district has a big inventory of apps that it pays for, it turned out the most-used app is a freebie from National Geographic.
“We had no fewer than 50 apps that we were paying for, but we had no idea what the usage was like,” he said. “If only 10 teachers are using an app, I can’t justify spending $25,000 a year on that. The new data enable me to ask the right questions: What is working?
What are people using or not using?”Student outcomes likewise can be
swayed by creative data initiatives. Robert Swiggum, CIO of the Georgia Department of Education, has been working along those lines. Specifi cally, his team has developed a streamlined way for educators to meld data from mid-year testing into the district’s longitudinal data system in order to combine long-term data on a student’s progress with snapshot status checks. “That has really helped teachers a lot. By combining the longitudinal data with the present-day data, they can generate more personalized learning,” he said.
The state system, which saw 66 million hits in 2016, also off ers a resource link with educational support materials. Teachers can use those materials based on the combined testing and longitudinal information in order to tailor instruction. “Now they have a 360-degree view of this student, and they have the materials they need to act on that,” Swiggum said.
To ensure teacher buy-in, the IT team worked hard to make the system user friendly. “The hardest part is just to get people to look at it. Teachers are so busy with so many diff erent things, they have a ton of work,” Swiggum said.
While teacher buy-in may be a hurdle in some districts, others wrangle with the technical aspects of data science. It can be a complex chore to integrate and perform analytics on multiple data points for thousands or tens of thousands of students. The task requires a robust architecture, said Greg Hughes, CIO of the Delaware Department of Education.
Hughes said he is fortunate in that his state supports a single information system for all 135,000 public school students. “That means we have a really nice pipeline to feed our data warehouse. We have a common interface with all the schools,” he said. “That makes it a little easier for us to pull data together.”
Availability of data is a key enabler, Hughes added. Of equal or even greater importance is the availability of a skilled data scientist.
DATA IN THE ED TECH ECOSYSTEM
8 Converge » SUMMER 2017
CON06_Feature_DataScienceProduction.indd 8 5/30/17 4:17 PM
100 Blue Ravine RoadFolsom, CA 95630916-932-1300www.erepublic.com
Page #
__________Designer __________Creative Dir.
__________Editorial __________Prepress
__________Other ____________OK to go
5 25 50 75 95 100 5 25 50 75 95 100 5 25 50 75 95 100 5 25 50 75 95 100
BLACKYELLOW
MAGENTACYAN
CMY grey T1 T2 T3
Cybersecurity inhabits a changing landscape. We help the public sector navigate this shifting terrain.
KPMGKPMGKPMGKPMGKPMGGKPMGKPMGPMMMMGKPMGMKPMGPMGMK MMMKPMGMKK MGKPMGKPM netnetetetetnetetnettttetnetneteeetettettettteetttttneeneteettneeenetetettworkworkworkworkworkworkworkworkrkworkworkkworkworkrkworrkrkrkkkkkrkworkrrr ofofofofofof foffofoofofooffoofoooof f oo indeindeindeindedeindeindendedeeindendndindendeindeindedeindeindndedendedeiiin pendpendpendpendpendddpendenddndpendpenddpendddpendpenpendpendpendpendddpendpendpependdpeenpendppendp nppppendnppeendpendenenddpppp entent ent ent ent nt nt ent nt ent ent tent ent eeeeent eent eeeeee membmembmembmembmmembmemmembmembmembmbmbmembbmbmembmembmembmembmembmemmemembemmmemememm er fer fer fer fer fer fr ffrer fffeer fer fr fffer ffereer ffeeee irmsrmsirmsirmsirmsrrmrmirmsmsmirmsmsrmsmsrmssirmsmsmmrmsmsssssssssssrmm affaffaffaffaffaffaffffffaffffaffaffaffaffaffaffaffffffaffaffafffffaffaffaffaffffffaffaffffafffafffffffafffffaffafffffffffffffaf iliaililialiaiailialialiaailiailiailialiiliiliailiailiailiailiailiaiilialiailiaiiliaiaiiliai iiailiaaaaaaaiiliaaaail aaai iaii il aliai tedted tedted t dted tededeedtedtedtedt ddttedtedtted tedtededtedtedtedtedtedtedtedtedddddededtedddddeeedddddddetedddddeeddddedddteddddeddetedded wwwwwithwithwithwithwitiwiwitwithwithwithwiwithwitwitwitwitwitwitwitiwiththwwwwiwwitwittthwwithw tthwitwithwiittttw thttttttthwwwwithww hwwwwwwwwww KKKPMKPMKPMPMKPMKPMMPMMPMPMKKKKKKPMMMMKKKKPMKPMKPMKPKKPMKPMPMMMPMMMPMMPMMKPMKPKPMKPKPMKPMPMKKPPKPK MPMPMGG InG InG InG IG InG IG InG IIG InG InG InGGGGGGG InG IGGGG InInGG InIGG InGG InG IG InGG Interterternternternterternternternternterternternteternterntternternererneeternrnternternerternererneeerernernerrrnteternternernrnrnrrnternernernereernrrnrneeeernteeernrerernter atatioatataatioioatioioatioatioatioatiooattiatioatioatioatioatioatiatitiitioatiotioatioatioa oatiooioatioatioatioatitiiatiooooatioatioooatiooatioatioatioooatioioioatioatiotat nal nalnanalalaanalnaalalnalanaalnalnaalanalnalnanalnanallnananananalnalnal nal nann lnnal nnnannnnnalannalaalnnnnaaaanal nannanaaaalnala CCoCCCoCCCoCoCCoopCoopCoCoopoopCoopCoopCoopooopCoopoopCCoopCoCoopCCCCoCoopCoopCoopCCoCCCoCoopCoCoopCoopCCCCCoopCCCCoopCCCCCoopopopCoopCCCoCoopCCoCoopCCCoooppCCCoopooppCCCooCCCCCCooCCC erateraeraeererateratratratatteraterateraratteeratratterataaaeraeratateraeratraterateraterateratraerateratraeratrerateraterateraterateeraterarrr veiveivevvvve iveive iveiveveive evevevveeveeive iveveive veveiveivevevvevveiveveveivevevevevveiveveeivevevevevveeiiivveveiiivevviveveveveiveiveeeivevvveeeive eiveiveve ivevevivivevveiveivvveiv(“KP(“KP“KP“K(“KP(“KPKPPPP(“KP(“KP(“(“KPK( KP( K(( P( KP( KP( KP( K( KP( KP( KP( KPKPK( KPMG IMG IMG IMG IMG IGMGMGMGGGMGMGMGGMG IGMG IMG IMGMG IMG IMMMGMMMG Intertternternterternternterterrternterrerrrrenterereertntenterntern erte natnatinatinatinanatiatinatinatnatianatinatitnnaanatitiatinatinatinatian onaonalonalonalonaonalonananaalononanalnalnanallonnn lonalonao a ”),”),””)”),”)”)”)””),”)”)”)”)”))),),),),), ),),)),,,), a Sa Swa a SwS Sw Sa Swa SwSwa Swa Swa Saa Swa Swa Swa Swa Swa Swa SwSwwa Swa Swa Swa Swa SwSwwSwaa Swa iissssss ssss iiissisissss isssssssssssssssss eenentientientientintintintientientintientintintintiieenntieenntnentntiintiiiiiinn tytyty. tytytty.ty. tyyty.tty.ttttyty. tytty.tyty.ty. tytty. ty.. SomeSomeSomSomeSomeSomeommSomeSomSomeSomeSomeSomeSomeSomSoSS meeSSSommeeeomo emSS e of of of ofoofofoffooffoof ooofoooffoo the the the the the the thethetheheeethethe thethe thhhhhhhtheeetthettttttt ett servservservservservservervservservservservserverserservsservervvssere vsserve icesicesicecescesicesicesicesiceicesicesicescecescescececescccesi scesescescescesessesesssc sesessesseseecesesesesceessssesesseeeeseseeeses oooooror oooooororor orr offeoffeoffeooofffffffffoffeoffeoffeoffeoffeoffeffffofffoffeoffeoffoffofffffffoffffffffffffeoffffffeoffoffeeffeoffoffeoffeoffffffoofffefffffffefef eooffffoofffo ringringiringrinnringrinringnginringringringringringringringningringingngnninrininringr nnngs prs prs prs prs ps ps ps prs ps prprs prs prs prs ps ps pss prprs prs ps prs prs prs prs pp pprs prs pppprs pprpprps pprprs prpppp ovidovidovidovidovidovidoviovidvidovidovidovidividvidididovidovidvididovidviddddididovidddviddddvidov dddidvidov ddddddoviovovovivvviddoovvovv doviovvovvvv ddovvvv dvviddo do dddddded bededed edded ed d bed bd bededed dded dededed ded beeeddd bedd bedd bd bed bbbed eeeed bd bbed bed bed ed eeded bed bed beeed dd bed bedeeed ee bbed bed bed beed bed bd bbbeed d bbee bed ed bbedd y KPy KPy KPy KPKPKPPy KPy KPy KPy KPy KPy KKKPy KPy KPy KPy KPKPyy Kyy KPKPy Ky Ky KPy KPy KPy Ky KPy KPy KKyy K KPKy KKKKPKPyyy Ky KP KPKPKPyy Kyy KKPKPyyyyyyy Ky Kyy KPKKPyyy KPKPyyyyyy MG LMGMG LMGMGMG LGMG LMG LLG LMG LMG LMG LMG LMG LMG LMG LMG LMG LMG LMGMG LMG LMG LMG LMG LM LMG LMG LMG LMG LGMGG LLLLG LMG LG LMG LG LGG LMG LLLLG LG LMG LLMGMG G LLLLLG L LMG LMGMGMG G LLLG LLMG LGGMG LLG LMGMGGGGMG LG LG LLLLMGMGGGGG LLLLLLLLLMG LMMG LGGGGG LLL LG LMG LGG LLLLLLLLLLLLLGG LLLPLPLPLPPLPPLPLP LLLPLP LLLPLPLLLLLPPLP LLPPLPPPLP LLLPLPPPPLP LLLPLPLLPPPPPPLLPLLPLPLPLPLPLPLPLLPLPPLPLPLLLP PLLPLPLPPPPLLPPPLLLLPLPPLLLLLLPLLareareareareareaareeearaaa earareareare areare rare areare rrrererareare notttnononottttnonotttnototttttnototottttnotnoottnotnotottoottnotnoottnotnot nnnotnottnonoonotoootnnooonooooo permpermpermpermermpermpermmpepermermpermermeee me mpermpermpermermpermppermperme mpermpermpermerermpeppp issiissiissiississiisissiissiisissississsissssssssissisississsiblbleebbbblbbbleble ble bleblebleblebbblebbbble bbblblebbbbleb ffforf rfforfffforfor rforfor for fofofor for foroorrfor fooorooo itsitsitsitsitstsitstsssstssts tstssss stts audaaudiaudaudiaudiauaudiaudiaudiaudaudiaaudiaudaudaudaudiaudaaudiaaaa t clt clt clt clt clcclclt clt clt ct ct clt llt cllt ct clt clclt ctttt c ientientieienteieientieientientientiententnnentientntieieienientientiientienteiententeeeieientienteeeennienteeeene s orss ors ors ors ors os orss orororooss oorors s s os os ors affaffaffffffaffffffffaffaaaffaaffaffaffafaffafafaffaffaff liiliaililialiaailialililiaiaiailiaiailiailiaililililiailiailiailiailiaiaaaaaaililialiiaaaaiaaal aaatetetestestesestes.tes.tes.steetestes.sttetessteseees.etestestestes.testestes.estes.teseses.testes.eetetestes.s.tetes.tetestes.es.es.tes.teeseses.tes.teses.eesses.stes.teteeesssesestttteteses.tttes.es.eseses NDPNDPNDPPNDPNDNDPNDPNNDPNDPDPNDPNDPDNDPNDPNDPNNNNDPNDPNDPNDNDPPNDPNNDPNDPNDPNDPDNDPNDPPPPPDNDPPPPNDPNDPDPNDPPPPPNDPNDPDPDNDDPNNDPDPNDNDDDDNDPNDPNNN PPPPPDDPPPSPS 6S 6PSPPS 6PS 6PS 6SSPS 6SS 6PS 6666PS 6PS 6PP 6666PPS 6PS 6PS 6PS 6PS PS 666PS 6PS 6PS 6PPS 6PS S 6S 6PS 6PPPPS 6PPSPS 6PPSPPS 6PS 6PS 6PS PS 6SPS PS 66S 6PS 6PSPSSS 6PS 66PS 6PSPS 6S PS 6PS 66PS 6S 66PPPS 6SS 666S 6PS 6PS 6S 666PS 66PS 6PS 6PS 666PS 6PS 6PS 666PS 666PSPPPPS 6666PSPPS 6PPS 6PPPS PS 6PPPSSS 66666711471147114471147114711411417114711471141171147114711471141 47114711471147771171147117114711711477711711711711711717117171717117114717111111414477711771171171147117117111117177771147171171117117117171711711477711111444711711411711111114711144447177777171 44411444771 44444444444444444444444444444444444444444444444444
Protecting data assets requires technology knowledge plus insight into the unique nature of federal organizations. KPMG combines both to help you stay ahead of cyber threats efficiently and effectively--no matter what’s around the bend.
Anticipate tomorrow. Deliver today.
100 Blue Ravine RoadFolsom, CA 95630916-932-1300www.erepublic.com
Page #
__________Designer __________Creative Dir.
__________Editorial __________Prepress
__________Other ____________OK to go
5 25 50 75 95 100 5 25 50 75 95 100 5 25 50 75 95 100 5 25 50 75 95 100
BLACKYELLOW
MAGENTACYAN
CMY grey T1 T2 T3
Cloud on Your Terms: Embracing Incremental OpportunitiesHow colleges and universities are modernizing traditional fi nance, human capital management and student systemswhile minimizing the heavy lift.
Higher education institutions strive to attract and educate the best and brightest minds. With that comes a responsibility to provide students and administration with the right tools to support learning in an evolving educational landscape.
Today, institutions face public pressure to innovate as key issues like aff ordability, value and accessibility continue to challenge the traditional university system. Enterprise cloud technology can help address these challenges. But even as private sector businesses migrate in droves to cloud-based solutions, many colleges and universities continue to operate traditional, on-premises ERP, fi nance, human capital management and student information systems.
CDE17 BRIEF Oracle 2.indd 2 6/1/17 10:56 AM
100 Blue Ravine RoadFolsom, CA 95630916-932-1300www.erepublic.com
Page #
__________Designer __________Creative Dir.
__________Editorial __________Prepress
__________Other ____________OK to go
5 25 50 75 95 100 5 25 50 75 95 100 5 25 50 75 95 100 5 25 50 75 95 100
BLACKYELLOW
MAGENTACYAN
CMY grey T1 T2 T3

BUILDING ON PEOPLESOFTPOPULARITY
Oracle’s higher education portfolio is popular due to its stability, dependability and functionality. Higher education lead-ers’ familiarity with Oracle’s PeopleSoft Campus Solutions, PeopleSoft Financials and PeopleSoft Human Capital Manage-ment (HCM) systems helps them quickly adjust to changing needs to support student success, while simple custom-ization allows these solutions to meet complex requirements unique to individ-ual institutions. As a result, many colleges and universities have embraced Oracle’s PeopleSoft solutions to help them man-age their complex business functions.
But long-term investments in customized on-premises solutions have made colleges and universities reluctant to evolve their technology. Those using PeopleSoft Financials and HCM systems often hesitate to make the investments required to swap out a stable, performing, back offi ce-oriented solution. Those utilizing Campus Solutions question why they should risk disruption in a mission-critical space when the current solution is reliable and generally customizable.
“For many colleges and universities, balancing the desire to move forward while juggling current challenges creates a unique barrier that prevents university administrations from evolving,” says Juan Carlos Gutierrez, managing director, PwC Cloud Transformation Services. “Higher education institutions are concerned about how to continue to innovate and grow while operating cur-rent business and navigating operational concerns; how to modernize their IT sys-tems leveraging the current skills they possess; and how they can continue to be centers for innovation without having the tools, data and experience to do so.”
The good news is that cloud tech-nology can help modernize and simplify technical architectures and drive solutions that move higher education forward. For higher education institutions to innovate, they need to focus more attention on core competencies and diff erentiation and less on operating technology. Cloud enables higher education IT teams to reduce costs, minimize risk and focus their attention on the institution’s central mission. Cloud can also help colleges and universities keep their technology current and reduce – or even eliminate – the cost of hardware refresh cycles.
Alternatively, not taking advantageof the cloud’s ability to transform and simplify technical infrastructures can make it much more challenging for higher education institutions to adapt to current and future needs.
TAKING A LESS DISRUPTIVEPATH TO THE CLOUD
Despite the many benefi ts, a large-scale shift to the cloud can seem daunting for higher education institutions. Large investments in skill, customized technology and complex architectures can also make a broad-based shift to cloud expensive and time consuming. More importantly, the shift would disrupt momentum from the organization’s broader business goals at a critical time in the industry.
Fortunately, colleges and univer-sities now have an alternative option that can help them to capture the benefi ts of a cloud-based solution while maintaining the benefi ts of their tried-and-true solution. Using Oracle’s PeopleSoft Cloud Manager, combined with expert guidance from PwC, colleges and universities that use PeopleSoft higher education solutions can move from on-premises systems to modern, cloud-based fi nance, HCM and student information systems incrementally, and in a lower-risk and less-disruptive manner.
Oracle’s PeopleSoft Cloud Manag-er enables colleges and universities to make an incremental move to the cloud without major service disruptions, so they can continue using the on-prem-ises applications they trust in a cloud environment. This allows institutions to modernize the IT environment while also reducing complex infrastructure and platform costs and maintaining the integrity of their Oracle higher education portfolio customizations and processes.
While the cost savings alone are a compelling reason to shift to a cloud infrastructure, the true value is in what comes next. Because PwC has vast experience working with clients to help them understand the value of cloud technologies, colleges and universities get a detailed, customized roadmap to guide them on their journey to a modern IT architecture. Once a cloud-based, modern architecture is in place, secu-rity, scalability and performance are no longer dependent on in-house resourc-es. And while reducing the workload may seem like a threat to the skills and investments of the IT organization, the reality is a simplifi ed operating model allows IT teams to drive innovation.
“It allows clients to replace monotonous workloads with mission-critical workloads, allows cost to be allocated to new technology rather than supporting old infrastructure and hardware, and drives the focus of big projects away from upgrades to fi nding new ways to support more modern IT capabilities,” says Gutierrez. “Ultimately, moving to the cloud allows the IT organization to become a more strategic part of the overall organization. As new ideas and new technologies emerge, the shift to migrate Oracle’s PeopleSoft higher education suite to the cloud will open the doors for those ideas to become reality.”
For more information about Oracle’s PeopleSoft Cloud Manager, visitwww.cloud.oracle.com.
ADVERTISEMENT
CDE17 BRIEF Oracle 2.indd 3 5/30/17 3:08 PM
100 Blue Ravine RoadFolsom, CA 95630916-932-1300www.erepublic.com
Page #
__________Designer __________Creative Dir.
__________Editorial __________Prepress
__________Other ____________OK to go
5 25 50 75 95 100 5 25 50 75 95 100 5 25 50 75 95 100 5 25 50 75 95 100
BLACKYELLOW
MAGENTACYAN
CMY grey T1 T2 T3
How higher education is using analytics to improve student outcomes. By Jennifer Snelling
INFORMAThe Power of
12 Converge » SUMMER 2017
I f students struggle with a certain subject in their freshman year, are they more likely to drop out? Which students are
more likely to seek out academic support, and do they graduate at higher rates than students who don’t? How much does it matter if students delay choosing a major?
Getting the answers to questions like these has never been easy, but the situation is beginning to change just at a time when student outcomes in higher education have never been more important. The reason for the change is the same one that explains which advertisements appear on an individual’s Facebook page or which movie recommendations Netfl ix has for you on a Friday night. Data, when collected and analyzed correctly, can uncover patterns of human behavior in new and revealing ways.
Consider the infl uence of big data in higher education. With the help of data analytics, state education agencies and higher education institutions are trying to increase college retention and graduation rates. According to a 2016 report by the U.S. Department
of Education, 60 percent of full-time students who enrolled at a four-year institution in 2008 took six years to graduate. The same study showed the average retention rate is around 80 percent, but less selective schools with open admissions policies retained 62 percent of their students between 2013 and 2014. Graduation and retention rates are key components to a school’s reputation.
A typical college graduate working full time earns 54 percent more than a worker who attended some college, but has no degree. When retention and graduation rates improve, both students and institutions benefi t. How can higher education keep students in school long enough to graduate? Turns out, analytics has some answers.
Predictive analytics uses massive amounts of historical data to identify patterns and forecast outcomes and trends. More importantly, the data indicates places where universities can use limited resources to make the greatest impact. When colleges understand that students earning a C in a freshman math class are far more likely to drop out of school than graduate, the schools can
CON06_Feature_HigherEducationData.indd 12 5/31/17 8:19 AM
100 Blue Ravine RoadFolsom, CA 95630916-932-1300www.erepublic.com
Page #
__________Designer __________Creative Dir.
__________Editorial __________Prepress
__________Other ____________OK to go
5 25 50 75 95 100 5 25 50 75 95 100 5 25 50 75 95 100 5 25 50 75 95 100
BLACKYELLOW
MAGENTACYAN
CMY grey T1 T2 T3

MATION FL
ICK
R.C
OM
/EM
ILY
centerdigitaled.com 13
CON06_Feature_HigherEducationData.indd 13 5/31/17 8:20 AM
100 Blue Ravine RoadFolsom, CA 95630916-932-1300www.erepublic.com
Page #
__________Designer __________Creative Dir.
__________Editorial __________Prepress
__________Other ____________OK to go
5 25 50 75 95 100 5 25 50 75 95 100 5 25 50 75 95 100 5 25 50 75 95 100
BLACKYELLOW
MAGENTACYAN
CMY grey T1 T2 T3

identify those students early and off er tutoring services before it is too late.
Longitudinal data, which tracks the same sample of students at diff erent points in time, helps advisers see a clearer picture of an individual student. Why is this student, who tested well in reading, struggling with a freshman literature class? Seeing that pattern can help advisers ask students the right questions and nudge them toward success.
The Southern states of Georgia, Tennessee and Kentucky fall in the bottom half of states when it comes to six-year graduation rates for fi rst-time, full-time students who enrolled in 2007, according to The Chronicle of Higher Education. Georgia has a 54 percent graduation rate, followed by Kentucky with 49 percent and Tennessee one percent lower. (Delaware took the top spot with nearly three-quarters of its students graduating in six years, while Washington, D.C., came in last at 16 percent.)
But Georgia, Tennessee and Kentucky have made signifi cant progress from where they were a decade ago, and they continue to move forward as they harness
big data to personalize the higher education experience for students, close achievement gaps and help more students graduate successfully.
“All three states have long been leaders in thinking about the role of data in education,” said Brennan McMahon Parton, the Data Quality Campaign’s associate director of state policy and advocacy. “Data is a really powerful tool to inform practice and target students’ specifi c needs. There’s so much interest in making sure kids get to college and stay on track to graduate, and that is one of data’s big promises.”
GEORGIAGeorgia State University in
Atlanta, ranked fourth in the nation in 2016 among the most innovative colleges and universities by U.S. News & World Report, raised its six-year graduation rate about 22 percentage points over a decade to 53 percent in 2013 with the help of a data analytics program and targeted advising.
Nearly seven years ago, the school looked at which students attended academic advising, said Timothy Renick, Georgia State vice president for
enrollment management and statistics. It was either the highly conscientious students or those required to go due to academic probation.
The school realized it was spending most of its advising resources on students whose academic success was not signifi cantly infl uenced by that advising. Renick knew that if they could determine which decisions and behaviors were risk factors for falling behind, they could fi nd students with those factors who would benefi t from early advising.
Using software developed by the Education Advisory Board, Georgia State identifi ed more than 800 risk factors that correlate to students dropping out early. These factors include registering for the wrong course or receiving a C in a major class. The school hired close to 50 advisers, and those advisers held more than 52,000 student meetings, which helped raise retention rates by four or fi ve percentage points, Renick said.
Georgia State has also raised its progression rate, meaning students are accumulating course work on schedule to graduate in four years. By graduating sooner, those students saved $15 million a year in tuition and fees in 2016.
“We are delivering personalized attention at scale,” Renick said. “We don’t just give generic advice, but personalized advice. It’s making a big diff erence in our success numbers.”
The initiative is especially helpful to fi rst-generation college students, who are more likely to be undecided about their major and have less help navigating the higher education experience. “Georgia State has closed all achievement gaps. We have black, Latino and low-income students graduating at the same rate,” Renick said. “That’s due to data.”
Despite successes such as Georgia State’s, the use of analytics is not without its critics. The Education Policy program at New America has released a paper, The Promise and Perils of Predictive Analytics in Higher Education by Manuela
T H E P O W E R O F I N F O R M A T I O N
WIK
IPE
DIA
14 Converge » SUMMER 2017
SH
UT
TE
RS
TO
CK
CO
M
Data analytics and targeted advising have helped
Georgia State University increase its graduation rates
by about 22 percent over a decade.
CON06_Feature_HigherEducationData.indd 14 5/31/17 8:23 AM
100 Blue Ravine RoadFolsom, CA 95630916-932-1300www.erepublic.com
Page #
__________Designer __________Creative Dir.
__________Editorial __________Prepress
__________Other ____________OK to go
5 25 50 75 95 100 5 25 50 75 95 100 5 25 50 75 95 100 5 25 50 75 95 100
BLACKYELLOW
MAGENTACYAN
CMY grey T1 T2 T3

Ekowo and Iris Palmer. The authors say predictive analytics can lead to discriminatory practices as well as privacy concerns over student data.
“For colleges that are just learning to use predictive analytics to make decisions, guarding against potential harms can be a struggle,” Ekowo pointed out in the paper’s introduction. “But the stakes are too high to postpone asking these hard questions.”
At Georgia State, Renick points out that a student’s race is not associated with an individual student’s data. Plus, advisers are trained to avoid presenting the predictive data as something that will happen. Data is only used as one tool to help advisers identify which students are at risk and what interventions statistically help.
“Regardless of the analytic, if you’re employing it in an education system, adults must be bound by a principle that they should only be used to support their learning, never to hurt them,” said the Data Quality Campaign’s Parton . “If you’re using an analytic to predict success, you need to be really transparent
about what’s in that analytic and make sure they understand that this is not a conclusion, it’s a way to predict success so we can support you the best way possible.”
TENNESSEE Middle Tennessee State University
(MTSU), about 40 miles southeast of Nashville, uses the same software system as Georgia State. In 2014, MTSU began using the statistics tool, which identifi es when a student is struggling in a class, for instance, and notifi es an adviser who can set up the student with tutoring. In its fi rst year, the data tool helped raise MTSU’s four-year graduation rate to 20 percent from 16 .
As they try to complete their degree, many MTSU students face a number of challenges, including falling behind academically because of their poor math and reading skills. They also struggle to fi t in classes around their full-time jobs, long commutes and family life. As with Georgia State, others are fi rst-generation college
students and simply don’t know how to manage college. The university hired 47 new advisers to help students cope with these challenges.
Mary Losey, a sophomore music major, was identifi ed as at-risk for losing her Tennessee HOPE scholarship during her fi rst semester. Academic adviser Brad Baumgardner asked her to come see him. Losey confi ded that her family was experiencing fi nancial hardship and had some expenses she could not cover.
“I showed up in tears. He helped me fi ll out the paperwork to give me a small cushion,” she said. “We related immediately and talked about clarinet geek stuff . He knows the ins and outs of the College of Liberal Arts completely.”
The paperwork resulted in a college microloan that alleviated some of Losey’s fi nancial burden, allowing her to focus on school. Now, Losey is working two jobs and excelling academically.
From a list of more than 200 students whom Baumgardner advises, the database at MTSU identifi es which ones are on scholarship and what their GPA is. Since a certain GPA is required to keep a scholarship, correlating these two pieces of information helps advisers know who needs a pep talk.
“Everybody is big on the analytics, and they are wonderful tools,” Baumgardner said. “But if you don’t have the people component, the data
centerdigitaled.com 15
“We are delivering personalized attention at scale. We don’t just give generic advice, but personalized advice. It’s making a big diff erence in our success numbers.”— Timothy Renick, Georgia State
SH
UT
TE
RS
TO
CK
.CO
M
CON06_Feature_HigherEducationData.indd 15 5/31/17 8:23 AM
100 Blue Ravine RoadFolsom, CA 95630916-932-1300www.erepublic.com
Page #
__________Designer __________Creative Dir.
__________Editorial __________Prepress
__________Other ____________OK to go
5 25 50 75 95 100 5 25 50 75 95 100 5 25 50 75 95 100 5 25 50 75 95 100
BLACKYELLOW
MAGENTACYAN
CMY grey T1 T2 T3
isn’t worth a darn. The analytics make my job easier, but we have to have the boots on the ground, people trained to make personal interventions for these kids.”
At MTSU, advising through predictive analytics is a culture. From the president all the way to the cafeteria workers, every staff member is concerned with tracking students. Advising and advanced registration are two factors shown to improve student success. Students receive regular advising reminders via email, complete with a scheduling link. At campus social events, staff reminds students to meet with their advisers. At the dining hall, they ask students if they’ve registered for the fall semester.
Analytics helps advisers identify individuals at risk, but it also helps identify trends that can be addressed at the institutional level. Data collected at the state level by the Tennessee Board of Regents showed that about one-third of Tennessee students who arrived on campus didn’t know what they wanted to study, and more than half of those students dropped out entirely before choosing anything, according to Tristan Denley, vice chancellor for academic aff airs at the Tennessee Board of Regents.
“Choosing to choose later is really an impediment to their success,” Denley said. “People are simply more committed to something when they feel the purpose of what they’re doing.”
Once the Tennessee Board of Regents identifi ed this trend, two of the system’s universities — University of Memphis and Austin Peay State University — changed their advising policies. For the last two years, incoming students have been required to meet with an adviser so they can choose a fi eld of focus or a meta major, such as social sciences, business, science or education.
To help students choose, these two Tennessee institutions use Degree Compass, a program Denley developed at Austin Peay State University that combines data on a student’s past grades with transcript
and enrollment information from thousands of other students. This program then uses a recommendation system analogous to those used by Amazon or Netfl ix to suggest courses or fi elds of study based on the data.
KENTUCKYLike Tennessee, Kentucky
uses analytics at the state level to infl uence policy and decision-making at higher education institutions. Kentucky’s Senate Bill 1 that passed in 2009 required the Kentucky Department of Education to create common standards of career and college readiness. The bill increased the need for a comprehensive data warehouse that measured student outcomes throughout their education and professional careers. Kentucky received a federal grant to establish a data warehouse and created the Kentucky Longitudinal Data System that’s housed at the Center for Education and Workforce Statistics (KCEWS).
Recently, KCEWS released the 2017 Postsecondary Feedback Report, which provides in-depth data about degrees and the subsequent employment and wages former students earn after they graduate. For example, 65 percent of education majors were still employed after seven years, and
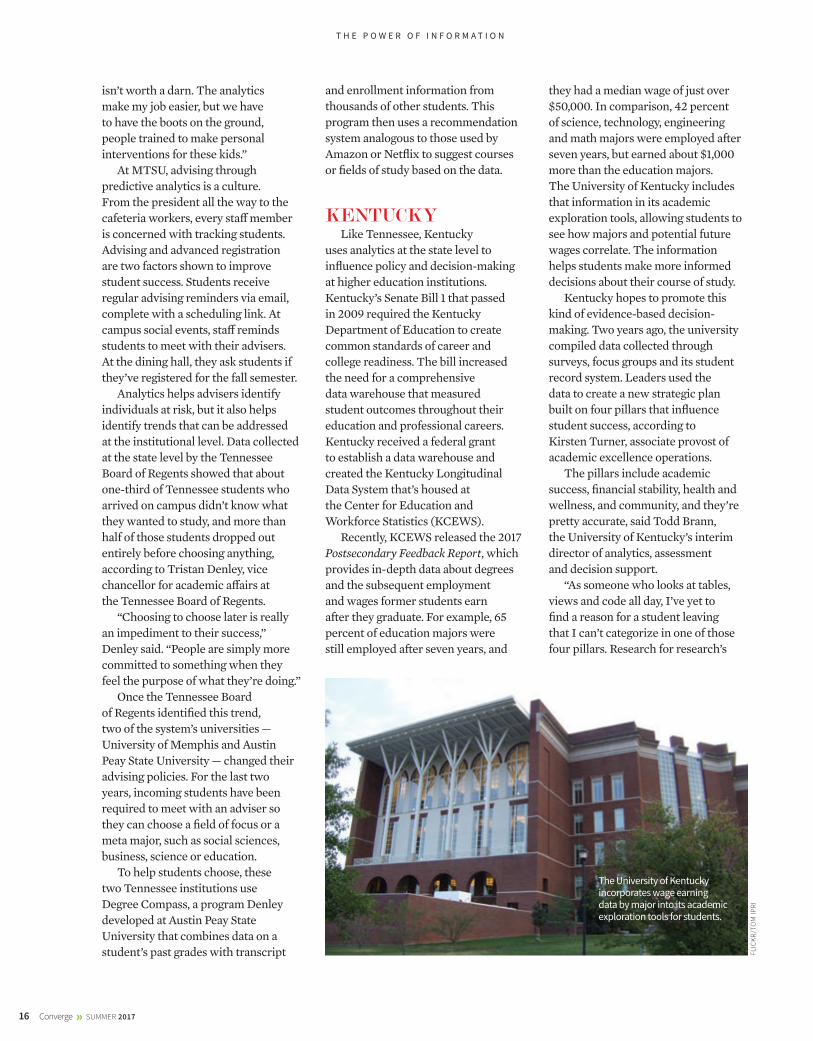
they had a median wage of just over $50,000. In comparison, 42 percent of science, technology, engineering and math majors were employed after seven years, but earned about $1,000 more than the education majors. The University of Kentucky includes that information in its academic exploration tools, allowing students to see how majors and potential future wages correlate. The information helps students make more informed decisions about their course of study.
Kentucky hopes to promote this kind of evidence-based decision-making. Two years ago, the university compiled data collected through surveys, focus groups and its student record system. Leaders used the data to create a new strategic plan built on four pillars that infl uence student success, according to Kirsten Turner, associate provost of academic excellence operations.
The pillars include academic success, fi nancial stability, health and wellness, and community, and they’re pretty accurate, said Todd Brann, the University of Kentucky’s interim director of analytics, assessment and decision support.
“As someone who looks at tables, views and code all day, I’ve yet to fi nd a reason for a student leaving that I can’t categorize in one of those four pillars. Research for research’s
T H E P O W E R O F I N F O R M A T I O N
FL
ICK
R/T
OM
IP
RI
The University of Kentucky
incorporates wage earning
data by major into its academic
exploration tools for students.
16 Converge » SUMMER 2017
CON06_Feature_HigherEducationData.indd 16 5/31/17 8:24 AM
100 Blue Ravine RoadFolsom, CA 95630916-932-1300www.erepublic.com
Page #
__________Designer __________Creative Dir.
__________Editorial __________Prepress
__________Other ____________OK to go
5 25 50 75 95 100 5 25 50 75 95 100 5 25 50 75 95 100 5 25 50 75 95 100
BLACKYELLOW
MAGENTACYAN
CMY grey T1 T2 T3
Converge » Q1 2016 17
sake is important, but I focus on actionable business intelligence and how we’re going to change university policies and procedures to support student success.”
Brann noticed that the retention of resident students falls by 40 percent with every $5,000 of unmet fi nancial need. The university is now in the midst of a multiyear eff ort to shift its scholarship awards from merit based to fi nancial need based.
Student privacy is a concern whenever states or institutions gather large amounts of data. KCEWS strips all information that could identify an individual student from the data, including the person’s name, date of birth, Social Security number and the institution they attend. The focus of the research is on the numbers, not the individual students, Brann said.
University of Kentucky staff members are asked to sign a statement
of responsibility that specifi es that they will only use the information to complete a specifi c job for the student. Across campus, the departments of decision support, advanced analytics and enrollment management collaborate to use data in ways that will positively impact student outcomes. While the data infrastructure is good, Brann’s offi ce constantly reviews data for cleanup and interpretation, as well as uses checks and balances to limit human error.
“We’re trying to create a culture of evidence and evidence-based practice,” Turner said. “How do we get the campus as a whole thinking in those terms? We want to usher in a universal culture of evidence.”
Information Is Power
Educational data is a valuable tool that can be used by policymakers and educators to evaluate success
over time. “We are excited to see other states prioritize this type of work,” said Kate Akers, executive director of the Kentucky Center for Education and Workforce Statistics. “In Kentucky, we collect and integrate data so that policymakers, the general public and institutions can make the best decisions possible.”
Armed with the knowledge of how to positively infl uence graduation rates, progression rates, course grades, fi elds of study and fi nancial aid awards, institutions are poised to better help students succeed.
“The benefi t and promise of education data writ large is that it’s a tool to inform conversations and actions that lead to student success,” said the Data Quality Campaign’s Parton . “A holistic picture allows adults to use information to tailor instruction to meet the needs of every student.”
T H E P O W E R O F I N F O R M A T I O N
Sign up today at www.centerdigitaled.com/newsletters
NewslettersKeep up to speed on the latest technology trends, policies and issues in K-20 education.
Converge
centerdigitaled.com 17
CON06_Feature_HigherEducationData.indd 17 6/14/17 10:12 AM
100 Blue Ravine RoadFolsom, CA 95630916-932-1300www.erepublic.com
Page #
__________Designer __________Creative Dir.
__________Editorial __________Prepress
__________Other ____________OK to go
5 25 50 75 95 100 5 25 50 75 95 100 5 25 50 75 95 100 5 25 50 75 95 100
BLACKYELLOW
MAGENTACYAN
CMY grey T1 T2 T3

18 Converge » SUMMER 2017
Students in foster care risk dropping out and falling behind when schools and child welfare systems don’t share data. But California and other states are working to fix the problem.By Tanya Roscorla
SHADOWSFrom the
SH
UT
TE
RS
TO
CK
.CO
M
CON06_18.indd 18 6/14/17 1:37 PM
100 Blue Ravine RoadFolsom, CA 95630916-932-1300www.erepublic.com
Page #
__________Designer __________Creative Dir.
__________Editorial __________Prepress
__________Other ____________OK to go
5 25 50 75 95 100 5 25 50 75 95 100 5 25 50 75 95 100 5 25 50 75 95 100
BLACKYELLOW
MAGENTACYAN
CMY grey T1 T2 T3

E very year, more than 400,000 neglected or abused children are taken away from family members
and placed with foster families in the United States. Nearly two-thirds of these children fall between ages 5 and 17, when they would likely be in elementary or secondary schools. Their teachers and other school staff often hear about what’s happening to the child and report it, along with other working professionals in legal and law enforcement fi elds, according to the Child Maltreatment 2015 report from the Children’s Bureau of the U.S. Department of Health and Human Services.
But while educators may have started out knowing what was happening with these children, they often lost touch with them when students were placed in foster care. In fact, schools haven’t always known when they have these children in their classrooms due to frequent school changes, privacy laws and lack of data sharing. Because they make up such a small percentage of the student population, their needs aren’t always on educators’ radar.
That’s a problem for schools because children in foster care tend to have lower graduation rates, higher dropout rates and slower grade progression than other students. This achievement gap was hidden for a long time at the state level because two major agencies didn’t share much information — with good reason. Child welfare agencies kept records on children who entered the foster care system, and education depart-ments tracked how these students did in school. They each had separate information systems and followed diff erent privacy and reporting laws.
“There was no structure, no bridge between two big statewide systems that were for totally diff erent purposes,” said Vanessa Ximenes Barrat, a senior researcher with the nonprofi t WestEd, which pushes for improvement in students’ education outcomes.
centerdigitaled.com 19
CON06_18.indd 19 6/14/17 1:38 PM
100 Blue Ravine RoadFolsom, CA 95630916-932-1300www.erepublic.com
Page #
__________Designer __________Creative Dir.
__________Editorial __________Prepress
__________Other ____________OK to go
5 25 50 75 95 100 5 25 50 75 95 100 5 25 50 75 95 100 5 25 50 75 95 100
BLACKYELLOW
MAGENTACYAN
CMY grey T1 T2 T3
California’s Experience Researchers recognized the chal-
lenges that students in foster care faced as they frequently moved between foster families, changed schools and dealt with the trauma they experi-enced. But they didn’t know how much this instability aff ected their education outcomes because children’s education and foster-care records were never matched and analyzed together.
That dilemma led legislators and advocates to create a policy framework designed to bridge the systems so they could work together for student success. While other states had addressed this issue earlier, Cali-fornia’s legislative work provided a model that federal policymakers and other states including Wash-ington and Arizona have followed.
Barrat, BethAnn Berliner and several other researchers from the Center for the Future of Teaching and Learning at WestEd asked California to build a bridge between its child welfare and education systems that would allow for the study of education outcomes of students in foster care during the 2009-2010 academic year. The California Department of Social Services agreed to send a data fi le to the California Education Department so that the child welfare and education records for each child could be matched. Whenever they had a match, researchers analyzed how that student did in school.
Researchers discovered that students in foster care had the lowest high school graduation rate, highest school dropout rate and lowest state testing partici-pation rate. They published their fi ndings in two 2013 and 2014 reports funded by the Stuart Foundation.
The California reports showed that out of more than 394,000 students enrolled in 12th grade, 84 percent graduated compared to 58 percent of more than 2,500 students in foster care. That’s a lower rate than other sub-groups that tend to struggle, including English language learners, students with disabilities and learners
from low socio-economic back-grounds. The students who did take standardized tests didn’t do as well as their peers. Just 29 percent were profi -cient on the California Standards Test for English language arts compared to 53 percent for students overall.
One-third of students in foster care also changed schools at least once in the school year — four times the rate of their peers. And about 15 percent of students in foster care attended the bottom tenth of schools.
Many people are respon-sible for children’s well-being and education when they’re in foster care, including the county, the care-giver, the case worker and the school. But they typically don’t know every-thing that’s going on with a child because they don’t have the data.
“It’s diffi cult to execute on your responsibility when you’re sort of operating in the dark,” said Paige Kowalski, executive vice president of the Data Quality Campaign, which worked with the Legal Center for Foster Care and Education on a road map for securely connecting foster care and K-12 records.
Legal Action Promotes Data Sharing
The results from the data analysis exposed a major problem. California policymakers addressed it imme-diately. In 2013, they changed the Local Control Funding Formula for schools through Assembly Bill 97, which required schools to report the education outcomes of students in foster care through the California Longitudinal Pupil Achievement Data System. Additionally, the legislation gave county education offi ces respon-sibility for verifying that the data for schools in their county was accurate.
The funding formula provided more money to school districts based on the percentage of students they served who were in foster care, who were learning English and who were from families with a low income. This additional money funded services for these students
including nutrition, transportation and academic support. In exchange, schools were held accountable for the academic results of these groups.
Under the new law, the California departments of social services and education needed to develop and agree to a memorandum of understanding. This memorandum would require social services to share data at least weekly with the education department so they could identify students in foster care. The state superintendent of public instruction would report education outcomes for these students to the Legislature and governor. And the education department also would send weekly data to schools and county offi ces of education so they would know which students in their service area were in foster care.
Similar data sharing agreements were already in place at the local level in a number of counties including Sacramento. But the state match made sure that schools in every county at least knew who their foster kids were.
“The memorandum of under-standing that allowed the California Department of Social Services and the California Education Department to even do the match was huge,” said Trish Kennedy, director of Foster Youth Services at the Sacramento County Offi ce of Education. “As soon as schools and county offi ces of education began getting the data match of their foster youth, it kind of set a new level, a new bar on data sharing.”
Two years later, the California Legislature passed Assembly Bill 854, which allowed county offi ces of education to apply for grant funding so they could serve as coordinators of foster services. A foster care coor-dinator in each county offi ce would work with local schools, county child welfare agencies and county probation departments to appropriately place children in schools with the goal of minimizing school changes. The legislation also authorized schools to provide transportation for students when it was in their best interest to stay in their original school, even
20 Converge » SUMMER 2017
F R O M T H E S H A D O W S
CON06_18.indd 20 6/14/17 1:38 PM
100 Blue Ravine RoadFolsom, CA 95630916-932-1300www.erepublic.com
Page #
__________Designer __________Creative Dir.
__________Editorial __________Prepress
__________Other ____________OK to go
5 25 50 75 95 100 5 25 50 75 95 100 5 25 50 75 95 100 5 25 50 75 95 100
BLACKYELLOW
MAGENTACYAN
CMY grey T1 T2 T3

though they might be placed in a home outside of the district.
A number of organizations including the nonprofi t National Center for Youth Law success-fully pushed for foster care reform in California. Then they worked nationally to transfer some of those same foster care student provisions to the federal Every Student Succeeds Act (ESSA) that passed in 2015.
“California was a leader, really, in setting up the formula that identifi ed students in foster care,” Barrat said.
When ESSA became law, every state had to start fi guring out how to share data both ways between child welfare and education agencies. Previously federal law called for child welfare agencies to send data to their counter-parts in education, but the education agencies didn’t have to share data back.
State education agencies now have to share data with their counterparts in child welfare, keep students in their original school when it’s in the children’s best interest and report
on education outcomes for these students. Schools also have to work with local child welfare agencies to enroll new students, transfer their records immediately and provide transportation from their new foster care home to their original school. That meant that both sides needed to appoint foster-care liaisons at the local, regional and state level.
More Work and Time NeededCollaboration helps ensure that
foster youth are placed in appropriate courses and programs that meet their needs, receive credit when they change placements or schools and keep on track in school with the help of outside resources. Social workers also get more accurate information faster that they can provide to a school when students transfer, according to Cynthia Vanzant, program planner for Child Protective Services in the Sacra-mento County Department of Health and Human Services. The county also has created a database so that social
workers can use ZIP codes to place children in homes closer to their school that meet the children’s needs.
California has made quite a bit of progress over the last few years to share data, make sure it’s accurate and act on it. Other states are also moving in the same direction. But they still have more work to do, said Michelle Francois Traiman, senior director of the FosterEd initiative at the National Center for Youth Law. Regional pockets of excellence exist where agencies are identifying students’ needs with the help of data sharing. That said, they’re not prolifi c enough. This work is hard, expensive, and takes persistence and strong leaders at each level.
“We’re another decade out really from seeing the kind of use of data that truly makes it down to every single use,” Traiman said. “Imple-mentation doesn’t work unless every young person experiences the benefi t of the intended policy or the intended vision of the state partners.”
centerdigitaled.com 21
F R O M T H E S H A D O W S
SH
UT
TE
RS
TO
CK
Education and child welfare leaders are figuring out how to work together to help students in foster care succeed.
CON06_18.indd 21 6/14/17 2:03 PM
100 Blue Ravine RoadFolsom, CA 95630916-932-1300www.erepublic.com
Page #
__________Designer __________Creative Dir.
__________Editorial __________Prepress
__________Other ____________OK to go
5 25 50 75 95 100 5 25 50 75 95 100 5 25 50 75 95 100 5 25 50 75 95 100
BLACKYELLOW
MAGENTACYAN
CMY grey T1 T2 T3

archivesocial.com
YOU’RE REQUIRED TO KEEP RECORDS FOR UP TO 10 YEARS.
BUT DON’T WORRY. WE GOT YOUR BACK.
IF YOUR CITY USES THESE
100 Blue Ravine RoadFolsom, CA 95630916-932-1300www.erepublic.com
Page #
__________Designer __________Creative Dir.
__________Editorial __________Prepress
__________Other ____________OK to go
5 25 50 75 95 100 5 25 50 75 95 100 5 25 50 75 95 100 5 25 50 75 95 100
BLACKYELLOW
MAGENTACYAN
CMY grey T1 T2 T3
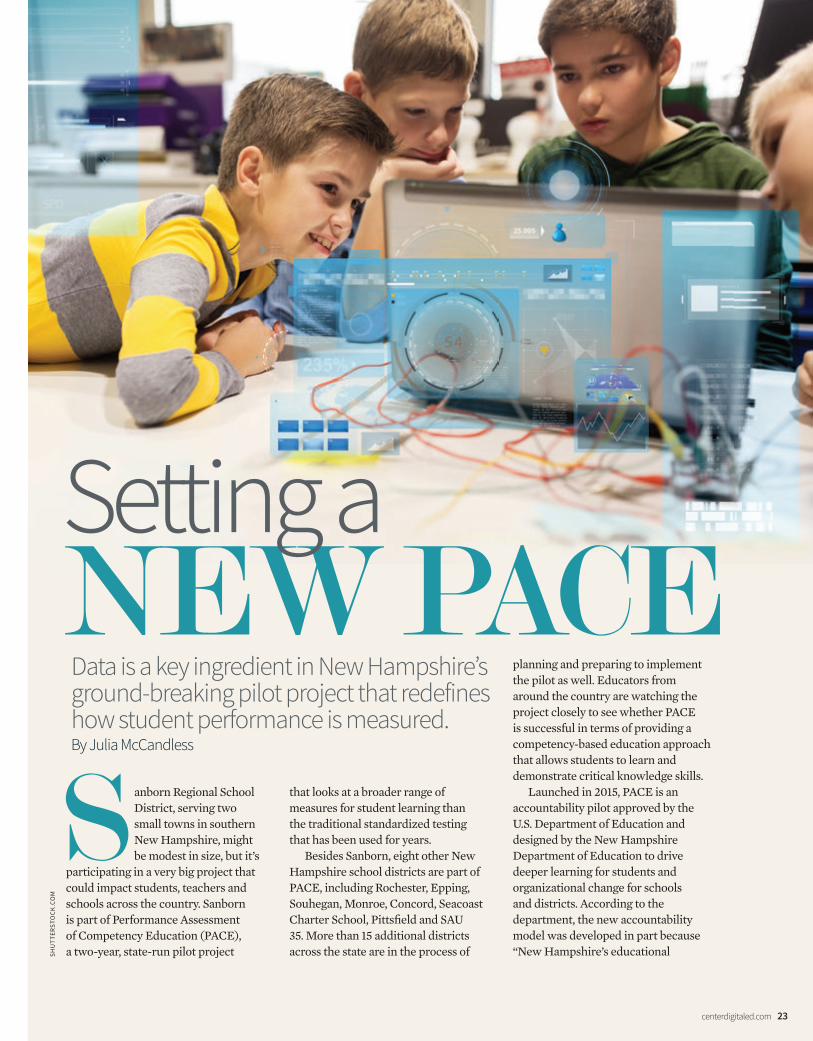
Sanborn Regional School District, serving two small towns in southern New Hampshire, might be modest in size, but it’s
participating in a very big project that could impact students, teachers and schools across the country. Sanborn is part of Performance Assessment of Competency Education (PACE), a two-year, state-run pilot project
that looks at a broader range of measures for student learning than the traditional standardized testing that has been used for years.
Besides Sanborn, eight other New Hampshire school districts are part of PACE, including Rochester, Epping, Souhegan, Monroe, Concord, Seacoast Charter School, Pittsfi eld and SAU 35. More than 15 additional districts across the state are in the process of
planning and preparing to implement the pilot as well. Educators from around the country are watching the project closely to see whether PACE is successful in terms of providing a competency-based education approach that allows students to learn and demonstrate critical knowledge skills.
Launched in 2015, PACE is an accountability pilot approved by the U.S. Department of Education and designed by the New Hampshire Department of Education to drive deeper learning for students and organizational change for schools and districts. According to the department, the new accountability model was developed in part because “New Hampshire’s educational
Data is a key ingredient in New Hampshire’s ground-breaking pilot project that redefines how student performance is measured. By Julia McCandless
NEW PACESetting a
SH
UT
TE
RS
TO
CK
.CO
M
centerdigitaled.com 23
CON06_23.indd 23 5/31/17 8:48 AM
100 Blue Ravine RoadFolsom, CA 95630916-932-1300www.erepublic.com
Page #
__________Designer __________Creative Dir.
__________Editorial __________Prepress
__________Other ____________OK to go
5 25 50 75 95 100 5 25 50 75 95 100 5 25 50 75 95 100 5 25 50 75 95 100
BLACKYELLOW
MAGENTACYAN
CMY grey T1 T2 T3
S E T T I N G A N E W P A C E
districts and adjust performance standards, if necessary (i.e., if there is evidence that a teacher is more lenient or stringent than others). As a way to collect comparative data, students in grades three, four and eight still take tests from the Smarter Balanced Assessment Consortium that 15 states support, and 11th-graders take the SAT.
To further enhance consistency within schools and across districts during evaluations, participating school districts must meet certain criteria. As noted in a recent progress report to the United States Department of Education, the New Hampshire Department of Education set a target for evaluator consistency of 60 percent for each part of multidimensional tasks. The target is based on information from the National Assessment of Educational Progress (NAEP), a federal program designed to measure what students know and can do in various subjects. Furthermore, the state established a target of 54 percent for cross-district evaluation comparability.
Student performance assessment data is accessible by the state, school districts and Center for Assessment. Parents also receive reports on their students’ performance in math, science or language arts, much like they would for a traditional standardized test.
While the use of PerformancePLUS
and technical standards for their eff orts with the help of the Center for Assessment, a nonprofi t organization that off ers consulting services related to assessment and accountability. With headquarters in New Hampshire, the organization was established in 1998 and has a long history of working with states and school districts to address changes in accountability and assessment in the United States. As part of that collaboration, the center develops metrics to ensure that all assessments align with agreed-upon performance standards.
During the actual evaluation process, teachers come together as a group to discuss, evaluate and grade student work via a rubric system. All work is cross-evaluated to ensure fairness and consistency. To protect student privacy, all names and identifying information are removed from student work prior to evaluations and are replaced with an ID number that the New Hampshire Department of Education correlates to names later on.
Those scores are uploaded to PerformancePLUS, a suite of modules that assist New Hampshire school districts in managing and organizing student data, creating local assessments, and mapping curriculum. The Center for Assessment can access the scores to look for variances across
leaders recognize that the level of improvement required cannot occur with the same type of externally oriented accountability model that has been employed for the past 12 years.”
Instead of traditional multiple-choice testing, teachers evaluate students based on performance assessments that are relevant to current learning and can demonstrate competency levels. There are currently 17 core performance assessments that all participating PACE school districts have created and use to measure students.
What does a performance assessment look like for students? It can take many forms, including quizzes, writing assignments, projects or presentations. For example, students in Sanborn were asked to create a solar cooker as part of a project demonstrating key science concepts that they were learning at the time.
Many in the education sector are watching PACE closely to see if it has the potential to be implemented throughout New Hampshire and possibly other states across the nation. In fact, the Every Student Succeeds Act (ESSA) now includes the “Assessment and Accountability Demonstration Authority,” which allows states to pilot innovative ways to assess students. Before any offi cial rollouts of the PACE model can happen, however, the pilot must prove that locally developed performance assessments can be used to compare districts.
While teachers assess students in the PACE model, they have to follow established
processes to ensure quality and fairness. From the beginning, teachers across the PACE districts work with a coordinator of curriculum, instruction and assessment along with 30 teacher content leads who are trained to develop complex performance tasks to ensure that the assessments align with PACE standards and guidelines.
The New Hampshire districts have also been establishing quality
Instead of just taking a test, students in Sanborn Regional School
District built a solar cooker based on the science principles they learned.
24 Converge » SUMMER 2017
CON06_23.indd 24 5/31/17 9:16 AM
100 Blue Ravine RoadFolsom, CA 95630916-932-1300www.erepublic.com
Page #
__________Designer __________Creative Dir.
__________Editorial __________Prepress
__________Other ____________OK to go
5 25 50 75 95 100 5 25 50 75 95 100 5 25 50 75 95 100 5 25 50 75 95 100
BLACKYELLOW
MAGENTACYAN
CMY grey T1 T2 T3
S E T T I N G A N E W P A C E
coming to the conclusion that the kinds of assessments that students are taking matter,” she said. “If it doesn’t promote learning, you need to ask the question about why you’re trying to give that assessment. Figure out where students’ strengths are. The closer you can get to assessments supporting student learning, the more often these assessments look like projects or students playing a musical score.”
Harris also points to the limited information that standardized testing reveals. “Standardized testing provides some data that is useful trend data, but it doesn’t provide information that can be used in individual schools or classrooms about how to help individual students succeed.”
While the future of assessments across the nation is still uncertain, Paul Leather, deputy commissioner for the New Hampshire Department of Education, notes that the PACE model is swiftly being implemented across the state. “We are rolling the process out as we speak through a multitiered system, by which districts must prove that they are ready to implement the system, as they have the appropriate leadership, training, resources for implementation, and agree to participate in the group activities that drive PACE,” he explained in an email. “Typically, they go through a couple years of preparation work in several tiers of support before implementing.”
Leather notes that while there are still areas to improve, the PACE pilot has strongly proven to stand up as an accountability system so far. “We need to do more to shore up college and career-ready math performance in our high schools — this is a No. 1 priority. We believe that this system provides much in terms of supporting schools and educators, in terms of understanding rigorous expectations for students in new ways, and in investment in their students’ success.”
Smarter Balanced and a 48 percent profi ciency rating for the PACE group mean. Those scores shot up in 2016 to 62 percent for Smarter Balanced and 53 percent for the PACE group mean. Similar fi ndings were true for 2016 eighth-grade math results.
While these results are encouraging, researchers at the Center for Assessment are clear that further data is needed to determine true, sustainable impact.
Brian Blake, superintendent at
Sanborn Regional School District, notes that the scores point more to the rigor of the assessments than students’ abilities. “This is a lot harder than memorizing facts,” he said. “I think that if you ask our teachers, or our parents, they would tell you that students are learning at a deeper level than they were before.” He also pointed out that performance assessments have opened the door for some students to improve their evaluation scores by being able to demonstrate what they know, rather than relying on being a good test-taker.
That demonstration and retention of knowledge is precisely why organizations like the National Education Association strongly support the PACE model as a modern approach to assessments. Donna Harris-Aikens, the association’s director of education policy and practice, foresees this as the future of student assessments. “People are rapidly
has been an adequate tool for the pilot, it’s also revealed a need for a more comprehensive technology solution, according to Scott Marion, executive director of the Center for Assessment. Currently, many applications do just parts of what they need done. For example, LibGuides allows them to store and securely share implementation documents, including a task administration guide, monthly meeting minutes, data collection protocols and resources. It also serves as a repository for operational tasks to support assessment needs in PACE districts. But during task development, teachers use Google Docs to collaborate.
“That is one of the major challenges: to fi nd a solution that does it all,” said Marion. “To make it even more complicated, one that integrates with a variety of home systems in diff erent districts [such as a student management system or learning management system] . That’s been a real challenge for us.”
Since a solution has not been found that meets all of the needs in terms of task development, data collection, performance task scoring and calibration, the state is aware that it may need to build its own system and is considering partnering with a technology company to design a customized solution.
Looking at the data results from the fi rst two years of the pilot, it appears that PACE scores are
comparable to Smarter Balanced scores. While additional analysis will give deeper insights, the scores validate the personalized, competency-based approach as a measure of student performance within schools and on a statewide basis.
In fact, the most recent results show a signifi cant uptick in student scores after PACE implementation. For example, eighth-grade English language arts results from 2015 show a 58 percent profi ciency rating for
“This is a lot harder than memorizing
facts.” — Brian Blake, Sanborn
Regional School District
centerdigitaled.com 25
CON06_23.indd 25 5/31/17 8:48 AM
100 Blue Ravine RoadFolsom, CA 95630916-932-1300www.erepublic.com
Page #
__________Designer __________Creative Dir.
__________Editorial __________Prepress
__________Other ____________OK to go
5 25 50 75 95 100 5 25 50 75 95 100 5 25 50 75 95 100 5 25 50 75 95 100
BLACKYELLOW
MAGENTACYAN
CMY grey T1 T2 T3

26 Converge » SUMMER 2017
You might say that romance led Melissa Woo to the IT world. After completing her
doctorate degree in biophysics at the University of Illinois, she took a job as a health physicist on campus as a way to stay close to her fi rst husband. Her responsibilities included computer-related duties, such as managing websites and international email lists. While this work was outside of the scope of her background, Woo discovered an affi nity for and deep meaning in the world of IT. “I realized that it was breaking down communication barriers between people,” she said. “I saw it as a means of connecting people.” From there, Woo was hooked and made the decision to start a new career in IT, working her way up from an entry-level position.
Since then, Woo has blazed a trail as an IT leader in higher education. She has worked in key IT roles at the University of Oregon, University of Wisconsin-Milwaukee and University of Illinois at Urbana-Champaign. Today, she serves as senior vice president for information technology and chief information offi cer at Stony Brook University in New York.
Woo knows fi rst-hand the challenges of being a minority in her fi eld as both an Asian and a woman, and has worked passionately to advocate for diversity and inclusion in the IT sector. Women and minorities including Asian-Americans tend to make up a smaller percentage of the IT workforce. In fact, according to an Equal Employment Opportunity Commission report, Asian-Americans make up 19.5 percent of the 2.3 million professionals in the tech sector who were represented in the report. Out of an approximate 5 million sample size, women hold 20 percent of tech executive positions nationwide.
Keith “Mac” McIntosh, vice president and CIO at the University of Richmond, has collaborated with Woo on many publications, panel
CON06_26.indd 26 6/13/17 9:16 AM
100 Blue Ravine RoadFolsom, CA 95630916-932-1300www.erepublic.com
Page #
__________Designer __________Creative Dir.
__________Editorial __________Prepress
__________Other ____________OK to go
5 25 50 75 95 100 5 25 50 75 95 100 5 25 50 75 95 100 5 25 50 75 95 100
BLACKYELLOW
MAGENTACYAN
CMY grey T1 T2 T3

Changing careers isn’t easy, but Melissa Woo shift ed from biophysics to technology and has become a trailblazing CIO. By Julia McCandless
C-SUITEin theDIVERSITY
centerdigitaled.com 27
CH
RIS
TO
PH
ER
BE
AU
CH
AM
P
CON06_26.indd 27 5/31/17 9:11 AM
100 Blue Ravine RoadFolsom, CA 95630916-932-1300www.erepublic.com
Page #
__________Designer __________Creative Dir.
__________Editorial __________Prepress
__________Other ____________OK to go
5 25 50 75 95 100 5 25 50 75 95 100 5 25 50 75 95 100 5 25 50 75 95 100
BLACKYELLOW
MAGENTACYAN
CMY grey T1 T2 T3

leadership in the IT fi eld. “We’re both part of a small group — women leaders in the C-suite — and we both get that more participation by women is needed in IT at all levels, as part of the overall need for more technology talent in the U.S.,” she said. Young and Woo continue to “talk” every week on Twitter’s #CIOchat along with others and help widen their circle to include CIOs from a wide range of industries.
Ask Woo, and she’ll note one of her greatest accomplishments is supporting researchers. Case in point: She recently made history by establishing Stony Brook University as the fi rst higher education institution in New York to achieve network speed of 100 gigabits per second to the research and education network NYSERNet. For researchers, that increase now allows them to transfer data back and forth faster, meaning they can get more accomplished in their research.
Beyond enhancing innovation in higher education, Woo is a passionate mentor who is motivated by seeing others grow and advance to places they dream of. That’s also the reason why working in public higher education remains so important to her. “We are training the minds for the next generation; the people who are going to provide all the innovation going forward,” she said. “This means something. It’s not like working for a company and trying to justify that ‘widget x’ is the most important thing to mankind. We are helping to educate the minds of the future.”
discussions and presentations around diversity inclusion, and notes that she stands out as a true leader in the fi eld. “She is not afraid to speak up about what she believes in,” he said. “She is willing to put her neck out and throws her energy behind things she believes in.” He points out that, despite managing many other high-level priorities, Woo demonstrates a fi rm dedication to making positive change. “She is carving time out of her day to speak, write and share as much as she can to get folks in leadership pipelines to think about higher education in IT. She’s not been afraid to say that there are diff erent directions to go in and guide the IT team in that direction. That’s the essence of leadership.”
For Woo, diversity inclusion is also about having good business sense. “In the business world, it’s been demonstrated that there are better outcomes when you have diversity throughout. The same applies to higher ed — it’s important to have diversity of all kinds to advance innovation and bring new ideas to the table,” she said.
She works closely with EDUCAUSE, a nonprofi t community of IT leaders and professionals focused on advancing higher education, and received the organization’s 2012 Rising Star Award for her accomplishments. Joanna Young, senior managing director at BlueLine Associates and former CIO at Michigan State University, collaborates with Woo at EDUCAUSE and values her strong
Besides driving positive
change in the technology
sector, Melissa Woo is also
passionate about books,
food and music.
Favorite books: Brave New World by Aldous Huxley;
Nexus: Small Worlds and the Groundbreaking Science of Networks, by Mark Buchanan;
nearly anything written by Mary
Roach and most things written
by Neil Gaiman.
Favorite food: A self-described
“flexitarian,” she eats meatless
most of the time and focuses on
a plant-based diet. Her favorite
meal is the “meatless Joes”
(i.e., vegetarian sloppy Joes)
that her husband makes on
brioche buns.
Best playlist: Woo changes up
her listening favorites quickly
and even posts a musical
selection of the day every
morning to her Google+ stream.
Her current favorite is anything
by 2Cellos, whom she recently
saw in concert.
Inspiring person: Bruce
Maas, a former manager
who retired in April from his
position as vice provost for
information technology and
chief information off icer at
the University of Wisconsin-
Madison.
Favorite quote: “Between
stimulus and response there is a
space. In that space is our power
to choose our response. In our
response lies our growth and
freedom.” — Viktor Frankl
28 Converge » SUMMER 2017
CHRISTOPHER BEAUCHAMP
CON06_26.indd 28 6/7/17 10:32 AM
100 Blue Ravine RoadFolsom, CA 95630916-932-1300www.erepublic.com
Page #
__________Designer __________Creative Dir.
__________Editorial __________Prepress
__________Other ____________OK to go
5 25 50 75 95 100 5 25 50 75 95 100 5 25 50 75 95 100 5 25 50 75 95 100
BLACKYELLOW
MAGENTACYAN
CMY grey T1 T2 T3

Android smartphones to help with the language and technical challenges some parents face.
One such parent portal has been developed and successfully implemented by the Denver Public Schools (DPS). I worked in DPS until 2013 and was involved in the early stages of the district’s portal development and rollout. During a recent conversation with Megan Marquez, the district’s academic portal director, I was brought up-to-date on the status of Denver’s Parent Portal.
Begun in 2012 with initial funding from the Michael and Susan Dell Foundation, the DPS Parent Portal helps district parents by providing graphically formatted student data translated into the nine languages most spoken in this diverse, urban district. The DPS Parent Portal is now used by a majority of the district’s parents and is smartphone accessible.
Some key factors that have contributed to Denver’s Parent Portal success include:• Strong fi nancial support
provided through grants and district bond funding
• A portal product management and outreach team assembled to support the district’s Parent Portal, as well as its other in-house developed portals: Principal, Teacher and Student
• Extensive community outreach and parent training off ered through schools and city organizations, such as the Denver Housing Authority
• Teachers hired to write grade-level and subject-specifi c curriculum guides for inclusion in the portal, and focus on such topics as: What can I do to help my child prepare for fourth-grade literacy?
Though it has gained a strong foothold among its parent community, the DPS Parent Portal continues to face challenges. Some of these are:• The lack of common
interoperability standards between the district’s many third-party data systems
• The growing number of district-purchased data and information systems (assessments, curriculum, etc.) with their own unique portals and log-in requirements
• Addressing the needs of schools that want their own school-branded parent portals with information unique to each school (calendars, schedules, parent communications, etc.)
• Securing the time from the district’s in-house data programmers for custom portal development
• Maintaining a high level of student data privacyThe DPS Parent Portal remains a
work in progress. In the coming year, the district’s portals are transitioning to a new back-end platform that will require less custom work from the district’s in-house programming staff .
Another upcoming portal enhancement will include the district’s graduation requirements and will provide parents with current information on their students’ On Track to Graduate status. Additionally, future portal iterations will focus on providing relevant district departments and staff with the ability to manage their own portal content.
With the current emphasis on providing important K-12
student data to educators, the challenge still remains as to how best to share this information with parents and students. Many districts employ student information systems (SIS) that include online parent and student access to attendance and grades — and perhaps also class assignments, assessment scores and behavior information. In so doing, these districts are recognizing the role such information can play in growing parents’ participation in their students’ academic success.
But what of parents who are non-English speakers? Or those with limited skills in deciphering the complex information provided about their students from their district’s SIS, as well as from other district information systems? And what about parents whose only Internet access is, at best, through a smartphone?
Some school districts have acknowledged these needs by building or purchasing parent portals that provide more than just static student data. These portals give parents a more inclusive and easier look into their students’ school performance, and off er ways for parents to support their students’ academic success. They also are being formatted in multiple languages and for access via operating systems for iOS or
Denver’s Parent PortalSome lessons on helping parents support students.
By Kipp Bentley
Guest Column
Kipp Bentley was formerly the director of educational technologies in Denver Public Schools. He’s currently a senior fellow with the Center for Digital Education and consults, writes and weaves in Santa Fe, N.M.
centerdigitaled.com 29
CON06_29.indd 29 5/31/17 9:16 AM
100 Blue Ravine RoadFolsom, CA 95630916-932-1300www.erepublic.com
Page #
__________Designer __________Creative Dir.
__________Editorial __________Prepress
__________Other ____________OK to go
5 25 50 75 95 100 5 25 50 75 95 100 5 25 50 75 95 100 5 25 50 75 95 100
BLACKYELLOW
MAGENTACYAN
CMY grey T1 T2 T3

HIGH MARKS: School districts reveal their digital priorities and practices for 2017.
DATA
As school districts continue to bolster their use of technology, data and digital content, it becomes increasingly important to know what are the top priorities and practices. For that reason, the Center for Digital Education and the National School Boards Association have been conducting their Digital School Districts Survey for 13 years. The purpose is to identify emerging trends around leadership, governance, accountability, engagement, data management and security. Here are the highlights from the 2016-17 survey. Source: 2016-17 Digital School Districts Survey
TOP 5 DIGITAL PRIORITIES:1 / Personalized learning
2 / Digital content and curriculum
3 / Professional development
4 / Mobility
5 / Networking infrastructure upgrades
SCHOOLS EMBRACE MOBILITY: 88%
of districts have a mobile policy
56%
provide a mobile app
DISTRICTS HAVE DIGITAL CONTENT STRATEGIES: 59%
have a content and curriculum strategy
64%
include open education resources
(OER) in their digital content
TOP 3 SOCIAL MEDIA PLATFORMS:
Twitter YouTube
93% 92% 75%
30 Converge » SUMMER 2017
CON06_30.indd 30 5/31/17 9:41 AM
100 Blue Ravine RoadFolsom, CA 95630916-932-1300www.erepublic.com
Page #
__________Designer __________Creative Dir.
__________Editorial __________Prepress
__________Other ____________OK to go
5 25 50 75 95 100 5 25 50 75 95 100 5 25 50 75 95 100 5 25 50 75 95 100
BLACKYELLOW
MAGENTACYAN
CMY grey T1 T2 T3
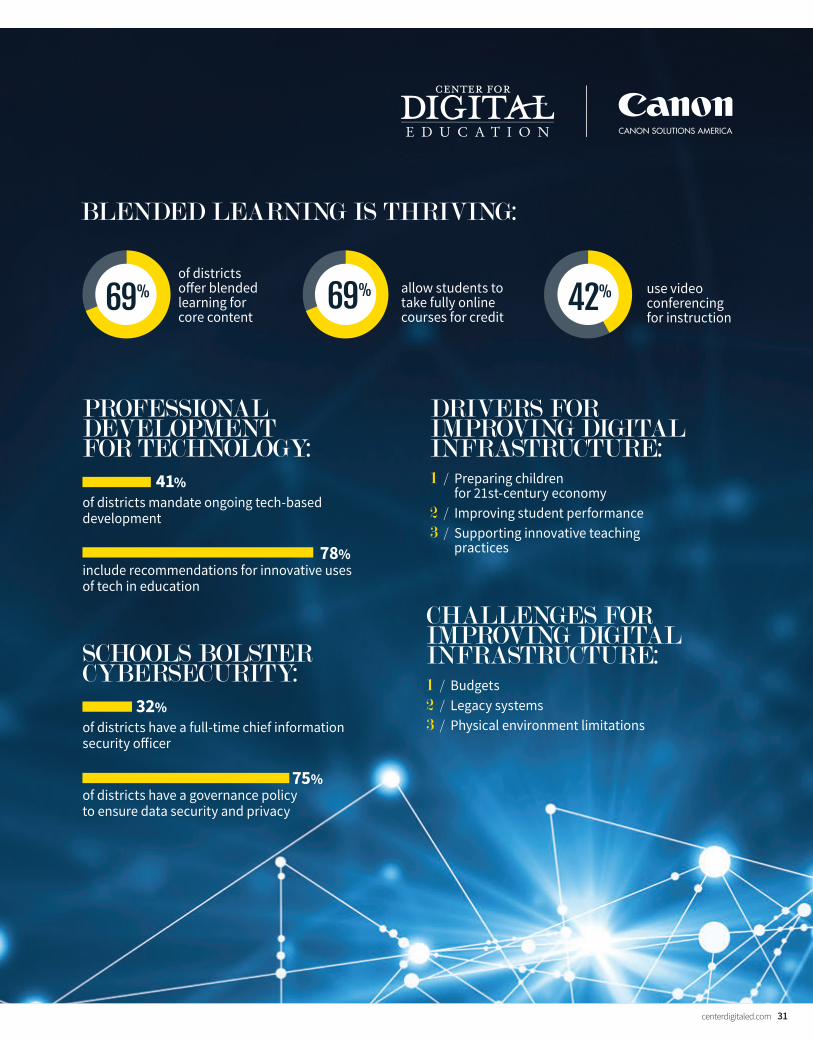
PROFESSIONAL DEVELOPMENT FOR TECHNOLOGY:
41%
of districts mandate ongoing tech-based
development
78% include recommendations for innovative uses
of tech in education
SCHOOLS BOLSTER CYBERSECURITY:
32%
of districts have a full-time chief information
security off icer
75% of districts have a governance policy
to ensure data security and privacy
BLENDED LEARNING IS THRIVING:
DRIVERS FOR IMPROVING DIGITAL INFRASTRUCTURE:1 / Preparing children
for 21st-century economy
2 / Improving student performance
3 / Supporting innovative teaching
practices
CHALLENGES FOR IMPROVING DIGITAL INFRASTRUCTURE:1 / Budgets
2 / Legacy systems
3 / Physical environment limitations
of districts
off er blended
learning for
core content
allow students to
take fully online
courses for credit
use video
conferencing
for instruction69% 69% 42%
centerdigitaled.com 31
CON06_30.indd 31 5/31/17 9:41 AM
100 Blue Ravine RoadFolsom, CA 95630916-932-1300www.erepublic.com
Page #
__________Designer __________Creative Dir.
__________Editorial __________Prepress
__________Other ____________OK to go
5 25 50 75 95 100 5 25 50 75 95 100 5 25 50 75 95 100 5 25 50 75 95 100
BLACKYELLOW
MAGENTACYAN
CMY grey T1 T2 T3

Real-time collaboration. Orchestrated by CDW•G. Today, classrooms aren’t limited to a physical space or the students right in front of you.
Intel Unite software is a wireless technology that connects immediately to new or existing displays and allows students to learn and ask questions in real time, no matter where they
are. Let Intel Unite securely power your classroom so students can connect and contribute seamlessly from anywhere. Th at’s IT Orchestration by CDW™.
CDWG.com/Intel
©2017 CDW®, CDW•G® and PEOPLE WHO GET IT® are registered trademarks of CDW LLC.Intel, the Intel logo and Intel Unite are trademarks of Intel Corporation or its subsidiaries in the U.S. and/or other countries.
100 Blue Ravine RoadFolsom, CA 95630916-932-1300www.erepublic.com
Page #
__________Designer __________Creative Dir.
__________Editorial __________Prepress
__________Other ____________OK to go
5 25 50 75 95 100 5 25 50 75 95 100 5 25 50 75 95 100 5 25 50 75 95 100
BLACKYELLOW
MAGENTACYAN
CMY grey T1 T2 T3


