61
Education Oversight Committee Community Block Grants 2016-17 Cohort Evaluation Report September 2018

1
Education Oversight Committee
Community Block Grants
2016-17 Cohort Evaluation Report
September 2018

2
Authors University of South Carolina Leigh Kale D’Amico, Ed.D. J. Montana Cain, Ph.D. William Brown, Ph.D. Clemson University Sandra Linder, Ph.D.
Acknowledgements The authors of this report are grateful for the information provided by the eight districts and consortia that received 2016-17 Community Block Grants. The continuing feedback from the districts and consortia improved our understanding of these grants and the effects of the grants across South Carolina. In addition, the South Carolina Education Oversight Committee provided the approved grant applications, documents from grantees, access to staff to clarify aspects of process and gain feedback related to data collection and analysis, and invited authors to attend webinars and meetings to facilitate deeper understanding of national initiatives and South Carolina initiatives.
3
Executive Summary Through the South Carolina Community Block Grants for Education Pilot Program Proviso 1.70, eight grants totaling $1 million were awarded to initiatives involving 15 South Carolina school districts and their partners in 2016-17. The purpose of these grants was to promote innovative programs and strategies to improve 4K classroom quality, enhance kindergarten readiness, and facilitate development within multiple domains such as language and literacy, mathematical thinking, and social emotional development. The 2016-17 Community Block Grants included:
• Two sustainability initiatives within districts that received 2015-2016 Community Block Grants • Two expansion initiatives that broadened the focus areas of 2015-16 Community Block Grants • Four new initiatives seeking to build on existing district efforts or develop new strategies
Each Community Block Grant district/consortia used a teacher-child interaction measure to assess 4K learning environments. The teacher-child interaction measures were developed by researchers, have been studied to ensure validity and reliability, and are used within early childhood and 4K settings across the country.
• Four districts/consortia used the Classroom Assessment Scoring System (CLASS) • Two districts used the Early Language and Literacy Classroom Observation (ELLCO) • Two districts/consortia used the Teaching Pyramid Observation Tool (TPOT) • One district also used the Early Childhood Environment Rating Scale 3 (E3) in addition to CLASS
The Community Block Grant districts/consortia assessed all or a portion of their 4K classrooms with the teacher-child interaction measure. In addition, an independent reviewer who was trained and certified (if required) conducted an assessment in one 4K classroom per district/consortia. Results from the district assessments demonstrated that four of four districts/consortia using CLASS improved their scores within at least one of the three domains; two of two districts using ELLCO improved their scores within the two domains; two of two districts/consortia improved their scores within two areas of TPOT. Community Block Grant districts/consortia used a variety of child outcomes measures to determine progress toward goals. All of the districts demonstrated progress in some areas, and most identified areas for improvement or additional strategies to use to more effectively evaluate their initiatives in the future. Three districts demonstrated growth in four of the five Individual Growth and Development Indicators (IGDIs) among children in 4K who completed the assessment in Fall 2017 and Spring 2018. While these results were not compared to previous years’ student cohorts based on differences in student populations, these districts met or exceeded their goals in these four domains. In addition to IGDIs, one district also found slightly higher Kindergarten Readiness Assessment (KRA) scores of children who had completed 4K within the district compared to their peers who did not participate in 4K. One district used Phonological Awareness Literacy Screening (PALS) and the district met its goal of 80% or more of the 4K children meeting expectations in all eight domains. This district also found a strong correlation (0.83) between the classroom PALS scores and the classroom ELLCO scores suggesting that higher scores on the ELLCO classroom interaction measure lead to stronger scores on PALS. One district used STAR Literacy and found that children involved in their strategy/intervention demonstrated higher growth in literacy domains than their peers who did not participate. Two districts used behavioral indicators as much of their work focused on social emotional growth. Both districts demonstrated reductions in discipline referrals, fewer disruptive behaviors in the classrooms, and more students demonstrating appropriate and productive behaviors in 4K classrooms. Detailed outcomes for each Community Block Grant district/consortia are provided within the individual profiles in this report. The results in this document, unless otherwise noted, are related to work during the school year 2017-2018 academic year.
4
Table of Contents
Executive Summary 3
Table of Contents 4
Overview 5
Numbers Served 7
Grant Outcomes 8
Findings and Recommendations 11
Cherokee County School District 14
Chesterfield County School District 21
Lancaster County School District 25
Lexington County School District 4 30
Pee Dee Consortia 35
Richland County School District 1 40
Spartanburg County School District Consortia (3 and 7) 45
York School District One 51
Appendix A Evaluation Methodology 56
Appendix B NIEER Survey Results 57
5
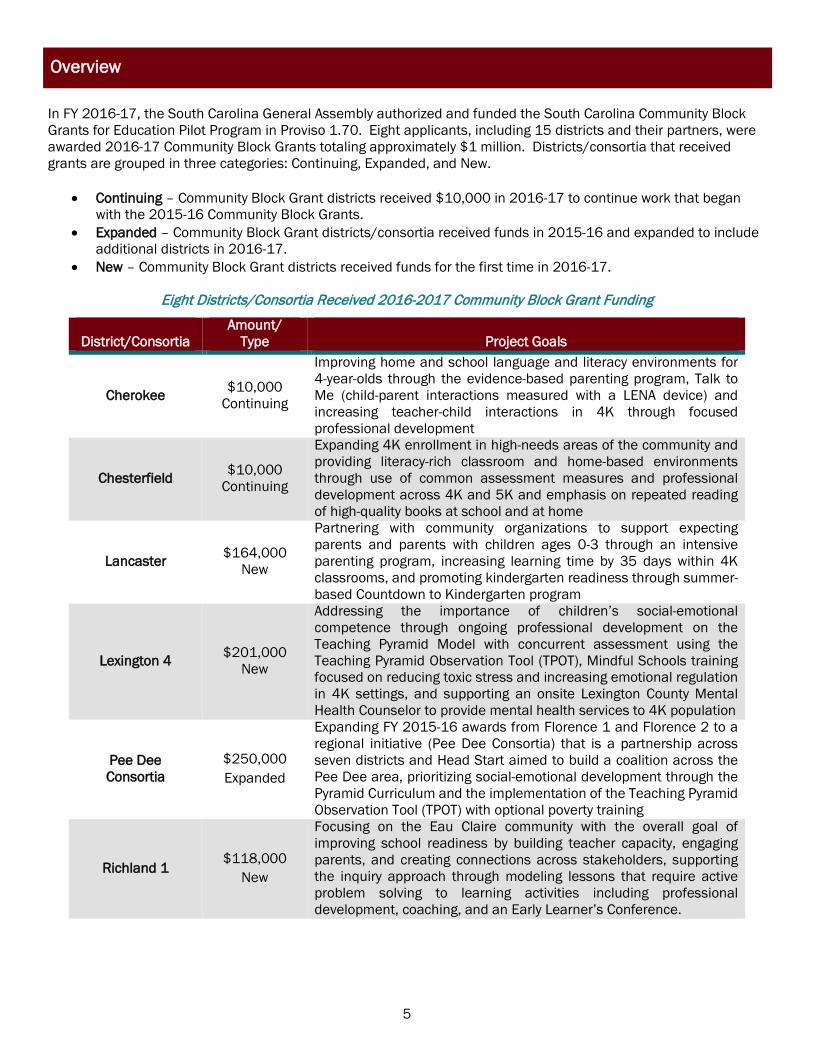
Overview In FY 2016-17, the South Carolina General Assembly authorized and funded the South Carolina Community Block Grants for Education Pilot Program in Proviso 1.70. Eight applicants, including 15 districts and their partners, were awarded 2016-17 Community Block Grants totaling approximately $1 million. Districts/consortia that received grants are grouped in three categories: Continuing, Expanded, and New.
• Continuing – Community Block Grant districts received $10,000 in 2016-17 to continue work that began with the 2015-16 Community Block Grants.
• Expanded – Community Block Grant districts/consortia received funds in 2015-16 and expanded to include additional districts in 2016-17.
• New – Community Block Grant districts received funds for the first time in 2016-17.
Eight Districts/Consortia Received 2016-2017 Community Block Grant Funding
District/Consortia
Amount/ Type
Project Goals
Cherokee $10,000 Continuing
Improving home and school language and literacy environments for 4-year-olds through the evidence-based parenting program, Talk to Me (child-parent interactions measured with a LENA device) and increasing teacher-child interactions in 4K through focused professional development
Chesterfield $10,000 Continuing
Expanding 4K enrollment in high-needs areas of the community and providing literacy-rich classroom and home-based environments through use of common assessment measures and professional development across 4K and 5K and emphasis on repeated reading of high-quality books at school and at home
Lancaster $164,000 New
Partnering with community organizations to support expecting parents and parents with children ages 0-3 through an intensive parenting program, increasing learning time by 35 days within 4K classrooms, and promoting kindergarten readiness through summer-based Countdown to Kindergarten program
Lexington 4 $201,000 New
Addressing the importance of children’s social-emotional competence through ongoing professional development on the Teaching Pyramid Model with concurrent assessment using the Teaching Pyramid Observation Tool (TPOT), Mindful Schools training focused on reducing toxic stress and increasing emotional regulation in 4K settings, and supporting an onsite Lexington County Mental Health Counselor to provide mental health services to 4K population
Pee Dee Consortia
$250,000 Expanded
Expanding FY 2015-16 awards from Florence 1 and Florence 2 to a regional initiative (Pee Dee Consortia) that is a partnership across seven districts and Head Start aimed to build a coalition across the Pee Dee area, prioritizing social-emotional development through the Pyramid Curriculum and the implementation of the Teaching Pyramid Observation Tool (TPOT) with optional poverty training
Richland 1 $118,000
New
Focusing on the Eau Claire community with the overall goal of improving school readiness by building teacher capacity, engaging parents, and creating connections across stakeholders, supporting the inquiry approach through modeling lessons that require active problem solving to learning activities including professional development, coaching, and an Early Learner’s Conference.

6
District/Consortia
Amount/ Type
Project Goals
Spartanburg Consortia
$142,000 Expanded
Creating and sustaining high quality 4K learning environments through partnerships with Spartanburg County First Steps Quality Counts, Spartanburg School District 3, Spartanburg School District 7, and the Spartanburg Academic Movement that expand the Quality Counts Model of ongoing assessment feedback from Spartanburg SD 7 to Spartanburg SD 3 and countywide implementation and analysis of the Early Development Instrument (EDI)
York One $84,000
New
Increasing kindergarten readiness by encouraging earlier kindergarten enrollment, participation in multi-tiered summer programs including a 3-week intensive summer camp, and developing relationships with families through parent-child activities in the community such as Countdown to Kindergarten and Night at the Museum
This report provides an overview of the stated foci, professional development activities, and outcome measures across all eight grantees. Following reporting of data across the eight projects are individual reports for each district or consortia with outcomes for each project highlighted separately. Findings and recommendations are included prior to the individual project highlights. Appendix A provides an overview of the methodology used for data collection and analysis. Appendix B provides survey results related to grantee perceptions of the National Institute for Early Education Research (NIEER) standards and South Carolina’s progress toward meeting these standards.
7
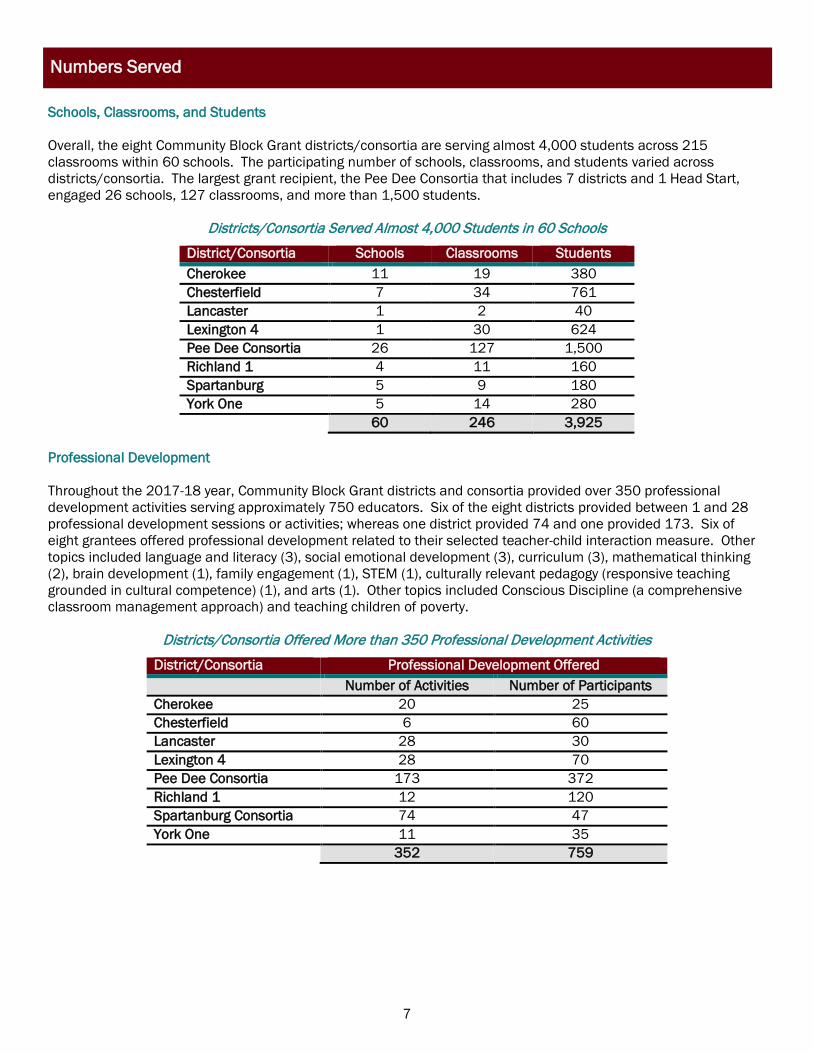
Numbers Served Schools, Classrooms, and Students Overall, the eight Community Block Grant districts/consortia are serving almost 4,000 students across 215 classrooms within 60 schools. The participating number of schools, classrooms, and students varied across districts/consortia. The largest grant recipient, the Pee Dee Consortia that includes 7 districts and 1 Head Start, engaged 26 schools, 127 classrooms, and more than 1,500 students.
Districts/Consortia Served Almost 4,000 Students in 60 Schools
District/Consortia Schools Classrooms Students Cherokee 11 19 380 Chesterfield 7 34 761 Lancaster 1 2 40 Lexington 4 1 30 624 Pee Dee Consortia 26 127 1,500 Richland 1 4 11 160 Spartanburg 5 9 180 York One 5 14 280 60 246 3,925
Professional Development Throughout the 2017-18 year, Community Block Grant districts and consortia provided over 350 professional development activities serving approximately 750 educators. Six of the eight districts provided between 1 and 28 professional development sessions or activities; whereas one district provided 74 and one provided 173. Six of eight grantees offered professional development related to their selected teacher-child interaction measure. Other topics included language and literacy (3), social emotional development (3), curriculum (3), mathematical thinking (2), brain development (1), family engagement (1), STEM (1), culturally relevant pedagogy (responsive teaching grounded in cultural competence) (1), and arts (1). Other topics included Conscious Discipline (a comprehensive classroom management approach) and teaching children of poverty.
Districts/Consortia Offered More than 350 Professional Development Activities
District/Consortia Professional Development Offered Number of Activities Number of Participants Cherokee 20 25 Chesterfield 6 60 Lancaster 28 30 Lexington 4 28 70 Pee Dee Consortia 173 372 Richland 1 12 120 Spartanburg Consortia 74 47 York One 11 35 352 759
8
Grant Outcomes Data from grant logic models, electronic surveys, and interviews with project leadership teams were compiled to determine outcome approaches for each grant project. Districts/consortia were asked to select the primary focus area(s) of their grants including Language and Literacy, Mathematical Thinking, and Social Emotional Development. Six districts/consortia selected one focus area and two districts/consortia selected two focus areas. Six of the districts/consortia focused on Language & Literacy, two focused on Social Emotional, one focused on Mathematical Thinking, and one focused on overall School Readiness.
Overview of Stated Grant Foci and Outcome Measures
District/Consortia Project Focus Student Measure Interaction Measure
Cherokee Language & Literacy Kindergarten Readiness Assessment (KRA)
Classroom Assessment Scoring System (CLASS)
Chesterfield Language & Literacy Phonological Awareness Literacy Screening (PALS)
Early Language & Literacy Classroom Observation (ELLCO)
Lancaster Language & Literacy Kindergarten Readiness Assessment (KRA)
Classroom Assessment Scoring System (CLASS)
Lexington 4 Language & Literacy Social Emotional
Individual Growth & Development Indicators (IGDIs)
Behavioral and Emotional Screening System (BESS)
Teaching Pyramid Observation Tool (TPOT)
Pee Dee Consortia Social Emotional
Decrease behavior referrals Oral and Written Language
Scales (OWLS)
Teaching Pyramid Observation Tool (TPOT)
Richland 1 Language & Literacy
Mathematical Thinking
Individual Growth and Development Indicators (IGDIs)
Classroom Assessment Scoring System (CLASS)
Spartanburg Consortia School Readiness Kindergarten Readiness
Assessment (KRA) Classroom Assessment Scoring
System (CLASS)
York One Language & Literacy Kindergarten Readiness Assessment (KRA)
Early Language & Literacy Classroom Observation (ELLCO)
Teacher-Child Interaction Assessment Community Block Grant recipients selected one of the approved interaction measures to assess teacher-student interactions: Classroom Assessment Scoring System (CLASS), Early Language and Literacy Classroom Observation (ELLCO), and Teaching Pyramid Observation Tool (TPOT). Results from the teacher-child interaction measures are detailed within each Community Block Grant district/consortia profile. Districts/consortia assessed classrooms at two points (Fall and Spring) and an independent rater assessed one classroom per district around the same two points. It is important to note that scores from the classrooms assessed by the districts were averaged, and this may present discrepancies between the one classroom assessed by the independent rater and the multiple classrooms assessed by the districts/consortia. In addition, trained raters from the districts/consortia may score classrooms lower or higher than the independent raters based on a variety of factors including experience with the measure. The Classroom Assessment Scoring System (CLASS) was used by four districts. One classroom per district was also assessed by an independent reviewer trained in the instrument. CLASS, developed by University of Virginia researchers, assesses 10 dimensions organized in three domains (Emotional Support, Classroom Organization, and Instructional Support). CLASS uses a 1 to 7 scale with a “low” score indicated as a 1 or 2, a “mid” score as a 3 – 5, and a “high” score as a 6 or 7. The Early Language & Literacy Classroom Observation (ELLCO) was used by two districts. One classroom per district was also assessed by an independent reviewer trained in the instrument. ELLCO includes 19 indicators within five sections and two subscales. ELLCO uses a 1 to 5 scale with 1 being “Deficient” and 5 being “Exemplary.”

9
The Teaching Pyramid Observation Tool (TPOT) was used by two districts. This tool includes 32 items organized within three subscales (Key Practices, Red Flags, and Using Effective Strategies to Respond to Challenging Behaviors). TPOT is scored using yes/no criteria and supporting notes. In addition to CLASS, one consortia also used the Early Childhood Environment Rating Scale-Third Edition (E3). This scale includes 35 items organized into six subscales (Space and Furnishings, Personal Care Routines, Language and Literacy, Learning Activities, Interactions, and Program Structure). This tool uses a 1 to 7 point scale.
Districts/Consortia Assessed Classrooms with More Than 2,500 Students
District/Consortia Tool Assessments Conducted Schools Classrooms Students Cherokee CLASS 8 9 180 Lancaster CLASS 1 2 40 Richland 1 CLASS 4 11 160 Spartanburg Consortia CLASS 5 9 180 Spartanburg Consortia E3 5 7 140 Chesterfield ELLCO 7 34 761 York One ELLCO 5 8 160 Lexington 4 TPOT 1 7 154 Pee Dee Consortia TPOT 26 94 1470 56 149 2542
Student Assessments Community Block Grant districts/consortia used a variety of student assessment measures including Developmental Reading Assessment (1), Early Development Instrument (EDI) (1), Individual Growth and Developmental Indicators (IGDIS) (3), Kindergarten Readiness Assessment (KRA) (3), Measures of Academic Progress (MAP) (1), Oral and Written Language Scales (OWL) (1), and Phonological Awareness Literacy Screening (PALS) (3). Results for each district/consortia are provided within the profiles.
Districts/Consortia Student Assessments used to Explore Effects of Community Block Grants
District/Consortia Student Assessments Conducted DRA EDI IGDI KRA MAP OWL PALS Cherokee Chesterfield Lancaster Lexington 4 Pee Dee Consortia Richland 1 Spartanburg Consortia York One
Additional Assessments Some districts included additional measures to act as formative assessment of project activities. For example, prior to implementing CLASS, the Spartanburg Consortia utilized the Early Childhood Environmental Rating Scale- Third Edition (ECERS-3) to act as base line data for informing technical assistance and professional development. The ECERS-3 is an observation tool used to provide an overview of early childhood classroom environments. Further, some districts went beyond their stated outcome measures for students by examining additional measures such as Teaching Strategies GOLD, Star Early Literacy, and the Phonological Awareness Literacy Screener (PALS).
The Spartanburg Consortia, in particular, focused on additional student outcome assessments with a project goal of implementing the Early Development Instrument (EDI) across Spartanburg County to examine growth across

10
domains of development in a systematic manner. The EDI is a validated measure of school readiness that allows for an overall snapshot of children’s developmental progress along five domains: Physical Health and Wellbeing; Social Competence; Emotional Maturity; Language and Cognitive Development; and Communication Skills and General Knowledge. With 103 items, the EDI questionnaire is completed by the classroom teacher for each kindergarten student and can be analyzed using visual snapshots to show children’s developmental needs across different census tracts.
Finally, projects with a heavy emphasis on family programming utilized additional outcome measures. For example, the Talk to Me Partnership in Cherokee County used family-oriented interventions to increase and support language and literacy practices in home environments. Outcomes related to these project activities were measured using a LENA device that accumulated the amount of words and interactions between children and adults over the course of a day. Detailed outcome findings related to each of the eight grant projects are described in the Project Highlights section below.

11
Findings and Recommendations A profile for each Community Block Grant district/consortia was developed based on the unique strategies and approaches within their approved proposals and the associated logic models, which defined the relationships between these strategies and the anticipated outcomes. These profiles detail the strategies and approaches used by each district/consortia. They also provide the teacher-interaction measure results, student assessment results, partnerships developed, sustainability plans, and scalability of strategies. After the profiles were developed and confirmed by grantees, evaluators identified common themes across the Community Block Grant districts/consortia to inform overall findings and recommendations. Findings • Community Block Grant districts/consortia used funding to develop new strategies such as 4K expansion,
kindergarten transition (3), align 4K and 5K goals/outcomes (3), implement or expand existing models (5), facilitate partnerships (8), and better measure progress through teacher-child interaction measures and other assessments (8) based on identified needs within their district or region.
• Some districts implemented national models or expanded local approaches that had demonstrated success: o Cherokee: Talk to Me o Lancaster: Harlem Children’s Zone/Promise Neighborhoods o Lexington 4: Teaching Pyramid Model; Mindful Schools o Pee Dee Consortia: Teaching Pyramid Model o Spartanburg: Quality Counts and Early Development Instrument
• Some districts developed approaches based on their needs: o Chesterfield: Expansion of 4K classrooms, development of common goals for 4K and 5K classrooms using
ELLCO/formative assessments o Richland 1: Targeted professional development and conference on evidence-based practices in 4K and 5K o York One: Child-find approach to encourage 4K enrollment and understand needs of rising 5K students and
comprehensive summer programs designed to effectively transition children to 5K
• Through the Community Block Grants, almost 4,000 4K and 5K children in 236 classrooms within 60 schools were impacted during the 2016-17 cycle.
• Professional development including the establishment of professional learning communities, mentoring, and coaching models were expanded to reach 759 early childhood educators including principals, assistant principals, teachers, and assistant teachers. Professional development was targeted toward 4K and 5K strategies and often included Head Start and other early childhood education organizations/sites.
• The majority of the Community Block Grant districts/consortia implemented teacher-child interaction measures (CLASS, ELLCO, TPOT) that were new to their (7 of 8) district/consortia. Results from the district-level assessments and the independent raters demonstrate substantive growth in many areas of the interaction measure. Districts/consortia also reported that common benchmarks and goals were developed as a result of the use of the teacher-child interaction measure.
• The majority of the initiatives and strategies funded focused on language and literacy. Some districts/consortia focused on social emotional development, mathematical thinking, or overall school readiness.
• Community Block Grant districts/consortia have been among the first in the state to fully implement national evidence-based models or initiatives designed to support early childhood education including Talk to Me (LENA device) in Cherokee; Teaching Pyramid in Pee Dee Consortia and Lexington School 4; Harlem Children’s Zone in Lancaster; and Early Development Instrument (EDI) in Spartanburg.
• Community Block Grant districts/consortia are among leaders in implementing new strategies designed to improve outcomes for young children including Chesterfield’s convergence around ELLCO to improve literacy outcomes and recent adoption of COEMET focused on mathematical thinking; Richland 1’s targeted professional development for 4K and 5K educators; and York One’s child find efforts and intensive summer transition to kindergarten strategies.

12
• Two of the Community Block Grant initiatives involve multiple districts, Pee Dee Consortia and Spartanburg Consortia, and other Community Block Grant districts have collaborated with districts in their region to inform and enhance early childhood programming and strategies.
• Many of these initiatives have led to expanded partnerships with First Steps (Cherokee, Lancaster, Richland 1, Spartanburg Consortia, York One); Head Start (Cherokee, Chesterfield, Lancaster, Pee Dee Consortia); early childhood education degree programs at South Carolina Institutions of Higher Education (Cherokee, Chesterfield, Pee Dee Consortia, Spartanburg); health organizations (Lexington 4), and other community organizations.
• Expanded partnerships have allowed for significant expansion of programs/models without significant expense. For example, with just a $10,000 continuing grant in Cherokee, partnerships allowed for participants to be tripled from Year 1 and for the model to become more sustainable over time. Partnerships within the Pee Dee Consortia and Spartanburg School Districts 3 and 7 yielded similar findings.
• Grantees are beginning to make connections between teacher-child interactions and child outcomes. While data on child outcomes has not yet been achieved by all districts/consortia, grantees are identifying and implementing strategies for examining child data in correlation with grant activities.
• Districts/consortia are beginning to disseminate grant activities through a variety of methods including social media, community events, and state level conferences.
• Dissemination and modeling of Community Block Grant best practices occurring through Olde English Consortium (Chesterfield, Lancaster, and York One); work with South Carolina Department of Education (Pee Dee Consortia); and district to district collaboration (Chesterfield, Spartanburg).
Recommendations • The use of partnerships has yielded positive results across grantees. Future submissions and proposed
expansions should focus on partnerships as a strategy for implementation. Currently funded programs should look to expand partnerships beyond county lines to promote scalability across South Carolina.
• Districts/consortia should continue to pursue strategies for examining connections between teacher-child (or parent-child) interactions and child outcomes. Sometimes examining child outcomes requires a longitudinal approach, therefore grantees seeking expansion or continuing funds should include plans for child outcome analysis of participants from previous years.
• Language and literacy have been emphasized in the majority of funded districts/consortia. Increased emphasis on social and emotional development and mathematical thinking can lead to projects that focus on the whole child.
• Current grantees, particularly those that have yielded positive results, can be encouraged to act in a mentor role for new grantees that seek to implement similar models in districts across South Carolina.
• Districts/consortia might be encouraged to develop specific plans for dissemination of grant outcomes within grant proposals to support scalability and collaborations across the state.
• Districts/consortia may benefit from technical assistance and support on methods to evaluate child/student progress using comparison groups, historical data, growth trajectories, and other methods to explore the relationships between interventions and success.
13
Education Oversight Committee Community Block Grants District/Consortia Profiles
Cherokee County School District
Chesterfield County School District
Lancaster County School District
Lexington County School District 4
Pee Dee Consortia
Richland County School District 1
Spartanburg County School District Consortia (3 and 7)
York School District One
14
SC Child Early Reading and Development Education Program Community Block Grants for Education Pilot Program
2016-17 Cohort
Cherokee County School District
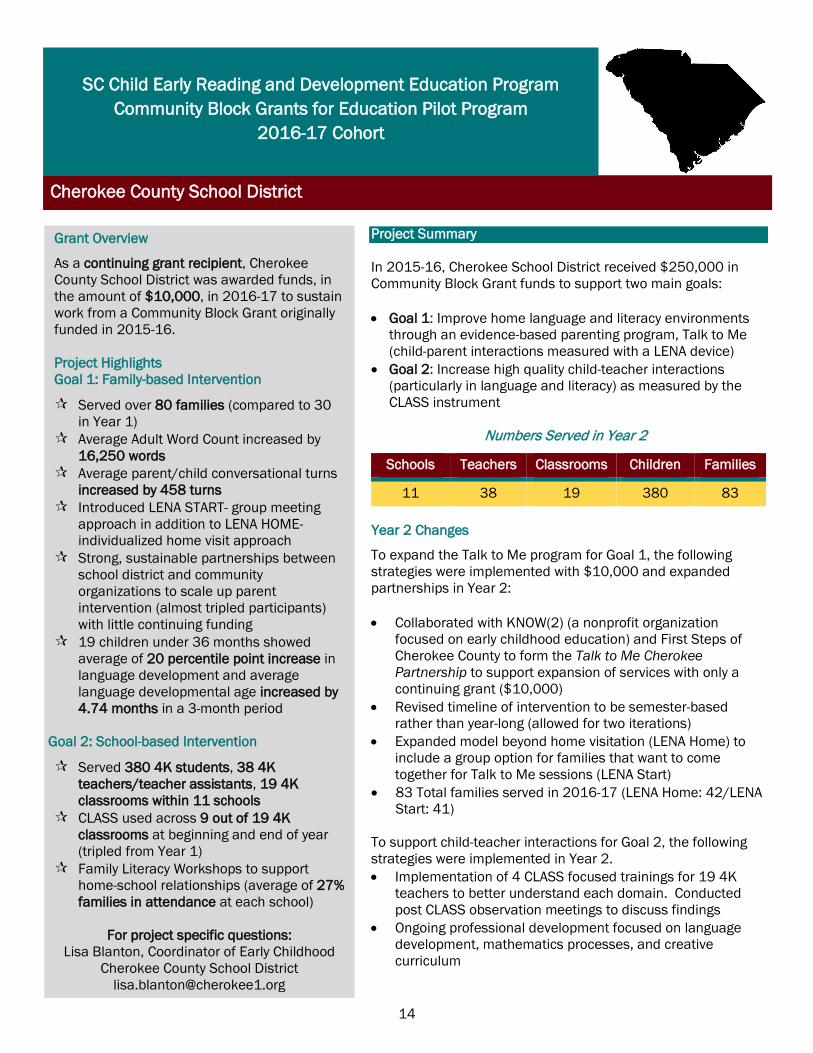
Project Summary In 2015-16, Cherokee School District received $250,000 in Community Block Grant funds to support two main goals: • Goal 1: Improve home language and literacy environments
through an evidence-based parenting program, Talk to Me (child-parent interactions measured with a LENA device)
• Goal 2: Increase high quality child-teacher interactions (particularly in language and literacy) as measured by the CLASS instrument
Numbers Served in Year 2
Schools Teachers Classrooms Children Families
11 38 19 380 83 Year 2 Changes
To expand the Talk to Me program for Goal 1, the following strategies were implemented with $10,000 and expanded partnerships in Year 2: • Collaborated with KNOW(2) (a nonprofit organization
focused on early childhood education) and First Steps of Cherokee County to form the Talk to Me Cherokee Partnership to support expansion of services with only a continuing grant ($10,000)
• Revised timeline of intervention to be semester-based rather than year-long (allowed for two iterations)
• Expanded model beyond home visitation (LENA Home) to include a group option for families that want to come together for Talk to Me sessions (LENA Start)
• 83 Total families served in 2016-17 (LENA Home: 42/LENA Start: 41)
To support child-teacher interactions for Goal 2, the following strategies were implemented in Year 2. • Implementation of 4 CLASS focused trainings for 19 4K
teachers to better understand each domain. Conducted post CLASS observation meetings to discuss findings
• Ongoing professional development focused on language development, mathematics processes, and creative curriculum
Grant Overview
As a continuing grant recipient, Cherokee County School District was awarded funds, in the amount of $10,000, in 2016-17 to sustain work from a Community Block Grant originally funded in 2015-16. Project Highlights Goal 1: Family-based Intervention
Served over 80 families (compared to 30 in Year 1)
Average Adult Word Count increased by 16,250 words
Average parent/child conversational turns increased by 458 turns
Introduced LENA START- group meeting approach in addition to LENA HOME- individualized home visit approach
Strong, sustainable partnerships between school district and community organizations to scale up parent intervention (almost tripled participants) with little continuing funding
19 children under 36 months showed average of 20 percentile point increase in language development and average language developmental age increased by 4.74 months in a 3-month period
Goal 2: School-based Intervention
Served 380 4K students, 38 4K teachers/teacher assistants, 19 4K classrooms within 11 schools
CLASS used across 9 out of 19 4K classrooms at beginning and end of year (tripled from Year 1)
Family Literacy Workshops to support home-school relationships (average of 27% families in attendance at each school)
For project specific questions: Lisa Blanton, Coordinator of Early Childhood
Cherokee County School District [email protected]

15
Project Outcomes School • All 4K classrooms in district schools focused on CLASS to inform literacy and language practices • LENA Start and LENA Home programs support student growth rates in literacy and language Teacher • 19 4K teachers trained on CLASS (focus on understanding CLASS domains- not on becoming CLASS observers) • 38 4K teachers and teacher assistants from 19 classrooms participated in ongoing professional development
and coaching sessions focused on language and literacy. Reading Coach training and support ranged from 9-15 days throughout the year per school. Administrator training and support ranged from 5-11 days throughout the year per school (days increased at schools with more 4k classrooms). A total of 20 professional development activities occurred for participants throughout the year.
• 9 out of 19 (47%) 4K teachers were observed with CLASS (increase from 3 classrooms in Year 1). CLASS pre-observation (fall 2017) scores revealed the Instructional Support Domain as an area of focus for professional development.
• Observed 4K classrooms improved CLASS scores from pre to post observations
Student • STAR Early Literacy scores from 2016-17 were compared between Talk
to Me students and Non-Talk to Me students at target schools. Talk to Me students scored an average of 8.1 points lower than their peers in vocabulary in the fall. While Non-Talk to Me students had a higher overall achievement score in the spring (53.9 compared to 45), the Talk to Me students showed a higher rate of growth from fall to spring (55% more than their peers).
Family • 13 home visits (LENA Home) or group sessions (LENA Start) to
implement the Talk to Me program for 83 families from fall to spring 2017-18
• Use of LENA device to record word counts and conversational turns for 13 weeks for each family
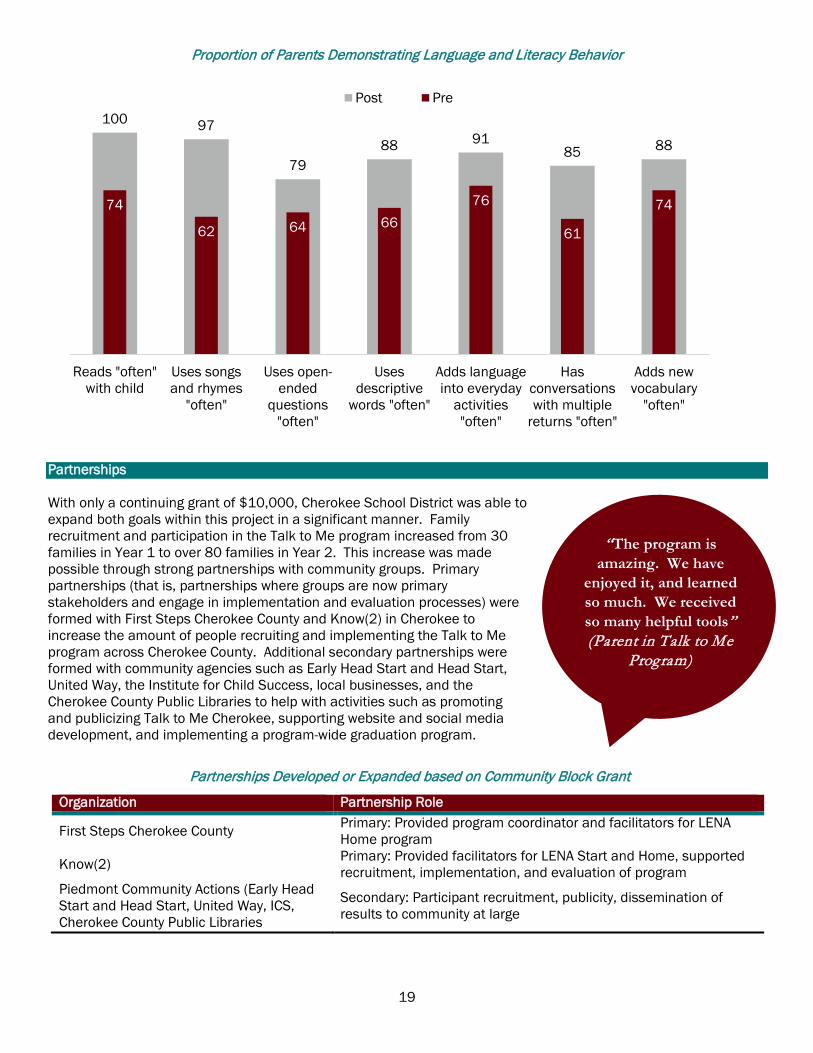
• Significant increases in adult word counts and conversational turns across fall and spring cohorts (83 families) • Parent surveys examined adult language and literacy behaviors in the home. Fall 2017 cohort showed
increases in self-reported data across the following behaviors: reading daily with their child (pre-24% to post 71% of families, using songs and rhymes daily (pre-21% to post 82% of families), and using open ended questions daily (pre-29% to post 61% of families).
• 1 family workshop held at each district school (average attendance 27% of families (focused on developing literacy and language practices at home)
Community • Sustainable primary partnerships developed with First Steps and Know(2) in addition to secondary partnerships
with Head Start and other community agencies
Teacher-Child Interaction Measure Cherokee School District is using The Classroom Assessment Scoring System (CLASS) that was developed by University of Virginia researchers as an observational tool to measure the quality of teacher-child interactions in center-based preschool classrooms. There are a total of 10 dimensions that are organized into three domains. The domain of emotional support assesses the extent to which teachers establish and promote a positive classroom climate through their everyday interactions and is captured by the following dimensions: positive climate, negative climate, teacher sensitivity, and regard for student perspectives. The domain of classroom organization assesses classroom routines and procedures related to the organization and management of students’ behavior, time and attention in the classroom and is captured by the following dimensions: behavior management, productivity, and instructional learning formats. The domain of instructional support assesses the ways in which teachers implement

16
the curriculum to effectively promote cognitive and language development and is captured by the following dimensions: concept development, quality of feedback, and language modeling. Each dimension is scored on a range from 1 to 7 with a “low” score indicated as a 1 or 2, a “mid” score as a 3-5, and a “high” score as a 6 or 7. The district implemented CLASS in 3 4K classrooms in Year 1 (this low number was attributed to the amount of effort put into Goal 1- the Talk to Me program). This number tripled to 9 classrooms in Year 2 by training additional CLASS observers with a portion of the continuing grant funds. All 4K teachers also received substantive training on the CLASS domains and how they are enacted in classroom practice. The district plans to continue expanding CLASS observations in the 2018-2019 year across all 4K classrooms. Year 2 pre-CLASS scores showed ratings across 9 teachers in the Emotional Support and Classroom Organization domains averaging above 6 (high). However, pre-CLASS scores in the Instructional Support domain averaged 4.89 across participants, resulting in increased professional development throughout the year focused on this domain with an emphasis on questioning, conversations, and vocabulary/language development. Post scores show almost a one-point increase in the Instructional Support domain, indicating positive responses overall to professional development initiatives. Smaller increases also occurred for the Emotional Support (+.06) and Classroom Organization (+.41) domains showing overall progress related to teacher/child interactions in 4K settings.
CLASS Average Pre and Post-Domain Scores: District Reported and Independent Review
Cherokee Reported Independent Review CLASS Domains Pre Post Pre Post
Emotional Support 6.23 6.29 6.50 6.50 Classroom Organization 5.99 6.40 5.67 6.00
Instructional Support 4.89 5.76 4.33 5.33 Number of Classrooms Assessed 9 9 1 1
6.29 6.45.76
6.235.99
4.89
Emotional Support Classroom Organization Instructional Support
CLASS Average Scores by Domain Summarized Across 9 Teachers/Classrooms
Post Pre
17
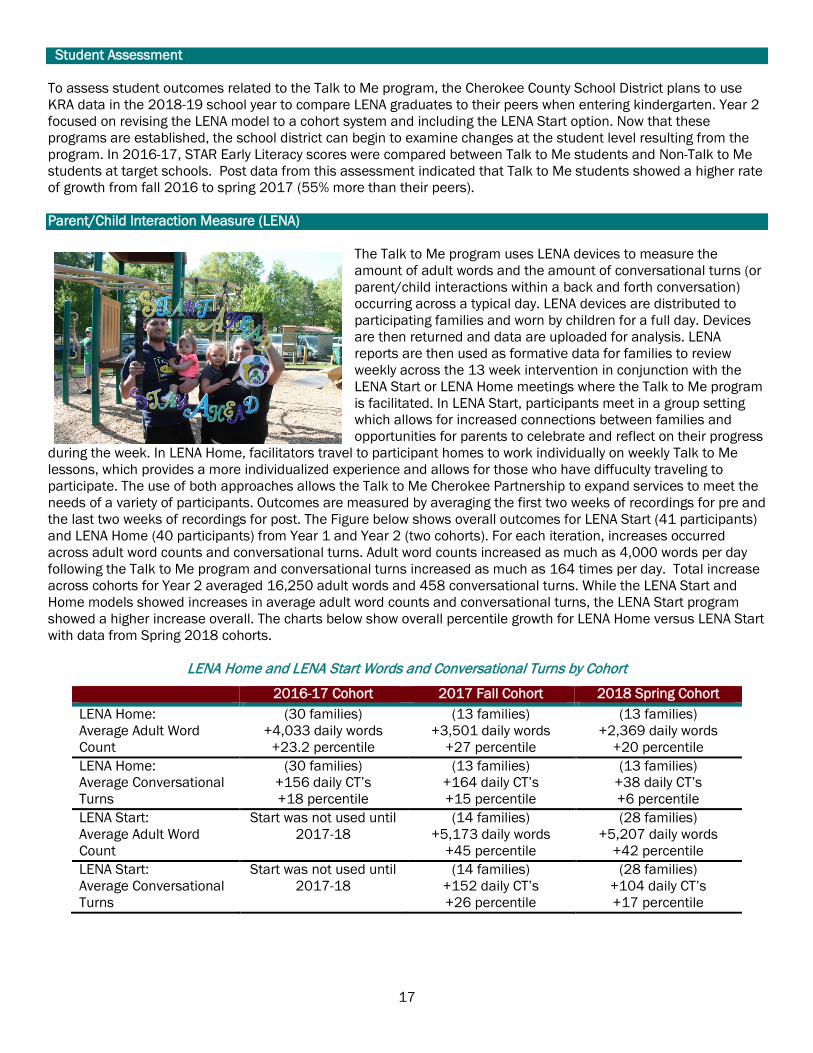
Student Assessment To assess student outcomes related to the Talk to Me program, the Cherokee County School District plans to use KRA data in the 2018-19 school year to compare LENA graduates to their peers when entering kindergarten. Year 2 focused on revising the LENA model to a cohort system and including the LENA Start option. Now that these programs are established, the school district can begin to examine changes at the student level resulting from the program. In 2016-17, STAR Early Literacy scores were compared between Talk to Me students and Non-Talk to Me students at target schools. Post data from this assessment indicated that Talk to Me students showed a higher rate of growth from fall 2016 to spring 2017 (55% more than their peers). Parent/Child Interaction Measure (LENA)
The Talk to Me program uses LENA devices to measure the amount of adult words and the amount of conversational turns (or parent/child interactions within a back and forth conversation) occurring across a typical day. LENA devices are distributed to participating families and worn by children for a full day. Devices are then returned and data are uploaded for analysis. LENA reports are then used as formative data for families to review weekly across the 13 week intervention in conjunction with the LENA Start or LENA Home meetings where the Talk to Me program is facilitated. In LENA Start, participants meet in a group setting which allows for increased connections between families and opportunities for parents to celebrate and reflect on their progress
during the week. In LENA Home, facilitators travel to participant homes to work individually on weekly Talk to Me lessons, which provides a more individualized experience and allows for those who have diffuculty traveling to participate. The use of both approaches allows the Talk to Me Cherokee Partnership to expand services to meet the needs of a variety of participants. Outcomes are measured by averaging the first two weeks of recordings for pre and the last two weeks of recordings for post. The Figure below shows overall outcomes for LENA Start (41 participants) and LENA Home (40 participants) from Year 1 and Year 2 (two cohorts). For each iteration, increases occurred across adult word counts and conversational turns. Adult word counts increased as much as 4,000 words per day following the Talk to Me program and conversational turns increased as much as 164 times per day. Total increase across cohorts for Year 2 averaged 16,250 adult words and 458 conversational turns. While the LENA Start and Home models showed increases in average adult word counts and conversational turns, the LENA Start program showed a higher increase overall. The charts below show overall percentile growth for LENA Home versus LENA Start with data from Spring 2018 cohorts.
LENA Home and LENA Start Words and Conversational Turns by Cohort
2016-17 Cohort 2017 Fall Cohort 2018 Spring Cohort LENA Home: Average Adult Word Count
(30 families) +4,033 daily words
+23.2 percentile
(13 families) +3,501 daily words
+27 percentile
(13 families) +2,369 daily words
+20 percentile LENA Home: Average Conversational Turns
(30 families) +156 daily CT’s +18 percentile
(13 families) +164 daily CT’s +15 percentile
(13 families) +38 daily CT’s +6 percentile
LENA Start: Average Adult Word Count
Start was not used until 2017-18
(14 families) +5,173 daily words
+45 percentile
(28 families) +5,207 daily words
+42 percentile LENA Start: Average Conversational Turns
Start was not used until 2017-18
(14 families) +152 daily CT’s +26 percentile
(28 families) +104 daily CT’s +17 percentile

18
LENA Home Visit Data Spring 2018 LENA Start Data Spring 2018
The increased number of participants in Year 2 allowed the Talk to Me Cherokee partnership to utilize a Language Development Snapshot tool to assess language development for children completing the program before the age of 36 months. Although this age range was not a priority for the Community Block Grant, the increased partnerships allowed for the inclusion of children in this age range as well. This included 19 children in the Spring 2018 Cohort. Results show an average of a 20-percentile point increase in language development. In addition, the average language developmental age increased by 4.74 months during a 3-month period, indicating that language development was accelerated for children whose parents participated in the LENA Home and Start programs. This is an additional indicator that student trajectories are being changed at an early age when parents participate in this program.
Snapshot Growth-Developmental Age Spring 2018 (n=19)
Finally, the Talk to Me Cherokee partnership examined feasibility of the Talk to Me program by conducting surveys examining parent reactions to the program and parent beliefs related to language and literacy practices. Results showed an overwhelmingly positive response from parents in regards to programming. Further, parents perceived language and literacy practices increased from pre to post implementation.
10.84
15.58
0.002.004.006.008.00
10.0012.0014.0016.0018.0020.00
Program Week 1 Program Week 13
Age
in M
onth
s
19
Proportion of Parents Demonstrating Language and Literacy Behavior
Partnerships With only a continuing grant of $10,000, Cherokee School District was able to expand both goals within this project in a significant manner. Family recruitment and participation in the Talk to Me program increased from 30 families in Year 1 to over 80 families in Year 2. This increase was made possible through strong partnerships with community groups. Primary partnerships (that is, partnerships where groups are now primary stakeholders and engage in implementation and evaluation processes) were formed with First Steps Cherokee County and Know(2) in Cherokee to increase the amount of people recruiting and implementing the Talk to Me program across Cherokee County. Additional secondary partnerships were formed with community agencies such as Early Head Start and Head Start, United Way, the Institute for Child Success, local businesses, and the Cherokee County Public Libraries to help with activities such as promoting and publicizing Talk to Me Cherokee, supporting website and social media development, and implementing a program-wide graduation program.
Partnerships Developed or Expanded based on Community Block Grant
Organization Partnership Role
First Steps Cherokee County Primary: Provided program coordinator and facilitators for LENA Home program
Know(2) Primary: Provided facilitators for LENA Start and Home, supported recruitment, implementation, and evaluation of program
Piedmont Community Actions (Early Head Start and Head Start, United Way, ICS, Cherokee County Public Libraries
Secondary: Participant recruitment, publicity, dissemination of results to community at large
“The program is amazing. We have
enjoyed it, and learned so much. We received so many helpful tools” (Parent in Talk to Me
Program)
100 97
7988 91
85 88
74
62 64 6676
61
74
Reads "often"with child
Uses songsand rhymes
"often"
Uses open-ended
questions"often"
Usesdescriptive
words "often"
Adds languageinto everyday
activities"often"
Hasconversationswith multiple
returns "often"
Adds newvocabulary
"often"
Post Pre
20
Sustainability Cherokee County School District sustained two positions for Talk to Me facilitators funded with Community Block Grant funds for the 2017-18 academic year. The school district plans to continue sustaining these positions in the future. In addition, the primary partnerships formed through this grant allows for sustainability over time. Scalability The following aspects of Cherokee School District’s initiatives will continue to scale-up through the Community Block Grant funding: • Use of CLASS teacher-child interaction measure across 4K classrooms,
with intensive professional development model focused on “Powerful Interactions”
• Increased recruitment of families to Talk to Me program to expand from birth to age 5 and continuing support of families who have graduated from the Talk to Me model (LENA Home and Start)
• Use of Kindergarten Readiness Assessment (KRA) data to determine student outcomes in relation to Goals 1 and 2 for the project
Leveraging Funds:
With only a continuing grant of $10,000, Cherokee County
School District increased Talk to Me families from 30 to 83. This increase was only made
possible because of the partnerships formed in
conjunction with the grant. Partnerships are essential for
grant success.

21
Project Summary In 2015-16, Chesterfield School District received a Community Block Grant to expand the 4K program by adding two full-day 4K classrooms serving 40 additional children in the 2016-17 academic year. These classrooms were placed in two schools (one classroom per school). In 2017-18, these classrooms were sustained through state funding and an additional 4K classroom was extended from part-day to full-day with district funds. Currently, the district has seven state-funded 4K classrooms and five district-funded 4K classrooms. In 2016-17, Chesterfield School District received a continuing grant to sustain their 4K work. Two goals guided the continuing grant: • Goal 1: Provide additional literacy-based instruction and
opportunities for 4-year-olds • Goal 2: Enhance classroom and home libraries of children to
promote rich oral language development
In 2016-17, all 4K students received 50 books for their home libraries that had been read in their classrooms. The district continued to provide approximately 22 books to each 4K student in 2017-18 for their home library based on the success of the repeated exposure to books from classroom to home. In addition, family literacy events to encourage reading at home were held at two primary schools that included Head Start families. To assess the quality of the 4K classrooms, the district used the Early Language and Literacy Observation Tool (ELLCO). In 2016-17, district leaders received ELLCO training and then trained principals, literacy coaches, 4K and 5K teachers and teacher assistants in seven schools. In 2017-18, ELLCO continued to be used across 4K and 5K classrooms. This was used across all 12 4K classrooms within seven schools in 2016-17 as well in the 22 5K classrooms within the district.
SC Child Early Reading and Development Education Program Community Block Grants for Education Pilot Program
2016-17 Cohort
Chesterfield County School District
Schools Teachers Classrooms Children
7 68 34 761
Grant Overview
As a continuing grant, Chesterfield School District was awarded $10,000 in 2016-17 to sustain work from a 2015-16 Community Block Grant funded for $250,000. Project Highlights
Served 761 4K and 5K students Served 68 teachers/teacher assistants Included 12 4K and 22 5K classrooms ELLCO, a teacher-child interaction
measure, used in 34 4K and 5K classrooms
ELLCO gains in 11 of 12 4K classrooms 5 professional development events
serving 60 principals, literacy coaches, teachers, and teacher assistants
Developed early learning strategy to 1) increase 4K enrollment, 2) provide high-quality, literacy-rich classrooms, 3) encourage repeated readings in school and at home, 4) increase summer reading activities, and 5) intervene with Reading Recovery in Grade 1 as needed
120 unique book titles added to 4K classroom libraries (2015-16 grant) to align with ELLCO and promote shared reading across curriculum and home
22 books added to home libraries of 4K children aligned with classroom libraries
Family literacy events at 2 primary schools that encouraged participation from Head Start families
For project specific questions: Wendy Folsom
Executive Director of Curriculum and Instruction
Chesterfield School District [email protected]

22
Project Outcomes School • 7 schools and 34 4K and 5K classrooms focused on ELLCO to inform classroom climate and quality within 4K
and 5K • Principals, literacy coaches, teachers, and teacher assistants trained in ELLCO to encourage common
understandings, facilitate professional development, and inform coaching on ELLCO-based improved strategies
Teacher • 11 of 12 4K classrooms improved ELLCO scores based on beginning of year baseline score • 120 books added to each classroom library based on ELLCO guidance (2015-16) • Common criteria and goals increased collaboration and transition from 4K to 5K • Individualized literacy coaching focused on ELLCO results • Classroom-based book inventory to determine needs and develop professional development based on common
book titles and ELLCO-identified strengths and areas for improvement • Strong correlation (0.83) between Spring 2018 classroom ELLCO results and Spring 2018 PALS student
assessment data
Student • 761 4K students served through expanded 4K classrooms, book distribution, and classroom quality
improvement through ELLCO • 85% to 96% of students met PALS benchmarks in the eight assessment areas • More than 90% of students met benchmarks in four of the eight areas: Name Writing (96%), Letter Sounds
(93%), Beginning Sound Awareness (92%), and Nursery Rhyme (92%) • Each student (4K through Grade 5) selected nine books at Book Fair to encourage summer reading
Family • 22 books added to home library of all 4K students within five schools • Literacy workshops held in fall and spring at Cheraw Primary and Petersburg Primary that encouraged
participation from Head Start sites in Cheraw and Pageland
Community • Partnerships developed with Head Start, Central High School (with on-site Eagle’s Nest Child Development
Center), and early childhood education degree program at Northeastern Technical College to enhance early learning focus within community
• Coordination occurring between Head Start, school district, and other local programs to increase access and enrollment within early learning programs and provide high-quality learning environments that promote kindergarten readiness across 4K settings
• Facilitated conversation with Olde English Consortium, a group of school districts in the North Central region of South Carolina, around 4K learning environments and domains
Teacher-Child Interaction Measure Chesterfield School District is using the Early Langague and Literacy Observation Tool (ELLCO) to assess classroom environment and teacher-child interactions. ELLCO includes 19 indicators within five sections and two subscales. ELLCO uses a 1 to 5 scale with 1 being “Deficient” and 5 being “Exemplary.” District personnel received ELLCO training provided by the South Carolina Department of Education in Summer 2016. The district uses a train-the-trainer model to disseminate the information to principals, 4K and 5K teachers, and literacy coaches to facilitate use within these schools.
The district began using this tool in the 2016-17 academic year, and continued its use across the 12 4K classrooms and 22 kindergarten classrooms in the district. The district choose to use ELLCO in 4K and 5K to increase collaboration, develop consistency in expectations across 4K and 5K, and encourage a smooth transition from 4K to 5K. Each teacher receives a Beginning-of-Year ELLCO and an End-of-Year ELLCO conducted.
23
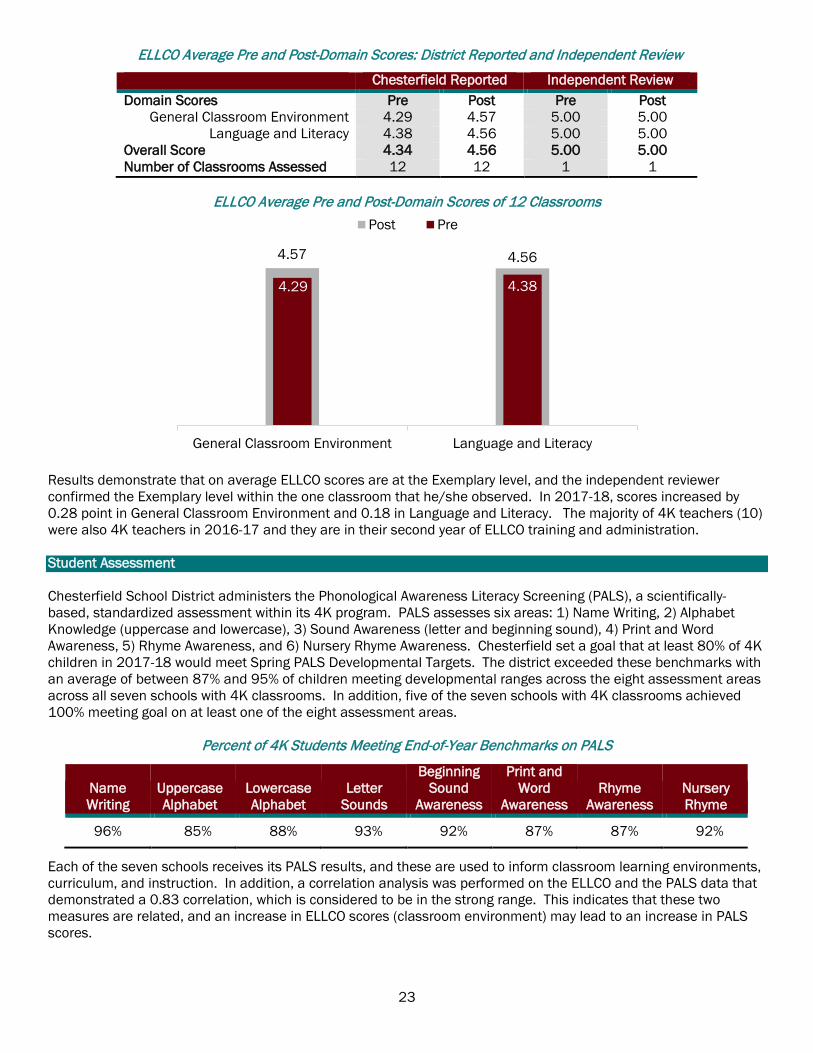
ELLCO Average Pre and Post-Domain Scores: District Reported and Independent Review
Chesterfield Reported Independent Review Domain Scores Pre Post Pre Post
General Classroom Environment 4.29 4.57 5.00 5.00 Language and Literacy 4.38 4.56 5.00 5.00
Overall Score 4.34 4.56 5.00 5.00 Number of Classrooms Assessed 12 12 1 1
ELLCO Average Pre and Post-Domain Scores of 12 Classrooms
Results demonstrate that on average ELLCO scores are at the Exemplary level, and the independent reviewer confirmed the Exemplary level within the one classroom that he/she observed. In 2017-18, scores increased by 0.28 point in General Classroom Environment and 0.18 in Language and Literacy. The majority of 4K teachers (10) were also 4K teachers in 2016-17 and they are in their second year of ELLCO training and administration. Student Assessment Chesterfield School District administers the Phonological Awareness Literacy Screening (PALS), a scientifically-based, standardized assessment within its 4K program. PALS assesses six areas: 1) Name Writing, 2) Alphabet Knowledge (uppercase and lowercase), 3) Sound Awareness (letter and beginning sound), 4) Print and Word Awareness, 5) Rhyme Awareness, and 6) Nursery Rhyme Awareness. Chesterfield set a goal that at least 80% of 4K children in 2017-18 would meet Spring PALS Developmental Targets. The district exceeded these benchmarks with an average of between 87% and 95% of children meeting developmental ranges across the eight assessment areas across all seven schools with 4K classrooms. In addition, five of the seven schools with 4K classrooms achieved 100% meeting goal on at least one of the eight assessment areas.
Percent of 4K Students Meeting End-of-Year Benchmarks on PALS
Each of the seven schools receives its PALS results, and these are used to inform classroom learning environments, curriculum, and instruction. In addition, a correlation analysis was performed on the ELLCO and the PALS data that demonstrated a 0.83 correlation, which is considered to be in the strong range. This indicates that these two measures are related, and an increase in ELLCO scores (classroom environment) may lead to an increase in PALS scores.
4.57 4.56
4.29 4.38
General Classroom Environment Language and Literacy
Post Pre
Name Writing
Uppercase Alphabet
Lowercase Alphabet
Letter Sounds
Beginning Sound
Awareness
Print and Word
Awareness Rhyme
Awareness Nursery Rhyme
96% 85% 88% 93% 92% 87% 87% 92%
24
Partnerships Chesterfield School District has facilitated partnerships across district programs in addition to developing partnerships with community organizations and national organizations. Through a multi-tiered approach, Chesterfield School District has coordinated early learning efforts. The district has expanded its 4K program to include seven state-funded classrooms and five district-funded classrooms serving approximately 240 4K students within seven schools. The district has enhanced its summer reading programs across the district including 4K and 5K providing nine books to all students in 4K through Grade 5. The district has adopted ELLCO as a measure of classroom quality and teacher-child interactions within 4K and 5K classrooms and all applicable principals and literacy coaches have been trained in this measure. The district offers Reading Recovery to Grade 1 students who demonstrate need. Out-of-district partnerships have been developed with Head Start to include their teachers in professional development and provide books to children in their 4K program. Chesterfield has secured additional partnerships with Central High School, which has an early childhood education course, Teacher Cadets, and an early education/child care program for 3- and 4-year olds called Eagle’s Nest. In addition, the district is partnering with Northeastern Technical College’s early education program to effectively prepare early childhood educators. Finally, the district is involved in a national partnership with Waterford, which includes the 4K children and their families. This partnership includes personalized learning via computer software and online programming for young children.
Partnerships Developed or Expanded based on Community Block Grant
Sustainability Chesterfield County School District has sustained two classrooms based on state funding that were originally funded with Community Block Grant funds for the 2017-18 academic year. In addition, the district has converted another district-funded, part-day classroom into a full-day 4K classroom based on community need. While they had to reduce the number of books distributed for children’s home libraries from 50 to 22, the district continues to develop the home libraries of 4K children to align with what they are reading in school. The district has continued to use ELLCO within the 12, 4K and 22, 5K classes within the district. Scalability The following aspects of Chesterfield School District’s initiatives through the Community Block Grant funding: • Use of teacher-child interaction measure across 4K and 5K to inform practice,
encourage smooth transition from 4K to 5K, create professional improvement networks through common framework, and determine books and other materials to improve classroom climate
• Focus on repeated reading approach where children read and reflect on the same books within and outside of the classroom. Classroom libraries are carefully designed based on ELLCO results and high-quality reading materials that reflect diverse perspectives. Children receive some these same book titles for their home library.
• Coordinated district-wide approach to 4K and 5K using common measures, repeated reading approach, summer learning, Waterford personalized learning, and offering Reading Recovery at first grade for students with additional needs
Organization Partnership Role
Head Start in Cheraw and Pageland Teacher professional development; family literacy workshops, classroom libraries, book distribution
Central High School and Eagle’s Nest Child Development Center Teacher Cadets and collaboration with child development center
Northeastern Technical College Early childhood education certificate/degree programs
Waterford Early Learning Initiative Personalized learning via software and online platform piloted in 4K classrooms in 2017-18
Leveraging Funds:
Chesterfield County School District
leveraged state funds, district funds, and
outside partnerships to increase its focus on expanding its 4K
program and providing children with literacy-rich school and home
environments.

25
Project Summary Lancaster County School District received Community Block Grant funds to leverage in the development and implementation of a comprehensive early childhood education initiative modeled on Harlem Children’s Zone. The partnership includes Lancaster County School District, Lancaster County First Steps, Head Start, and the Children’s Council. Goals for this funding include: • Goal 1: Expand 4K calendar to include 35 additional days • Goal 2: Implement 9-week Baby College with fidelity to the
model employed by the Harlem Children’s Zone • Goal 3: Facilitate comprehensive early care service
continuum through Baby College, 4K, and Countdown to Kindergarten
The partnership, which met as a full group six times during 2017-18, focuses on a 20-year plan centered on partnerships, data, and evidence-based or best practices. The goals for this funding include focus on 4K and transition to 5K.
Schools Teachers Classrooms Children
1 4 2 40
Using the Baby Basics prenatal curriculum and Baby Blocks curriculum for 0-3-year-old children used in Harlem Children’s Zone, Baby College was piloted through a series of Saturday seminars. This shaped the strategy for the 9-week training program to be offered in 2018. In addition, Lancaster County School District extended the school year by 35 days for 4K students enrolled at Clinton Elementary during the 2017 summer. The summer expansion was staffed by certified teachers and instructional assistants. The partnership is preparing to submit a proposal for the U.S. Department of Education’s Promise Neighborhood Program to realize the goals of the 20-year plan and fund to scale the approaches used in Harlem Children’s Zone.
SC Child Early Reading and Development Education Program Community Block Grants for Education Pilot Program
2016-17 Cohort
Lancaster County School District
Grant Overview
As a new grant recipient, Lancaster County School District was awarded $164,000 in 2016-17. This funding contributed to a larger initiative replicating strategies applied within the Harlem Children’s Zone. Project Highlights
Piloted Baby College, intensive 9-week parenting program, with 40 expectant parents and parents of 0-3-year-olds
6 people trained by Brazelton Touchpoints Center at Boston University Hospital/Harvard Medical focused on understanding theory behind Touchpoints, enhancing delivery of care to families and effective practices
6 meetings of Promise Neighborhoods Committee with focus on early care and education continuum for parents and children ages 0-5
Served 30 4K students with 35 additional days within the school calendar for 4K transition to 5K
Served 40 4K students during academic year
Partnership with Lancaster County First Steps to coordinate services across 4K settings within the community
Expanded Countdown to Kindergarten initiative by serving 35 new families
For project specific questions: Paul McKenzie
Director, Research and Development Lancaster County School District
26
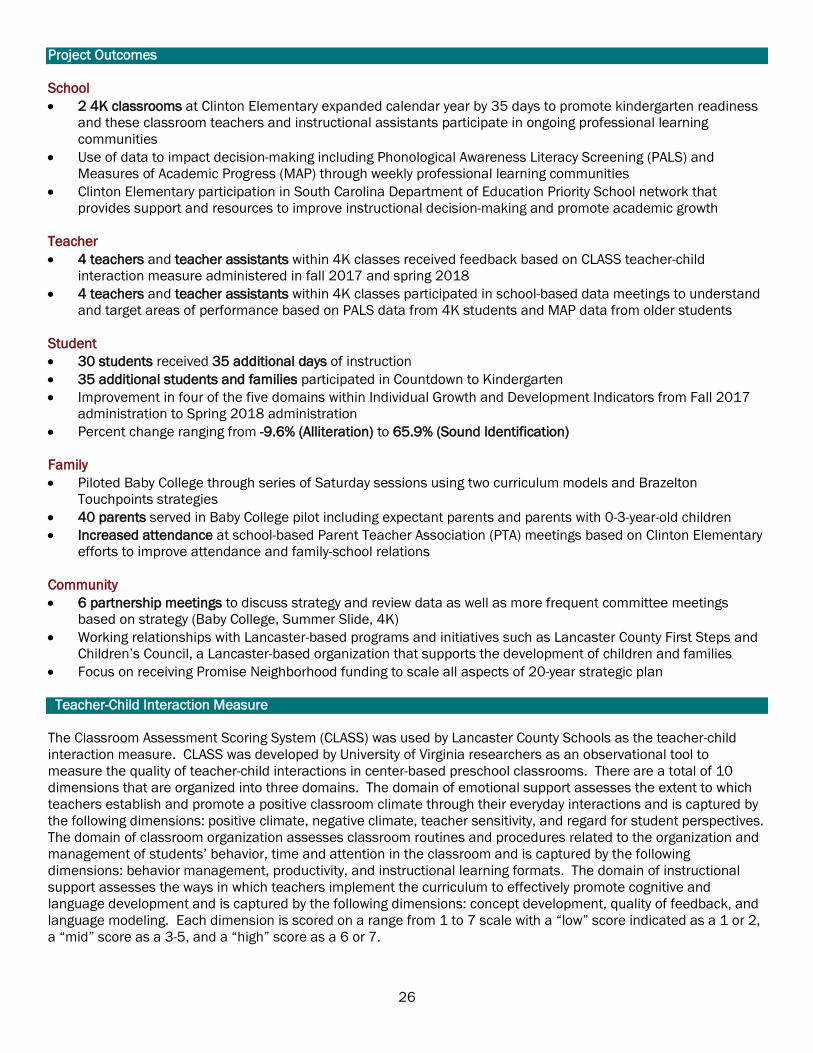
Project Outcomes School • 2 4K classrooms at Clinton Elementary expanded calendar year by 35 days to promote kindergarten readiness
and these classroom teachers and instructional assistants participate in ongoing professional learning communities
• Use of data to impact decision-making including Phonological Awareness Literacy Screening (PALS) and Measures of Academic Progress (MAP) through weekly professional learning communities
• Clinton Elementary participation in South Carolina Department of Education Priority School network that provides support and resources to improve instructional decision-making and promote academic growth
Teacher • 4 teachers and teacher assistants within 4K classes received feedback based on CLASS teacher-child
interaction measure administered in fall 2017 and spring 2018 • 4 teachers and teacher assistants within 4K classes participated in school-based data meetings to understand
and target areas of performance based on PALS data from 4K students and MAP data from older students
Student • 30 students received 35 additional days of instruction • 35 additional students and families participated in Countdown to Kindergarten • Improvement in four of the five domains within Individual Growth and Development Indicators from Fall 2017
administration to Spring 2018 administration • Percent change ranging from -9.6% (Alliteration) to 65.9% (Sound Identification)
Family • Piloted Baby College through series of Saturday sessions using two curriculum models and Brazelton
Touchpoints strategies • 40 parents served in Baby College pilot including expectant parents and parents with 0-3-year-old children • Increased attendance at school-based Parent Teacher Association (PTA) meetings based on Clinton Elementary
efforts to improve attendance and family-school relations
Community • 6 partnership meetings to discuss strategy and review data as well as more frequent committee meetings
based on strategy (Baby College, Summer Slide, 4K) • Working relationships with Lancaster-based programs and initiatives such as Lancaster County First Steps and
Children’s Council, a Lancaster-based organization that supports the development of children and families • Focus on receiving Promise Neighborhood funding to scale all aspects of 20-year strategic plan Teacher-Child Interaction Measure The Classroom Assessment Scoring System (CLASS) was used by Lancaster County Schools as the teacher-child interaction measure. CLASS was developed by University of Virginia researchers as an observational tool to measure the quality of teacher-child interactions in center-based preschool classrooms. There are a total of 10 dimensions that are organized into three domains. The domain of emotional support assesses the extent to which teachers establish and promote a positive classroom climate through their everyday interactions and is captured by the following dimensions: positive climate, negative climate, teacher sensitivity, and regard for student perspectives. The domain of classroom organization assesses classroom routines and procedures related to the organization and management of students’ behavior, time and attention in the classroom and is captured by the following dimensions: behavior management, productivity, and instructional learning formats. The domain of instructional support assesses the ways in which teachers implement the curriculum to effectively promote cognitive and language development and is captured by the following dimensions: concept development, quality of feedback, and language modeling. Each dimension is scored on a range from 1 to 7 scale with a “low” score indicated as a 1 or 2, a “mid” score as a 3-5, and a “high” score as a 6 or 7.

27
Two 4K classrooms within one elementary school were assessed using CLASS, and one of these classrooms was also assessed by an independent reviewer. CLASS was selected by Lancaster County School District as the teacher-child interaction measure based on its use by Lancaster County First Steps within Early Head Start and Head Start classrooms.
CLASS Average Pre- and Post-Domain Scores: District Reported and Independent Review
Lancaster Reported Independent Review Domain Scores Pre Post Pre Post
Emotional Support 6.95 7.0 6.25 6.25 Classroom Organization 5.85 6.3 5.33 6.00
Instructional Support 3.60 3.5 5.00 5.00 Number of Classrooms Assessed 2 2 1 1
CLASS Average Pre and Post-Domain Scores of Two Classrooms
Results demonstrate that the two classrooms improved in the Emotional Support and Classroom Organization domains. The Instructional Support, the lowest scoring domain, stayed relatively stable from Fall 2017 to Spring 2018. The classrooms are demonstrating high performance within two of the three domains of CLASS. Student Assessment Lancaster County School District administers the Individual Growth and Development Indicators (IGDI) within its 4K classrooms. IGDI subtests include: 1) Picture Naming (oral language and vocabulary), 2) Rhyming (phonological awareness), 3) Alliteration (phonological awareness) 4) Sound Identification (alphabet knowledge), 5) “Which One Doesn’t Belong” (comprehension). Alliteration is only administered at mid-year and end-of-year testing. Each of the five subscales has separate assessment protocols for three testing occasions (i.e., fall, winter, and spring). Teachers administer IGDI directly to children. Lancaster County School District administered IGDI in Fall 2017, Winter 2018, and Spring 2018. The percent change based on the five domains ranged from -9.6 (Alliteration) to +65.9 (Sound Identification).
Percent Change by IGDI Domain from Fall 2017 to Spring 2018
76.3
3.5
6.95
5.85
3.6
Emotional Support Classroom Organization Instructional Support
Post Pre
Picture Naming Rhyming Alliteration Sound ID WODB
+24.5% change +16.8 change -9.6% change +65.9% change +30.4% change

28
In addition, Lancaster County School District explored the Kindergarten Readiness Assessment (KRA) scores of children who participated in 4K and those who did not. KRA scores are grouped by three categories to indicate the level of school readiness across each domain and the overall assessment: Emerging, Approaching, and Demonstrating. The Demonstrating category requires a score of 270. The mean scores on the KRA for children who attended 4K the previous year was 263 compared to a mean score of 256 for those who did not attend a district-based 4K program. Partnerships Strong partnerships with community organizations including Head Start, First Steps, and the Children’s Council are central to this initiative in Lancaster County. Lancaster County School District partners with First Steps (Dolly Parton Imagination Library) and Reach Out and Read Carolinas related to ensuring print-rich early learning environments prior to school entry. Approximately 72 children are served through an Early Head Start program at Southside Child Development Center, which partners with Lancaster County First Steps and Lancaster County School District related to professional development, resources, and awareness of 4K programs. In addition, the partners meet regularly as a full group and within committees to analyze data, refine strategies, and explore resources to expand and sustain its vision.
Partnerships Developed or Expanded based on Community Block Grant
Organization Partnership Role
Children’s Council (non-profit, community organization focused on children’s wellbeing)
Baby College development and facilitation; trained in Brazelton’s TouchPoints, an evidence-based program informed by adult learning theory, behavioral change, and self-care, and using Baby Basics (prenatal) and Baby Block (0-3 year old) curriculum for parenting programs
Lancaster County First Steps Connection to early care and education; Countdown to Kindergarten; CLASS administration; assessment of early care and availability of high-quality care in 2018 based on partnership
Early Head Start/Head Start Partner for professional development; use of CLASS to gauge teacher-child interactions; focus on transitions
Lancaster Pride (community organization) Partner with Clinton Elementary to beautify homes of families within the school’s attendance zone and providing smoke detectors and other safety services to families
Reach Out and Read Carolinas (regional organization through national initiative)
Medical practices/clinics provide books to families and discuss importance of early literacy, Baby College, 4K, and other early literacy initiatives
Sustainability Lancaster County School District is preparing an application for the US Department of Education’s Promise Neighborhood grant competition, which is scheduled to be released in Summer 2018. The school district has received pledges and donations to match the grant funding, if it is received. Lancaster County School District and its partners have also worked together to effectively use current funding streams to collaborate on its systems-based early childhood approach.
29
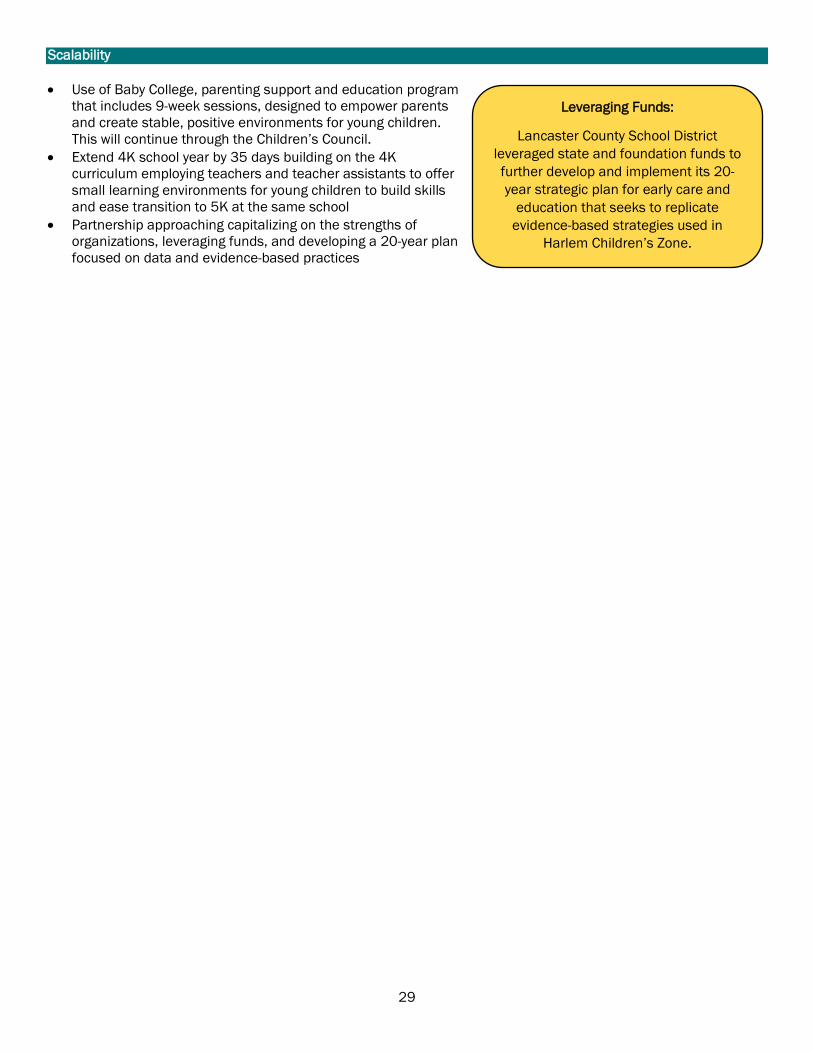
Scalability • Use of Baby College, parenting support and education program
that includes 9-week sessions, designed to empower parents and create stable, positive environments for young children. This will continue through the Children’s Council.
• Extend 4K school year by 35 days building on the 4K curriculum employing teachers and teacher assistants to offer small learning environments for young children to build skills and ease transition to 5K at the same school
• Partnership approaching capitalizing on the strengths of organizations, leveraging funds, and developing a 20-year plan focused on data and evidence-based practices
Leveraging Funds:
Lancaster County School District leveraged state and foundation funds to further develop and implement its 20-year strategic plan for early care and
education that seeks to replicate evidence-based strategies used in
Harlem Children’s Zone.

30
Project Summary Lexington School District 4 received $201,000 in funds to implement initiatives related to social and emotional growth and language and literacy in 4K settings at the Early Childhood Center (ECC). The primary grant goals were: • Goal 1: Supporting high quality social and emotional
environments and literacy environments in 4K settings. • Goal 2: Supporting families to identify, understand, and
alleviate mental health needs.
The following tasks were conducted to move towards project goals: • Task 1: Ongoing professional development from the Center
on the Social and Emotional Foundations for Early Learning (CSEFEL) using the Teaching Pyramid model;
• Task 2: Training and implementation of the Teaching Pyramid Observation Tool (TPOT) to measure teacher-student interaction and the effective implementation of the Teaching Pyramid;
• Task 3: Professional development related to Mindful Schools for teachers, administrators, and teaching assistants. This training and supporting materials specifically targeted those working in education in the development of mindful awareness as a strategy in reduction of toxic stress, an increase in emotional regulation, and improvement in sustained attention, focus and executive functioning. Additional professional development was provided by the Children's Trust of SC for all 4K teachers regarding Adverse Childhood Experiences.
• Task 4: Hiring an on-site Lexington County Mental Health counselor, providing mental health services and intensive intervention, as appropriate, for the at-risk four-year-old population and their families.
SC Child Early Reading and Development Education Program Community Block Grants for Education Pilot Program
2016-17 Cohort
Lexington County School District 4
Schools Teachers Classrooms Children Families
1 70 30 624 1800
Grant Overview As a new grant recipient, Lexington School District 4 was awarded funds in the amount of $201,000. Project Highlights Served 624 children in 4K and multiage
Montessori settings with focus on Pyramid Model and Mindful Schools practices
Supported 30 classrooms with 60 teachers and teacher assistants through ongoing professional development and instructional coaching
Conducted 28 formal professional development activities with teachers, teacher assistants, administrators, and staff (including mental health counselor and social service worker in the school) with a total of 70 participants
Mental Health counselor supported 10 families through ongoing cases
Served 1,800 family members through monthly family events at the Early Childhood Center
Implemented TPOT assessment in 7 classrooms that served 154 students
Formed strong partnerships among Lexington School District 4, Lexington County Mental Health, and Children’s Trust of South Carolina
For project specific questions:
Lisa Evans Principal of Early Childhood Center Lexington County School District 4

31
Project Outcomes School • 100% of 4K and 5K classrooms participated in ongoing professional development geared towards supporting
mental health and developing a positive literacy environment geared towards social and emotional growth
Teacher • 70 4K teachers and 5K teachers and teacher assistants across 30 classrooms participated in ongoing
professional development with sessions focusing on the Teaching Pyramid Model • 70 teachers participated in additional professional development related to creating mindful schools and
understanding the influence of Adverse Childhood Experiences on young children’s development • 7 classrooms assessed with TPOT assessment to understand the influence of the Teaching Pyramid Model on
teacher/child interactions in early learning settings
Student • 624 students across all 4K and 5K settings (including multi-age classrooms) were served through the Teaching
Pyramid Model implementation • 154 students were included in TPOT assessments with 7 classrooms at the Early Childhood Center • TPOT data showed zero red flags across post assessments in 7 classrooms at the Early Childhood Center,
showing improvement of teacher perceptions related to classroom management and behavioral concerns in the classroom
Family • 1800 total family participants attended 9 monthly events (approximately 200 at each event- attendance could
have been repeated) coordinated by the Mental Health counselor and school counselor to provide support related to increasing quality literacy practices while understanding issues of mental health and adverse child effects (ACEs)
• 10 families were served throughout the year by a Mental Health counselor that was housed onsite at the Early Childhood Center through a partnership with Lexington County Mental Health
Community • Sustainable partnerships developed with Lexington School District 4, Lexington County Mental Health, and
Children’s Trust South Carolina led to a mental health counselor on site, which allowed for increased support with at risk families and a coordinated effort to meet the needs of all families through ongoing family events
Teacher-Child Interaction Measure The Teaching Pyramid Observation Tool for Preschool Classrooms (TPOT) was used by Lexington School District 4 to assess the influence of the Teaching Pyramid Model on early learning settings. TPOT was developed at two national centers: The Center on the Social and Emotional Foundations for Early Learning (CSEFEL) and the Technical Assistance Center on Social Emotional Interventions (TACSEI). It was designed to measure the extent to which teachers are implementing the 3-tiered Pyramid Model of individualized practices that support children’s social competence and prevent challenging behaviors. Administration time for each classroom is approximately 2.5 hours, which includes observation and interview. There are three subscales: Key Practices, Red Flags, and Responses to Challenging Behavior. The Key Practice subscale includes 114 indicators that are scored a yes or no (e.g., supportive conversations, collaborative teaming, and connecting with families). Total scores represent the percentage of practice indicators observed. The Red Flag subscale includes 17 items that are scored a yes or no (e.g., chaotic transitions, children threatened with negative consequence, and lack of student engagement in group activities). Total scores represent the percentage of red flags marked. The Responses to Challenging Behavior subscale includes 3 essential strategies for responding to challenging behaviors and 3 optional strategies. Total scores represent the total number of challenging behavior incidents (e.g., physical aggression, verbal aggression, and noncompliant statements).
The TPOT was implemented in 1 school in 7 classrooms with 154 students across the classrooms. Classrooms were assessed by district representatives trained in TPOT (the entire administrative team including principal, assistant principal, instructional coach, and school counselor were trained on the TPOT). The independent reviewer scored

32
one classroom in the fall and the spring using TPOT. Assessors met with teachers following pre and post TPOT implementation to discuss findings and make plans for support through instructional coaching. Key practices are related to the implementation of practices aligned with the Teaching Pyramid model that are grounded in social and emotional support for young children. Key practices increased across the 7 classrooms from 54% to 73% following Teaching Pyramid professional development. Red flags indicated practices that are in contradiction to the Teaching Pyramid model. Instances of red flags decreased from 22% to 0% across the 7 classrooms.
TPOT Average Pre and Post-Domain Scores: District Reported and Independent Review Lexington 4 Reported Independent Review Domain Pre Post Pre Post
Key Practices 54% 73% 67% 67% Red Flags 22% 0% 0% 0%
Challenging Behaviors 3 0 0 0 Number of Classrooms Assessed 7 7 1 1
TPOT Average Pre- and Post-Domain Scores for 7 Classrooms
While individual teacher level data was not required for the external evaluation, the administrative team at the Early Childhood Center examined individual teacher level data to make decisions regarding professional development and ongoing instructional support.
54%
22%
3
73%Key Practices
Red Flags
Challenging Behaviors
Pre Post

33
Percentage of Indicators Observed per TPOT Item
Student Outcomes Lexington School District 4 administers the Individual Growth and Developmental Indicators (IGDI) to all 4K students in the district. IGDI subtests include: 1) Picture Naming (oral language and vocabulary), 2) Rhyming (phonological awareness), 3) Sound Identification (alphabet knowledge), 4) “Which One Doesn’t Belong” (comprehension), and 5) Alliteration (phonological awareness). The assessment developers recommend that Alliteration only be administered at mid-year and end-of-year testing (spring). Each of the five subscales has separate assessment protocols for three testing occasions (i.e., fall, winter, and spring). Teachers administer IGDI directly to children. Lexington School District 4 worked in conjunction with the University of South Carolina to implement the Behavioral and Emotional Screening System (BESS) to examine changes in social and emotional growth as a result of grant activities. This screening examines risks in behavioral or emotional development. Children who score under 60 on this screening exhibit normal or little risk. Those scoring between 60-70 exhibit an elevated risk. Those scoring 71 and above are at an extremely elevated risk for behavioral or emotional concerns. In Spring 2018, 528 children were assessed with the BESS. The end-of-year results are presented in the table below and show a majority of children at the Early Childhood Center displayed a normal risk level while only 8% displayed levels that are considered extremely elevated, indicating positive results overall.
End-of-Year BESS Screening Results
Risk Level Number Percentage Normal 381 72% Elevated 104 20% Extremely Elevated 43 8%
0% 20% 40% 60% 80% 100%
Schedules, routines, and activities
Transitions between activities
Supportive conversations
Promoting children’s engagement
Providing directions
Collaborative teaming
Teaching behavior expectations
Teaching social skills and emotional competencies
Teaching friendship skills
Teaching children to express emotions
Teaching problem solving
Intervention for children with persistent challenging behavior
Connecting with families
Supporting Family use of the Pyramid Model Practices
Key Practice Item Subscale
TPOT 1 TPOT 2

34
Partnerships The 2016-17 Community Block Grant allowed for the development of strong partnerships between Lexington School District 4, Children’s Trust South Carolina, and the Lexington County Mental Health Center. In particular, housing a mental health counselor at the Early Childhood Center allowed for increased support to families across the community who are unable to drive the long distance to the nearest center. Establishing trust between families and the mental health counselor took time and required coordinated support with the administrative team to provide monthly family events that allowed for outreach in relation to literacy development and understanding of mental health issues and social and emotional development.
Partnerships Developed or Expanded based on Community Block Grants
Sustainability Lexington School District 4 will continue to support early learning environments through the Teaching Pyramid model and ongoing support through instructional coaching. They will also continue using the TPOT as a method of formative assessment. Scalability Lexington School District 4 has used the 2016-17 grant to meet the needs of 4K students and families in the district. Scaling up beyond the district limits would require an increased partnership between multiple school districts and the Lexington County Mental Health group. Discussions are underway to establish a satellite site for mental health services that is accessible to district families that are unable to travel to the current location. Plans to seek funding related to this initiative are underway.
Organization Partnership Role
Lexington County School District 4 Implemented ongoing coaching in relation to Teaching Pyramid Model and TPOT, coordinated logistics for monthly family events
Lexington County Mental Health Provided onsite counselor to support teachers and families in relation to issues surrounding mental health Coordinated content for family events with school counselor.
SC Children’s Trust Implemented professional development related to Adverse Childhood Experiences (ACEs)
USC College of Education Analysis of BESS data in relation to student outcomes as a results of Teaching Pyramid model implementation
The Pyramid Model Consortium Provided ongoing professional development on the Teaching Pyramid Model
“Start small, it was
a struggle in hindsight to
include everyone at once” (Lisa Evans,
Principal ECC)
Leveraging Funds:
Bringing a mental health counselor onsite at an early learning center
was an innovative strategy for supporting mental health in the community. According to grant
participants, many families require travel assistance to get to facilities and were, therefore, not getting the
help they needed in the past.

35
Project Summary Pee Dee Consortium is a partnership across 7 districts and Head Start focused on social-emotional development through the Pyramid Curriculum and the implementation of the Teaching Pyramid Observation Tool (TPOT) with optional poverty training. • Goal 1: Improve teacher-child interaction as indicated by a 20%
increase in TPOT scores between Fall 2017 and Spring 2018 • Goal 2: Improve student behavior as indicated by a decrease in
number of red flags observed using the TPOT and decrease in students referred to the office for behavioral concerns
• Goal 3: Facilitate a positive change in teachers’ perspective of students in poverty through training sessions with Center of Excellence to Prepare Teachers of Children of Poverty
• Goal 4: Increase teachers’ use of effective strategies when working with children in poverty
In their second year of funding, Florence 1 and 2 continued the Pyramid training and the newly added districts began initial Pyramid training. To manage the grant, a grant coordinator was hired and a leadership team of 36 educators representing all involved districts and Head Start was established. The team convened on a monthly basis. Among the members are school principals, program managers, curriculum specialists, and school coaches. Grant-related work centered on the Pyramid curriculum which is a Positive Behavioral Intervention and Support (PBIS) framework that uses systems-thinking and implementation science to build skills that support nurturing and responsive caregiving, create learning environments, provide targeted social emotional skills, and support children with challenging behavior. Teachers participated in an initial 4-day training by Professional Pyramid Consultant along with monthly refresher courses. Administrators from all except one district participated in 2-day coach training. All participating districts agreed to have their 4K classrooms assessed using the TPOT and all administrators participated in TPOT training. Training in levels 1 and 2 of the Pyramid Model was offered.
SC Child Early Reading and Development Education Program Community Block Grants for Education Pilot Program
2016-17 Cohort
Pee Dee Consortia
Schools Teachers Classrooms Children
26 234 127 1500
Grant Overview The FY 2015-16 awards to Florence 1 and 2 expanded in 2016-17 into the Pee Dee Consortia—a regional initiative that includes 7 districts and Head Start. The consortia was awarded funds in the amount of $250,000. Their grant work centered on the Teaching Pyramid Observation Tool (TPOT) and poverty training to prioritize social-emotional development. Project Highlights Served 7 districts Included at total of 15 schools Served 112 4K classrooms and 15
special needs 4K classrooms Assessed 98 classrooms Supported 234 classroom teachers and
assistant teachers Served over 1500 4-year-olds at-risk for
school failure Facilitated by a leadership team of 36
educators across the Pee Dee Funding led to at least $100,000 in
additional funding across three funders to support continued/expanded efforts
Additional funding will support portable dental, vision, and hearing screening throughout the Pee Dee
Based on the successful work, the Pee Dee Consortia is working with additional districts to extend its reach and develop partnerships across the region
For project specific questions: Floyd Creech
Director of School Readiness Florence School District One
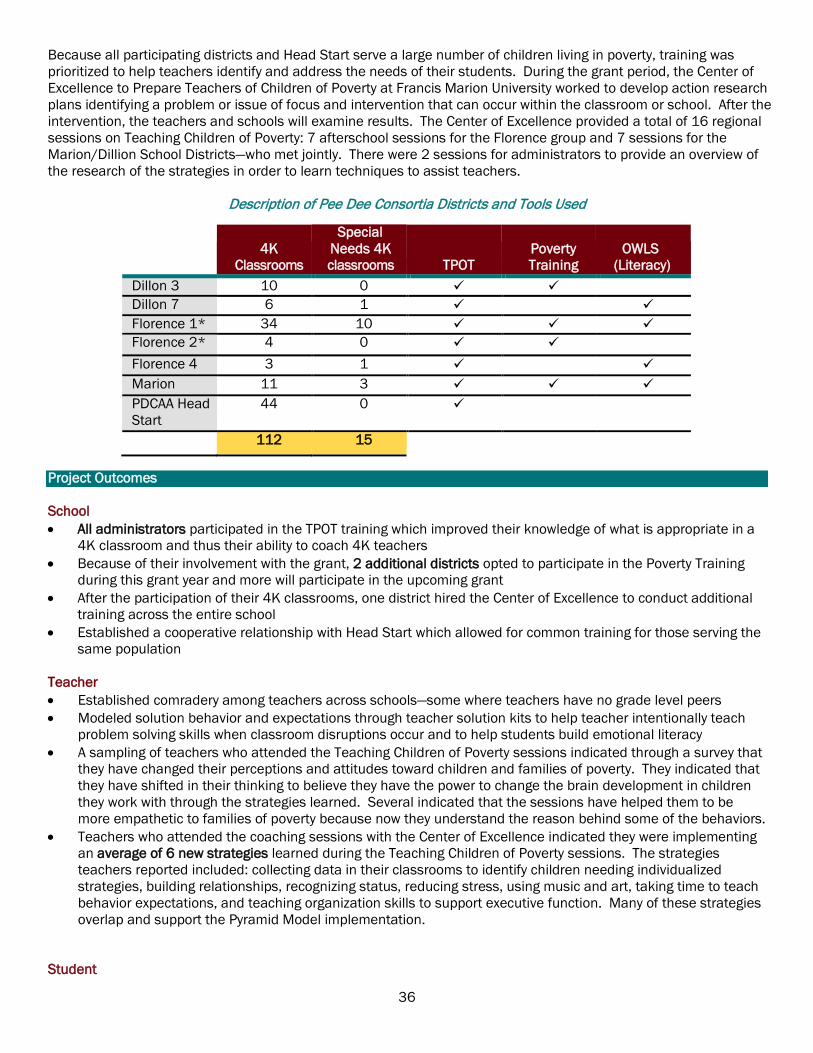
36
Because all participating districts and Head Start serve a large number of children living in poverty, training was prioritized to help teachers identify and address the needs of their students. During the grant period, the Center of Excellence to Prepare Teachers of Children of Poverty at Francis Marion University worked to develop action research plans identifying a problem or issue of focus and intervention that can occur within the classroom or school. After the intervention, the teachers and schools will examine results. The Center of Excellence provided a total of 16 regional sessions on Teaching Children of Poverty: 7 afterschool sessions for the Florence group and 7 sessions for the Marion/Dillion School Districts—who met jointly. There were 2 sessions for administrators to provide an overview of the research of the strategies in order to learn techniques to assist teachers.
Description of Pee Dee Consortia Districts and Tools Used
Project Outcomes
School • All administrators participated in the TPOT training which improved their knowledge of what is appropriate in a
4K classroom and thus their ability to coach 4K teachers • Because of their involvement with the grant, 2 additional districts opted to participate in the Poverty Training
during this grant year and more will participate in the upcoming grant • After the participation of their 4K classrooms, one district hired the Center of Excellence to conduct additional
training across the entire school • Established a cooperative relationship with Head Start which allowed for common training for those serving the
same population Teacher • Established comradery among teachers across schools—some where teachers have no grade level peers • Modeled solution behavior and expectations through teacher solution kits to help teacher intentionally teach
problem solving skills when classroom disruptions occur and to help students build emotional literacy • A sampling of teachers who attended the Teaching Children of Poverty sessions indicated through a survey that
they have changed their perceptions and attitudes toward children and families of poverty. They indicated that they have shifted in their thinking to believe they have the power to change the brain development in children they work with through the strategies learned. Several indicated that the sessions have helped them to be more empathetic to families of poverty because now they understand the reason behind some of the behaviors.
• Teachers who attended the coaching sessions with the Center of Excellence indicated they were implementing an average of 6 new strategies learned during the Teaching Children of Poverty sessions. The strategies teachers reported included: collecting data in their classrooms to identify children needing individualized strategies, building relationships, recognizing status, reducing stress, using music and art, taking time to teach behavior expectations, and teaching organization skills to support executive function. Many of these strategies overlap and support the Pyramid Model implementation.
Student
4K
Classrooms
Special Needs 4K classrooms TPOT
Poverty Training
OWLS (Literacy)
Dillon 3 10 0 Dillon 7 6 1 Florence 1* 34 10 Florence 2* 4 0 Florence 4 3 1 Marion 11 3 PDCAA Head Start
44 0
112 15

37
• 5 of the 7 total districts decreased the number of TPOT Red Flags ranging from a 2% to 4% decrease. The remaining districts did not show improvement in reduction of Red Flags, however; the majority of teachers did not have any Red Flags, scoring 0 Red Flags.
• 6 of the 7 school districts reported a decrease in the number of children referred to the office due to challenging behaviors.
Teacher-Child Interaction Measure The Teaching Pyramid Observation Tool (TPOT) was developed at two national centers: The Center on the Social and Emotional Foundations for Early Learning (CSEFEL) and the Technical Assistance Center on Social Emotional Interventions (TACSEI). It was designed to measure the extent to which teachers are implementing the 3-tiered Pyramid Model of individualized practices that support children’s social competence and prevent challenging behaviors. Administration time for each classroom is approximately 2.5 hours, which includes observation and interview. There are three subscales: Key Practices, Red Flags, and Responses to Challenging Behavior. The Key Practice subscale includes 114 indicators that are scored a yes or no (e.g., supportive conversations, collaborative teaming, and connecting with families). Total scores represent the percentage of practice indicators observed. The Red Flag subscale includes 17 items that are scored a yes or no (e.g., chaotic transitions, children threatened with negative consequence, and lack of student engagement in group activities). Total scores represent the percentage of red flags marked. The Responses to Challenging Behavior subscale includes 3 essential strategies for responding to challenging behaviors and 3 optional strategies. Total scores represent the total number of challenging behavior incidents (e.g., physical aggression, verbal aggression, and noncompliant statements). The Pyramid Curriculum played an essential role in focusing on the social development of students in the Pee Dee Consortium to improve teacher-child interactions. Administrators from all participating districts were trained to conduct classroom observations using the TPOT to help them better understand what is appropriate in a 4K classroom. Of the 98 classrooms served, 86 (or 88%) were assessed using the TPOT tool. The leadership team felt that the initial pre-assessment scores were slightly inflated and conducted a follow-up assessment with support from TPOT consultants to ensure the fidelity of the scores. All 7 districts and Head Start showed improvements on overall TPOT scores ranging from 2% to 15%. The districts that showed the most growth were those which started out with the lowest scores, therefore had more room for growth. The consortia determined that a better way to use the TPOT data was to drill down to look at growth of individual teachers and to focus in on scores on the indicators that were focused on during follow-up training sessions. After further work to analyze each district's data, to learn how many teachers in school districts scored at 75% or higher, the district compared pre and post scores. Findings indicate that in Fall of 2017 only 24% scored 75% or higher, and in Spring of 2018, 49% scored at 75% or higher, showing a 25% increase in teachers scoring 75% or higher. Additionally, the Pee Dee Consortium will be working with the developers of TPOT to determine a research-based score to set as a goal for individual teachers. Among the 7 districts, 5 decreased the number of Red Flags ranging from a 2% to 4% decrease. The remaining districts did not show improvement in reduction of Red Flags, however; the majority of teachers did not have any Red Flags, scoring 0 Red Flags. Of the 7 school districts, 6 reported a decrease in the number of children referred to the office due to challenging behaviors.
TPOT Average Pre and Post-Domain Scores: District Reported and Independent Review
Pee Dee Reported Independent Review TPOT Domains Pre Post Pre Post
Key Practices 79% 86% 61% 34% Red Flags 6.5% 3.3% 6% 0%
Challenging Behaviors 31 25 0 0% Number of Classrooms 86 85 1 1
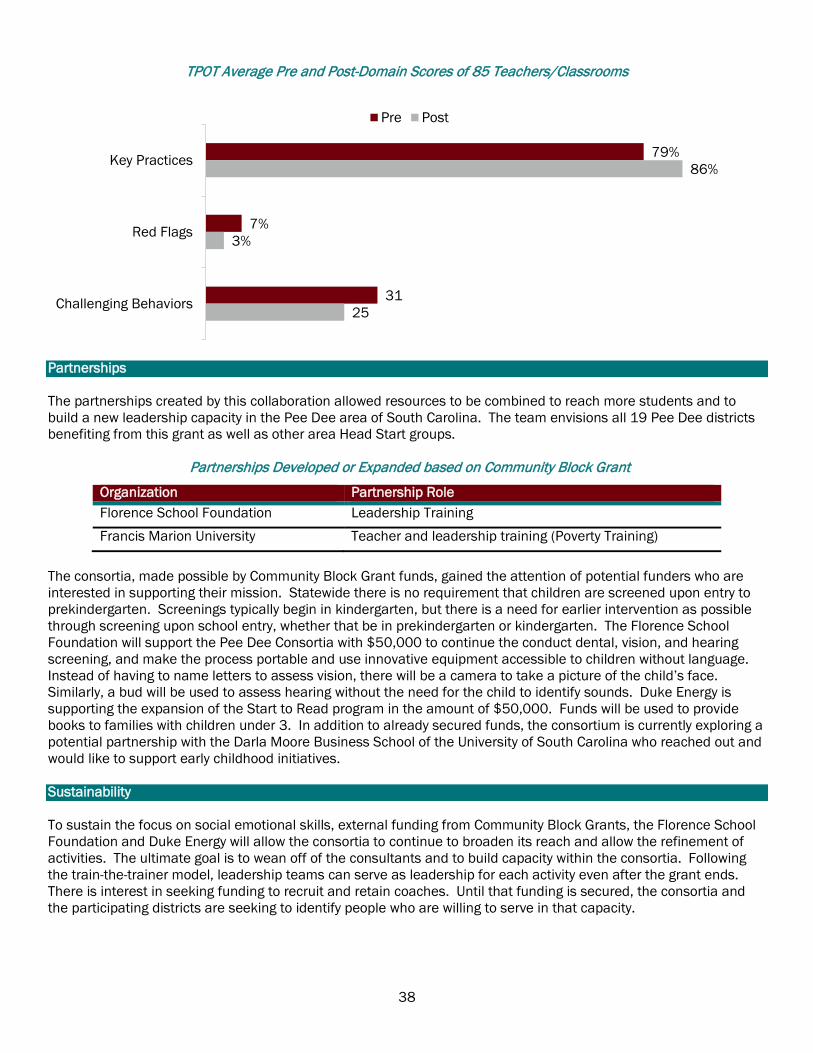
38
TPOT Average Pre and Post-Domain Scores of 85 Teachers/Classrooms
Partnerships The partnerships created by this collaboration allowed resources to be combined to reach more students and to build a new leadership capacity in the Pee Dee area of South Carolina. The team envisions all 19 Pee Dee districts benefiting from this grant as well as other area Head Start groups.
Partnerships Developed or Expanded based on Community Block Grant
Organization Partnership Role Florence School Foundation Leadership Training Francis Marion University Teacher and leadership training (Poverty Training)
The consortia, made possible by Community Block Grant funds, gained the attention of potential funders who are interested in supporting their mission. Statewide there is no requirement that children are screened upon entry to prekindergarten. Screenings typically begin in kindergarten, but there is a need for earlier intervention as possible through screening upon school entry, whether that be in prekindergarten or kindergarten. The Florence School Foundation will support the Pee Dee Consortia with $50,000 to continue the conduct dental, vision, and hearing screening, and make the process portable and use innovative equipment accessible to children without language. Instead of having to name letters to assess vision, there will be a camera to take a picture of the child’s face. Similarly, a bud will be used to assess hearing without the need for the child to identify sounds. Duke Energy is supporting the expansion of the Start to Read program in the amount of $50,000. Funds will be used to provide books to families with children under 3. In addition to already secured funds, the consortium is currently exploring a potential partnership with the Darla Moore Business School of the University of South Carolina who reached out and would like to support early childhood initiatives.
Sustainability To sustain the focus on social emotional skills, external funding from Community Block Grants, the Florence School Foundation and Duke Energy will allow the consortia to continue to broaden its reach and allow the refinement of activities. The ultimate goal is to wean off of the consultants and to build capacity within the consortia. Following the train-the-trainer model, leadership teams can serve as leadership for each activity even after the grant ends. There is interest in seeking funding to recruit and retain coaches. Until that funding is secured, the consortia and the participating districts are seeking to identify people who are willing to serve in that capacity.
79%
7%
31
86%
3%
25
Key Practices
Red Flags
Challenging Behaviors
Pre Post

39
Scalability For districts wishing to design a model similar to the Pee Dee consortia, the leadership suggests “if you focus on the social emotional you are going to get the long-term results you want.” The Pee Dee centered their innovative early childhood model on the Pyramid Curriculum and implemented the TPOT to support teachers in their ability to teach social emotional skills. This was paired with the Poverty Training. They found that the Pyramid and the Poverty Training go hand in hand. While the Pyramid supported classroom instruction, the poverty training helped them to understand their children and their families better. This allowed them to bridge the gap between school and home and ultimately impact student achievement.
Leveraging Funds:
Pee Dee Consortia expanded based on successful implementation of a 2015-16
Community Block Grant. This initiative has partnered with regional organizations including the Center of Excellence to
Prepare Teachers of Children of Poverty at Francis Marion University to maximize its capacity and has received funding from
foundations and other funders to continue and expand its work related to early
childhood social emotional development.

40
Project Summary In 2016-17, Richland County School District 1 (RSD1) was awarded Community Block Grant funds with the following goals: • Goal 1: Improve teacher-child interactions as measured by
CLASS • Goal 2: Implement Conscious Discipline as indicated by
number of strategies observed and self-reflection reports • Goal 3: Increase family engagement as indicated by 90% or
more of families in 29203 zip code participation in family engagement opportunities and parent meetings
• Goal 4: Foster strong partnerships with families and community partners to strengthen and extend students’ literacy, numeracy, and social-emotional development
RSD1’s Department of Early Childhood and University of South Carolina professors offered professional development to support an inquiry approach to learning. Teachers of 4K (11) and child care providers were equipped with research-based best practices in the area of literacy and numeracy. Activities included: (1) Teacher Academy (weeklong) to address implementation of best practices; (2) Monthly professional development for teachers and instructional assistants to support changing needs of students; and (3) Monthly on-site coaching for all staff members. To build relationships and share best practices, Richland County School District 1 hosted the first annual Early Learners Conference on Saturday, April 21, 2018 on the campus of Alcorn Middle School. Among the 200 in attendance, there were teachers, instructional assistants, parents, childcare providers, community leaders, and district personnel. The half-day conference included 17 sessions on topics such as technology, early learning standards, cultural diversity, math, parent involvement and language development.
SC Child Early Reading and Development Education Program Community Block Grants for Education Pilot Program
2016-17 Cohort
Richland County School District 1
Schools Teachers Classrooms Children
4 20 11 160
Grant Overview As a new grant recipient, Richland County School District 1 was awarded $118,000, for the first time in 2016-17. Grant work focused on the Eau Claire community with the overall goal of improving school readiness by building teacher capacity, engaging parents, and creating connections across stakeholders. Project Highlights Served 4 schools in Eau Claire cluster Supported 11 teachers and 9
instructional assistants Served 160 pre-K students across 11
classrooms Assessed 11 classrooms using CLASS Offered 12 professional development
sessions for teachers and instructional assistants
Held 17 parent engagement activities Hosted the first annual Early Learner’s
Conference with approximately 200 attendees representing teachers, instructional assistants, parents, childcare providers, community leaders, and district personnel
District support for continuing conference in future years
For project specific questions: Gina Carter
Coordinator of School Readiness and PreK Programs
Richland County School District 1 [email protected]
41
Project Outcomes Teacher • Collegiality developed among the cluster of teachers across different schools—some where teachers have no
grade level peers • Instructional assistants were able to participate in professional development opportunities due to financial
compensation for their time • During the end of year debrief, the overwhelming sentiment from both teachers and instructional assistants
was one of growth – both for teaching staff and students. Teachers and instructional assistants agreed that they had learned a new strategy that could provide student growth in ways they had not considered. All were willing to continue using inquiry-based learning, but no one felt proficient. All requested that support be continued in the upcoming school year.
• Teachers were initially reluctant to allow students to help guide their learning, but over the course of the year became more confident and proficient at guiding their students to their desired learning objective through inquiry instruction
• By the end of the project, the goal of increasing by .5 was only met in one domain out of the three CLASS domains, Emotional Support
Student • Stronger classroom dynamic because both instructional assistants and classroom teacher were participated in
professional development opportunities • On average, the 160 students in 11 classrooms demonstrated improvement across four IGDI domains • 40 students (10 from each participating school) were identified to participate in a summer camp to facilitate
kindergarten transition. They will work on topics such as first and last name recognition, letter identification, sound identification, rhyme and alliteration, comprehension and writing.
• 61 students were identified as needing more intense academic support based on their DIAL 4 scores and teacher observations. By the end of the year, 24 students were in average range and no longer needed services, 15 were referred to special services for full evaluation, 4 were referred to Successful Transitions Entering Prekindergarten, district-based initiative, to provide additional tiered interventions to promote grade-level proficiency, and 18 students remained in the delayed range after two, 6 to 8 week cycles of interventions.
Family • Increased representation from the Eau Claire Community in parent engagement activities • District moved away from the traditional Parent Educator model where each elementary school had a full-time
or a shared parent educator, to a cluster model where a group of Parent Engagement Specialists served an area's elementary, middle and high school(s). The revised model allowed families to be served at multiple levels and helped to eliminate duplicate family engagement activities for those with multiple children.
• Each cluster was allowed to create family engagement activities specific to their population. In the Eau Claire cluster of schools this helped to provide some continuity of service and establish a rapport between schools and families at multiple levels.
• The attendance across the 17 activities ranged from 4 to 200 families represented • Parents think more holistically about learning and see success beyond rote memory based on reports from
teachers and school administrators
Community • To build relationships among stakeholder and to share best practices in early learning, Richland County School
District hosted the first annual Early Learners Conference on the campus of Alcorn Middle School. Among the 200 attendees were teachers, instructional assistants, parents, childcare providers, community leaders, and district personnel.
• Survey results from the Early Learner’s Conference showed that 99% of the respondents agreed that the conference was a successful training experience and was applicable to their job setting

42
Teacher-Child Interaction Measure The Classroom Assessment Scoring System (CLASS) was developed by University of Virginia researchers as an observational tool to measure the quality of teacher-child interactions in center-based preschool classrooms. There are a total of 10 dimensions that are organized into three domains. The domain of emotional support assesses the extent to which teachers establish and promote a positive classroom climate through their everyday interactions and is captured by the following dimensions: positive climate, negative climate, teacher sensitivity, and regard for student perspectives. The domain of classroom organization assesses classroom routines and procedures related to the organization and management of students’ behavior, time and attention in the classroom and is captured by the following dimensions: behavior management, productivity, and instructional learning formats. The domain of instructional support assesses the ways in which teachers implement the curriculum to effectively promote cognitive and language development and is captured by the following dimensions: concept development, quality of feedback, and language modeling. Each dimension is scored on a range from 1 to 7 scale with a “low” score indicated as a 1 or 2, a “mid” score as a 3-5, and a “high” score as a 6 or 7. RSD1 used the CLASS assessment tool in its entirety as designed and consulted with official CLASS consultants to identify a realistic goal of .5 points for growth. On average across all 11 classrooms and domains, Richland School District 1 teachers scored in the mid-range with a 4 at the beginning of the project. By the end of the project, the goal of increasing by .5 was only met in one domain out of the three CLASS domains, Emotional Support. There was no change with Classroom Organization and scores in instructional support decreased by .25. At the onset of the grant, the plan was to provide professional development on the and implementation in the administration of the Classroom Assessment Scoring System (CLASS) to identify areas of specific need to improve teacher-student interaction in each of the assessed domains at the beginning of the year and to celebrate growth at the end of the year. However, due to time constraints scores were provided to principals to share with teachers who were then tasked with facilitating feedback sessions. With the first year complete and plans to continue using CLASS, RSD1 is confident that they will be able to share scores with teachers earlier to design a professional development plan in the upcoming school year.
CLASS Average Pre and Post-Domain Scores: District Reported and Independent Review
Richland Reported Independent Review CLASS Domains Pre Post Pre Post
Emotional Support 4.25 5 5.25 6.00 Classroom Organization 4.5 4.5 5.33 5.67
Instructional Support 3.5 3.25 5.67 6.00 Number of Classrooms 11 11 1 1
CLASS Average Pre and Post-Domain Scores of 11 Teachers/Classrooms
4.25
4.5
3.5
5
4.5
3.25
Emotional Support
Classroom Organization
Instructional Support
Pre Post
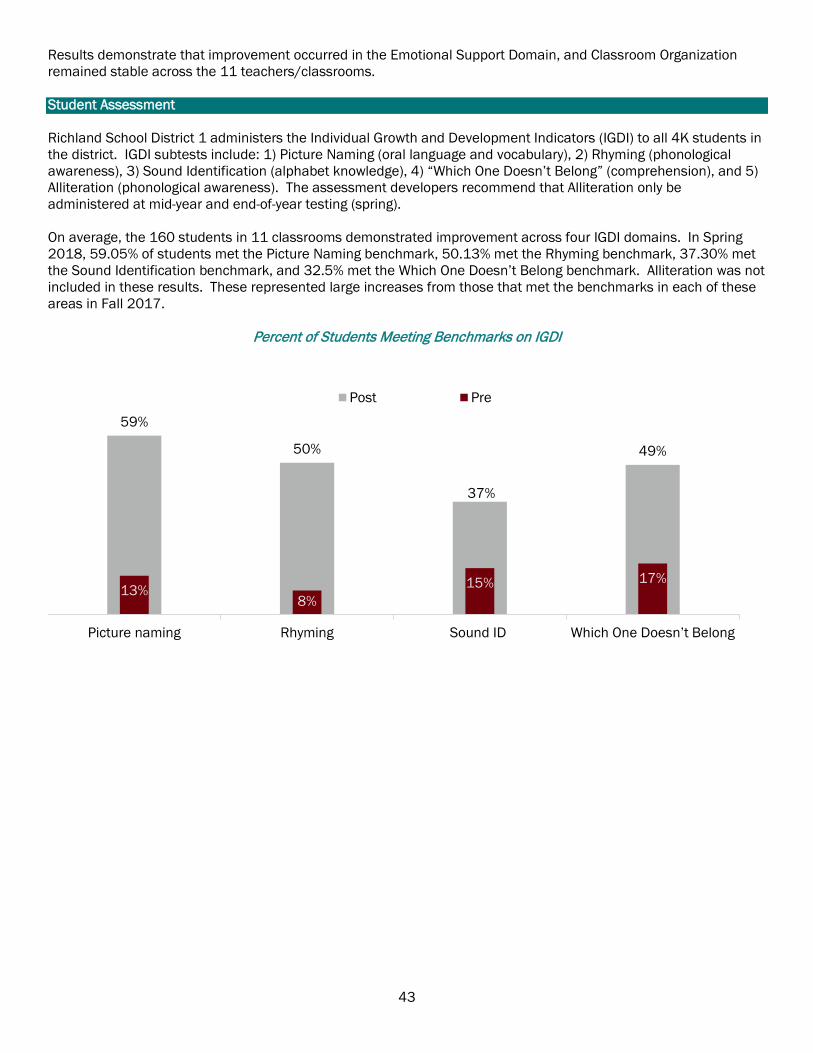
43
Results demonstrate that improvement occurred in the Emotional Support Domain, and Classroom Organization remained stable across the 11 teachers/classrooms. Student Assessment Richland School District 1 administers the Individual Growth and Development Indicators (IGDI) to all 4K students in the district. IGDI subtests include: 1) Picture Naming (oral language and vocabulary), 2) Rhyming (phonological awareness), 3) Sound Identification (alphabet knowledge), 4) “Which One Doesn’t Belong” (comprehension), and 5) Alliteration (phonological awareness). The assessment developers recommend that Alliteration only be administered at mid-year and end-of-year testing (spring). On average, the 160 students in 11 classrooms demonstrated improvement across four IGDI domains. In Spring 2018, 59.05% of students met the Picture Naming benchmark, 50.13% met the Rhyming benchmark, 37.30% met the Sound Identification benchmark, and 32.5% met the Which One Doesn’t Belong benchmark. Alliteration was not included in these results. These represented large increases from those that met the benchmarks in each of these areas in Fall 2017.
Percent of Students Meeting Benchmarks on IGDI
59%
50%
37%
49%
13%8%
15% 17%
Picture naming Rhyming Sound ID Which One Doesn’t Belong
Post Pre

44
Partnerships Richland’s overall goal was to make connections, across schools, between families and schools, and between the school and the community. In collaboration with their partners, they hosted the first annual Early Learner’s Conference that reached teachers, instructional assistants, parents, childcare providers, community leaders, and district personnel across the county.
Partnerships Developed or Expanded based on Community Block Grant
Sustainability RSD1 plans on continuing aspects from the project funded with the Community Block Grant funds. With district support the Early Learning Conference will be sustained for the second annual event. Local colleges will also be considered for partnerships. Professional development will be sustained through continued in-house training, including CLASS. RSD1 plans to continue to use the CLASS observational assessment tool to promote high quality classroom interactions. However, they will have to rely on formerly trained assessors and the use of a yearlong subscription to CLASS resources specific to each dimension and level, which also includes a database for scores to sustain attention to high quality teacher-child interactions through the next school year. Scalability With the grant funds, RSD1 aimed to improve school readiness by building teacher capacity, engaging parents, and creating connections across stakeholders. For districts seeking to model a program similar to RSD1 the key would be to focus on the connection across stakeholders. Through their work, RSD1 developed relationships with parents and families in the Eau Claire cluster, area childcare providers, community leaders, 4K teachers, and instructional coaches. Future efforts will also include local colleges and universities.
Organization Partnership Role
EdVenture Museum Provide experiential opportunities for students
Reading Matters Coalition Provide tutors in schools
Richland County First Steps
Outreach to families in school attendance zone
Richland One Office of State and Federal Programs
Offer family engagement opportunities and parent meetings through Parent Engagement Specialist
“We need all partners working hand in hand to make a real difference in
setting a stronger foundation for our early learners. Thank you for your role in helping us to build a strong foundation
through meaningful partnerships.”
– Chief of Teaching and
Leveraging Funds:
Richland School District 1 has developed partnerships and integrated early childhood
education professional development within its district priorities to improve 4K and 5K
classrooms.

45
Project Summary In 2015-16, Spartanburg School District 7, in partnership with the Spartanburg Academic Movement and Spartanburg County First Steps (herein called the Spartanburg Consortia), received a Community Block Grant to create and sustain high-quality 4K learning environments within the district. Through ongoing assessment, feedback, professional development, and technical assistance from Quality Counts, 4K teachers were able to establish and sustain high-quality learning environments for students as measured through the E3 environmental assessment and the CLASS assessment. In addition, interview data from the 2015-16 grant cycle highlighted the importance of establishing partnerships between the school district and entities that were commonly associated with child care settings external to the district (i.e. private child care). The expansion funds in the 2016-17 were used for two main foci: expand Quality Counts model to 4K classrooms across Spartanburg School District 3 and a county-wide implementation of the Early Development Instrument (EDI) to measure overall school readiness of students in Spartanburg County. The EDI was piloted in 2016 and fully implemented across the majority of the county by December 2017. Year 2 Changes To expand beyond Year 1 goals, two goals were identified for the 2016-17 grant expansion. Results in this report are mostly related to Year 2 goals. • Goal 1: Expansion of the Quality Counts Model to
Spartanburg SD 3. • Goal 2: County-wide implementation of the Early
Development Instrument (EDI).
SC Child Early Reading and Development Education Program Community Block Grants for Education Pilot Program
2016-17 Cohort
Spartanburg County School District Consortia (3 and 7)
Schools Teachers Classrooms Children EDI
5 18 9 180 2500
Grant Overview As an expanding grant recipient, Spartanburg Consortia was awarded $142,000 in 2016-17 to sustain and expand work from a 2015-16 Community Block Grant in the amount of $194,466. Project Highlights Goal 1: Expansion of Quality Counts Model While Year 1 only focused on 4K
classrooms in 1 Spartanburg 7 school and 1 Head Start classroom, Year 2 expanded the model to 4K classrooms across Spartanburg 3 (4 schools, 6 classrooms) and Spartanburg 7 (1 school, 3 classrooms)
Used results from environmental assessment (E3) and CLASS assessment to structure professional development and technical assistance
Formal professional development and ongoing technical assistance on Conscious Discipline, Creative Curriculum, STEM and mathematics practices, and center-based play
Goal 2: County-wide Implementation of EDI Assessed 2500 kindergarteners Snapshot of readiness in five domains Data analysis by UCLA; provided to
school districts in May 2018 to identify vulnerabilities across the county
29% of Spartanburg County children considered vulnerable compared to 26% in a national sample
For project specific questions: Barbara Manoski Executive Director
Spartanburg County First Steps [email protected]
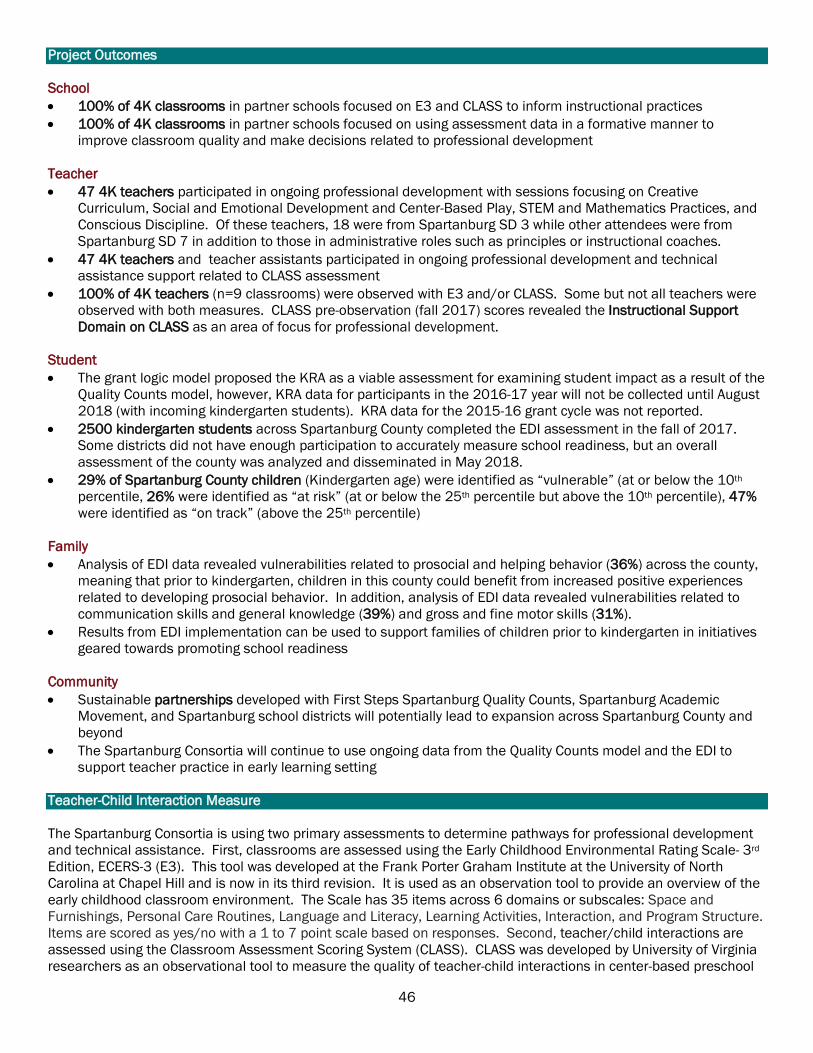
46
Project Outcomes School • 100% of 4K classrooms in partner schools focused on E3 and CLASS to inform instructional practices • 100% of 4K classrooms in partner schools focused on using assessment data in a formative manner to
improve classroom quality and make decisions related to professional development Teacher • 47 4K teachers participated in ongoing professional development with sessions focusing on Creative
Curriculum, Social and Emotional Development and Center-Based Play, STEM and Mathematics Practices, and Conscious Discipline. Of these teachers, 18 were from Spartanburg SD 3 while other attendees were from Spartanburg SD 7 in addition to those in administrative roles such as principles or instructional coaches.
• 47 4K teachers and teacher assistants participated in ongoing professional development and technical assistance support related to CLASS assessment
• 100% of 4K teachers (n=9 classrooms) were observed with E3 and/or CLASS. Some but not all teachers were observed with both measures. CLASS pre-observation (fall 2017) scores revealed the Instructional Support Domain on CLASS as an area of focus for professional development.
Student • The grant logic model proposed the KRA as a viable assessment for examining student impact as a result of the
Quality Counts model, however, KRA data for participants in the 2016-17 year will not be collected until August 2018 (with incoming kindergarten students). KRA data for the 2015-16 grant cycle was not reported.
• 2500 kindergarten students across Spartanburg County completed the EDI assessment in the fall of 2017. Some districts did not have enough participation to accurately measure school readiness, but an overall assessment of the county was analyzed and disseminated in May 2018.
• 29% of Spartanburg County children (Kindergarten age) were identified as “vulnerable” (at or below the 10th percentile, 26% were identified as “at risk” (at or below the 25th percentile but above the 10th percentile), 47% were identified as “on track” (above the 25th percentile)
Family • Analysis of EDI data revealed vulnerabilities related to prosocial and helping behavior (36%) across the county,
meaning that prior to kindergarten, children in this county could benefit from increased positive experiences related to developing prosocial behavior. In addition, analysis of EDI data revealed vulnerabilities related to communication skills and general knowledge (39%) and gross and fine motor skills (31%).
• Results from EDI implementation can be used to support families of children prior to kindergarten in initiatives geared towards promoting school readiness
Community • Sustainable partnerships developed with First Steps Spartanburg Quality Counts, Spartanburg Academic
Movement, and Spartanburg school districts will potentially lead to expansion across Spartanburg County and beyond
• The Spartanburg Consortia will continue to use ongoing data from the Quality Counts model and the EDI to support teacher practice in early learning setting
Teacher-Child Interaction Measure The Spartanburg Consortia is using two primary assessments to determine pathways for professional development and technical assistance. First, classrooms are assessed using the Early Childhood Environmental Rating Scale- 3rd Edition, ECERS-3 (E3). This tool was developed at the Frank Porter Graham Institute at the University of North Carolina at Chapel Hill and is now in its third revision. It is used as an observation tool to provide an overview of the early childhood classroom environment. The Scale has 35 items across 6 domains or subscales: Space and Furnishings, Personal Care Routines, Language and Literacy, Learning Activities, Interaction, and Program Structure. Items are scored as yes/no with a 1 to 7 point scale based on responses. Second, teacher/child interactions are assessed using the Classroom Assessment Scoring System (CLASS). CLASS was developed by University of Virginia researchers as an observational tool to measure the quality of teacher-child interactions in center-based preschool
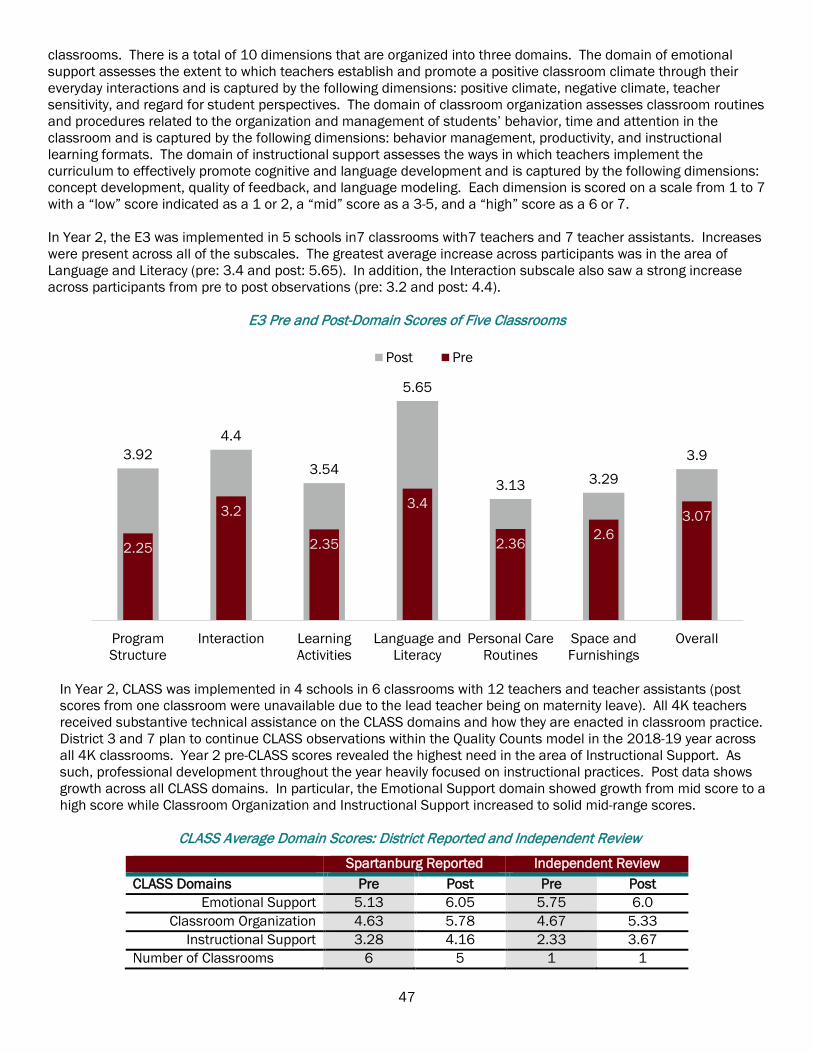
47
classrooms. There is a total of 10 dimensions that are organized into three domains. The domain of emotional support assesses the extent to which teachers establish and promote a positive classroom climate through their everyday interactions and is captured by the following dimensions: positive climate, negative climate, teacher sensitivity, and regard for student perspectives. The domain of classroom organization assesses classroom routines and procedures related to the organization and management of students’ behavior, time and attention in the classroom and is captured by the following dimensions: behavior management, productivity, and instructional learning formats. The domain of instructional support assesses the ways in which teachers implement the curriculum to effectively promote cognitive and language development and is captured by the following dimensions: concept development, quality of feedback, and language modeling. Each dimension is scored on a scale from 1 to 7 with a “low” score indicated as a 1 or 2, a “mid” score as a 3-5, and a “high” score as a 6 or 7. In Year 2, the E3 was implemented in 5 schools in7 classrooms with7 teachers and 7 teacher assistants. Increases were present across all of the subscales. The greatest average increase across participants was in the area of Language and Literacy (pre: 3.4 and post: 5.65). In addition, the Interaction subscale also saw a strong increase across participants from pre to post observations (pre: 3.2 and post: 4.4).
E3 Pre and Post-Domain Scores of Five Classrooms
In Year 2, CLASS was implemented in 4 schools in 6 classrooms with 12 teachers and teacher assistants (post scores from one classroom were unavailable due to the lead teacher being on maternity leave). All 4K teachers received substantive technical assistance on the CLASS domains and how they are enacted in classroom practice. District 3 and 7 plan to continue CLASS observations within the Quality Counts model in the 2018-19 year across all 4K classrooms. Year 2 pre-CLASS scores revealed the highest need in the area of Instructional Support. As such, professional development throughout the year heavily focused on instructional practices. Post data shows growth across all CLASS domains. In particular, the Emotional Support domain showed growth from mid score to a high score while Classroom Organization and Instructional Support increased to solid mid-range scores.
CLASS Average Domain Scores: District Reported and Independent Review
Spartanburg Reported Independent Review CLASS Domains Pre Post Pre Post
Emotional Support 5.13 6.05 5.75 6.0 Classroom Organization 4.63 5.78 4.67 5.33
Instructional Support 3.28 4.16 2.33 3.67 Number of Classrooms 6 5 1 1
3.9
3.293.13
5.65
3.54
4.43.92
2.25
3.2
2.35
3.4
2.36 2.63.07
OverallSpace andFurnishings
Personal CareRoutines
Language andLiteracy
LearningActivities
InteractionProgramStructure
Post Pre

48
CLASS Average Pre and Post-Domain Scores of 6 Classrooms
Early Development Instrument The Early Development Instrument (EDI) is a validated measure of school readiness that allows for an overall snapshot of children’s developmental progress along five domains: Physical Health and Wellbeing; Social Competence; Emotional Maturity; Language and Cognitive Development; and Communication Skills and General Knowledge. With 103 items, the EDI questionairre is completed by the classroom teacher for each kindergarten student. The EDI should be completed approximately halfway through the kindergarten year so teachers have a strong overall understanding of the child. The EDI can be analyzed using visual snapshots to show children’s developmental needs across different census tracts. In the Spartanburg implementation, maps for each of the five domains were created to show the spread of vulnerabilities across the county. These data will be used to determine how to best structure early childhood initiatives within the county. The table below shows EDI results for each domain.
Early Development Instrument Scores Overall and by Developmental Domain
Vulnerable (at or below 10th percentile)
At Risk (between 10th and 25th percentile)
On Track (above 25th percentile)
Overall Development 29% 25% 47% Physical Health and Wellbeing 11% 13% 76% Social Competence 12% 16% 72% Emotional Maturity 11% 16% 73% Language and Cognitive Development
14% 17% 68%
Communication Skills and General Knowledge
11% 17% 72%
6.055.78
4.165.134.63
3.28
Emotional Support Classroom Organization Instructional Support
Post Pre
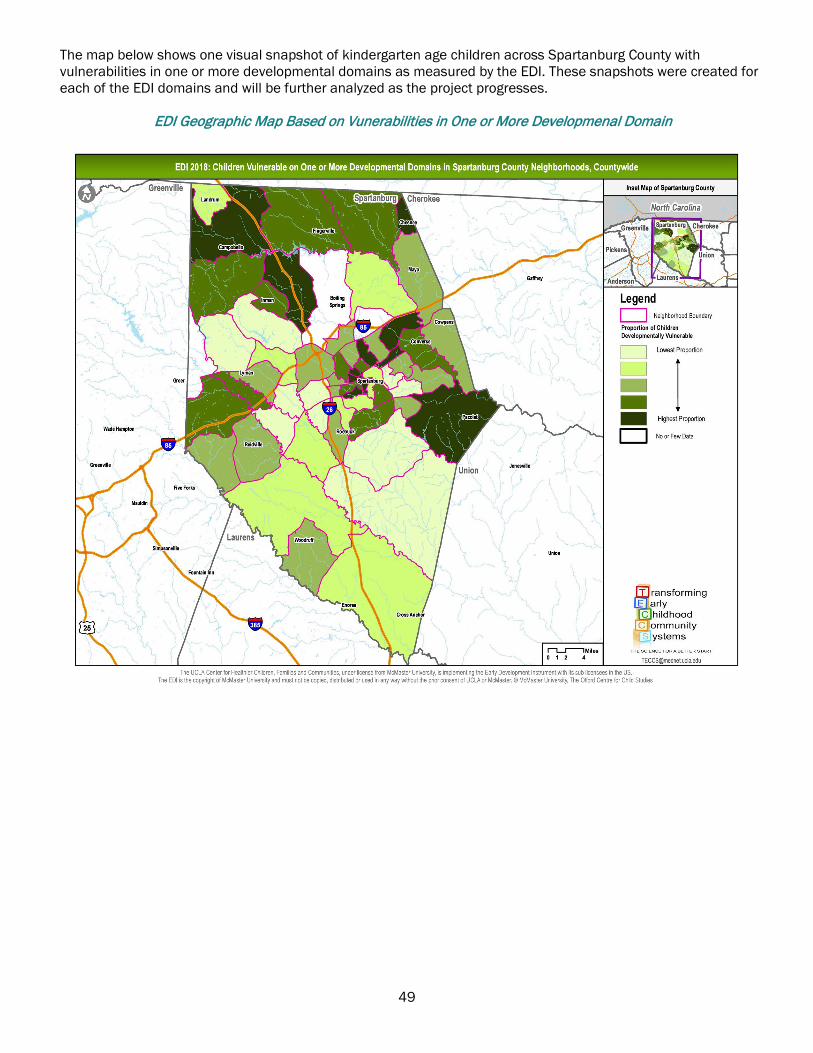
49
The map below shows one visual snapshot of kindergarten age children across Spartanburg County with vulnerabilities in one or more developmental domains as measured by the EDI. These snapshots were created for each of the EDI domains and will be further analyzed as the project progresses.
EDI Geographic Map Based on Vunerabilities in One or More Developmenal Domain

50
Partnerships The 2015-16 and 2016-17 Community Block Grant allowed for the development of strong partnerships between two Spartanburg County school districts (3 and 7) with an organization that is external to the public school system, Spartanburg County First Steps Quality Counts. Forming a solid partnership between Quality Counts and the two school districts is not an easy feat. In Year One, the biggest perceived challenge from partners at Quality Counts was entering into a partnership with the school district as it was the first time these entities worked together on a single initiative. Traditionally, Quality Counts implements their Quality Improvement and Rating System in private child care settings. “School district and individual 4K teacher needs are different than what they might need in a private child care setting” (Barbara Manoski, Quality Counts Program Director). With Spartanburg 7 acting as a model, the partnership with Spartanburg 3 was formed in Year 2 with great success. In fact, as a result of this partnership, the administration in Spartanburg 7 sought the expertise of Quality Counts when designing the kindergarten classrooms of a new school in the district that was not a part of the grant.
Partnerships Developed or Expanded based on Community Block Grant
Organization Partnership Role
Spartanburg County First Steps Implemented Quality Counts Quality Improvement and Rating System in Spartanburg 3 and continued support in Spartanburg 7
Spartanburg SD 7 Acted in a mentor role to support 4K teachers in Spartanburg SD 3 as the Quality Counts model was implemented.
Spartanburg SD 3 Worked with Quality Counts to improve early learning settings through ongoing assessment and professional development support
Spartanburg Academic Movement Spearheaded implementation and analysis of EDI across county Sustainability The Spartanburg Consortia is developing plans for sustainability by working through the Spartanburg Academic Movement to seek continued external funding from a variety of sources. In addition, there is continued discussion of including the Quality Counts Technical Assistant salary within school district budgets. In Year 3, Spartanburg SD 7 will be providing office space for Quality Counts Technical Assistants so they can meet with 4K teachers and complete paperwork in a timely manner. In terms of the EDI, it is not a required annual assessment, however plans should be secured for the next iteration in approximately three years. Scalability The following aspects of the Spartanburg Consortia’s initiatives will continue to scale-up through the Community Block Grant funding: • Use of Quality Counts Quality Improvement and Rating System
across 4K classrooms in Spartanburg 3 and 7, Head Start, and private child care
• Potentially partnering with other school districts in Spartanburg County to implement the Quality Counts model
• Continued professional development support to all 4K teachers and teacher assistants
• Continued analysis of EDI data to move towards informed policy decisions for early childhood across the county
“The grant represented a changed school climate. It was school-wide, not
just in our 4K classrooms”
(Susan Little, Assistant Superintendent,
Spartanburg 3)
Leveraging Funds:
Bringing external entities into the public school setting, particularly those that primarily work in child care is a difficult feat. The trust built through the Quality Counts
model took time, but has resulted in continued partnerships
extending beyond the grant. For example, Quality Counts acted as a consultant in designing classrooms
and purchasing furnishings and materials for the new Drayton Mills
Elementary School in SD 7.

51
SC Child Early Reading and Development Education Program Community Block Grants for Education Pilot Program
2016-17 Cohort
York School District One
Project Summary York School District One received Community Block Grant funds for a multi-faceted approach to improve school readiness among rising kindergartners and their families.
• Goal 1: Improve kindergarten readiness through summer
program options for rising kindergarteners • Goal 2: Improve recruitment of rising kindergarteners for
participation in summer program options • Goal 3: Increase opportunities for parent education and
family involvement •Goal 4: Improve 4K classroom environment and teacher-child
interactions
Schools Teachers Classrooms Children
5 28 14 280
Summer options included 1) three-week intensive summer program for 61 students, 2) Countdown to Kindergarten expansion for 10 families (45 total leveraging with First Steps funding), and 3) distribution of 145 kindergarten readiness packs. The intensive summer learning program used the district’s literacy (OWL) and mathematics (NITA Playhouse) curriculum in 5 classrooms each staffed with a teacher and teacher assistant. Classes met Monday through Thursday from 8:00am to 1:00pm. In addition, 1 parenting class per week was provided with attendance ranging from 14 to 34 parents. All students received a kindergarten readiness pack and 5 books for their home libraries. The Countdown to Kindergarten expansion included 10 additional families receiving 6 visits from teachers and parent educators, and approximately 75 families received a kindergarten readiness pack only.
Grant Overview As a new grant recipient, York School District One was awarded $84,000 in 2016-17 to focus on summer learning and kindergarten readiness strategies. Project Highlights Served 280 students through tiered
summer learning strategies or 4K classroom improvement activities
Provided intensive summer learning camp to 61 rising kindergarteners
Expanded Countdown to Kindergarten to serve 10 additional families for a total of 45 families receiving 6 visits from York School District One teachers and parent educators prior to kindergarten entry
Provided 145 kindergarten readiness packs to families with entering kindergarteners
Approximately 1200 people attended first annual Kindergarten Registration Carnival showcasing York School District One elementary schools and summer programs for rising kindergarteners
22 administrators, 4K teachers and assistant teachers attended 2-day ELLCO training
Approximately 40 people attended Night at the Museum family engagement event
For project specific questions: Lisa Spangler
Coordinator of Special Projects York School District One

52
Project Outcomes School • 22 administrators, 4K teachers, and 4K teaching assistants were trained in ELLCO in 2017-18 Teacher • ELLCO scores improved in schools by approximately 1 point on a 1-5 scale and were in the Exemplary range Student • More than 70% of students increased the number of lower-case letters that they could identify and almost 60%
increased the number of upper-case letters that they could identify by the end of the 3-week Kindergarten Kamp
• The percentage of students scoring below the 40th percentile on Measures of Academic Progress (MAP) decreased from 46.2% in 2016 to 34.5% in 2017
• The percentage of students scoring an A or higher on the Developmental Reading Assessment (DRA) increased from 44.1% in 2016 to 52.1% in 2017
Family • 3 family sessions held for families of Kindergarten Kamp participants • Approximately half (34) of Kindergarten Kamp parents attended a family session • Approximately 40 people attended Night at Museum held at York County Museum • Approximately 58% of the families who attended Night at the Museum had never visited the museum • A Countdown to Kindergarten celebration was held to celebrate entering kindergarteners and their families • 100% of families agreed or strongly agreed that Kindergarten Kamp was beneficial for their child, helped them
understand the importance of reading on a daily basis, would recommend this program for other rising kindergarteners, and felt the district should continue the program
Community • More than 1200 people attended the Kindergarten Registration Carnival held in Spring 2017 to answer
questions about kindergarten entry, provide information about summer opportunities to promote kindergarten readiness, and encourage family-school engagement
Teacher-Child Interaction Measure The Early Langague and Literacy Observation Tool (ELLCO) is used by York School District One to assess classroom environment and teacher-child interactions. ELLCO includes 19 indicators within five sections and two subscales. ELLCO uses a 1 to 5 scale with 1 being “Deficient” and 5 being “Exemplary.” District personnel received ELLCO training in Summer 2016. The district uses a train-the-trainer model to disseminate the information to principals, 4K and 5K teachers, and literacy coaches to facilitate use within these schools. The district began using this tool in the 2017-18 academic year.
ELLCO Average Domain Scores: District Reported and Independent Review
York One Reported Independent Review Domain Scores Pre Post Pre Post
General Classroom Environment 3.81 4.74 5.0 5.0 Language and Literacy 3.69 4.83 5.0 5.0
Overall Score 3.75 4.79 5.0 5.0 Number of Classrooms Assessed 3 5 1 1
Results demonstrate that on average ELLCO scores were near the Basic level (3) in Fall 2017 and moved toward the Exemplary level (5) in Spring 2018. The independent reviewer confirmed the Exemplary level within the one classroom that he/she observed. In 2017-18, scores within district assessed classrooms increased by an average of 0.93 point in General Classroom Environment and 1.04 in Language and Literacy.
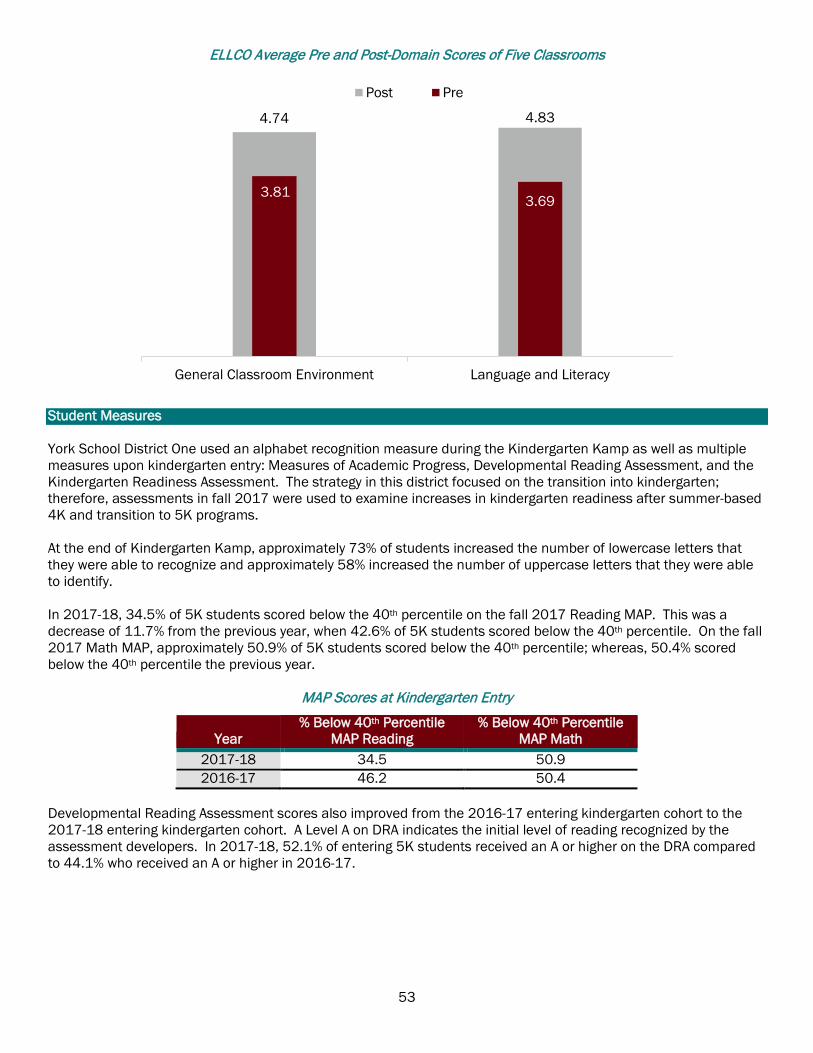
53
ELLCO Average Pre and Post-Domain Scores of Five Classrooms
Student Measures York School District One used an alphabet recognition measure during the Kindergarten Kamp as well as multiple measures upon kindergarten entry: Measures of Academic Progress, Developmental Reading Assessment, and the Kindergarten Readiness Assessment. The strategy in this district focused on the transition into kindergarten; therefore, assessments in fall 2017 were used to examine increases in kindergarten readiness after summer-based 4K and transition to 5K programs. At the end of Kindergarten Kamp, approximately 73% of students increased the number of lowercase letters that they were able to recognize and approximately 58% increased the number of uppercase letters that they were able to identify. In 2017-18, 34.5% of 5K students scored below the 40th percentile on the fall 2017 Reading MAP. This was a decrease of 11.7% from the previous year, when 42.6% of 5K students scored below the 40th percentile. On the fall 2017 Math MAP, approximately 50.9% of 5K students scored below the 40th percentile; whereas, 50.4% scored below the 40th percentile the previous year.
MAP Scores at Kindergarten Entry
Year % Below 40th Percentile
MAP Reading % Below 40th Percentile
MAP Math 2017-18 34.5 50.9 2016-17 46.2 50.4
Developmental Reading Assessment scores also improved from the 2016-17 entering kindergarten cohort to the 2017-18 entering kindergarten cohort. A Level A on DRA indicates the initial level of reading recognized by the assessment developers. In 2017-18, 52.1% of entering 5K students received an A or higher on the DRA compared to 44.1% who received an A or higher in 2016-17.
4.74 4.83
3.81 3.69
General Classroom Environment Language and Literacy
Post Pre
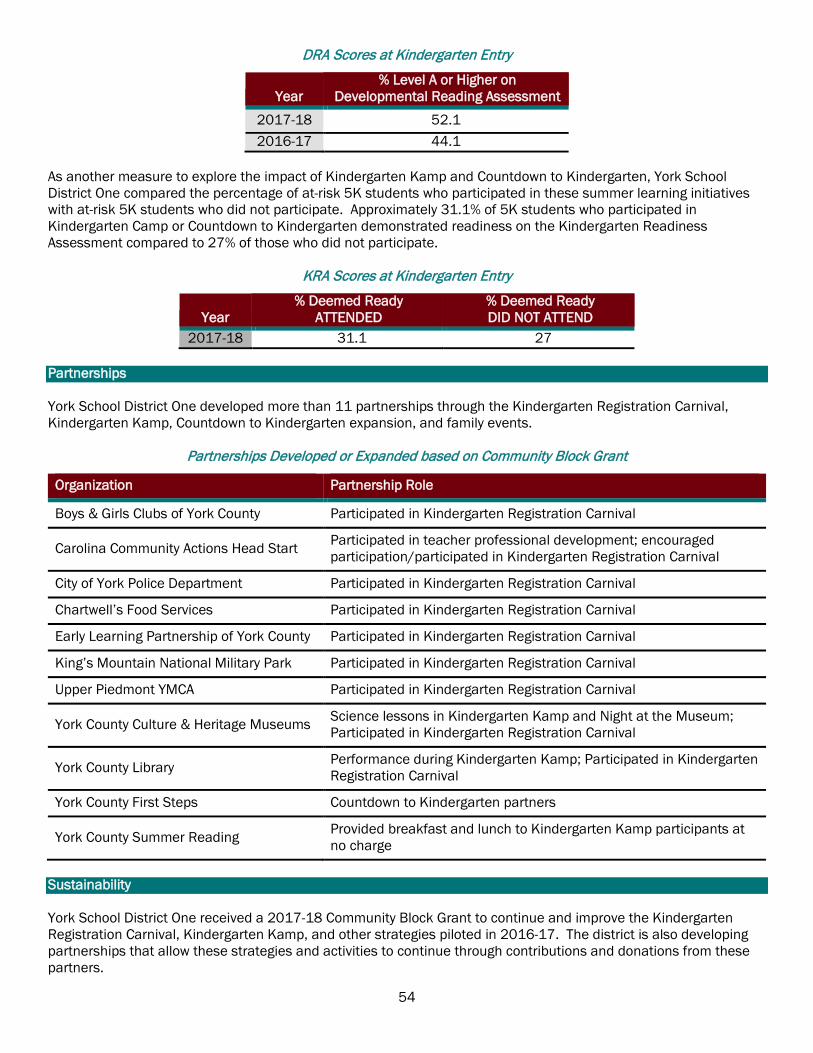
54
DRA Scores at Kindergarten Entry
Year % Level A or Higher on
Developmental Reading Assessment 2017-18 52.1 2016-17 44.1
As another measure to explore the impact of Kindergarten Kamp and Countdown to Kindergarten, York School District One compared the percentage of at-risk 5K students who participated in these summer learning initiatives with at-risk 5K students who did not participate. Approximately 31.1% of 5K students who participated in Kindergarten Camp or Countdown to Kindergarten demonstrated readiness on the Kindergarten Readiness Assessment compared to 27% of those who did not participate.
KRA Scores at Kindergarten Entry
Year % Deemed Ready
ATTENDED % Deemed Ready DID NOT ATTEND
2017-18 31.1 27 Partnerships
York School District One developed more than 11 partnerships through the Kindergarten Registration Carnival, Kindergarten Kamp, Countdown to Kindergarten expansion, and family events.
Partnerships Developed or Expanded based on Community Block Grant
Organization Partnership Role
Boys & Girls Clubs of York County Participated in Kindergarten Registration Carnival
Carolina Community Actions Head Start Participated in teacher professional development; encouraged participation/participated in Kindergarten Registration Carnival
City of York Police Department Participated in Kindergarten Registration Carnival
Chartwell’s Food Services Participated in Kindergarten Registration Carnival
Early Learning Partnership of York County Participated in Kindergarten Registration Carnival
King’s Mountain National Military Park Participated in Kindergarten Registration Carnival
Upper Piedmont YMCA Participated in Kindergarten Registration Carnival
York County Culture & Heritage Museums Science lessons in Kindergarten Kamp and Night at the Museum; Participated in Kindergarten Registration Carnival
York County Library Performance during Kindergarten Kamp; Participated in Kindergarten Registration Carnival
York County First Steps Countdown to Kindergarten partners
York County Summer Reading Provided breakfast and lunch to Kindergarten Kamp participants at no charge
Sustainability York School District One received a 2017-18 Community Block Grant to continue and improve the Kindergarten Registration Carnival, Kindergarten Kamp, and other strategies piloted in 2016-17. The district is also developing partnerships that allow these strategies and activities to continue through contributions and donations from these partners.
55
Scalability The following aspects of York School District One’s initiatives through the Community Block Grant funding are scalable to other districts: • Kindergarten registration event to identify children eligible for
programs and promote awareness of kindergarten entry. This event led to more effective recruitment of children for Kindergarten Kamp and Countdown to Kindergarten as well as informed the distribution of Kindergarten Readiness Packs.
• Multi-faceted summer learning strategy including 1) 3-week summer program, 2) Countdown to Kindergarten, and 3) School Readiness Packs. The 3-week summer program uses curriculum modules and approaches used in 4K and 5K to ease transition to 5K. The Countdown to Kindergarten approach leverages partnerships and funding from First Steps to provide 6 visits to families during the summer prior to kindergarten entry. Kindergarten Readiness Packs include supplies and suggested activities to engage families and children prior to kindergarten entry.
• Community Events such as Night at the Museum, partnering with local York County Museum and Countdown to Kindergarten Celebration to bring families together
Leveraging Funds:
York One has worked with existing programs within the county to
leverage and build on currently successful programs and models.
In addition, programming and strategies are based on needs in
the county and many of the partners have been compelled to donate time and resources based
on their commitment to York County children and families.
56
Appendix A Evaluation Methodology The South Carolina Department of Education and South Carolina First Steps to School Readiness implement the Child Early Reading Development and Education Program (CERDEP). This program provides state-funded full-day 4-year-old kindergarten (4K). As part of CERDEP, the Community Block Grants encourage and incentivize evidence-based early childhood strategies that enhance the quality of 4K programs and instruction. Eight initiatives were awarded these funds during the 2016-17 fiscal year to be implemented during the 2017-18 academic year. The Education Oversight Committee (EOC) commissioned researchers from the Colleges of Education at the University of South Carolina and Clemson University to evaluate the status and quality of the projects implemented by the grant recipients. These evaluators used the following data collection methods. Strategy 1: Explore midpoint and end of year perceptions of project implementation in relation to logic models presented in grant submissions. Examine approaches to interventions, progress towards grant goals, use of teacher-child interactions, and understanding of student outcome data. Data Source: One phone interview (December 2017) and one in-person interview (April-May 2018) with each early childhood coordinator and/or other personnel working closely with the grant. Strategy 2: Explore outcomes related to professional development activities Data Source: Electronic report of pre and post-teacher/child interaction assessment outcomes, electronic report of pre and post-student outcomes, and online survey of professional development activities and demographic information related to grant (mid-year and end of year) completed by each early childhood coordinator or person most involved with the project. Strategy 3: Explore results from teacher-child interactional assessments at two points to better understand trends in teacher-child interactions. Use external teacher-child interactional assessment process (external evaluator to conduct assessment) including one classroom in Fall 2017 and one classroom in Spring 2018 in each district using the district-selected assessment. Scores were provided to districts to allow them to review feedback from an experienced evaluator of the particular assessment and explore perceptions of these scores. Data Source: A template was provided to districts in which to record classroom teacher-child interaction assessment scores in December 2017 and June 2018. Each district coordinated with evaluators and participated in one external assessment visit (approximately 4 hours of time in classroom per visit: 8 hours total with both visits) in Fall 2017 and Spring 2018. Strategy 4: Explore perceptions related to the NIEER standards and how well South Carolina is progressing towards meeting these standards. Data Source: Online survey of grantee perceptions on the value of these standards and perceptions of South Carolina’s progress completed in Spring 2018.

57
Appendix B NIEER Survey Results The National Institute for Early Education Research (NIEER) compares each state's preschool program policies against a checklist of 10 quality standards. The Community Block Grant recipients were invited to provide insight on the quality standards based on their experience as early childhood professionals. In a web-based survey, grantees rated their level of agreement with the standards as well as their comments on how well they believe South Carolina is doing in relation to these standards. The eight respondents represented all eight districts/consortia.
There was overwhelming agreement that most of the standards were appropriate. However, some participants responded with disagreement to 1 of the 10 standards (Assistant Teacher Degree) and strong disagreement to 2 of the 10 standards (Early Learning and Development Standards and Teacher Degree). Regarding South Carolina’s progress based on the NIEER Quality Standards, commonly mentioned concerns across standards were the need for increased opportunities for professional development that is both specific to early childhood and accessible in rural areas. Additional funding was also an expressed need to maintain adequate classroom sizes, facilitate curriculum implementation with fidelity, and ensure that early learning and development standards are met. Two respondents suggested additional standards, one related to “teachers and assistant teachers being ethically and morally
NIEER Quality Standards
1. Early Learning & Development Standards Standards must be (1) comprehensive to cover multiple domains of learning, (2) vertically aligned (with state infant & toddler and K-3 or college & career ready standards), (3) horizontally aligned with child assessments, (4) supported through professional development and/or additional resources, and (5) culturally sensitive.
2. Curriculum Supports Approval process for selecting curricula and supports in place for curriculum implementation including the provision of: (1) guidance for selecting or adopting curriculum and (2) supports for curriculum implementation with fidelity (such as training, ongoing technical assistance, or additional training).
3. Teacher Degree Lead teacher must have a BA, at a minimum.
4. Teacher Specialized Training Lead teacher must have specialized training in Early Childhood Education and/or Child Development.
5. Assistant Teacher Degree Assistant teacher must have a CDA, or equivalent, at a minimum.
6. Staff Professional Development Lead teachers and assistant teachers must receive at least 15 hours per year of in-service professional development and training. Both lead and assistant teachers are required to have individualized professional development plans, and receive ongoing coaching or classroom-embedded support.
7. Maximum Class Size Maximum number of children per classroom must be 20 or fewer.
8. Staff-child Ratio Lowest acceptable ratio of staff to children in classroom (e.g., maximum number of students per teacher) must be 1:10 or better.
9. Screening & Referral Screenings and referrals for vision, hearing, and health must be required.
10. Monitoring/Continuous Quality Improvement System Annual structured observations of classroom quality and information collected is used for classroom/program improvement. Programs must complete structured observations of classroom quality (using a valid and reliable measure) and use this information to inform an improvement plan with teacher feedback.

58
committed to educating young children to become socially well-adjusted, intelligent individuals without demoralizing them” and the other calling for “one uniform measure across all programs and equalized educational levels for all staff.” Responses also suggested that there are disparate experiences between public and private 4K programs. Thus, future studies should include not only a larger sample but also cast a wider net to include the private sector. Below is a summary of responses organized by standard.
Among the 8 Respondents, there was Overwhelming Agreement with the NIEER Standards
*Due to rounding sums may not total 100%
Early Learning Development With the exception of one respondent who strongly disagreed, all agreed that the early learning and development standards must be comprehensive, vertically aligned, horizontally aligned, supported through professional development, and culturally sensitive. Most (63% or 5) strongly agreed. In explaining their agreement, two respondents described the standard as appropriate and further expanded on the importance of vertical alignment. One specifically cautioned that a strong research-base and age appropriateness are necessary prerequisites to vertical alignment and the other highlighted the impact that it has on “academic growth for students.” For the grant recipient who disagreed, no explanation was provided. South Carolina’s process received positive reviews. South Carolina standards were described as comprehensive, user-friendly, rigorous, age-appropriate, vertically-aligned and culturally sensitive. Four respondents provided content-related concerns: insufficient professional development, absence of social-emotional development, lack of horizontal alignment with child assessments, and insufficient funding. One respondent shared “public school programs often remained underfunded in order to include all pre-K students in the state of SC.”
13%
13%
13%
25%
63%
13%
38%
38%
50%
13%
13%
38%
25%
63%
38%
75%
63%
50%
50%
88%
88%
63%
75%
Early Learning & Development
Curriculum Supports
Teacher Degree
Teacher Specialized Training
Assistant Teacher Degree
Staff Professional Development
Maximum Class Size
Staff-child Ratio
Screening and Referal
Monitoring/Continuous Quality Improvement System
Strongly Disagree Disagree Agree Strongly Agree

59
Curriculum Supports All respondents agreed with the approval process for selecting curricula and supports for curriculum implementation. Most (63% or 5) agreed and the remaining strongly agreed. Of the four respondents who explained their answers, all expressed the need for fidelity, technical assistance, and ongoing professional learning opportunities in order to realize benefits of the curriculum. One district’s curriculum implementation efforts were made possible due to grant funds, which are “often competitive and may not be available to all districts.” These concerns were also shared when commenting on South Carolina’s progress. While one respondent found the rubric and curriculum overview session provided by the South Carolina Department of Education useful, others reiterated the need for technical assistance (n = 5), additional funding (n = 2), and ongoing professional development (n = 2). Areas mentioned for technical assistance and professional development included curriculum selection, personalization, fidelity, implementation, and innovation. Teacher Degree Only one respondent strongly disagreed that lead teachers should have a Bachelor of Arts at minimum. No explanation was offered to explain the disagreement. The remaining agreed with most (6 or 75%) expressing strong agreement with the standard. Respondents acknowledged the link between teacher training and effective classrooms that maximize student learning. One respondent shared that “experience is always a plus and cannot nor should it be discounted.” South Carolina was described as “leading the way in regulations for certified staffing.” However, this was specific to public schools as half of the respondents (or 4) noted the distinction between the regulations for private and public schools, where lower standards are accepted in the private sector. An added concern was that certification is not only needed for 4K teachers, but for 3K teachers and in the area of early childhood and not elementary. Teacher Specialized Training All respondents agreed that the lead teacher should have specialized training in Early Childhood Education and/or Child Development. Most (63% or 5) strongly agreed. Similar to the teacher degree standard, specialized training was regarded as important to classroom impact. Most (75% or 6) respondents indicated that South Carolina is doing well and that there are numerous opportunities for specialized training, with The Early Childhood Roundtable offered through the South Carolina Association of School Administrators being mentioned specifically. On the contrary, one respondent felt that the mandatory South Carolina Department of Social Services training hours do not adequately address this standard. For another respondent, access to training opportunities is a challenge in rural areas. Assistant Teacher Degree Only one respondent disagreed that the assistant teacher should have a Child Development Associate (CDA), or the equivalent, at minimum. No explanation was offered to explain the disagreement. The remaining respondents agreed with half (n = 4) strongly agreeing. Though regarded as important to developmentally appropriate curriculum for preschools, one respondent also added that it is “hard to get if you do not pay for it.” Four of the six who commented on South Carolina’s progress indicated that there are structures in place to ensure that the minimum standard is met. However, the remaining two were critical in their description of South Carolina’s progress. For these respondents, the standard is not being required and there is a need for “additional professional opportunities other than the ECD 101 required by CDEP.” Staff Professional Development Half of the respondents agreed and the other half strongly agreed that lead teachers and assistant teachers should receive a minimum of 15 hours per year of in-service professional development in addition to individualized

60
professional development plans and ongoing coaching or classroom-embedded support. As one respondent explained “just as students continue to grow and learn, so must their teachers.” Four out of the five respondents who offered comments on South Carolina felt that structures are in place to meet this standard and that most teachers in public school 4K classrooms are able to accrue more than the required 15 hours, when school-based opportunities are counted. One respondent was unaware of “genuine efforts at professional development at any level.” Consistent with concerns across multiple standards, one respondents emphasized the need for a specific focus on early childhood. Other concerns included insufficient focus on individualized professional development plans and lack of on-site training. Maximum Class Size All respondents agreed with 20 as the maximum number of children in a classroom. Most (88% or 7) strongly agreed explaining that it affords teachers opportunities to differentiate, provide intervention, and better meet the diverse needs of students. It was also noted that innovative practices, such as a multiage Montessori classroom may be over 20 based on the ratio of ages of the students in the classroom. One respondent added “there are circumstances where a class of 20 is too large” and that those instances could be accommodated with adequate funding. Though all five respondents who added comments felt that South Carolina is doing well on this standard, one was unsure if it is being monitored. Staff-Child Ratio All respondents agreed that the staff-child ratio should be 1:10 or better. Most (88% or 7) strongly agreed explaining that maintaining the staff-child ratio “allows the individualized attention and support needed at this age" and “to increase the ratio would risk the appropriate development of the students.” The four respondents who added comments about South Carolina’s progress felt that “structures are in place” and that “South Carolina is doing a great job.” Screening and Referral All respondents agreed with the requirement of screenings and referrals for vison, hearing, and health. Most (63% or 5) strongly agreed. Not only did all respondents agree that screening and referrals should be required, but one respondent added that “in the case of the school district, services should be provided.” For South Carolina, even though respondents are aware of the regulations “there is work to be done.” One voiced a need for clarification on guidelines requiring vision, hearing, and health screenings. Three alluded to the disparities between public school and private center-based classrooms, with the public sector faring better. Monitoring/Continuous Quality Improvement All respondents agreed with annual structured observations of classroom quality for classroom/program improvement using valid and reliable measures and providing teacher feedback. Most (75% or 6) strongly agreed. Respondents added that it is “useful when done in a non-threatening coaching session” and “without bias.” Of the six who added comments about South Carolina’s progress, three responded positively, two negatively, and one was unsure. One respondent feared that the current version of the Early Language and Literacy Classroom Observation (ELLCO) tool “has been tampered with by the state” and is “not valid or reliable.” Another who was critical of South Carolina stated that “many districts do not use a quality assessment tool in 4K/5K.” For those who responded positively, the Rubric 4.0 was described as a “rigorous” tool used to monitor classroom instruction that provide necessary feedback to teachers. The Classroom Assessment Scoring System (CLASS) and Early Childhood Environment Rating Scale (ECERS-3) were other tools mentioned to monitor instructional progress and provide feedback. Additionally, monitoring visits conducted by the South Carolina Department of Education were described,
61
by one respondent, as less beneficial to teachers. This respondent explained that “they tend to be more beneficial to the program administrator.” Additional Supports When asked to share what additional supports were needed to meet the NIEER Quality Standards, respondents shared the following: Continued professional learning opportunities offered across the state Early childhood trained classroom coaches Support from the state on training for curriculum fidelity (e.g., a document that outlines NIEER standards and
guidelines) Support from the state to implement a quality classroom observation tool focused on adult-child interaction Address the challenge of finding quality staffing in rural areas, which is complicated by pay disparities in
more affluent counties Adequate funding Continued district support to monitor credentials and provide on-going professional learning opportunities Reassurance that only the best early childhood teachers are placed in 4K classrooms


