Education Statistics Staitisticí Oideachais 2011/2012 & 2012/2013 Department of Education and Skills An Roinn Oideachais agus Scileanna Statistics Section Rannóg Staitistic Marlborough Street Sráid Maoilbhríde Dublin 1, Ireland Baile Átha Cliath 1, Éire Phone +353 (0)1 889 2085 Fón +353 (0)1 889 2085 Fax +353 (0)1 889 6419 Facs +353 (0)1 889 6419 Email [email protected]P-phost [email protected]Website www.education.ie Suíomh idirlín www.education.ie Department of Education and Skills An Roinn Oideachais agus Scileanna
Transcript
Education StatisticsStaitisticí Oideachais
2011/2012 & 2012/2013
Department of Education and Skills An Roinn Oideachais agus ScileannaStatistics Section Rannóg StaitisticMarlborough Street Sráid MaoilbhrídeDublin 1, Ireland Baile Átha Cliath 1, ÉirePhone +353 (0)1 889 2085 Fón +353 (0)1 889 2085Fax +353 (0)1 889 6419 Facs +353 (0)1 889 6419Email [email protected] P-phost [email protected] www.education.ie Suíomh idirlín www.education.ie
Department of Education and Skills
An Roinn Oideachais agus Scileanna
Education Statistics Staitisticí Oideachais
2
Full-Time Education in State-Aided Institutions
TypicalAge
4-12
12-18
15+
18-23
TYPE OF INSTITUTION ATTENDED
TOTAL - First Level
*TOTAL - Second Level
TOTAL - Further Education
TOTAL - Third Level
GRAND TOTAL
2002/03
443,720
311,531
36,239
130,424
921,914
516,458
323,843
44,660
163,126
1,048,087
526,422
328,754
43,168
164,921
1,063,265
2011/12 2012/13
FIRST LEVELPupils in Mainstream ClassesPupils in Special Classes in Mainstream National Schools
Pupils in Special Schools
427,5299,3846,807
172,673137,909
949
28,64937762,859
955
70,08251,5075,4542,2401,141
506,2162,8227,420
180,470142,049
1,324
36,5284,3453,321
466
89,92863,8746,4282,838
58
515,6763,0817,665
181,234146,089
1,431
35,5244,3313,313
Not Applicable
90,34165,0396,4543,029
58
SECOND LEVELJunior CycleSenior CycleAided by Other Departments (Agriculture/Defence)
FURTHER EDUCATIONPost Leaving Cert CourseCore VTOSYouthreachSenior Travelling Training**
THIRD LEVELUniversity SectorTechnology Sector (IOTs/DITs)Teacher Training InstitutionsOther Aided Institutions***Aided by Other Departments (Justice/Defence)
*Does not include second level courses in Institutes of Technology or Post Leaving Cert Courses**Senior Traveller Training was phased out in June 2012***Milltown Institute was included in other aided institutions for the first time in 2009/10 therefore is included in 2011/12 and 2012/13 but not 2002/03
CO
MP
ULSO
RY
ED
UC
ATIO
N
Education Statistics Staitisticí Oideachais
3
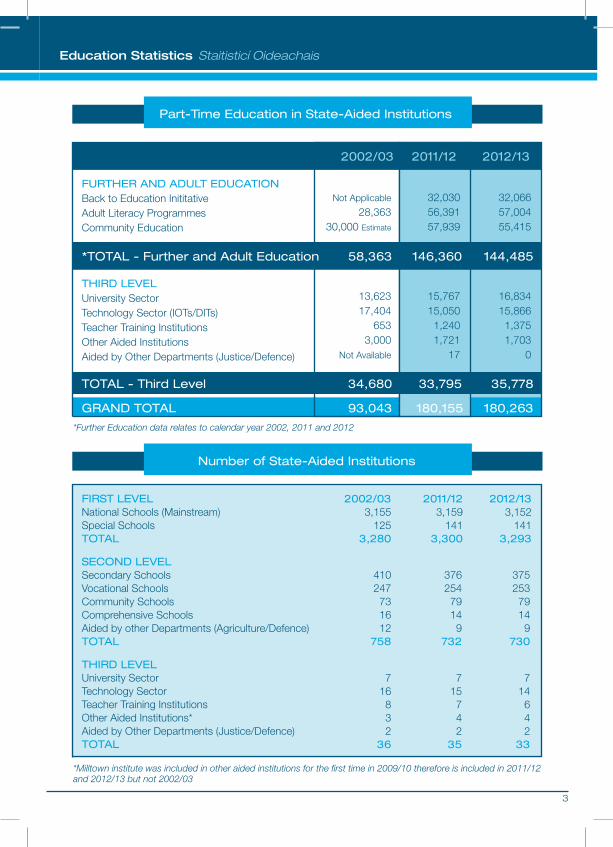
Part-Time Education in State-Aided Institutions
Number of State-Aided Institutions
TOTAL - Third Level
*TOTAL - Further and Adult Education
GRAND TOTAL
2002/03
58,363
34,680
93,043
146,360
33,795
180,155
144,485
35,778
180,263
2011/12 2012/13
FIRST LEVELNational Schools (Mainstream)Special SchoolsTOTAL
2002/033,155
1253,280
410247731612
758
716832
36
37625479149
732
715742
35
37525379149
730
714642
33
2011/123,159
1413,300
2012/133,152
1413,293
Not Applicable
28,36330,000 Estimate
13,62317,404
6533,000
Not Available
32,03056,39157,939
15,76715,0501,2401,721
17
32,06657,00455,415
16,83415,8661,3751,703
0
SECOND LEVELSecondary SchoolsVocational SchoolsCommunity SchoolsComprehensive SchoolsAided by other Departments (Agriculture/Defence)TOTAL
FURTHER AND ADULT EDUCATIONBack to Education InititativeAdult Literacy ProgrammesCommunity Education
THIRD LEVELUniversity SectorTechnology SectorTeacher Training InstitutionsOther Aided Institutions*Aided by Other Departments (Justice/Defence)TOTAL
THIRD LEVELUniversity SectorTechnology Sector (IOTs/DITs)Teacher Training InstitutionsOther Aided InstitutionsAided by Other Departments (Justice/Defence)
*Further Education data relates to calendar year 2002, 2011 and 2012
*Milltown institute was included in other aided institutions for the first time in 2009/10 therefore is included in 2011/12 and 2012/13 but not 2002/03
Education Statistics Staitisticí Oideachais
4
Number of Teachers and SNAs at First and Second Level
Pupil-Teacher Ratio
2002/03 2011/12 2012/13
24,700
25,69214,127
7,3503,576
639
4,594385
25,80812,8938,6733,652
590
8,1651,952
25,37412,5788,6253,590
581
8,3612,029
31,928 32,175PRIMARY TEACHERS
SECOND LEVEL TEACHERSSecondaryVocationalCommunityComprehensive
SNAs PrimarySNAs Second Level
Data in respect of 2011/12 and 2012/13 relate to number of teaching posts allocated and 2002/03 relates to whole time equivalent numbers on payroll. Only teachers paid from funds provided by the Department of Education & Skills are included in the above table. Second level teacher numbers exclude all Further Education other than PLC
Pupil-Teacher Ratio
25.0
15.0
10.0
20.0
5.0
0.0
First LevelSecond Level
Academic Year
PTR
18.0
13.2
17.1
13.6
17.1
13.4
16.6
13.1
16.0
13.1
16.0
12.9
15.9 16.0
13.0
15.7
13.6
16.2 16.4
14.313.6
13.9
Education Statistics Staitisticí Oideachais
5
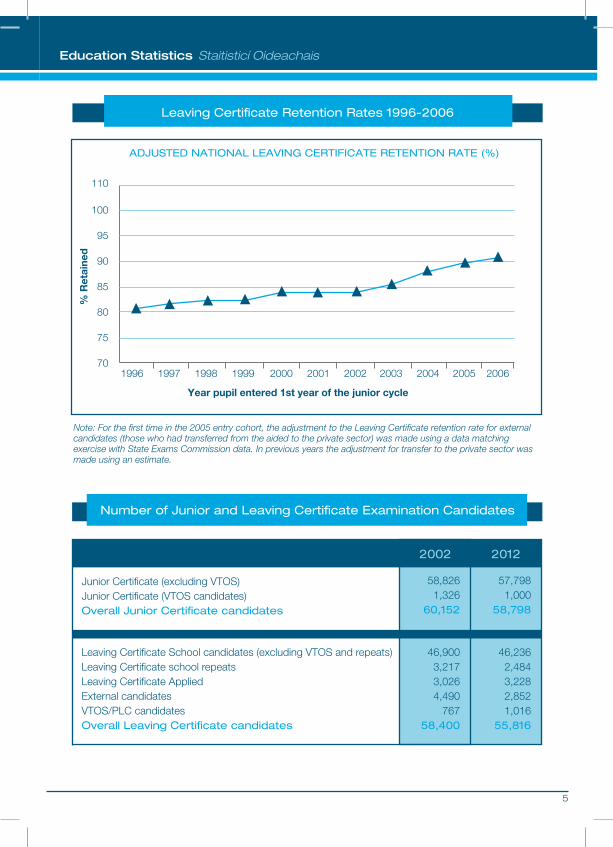
Number of Junior and Leaving Certificate Examination Candidates
Leaving Certificate School candidates (excluding VTOS and repeats)Leaving Certificate school repeatsLeaving Certificate AppliedExternal candidatesVTOS/PLC candidatesOverall Leaving Certificate candidates
Note: For the first time in the 2005 entry cohort, the adjustment to the Leaving Certificate retention rate for external candidates (those who had transferred from the aided to the private sector) was made using a data matching exercise with State Exams Commission data. In previous years the adjustment for transfer to the private sector was made using an estimate.
ADJUSTED NATIONAL LEAVING CERTIFICATE RETENTION RATE (%)
Full-time and part-time students in public and private institutions
100908070605040302010
0
%
Aust
ralia
Aust
riaBe
lgium
Cana
daCh
ileCz
ech
Rep.
Denm
ark
Finlan
dFr
ance
Ger
man
yG
reec
eHu
ngar
yIc
eland
Irelan
dIsr
ael
Italy
Kore
aLu
xem
bour
gM
exico
Neth
erlan
dsN.
Zea
land
Norw
ayPo
land
Portu
gal
Slov
ak R
ep.
Spain
Swed
enSw
itzer
land
Turk
eyUK
US
A
EU12
avg
.O
ECD
avg.
OECDcountries
2011 2002 1995
Enrolment Rates of 15-19 year-olds as a percentage of the population aged 15 to 19
Data refer to Gross voted expenditure divided by full-time equivalent students in DES-aided institutions for each calendar year. Values are calculated in constant 2012 prices using the CSO National Accounts deflator for net expenditure by central and local government on current goods and services. All data are provisional for 2012.