21
The Washington State Board of Education 1 Education System Outcomes Washington Compared to Other States Mr. Ben Rarick, Executive Director

The Washington State Board of Education 1
Education System Outcomes Washington Compared to Other States
Mr. Ben Rarick, Executive Director
The Washington State Board of Education 2
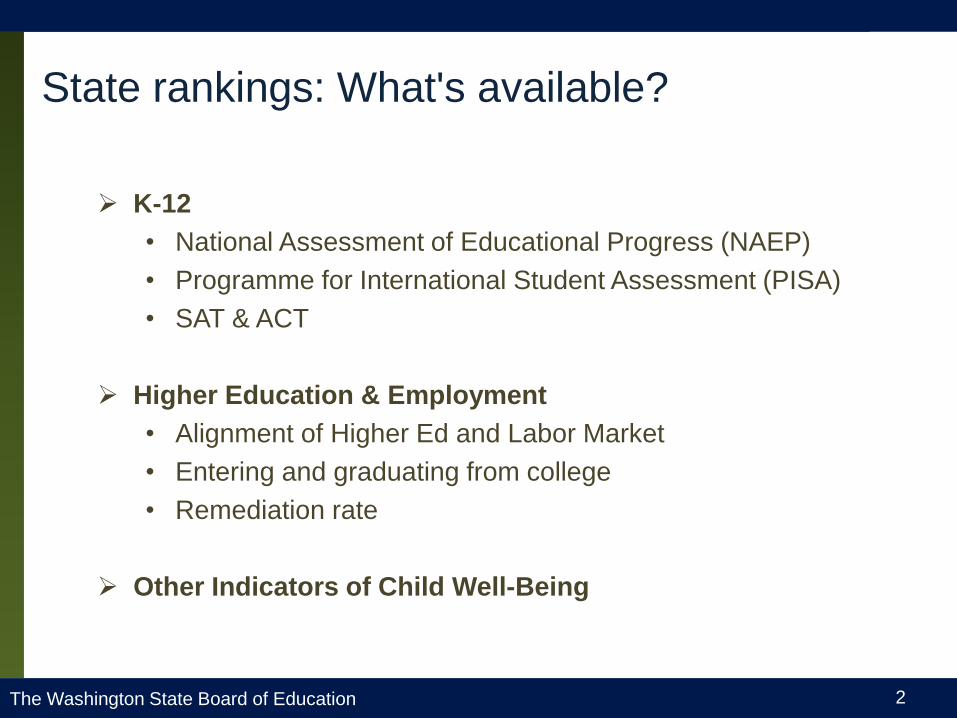
State rankings: What's available?
K-12
• National Assessment of Educational Progress (NAEP)
• Programme for International Student Assessment (PISA)
• SAT & ACT
Higher Education & Employment
• Alignment of Higher Ed and Labor Market
• Entering and graduating from college
• Remediation rate
Other Indicators of Child Well-Being
The Washington State Board of Education 3
State rankings: How are they valuable?
Rankings often, but not always, convey valuable
information to policymakers.
• What are you comparing?
• What's most useful is not always what's available.
• Progress relative to other states is not always progress
towards your own goal.
The Washington State Board of Education 4
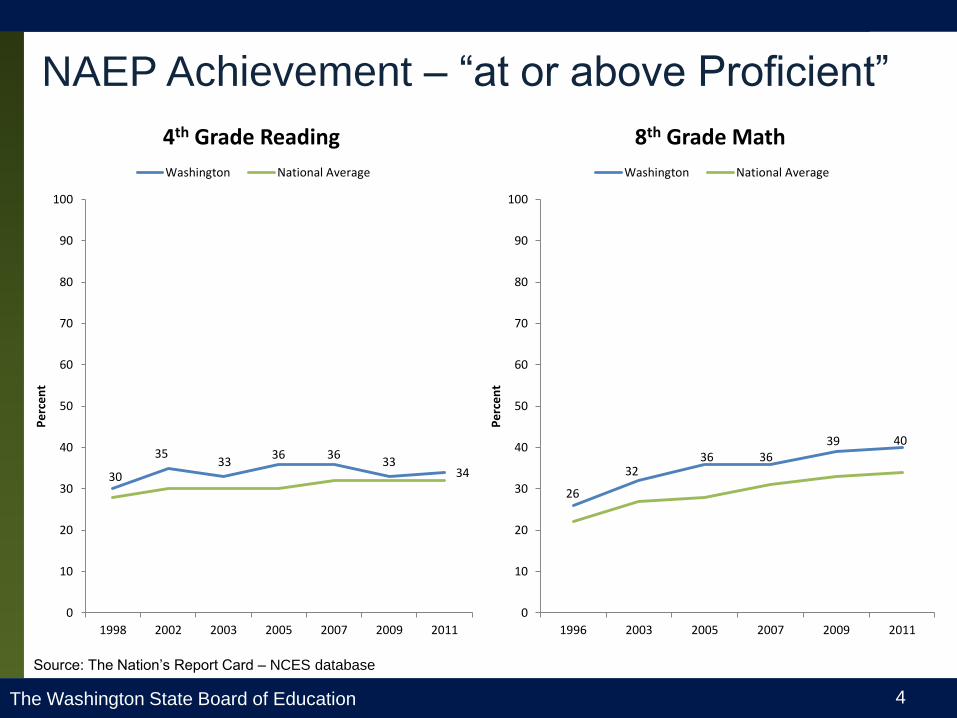
NAEP Achievement – “at or above Proficient”
30
35 33
36 36 33
34
0
10
20
30
40
50
60
70
80
90
100
1998 2002 2003 2005 2007 2009 2011
Pe
rce
nt
4th Grade Reading
Washington National Average
26
32 36 36
39 40
0
10
20
30
40
50
60
70
80
90
100
1996 2003 2005 2007 2009 2011
Pe
rce
nt
8th Grade Math
Washington National Average
Source: The Nation’s Report Card – NCES database
The Washington State Board of Education 5
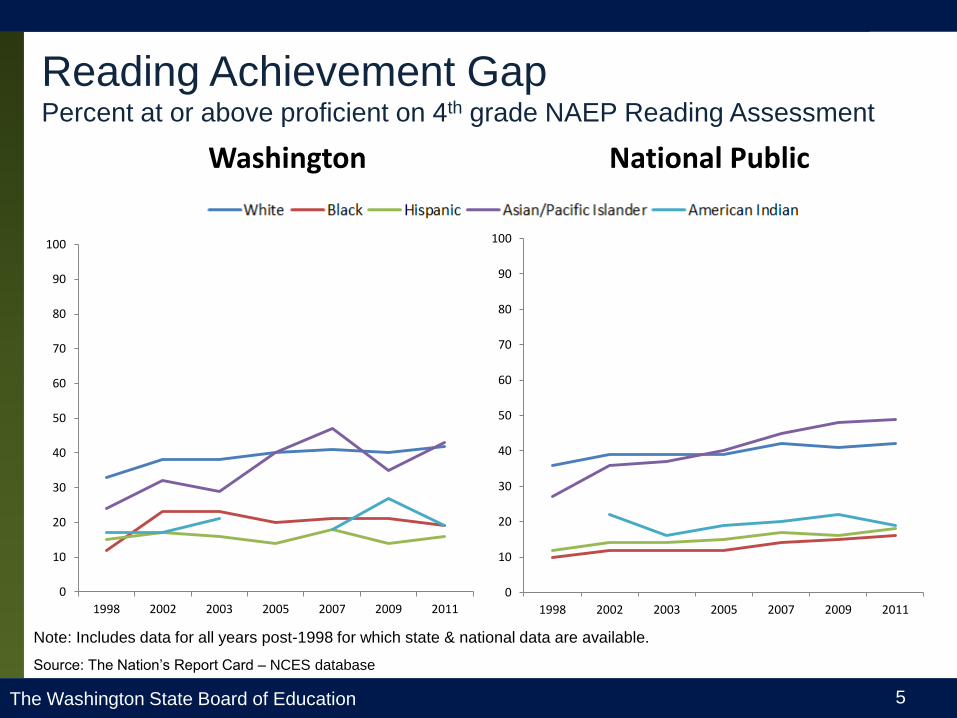
Reading Achievement Gap Percent at or above proficient on 4th grade NAEP Reading Assessment
0
10
20
30
40
50
60
70
80
90
100
1998 2002 2003 2005 2007 2009 2011
Washington
0
10
20
30
40
50
60
70
80
90
100
1998 2002 2003 2005 2007 2009 2011
National Public
Note: Includes data for all years post-1998 for which state & national data are available.
Source: The Nation’s Report Card – NCES database
The Washington State Board of Education 6
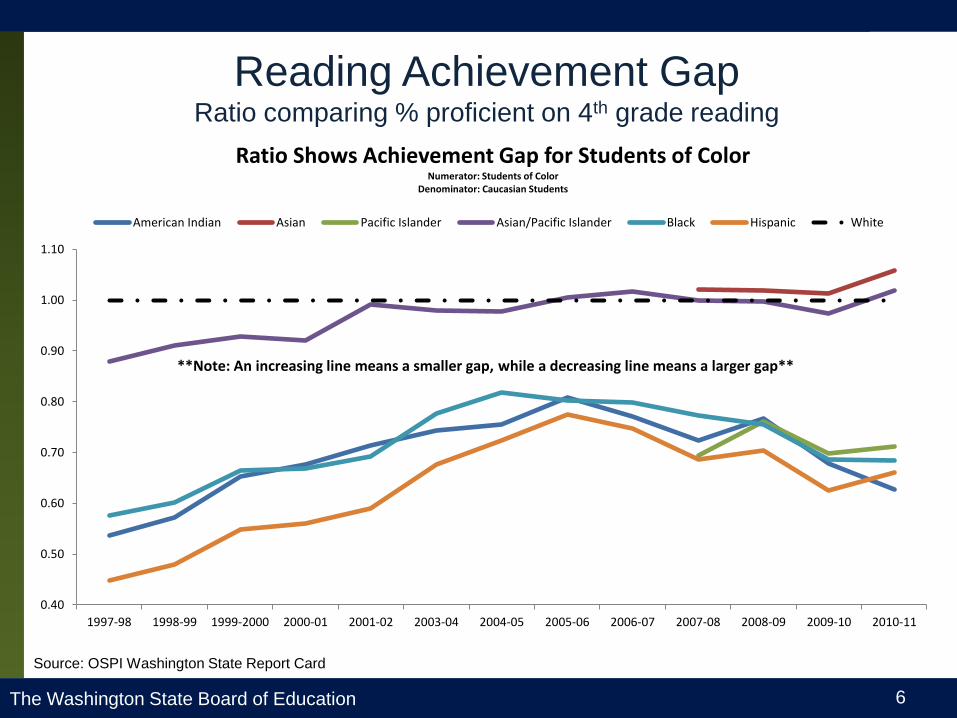
Reading Achievement Gap Ratio comparing % proficient on 4th grade reading
0.40
0.50
0.60
0.70
0.80
0.90
1.00
1.10
1997-98 1998-99 1999-2000 2000-01 2001-02 2003-04 2004-05 2005-06 2006-07 2007-08 2008-09 2009-10 2010-11
Ratio Shows Achievement Gap for Students of Color Numerator: Students of Color
Denominator: Caucasian Students
American Indian Asian Pacific Islander Asian/Pacific Islander Black Hispanic White
**Note: An increasing line means a smaller gap, while a decreasing line means a larger gap**
Source: OSPI Washington State Report Card
The Washington State Board of Education 7
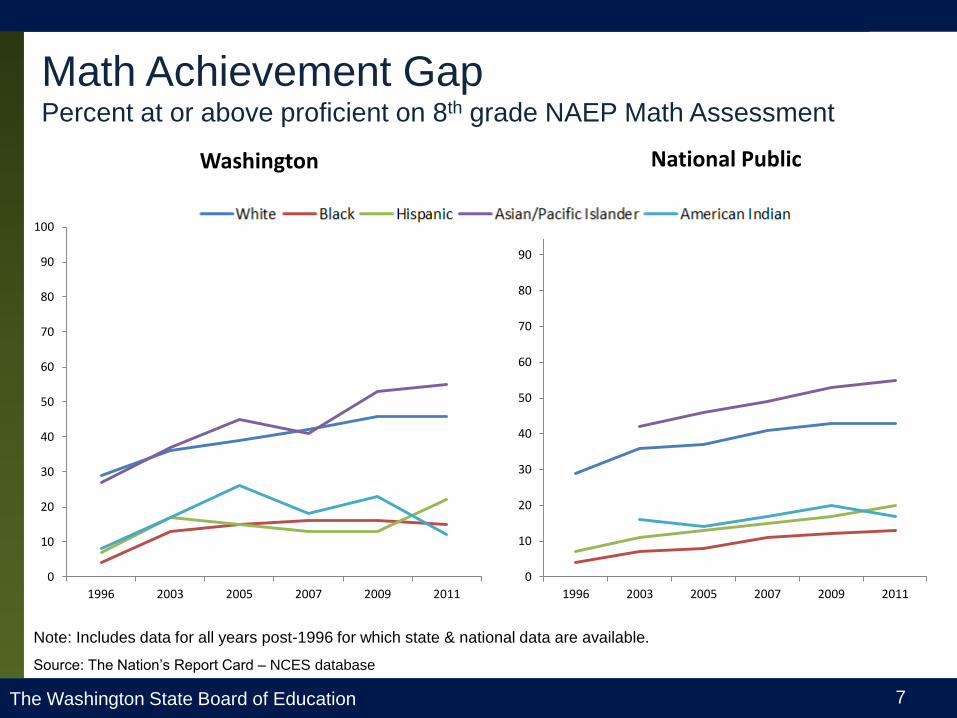
Math Achievement Gap Percent at or above proficient on 8th grade NAEP Math Assessment
0
10
20
30
40
50
60
70
80
90
100
1996 2003 2005 2007 2009 2011
Washington
0
10
20
30
40
50
60
70
80
90
100
1996 2003 2005 2007 2009 2011
National Public
Note: Includes data for all years post-1996 for which state & national data are available.
Source: The Nation’s Report Card – NCES database
The Washington State Board of Education 8
0.40
0.50
0.60
0.70
0.80
0.90
1.00
1.10
1.20
1.30
1.40
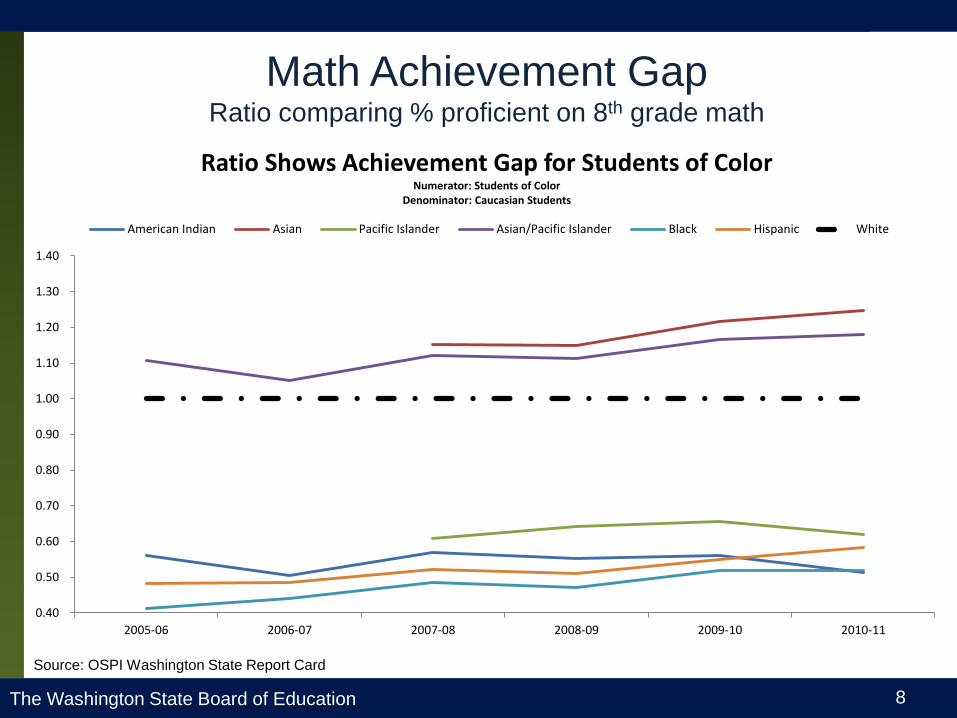
2005-06 2006-07 2007-08 2008-09 2009-10 2010-11
Ratio Shows Achievement Gap for Students of Color Numerator: Students of Color
Denominator: Caucasian Students
American Indian Asian Pacific Islander Asian/Pacific Islander Black Hispanic White
Math Achievement Gap Ratio comparing % proficient on 8th grade math
Source: OSPI Washington State Report Card
The Washington State Board of Education 9
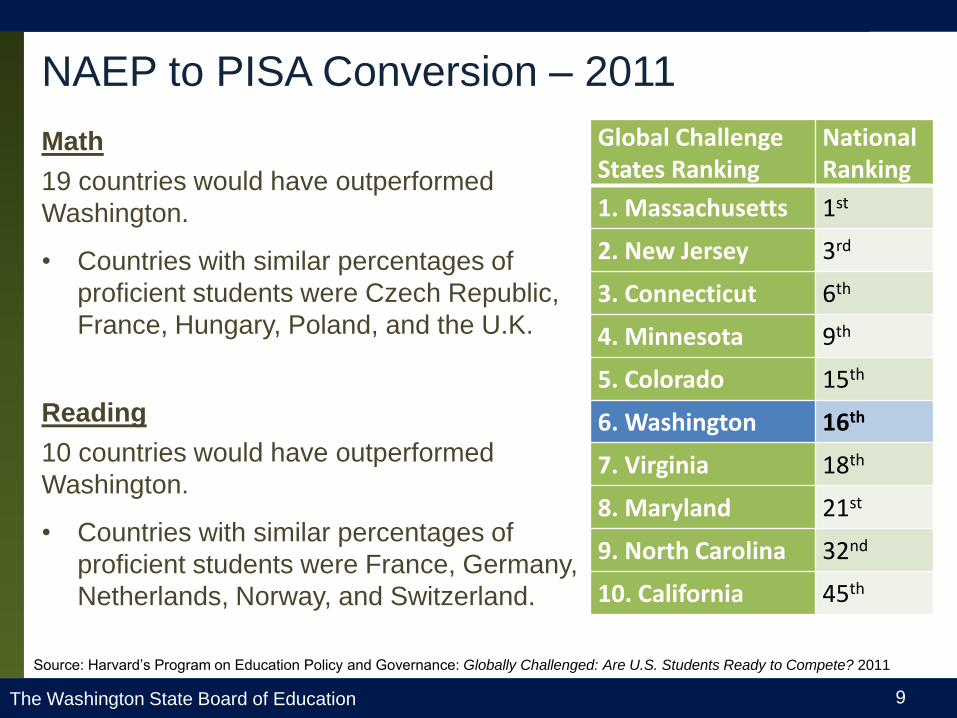
NAEP to PISA Conversion – 2011
Math
19 countries would have outperformed
Washington.
• Countries with similar percentages of
proficient students were Czech Republic,
France, Hungary, Poland, and the U.K.
Reading
10 countries would have outperformed
Washington.
• Countries with similar percentages of
proficient students were France, Germany,
Netherlands, Norway, and Switzerland.
Global Challenge States Ranking
National Ranking
1. Massachusetts 1st
2. New Jersey 3rd
3. Connecticut 6th
4. Minnesota 9th
5. Colorado 15th
6. Washington 16th
7. Virginia 18th
8. Maryland 21st
9. North Carolina 32nd
10. California 45th
Source: Harvard’s Program on Education Policy and Governance: Globally Challenged: Are U.S. Students Ready to Compete? 2011
The Washington State Board of Education 10
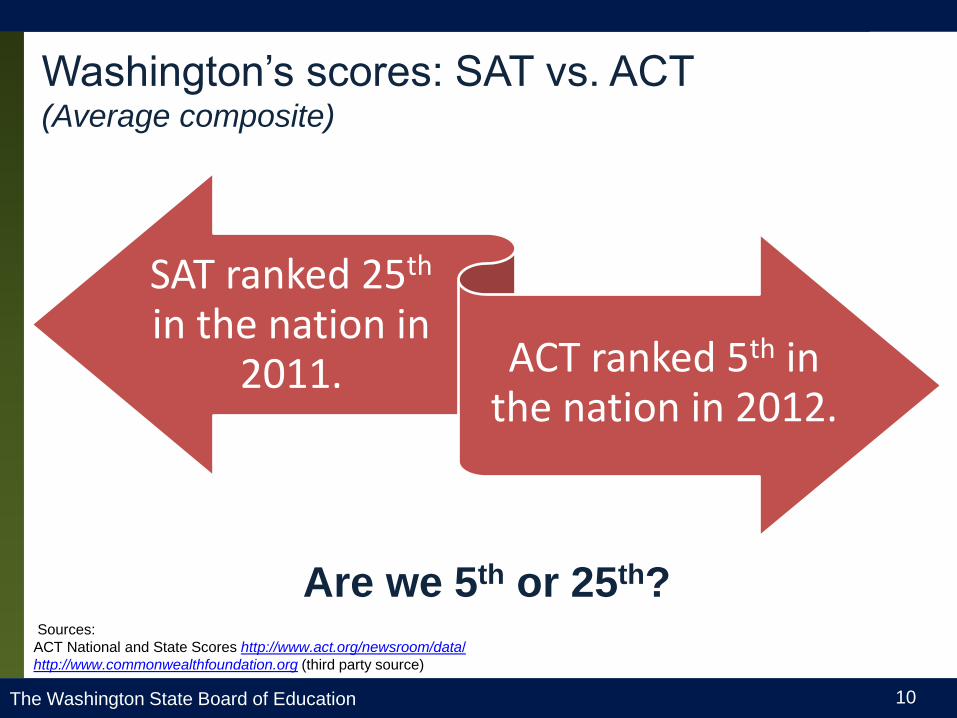
Washington’s scores: SAT vs. ACT (Average composite)
SAT ranked 25th in the nation in
2011. ACT ranked 5th in the nation in 2012.
Are we 5th or 25th? Sources:
ACT National and State Scores http://www.act.org/newsroom/data/
http://www.commonwealthfoundation.org (third party source)
The Washington State Board of Education 11
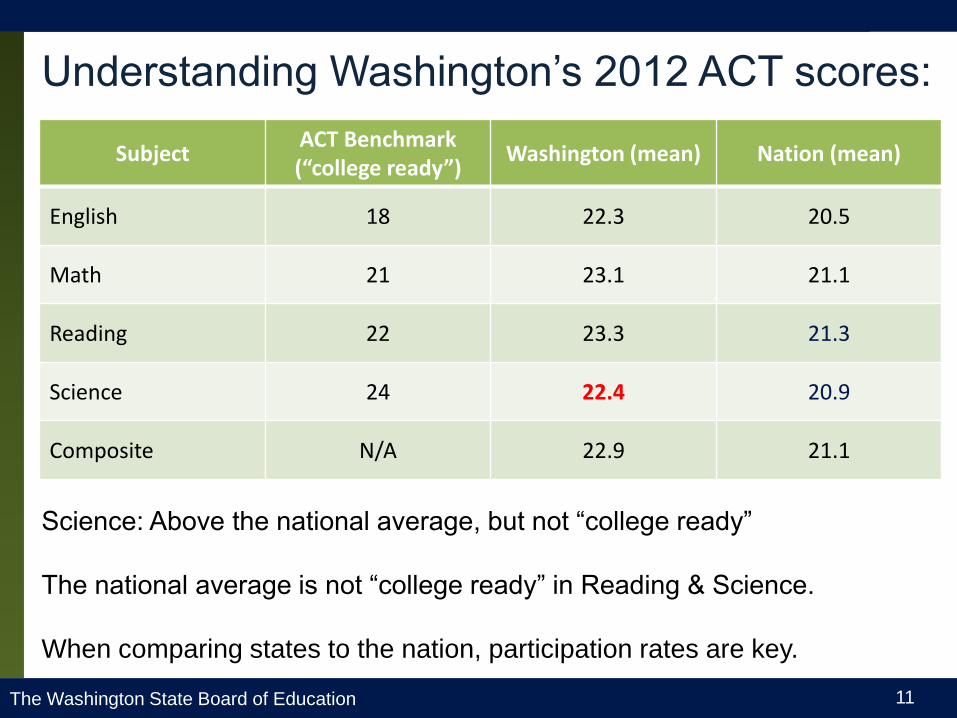
Understanding Washington’s 2012 ACT scores:
Subject ACT Benchmark (“college ready”)
Washington (mean) Nation (mean)
English 18 22.3 20.5
Math 21 23.1 21.1
Reading 22 23.3 21.3
Science 24 22.4 20.9
Composite N/A 22.9 21.1
Science: Above the national average, but not “college ready”
The national average is not “college ready” in Reading & Science.
When comparing states to the nation, participation rates are key.
The Washington State Board of Education 12
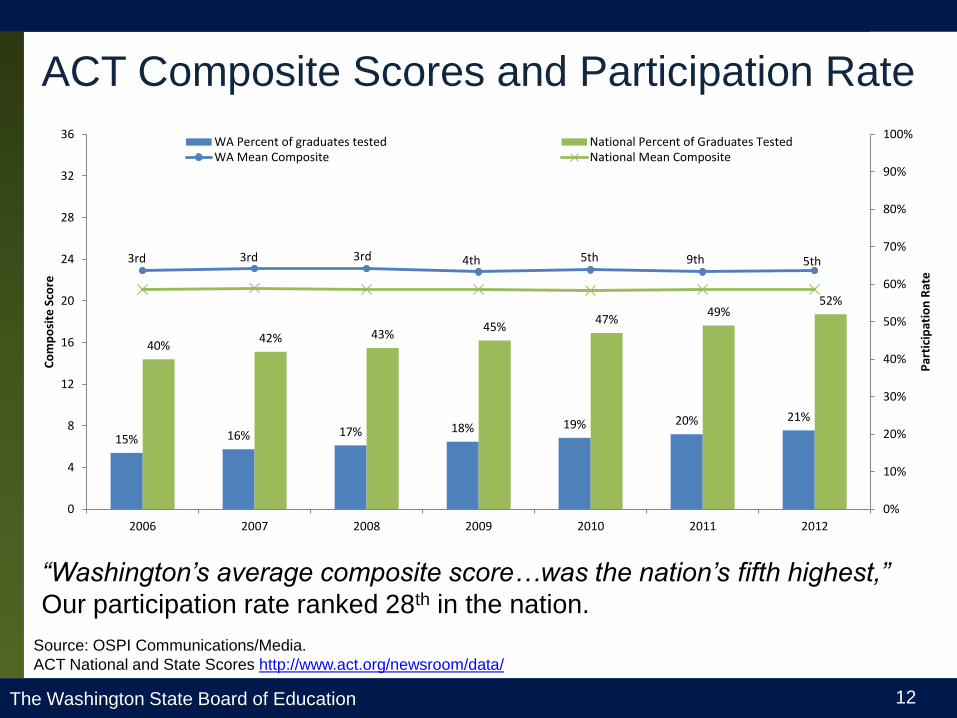
ACT Composite Scores and Participation Rate
“Washington’s average composite score…was the nation’s fifth highest,”
Our participation rate ranked 28th in the nation.
15% 16% 17% 18% 19% 20% 21%
40% 42% 43%
45% 47%
49% 52%
3rd 3rd 3rd 4th 5th 9th 5th
0%
10%
20%
30%
40%
50%
60%
70%
80%
90%
100%
0
4
8
12
16
20
24
28
32
36
2006 2007 2008 2009 2010 2011 2012
Par
tici
pat
ion
Rat
e
Co
mp
osi
te S
core
WA Percent of graduates tested National Percent of Graduates TestedWA Mean Composite National Mean Composite
Source: OSPI Communications/Media.
ACT National and State Scores http://www.act.org/newsroom/data/

The Washington State Board of Education 13
WA Compared to States with Similar Participation
These are states with similar ACT participation rates as Washington.
Massachusetts’ mean composite score ranked first in the nation.
24.1
22.1 22.9 23.4
21.9
0
4
8
12
16
20
24
28
32
36
MA (23%) MD (21%) WA (21%) NJ (20%) NC (20%)
2012 Mean Composite Score
Source: ACT National and State Scores http://www.act.org/newsroom/data/
The Washington State Board of Education 14
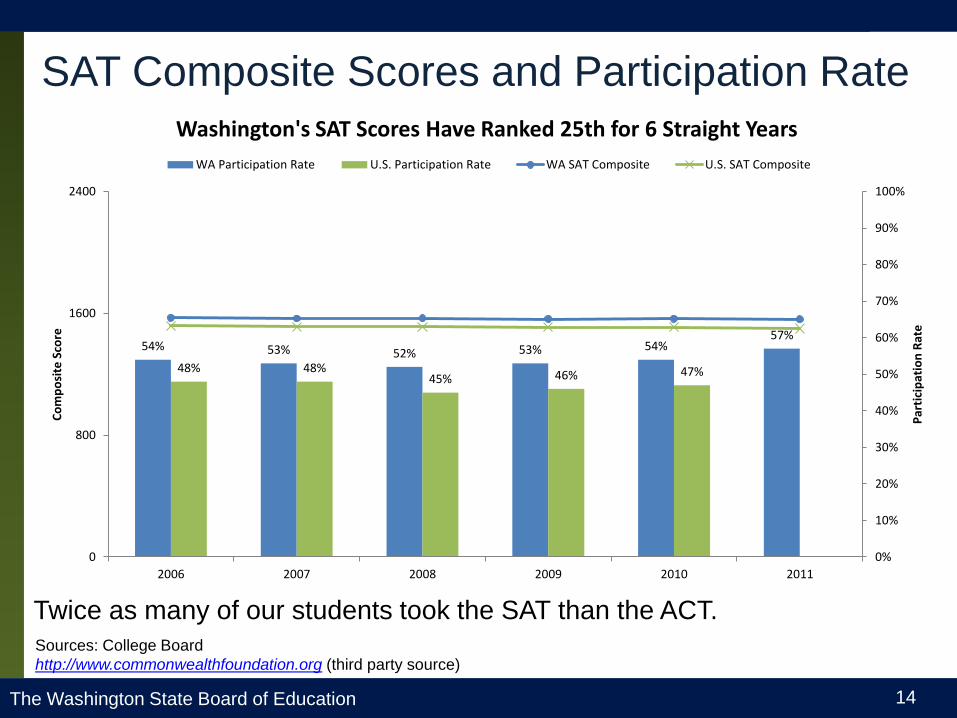
SAT Composite Scores and Participation Rate
54% 53% 52% 53% 54% 57%
48% 48% 45% 46% 47%
0%
10%
20%
30%
40%
50%
60%
70%
80%
90%
100%
0
800
1600
2400
2006 2007 2008 2009 2010 2011
Par
tici
pat
ion
Rat
e
Co
mp
osi
te S
core
Washington's SAT Scores Have Ranked 25th for 6 Straight Years
WA Participation Rate U.S. Participation Rate WA SAT Composite U.S. SAT Composite
Twice as many of our students took the SAT than the ACT.
Sources: College Board
http://www.commonwealthfoundation.org (third party source)
The Washington State Board of Education 15
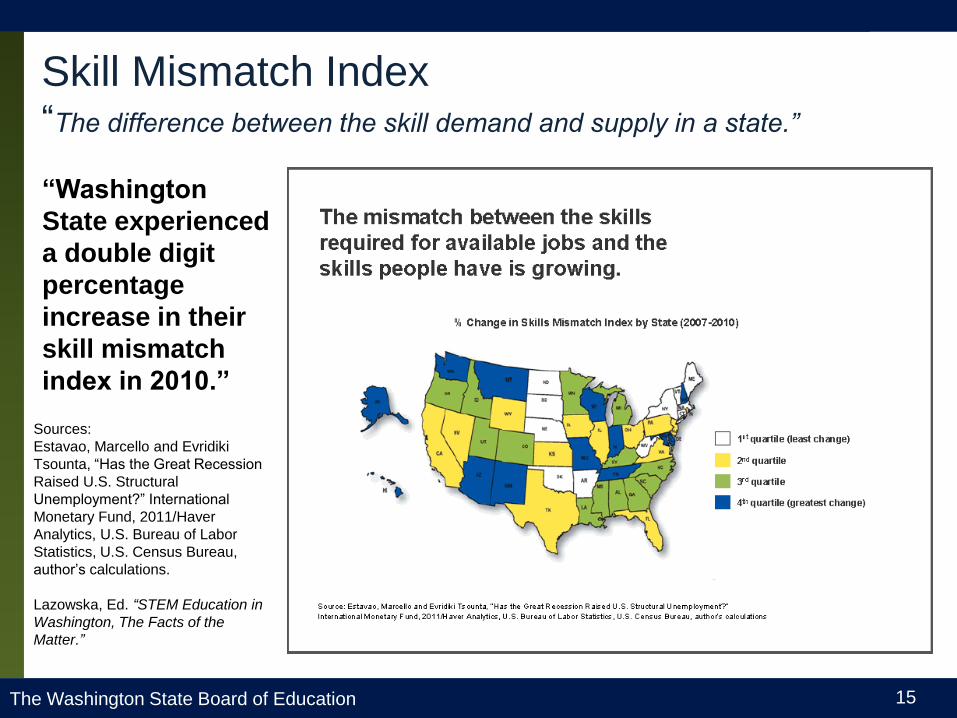
Skill Mismatch Index “The difference between the skill demand and supply in a state.”
Sources:
Estavao, Marcello and Evridiki
Tsounta, “Has the Great Recession
Raised U.S. Structural
Unemployment?” International
Monetary Fund, 2011/Haver
Analytics, U.S. Bureau of Labor
Statistics, U.S. Census Bureau,
author’s calculations.
Lazowska, Ed. “STEM Education in
Washington, The Facts of the
Matter.”
“Washington
State experienced
a double digit
percentage
increase in their
skill mismatch
index in 2010.”
The Washington State Board of Education 16
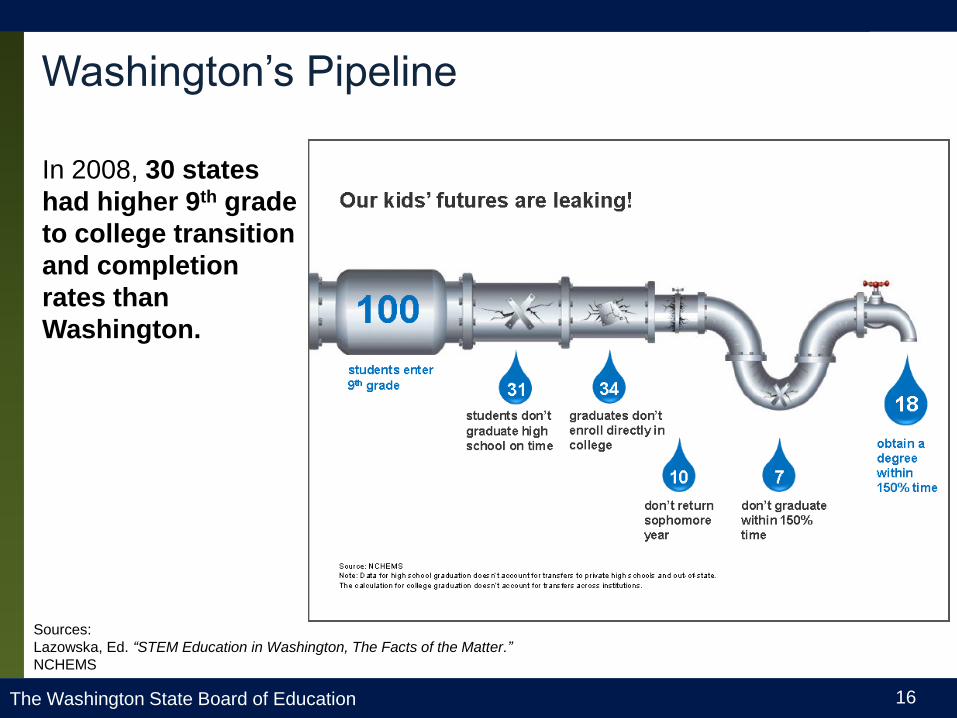
Washington’s Pipeline
In 2008, 30 states
had higher 9th grade
to college transition
and completion
rates than
Washington.
Sources:
Lazowska, Ed. “STEM Education in Washington, The Facts of the Matter.”
NCHEMS
The Washington State Board of Education 17
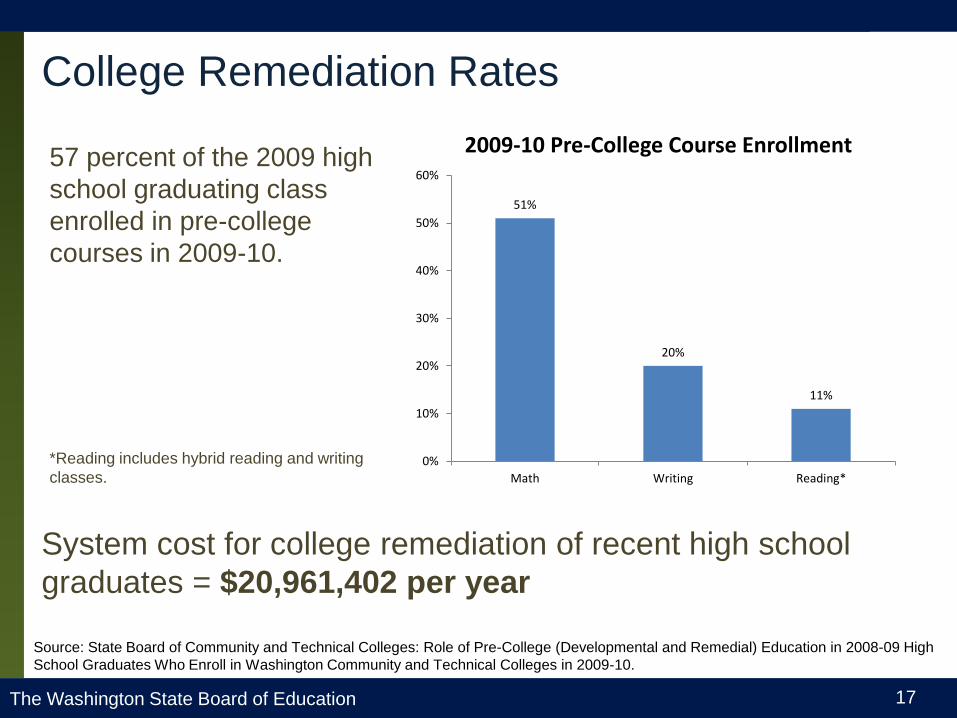
College Remediation Rates
57 percent of the 2009 high
school graduating class
enrolled in pre-college
courses in 2009-10.
*Reading includes hybrid reading and writing
classes.
51%
20%
11%
0%
10%
20%
30%
40%
50%
60%
Math Writing Reading*
2009-10 Pre-College Course Enrollment
System cost for college remediation of recent high school
graduates = $20,961,402 per year
Source: State Board of Community and Technical Colleges: Role of Pre-College (Developmental and Remedial) Education in 2008-09 High
School Graduates Who Enroll in Washington Community and Technical Colleges in 2009-10.

The Washington State Board of Education 18
How Washington’s Children Rank Among 50 States
Sixteen Indicators of Child Well-Being
Source: Washington State Budget & Policy Center
The Washington State Board of Education 19
Final Thoughts
• When viewing rankings, keep in mind – what's the ultimate goal?
• Participation rates, socio-economic factors play heavily in the outcome.
• Some outcomes make more sense to ‘rank’ than others.
• High school graduation is not always enough.
• Many graduates require remediation at the next level.
• Significant mismatch in workforce needs versus preparation/training.
• When it comes to system outcomes, aggregate state rankings can mask
the ‘opportunity gaps’ that exist for students of color.
• American Indian children – concern for the trend line.
• Widening gaps in some areas.
The Washington State Board of Education 20
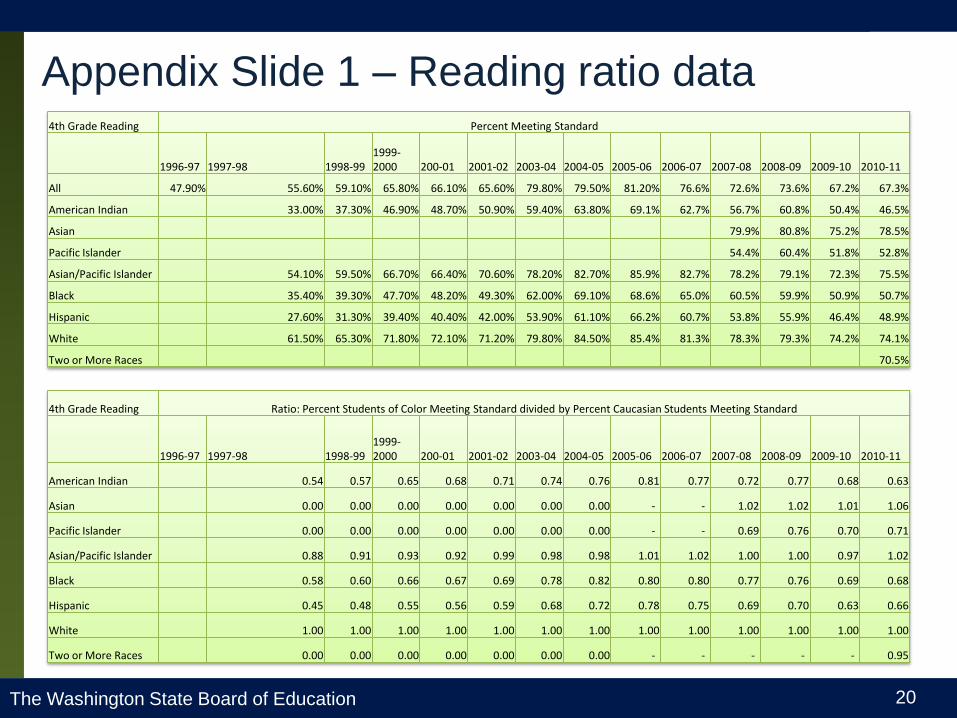
Appendix Slide 1 – Reading ratio data
4th Grade Reading Percent Meeting Standard
1996-97 1997-98 1998-99 1999-2000 200-01 2001-02 2003-04 2004-05 2005-06 2006-07 2007-08 2008-09 2009-10 2010-11
All 47.90% 55.60% 59.10% 65.80% 66.10% 65.60% 79.80% 79.50% 81.20% 76.6% 72.6% 73.6% 67.2% 67.3%
American Indian 33.00% 37.30% 46.90% 48.70% 50.90% 59.40% 63.80% 69.1% 62.7% 56.7% 60.8% 50.4% 46.5%
Asian 79.9% 80.8% 75.2% 78.5%
Pacific Islander 54.4% 60.4% 51.8% 52.8%
Asian/Pacific Islander 54.10% 59.50% 66.70% 66.40% 70.60% 78.20% 82.70% 85.9% 82.7% 78.2% 79.1% 72.3% 75.5%
Black 35.40% 39.30% 47.70% 48.20% 49.30% 62.00% 69.10% 68.6% 65.0% 60.5% 59.9% 50.9% 50.7%
Hispanic 27.60% 31.30% 39.40% 40.40% 42.00% 53.90% 61.10% 66.2% 60.7% 53.8% 55.9% 46.4% 48.9%
White 61.50% 65.30% 71.80% 72.10% 71.20% 79.80% 84.50% 85.4% 81.3% 78.3% 79.3% 74.2% 74.1%
Two or More Races 70.5%
4th Grade Reading Ratio: Percent Students of Color Meeting Standard divided by Percent Caucasian Students Meeting Standard
1996-97 1997-98 1998-99 1999-2000 200-01 2001-02 2003-04 2004-05 2005-06 2006-07 2007-08 2008-09 2009-10 2010-11
American Indian 0.54 0.57 0.65 0.68 0.71 0.74 0.76 0.81 0.77 0.72 0.77 0.68 0.63
Asian 0.00 0.00 0.00 0.00 0.00 0.00 0.00 - - 1.02 1.02 1.01 1.06
Pacific Islander 0.00 0.00 0.00 0.00 0.00 0.00 0.00 - - 0.69 0.76 0.70 0.71
Asian/Pacific Islander 0.88 0.91 0.93 0.92 0.99 0.98 0.98 1.01 1.02 1.00 1.00 0.97 1.02
Black 0.58 0.60 0.66 0.67 0.69 0.78 0.82 0.80 0.80 0.77 0.76 0.69 0.68
Hispanic 0.45 0.48 0.55 0.56 0.59 0.68 0.72 0.78 0.75 0.69 0.70 0.63 0.66
White 1.00 1.00 1.00 1.00 1.00 1.00 1.00 1.00 1.00 1.00 1.00 1.00 1.00
Two or More Races 0.00 0.00 0.00 0.00 0.00 0.00 0.00 - - - - - 0.95

The Washington State Board of Education 21
Appendix Slide 2 – Math ratio data
8th Grade Math MSP Percent Meeting Standard
2005-06 2006-07 2007-08 2008-09 2009-10 2010-11
American Indian 30.5% 28.3% 32.8% 31.4% 32.0% 28.7%
Asian 66.3% 65.3% 69.4% 69.7%
Pacific Islander 35.0% 36.6% 37.5% 34.6%
Asian/Pacific Islander 60.3% 58.9% 64.6% 63.3% 66.5% 66.0%
Black 22.4% 24.7% 28.0% 26.8% 29.6% 29.0%
Hispanic 26.3% 27.2% 30.1% 29.1% 31.3% 32.6%
White 54.5% 56.1% 57.6% 56.9% 57.1% 55.9%
Two or More Races 50.1%
8th Grade Math MSP Ratio: Percent Students of Color Meeting Standard divided by Percent Caucasian Students Meeting Standard
2005-06 2006-07 2007-08 2008-09 2009-10 2010-11
American Indian 0.56 0.50 0.57 0.55 0.56 0.51
Asian - - 1.15 1.15 1.22 1.25
Pacific Islander - - 0.61 0.64 0.66 0.62
Asian/Pacific Islander 1.11 1.05 1.12 1.11 1.16 1.18
Black 0.41 0.44 0.49 0.47 0.52 0.52
Hispanic 0.48 0.48 0.52 0.51 0.55 0.58
White 1.00 1.00 1.00 1.00 1.00 1.00
Two or More Races - - - - - 0.90


