Education & Young People's Services Performance Management Early Help & Preventative Services Monthly Scorecard August 2015 Release (July 2015 Data) Produced by: Management Information, KCC Publication Date: 26th August 2015
Transcript
Education & Young People's Services Performance Management
Early Help & Preventative Services Monthly Scorecard
August 2015 Release (July 2015 Data)
Produced by: Management Information, KCC
Publication Date: 26th August 2015
This page is intentionally blank
Early Help & Preventative Services Monthly Scorecard
Executive Summary
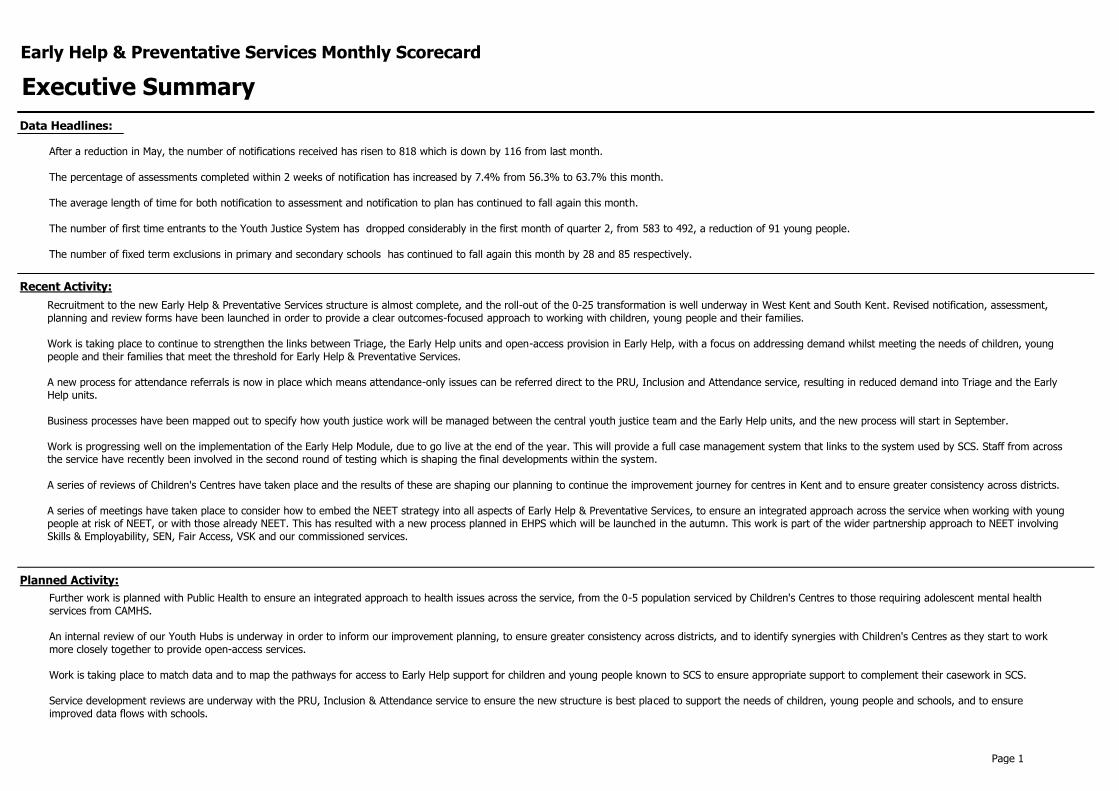
Data Headlines:
Recent Activity:
Planned Activity:
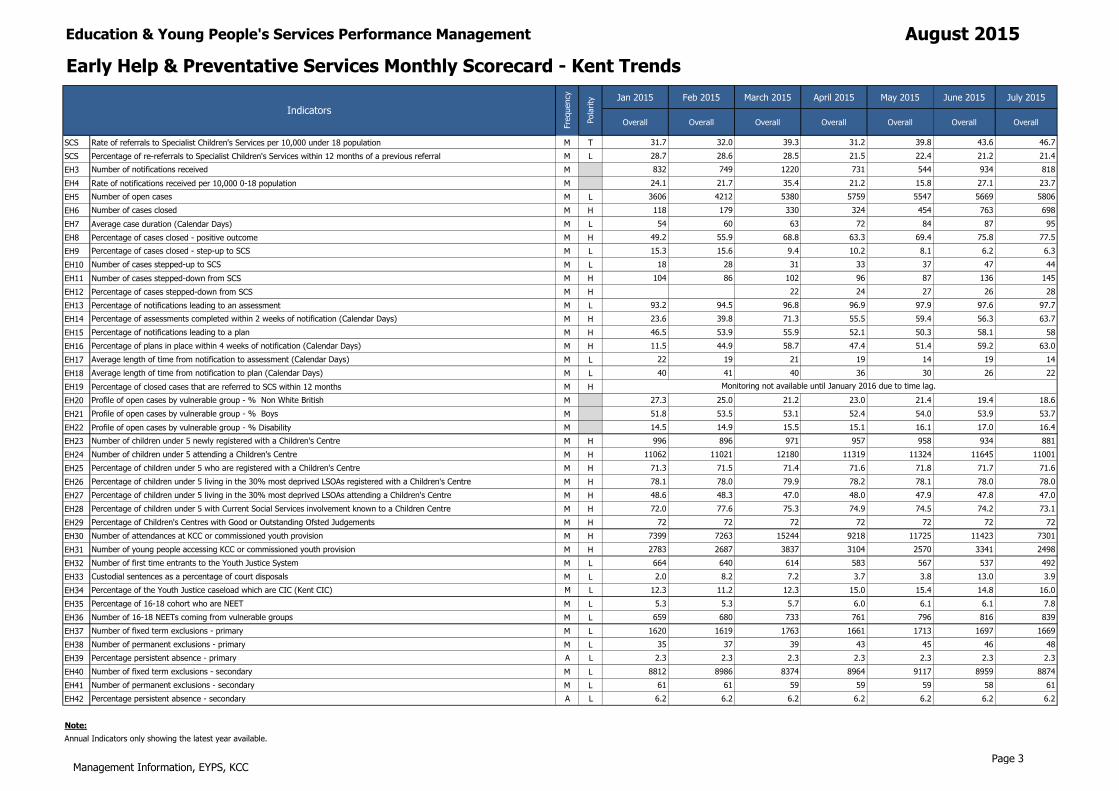
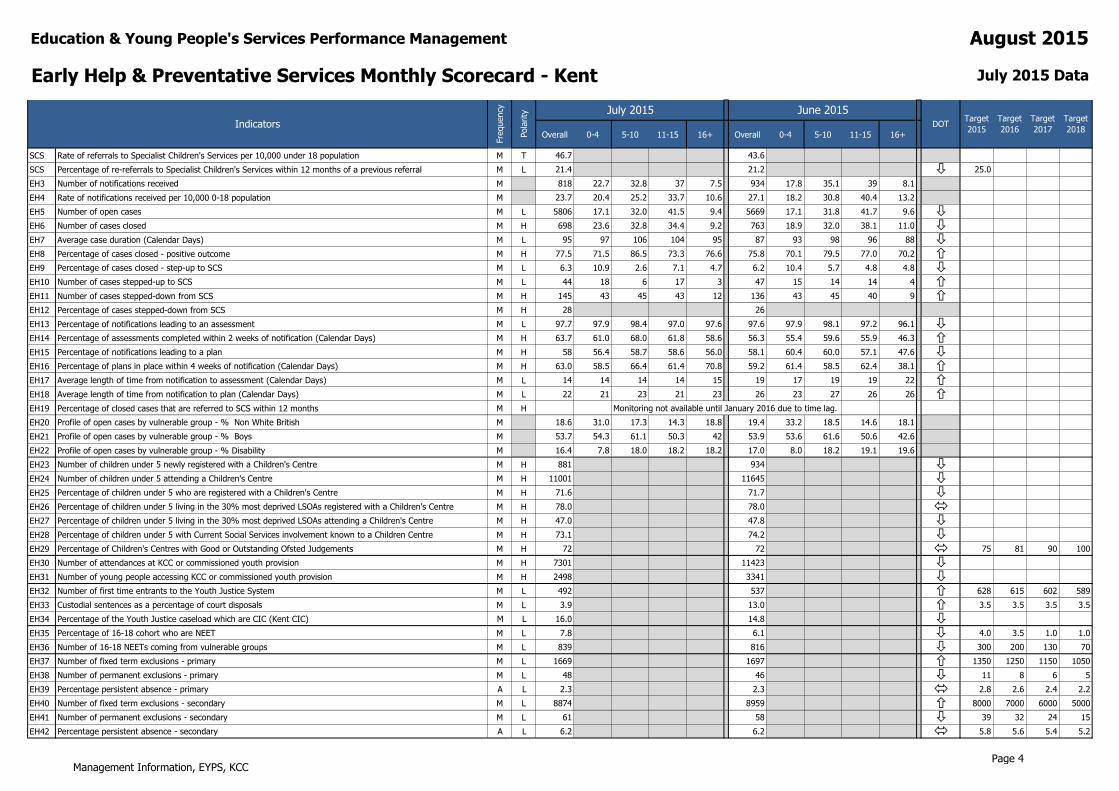
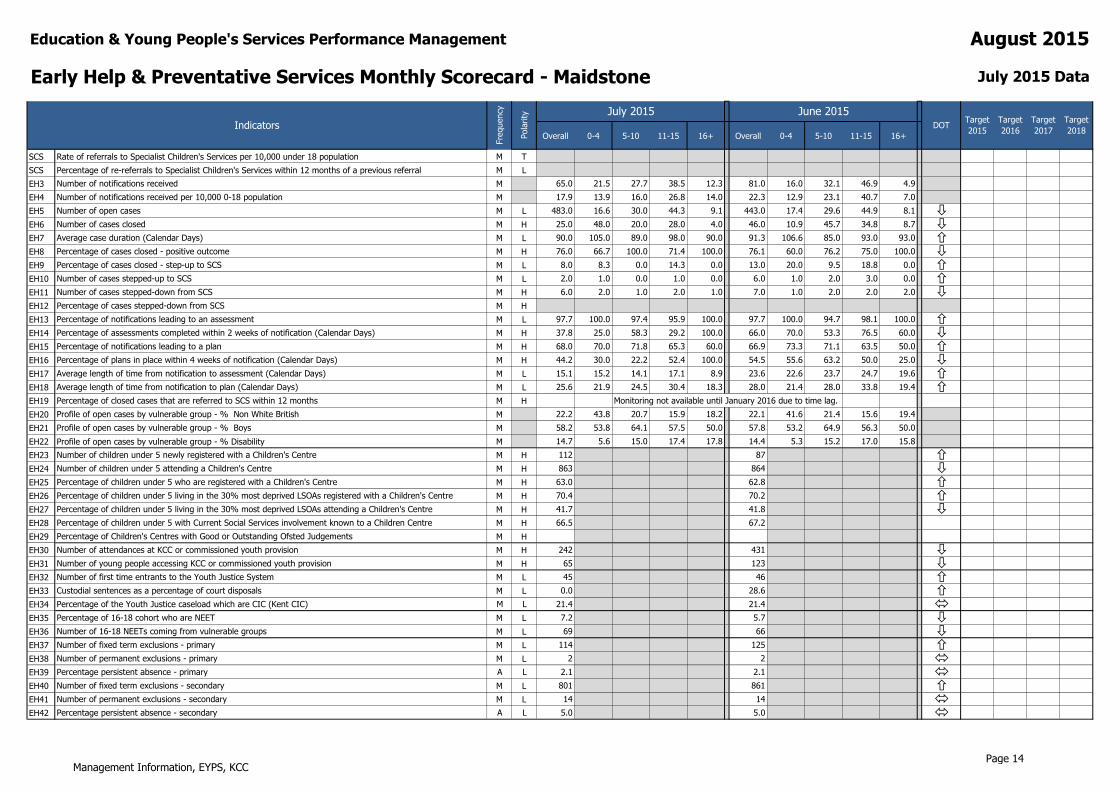
After a reduction in May, the number of notifications received has risen to 818 which is down by 116 from last month.
The percentage of assessments completed within 2 weeks of notification has increased by 7.4% from 56.3% to 63.7% this month.
The average length of time for both notification to assessment and notification to plan has continued to fall again this month.
The number of first time entrants to the Youth Justice System has dropped considerably in the first month of quarter 2, from 583 to 492, a reduction of 91 young people. The number of fixed term exclusions in primary and secondary schools has continued to fall again this month by 28 and 85 respectively.
Recruitment to the new Early Help & Preventative Services structure is almost complete, and the roll-out of the 0-25 transformation is well underway in West Kent and South Kent. Revised notification, assessment,
planning and review forms have been launched in order to provide a clear outcomes-focused approach to working with children, young people and their families.
Work is taking place to continue to strengthen the links between Triage, the Early Help units and open-access provision in Early Help, with a focus on addressing demand whilst meeting the needs of children, young
people and their families that meet the threshold for Early Help & Preventative Services.
A new process for attendance referrals is now in place which means attendance-only issues can be referred direct to the PRU, Inclusion and Attendance service, resulting in reduced demand into Triage and the Early Help units.
Business processes have been mapped out to specify how youth justice work will be managed between the central youth justice team and the Early Help units, and the new process will start in September.
Work is progressing well on the implementation of the Early Help Module, due to go live at the end of the year. This will provide a full case management system that links to the system used by SCS. Staff from across the service have recently been involved in the second round of testing which is shaping the final developments within the system.
A series of reviews of Children's Centres have taken place and the results of these are shaping our planning to continue the improvement journey for centres in Kent and to ensure greater consistency across districts.
A series of meetings have taken place to consider how to embed the NEET strategy into all aspects of Early Help & Preventative Services, to ensure an integrated approach across the service when working with young people at risk of NEET, or with those already NEET. This has resulted with a new process planned in EHPS which will be launched in the autumn. This work is part of the wider partnership approach to NEET involving
Skills & Employability, SEN, Fair Access, VSK and our commissioned services.
Further work is planned with Public Health to ensure an integrated approach to health issues across the service, from the 0-5 population serviced by Children's Centres to those requiring adolescent mental health
services from CAMHS.
An internal review of our Youth Hubs is underway in order to inform our improvement planning, to ensure greater consistency across districts, and to identify synergies with Children's Centres as they start to work
more closely together to provide open-access services.
Work is taking place to match data and to map the pathways for access to Early Help support for children and young people known to SCS to ensure appropriate support to complement their casework in SCS.
Service development reviews are underway with the PRU, Inclusion & Attendance service to ensure the new structure is best placed to support the needs of children, young people and schools, and to ensure
improved data flows with schools.
Page 1
Early Help & Preventative Services Monthly Scorecard
Guidance Notes
POLARITY
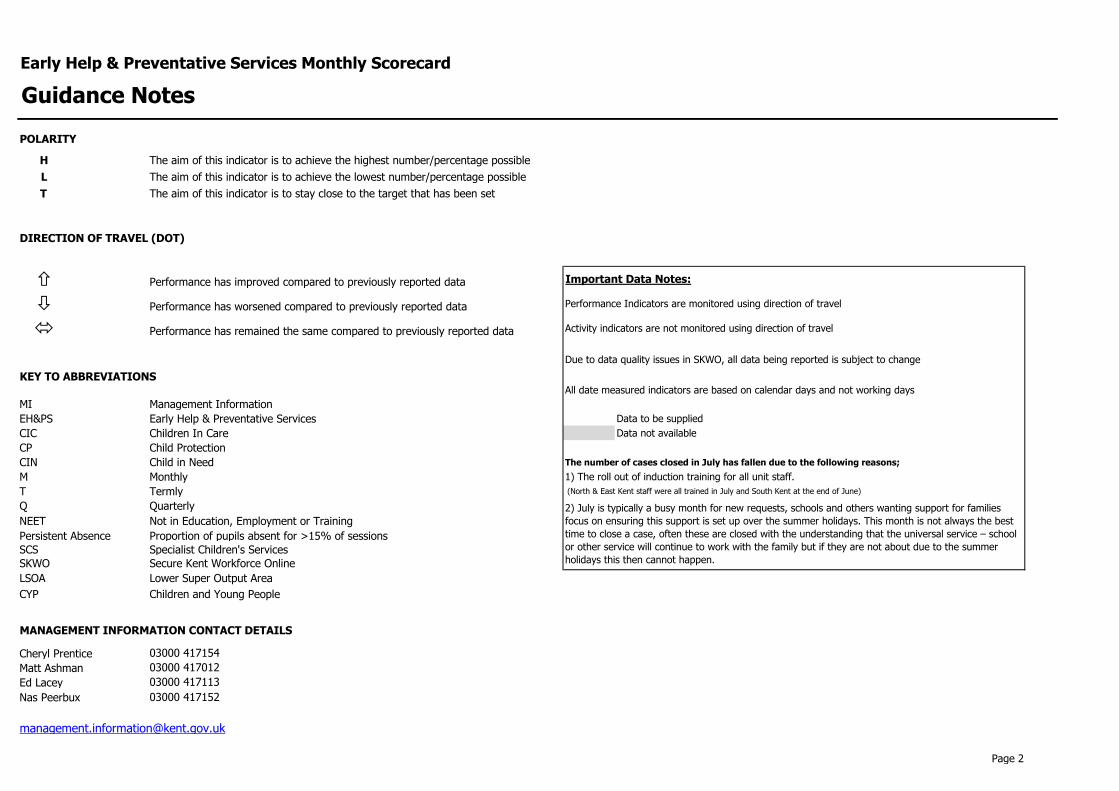
H The aim of this indicator is to achieve the highest number/percentage possible
L The aim of this indicator is to achieve the lowest number/percentage possible
T The aim of this indicator is to stay close to the target that has been set
DIRECTION OF TRAVEL (DOT)
Performance has improved compared to previously reported data Important Data Notes:
Performance has worsened compared to previously reported data Performance Indicators are monitored using direction of travel
Performance has remained the same compared to previously reported data Activity indicators are not monitored using direction of travel
Due to data quality issues in SKWO, all data being reported is subject to change
KEY TO ABBREVIATIONSAll date measured indicators are based on calendar days and not working days
MI Management Information
EH&PS Early Help & Preventative Services Data to be supplied
CIC Children In Care Data not available
CP Child Protection
CIN Child in Need The number of cases closed in July has fallen due to the following reasons;
M Monthly 1) The roll out of induction training for all unit staff.
T Termly (North & East Kent staff were all trained in July and South Kent at the end of June)
Q Quarterly
NEET Not in Education, Employment or Training
Persistent Absence Proportion of pupils absent for >15% of sessions
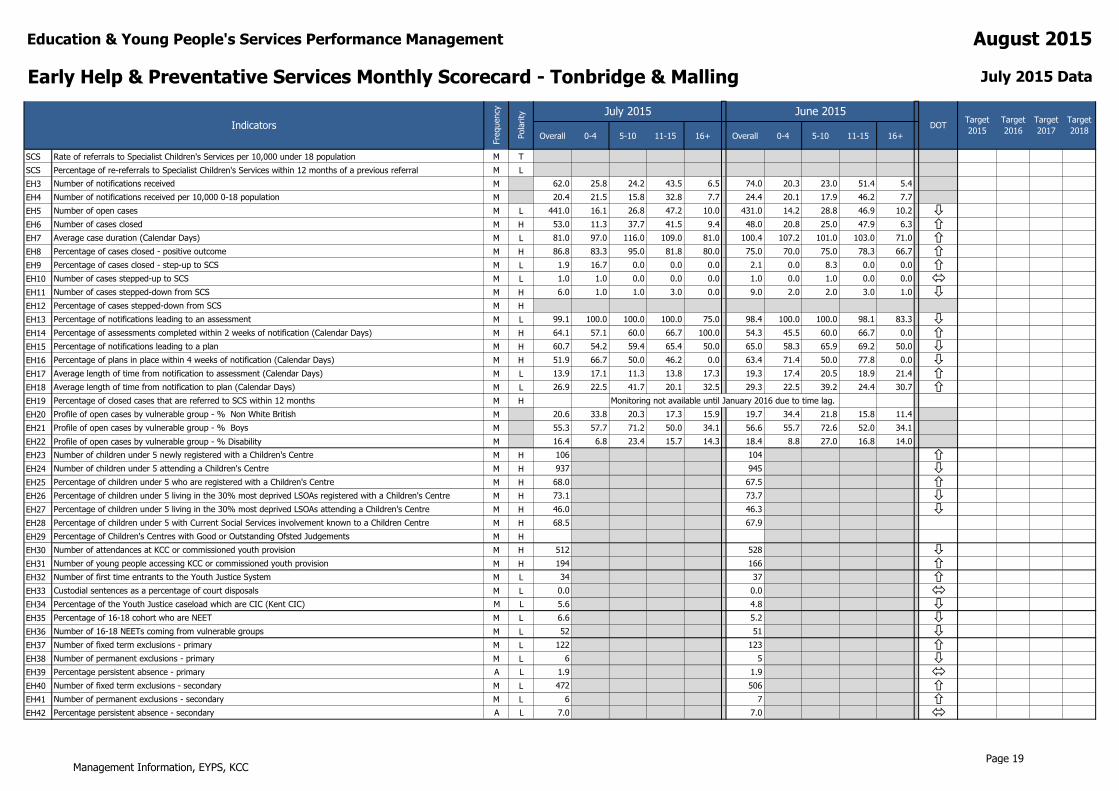
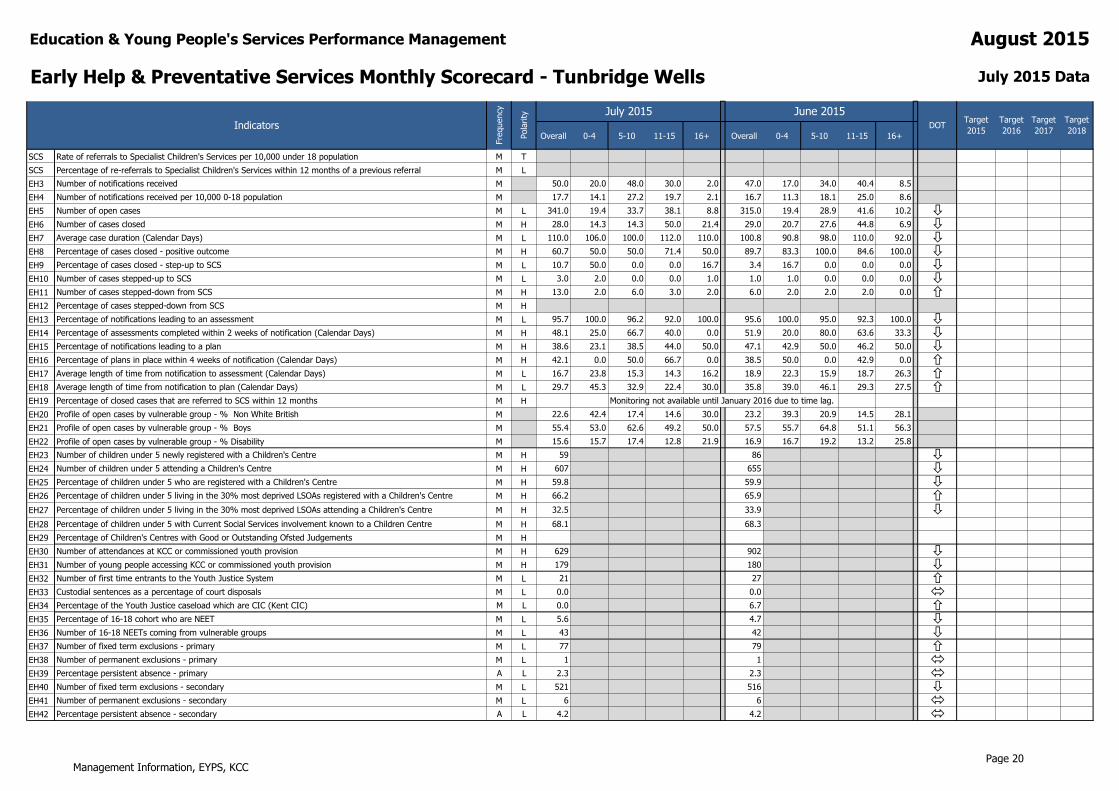
SCS Rate of referrals to Specialist Children's Services per 10,000 under 18 population M T
SCS Percentage of re-referrals to Specialist Children's Services within 12 months of a previous referral M L
EH3 Number of notifications received M 50.0 20.0 48.0 30.0 2.0 47.0 17.0 34.0 40.4 8.5
EH4 Number of notifications received per 10,000 0-18 population M 17.7 14.1 27.2 19.7 2.1 16.7 11.3 18.1 25.0 8.6
EH5 Number of open cases M L 341.0 19.4 33.7 38.1 8.8 315.0 19.4 28.9 41.6 10.2
EH6 Number of cases closed M H 28.0 14.3 14.3 50.0 21.4 29.0 20.7 27.6 44.8 6.9
EH7 Average case duration (Calendar Days) M L 110.0 106.0 100.0 112.0 110.0 100.8 90.8 98.0 110.0 92.0
EH8 Percentage of cases closed - positive outcome M H 60.7 50.0 50.0 71.4 50.0 89.7 83.3 100.0 84.6 100.0
EH9 Percentage of cases closed - step-up to SCS M L 10.7 50.0 0.0 0.0 16.7 3.4 16.7 0.0 0.0 0.0
EH10 Number of cases stepped-up to SCS M L 3.0 2.0 0.0 0.0 1.0 1.0 1.0 0.0 0.0 0.0
EH11 Number of cases stepped-down from SCS M H 13.0 2.0 6.0 3.0 2.0 6.0 2.0 2.0 2.0 0.0
EH12 Percentage of cases stepped-down from SCS M H
EH13 Percentage of notifications leading to an assessment M L 95.7 100.0 96.2 92.0 100.0 95.6 100.0 95.0 92.3 100.0
EH14 Percentage of assessments completed within 2 weeks of notification (Calendar Days) M H 48.1 25.0 66.7 40.0 0.0 51.9 20.0 80.0 63.6 33.3
EH15 Percentage of notifications leading to a plan M H 38.6 23.1 38.5 44.0 50.0 47.1 42.9 50.0 46.2 50.0
EH16 Percentage of plans in place within 4 weeks of notification (Calendar Days) M H 42.1 0.0 50.0 66.7 0.0 38.5 50.0 0.0 42.9 0.0
EH17 Average length of time from notification to assessment (Calendar Days) M L 16.7 23.8 15.3 14.3 16.2 18.9 22.3 15.9 18.7 26.3
EH18 Average length of time from notification to plan (Calendar Days) M L 29.7 45.3 32.9 22.4 30.0 35.8 39.0 46.1 29.3 27.5
EH19 Percentage of closed cases that are referred to SCS within 12 months M H Monitoring not available until January 2016 due to time lag.
EH20 Profile of open cases by vulnerable group - % Non White British M 22.6 42.4 17.4 14.6 30.0 23.2 39.3 20.9 14.5 28.1
EH21 Profile of open cases by vulnerable group - % Boys M 55.4 53.0 62.6 49.2 50.0 57.5 55.7 64.8 51.1 56.3
EH22 Profile of open cases by vulnerable group - % Disability M 15.6 15.7 17.4 12.8 21.9 16.9 16.7 19.2 13.2 25.8
EH23 Number of children under 5 newly registered with a Children's Centre M H 59 86
EH24 Number of children under 5 attending a Children's Centre M H 607 655
EH25 Percentage of children under 5 who are registered with a Children's Centre M H 59.8 59.9
EH26 Percentage of children under 5 living in the 30% most deprived LSOAs registered with a Children's Centre M H 66.2 65.9
EH27 Percentage of children under 5 living in the 30% most deprived LSOAs attending a Children's Centre M H 32.5 33.9
EH28 Percentage of children under 5 with Current Social Services involvement known to a Children Centre M H 68.1 68.3
EH29 Percentage of Children's Centres with Good or Outstanding Ofsted Judgements M H
EH30 Number of attendances at KCC or commissioned youth provision M H 629 902
EH31 Number of young people accessing KCC or commissioned youth provision M H 179 180
EH32 Number of first time entrants to the Youth Justice System M L 21 27
EH33 Custodial sentences as a percentage of court disposals M L 0.0 0.0
EH34 Percentage of the Youth Justice caseload which are CIC (Kent CIC) M L 0.0 6.7
EH35 Percentage of 16-18 cohort who are NEET M L 5.6 4.7
EH36 Number of 16-18 NEETs coming from vulnerable groups M L 43 42
EH37 Number of fixed term exclusions - primary M L 77 79
EH38 Number of permanent exclusions - primary M L 1 1
EH39 Percentage persistent absence - primary A L 2.3 2.3
EH40 Number of fixed term exclusions - secondary M L 521 516
EH41 Number of permanent exclusions - secondary M L 6 6
EH42 Percentage persistent absence - secondary A L 4.2 4.2
August 2015
Indicators
Fre
quency
Pola
rity July 2015 June 2015
DOTTarget
2017
Target
2018
Target
2015
Target
2016
Management Information, EYPS, KCCPage 20
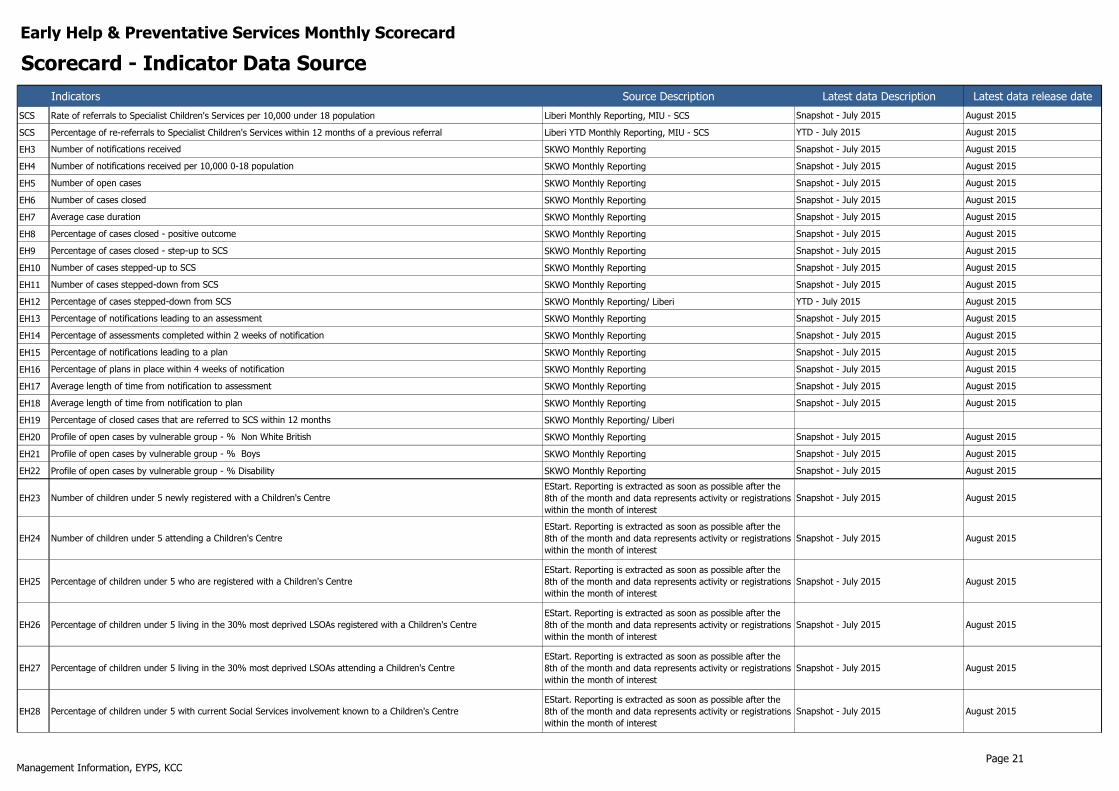
Early Help & Preventative Services Monthly Scorecard
Scorecard - Indicator Data Source
Indicators Source Description Latest data Description Latest data release date
SCS Rate of referrals to Specialist Children's Services per 10,000 under 18 population Liberi Monthly Reporting, MIU - SCS Snapshot - July 2015 August 2015
SCS Percentage of re-referrals to Specialist Children's Services within 12 months of a previous referral Liberi YTD Monthly Reporting, MIU - SCS YTD - July 2015 August 2015
EH3 Number of notifications received SKWO Monthly Reporting Snapshot - July 2015 August 2015
EH4 Number of notifications received per 10,000 0-18 population SKWO Monthly Reporting Snapshot - July 2015 August 2015
EH5 Number of open cases SKWO Monthly Reporting Snapshot - July 2015 August 2015
EH6 Number of cases closed SKWO Monthly Reporting Snapshot - July 2015 August 2015
EH7 Average case duration SKWO Monthly Reporting Snapshot - July 2015 August 2015
EH8 Percentage of cases closed - positive outcome SKWO Monthly Reporting Snapshot - July 2015 August 2015
EH9 Percentage of cases closed - step-up to SCS SKWO Monthly Reporting Snapshot - July 2015 August 2015
EH10 Number of cases stepped-up to SCS SKWO Monthly Reporting Snapshot - July 2015 August 2015
EH11 Number of cases stepped-down from SCS SKWO Monthly Reporting Snapshot - July 2015 August 2015
EH12 Percentage of cases stepped-down from SCS SKWO Monthly Reporting/ Liberi YTD - July 2015 August 2015
EH13 Percentage of notifications leading to an assessment SKWO Monthly Reporting Snapshot - July 2015 August 2015
EH14 Percentage of assessments completed within 2 weeks of notification SKWO Monthly Reporting Snapshot - July 2015 August 2015
EH15 Percentage of notifications leading to a plan SKWO Monthly Reporting Snapshot - July 2015 August 2015
EH16 Percentage of plans in place within 4 weeks of notification SKWO Monthly Reporting Snapshot - July 2015 August 2015
EH17 Average length of time from notification to assessment SKWO Monthly Reporting Snapshot - July 2015 August 2015
EH18 Average length of time from notification to plan SKWO Monthly Reporting Snapshot - July 2015 August 2015
EH19 Percentage of closed cases that are referred to SCS within 12 months SKWO Monthly Reporting/ Liberi
EH20 Profile of open cases by vulnerable group - % Non White British SKWO Monthly Reporting Snapshot - July 2015 August 2015
EH21 Profile of open cases by vulnerable group - % Boys SKWO Monthly Reporting Snapshot - July 2015 August 2015
EH22 Profile of open cases by vulnerable group - % Disability SKWO Monthly Reporting Snapshot - July 2015 August 2015
EH23 Number of children under 5 newly registered with a Children's Centre
EStart. Reporting is extracted as soon as possible after the
8th of the month and data represents activity or registrations
within the month of interest
Snapshot - July 2015 August 2015
EH24 Number of children under 5 attending a Children's Centre
EStart. Reporting is extracted as soon as possible after the
8th of the month and data represents activity or registrations
within the month of interest
Snapshot - July 2015 August 2015
EH25 Percentage of children under 5 who are registered with a Children's Centre
EStart. Reporting is extracted as soon as possible after the
8th of the month and data represents activity or registrations
within the month of interest
Snapshot - July 2015 August 2015
EH26 Percentage of children under 5 living in the 30% most deprived LSOAs registered with a Children's Centre
EStart. Reporting is extracted as soon as possible after the
8th of the month and data represents activity or registrations
within the month of interest
Snapshot - July 2015 August 2015
EH27 Percentage of children under 5 living in the 30% most deprived LSOAs attending a Children's Centre
EStart. Reporting is extracted as soon as possible after the
8th of the month and data represents activity or registrations
within the month of interest
Snapshot - July 2015 August 2015
EH28 Percentage of children under 5 with current Social Services involvement known to a Children's Centre
EStart. Reporting is extracted as soon as possible after the
8th of the month and data represents activity or registrations
within the month of interest
Snapshot - July 2015 August 2015
Management Information, EYPS, KCCPage 21
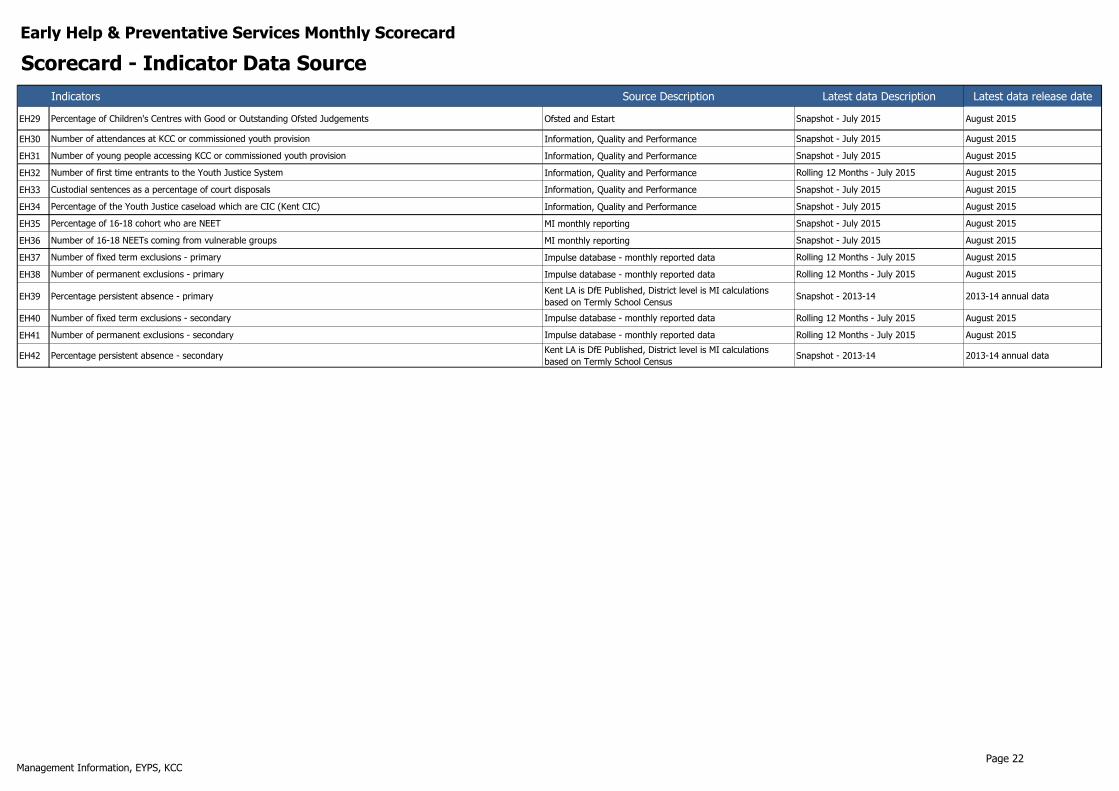
Early Help & Preventative Services Monthly Scorecard
Scorecard - Indicator Data Source
Indicators Source Description Latest data Description Latest data release date
EH29 Percentage of Children's Centres with Good or Outstanding Ofsted Judgements Ofsted and Estart Snapshot - July 2015 August 2015
EH30 Number of attendances at KCC or commissioned youth provision Information, Quality and Performance Snapshot - July 2015 August 2015
EH31 Number of young people accessing KCC or commissioned youth provision Information, Quality and Performance Snapshot - July 2015 August 2015
EH32 Number of first time entrants to the Youth Justice System Information, Quality and Performance Rolling 12 Months - July 2015 August 2015
EH33 Custodial sentences as a percentage of court disposals Information, Quality and Performance Snapshot - July 2015 August 2015
EH34 Percentage of the Youth Justice caseload which are CIC (Kent CIC) Information, Quality and Performance Snapshot - July 2015 August 2015
EH35 Percentage of 16-18 cohort who are NEET MI monthly reporting Snapshot - July 2015 August 2015
EH36 Number of 16-18 NEETs coming from vulnerable groups MI monthly reporting Snapshot - July 2015 August 2015
EH37 Number of fixed term exclusions - primary Impulse database - monthly reported data Rolling 12 Months - July 2015 August 2015
EH38 Number of permanent exclusions - primary Impulse database - monthly reported data Rolling 12 Months - July 2015 August 2015
EH39 Percentage persistent absence - primaryKent LA is DfE Published, District level is MI calculations
based on Termly School CensusSnapshot - 2013-14 2013-14 annual data
EH40 Number of fixed term exclusions - secondary Impulse database - monthly reported data Rolling 12 Months - July 2015 August 2015
EH41 Number of permanent exclusions - secondary Impulse database - monthly reported data Rolling 12 Months - July 2015 August 2015
EH42 Percentage persistent absence - secondaryKent LA is DfE Published, District level is MI calculations
based on Termly School CensusSnapshot - 2013-14 2013-14 annual data
Management Information, EYPS, KCCPage 22
Early Help & Preventative Services Monthly Scorecard
Scorecard - Indicator Definitions
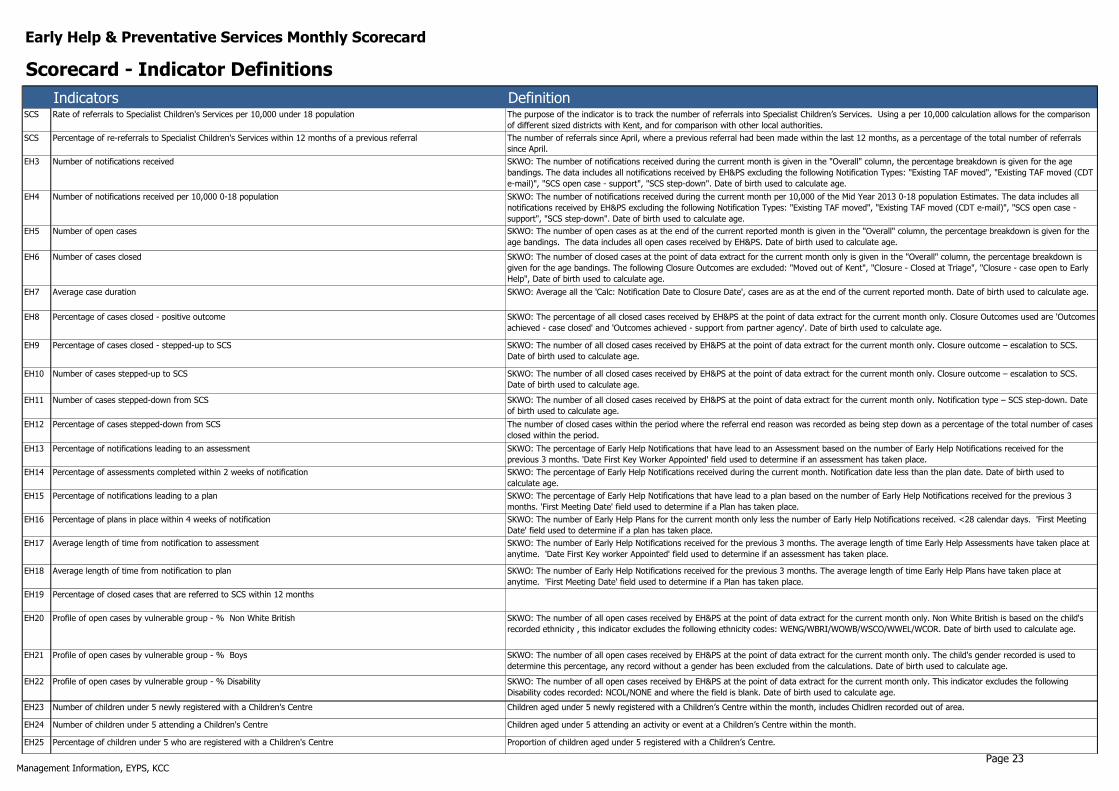
Indicators DefinitionSCS Rate of referrals to Specialist Children's Services per 10,000 under 18 population The purpose of the indicator is to track the number of referrals into Specialist Children’s Services. Using a per 10,000 calculation allows for the comparison
of different sized districts with Kent, and for comparison with other local authorities.
SCS Percentage of re-referrals to Specialist Children's Services within 12 months of a previous referral The number of referrals since April, where a previous referral had been made within the last 12 months, as a percentage of the total number of referrals
since April.
EH3 Number of notifications received SKWO: The number of notifications received during the current month is given in the "Overall" column, the percentage breakdown is given for the age
bandings. The data includes all notifications received by EH&PS excluding the following Notification Types: "Existing TAF moved", "Existing TAF moved (CDT
e-mail)", "SCS open case - support", "SCS step-down". Date of birth used to calculate age.
EH4 Number of notifications received per 10,000 0-18 population SKWO: The number of notifications received during the current month per 10,000 of the Mid Year 2013 0-18 population Estimates. The data includes all
notifications received by EH&PS excluding the following Notification Types: "Existing TAF moved", "Existing TAF moved (CDT e-mail)", "SCS open case -
support", "SCS step-down". Date of birth used to calculate age.
EH5 Number of open cases SKWO: The number of open cases as at the end of the current reported month is given in the "Overall" column, the percentage breakdown is given for the
age bandings. The data includes all open cases received by EH&PS. Date of birth used to calculate age.
EH6 Number of cases closed SKWO: The number of closed cases at the point of data extract for the current month only is given in the "Overall" column, the percentage breakdown is
given for the age bandings. The following Closure Outcomes are excluded: "Moved out of Kent", "Closure - Closed at Triage", "Closure - case open to Early
Help", Date of birth used to calculate age.
EH7 Average case duration SKWO: Average all the 'Calc: Notification Date to Closure Date', cases are as at the end of the current reported month. Date of birth used to calculate age.
EH8 Percentage of cases closed - positive outcome SKWO: The percentage of all closed cases received by EH&PS at the point of data extract for the current month only. Closure Outcomes used are 'Outcomes
achieved - case closed' and 'Outcomes achieved - support from partner agency'. Date of birth used to calculate age.
EH9 Percentage of cases closed - stepped-up to SCS SKWO: The number of all closed cases received by EH&PS at the point of data extract for the current month only. Closure outcome – escalation to SCS.
Date of birth used to calculate age.
EH10 Number of cases stepped-up to SCS SKWO: The number of all closed cases received by EH&PS at the point of data extract for the current month only. Closure outcome – escalation to SCS.
Date of birth used to calculate age.
EH11 Number of cases stepped-down from SCS SKWO: The number of all closed cases received by EH&PS at the point of data extract for the current month only. Notification type – SCS step-down. Date
of birth used to calculate age.
EH12 Percentage of cases stepped-down from SCS The number of closed cases within the period where the referral end reason was recorded as being step down as a percentage of the total number of cases
closed within the period.
EH13 Percentage of notifications leading to an assessment SKWO: The percentage of Early Help Notifications that have lead to an Assessment based on the number of Early Help Notifications received for the
previous 3 months. 'Date First Key Worker Appointed' field used to determine if an assessment has taken place.
EH14 Percentage of assessments completed within 2 weeks of notification SKWO: The percentage of Early Help Notifications received during the current month. Notification date less than the plan date. Date of birth used to
calculate age.
EH15 Percentage of notifications leading to a plan SKWO: The percentage of Early Help Notifications that have lead to a plan based on the number of Early Help Notifications received for the previous 3
months. 'First Meeting Date' field used to determine if a Plan has taken place.
EH16 Percentage of plans in place within 4 weeks of notification SKWO: The number of Early Help Plans for the current month only less the number of Early Help Notifications received. <28 calendar days. 'First Meeting
Date' field used to determine if a plan has taken place.
EH17 Average length of time from notification to assessment SKWO: The number of Early Help Notifications received for the previous 3 months. The average length of time Early Help Assessments have taken place at
anytime. 'Date First Key worker Appointed' field used to determine if an assessment has taken place.
EH18 Average length of time from notification to plan SKWO: The number of Early Help Notifications received for the previous 3 months. The average length of time Early Help Plans have taken place at
anytime. 'First Meeting Date' field used to determine if a Plan has taken place.
EH19 Percentage of closed cases that are referred to SCS within 12 months
EH20 Profile of open cases by vulnerable group - % Non White British SKWO: The number of all open cases received by EH&PS at the point of data extract for the current month only. Non White British is based on the child's
recorded ethnicity , this indicator excludes the following ethnicity codes: WENG/WBRI/WOWB/WSCO/WWEL/WCOR. Date of birth used to calculate age.
EH21 Profile of open cases by vulnerable group - % Boys SKWO: The number of all open cases received by EH&PS at the point of data extract for the current month only. The child's gender recorded is used to
determine this percentage, any record without a gender has been excluded from the calculations. Date of birth used to calculate age.
EH22 Profile of open cases by vulnerable group - % Disability SKWO: The number of all open cases received by EH&PS at the point of data extract for the current month only. This indicator excludes the following
Disability codes recorded: NCOL/NONE and where the field is blank. Date of birth used to calculate age.
EH23 Number of children under 5 newly registered with a Children's Centre Children aged under 5 newly registered with a Children’s Centre within the month, includes Chidlren recorded out of area.
EH24 Number of children under 5 attending a Children's Centre Children aged under 5 attending an activity or event at a Children’s Centre within the month.
EH25 Percentage of children under 5 who are registered with a Children's Centre Proportion of children aged under 5 registered with a Children’s Centre.
Management Information, EYPS, KCCPage 23
Early Help & Preventative Services Monthly Scorecard
Scorecard - Indicator Definitions
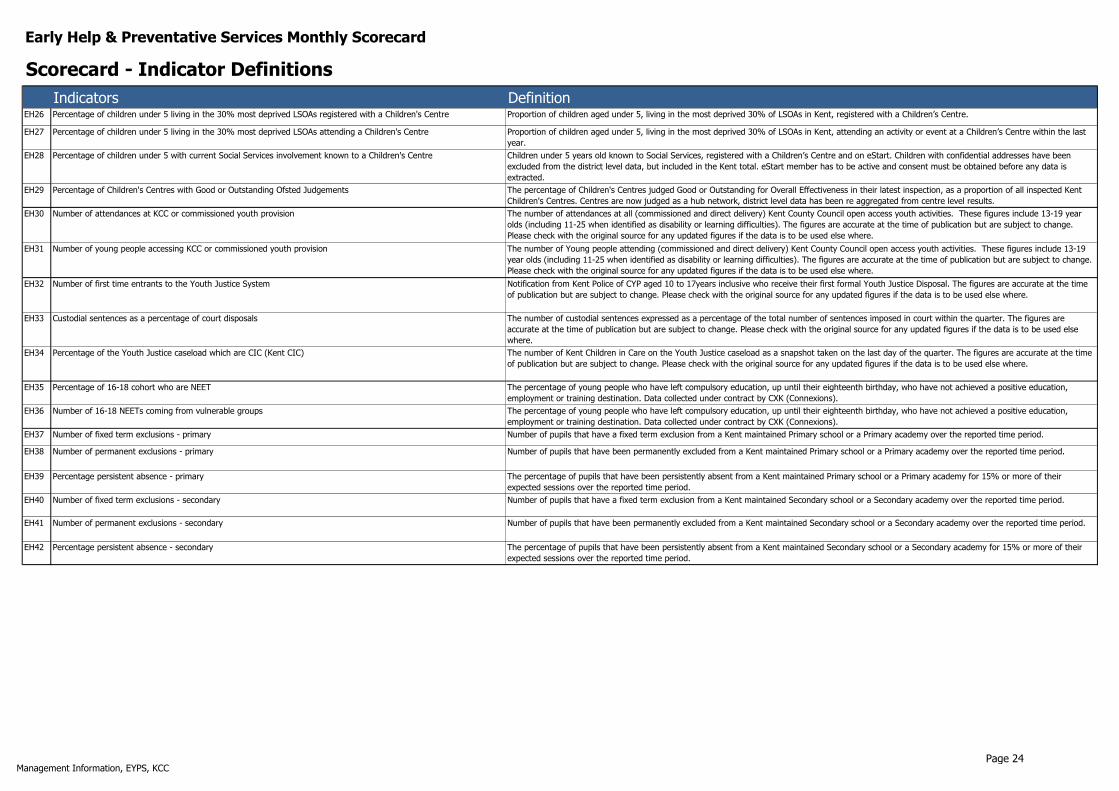
Indicators DefinitionEH26 Percentage of children under 5 living in the 30% most deprived LSOAs registered with a Children's Centre Proportion of children aged under 5, living in the most deprived 30% of LSOAs in Kent, registered with a Children’s Centre.
EH27 Percentage of children under 5 living in the 30% most deprived LSOAs attending a Children's Centre Proportion of children aged under 5, living in the most deprived 30% of LSOAs in Kent, attending an activity or event at a Children’s Centre within the last
year.
EH28 Percentage of children under 5 with current Social Services involvement known to a Children's Centre Children under 5 years old known to Social Services, registered with a Children’s Centre and on eStart. Children with confidential addresses have been
excluded from the district level data, but included in the Kent total. eStart member has to be active and consent must be obtained before any data is
extracted.
EH29 Percentage of Children's Centres with Good or Outstanding Ofsted Judgements The percentage of Children's Centres judged Good or Outstanding for Overall Effectiveness in their latest inspection, as a proportion of all inspected Kent
Children's Centres. Centres are now judged as a hub network, district level data has been re aggregated from centre level results.
EH30 Number of attendances at KCC or commissioned youth provision The number of attendances at all (commissioned and direct delivery) Kent County Council open access youth activities. These figures include 13-19 year
olds (including 11-25 when identified as disability or learning difficulties). The figures are accurate at the time of publication but are subject to change.
Please check with the original source for any updated figures if the data is to be used else where.
EH31 Number of young people accessing KCC or commissioned youth provision The number of Young people attending (commissioned and direct delivery) Kent County Council open access youth activities. These figures include 13-19
year olds (including 11-25 when identified as disability or learning difficulties). The figures are accurate at the time of publication but are subject to change.
Please check with the original source for any updated figures if the data is to be used else where.
EH32 Number of first time entrants to the Youth Justice System Notification from Kent Police of CYP aged 10 to 17years inclusive who receive their first formal Youth Justice Disposal. The figures are accurate at the time
of publication but are subject to change. Please check with the original source for any updated figures if the data is to be used else where.
EH33 Custodial sentences as a percentage of court disposals The number of custodial sentences expressed as a percentage of the total number of sentences imposed in court within the quarter. The figures are
accurate at the time of publication but are subject to change. Please check with the original source for any updated figures if the data is to be used else
where.
EH34 Percentage of the Youth Justice caseload which are CIC (Kent CIC) The number of Kent Children in Care on the Youth Justice caseload as a snapshot taken on the last day of the quarter. The figures are accurate at the time
of publication but are subject to change. Please check with the original source for any updated figures if the data is to be used else where.
EH35 Percentage of 16-18 cohort who are NEET The percentage of young people who have left compulsory education, up until their eighteenth birthday, who have not achieved a positive education,
employment or training destination. Data collected under contract by CXK (Connexions).
EH36 Number of 16-18 NEETs coming from vulnerable groups The percentage of young people who have left compulsory education, up until their eighteenth birthday, who have not achieved a positive education,
employment or training destination. Data collected under contract by CXK (Connexions).
EH37 Number of fixed term exclusions - primary Number of pupils that have a fixed term exclusion from a Kent maintained Primary school or a Primary academy over the reported time period.
EH38 Number of permanent exclusions - primary Number of pupils that have been permanently excluded from a Kent maintained Primary school or a Primary academy over the reported time period.
EH39 Percentage persistent absence - primary The percentage of pupils that have been persistently absent from a Kent maintained Primary school or a Primary academy for 15% or more of their
expected sessions over the reported time period.
EH40 Number of fixed term exclusions - secondary Number of pupils that have a fixed term exclusion from a Kent maintained Secondary school or a Secondary academy over the reported time period.
EH41 Number of permanent exclusions - secondary Number of pupils that have been permanently excluded from a Kent maintained Secondary school or a Secondary academy over the reported time period.
EH42 Percentage persistent absence - secondary The percentage of pupils that have been persistently absent from a Kent maintained Secondary school or a Secondary academy for 15% or more of their