+ All Categories
Home > Education > Educational Data Mining in Program Evaluation: Lessons Learned

Educational Data Mining in Program Evaluation: Lessons Learned

Date post: 08-Jan-2017
Category:
Upload: kerry-rice
View: 96 times
Download: 1 times
Share this document with a friend
28
© 2016 Boise State University 1 Kerry Rice, Jui-Long Hung, Yu-Chang Hsu, Brett E. Shelton Department of Educational Technology Boise State University Educational Data Mining in Program Evaluation: Lessons Learned AECT 2016, Las Vegas
Transcript

© 2016 Boise State University 1

Kerry Rice, Jui-Long Hung, Yu-Chang Hsu, Brett E. SheltonDepartment of Educational Technology

Boise State University

Educational Data Mining in Program Evaluation: Lessons Learned

AECT 2016, Las Vegas

© 2016 Boise State University 2

METEd. D. Ed. S. Graduate Certificates:

Online Teaching Technology Integration SpecialistSchool Technology Coordinator

K-12 Online Teaching EndorsementCollege of Education

© 2016 Boise State University 3

Go Broncos!

© 2016 Boise State University 4

Decision Tree Analysis (performance prediction)

Cluster Analysis (engagement)

Sequential Association Analysis (path analysis)

Educational Data Mining Applications

Time Series Analysis (future performance prediction)

© 2016 Boise State University 5

Study #1: Teacher Training Workshops 2010

• Survey Data + Data Mining + Student Outcomes

• Research Goal: – Program

improvement– Satisfaction – Impact on practice

• Blackboard• 103 participants• 31,417 learning logs• Cluster Analysis;

Sequential Association Analysis; Decision Tree Analysis;

© 2016 Boise State University 6

Study #2: Online Graduate Teacher Education 2010• Data Mining + Student

Outcomes (no demographic data)

• Research Goal: – Identify struggling students– Adjust teaching strategies– Improve course design– Data Visualization

• Study Design– Comparative (between and

within courses)– Random course selection

• Moodle• Two graduate courses

(X and Y)• Each with two sections

– X1 (18 students)– X2 (19 students)– Y1 (18 students)– Y2 (22 students)

• 2,744,433 server logs• Cluster Analysis; Sequential

Association Analysis; Decision Tree Analysis; Data Visualization

© 2016 Boise State University 7

• Data mining + Demographics + Survey Data + Student Outcomes

• Research Goal: Large scale program evaluation– Support decision making at the

course and institutional level – Identify key variables and

relationships between teacher and course satisfaction, student behaviors, and performance outcomes

Study #3: End of Year K-12 Online Program Evaluation 2012

• Blackboard LMS• 7500 students • 883 courses• 23,854,527 learning logs

(over 1 billion records)• Cluster Analysis; Decision

Tree Analysis

© 2016 Boise State University 8

Study #4: End of Year K-12 Blended Program Evaluation 2012

• Blackboard LMS• 255 Enrollments • 33 course sections• 17 unique courses• Satisfaction Survey• Data from 2011 pilot

study• Cluster Analysis;

Decision Tree Analysis

• Demographics + Survey Data + Data Mining + Student Outcomes

• Research Goal: Test Framework in Blended Learning– Support decision making at the

course and institutional level? – Identify key variables and

relationships between teacher and course satisfaction, student behaviors, and performance outcomes

© 2016 Boise State University 9

Study #5: Online Graduate Teacher Education, 2014

• Moodle LMS• 509 Enrollments • 25 course sections• 12 unique courses• 431,708 records• Time Series Analysis• 34 original and derived

variables–static (demographic)–dynamic (engagement)

• Demographics + Data Mining + Student Outcomes

• Research Goal: – Could we identify at-risk

students in real time?– When?

© 2016 Boise State University 10

Study #6: Online Graduate Teacher Education, 2015

• Moodle LMS• 661 Enrollments • 31 course sections• 18 unique courses• 546,965 records• Time Series Analysis• 34 original and derived

variables–static (demographic)–dynamic (engagement)

• Demographics + Data Mining + Student Outcomes

• Research Goal: – Did the model developed in

Study #5 work with new semester data?

– Were the predictive (timing) results the same?

– Were frequency data more predictive?

© 2016 Boise State University 11

Variables - actual and derived

Engagement

© 2016 Boise State University 12

Cluster Analysis

Student clustering which describes shared characteristics of students who passed or failed their courses

© 2016 Boise State University 13

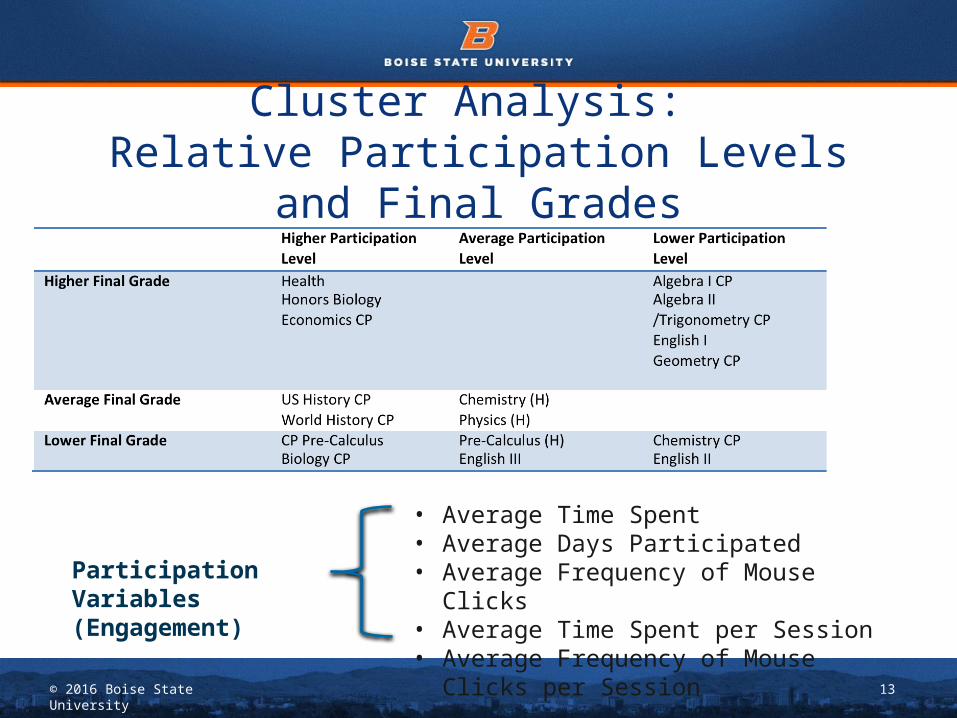
Cluster Analysis: Relative Participation Levels and Final Grades

• Average Time Spent• Average Days Participated• Average Frequency of Mouse Clicks • Average Time Spent per Session• Average Frequency of Mouse Clicks per Session

Participation Variables (Engagement)

© 2016 Boise State University 14

Cluster Analysis: Student Characteristics

Cluster 1 – Low-High, 119 students: Low average participation and higher performance levels.

Cluster 2 – High-High, 60 students: High average participation and high performance levels.

Cluster 3 – Low-Low, 76 students (46% remedial): Low average participation and low performance levels.

© 2016 Boise State University 15

Cluster Distributions in CoursesHigh percentage of Low-Low students in Chemistry CP, CP Pre-Calculus, English II, English III, and Pre-Calculus (H)

© 2016 Boise State University 16

Decision Tree Analysis

Perception and performance predictions which identify key predictors of course satisfaction, instruction satisfaction, and final grade

© 2016 Boise State University 17

Decision Tree Analysis: Predictors of Student Performance

Decision Tree Analysis• Identified at risk• Number of Courses Taken• Average Clicks per Week• Average Time Spent per

Week, and • Average Time Spent per

Session

Other factors• Gender • Ethnicity• Reason for taking a course

© 2016 Boise State University 18

Sequential Association Analysis

Course X Course Y

Does the design of the course (path to learning) predict learner outcomes?

© 2016 Boise State University 19

Sequential Association Analysis

© 2016 Boise State University 20

Time Series Analysis

© 2016 Boise State University 21

Time Series Analysis – course access

A

B

F

Week 10 Spring Break

© 2016 Boise State University 22

Time Series Analysis – DB Replies

A

B

F

Week 10 Spring Break

© 2016 Boise State University 23

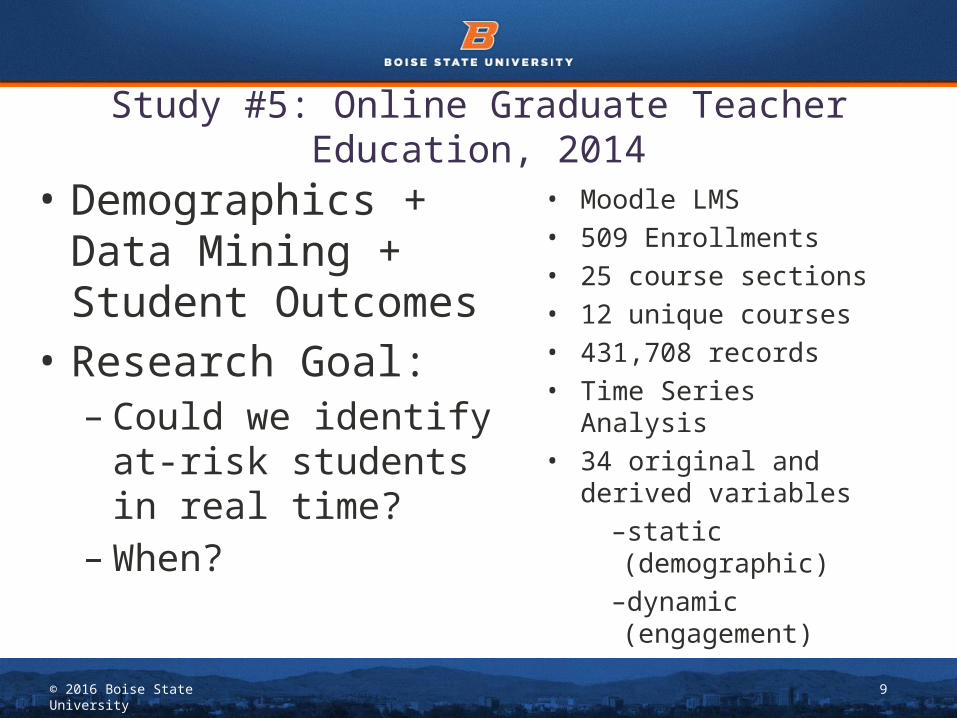
Overall Analysis• Students who took fewer courses performed significantly better than

those who took more courses. • Engagement is a significant factor. High-engaged students performed

better than low-engaged students. • Students identified as at risk performed differently than all other students. • Type of engagement matters. Students who accessed their courses more

often performed better than those who had more interactions within the course. Consistent interaction over time is a better predictor of performance. (higher ed only)

• Advanced courses - High-engagement and high performance (K-12)• Entry level courses - Low performance regardless of engagement (K-12)• Gender and ethnicity (higher ed) were identified as significant factors• Satisfaction did not always equate to higher performance

© 2016 Boise State University 24

Characteristics of successful students• Female (k-12)• Younger (k-12)• Were enrolled in advanced courses (k-12)• Took fewer courses• Were more engaged overall • Were consistently engaged

© 2016 Boise State University 25

Characteristics of at-risk students• Male (K-12)• Older (K-12)• Took entry-level courses (K-12)• Took a greater number of courses • Were low engaged overall• Were inconsistent in their engagement

© 2016 Boise State University 26

Data Collection Challenges• Bb activity accumulator grouped wide ranging behaviors into

only five useful categories• Missing data (empty fields – ex. internal handler)• Mismatched data fields/data stored in the wrong fields• Inconsistent data collection (i.e. failure to track every forum

reply)• Partial or missing timestamp (needed for sequential analysis)• Course or student ID not linked to survey • Demographic data not linked to course or program• Inconsistent course models (blended)

© 2016 Boise State University 27

Educational Data MiningSpecial Challenges• Learning behaviors are complex• Target variables (learning

outcomes/performance) require wide range of assessments and indicators

• Goal of improving teaching and learning is hard to quantify

• Limited number of DM techniques suitable to meet educational goals

• Only interactions that occur in the LMS can be tracked through data mining

• Still a very intensive process to identify rules and patterns

© 2016 Boise State University 28

References•Hung, J. L., Rice, K., & Saba, A. (2012). An educational data mining model for online teaching and learning. Journal of Educational Technology Development and Exchange, 5(2), 77-94.•Hung, J. L., Hsu, Y.-C., & Rice, K. (2012). Integrating data mining in program evaluation of K-12 online education. Educational Technology & Society, 15(3), 27-41.•Rice, K., & Hung. J. (2015). Data mining in online professional development program: An exploratory case study. International Journal of Technology in Teaching and Learning, 11(1), 1-20. •Shelton, B., Hung, J. L., & Baughman, S. (2015). Online graduate teacher education: Establishing and EKG for student success intervention. Technology, Knowledge and Learning. •Rice, K., & Hung, J. L. (2015). Identifying variables important to the success of K-12 students in blended learning. Paper presented at the Northern Rocky Mountain Educational Research Association Conference, Boise, Idaho. •Shelton, B. E., Hung, J. L.., & Lowenthal, P. (under review). Predicting student success by modeling student interaction in online courses.


Recommended